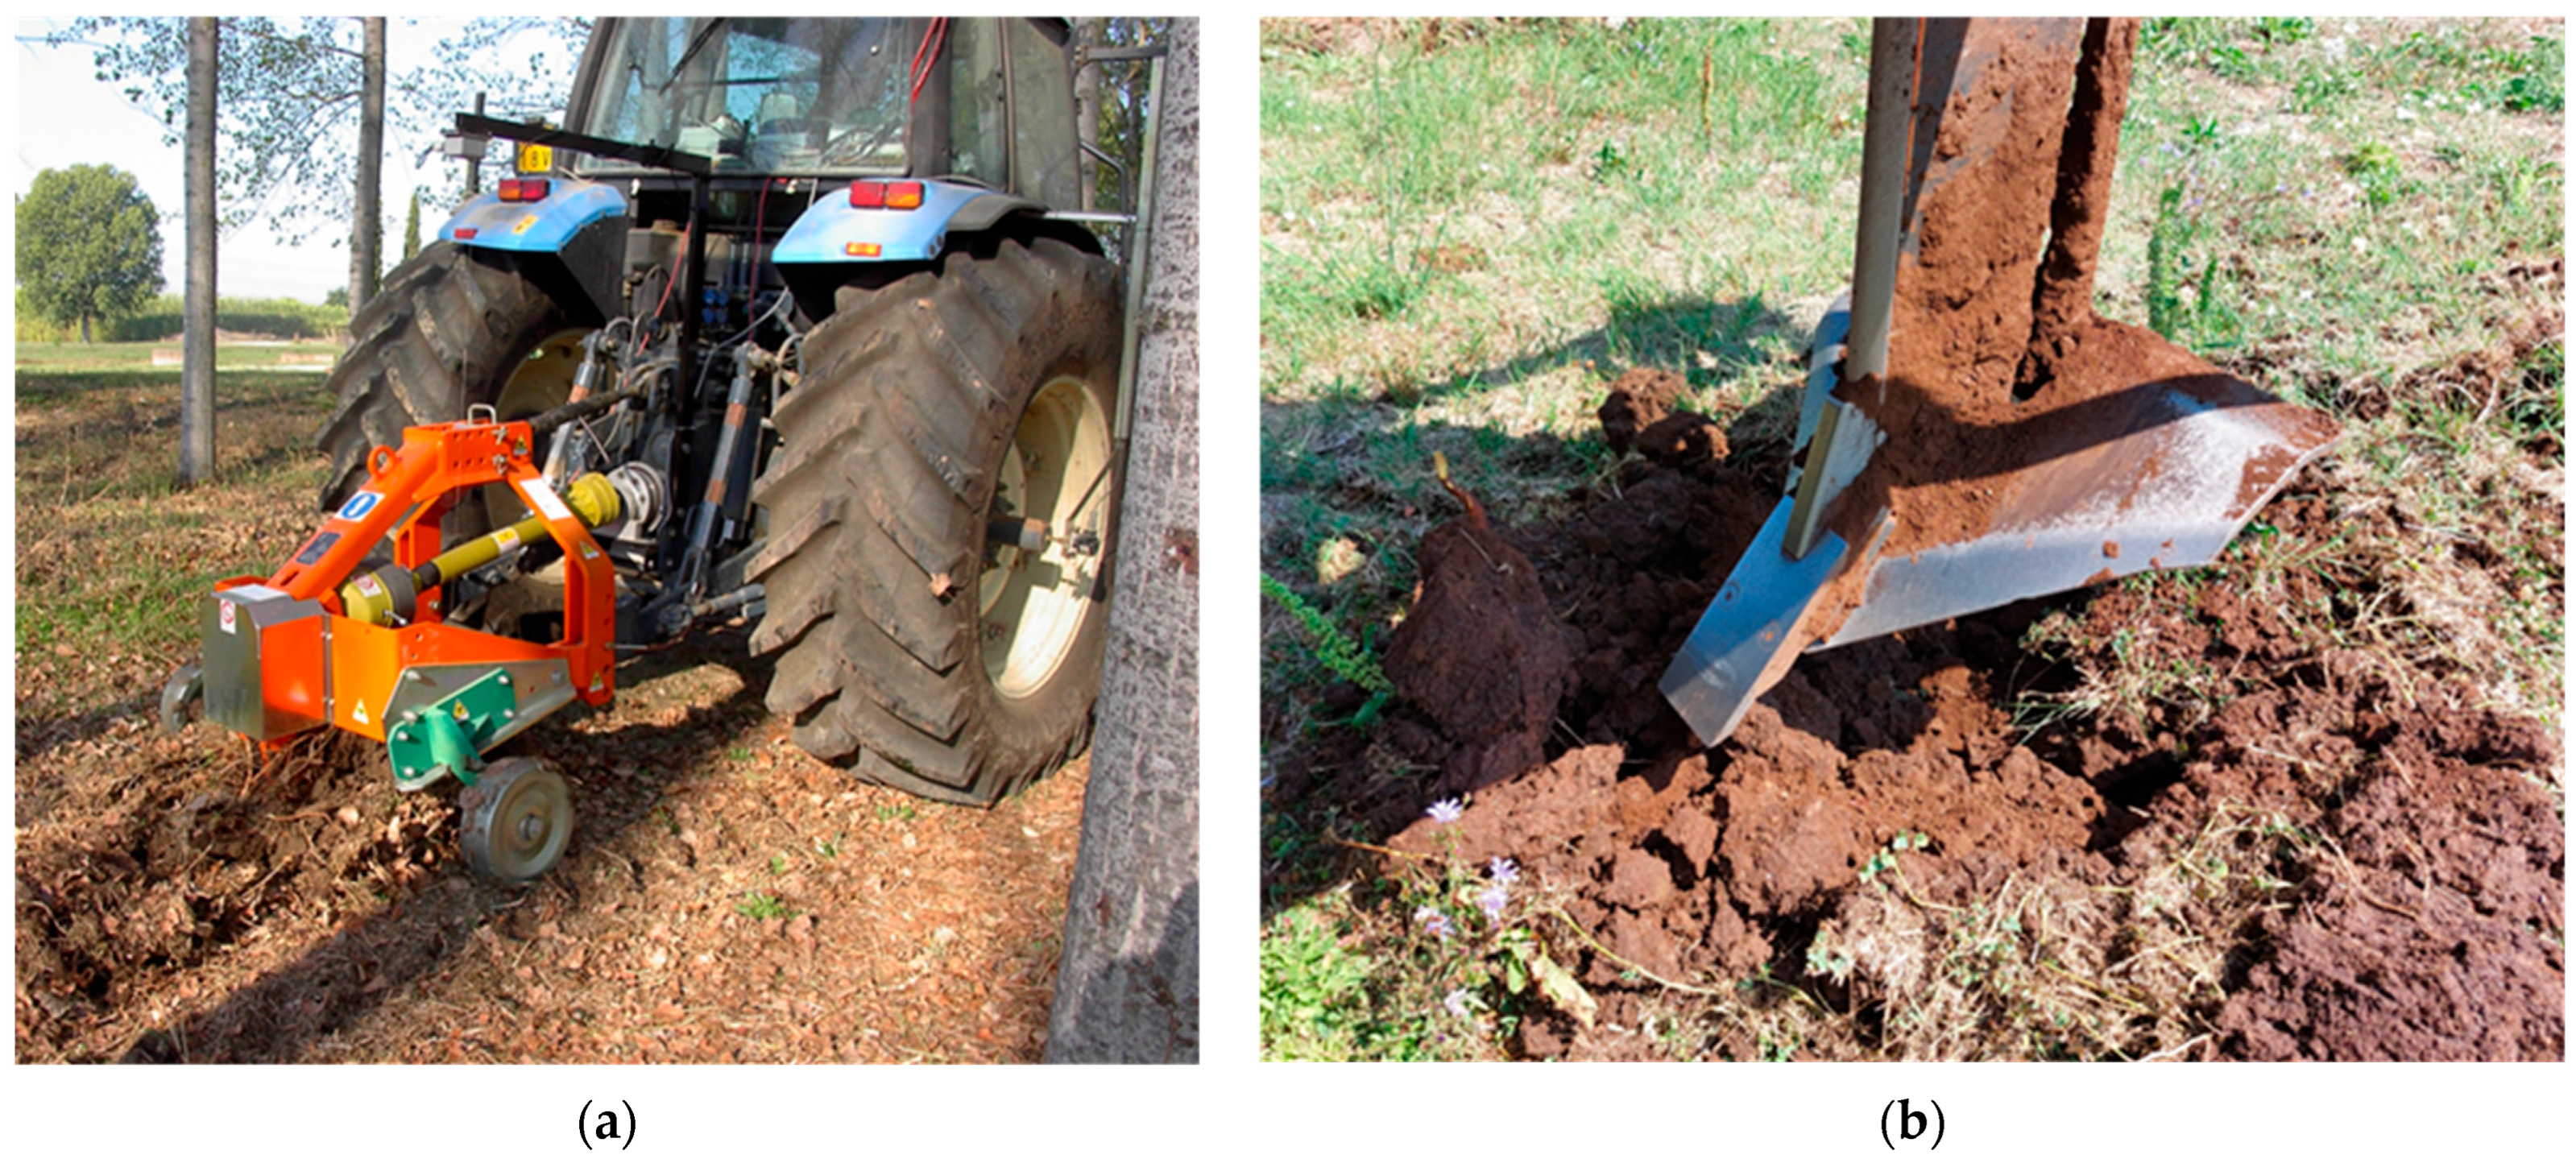
3.1. Tillage Performance
Table 3 and
Table 4 report, respectively, the results of the measurements concerning the dynamic-energy performances of the tractor–subsoiler system and the most significant parameters describing soil–machine interaction.
The activation of the oscillating plate (Treatment A) occurs by engaging the tractor’s Power Take-Off (PTO), which transmits the power required to overcome the soil’s resistance to the oscillations. Compared to Treatment B, this results in higher values for forward speed, hourly fuel consumption, and average total engine power output, while lower values are observed for drawbar pull and wheel slip (
Table 3). Given the same tractor settings (engine speed, gear ratio) in both cases, the 4.9 kW PTO power observed in Treatment A stems primarily from the transfer of a portion of the traction power (17.0 kW in Treatment A vs. 19.37 kW in Treatment B) and lower power dissipation due to slip (4.04 kW in Treatment A vs. 5.56 kW in Treatment B). This indicates that the oscillating device effectively performs a soil-shattering action within the tilled layer.
The orchard soil was highly compacted, which limited the achievable working depth during the tests to approximately 0.43 m.
Table 3 also shows the fuel and energy requirements per unit area, calculated by combining the previous data with those in
Table 4. It can be noted here that, while the tillage depth was nearly identical in both treatments, the working width recorded in Treatment A was 0.61 m, compared to 0.34 m in Treatment B. These figures significantly impact the calculation of the actual working time and, consequently, of fuel consumption, total energy required, and energy dissipated by slippage per hectare; in Treatment A, these are reduced by 44.6%, 45.9%, and 61.1%, respectively. Similarly, a 45% reduction is observed in the energy required per cubic meter of tilled soil.
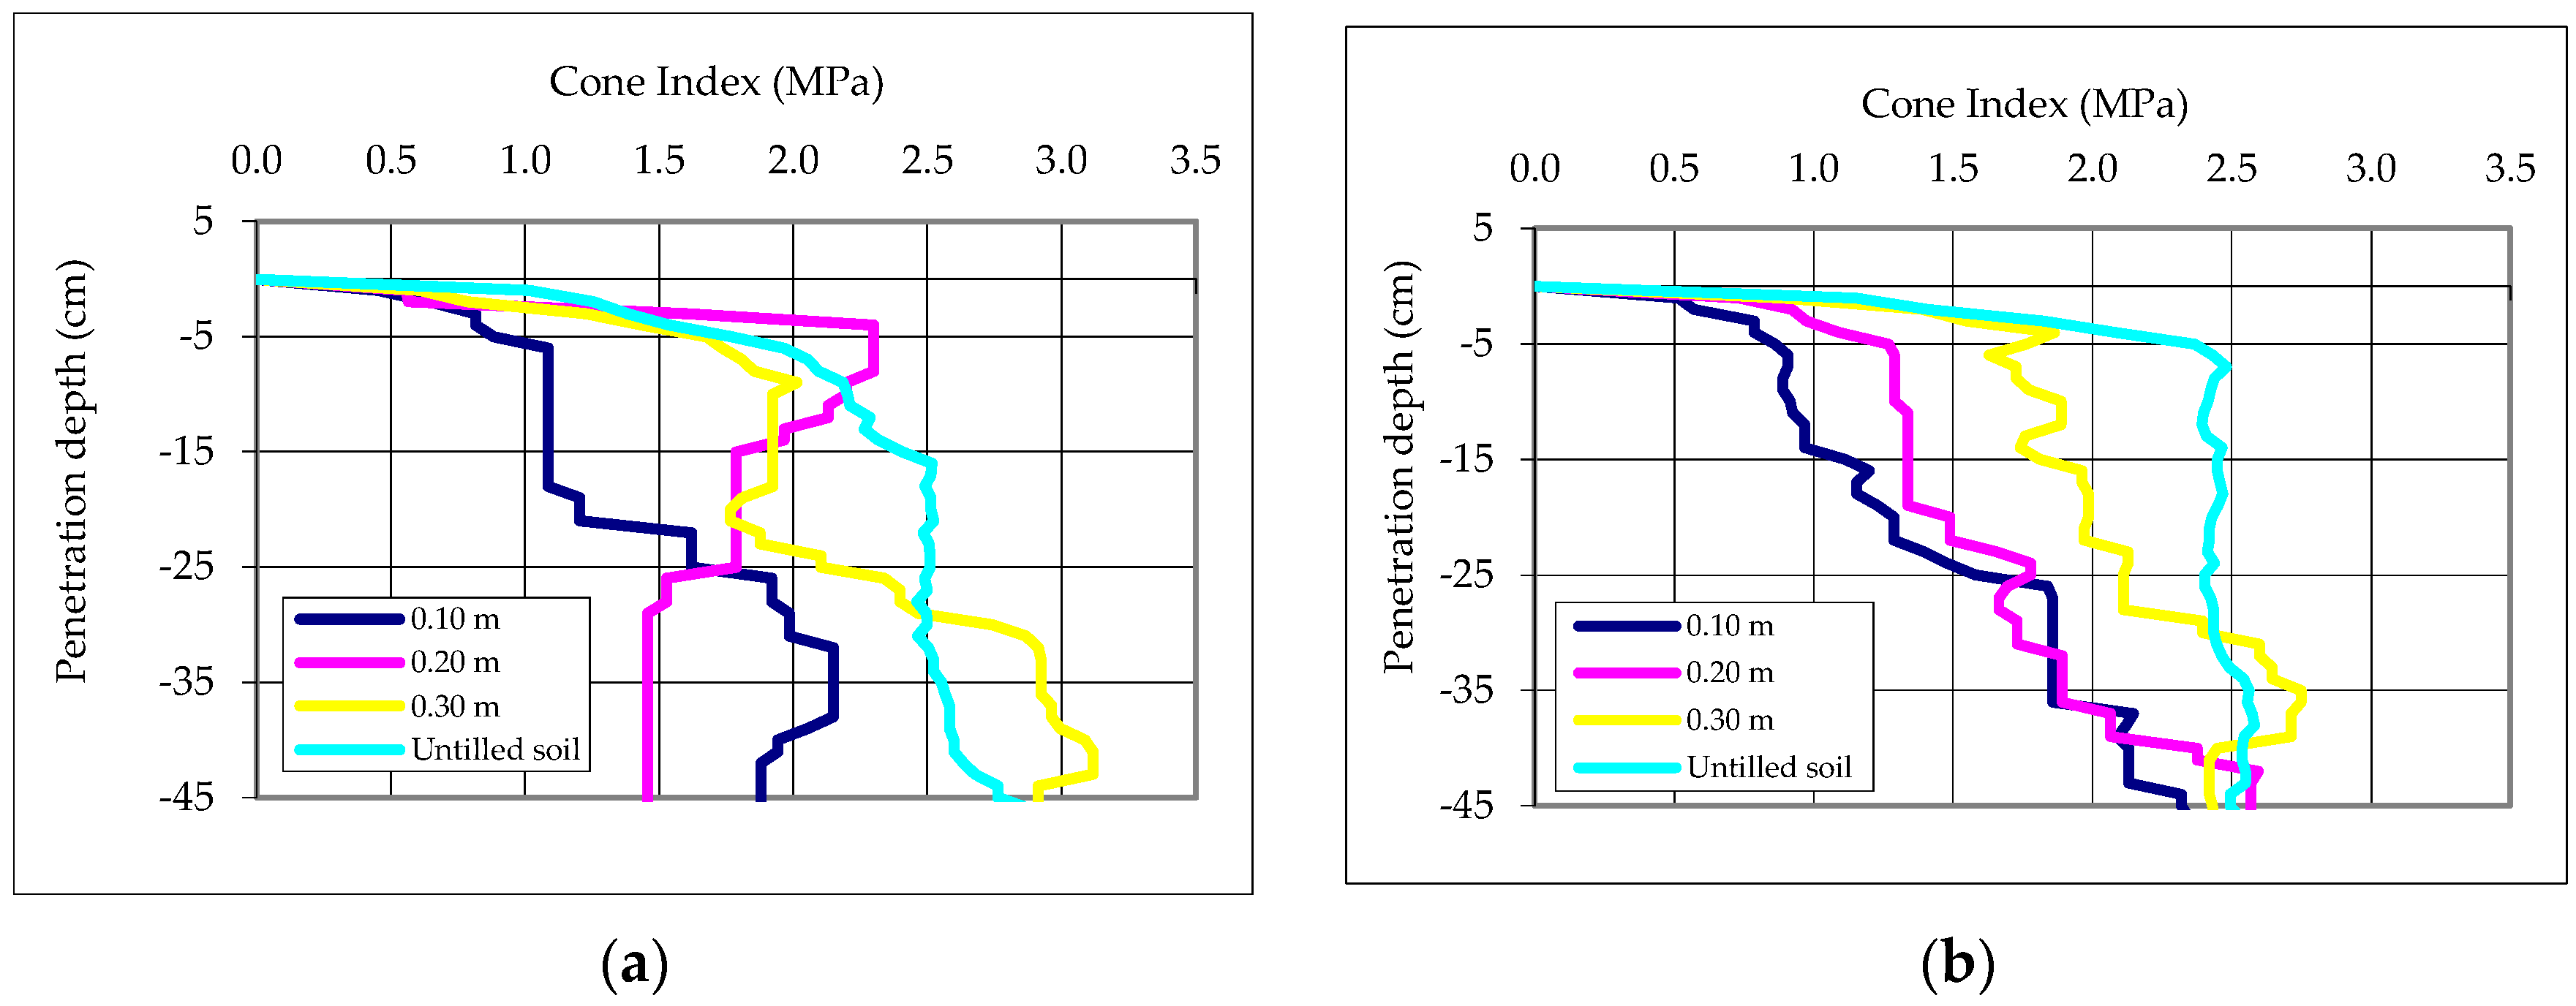
Tillage quality was evaluated through the consistency of the disrupted soil, as shown in
Figure 3, which shows Cone Index (C.I.) values measured in six sampling areas before and after tillage, at 0.10, 0.20, and 0.30 m from the furrow center opened by the shank. In treatment A, the irregular trend of C.I. values indicates the presence of fissures even at greater depths, reflecting extensive soil disruption. Specifically: at 0.10 m from the furrow center, C.I. values were particularly low in the 0–0.20 m layer due to fissures and gradually increase at greater depth; at 0.20 m, C.I. values were higher at 0.10 m depth but lower at 0.30 m, revealing deep fissures created by the subsoiler; at 0.30 m, C.I. values showed an increasing trend, reaching high levels in deeper layers. This pattern confirms that the oscillating plate enhanced the shattering effect of the subsoiler, promoting deeper soil loosening. In contrast, treatment B exhibited a more regular C.I. trend, increasing with distance from the furrow center, indicating that the soil was subjected to a less disruptive action. This highlights the role of the oscillating plate in improving soil fracturing and reducing compaction beyond the immediate furrow zone.
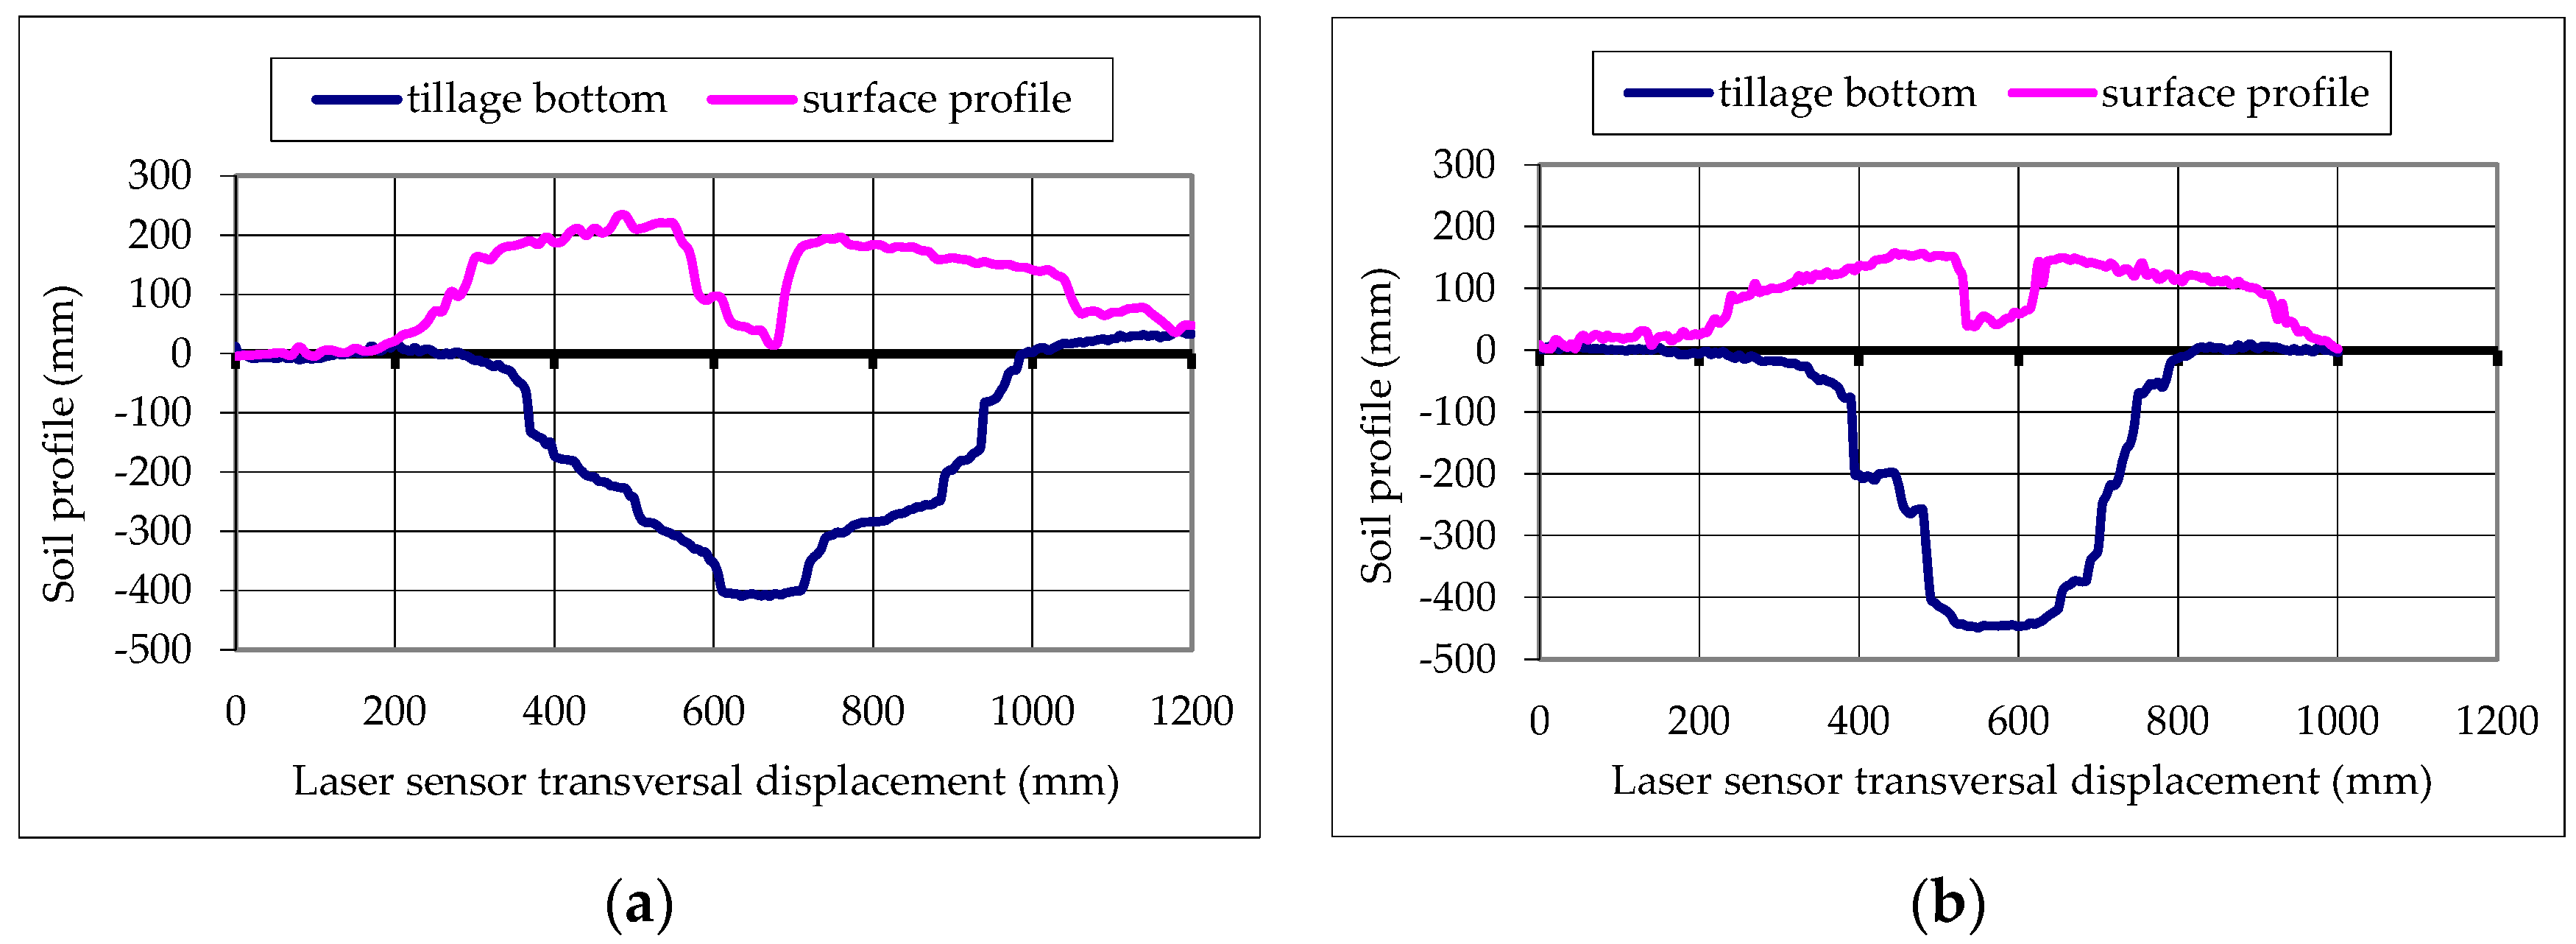
After excavation of a transversal trench, the cross-sectional area of the tillage profile, the actual tillage width, and the bottom of the tilled layer were scanned using a laser profile meter (
Figure 4). The results clearly show that the tilled cross-section was larger in treatment A compared to treatment B, where the plate remained inactive. The grooves produced by the shank were more pronounced when the oscillating plate was active, confirming its contribution to widening the effective tillage profile.
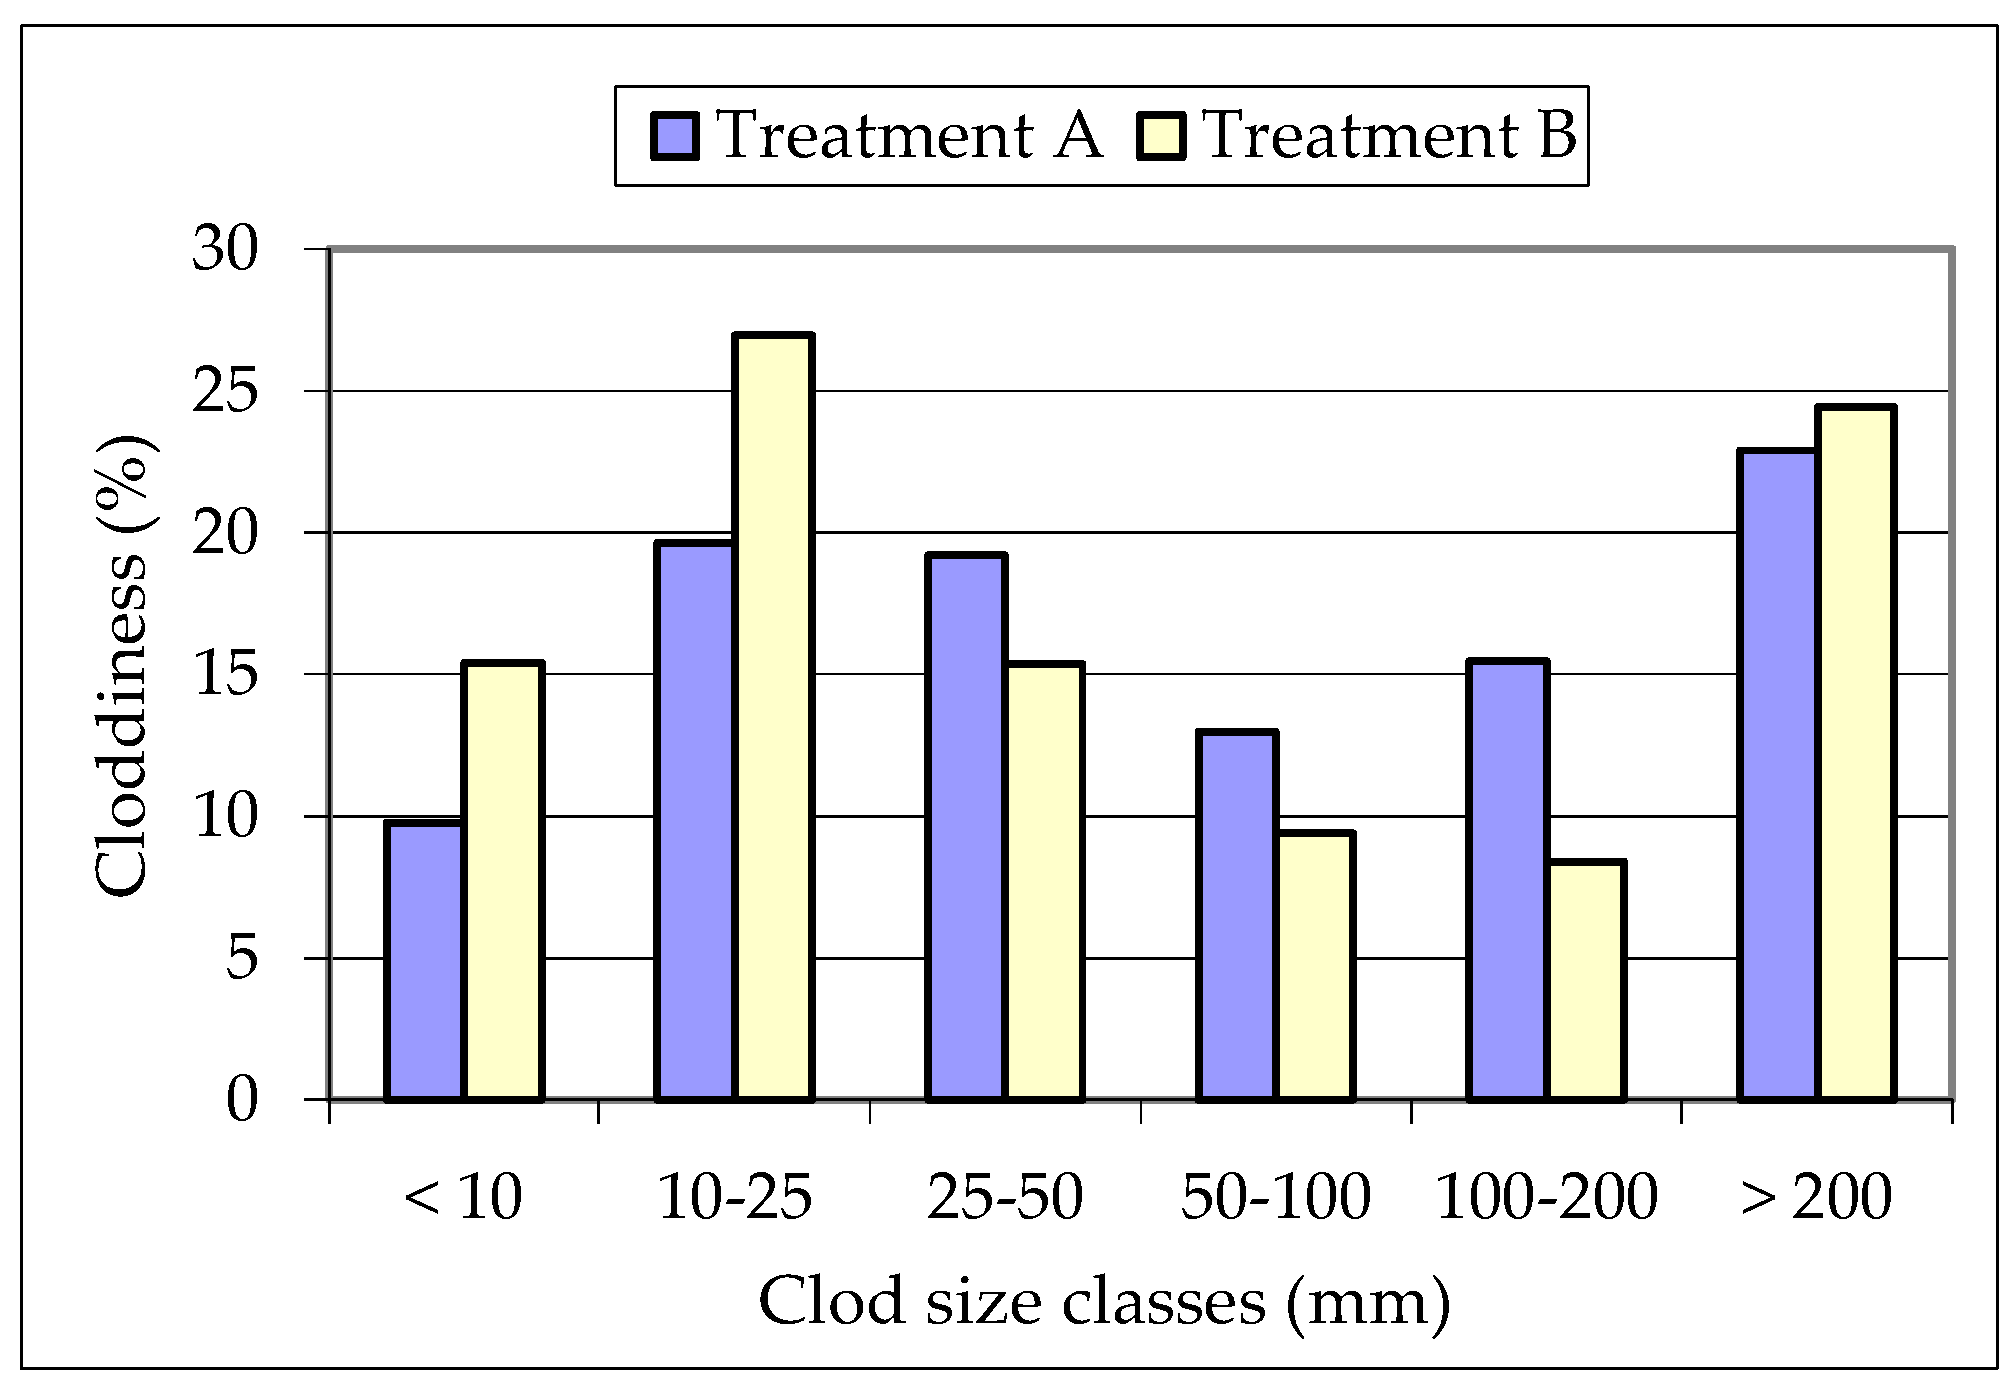
Regarding soil cloddiness, the clods produced by deep tillage were classified into six size categories (
Figure 5). The results confirm that the subsoiler performs a very effective loosening and shattering action. In trials where the oscillating plate was active, approximately 71% of total clods belonged to the larger size classes (>25 mm) compared to 58% when the plate was inactive. This demonstrates that the oscillating plate enhanced soil shattering, producing larger aggregates and improving subsoil drainage capacity. The highest clod-breaking index was observed in treatment B, indicating that the inactive plate produced finer soil particles (
Table 4). Soil elevation along the subsoiling line was minimal and could be further reduced by equipping the subsoiler with a cage roller, which would level the tilled soil. This improvement would promote greater stability conditions for the tractor during subsequent agricultural operations (e.g., spraying, fertilization). Furthermore, the oscillating plate provided a better balance between soil loosening and drainage improvement, which is particularly beneficial in compacted orchard soils.
3.2. Measurement of Vibrations
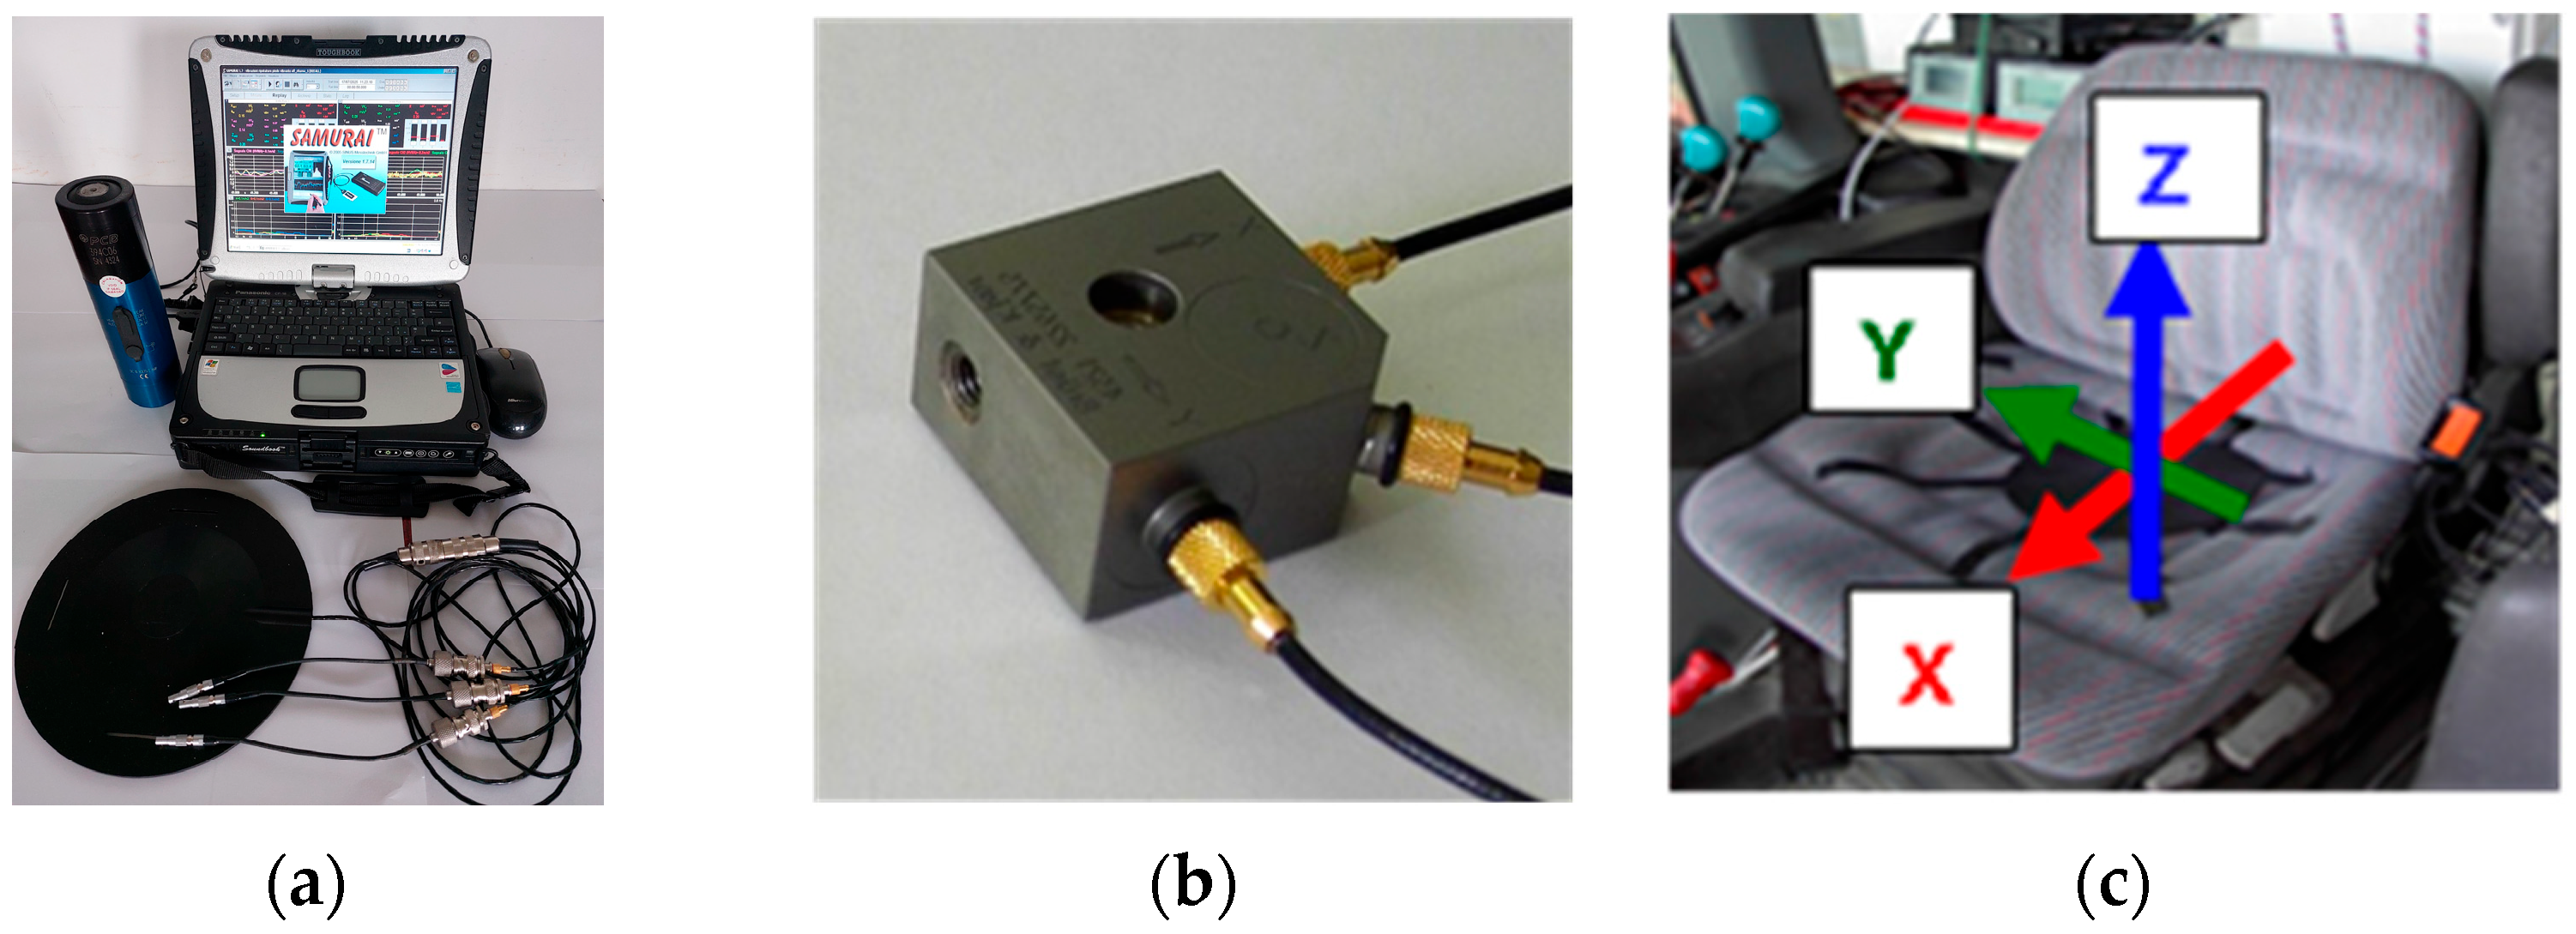
The tests were designed to evaluate the effect of the oscillating metal plate of the subsoiler on the level of vibrations transmitted to the tractor drivers whole body (WBV). To this purpose, the subsoiler was coupled with both a medium-powered and a lower-powered 4WD tractors in order to assess WBV exposure under different tractor power and mass conditions. Vibrations propagate from the soil to the driver’s seat through various tractor components, including tires and chassis [
58,
59], axles [
33,
60], cabin, and seat suspensions [
61,
62,
63]. The measured quantity was acceleration (a, m s
−2), weighted using appropriate filters in accordance with ISO 2631-1:1997. This procedure allows quantification of WBV exposure within the reference frequency band of 0.5–80 Hz, which is considered particularly harmful for the human body in a seated position. The results of the vibration level tests are summarized in
Table 5 and
Table 6, which report the weighted r.m.s. axial accelerations (a
wx, a
wy, a
wz) measured both at the driver’s seat of medium- and lower-power tractors operating with the subsoiler oscillating plate active (Treatment A) or inactive (Treatment B), and at the floor of the tractor cabs. The crest factor values (CF) have not been reported, as they are all less than 9. The vibration measurements are also graphically represented in the diagrams in
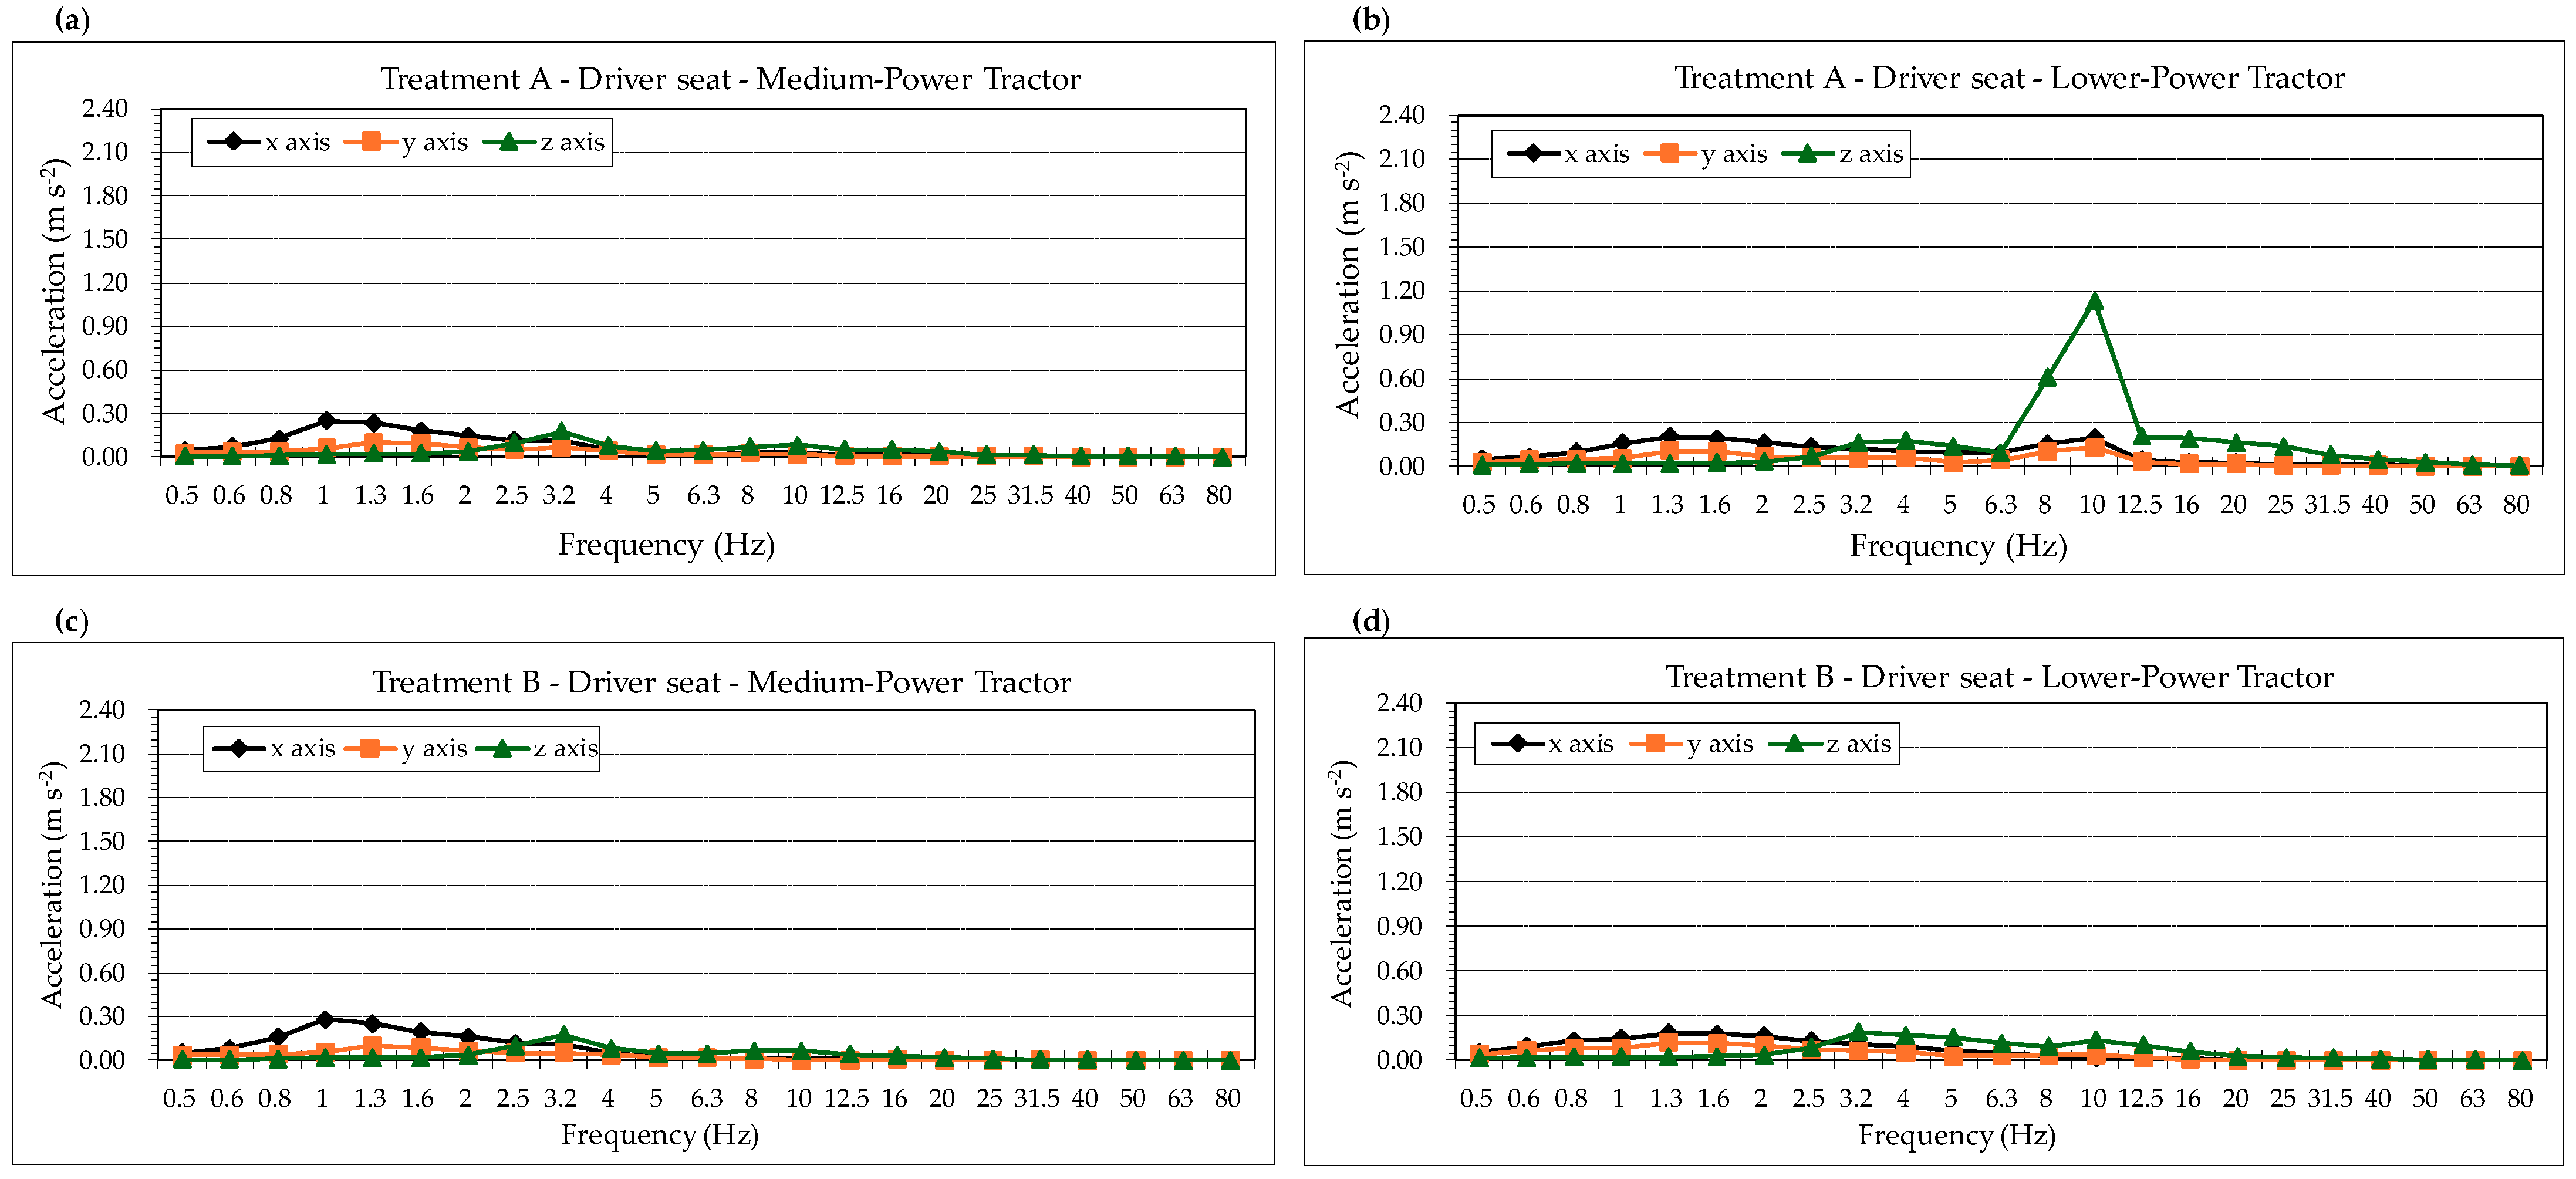
Figure 6 and
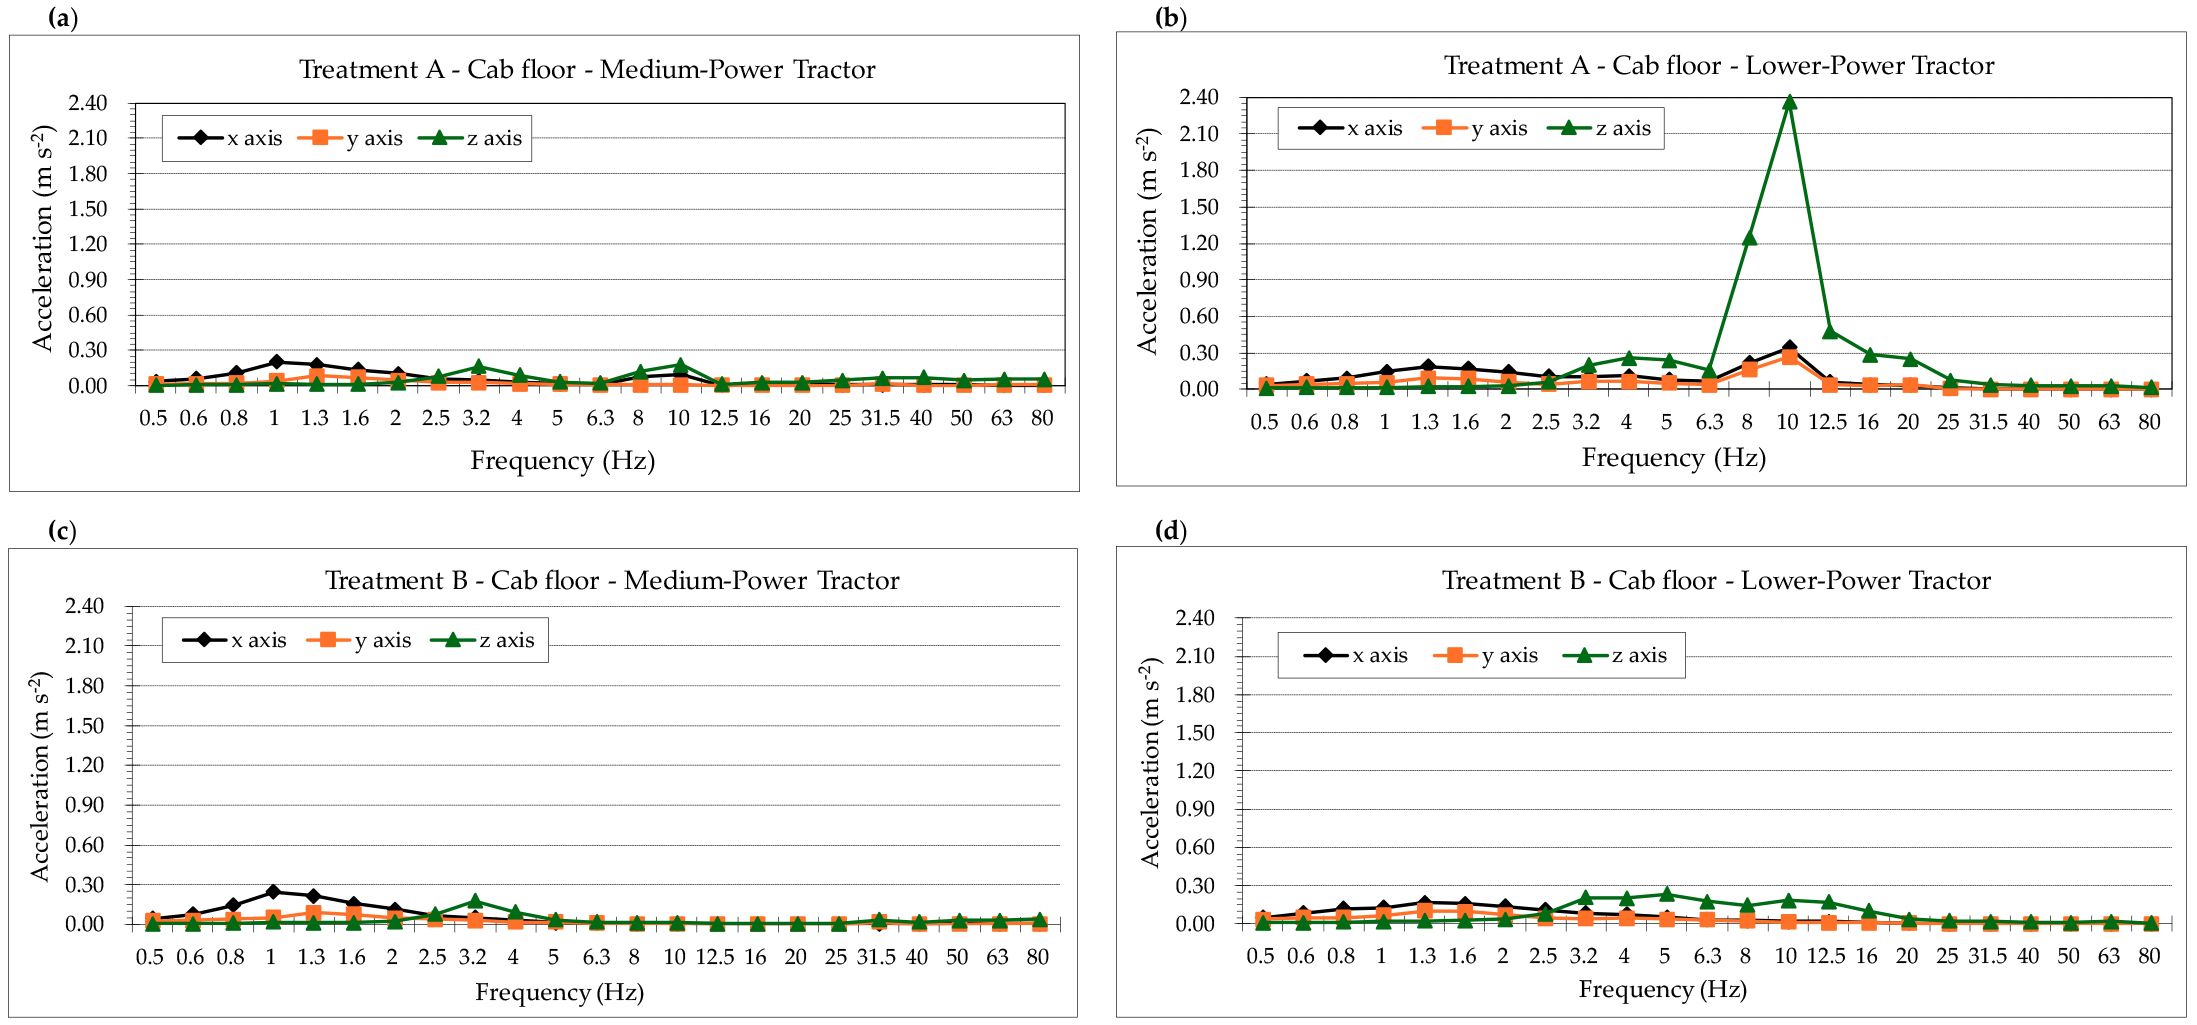
Figure 7.
In
Figure 6a (Treatment A: subsoiler coupled with the Medium-Power Tractor and oscillating plate active), vibrations recorded on the driver’s seat along the
z-axis (vertical axis) are very low. Consequently, the main motion perceived by the operator is pitching. The dominant curve corresponds to the
x-axis (longitudinal axis), with a peak of 0.248 m s
−2 at 1 Hz. As for the
y-axis (transversal axis), values remain very low, confirming that tillage with the subsoiler occurs in the forward direction, in a straight line, without significant lateral shaking.
In
Figure 6b (Treatment A: subsoiler coupled with the Lower-Power Tractor and oscillating plate active), the
z-axis curve (vertical axis) recorded on the driver’s seat is the most critical. The peak at 10 Hz is 1.13 m·s
−2, far exceeding the limit value established by Italian Legislative Decree 81/08 (1.00 m·s
−2) despite the 50% reduction of the vibration levels transmitted from the cabin floor, which reached 2.364 ms
−2 at the same frequency of 10 Hz (
Figure 7b). This is likely not due to the tractor suspension system, which operates at lower frequencies, but rather to the specific working frequency of the oscillating subsoiler. Operating at depth with an oscillatory motion, the plate adds a significant contribution to vibrations generated by the engine and tractor movement. The plate, impacting the soil and releasing elastic energy, generates mechanical vibrations transmitted first to the tractor frame and then to the driver’s seat. At low frequencies (0.5–2 Hz), the
z-axis shows values close to zero, indicating that the seat suspension system effectively compensates for bumps and soil irregularities. During tillage with the oscillating subsoiler, draft resistance varies continuously, causing slight oscillations in traction (pitching). Although present, this phenomenon produces relatively low vibrational values and does not represent a major risk, as shown by the
x-axis curve with a small peak (0.201 m·s
−2) at 1.3 Hz. The peak at 10 Hz (0.196 m·s
−2) is a crosstalk effect of the dominant vertical vibration, which is so strong that it also affects the seat backrest horizontally.
Comparing
Figure 6c,d (Treatment B: subsoiler coupled with both Medium- and Lower-Power Tractors, oscillating plate inactive) with previous tests (
Figure 6a,b), it is evident that using the subsoiler with the plate inactive results in minimal or no risk for driver. The analysis confirms that, without oscillating input from the implement, exposure to seat-transmitted vibrations remains well below regulatory limits. Both tractors, when not stressed by implement-induced vibration, provide high levels of safety and comfort at the driver’s seat.
The use of a Medium-Power tractor (
Figure 6a,c) markedly attenuates the vibrational response compared to the Lower-Power tractor–subsoiler system. The most evident difference is the disappearance of the 10 Hz peak observed in
Figure 6b. This demonstrates the positive effect of greater tractor mass: its inertia absorbs high-frequency vibrations generated by the implement during soil tillage, preventing them from reaching the seat. In summary, the spectrum indicates that the medium-power tractor, probably thanks to an efficient suspension system (particularly at the seat and/or cabin level), manages the significant stress induced by the oscillating subsoiler, keeping most of the vibrational energy below the regulatory limit values.
Table 5 further indicates the maximum operator exposure times during an 8-h workday to avoid exceeding the Action Value (AV) and the Limit Value (LV). In all cases, the A(8) daily exposure value was calculated using the axis that exhibited the highest vibration levels. Specifically, for the medium-powered tractor, the
x-axis was used for both treatments, whereas for the lower-powered tractor, the
z-axis was considered. This analysis is essential for operator safety, since Legislative Decree 81/08, Title VIII—Physical Agents, Chapter III—Protection of Workers from Risks of Exposure to Vibrations, Article 201—Exposure Action Values and Limit Values, establishes that for whole-body vibrations, the daily Action Value is 0.5 m s
−2, while the daily exposure Limit Value is 1.0 m s
−2.
The most critical condition occurs when using a lower-power, lower-mass tractor coupled with the subsoiler and the oscillating plate active (Treatment A). In this case, the operator can work for only about one hour per day before exceeding the AV, and just over four hours before exceeding the LV. The situation improves with the medium-power tractor: here, the AV is exceeded only after approximately 4.5 h of work, while the LV is never exceeded within a standard 8-h shift. When operating with both tractors and the subsoiler with the oscillating plate inactive (Treatment B), the operator can work for about four hours without exceeding the AV, and for eight hours without ever exceeding the LV. In both treatments (A and B), care must be taken to avoid exceeding the AV. In such cases, employers are required to develop and implement technical and organizational measures to minimize exposure and associated risks. These measures include limiting the duration and intensity of vibration exposure, organizing appropriate working schedules, and ensuring adequate shifts and rest periods.
In
Figure 7a (Treatment A: subsoiler coupled with the Medium-Power Tractor and oscillating plate active), the frequency spectrum analysis of the accelerations recorded on the tractor’s cab floor highlights two frequency bands with significant peaks. The first is the low-frequency band (0.5–2 Hz), where the
x-axis shows a maximum peak of 0.203 m·s
−2 at 1 Hz, and the
y-axis shows a peak of 0.081 m·s
−2 at 1.3 Hz. These bands are typically associated with rigid tractor motion (bouncing and pitching) induced by driving on uneven soil. The second is the mid-frequency band (2.5–10 Hz), where the
z-axis shows two significant peaks: one at 3.2 Hz (0.163 m·s
−2) and a dominant peak at 10 Hz (0.177 m·s
−2). This second band is the most critical for whole-body vibration (WBV) and spinal health, as it is associated with risks of low back pain and spinal trauma. Peaks in this band are generally linked to the resonance frequency of the tractor seat and cabin, which amplify vibrations originating from the frame and the oscillating implement. The dynamic interaction of the subsoiler’s straight shank with the soil may significantly contribute to these frequencies. In
Figure 7b (Treatment A: subsoiler coupled with the Lower-Power Tractor and oscillating plate active), the three curves reveal a much more critical situation compared to the previous analysis, characterized by extremely high structural resonance. The most alarming result is the 10 Hz peak in the
z-axis curve, which reaches a weighted acceleration value of 2.364 m·s
−2. According to ISO 2631-1, the frequency band between 2 and 20 Hz represents the zone of maximum sensitivity for the seated human body. Vibrations within this range distort the normal biological and psycho-physiological responses of the operator to mechanical stimuli, potentially leading to musculoskeletal alterations, cardiovascular disorders, and impairments of the digestive system. Resonance at 10 Hz is extremely dangerous, indicating that the excitation frequency of the tractor–subsoiler system is perfectly aligned with a critical natural frequency.
In
Figure 7c,d (Treatment B: subsoiler coupled with both Medium- and Lower-Power Tractors, oscillating plate inactive) the frequency spectrum analysis showed a behavior similar to that highlighted in
Figure 6c,d. Using the subsoiler with the inactive plate did not result in additional vibration peaks or significant amplifications at the cab floor level, with values remaining well below regulatory limits.
3.3. Statistical Analysis
The analysis focused on the data series of weighted axial accelerations (a
wx, a
wy, a
wz) and the resultant acceleration vector (a
v) recorded at the driver seat and the tractor’s cab floor, as reported in
Table 5 and
Table 6. The Shapiro–Wilk test consistently confirmed the normal distribution of the values. Subsequently, the dataset was subjected to multifactorial ANOVA. In cases of significant factor interaction, Tukey’s post-hoc test was applied to perform multiple mean comparisons and identify significant differences. These analyses corroborate the observations described above.
Table 7 presents the ANOVA results for the driver’s seat. Highly significant differences were observed along the
Z-axis for both variation factors (tractor and treatment) and their interaction, while no significant effects were found on the
X-axis. The acceleration along the
Y-axis (a
wy) was significantly influenced by the tractor type. A similar trend to that of the
Z-axis was observed for the resultant acceleration vector (a
v).
Tukey’s test on the data in
Table 7 involved multiple mean comparisons related to factor interactions. The results are reported in
Table 8, ordered by increasing adjusted
p-values. No significant differences were observed for a
wx. For a
wy, although not significant in the ANOVA, three pairs showed significant differences. In 80% of the significant comparisons, the medium-power tractor versus the lower-power tractor was involved, confirming tractor type as the discriminating factor in determining whether the oscillating plate in active mode is acceptable.
Table 9 and
Table 10 show the results of the same analysis performed on the dataset from cab floor measurements. In this case, the absence of damping elements (apart from the tires) emphasized the differences in vibration levels determined by tractor type and oscillating plate activation, which became consistently significant even on the X and Y axes. However, the trend of the
p-values in
Table 9 indicates that significance progressively increases from a
wx to a
wy to a
wz, and finally to a
v, thus amplifying the same trend observed at the driver’s seat (
Table 7).
The same considerations discussed for
Table 8 also apply to the results of Tukey’s test for the tractor’s cab floor data reported in
Table 10. However, the absence of any damping effect at the mainframe level accentuates the differences between pairs, as evidenced by the higher
p-adjusted values compared to those in
Table 8. Notably, significant differences were also observed for a
wx, which were not present in the driver’s seat analysis.




 ,
,