Article

Milk Quality Dynamics in Romanian Black Spotted and Romanian Spotted Cattle Breeds Under Heat Stress


by
Gabriela Amariții (Pădurariu)
,
Claudia Pânzaru
* and
Vasile Maciuc
Faculty of Food and Animal Sciences, “Ion Ionescu de la Brad” Iasi University of Life Sciences, 700490 Iasi, Romania
*
Author to whom correspondence should be addressed.
Agriculture 2026, 16(2), 274; https://doi.org/10.3390/agriculture16020274

Submission received: 17 December 2025 / Revised: 11 January 2026 / Accepted: 20 January 2026 / Published: 21 January 2026
(This article belongs to the Special Issue Quality Assessment and Processing of Farm Animal Products)

Abstract

Milk production and quality are increasingly affected worldwide by rising ambient temperatures associated with climate change, with heat stress (HS) representing one of the major environmental challenges for dairy cattle. HS alters physiological and metabolic processes, leading to significant changes in milk composition, particularly in regions exposed to prolonged summer heat. The Temperature–Humidity Index (THI) is widely used to assess the degree of thermal discomfort and its impact on dairy performance. This study investigated the effects of heat stress on milk quality parameters in a dairy herd managed under identical conditions, comprising Romanian Black Spotted (RBS, Holstein strain) and Romanian Spotted (RS, Simmental strain) cows. Descriptive statistics were performed using the SAVC for Windows program, while differences between means were evaluated using the t-test in GraphPad Prism 9. Milk quality traits were significantly affected when THI values exceeded 73, with a consistent decline observed from early summer onwards. In the RBS breed, milk protein content decreased significantly compared with spring values, reaching 3.25% (p < 0.0001) in 2023 and 3.35% (p < 0.01) in 2024. Similar trends were recorded in the RS breed, with minimum protein values of 3.10% (p < 0.0001) and 3.19% (p < 0.0001). Fat content, casein concentration, and milk urea levels also showed highly significant HS-related changes (p < 0.0001). Overall, heat stress negatively affected milk quality, while the RS breed appears less affected under the studied conditions than the RBS breed.

1. Introduction

Heat stress (HS) represents a major threat to the dairy farming sector because it negatively influences the productive performance of animals, production quality, and farm profitability [1]. The economic impact of the effects of HS has been the subject of many studies. In USA the losses caused by HS action are estimated at 1.2–1.5 billion dollars and are largely determined by seasonal infertility, decreased milk yield and quality, and also by veterinary costs [2]. In European countries, including Romania, financial losses are estimated at 400 euros/cow/year [3].
One of the direct effects of HS is reduced feed intake, which can cause losses of 0.2–0.9 kg of milk/day per cow [4]. Moreover, the effects of HS are transgenerational because calves exposed to heat stress in utero will have lower milk production throughout their adult lives [5].
Milk quality is adversely affected under thermal stress conditions, as its principal components are directly influenced by heat-induced physiological and metabolic alterations. The reduction in milk protein and casein content is primarily attributed to decreased protein synthesis in the mammary gland, as amino acids are redirected toward alternative metabolic pathways, such as gluconeogenesis, in order to meet the increased energetic demands of the cow [6,7]. Consequently, the decline in protein concentration leads to impaired milk coagulation properties, negatively affecting its technological quality [8]. Variations in milk fat content under heat stress have been reported inconsistently in the literature, with some studies indicating an increase in fat percentage, while others describe a decrease, likely due to a reduced availability of ruminal fermentation precursors, such as acetate and butyrate, resulting from altered ruminal activity [9].
Climate change constitutes a major contemporary challenge with substantial implications for animal productivity and welfare. Predictive climate models suggest that average air temperatures may increase by up to 2 °C by 2050 [10], thereby exacerbating thermal stress conditions in dairy production systems. This is of particular concern given that the thermal comfort zone for dairy cows generally ranges between 5 and 25 °C. In European dairy breeds, the thermoneutral zone is narrower, extending from approximately −0.5 to 20 °C, under relative humidity levels of 40–60% [11,12,13]. Heat stress occurs when elevated ambient temperatures are combined with high humidity, impairing the animal’s ability to dissipate excess body heat. The capacity to maintain physiological homeostasis under such conditions, defined as heat tolerance, largely depends on the efficiency of metabolic heat dissipation mechanisms [14,15]. Across the European continent, recent years have been characterized by annual temperature increases exceeding 1 °C, and since the beginning of the 21st century, prolonged and recurrent summer heat waves have been increasingly reported [16]. Under Romania’s climatic conditions, the year 2023 ranked among the warmest recorded in recent history. During the summer season, large areas of the country are frequently affected by heat waves, which have shown an increasing duration and intensity, particularly in the southern regions [17]. The Temperature–Humidity Index (THI) is widely used in animal husbandry as a key indicator for assessing the degree of thermal stress, with specific values serving as thresholds for heat stress classification. Numerous studies have documented the effects of heat stress at various THI levels on animal productivity and product quality, with responses varying according to geographical location [18,19], breed [20], physiological status, and the duration of heat stress exposure. Although a THI threshold of 72 is frequently cited as indicative of the onset of heat stress, high-yielding dairy cows often exhibit physiological and productive responses at lower THI values [21,22,23,24].
Under heat stress conditions, animals exhibit adaptive physiological and behavioral responses aimed at enhancing heat dissipation. These responses include increased respiratory rate (panting), elevated water intake, enhanced sweating, reduced feed intake, and a consequent decline in milk production, which may range between 10% and 35% [25,26]. Behavioral adaptations commonly observed under thermal stress involve increased shade-seeking behavior, prolonged standing time, reduced overall activity, and decreased feed consumption. Reductions in resting time have been reported to occur even at moderate THI values, beginning around 56 [27,28,29]. When THI values exceed 68, a marked increase in respiratory rate is observed, reaching approximately 75 breaths per minute at an ambient temperature of 27 °C and a relative humidity of 35% (corresponding to a THI of 73) [26,30]. In parallel, rumination time decreases and may fall below the critical threshold of 420 min/day required for optimal dairy cow performance [19].
Physiological thermoregulatory mechanisms are also activated under heat stress and also include a reduced metabolic rate, vasodilation in the dermis and mucous membranes, and immune system activation. However, the full scope of these physiological adaptations remains unclear, as heat stress triggers complex cellular processes, even involving DNA structure and gene transcription [23,31,32]. Mortality rates could rise significantly when the minimum daily THI exceeds 70 [33,34].
Heat stress directly reduces productive performance, primarily through a decrease in feed intake. Reproductive efficiency is also adversely affected, as heat stress suppresses estrous expression and increases susceptibility to postpartum disorders as a consequence of immune system alterations [27]. Moreover, heat stress disrupts ruminal and intestinal microbiota homeostasis, further compromising milk quality and overall metabolic efficiency [35,36,37].
Although dairy cows are generally adapted to their production environment, genetic selection for increased productivity yield, over the past five decades, has reduced their heat tolerance [14]. High-yielding cows are particularly vulnerable, showing HS at THI values ≥ 68 [25]. Additionally, in cows with an average daily milk yield of approximately 35 kg, a minimum THI threshold of 68 has been reported, whereas in animals producing around 45 kg/day, the temperature threshold at which heat stress occurs is reduced by approximately 5 °C [38,39]. The threshold value of 68 for THI corresponds to 22 °C and 50% relative humidity and is frequently used as an indicator of heat stress in both lactating and dry cows in temperate climates [27,35]. We use THI > 72 as the threshold in our study because these two Romanian breeds from Holstein and Simmental are genetically more robust to the action of environmental factors.
Milk quality parameters are essential determinants of farm profitability, as milk pricing systems are frequently based on fat and protein concentrations. Chemical composition and hygienic–sanitary characteristics are key determinants of sensory attributes and compliance with regulatory standards. For example, cheese production relies on milk coagulation, involving physical and chemical changes in the casein micelle. Curd firmness is strongly influenced by both the casein concentration in the milk and the processing temperature. Higher casein content results in a denser and more resistant curd [22,40].
This observational study aimed to evaluate the effects of heat stress (HS) on milk quality in Romanian Black Spotted (RBS) and Romanian Spotted (RS) cows, with the objective of identifying potential differences in the responses of these two Romanian breeds when the Temperature–Humidity Index (THI) exceeds the threshold of 72, a level at which heat stress is known to induce alterations in milk composition. Given the limited availability of data regarding the impact of heat stress on milk quality in Romanian cattle breeds, the present study contributes to addressing this existing knowledge gap. In summary, HS adversely affects both milk production and the overall health of dairy cows, rendering climate change a significant environmental and economic challenge for dairy farming operations.

2. Materials and Methods

Monitoring and detecting HS has become a critical issue, prompting the development and application of methods to assess its onset and severity. With recent advances in continuous monitoring technologies, including wearable sensors such as pedometers and smart collars, parameters such as cow activity, rumination time, and respiratory patterns can now be tracked in real time, facilitating the early detection of heat stress [41,42]. Infrared thermography (IRT) is a promising, non-invasive method that measures body surface temperatures at specific anatomical sites, such as the eyes and flanks, which can be correlated with core body temperature [43,44]. Automated milking systems (AMSs) also provide continuous monitoring of productivity, milk composition, fat/protein ratios, and milk temperature, allowing the identification of animals affected by heat stress [45,46].
Among HS indicators, the Temperature–Humidity Index (THI) is the most widely used, despite the absence of a universally standardized formula. THI is broadly applied to quantify the severity of heat stress in dairy cows and to evaluate their level of discomfort during periods of extreme summer temperatures and heat waves [47,48].

2.1. Weather Data Acquisition and THI Calculation

Located in the N-E of the European continent, Romania has a temperate-continental climate with four seasons. The farm is located in Holboca commune, Iași County, North-Eastern Romania (47°08′–47°47′ N, 24°94′–25°83′ E) and it is placed in the Moldavian Plateau. Access to accurate weather data on farms is often limited, making local weather stations valuable for assessing heat tolerance based on quantitative and qualitative changes in milk production. Many studies rely on weather station data to calculate THI and identify thresholds at which milk production is affected [49]. In this study, historical weather data were obtained from https://www.wunderweather.com [50], which includes data from environmental sensors like weather stations and air quality monitor measurements to provide information about climatic conditions. Wunder weather is part of The Weather Channel, which is consistently ranked first worldwide for forecast accuracy by ForecastWatch [51]. For this reason, the weather data has not been validated against local instruments. Ambient temperature (AT, °C) and relative humidity (RH, %) were used to calculate average THI values according to the National Research Council formula (1971) [25,52]:
THI = (1.8 × AT + 32) − [(0.55 − 0.0055 × RH) × (1.8 × AT − 26)]
Both the monthly average daytime THId and the monthly average daily THIav were calculated. The latter one includes the 24 h average temperature, providing a basis for comparison with other studies. Calculating THI values based solely on diurnal temperatures has shown that the duration of heat stress (HS) exposure influences the magnitude of production decline [53]. Since cows are most active during the day, the peak of internal body heat coincides with the peak of ambient temperatures. Therefore, THI values calculated for the daytime (THId) better capture the maximum thermal load, and variations in milk components (fat and protein) are more closely associated with THId than with daily averages [22,53]. An animal’s ability to tolerate high daytime temperatures largely depends on its capacity to dissipate accumulated heat at night. Minimizing the effects of daytime HS is more effective when cows experience cool nights, with temperatures below 21 °C for at least 2–6 h [3].
During the study period, daytime and daily THI values were calculated, from which monthly average THId and THIav values were determined. To assess the effects of heat stress on milk quality, the dynamics of the main milk quality parameters were observed in the summer months (June, July, August) and in September, when THId values > 72, compared with April and May as a reference period when THId values were below this limit. This threshold was exceeded in each of the three summer months and in September, which is a transitional month with elevated daytime temperatures in 2023 and 2024.

2.2. Biological Material and Husbandry Management

The biological material comprised lactating cows observed during 2023 and 2024, representing two Romanian Black Spotted (RBS, Holstein strain) and Romanian Spotted (RS, Simmental strain) breeds. The cows varied in parity and stage of lactation, with an average body weight of 623 kg and 583 kg for RBS and RS, respectively. On the farm, RBS and RS cows were housed in separate barns under a permanent free-stall system, with concrete floors and naturally ventilated facilities, ensuring uniform environmental conditions. The two barns are identical in layout and internal structure, providing each cow with up to 9 m2 of total space, including 3 m2 per cow for resting, in accordance with welfare recommendations. Cows were grouped according to breed, production level, and physiological status, while sick animals were isolated and treated separately in dedicated sick pens.
Access to water and feed is assured for each animal. The water has quality parameters monitored by the supplier and is permanently provided to the cows through fountains at a constant level. At the feeding area, space was allocated on a 1:1 ratio, ensuring that each cow had direct access to feed. The animals were fed year-round with a mono-diet ration, which was not specifically formulated to mitigate thermal stress. The composition of the ration is detailed in Table 1, which presents the nutritional requirements for a cow weighing 600 kg and producing 30 L of milk per day; the diet was adjusted according to internal factors, such as production level and physiological stage. Corn and alfalfa silage were cultivated and stored on the farm, while concentrates were purchased from external suppliers. Feed was administered twice daily, immediately following milking. Milking was conducted twice daily, with an interval of 12 h between sessions. According to the farm’s AfiMilk management software, [54], the average daily milk yield during 2023–2024 was 33.13 kg for RBS cows and 21.42 kg for RS cows, highlighting a significant difference in production between the two breeds. This disparity represents a limitation when interpreting the results, as differences in milk yield may influence the response to heat stress independently of breed-specific factors.

2.3. Providing Milk Data

Milk represents an ideal biological sample for diagnostic purposes, as it can be collected non-invasively and its analysis methods are standardized. Values for milk quality parameters from individual animals were obtained from monthly analysis reports generated as part of the Official Production Control (OPC), which follows the A4 control method under regulated conditions. The milk yield recorded on the day of control is considered representative of the average production throughout the entire 28-day control period. Although this approach represents a limitation in the comparative interpretation of the results between months, this type of data is used in studies that address the effects of HS [47,52].
Each month, during the official production control (OPC), milk samples are analyzed in the laboratory of the National Zootechnical Agency for their fat (F%), protein (P%), and casein (CN) contents using the CombiScope MK2, device produced by Delta Instruments from Drachten, Netherlands wich in present is part of PerkinElmer (USA). The CombiScope is a sophisticated instrument that performs milk analysis through infrared (IR) measurements and is composed of two main components: the Somascope and the Lactoscope FTIR (Fourier Transform InfraRed). By integrating these two modules, the device can determine the concentrations of various milk constituents, including fat, protein, lipids, urea, citric acid, free fatty acids (FFA), and density. The Somascope specifically functions as a somatic cell counter, utilizing flow cytometry as the underlying principle for measuring somatic cell count (SCC). The device is capable of processing up to 300 or 600 milk samples per hour, with samples collected in 50 mL tubes labeled with the animal’s registration number and the date of collection. Results for each analyzed sample are displayed on the screen, stored digitally, and can be compiled into comprehensive reports. Daily maintenance is performed at the beginning of each work session and includes recalibration of the spectrometer baseline using a control sample (distilled water) to establish the zero reference for all parameters; this calibration is repeated every 60 min. To prevent the accumulation of fat and protein residues, the device automatically executes washing cycles with an alkaline solution after a predetermined number of samples or at set time intervals. Technical inspection and general maintenance are recommended by the manufacturer on an annual basis [55].
For this study, data from April to September of 2023 and 2024 were used, derived from monthly analyses of an average of 35 samples for RS cows and 283 samples for RBS cows, with April and May serving as reference months. The analyzed milk quality parameters were selected based on their nutritional, economic, and technological significance, including fat and protein content (%), as well as casein concentration (g/L). Additionally, the dynamics of milk urea concentration (mg/dL) were assessed due to their close association with protein metabolism. The fat-to-protein ratio (F/P) was also evaluated, serving as an indicator of energy imbalances and overall cow health, including the risk of subclinical ketosis.

2.4. Statistical Analysis

The hypothesis of this study is that HS action alters milk composition in the listed components, affecting milk quality in addition to quantity. The values of milk quality parameters were statistically processed using SAVC var.3 software (Analysis of Variance and Covariance) for Windows, a specialized software in animal biometrics developed in Romania and which was used to determine position and dispersion estimators: arithmetic mean ( X ¯ ), standard error of the mean (± S X ¯ ), standard deviation (s), and coefficient of variation (V%) [56]. This program is often the first step in any analysis and it is based on linear models and the method of least squares; it is used because it ensures rigorous data processing, including the removal of outliers, and allows the calculation of key statistics necessary for data interpretation. The arithmetic mean is the primary numerical descriptor of a series of observations, representing the value around which the measured trait varies and allowing the classification of individuals into positive and negative variants. The standard deviation describes the degree of dispersion of the data relative to the mean, while the variance quantifies the magnitude of variation in the trait. The coefficient of variation (V%) provides a direct measure of the population’s homogeneity.
In this study, comparisons were performed between the mean values of milk quality parameters recorded during the summer months and September and the means of the reference months (April and May). Statistical significance between monthly means within the same breed for all evaluated traits was determined by calculating p-values using GraphPad Prism 9 (Palo Alto, CA, USA) [57]. Specifically, the Welch ANOVA single-factor method, which accounts for unequal standard deviations, was applied, followed by multiple pairwise comparisons using the Tukey post hoc test.
The p-value indicates the probability of committing a Type I error if the null hypothesis (H0) is rejected. If p is less than the chosen significance threshold α, usually 0.05, the null hypothesis is rejected in favor of the alternative hypothesis (H1). The interpretation of p-values in most tests is as follows:
-
p < 0.05, the relationship is significant (S, 95% confidence, marked as *);
-
p < 0.01, the relationship is significant (S, 99% confidence, marked as **);
-
p < 0.001, the relationship is highly significant (HS, 99.9% confidence, marked as ***);
-
p < 0.0001, the relationship is extremely highly significant (HS, 99.99% confidence, marked as ****);
-
p > 0.05, the relationship is not significant (NS).
The two breeds are exploited in the same specialized dairy farm. The RBS breed belongs to the Holstein strain and ensures the highest milk production in quantity. The RS breed belongs to the Simmental strain and is exploited in a smaller herd to improve the quality of the milk upon delivery. In most cases, a sample of at least 30 records is considered the generally accepted threshold to safely apply basic statistical theorems, allowing the use of parametric methods based on normal distribution. Although large samples are preferred, statistical tests can be applied on numerically disproportionate batches using appropriate tools for such statistical processing. We believe that we have respected the experimental technique, and the results obtained with statistically significant differences are relevant.
For both RBS and RS cows, statistical estimators were calculated for the main milk quality parameters: fat content (%), protein content (%), casein content (g/L), urea concentration (mg/dL), and the fat/protein (F/P) ratio.

3. Results

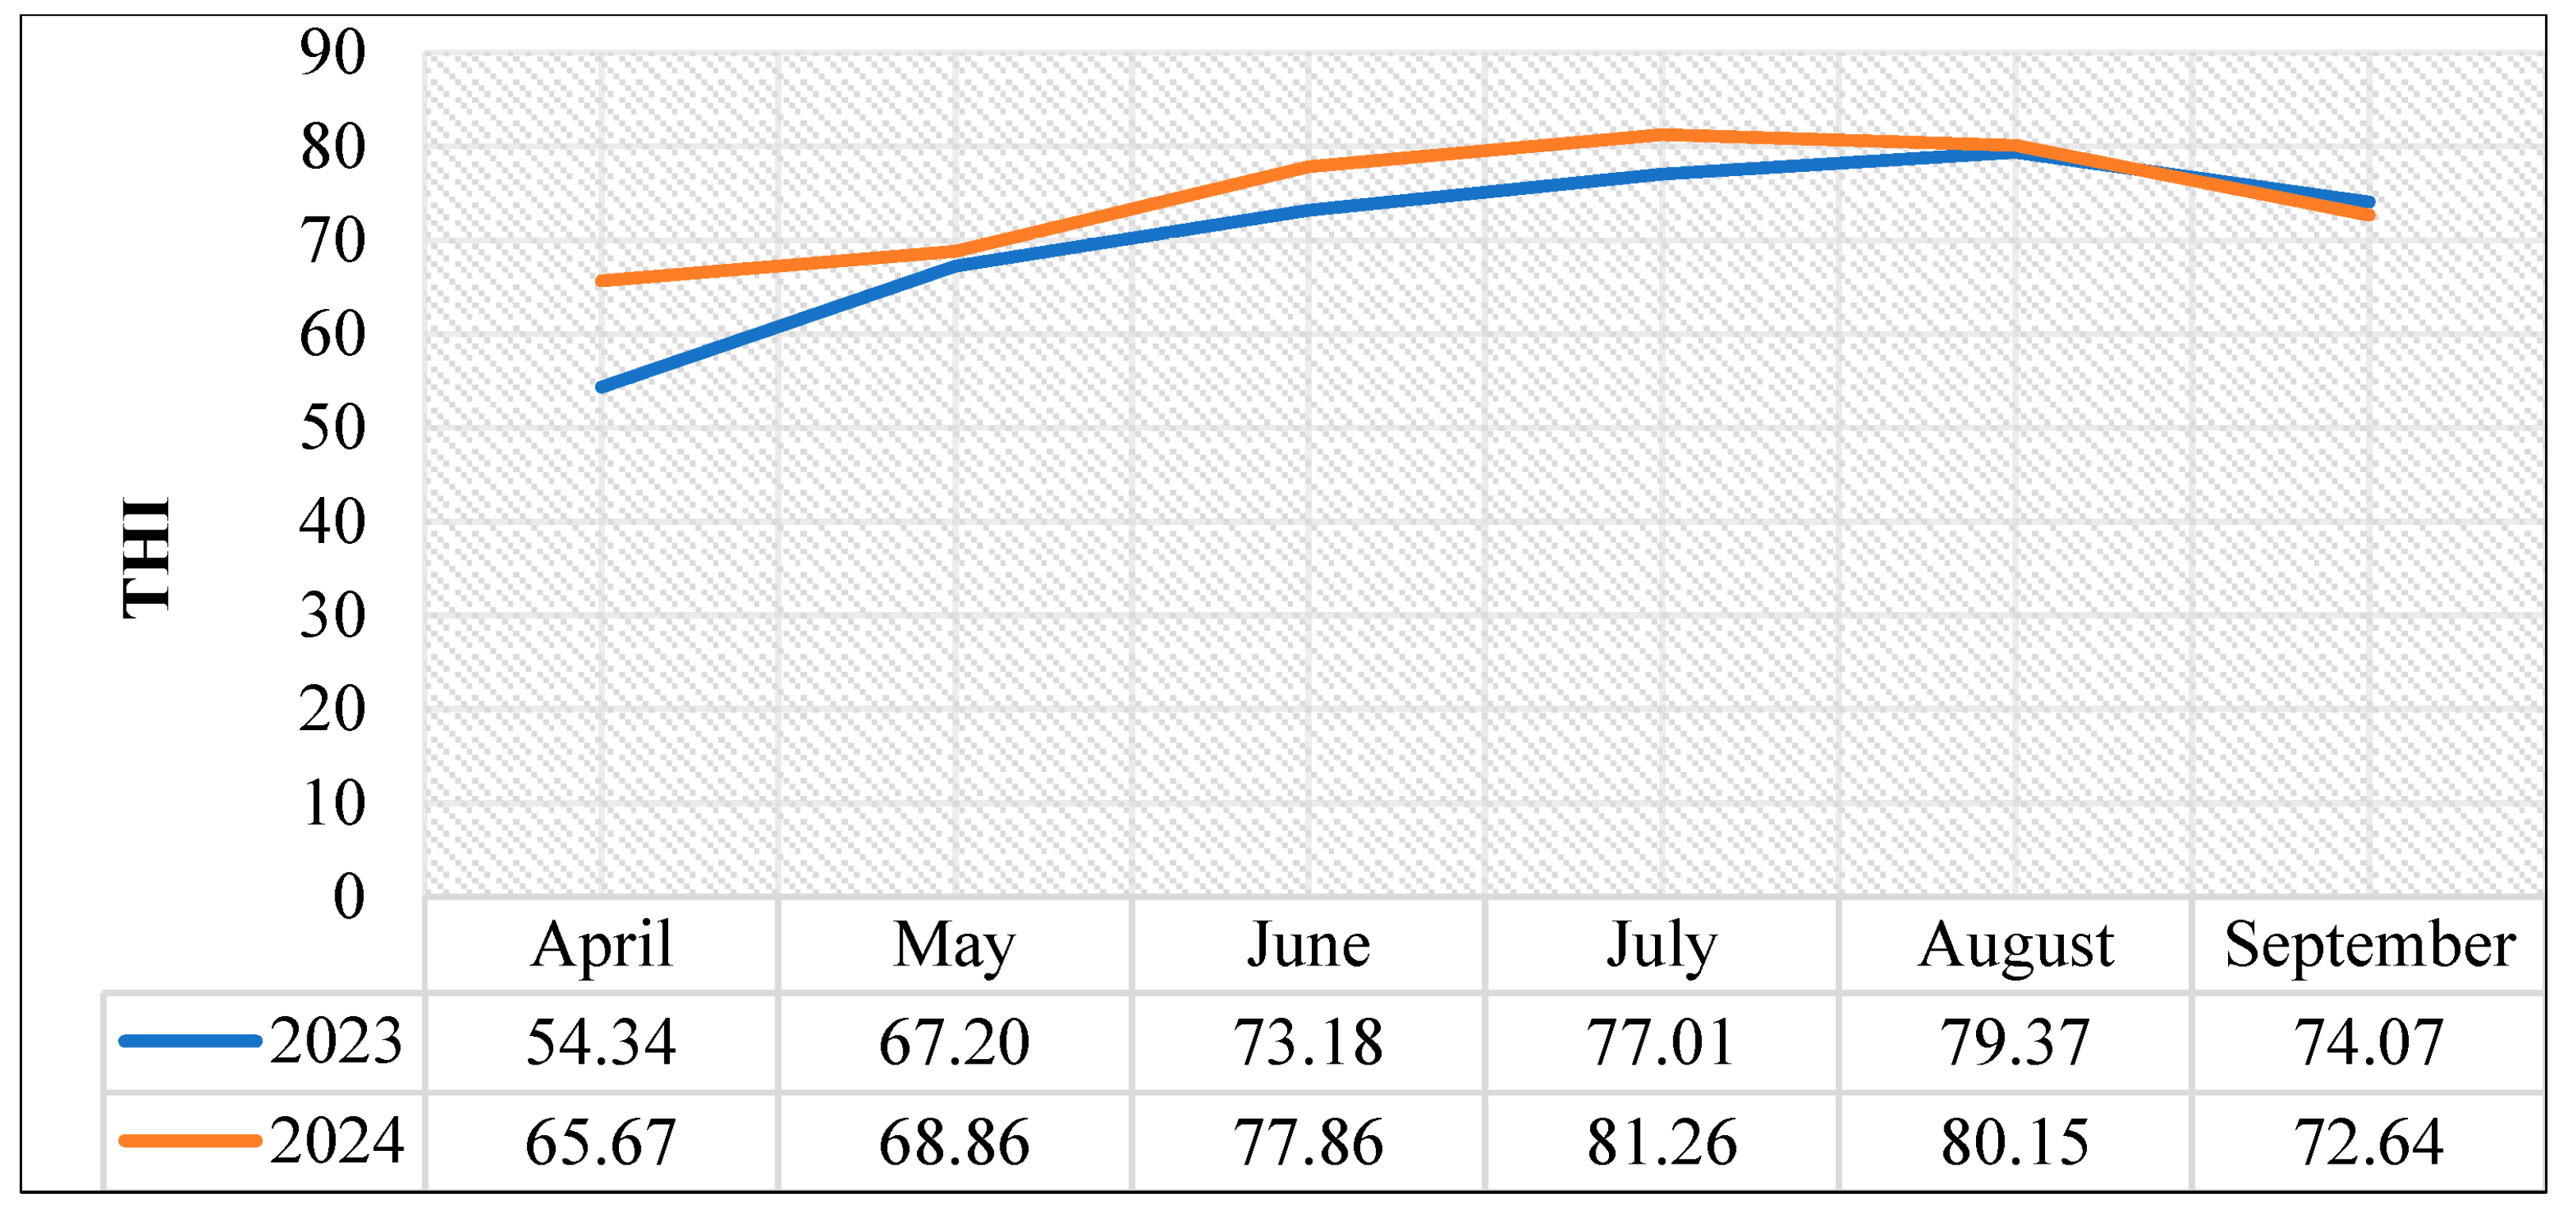
The THId values recorded for the months of 2023 and 2024 are presented in Figure 1. It can be observed that during the summer of 2024, THId values were higher compared to the corresponding period in 2023. In both years, September exhibited average daily THId values exceeding the alert threshold of 72, whereas the reference months of April and May showed THId values below this threshold. In our study, notable changes in milk quality parameters were first observed at the beginning of June, corresponding to THId values of 73.18 in 2023 and 77.86 in 2024.
For an overview of the results obtained through descriptive statistical processing, Table 2 was compiled, which includes the means and standard deviations obtained for the values of milk quality parameters for the two breeds in 2023–2024 during the period April–September. Character variability is higher in the RS cow herd, reflecting the fact that the herd is small and biological heterogeneity is high.
The average values of F% and P% content were represented in the following graphs in which error bars for the standard deviation of the mean ±SE and n values for the description of sample sizes are highlighted.
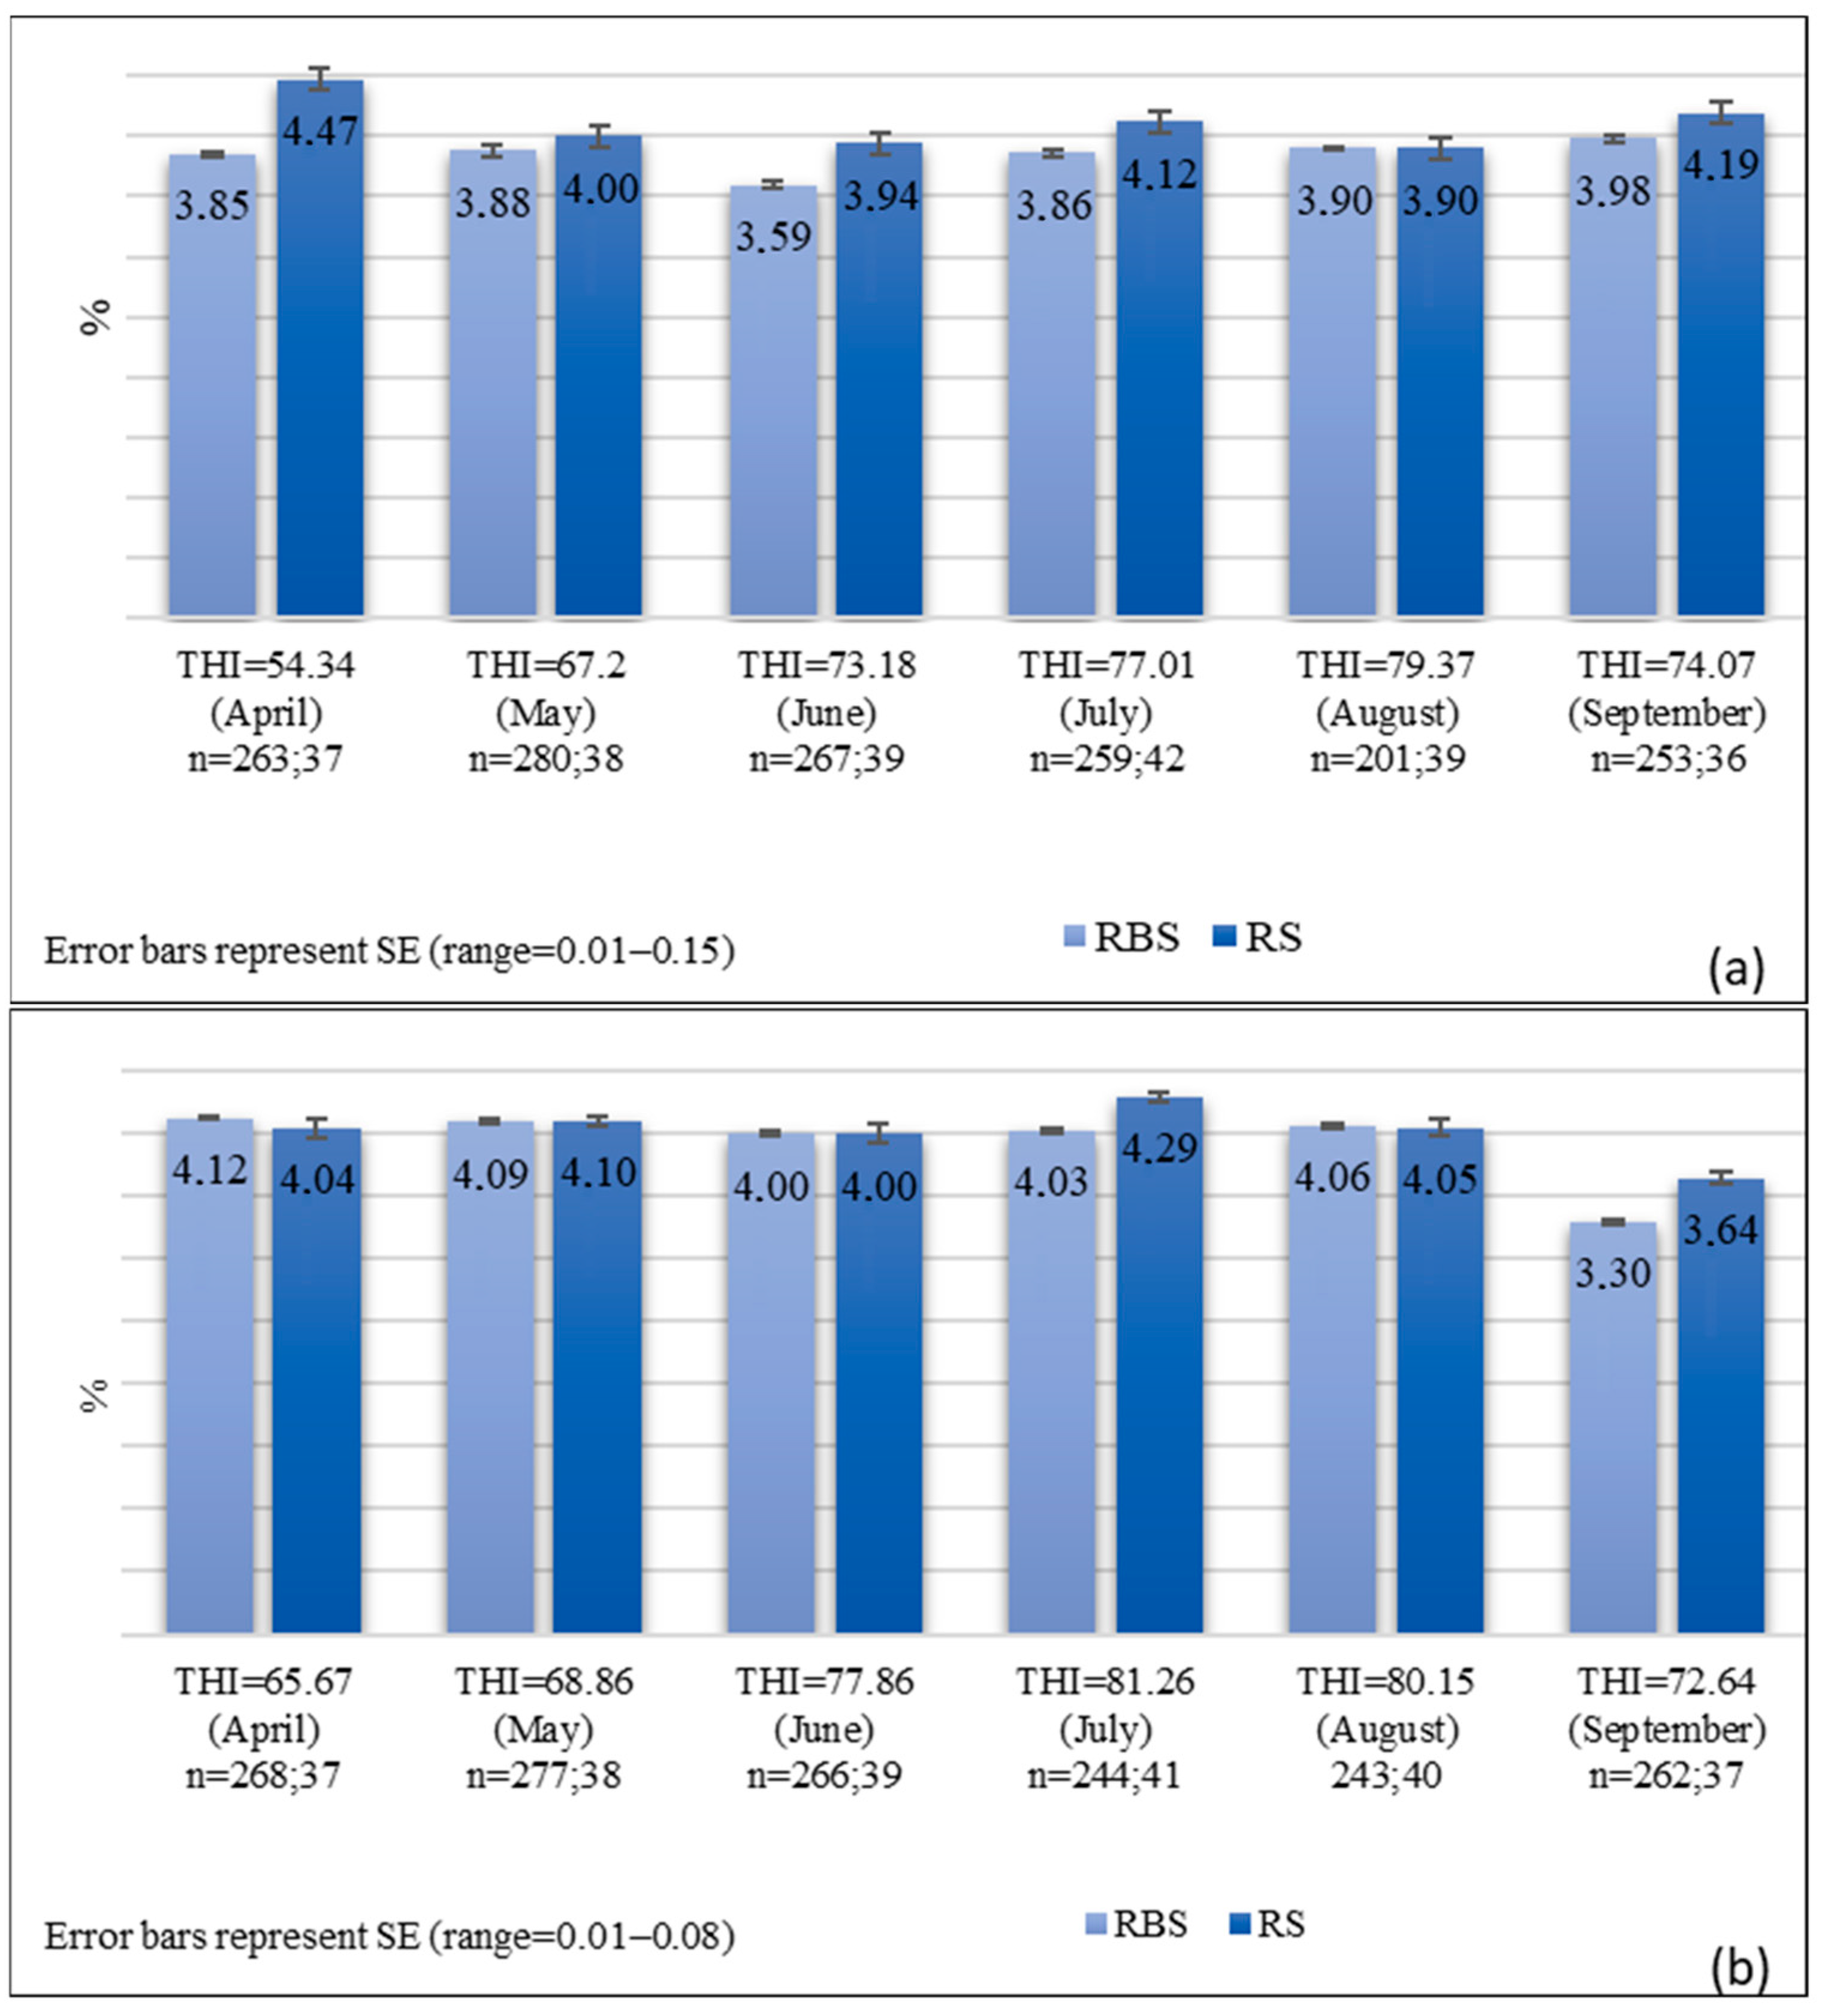
Figure 2 shows the dynamics of mean milk fat (F%) values in RBS and RS cows between April and September for 2023 (a) and 2024 (b).
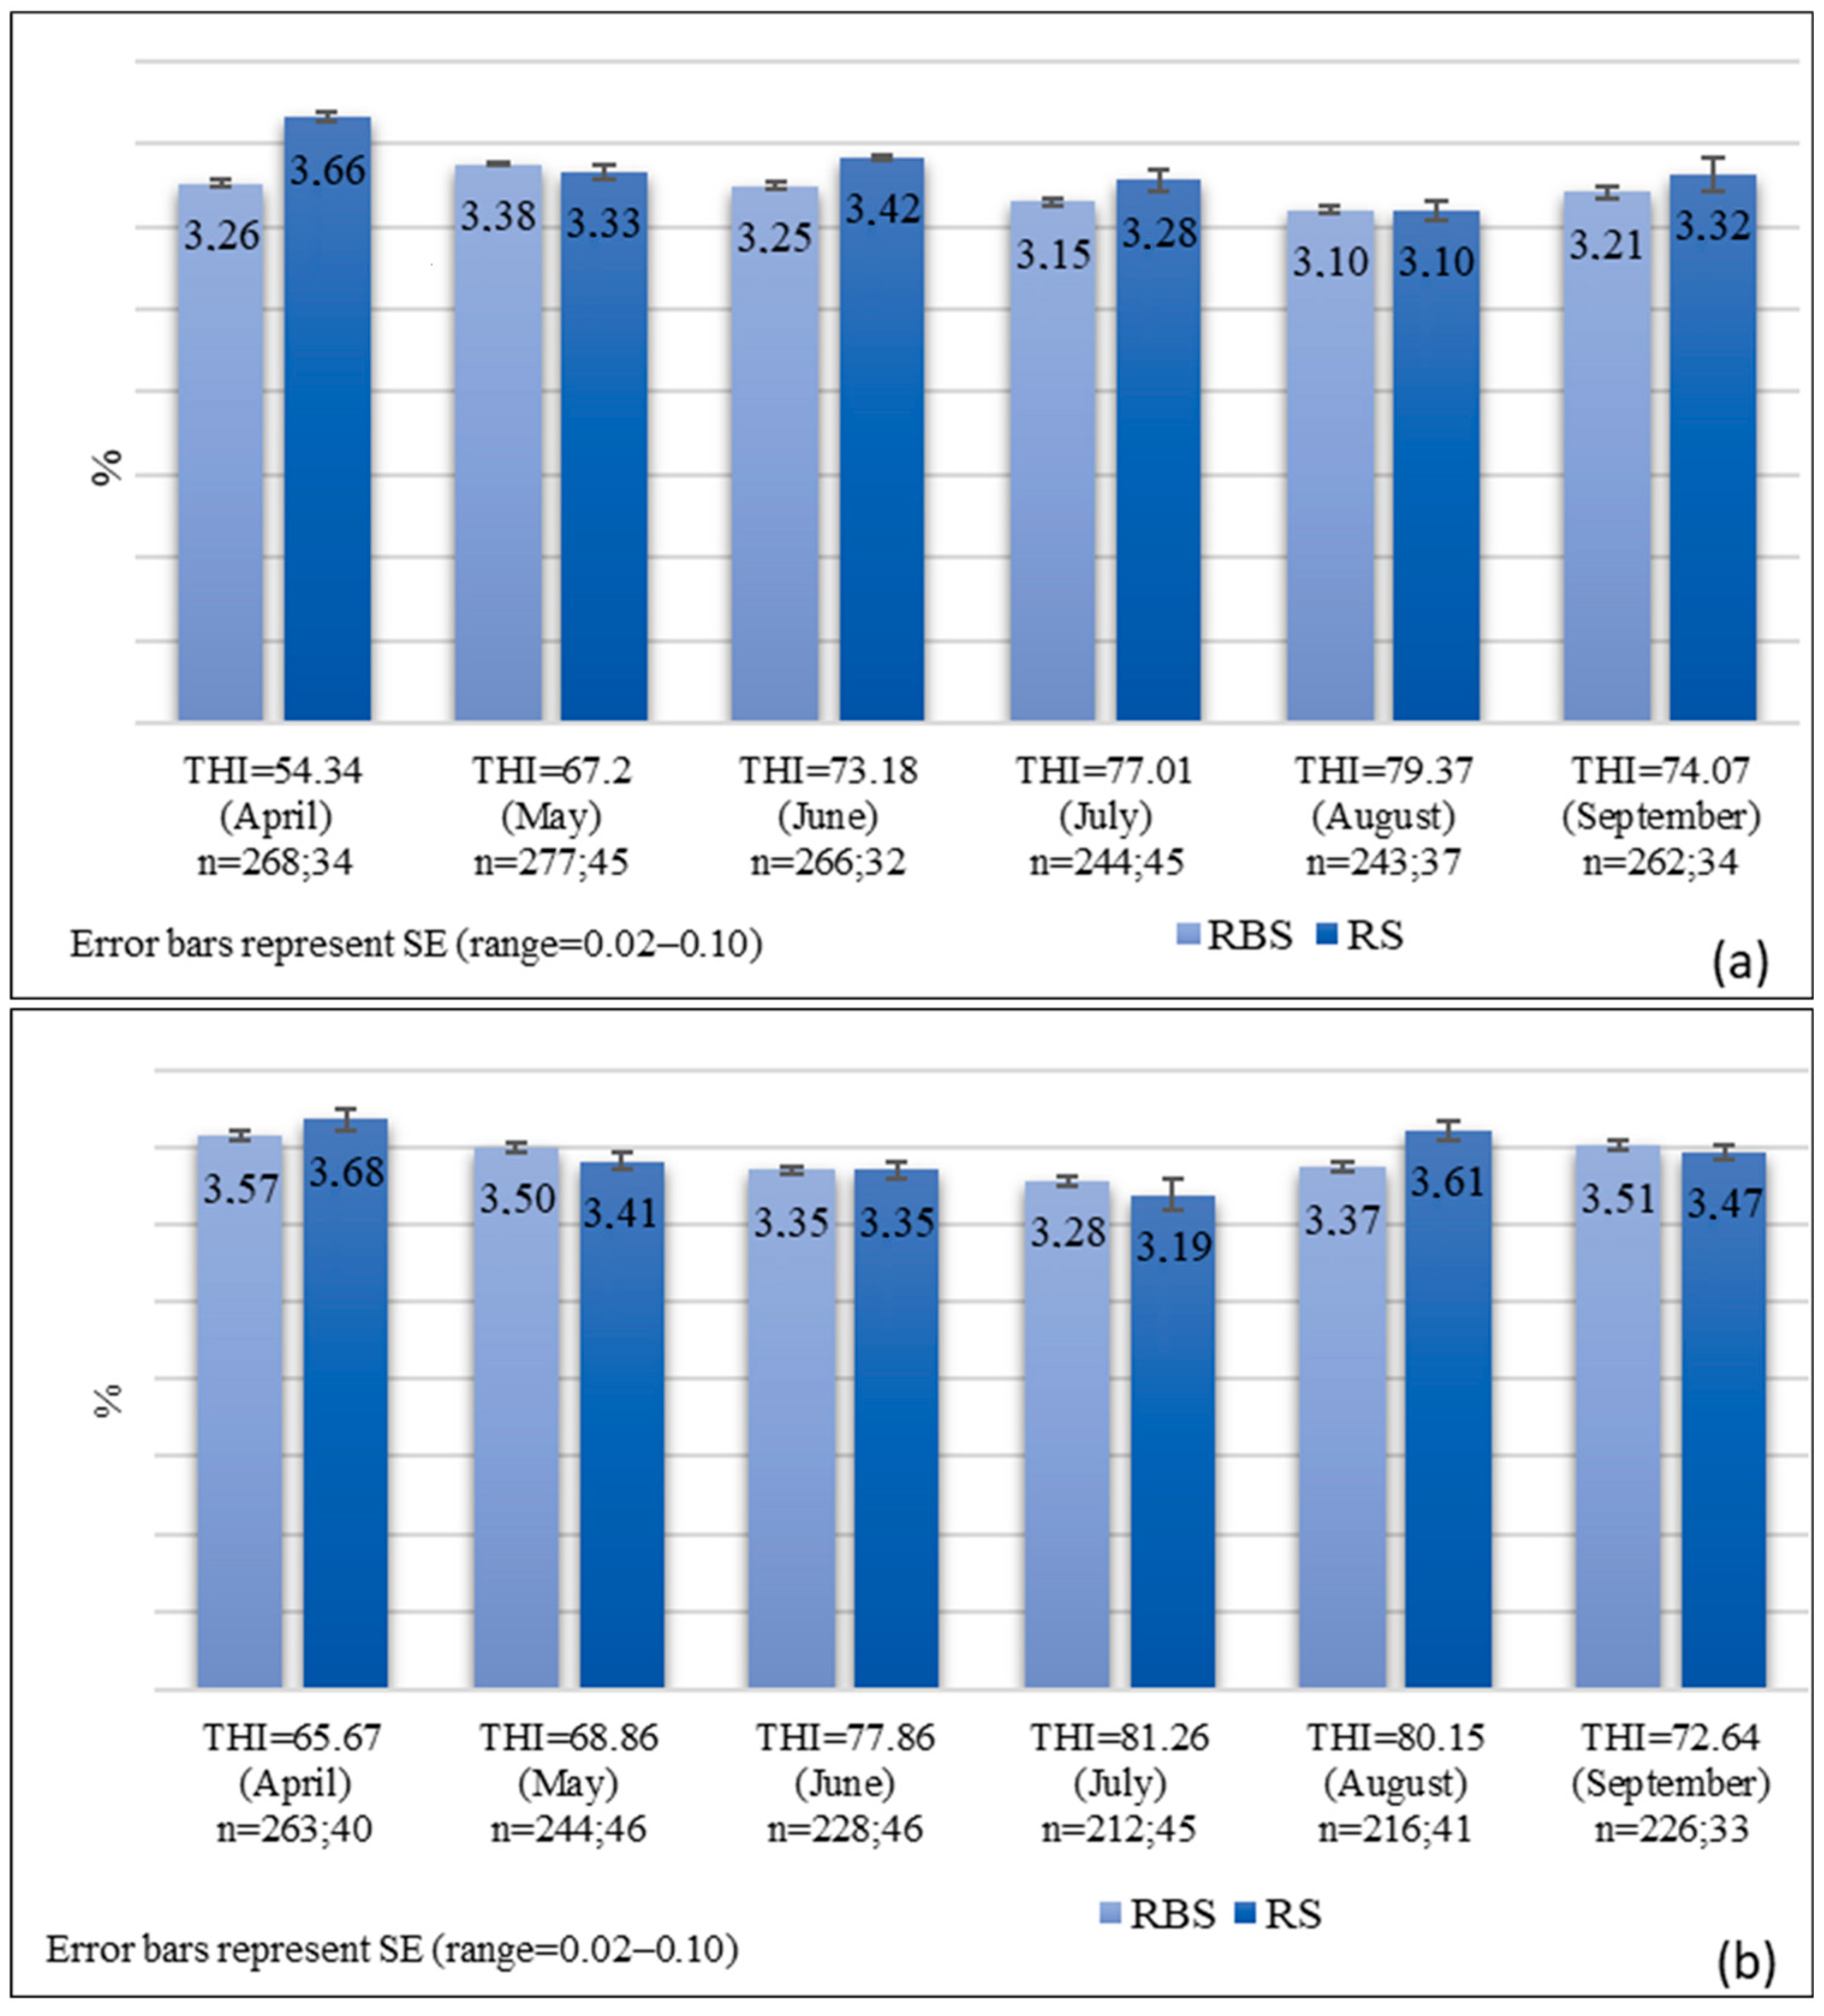
Figure 3 shows the mean protein content (P%) in milk from RBS and RS cows between April and September for 2023 (a) and 2024 (b).
Table 3 presents the statistical significance of differences between mean values of the analyzed milk quality parameters, comparing the reference months with the months under heat stress conditions. The observed differences were statistically confirmed, highlighting the impact of heat stress on milk composition.

4. Discussions

The interpretation of the results should consider certain limitations inherent to the study design, which was observational and based on monthly averages of milk quality parameters. Additionally, the numerical imbalance between the two groups of animals may affect the precision of statistical estimates for the smaller group. The differences in productive level represent another limitation, as the lower milk yield of RS cows could be associated with a distinct resilience to heat stress compared to higher-producing RBS cows. Future studies should aim to include more balanced sample sizes to strengthen the robustness and generalizability of these observations. For the summer months and September, during which daytime THId values exceeded 72, this period can be considered as the heat stress (HS) exposure window. In 2023, the highest THI values were recorded in July and August, reaching 77.01 and 79.37, respectively, while in 2024, the peak shifted slightly, with the highest value of 81.26 in July and 80.15 in August. June is also notable, with a THId of 77.86. In 2023, the increase from May to June amounted to 5.98 THI units, whereas in 2024, despite May being warmer, the difference compared to June reached 9 units. Daytime THI differences between June and July in 2024 compared to 2023 were statistically significant (p < 0.05). In April 2024, the mean THId was significantly higher than in April 2023 (p < 0.001), with an increase of 7.8 °C. Although 2024 began with generally higher temperatures, September recorded a mean 2.17 °C lower than that of 2023, while the differences for May and August were not statistically significant (p > 0.05). For a long time, it was believed that the decrease in production under heat stress (HS) was caused solely by reduced feed intake. However, studies have shown that this factor accounts for only 35–50% of milk losses, with the remainder resulting from direct metabolic changes in the body. Under HS conditions, the animal’s metabolism prioritizes survival over production, and glucose is preferentially directed toward metabolic processes that generate less internal heat. To provide precursors for gluconeogenesis, the body begins to break down muscle proteins, leading to increased concentrations of urea nitrogen in blood and milk, which serves as an indicator of inefficient protein utilization. Significant amounts of minerals, particularly potassium (K) and sodium (Na), are lost through sweat and urine, disrupting osmotic balance and muscle function. Heat stress also alters the rumen microbial population, increasing lactate production and negatively affecting fat synthesis in the mammary gland. Additionally, blood flow is redirected toward the skin, causing hypoxia in internal organs, increased intestinal permeability, and triggering systemic inflammation [58,59].
The productive level of dairy cows is directly linked to specific endocrine and metabolic profiles that dictate how the animal responds to stress factors, especially thermal stress [53]. A high productive level becomes a multiplier of the effects of HS due to the hormonal and metabolic imbalances to which the animal is predisposed.
Exposure to elevated temperatures initiates a hormonal cascade mediated by the hypothalamic–pituitary–adrenal (HPA) axis, culminating in the release of cortisol. During the acute phase of heat stress (HS), cortisol concentrations increase to mobilize energy reserves and support physiological adaptation. However, under prolonged or chronic HS, cortisol levels may decline due to adrenal exhaustion or physiological adaptation. Concurrently, serotonin levels decrease, serving as a complementary biomarker of HS and reflecting the deterioration of metabolic homeostasis in chronically stressed animals [60,61,62,63]. As a measure of adaptation of the body, the level of thyroid hormones (T3 and T4) decreases, which causes the slowing down of cellular processes and the decrease in productive efficiency [1,24,64]. Highly productive cows, under the action of HS, have a distinct endocrine profile characterized by hyperinsulinemia manifested concomitantly with hypoglycemia, which causes the mobilization of adipose tissue to no longer be achieved [2,60,65,66,67].
Somatotropin (GH) and insulin-like growth factor-1 (IGF-1) are essential hormones for supporting milk production, but their levels decrease significantly when THI exceeds 70, as an attempt by the body to reduce internal heat production, which has negative effects on protein synthesis in the mammary gland [12].
HS has also been shown to reduce the activity of genes that repair and degrade proteins and activate genes responsible for cell structure restoration, biosynthesis, and transport in the mammary gland [23]. Studies on the behavior of cows claim that the physiological response to HS also depends on the temperament of the animals, those with a lively temperament being more prone to the negative effects of heat stress on production [29]. All of this proves that under HS conditions, a systemic adaptation of the body is triggered that is influenced by the productive level and that directly influences the performance in terms of quantity and quality.
As shown in Table 2 and the graphs in Figure 1, for the RBS breed, milk protein content is the component most visibly affected by heat stress, starting to decline in June compared to the reference months. Protein percentage dropped to 3.25% in 2023 and 3.35% in 2024, representing decreases of 3.85% and 4.29%, respectively, compared to May, with the differences being highly significant (p < 0.001). This downward trend continued in the following months, with a slight recovery in late summer and in September, when THI values decreased. In the months of higher HS values (July 2023 and August 2024), the lowest protein percentages were recorded at 3.10% and 3.28%, respectively, corresponding to decreases of 8.28% and 6.29% relative to May. The results are similar to those obtained in other studies conducted and the protein content being affected by availability of precursor amino acids which are used in the body’s defense mechanisms, with decreases also influenced by feed intake [22,58,67] and reduced intestinal protein absorption. In the RS breed, a similar decrease in milk protein content is observed, becoming apparent when THI values exceed 75 units in July 2023 (p < 0.0001) and June 2024, caused by metabolic mechanisms that affect the protein synthesis [68,69,70]. In 2024, the larger increase in THI values from May to June led to the onset of heat stress, negatively affecting protein synthesis and causing a decline in milk protein content from 3.41% to 3.35%. In August 2024, when THI peaked at 81.26, protein content further decreased to 3.19%; however, this difference was not statistically significant, suggesting that the relatively low protein level may be primarily influenced by the composition of the administered ration rather than heat stress alone. Subsequent decreases in THI led to recovery in protein content. Differences in averages are significant (p < 0.05) for June and September and highly significant (p < 0.001) for July and August 2023 relative to the reference period. The temporary increase in protein content observed in June 2023 reflects the body’s response to the impact of HS, which leads to an increase in non-protein nitrogen in milk as a result of the catabolism of muscle proteins used in gluconeogenesis to cover the body’s energy needs [71,72]. This trend can be influenced, among other things, by diet composition, lactation stage, or genetic factors that determine how the animal redistributes amino acids under stress condition [71,73]. Heat stress can affect the integrity of mammary epithelial cell junctions, allowing serum proteins from the blood to pass into the milk [72]. In these conditions, the increase in protein content in the first month of HS is rather an alarm signal regarding the metabolism of cows which produce less milk and begin to consume muscle proteins to provide energy and also face possible udder inflammation.
Milk fat content is also considered an indicator of HS, with several studies reporting negative effects of HS on fat and protein content in lactating cows [22]. In the RBS breed, fat content decreased in June of both years and subsequently increased in the following months. In September 2023, with THI at 74.07, fat percentage remained high due to ongoing HS [73]. In September 2024, with a lower THI of 72.64, fat content dropped to 3.51% due to cooler ambient temperatures. Differences were highly significant (p < 0.001) for June 2023 and September 2024 relative to the reference months. After the initial impact of high temperatures, which reduced milk fat due to lower feed intake, cows belonging to RBS breed mobilized body reserves to support metabolic processes, reflected in increased fat percentages. Some studies, however, indicate that HS can increase fat content, which is consistent with observations in this study [67,70,74]. For the RS breed, fat content decreased by 1.5% in June (p < 0.01) 2023 and by 2.44% in June 2024. In 2023, THI did not exceed 80 units, and fat content fluctuated monthly, reflecting alternating periods of HS with decreased values in June (p < 0.01) and August (p < 0.0001) and mobilization of body reserves. In 2024, similar patterns occurred, with August and September showing reductions due to more prolonged and intense HS. In September, differences relative to reference months were highly significant (p < 0.001). As stress persists, among other causes, high insulin levels block the mobilization of non-esterified fatty acids from the body to the udder, reducing fat content at the end of the period [28,47]. Also, prolonged HS affects the rumen flora and predisposes cows to Subacute Ruminal Acidosis (SARA) due to reduced rumination and saliva secretion [31,59,75]. If in 2023, under the action of HS during the summer, the levels of fat content remain high, in 2024, which was warmer, the metabolism is more affected, which makes the values of this parameter decrease in September. Significant differences in fat content were recorded in both breeds in the case of June 2023 and September 2024, which means that this quality parameter is affected by the onset period of HS and at the end of the summer months when the metabolism of the animals is greatly affected.
Casein, the milk protein essential for technological and processing quality, is synthesized in the mammary gland and is influenced by mammary blood flow as well as the availability of amino acids. Average casein concentrations decreased significantly during the summer months compared to the reference months (p < 0.0001), with September values also showing a significant reduction relative to May (p < 0.005). In the RBS breed, the lowest mean casein levels were recorded in July of both years, at 25.95 g/L and 26.06 g/L, representing declines of 5.7% and 8.62% compared to April. A similar trend was observed in the RS breed, where the lowest casein concentrations occurred during the summer, reaching 26.19 g/L in August 2023 and 25.44 g/L in July 2024, corresponding to decreases of 10.18% and 12.72% relative to April. Notably, casein content began to decline in June for both years and remained reduced throughout the months when THId exceeded 72, compared to the reference period. Differences were highly significant (p < 0.0001) for RBS during summer, indicating that casein content was strongly affected by HS. Differences regarding the significance for RS in July 2024 vs. April show us that in this breed case, the effects appear later on and are not constant. Some studies show similar results in that although protein content is affected by the action of HS, the expression of genes responsible for casein synthesis was not affected to the same extent [73]. Casein presents “no significant differences” in certain contexts of moderate stress, as udder cells continue to follow the genetic program of casein synthesis, as long as their functional integrity is not completely destroyed by severe HS. Reducing the casein content of milk has direct effects on technological properties by increasing the time it takes for the curd to form, and there is even a risk that it will not set. Milk with a low casein content causes a low cheese yield, which means that economic losses extend into the processing chain [40,76].
The urea content in milk (mg/dL) is closely correlated with that in blood. Increased urea concentrations in milk with simultaneously low or normal milk protein contents suggest a lack of energy supply. The normal value for urea content in milk is between 20 and 30 mg/dL (100 mL) of milk, with a value of 35 mg/dL of milk being tolerated in cows with high milk production [77]. Urea becomes a signal of profound changes in nutrient utilization at the systemic level because its content is influenced by HS, with average summer values significantly higher (p < 0.0001) than spring months [59]. Differences between 2023 and 2024 reflect higher THI values in 2024. The lowest urea levels were observed in July 2023 and June 2024, when THId exceeded 77, then increased again, indicating HS effects on protein metabolism [59,78]. In RBS cows, average urea values were distinctly significant, highlighting the impact of HS on protein metabolism, with fluctuations reflecting breed sensitivity [58,72]. Although the literature states that urea in milk usually increases during heat stress, there are also studies reporting reductions in urea in milk. The reduction in its content is mainly due to the voluntary reduction in food consumption [79]. Because the processing of excess protein and the transformation of ammonia into urea in the liver are processes that generate additional metabolic heat, reducing the content is an adaptive effect of the body to HS [13].
The F/P ratio in milk is frequently used to identify energy deficiencies or subclinical ketosis, and increases in this ratio are associated with a negative energy balance, with values greater than 1.35 to 1.50 being a good indicator that cows are experiencing an energy deficit [45]. For both breeds, the fat-to-protein (F/P) ratio remained below the recommended optimal range of 1.3–1.5, reflecting an energy deficit likely associated with reduced feed intake during the summer months. Slight increases in the F/P ratio were observed during periods when milk fat percentage rose. Differences in the F/P ratio were highly significant (p < 0.0001) compared to the reference months in RBS cows, and a similar significant change was observed in RS cows in July 2024.
Thus, heat stress becomes a key factor influencing milk quality in cows raised under the climatic conditions of Romania. In the future, Romanian farms will need to consider the impacts of HS and implement management strategies to mitigate its effects, particularly during summer, due to its economic implications. Understanding the physiological responses to heat stress that alter milk composition could serve as a foundation for developing strategies to reduce losses as temperatures continue to rise.
Considering the influence of HS on milk quality, finding optimal solutions requires a holistic approach that includes the management of internal and external environmental factors. It is necessary to implement appropriate measures to reduce its effects and help animals get through the critical period during the summer months. Because the effects of high temperatures are reflected in the metabolism of animals, animal feeding strategies should be considered primarily along with improving microclimate conditions. Considering the reduction in feed consumption, rations must be more energy-rich without affecting the specifics of feeding. The use of fans coupled to a THI monitoring system is required during the summer. Shading barns by planting trees is recommended as a cheap and sustainable alternative to reduce temperatures in the stables. Avoiding overcrowding in the stable and even reducing animal density during this period is another viable measure. Replacing litter and removing manure should be carried out more frequently to avoid increasing humidity and to improve animal stress resistance. Breeding animals for stress resistance and light coat color is a long-term process but must be taken into account.
Research must be focused on understanding the mechanisms related to animal metabolism that are triggered under HS conditions in order to identify inter-relationships and apply the best solutions to reduce its effects on the quality of animal production.

5. Conclusions

Due to the action of HS, food intake is reduced and metabolism is modified, which is reflected in the quality of the milk obtained. Under HS conditions, the most affected component of milk quality for both breeds is the protein content.
Considering the results obtained, it can be concluded that, during months with THI values exceeding 72, the two breeds exhibit distinct responses to heat stress (HS). The RS breed appears more resilient to HS, likely due to its lower productive level and specific genetic background. Furthermore, not all milk components are equally affected; protein content and urea levels—an indicator of altered protein metabolism—are the most sensitive parameters in this breed. Casein content displayed highly significant differences in July 2024, when THI surpassed 80 units. For both breeds, the impact of HS becomes apparent in June, as milk protein concentration gradually declines in parallel with rising THI values, before stabilizing or showing a slight recovery following the peak summer temperatures. In the RBS breed, milk fat percentage initially decreased with the onset of heat stress in June, followed by an increase in the subsequent months as the animals mobilized body reserves to support metabolism. In contrast, RS cows exhibited a more variable pattern over the two years: in June, fat content increased in the following month due to mobilization of body fat, particularly in 2024 when THI reached 81.26. As heat stress decreased, milk fat percentage subsequently declined in September, reflecting the persistent effects of thermal stress and the associated metabolic adjustments. For all milk components, differences were frequently highly significant, especially in 2024. Under prolonged heat stress and elevated THI values, protein metabolism was markedly affected, with urea concentrations and the F/P ratio showing pronounced and statistically significant changes.

Author Contributions

Conceptualization, G.A. and V.M.; methodology, V.M.; software, C.P.; validation, G.A. and V.M.; formal analysis, G.A., C.P. and V.M.; investigation G.A.; resources, C.P. and G.A.; data curation, V.M.; writing—original draft preparation, G.A.; writing—review and editing, G.A and C.P.; visualization, C.P.; supervision, V.M.; All authors have read and agreed to the published version of the manuscript.

Funding

This research received no external funding.

Informed Consent Statement

Not applicable.

Data Availability Statement

The original contributions presented in this study are included in the article. Further inquiries can be directed to the corresponding author.

Conflicts of Interest

The authors declare no conflicts of interest.

References

  1. Besharati, M.; Ahmad, S.; Jabbar, M.; Palangi, V.; Esen, S.; Essen, V.K.; Eseceli, H.; Mammadov, A.; Lackner, M. Effects of stress hormones on digestibility and performance in cattle: A review. Open Agric. 2024, 9, 20220387. [Google Scholar] [CrossRef]
  2. Rhoads, M.L. Review: Reproductive consequences of whole-body adaptations of dairy cattle to heat stress. Animal 2023, 17, 100847. [Google Scholar] [CrossRef] [PubMed]
  3. Mylostyva, D.; Prudnikov, V.; Kolisnyk, O.; Lykhach, A.; Begma, N.; Kalinichenko, O.; Khmeleva, O.; Sanzhara, R.; Izhboldina, O.; Mylostyvyi, R. Biochemical changes during heat stress in productive animals with an emphasis on the antioxidant defense system. J. Anim. Behav. Biometeorol. 2022, 10, 2209. [Google Scholar] [CrossRef]
  4. Nzeyimana, J.B.; Fan, C.; Zhuo, Z.; Butore, J.; Cheng, J. Heat stress effects on the lactation performance, reproduction, and alleviating nutritional strategies in dairy cattle, a review. J. Anim. Behav. Biometeorol. 2023, 11, 2023018. [Google Scholar] [CrossRef]
  5. Miętkiewska, K.; Kordowitzki, P.; Pareek, C.S. Effects of Heat Stress on Bovine Oocytes and Early Embryonic Development—An Update. Cells 2022, 11, 4073. [Google Scholar] [CrossRef]
  6. Gao, S.T.; Guo, J.; Quan, S.; Nan, X.; Fernandez, M.S.; Baumgard, L.; Bu, D. The effects of heat stress on protein metabolism in lactating Holstein cows. J. Dairy Sci. 2017, 100, 5040–5049. [Google Scholar] [CrossRef]
  7. Promket, D.; Kenchaiwong, W.; Ruangwittayanusorn, K. Effects of Climate Change on Milk Yield and Milk Composition in Thai Crossbred Holstein Cows. Geomate J. 2020, 18, 108–113. [Google Scholar] [CrossRef]
  8. Ceciliani, F.; Maggiolino, A.; Biscarini, F.; Dadi, Y.; De Matos, L.; Cremonesi, P.; Landi, V.; De Palo, P.; Lecchi, C. Heat stress has divergent effects on the milk microbiota of Holstein and Brown Swiss cows. J. Dairy Sci. 2024, 107, 11639–11654. [Google Scholar] [CrossRef]
  9. Li, C.; Liu, Z.; Bath, C.; Marett, L.C.; Pryce, J.; Rochfort, S. The effect of 2-day heat stress on the lipid composition of bovine milk and serum. Front. Anim. Sci. 2023, 4, 1212904. [Google Scholar] [CrossRef]
  10. Trnka, M.; Olesen, J.E.; Kersebaum, K.C.; Skjelvag, A.O.; Eitzinger, J.; Seguin, B.; Peltonen-Sainio, P.; Rötter, R.; Ana Iglesias, A.; Orlandini, S.; et al. Agroclimatic conditions in Europe under climate change. Glob. Change Biol. 2011, 17, 2298–2318. [Google Scholar] [CrossRef]
  11. Frigeri, K.D.M.; Kachinski, K.D.; Ghisi, N.d.C.; Deniz, M.; Damasceno, F.A.; Barbari, M.; Herbut, P.; Vieira, F.M.C. Effects of Heat Stress in Dairy Cows Raised in the Confined System: A Scientometric Review. Animals 2023, 13, 350. [Google Scholar] [CrossRef]
  12. West, J.W. Effects of Heat-Stress on Production in Dairy Cattle. J. Dairy Sci. 2003, 86, 2131–2144. [Google Scholar] [CrossRef] [PubMed]
  13. Manzoor, A.; Maqbool, I.; Ganaie, Z.A.; Afzal, I.; Khan, H.M.; Zaffe, B. Mitigating winter vagaries in dairy animals: A review. Int. J. Vet. Sci. Ani. Husb. 2019, 4, 01–05. [Google Scholar]
  14. Pryce, J.E.; Nguyen, T.T.T.; Cheruiyot, E.K.; Marett, L.; Garner, J.B.; Haile-Mariam, M. Impact of hot weather on animal performance and genetic strategies to minimise the effect. Ani. Prod. Sci. 2022, 62, 726–735. [Google Scholar] [CrossRef]
  15. Rakib, M.R.H.; Messina, V.; Gargiulo, J.I.; Lyons, N.A.; Garcia, S.C. Graduate Student Literature Review: Potential use of HSP70 as an indicator of heat stress in dairy cows—A review. J. Dairy Sci. 2024, 107, 11597–11610. [Google Scholar] [CrossRef]
  16. Spinoni, J.; Barbosa, P.; De Jager, A.; McCormick, N.; Naumann, G.; Vogt, J.V.; Magni, D.; Masante, D.; Mazzeschi, M. A New Global Database of Meteorological Drought Events from 1951 to 2016. J. Hydrol. Reg. Stud. 2019, 22, 100593. [Google Scholar] [CrossRef] [PubMed]
  17. Călugăr, R.E.; Varga, A.; Vana, C.D.; Ceclan, L.A.; Racz, I.; Chețan, F.; Șimon, A.; Popa, C.; Tritean, N.; Russu, F.; et al. Influence of Changing Weather on Old and New Maize Hybrids: A Case Study in Romania. Plants 2024, 13, 3322. [Google Scholar] [CrossRef] [PubMed]
  18. Hill, D.L.; Wall, E. Dairy cattle in a temperate climate: The effects of weather on milk yield and composition depend on management. Anim. Int. J. Anim. Biosci. 2015, 9, 138–149. [Google Scholar] [CrossRef]
  19. Müschner-Siemens, T.; Hoffmann, G.; Ammon, C.; Amon, T. Daily rumination time of lactating dairy cows under heat stress conditions. J. Therm. Biol. 2020, 88, 102484. [Google Scholar] [CrossRef]
  20. Maggiolino, A.; Dahl, G.E.; Bartolomeo, N.; Bernabucci, U.; Vitali, A.; Serio, G.; Cassandro, M.; Centoducati, G.; Santus, E.; De Palo, P. Estimation of maximum thermo-hygrometric index thresholds affecting milk production in Italian Brown Swiss cattle. J. Dairy Sci. 2020, 103, 8541–8553. [Google Scholar] [CrossRef] [PubMed]
  21. López-Carlos, M.A.; Hernández-Briano, P.; Aguilera-Soto, J.I.; Carrillo-Muro, O.; Medina-Flores, C.A.; Méndez-Llorente, F.; Aréchiga-Flores, C.F. Effect of milking hygiene, herd size, water hardness and temperature-humidity index on milk quality of dairy farms. R. Bras. Zootec. 2023, 52, e20210189. [Google Scholar] [CrossRef]
  22. Moore, S.S.; Costa, A.; Peñasa1, M.; Callegaro, S.; De Marchi, M. How heat stress conditions affect milk yield, composition, and price in Italian Holstein herds. J. Dairy Sci. 2023, 106, 4042–4058. [Google Scholar] [CrossRef]
  23. Cartwright, S.L.; Schmied, J.; Karrow, N.; Mallard, B.A. Impact of heat stress on dairy cattle and selection strategies for thermotolerance: A review. Front. Vet. Sci. 2023, 10, 1198697. [Google Scholar] [CrossRef]
  24. Habeeb, A.A.; Osman, S.F.; Fatma Teama, E.I.; Gad, A.E. The detrimental impact of high environmental temperature on physiological response, growth, milk production, and reproductive efficiency of ruminants. Trop. Anim. Health Prod. 2023, 55, 388. [Google Scholar] [CrossRef] [PubMed]
  25. Herbut, P.; Angrecka, S.; Walczak, J. Environmental parameters to assessing of heat stress in dairy cattle—A review. Int. J. Biomet. 2018, 62, 2089–2097. [Google Scholar] [CrossRef] [PubMed]
  26. Bagath, M.; Krishnan, G.; Devaraj, C.; Rashamol, V.P.; Pragna, P.; Lees, A.M.; Sejian, V. The impact of heat stress on the immune system in dairy cattle: A review. Res Vet Sci. 2019, 126, 94–102. [Google Scholar] [CrossRef]
  27. Toledo, I.M.; Dahl, G.E.; De Vries, A. Dairy cattle management and housing for warm environments. Livest. Sci. 2022, 255, 104802. [Google Scholar] [CrossRef]
  28. Herbut, P.; Hoffmann, G.; Angrecka, S.; Godyń, D.; Vieira, F.M.C.; Adamczyk, K.; Kupczyński, R. The effects of heat stress on the behaviour of dairy cows—A review. Ann. Anim. Sci. 2021, 21, 385–402. [Google Scholar] [CrossRef]
  29. Jurkovich, V.; Hejel, P.; Kovács, L. A Review of the Effects of Stress on Dairy Cattle Behaviour. Animals 2024, 14, 2038. [Google Scholar] [CrossRef]
  30. Vitali, A.; Grossi, G.; Lacetera, N. Vaginal temperature of lactating cows during heat waves or normal summer day and effect of additional daily cooling treatments as heat load mitigation strategy. Int. J. Biomet. 2024, 68, 419–426. [Google Scholar] [CrossRef] [PubMed]
  31. Fabris, T.F.; Laporta, J.; Amy, L.; Skibiel, A.L.; Corra, F.N.; Senn, B.D.; Wohlgemuth, S.E.; Dahl, G.E. Effect of heat stress during early, late, and entire dry period on dairy cattle. J. Dairy Sci. 2019, 102, 5647–5656. [Google Scholar] [CrossRef] [PubMed]
  32. Choudhary, R.K.; Sunil Kumar, B.V.; Mukhopadhyay, C.S.; Kashyap, N.; Sharma, V.; Singh, N.; Tazerji, S.S.; Kalantari, R.; Hajipour, P.; Malik, Y.S. Animal Wellness: The Power of Multiomics and Integrative Strategies. Wiley Vet. Med. Int. 2024, 2024, 4125118. [Google Scholar] [CrossRef]
  33. Boonkum, W.; Teawyoneyong, W.; Chankitisakul, V.; Duangjinda, M.; Buaban, S. Impact of Heat Stress on Milk Yield, Milk Fat-to-Protein Ratio, and Conception Rate in Thai-Holstein Dairy Cattle: A Phenotypic and Genetic Perspective. Animals 2024, 14, 3026. [Google Scholar] [CrossRef] [PubMed]
  34. Burhans, W.S.; Rossiter Burhans, C.A.; Baumgard, L.H. Invited review: Lethal heat stress: The putative pathophysiology of a deadly disorder in dairy cattle. J. Dairy Sci. 2022, 105, 3716–3735. [Google Scholar] [CrossRef] [PubMed]
  35. Pinto, S.; Hoffmann, G.; Ammon, C.; Amon, T. Critical THI thresholds based on the physiological parameters of lactating dairy cows. J. of Thermal Biology. 2020, 88, 102523. [Google Scholar] [CrossRef] [PubMed]
  36. Czech, B.; Szyda, J.; Wang, K.; Luo, H.; Wang, Y. Fecal microbiota and their association with heat stress in Bos taurus. BMC Microbiol. 2022, 22, 171. [Google Scholar] [CrossRef]
  37. Park, T.; Ma, L.; Gao, S.; Bu, D.; Yu, Z. Heat stress impacts the multi-domain ruminal microbiota and some of the functional features independent of its effect on feed intake in lactating dairy cows. J. Anim. Sci. Biotechnol. 2022, 13, 71. [Google Scholar] [CrossRef]
  38. Bohmanova, J.; Misztal, I.; Cole, J.B. Temperature-humidity indices as indicators of milk production losses due to heat stress. J. Dairy Sci. 2007, 90, 1947–1956. [Google Scholar] [CrossRef]
  39. Collier, R.J.; Hall, L.W.; Rungruang, S.; Zimbleman, R.B. Quantifying Heat Stress and Its Impact on Metabolism and Performance; Department of Animal Science University of Arizona: Tucson, AZ, USA, 2012; pp. 74–84. [Google Scholar]
  40. Simone, B.; Martino, C.; de Aparecido, L.V.; Ferreira, Z.A.A.; Alessandro, N.; Waszczynskyj, N. Seasonal effect on milk composition, somatic cell content and milk coagulation properties of Italian Holstein-Friesian cows. Emir. J. Food Agric. 2018, 30, 998–1005. [Google Scholar] [CrossRef]
  41. Idris, M.; Uddin, J.; Sullivan, M.; McNeill, D.M.; Phillips, C.J.C. Non-Invasive Physiological Indicators of Heat Stress in Cattle. Animals 2021, 11, 71. [Google Scholar] [CrossRef] [PubMed]
  42. Islam, M.d.A.; Lomax, S.; Doughty, A.; Islam, M.R.; Jay, O.; Thomson, P.; Clark, C. Automated Monitoring of Cattle Heat Stress and Its Mitigation. Front. Anim. Sci. 2021, 2, 737213. [Google Scholar] [CrossRef]
  43. Aloia, A.; Maggiolino, A.; Forte, L.; De Palo, P. Heat stress measuring methods in dairy cows. Acta IMEKO 2024, 13, 1–5. [Google Scholar] [CrossRef]
  44. Shu, H.; Wang, W.; Guo, L.; Bindelle, J. Recent advances on early detection of heat strain in dairy cows using animal-based indicators: A Review. Animals 2021, 11, 980. [Google Scholar] [CrossRef]
  45. Antanaitis, R.; Džermeikaitė, K.; Krištolaitytė, J.; Ribelytė, I.; Bespalovaitė, A.; Bulvičiūtė, D.; Tolkačiovaitė, K.; Baumgartner, W. Impact of Heat Stress on the In-Line Registered Milk Fat-to-Protein Ratio and Metabolic Profile in Dairy Cows. Agriculture 2024, 14, 203. [Google Scholar] [CrossRef]
  46. Fan, C.; Su, D.; Tian, H.; Li, X.; Li, Y.; Ran, L.; Hu, R.; Cheng, J. Liver Metabolic Perturbations of Heat-Stressed Lactating Dairy Cows. Asian-Austral. J. Anim. Sci. 2018, 31, 1244–1251. [Google Scholar] [CrossRef]
  47. Becker, C.A.; Stone, A.E. Graduate Student Literature Review: Heat abatement strategies used to reduce negative effects of heat stress in dairy cows. J. Dairy Sci. 2020, 103, 9667–9675. [Google Scholar] [CrossRef] [PubMed]
  48. Tazzo, I.F.; Tarouco, A.K.; Allem Junior, P.H.C.; Bremm, C.; Cardoso, L.S.; Junges, A.H. Temperature and Humidity Index (THI) during the 2021/2022 summer and its impact on dairy cattle in Rio Grande do Sul, Brazil. Ciência Ani. Brasil. 2024, 25, e-77035. [Google Scholar] [CrossRef]
  49. Campos, I.L.; Chud, T.C.S.; Oliveira, H.R.; Baes, C.F.; Cánovas, A.; Schenkel, F.S. Using publicly available weather station data to investigate the effects of heat stress on milk production traits in Canadian Holstein cattle. Can. J. Anim. Sci. 2022, 102, 368–381. [Google Scholar] [CrossRef]
  50. Lander Weather Forecasts. Available online: https://www.wunderweather.com/lander (accessed on 12 December 2025).
  51. Global and Regional Weather Forecast Accuracy Overview. 2021–2024. Available online: https://forecastwatch.com/wp-content/uploads/Global_and_Regional_Weather_Forecast_Accuracy_Overview_2021-2024.pdf (accessed on 31 December 2025).
  52. Li, G.; Chen, J.; Peng, D.; Gu, X. Short communication: The lag response of daily milk yield to heat stress in dairy cows. J. Dairy Sci. 2021, 104, 981–988. [Google Scholar] [CrossRef] [PubMed]
  53. Becker, C.A.; Collier, R.J.; Stone, A.E. Invited review: Physiological and behavioral effects of heat stress in dairy cows. J. Dairy Sci. 2020, 103, 6751–6770. [Google Scholar] [CrossRef] [PubMed]
  54. Evaluation of the Delta Instrument FTIR 600 LactoScope Infrared Analyser. Available online: https://www.cecalait.fr/document/download/1771 (accessed on 8 December 2025).
  55. AfiFarm—The Ultimate Farm Management System. Available online: https://www.afimilk.com/afifarm/ (accessed on 8 December 2025).
  56. Maciuc, V.; Creangă, Ș.; Domnica, M.; Livia, V. A New Software Programme for Data Management in Dairy Farms. “ST26733”. Agric. Agric. Sci. Procedia 2015, 6, 226–231. [Google Scholar]
  57. Prism 9.0.2 Release Notes. Available online: www.graphpad.com/updates/prism-902-release-notes (accessed on 8 December 2025).
  58. Cowley, F.C.; Barber, D.G.; Houlihan, A.V.; Poppi, D.P. Immediate and residual effects of heat stress and restricted intake on milk protein and casein composition and energy metabolism. J. Dairy Sci. 2015, 98, 2356–2368. [Google Scholar] [CrossRef] [PubMed]
  59. Collier, R.J.; Renquist, B.J.; Xiao, Y. A 100-Year Review: Stress physiology including heat stress. J. Dairy Sci. 2017, 100, 10367–10380. [Google Scholar] [CrossRef] [PubMed]
  60. Dos Santos, S.G.C.G.; Saraiva, E.P.; Neto, S.G.; Maia, M.I.L.; Lees, A.M.; Sejian, V.; Maia, A.S.C.; de Medeiros, G.R.; Fonsêca, V.F.C. Heat tolerance, thermal equilibrium and environmental management strategies for dairy cows living in intertropical regions. Front Vet Sci. 2022, 9, 988775. [Google Scholar] [CrossRef] [PubMed]
  61. Naranjo-Gómez, J.S.; Uribe-García, H.F.; Herrera-Sánchez, M.P.; Lozano-Villegas, K.J.; Rodríguez-Hernández, R.; Rondón-Barragán, I.S. Heat stress on cattle embryo: Gene regulation and adaptation. Heliyon 2022, 7, e06570. [Google Scholar] [CrossRef]
  62. Dovolou, E.; Giannoulis, T.; Nanas, I.; Amiridis, G.S. Stresul termic: Un perturbator serios al fiziologiei reproductive a vacilor de lapte. Animals 2023, 13, 1846. [Google Scholar] [CrossRef]
  63. Chen, Y.C.; Orellana Rivas, R.M.; Marins, T.N.; Melo, V.H.L.R.; Wang, Z.; Garrick, M.; Gao, J.; Liu, H.; Bernard, J.K.; Melendez, P.; et al. Effects of heat stress abatement on systemic and mammary inflammation in lactating dairy cows. J. Dairy Sci. 2023, 106, 8017–8032. [Google Scholar] [CrossRef] [PubMed]
  64. Țogoe, D.; Mincă, N.A. Impactul stresului termic asupra stării fiziologice, productive și reproductive a vacilor de lapte. Agriculture 2024, 14, 1241. [Google Scholar] [CrossRef]
  65. Pontiggia, A.; Münger, A.; Eggerschwiler, L.; Holinger, M.; Stucki, D.; Ammer, S.; Bruckmaier, R.M.; Dohme-Meier, F.; Keil, N.M. Behavioural responses related to increasing core body temperature of grazing dairy cows experiencing moderate heat stress. Animal 2024, 18, 101097. [Google Scholar] [CrossRef] [PubMed]
  66. Dahl, G.E.; Tao, S.; Laporta, J. Heat Stress Impacts Immune Status in Cows Across the Life Cycle. Front. Vet. Sci. 2020, 7, 116. [Google Scholar] [CrossRef] [PubMed]
  67. Giannone, C.; Bovo, M.; Ceccarelli, M.; Torreggiani, D.; Tassinari, P. Review of the Heat Stress-Induced Responses in Dairy Cattle. Animals 2023, 13, 3451. [Google Scholar] [CrossRef] [PubMed]
  68. Gross, J.J.; Bruckmaier, R.M. Review: Metabolic Challenges in Lactating Dairy Cows and Their Assessment via Established and Novel Indicators in Milk. Animal 2019, 13, s75–s81. [Google Scholar] [CrossRef] [PubMed]
  69. Jo, J.; Lee, H. Impact of Relative Humidity on Heat Stress Responses in Early-Lactation Holstein Cows. Animals 2025, 15, 1503. [Google Scholar] [CrossRef]
  70. Habimana, V.; Nguluma, A.S.; Nziku, Z.C.; Ekine-Dziveny, C.C.; Morota, G.; Mrode, R.; Chenyambuga, S.W. Heat Stress Effects on Physiological and Milk Yield Traits of Lactating Holstein Friesian Crossbreds Reared in Tanga Region, Tanzania. Animals 2024, 14, 1914. [Google Scholar] [CrossRef]
  71. Sowula-Skrzyńska, E.; Borecka, A.; Pawłowska, J.; Kaczor, A. Thermal stress influence on the productive and economic effectiveness of Holstein-Friesian dairy cows in temperate climate. Ann. Anim. Sci. 2023, 23, 887–896. [Google Scholar] [CrossRef]
  72. Ellett, M.D.; Rhoads, R.P.; Hanigan, M.D.; Corl, B.A.; Perez-Hernandez, G.; Parsons, C.L.M.; Baumgard, L.H.; Daniels, K.M. Relationships between gastrointestinal permeability, heat stress, and milk production in lactating dairy cows. J. Dairy Sci. 2024, 107, 5190–5203. [Google Scholar] [CrossRef]
  73. Stefanska, B.; Pruszynska-Oszmalek, E.; Fievez, V.; Purwin, C.; Nowak, W. Impact of heat stress during close-up dry period on performance, fertility and immunometabolic blood indices of dairy cows: Prospective cohort study. Sci. Rep. 2024, 14, 21211. [Google Scholar] [CrossRef]
  74. Jo, J.H.; Nejad, J.G.; Lee, J.S.; Lee, H.G. Evaluation of Heat Stress Effects in Different Geographical Areas on Milk and Rumen Characteristics in Holstein Dairy Cows Using Robot Milking and Rumen Sensors: A Survey in South Korea. Animals 2022, 12, 2398. [Google Scholar] [CrossRef]
  75. Ammer, S.; Lambertz, C.; Gauly, M. Is reticular temperature a useful indicator of heat stress in dairy cattle? J. Dairy Sci. 2016, 99, 10067–10076. [Google Scholar] [CrossRef] [PubMed]
  76. Pretto, D.; De Marchi, M.; Penasa, M.; Cassandro, M. Effect of milk composition and coagulation traits on Grana Padano cheese yield under field conditions. J. Dairy Res. 2013, 80, 1–5. [Google Scholar] [CrossRef] [PubMed]
  77. Falta, D.; Zapletalová, L.; Hanuš, O.; Kučera, J.; Večeřa, M.; Chládek, G.; Filipčík, R.; Kopec, T.; Lategan, F.S. The interaction between the milk production, milk components with a low frequency of analysis and factors affecting the milk composition in dual-purpose Simmental cows. Czech J. Anim. Sci. 2023, 68, 99–110. [Google Scholar] [CrossRef]
  78. Koch, F.; Albrecht, D.; Albrecht, E.; Hansen, C.; Kuhla, B. Novel Perspective on Molecular and Cellular Adaptations of the Mammary Gland-Regulating Milk Constituents and Immunity of Heat-Stressed Dairy Cows. J. Agric. Food Chem. 2024, 72, 20286–20298. [Google Scholar] [CrossRef] [PubMed]
  79. Huang, Q.; Xiao, Y.; Sun, P. Rumen–mammary gland axis and bacterial extracellular vesicles: Exploring a new perspective on heat stress in dairy cows. Anim. Nutr. 2024, 19, 70–75. [Google Scholar] [CrossRef] [PubMed]
Figure 1. Comparative graphical representation of THId values for the period 2023 and 2024, between April and September.
Agriculture 16 00274 g001
Figure 2. Dynamics of fat content (F%) of milk obtained from RBS and RS cows according to THI values in 2023 (a) and 2024 (b).
Agriculture 16 00274 g002
Figure 3. Dynamics of protein content (P%) of milk obtained from RBS and RS cows according to THI values in 2023 (a) and 2024 (b).
Agriculture 16 00274 g003
Table 1. The diet structure administered to cows in production.
Feed ContentMFUPDINPDIECaPKg DM
Corn silo 25%0.65364320.3
Alfalfa silo0.781177116.530.35
Alfalfa hay0.610889132.50.85
Corn kernels0.871.27821200.30.87
Triticale0.871.21881080.50.87
Dicalcium phosphate0.95 2400.95
Feed diet structure
Requirement25.42470247018610732.7
Corn silo 25%3.5309.17373.3317.5011.675.83
Alfalfa silo4.5675.00409.6295.1917.315.77
Alfalfa hay3.3594.00489.5071.5013.755.50
Corn kernels7.1458.43670.871.6819.575.59
Triticale7509.09624.792.8926.615.79
Dicalcium phosphate 24.0018.500.10
Total25.402545.682568.11212.76107.4028.58
Notes: MFU = Milk Feed Units; PDIN—Protein digestible in the small intestine when nitrogen is limiting; PDIE—Protein digestible in the small intestine when energy is limiting; Ca = Calcium; P = Phosphorus; DM = Dry Matter.
Table 2. Descriptive statistics (mean ± SD) for quality parameters of milk and monthly average of THId from April to September, 2023 and 2024.
BreedYear/MonthTHIdTHIavFat%Protein%Casein (g/L)F/P RatioUrea (mg/dL)
RBS2023
April54.3448.753.85 ± 0.373.26 ± 0.2327.53 ± 2.631.18 ± 0.11
May67.260.143.88 ± 0.923.38 ± 0.3526.94 ± 2.781.13 ± 0.25
June73.1865.953.59 ± 0.453.25 ± 0.3226.13 ± 2.281.10 ± 0.14
July77.0169.543.86 ± 0.513.15 ± 0.2725.96 ± 2.161.21 ± 0.1636.95 ± 7.66
August79.3771.043.9 ± 0.173.10 ± 0.2326.19 ± 2.131.26 ± 0.11
September74.0765.673.98 ± 0.323.21 ± 0.2827.71 ± 2.571.25 ± 0.11
2024
April65.6757.364.12 ± 0.273.57 ± 0.4128.52 ± 3.431.16 ± 0.1434.28 ± 9.36
May68.86614.09 ± 0.173.50 ± 0.4427.90 ± 3.441.17 ± 0.1446.99 ± 6.08
June77.8670.034.00 ± 0.263.35 ± 0.3426.29 ± 2.581.21 ± 0.1425.03 ± 3.49
July81.2672.394.03 ± 0.293.28 ± 0.426.06 ± 3.191.24 ± 0.1539.79 ± 6.03
August80.1571.614.06 ± 0.233.37 ± 0.3826.69 ± 2.941.22 ± 0.1527.33 ± 5.7
September72.6464.323.30 ± 0.643.51 ± 0.4127.7 ± 3.170.94 ± 0.1626.26 ± 3.76
RS2023
April54.3448.754.47 ± 0.93.66 ± 0.4429.16 ± 3.531.18 ± 0.1823.42 ± 4.15
May67.260.144 ± 0.443.33 ± 0.2627.63 ± 2.91.20 ± 0.143.66 ± 6.43
June73.1865.953.94 ± 0.93.42 ± 0.527.17 ± 3.91.15 ± 0.2839.68 ± 21.63
July77.0169.544.12 ± 0.213.28 ± 0.2327.06 ± 2.61.26 ± 0.1132.64 ± 3.82
August79.3771.043.9 ± 0.173.10 ± 0.2326.19 ± 2.131.26 ± 0.1135.31 ± 9.45
September74.0765.674.19 ± 0.303.32 ± 0.3026.69 ± 2.891.28 ± 0.0535.38 ± 4.74
2024
April65.6757.364.04 ± 0.163.68 ± 0.4629.15 ± 3.631.12 ± 0.1631.6 ± 6.63
May68.86614.10 ± 0.373.41 ± 0.4227.05 ± 3.351.21 ± 0.1634.77 ± 6.63
June77.8670.034.00 ± 0.263.35 ± 0.3426.29 ± 2.581.21 ± 0.1424.84 ± 3.9
July81.2672.394.29 ± 0.443.19 ± 0.6625.44 ± 5.141.40 ± 0.3326.18 ± 8.26
August80.1571.614.05 ± 0.353.61 ± 0.4128.61 ± 3.241.10 ± 0.1231.42 ± 4.95
September72.6464.323.64 ± 0.613.47 ± 0.2927.63 ± 2.071.03 ± 0.1621.96 ± 3.44
Notes: RBS = Romanian Black Spotted; RS = Romanian Spotted; THId = Temperature–Humidity Index—daytime; THIav = Temperature–Humidity Index—daily; F/P ratio = fat/protein ratio.
Table 3. The t-test results for the significance of differences between means for the characteristics analyzed in months of HS action (June, July, August, and September) compared with reference months (April, May) in 2023 and 2024.
BreedRBSBS
Year2023202420232024
MonthAprilMayAprilMayAprilMayAprilMay
JuneF%dd b
P% d b
Caseindadd
Urea ddd dd
F/Pd
JulyF%
P%cd dddd
Caseindcdd c
Urea ddc bd
F/P d d dd
AugustF% d
P%dd ad
Caseindadbb
Urea dddb
F/Pdd a
SeptemberF% d ac
P% d b
Casein a a
Urea dddbdd
F/Pdd d
Notes: a significant (p < 0.05), b highly significant (p < 0.01), c very highly significant (p < 0.001), d extremely significant (p < 0.0001).
Disclaimer/Publisher’s Note: The statements, opinions and data contained in all publications are solely those of the individual author(s) and contributor(s) and not of MDPI and/or the editor(s). MDPI and/or the editor(s) disclaim responsibility for any injury to people or property resulting from any ideas, methods, instructions or products referred to in the content.