Article

Evaluating Marker-Assisted Selection for Varroa Resistance in Flanders Using a Three-Variant Model

1
Honeybee Valley, Department of Biochemistry and Microbiology, Faculty of Sciences, Ghent University, Krijgslaan 287, S33, 9000 Ghent, Belgium
2
Laboratory of Molecular Entomology and Bee Pathology (L-MEB), Department of Biochemistry and Microbiology, Faculty of Sciences, Ghent University, Krijgslaan 287, S2, 9000 Ghent, Belgium
*
Author to whom correspondence should be addressed.
Agriculture 2026, 16(18), 1983; https://doi.org/10.3390/agriculture16181983
Submission received: 5 August 2026 / Revised: 8 September 2026 / Accepted: 14 September 2026 / Published: 16 September 2026
(This article belongs to the Section Farm Animal Production)

Abstract

Selective breeding for Varroa resistance is an important strategy to improve honey bee colony survival against Varroa destructor, which remains a major threat to their health. However, phenotyping resistance traits is often labor-intensive. Marker-assisted selection (MAS) offers an alternative by selecting colonies based on molecular markers associated with resistance traits. This study evaluated the implementation of MAS for drone brood resistance (DBR, i.e., mite non-reproduction in drone brood), using a three-SNP model within the ongoing Flemish honey bee breeding program. From 2022 to 2025, predominantly Apis mellifera carnica workers and drones were genotyped. Through targeted breeding and mating via instrumental insemination, we aimed to reconstruct the genetic profile with all three SNPs’ protective alleles. Over sampling years, SNP2 and SNP6 increased in frequency in both workers and drones, whereas SNP4 did not. The cumulative three-SNP score also increased over years and generations, with the greatest genetic gain achieved by combining targeted breeding and targeted mating. The ideal genetic profile was obtained in three queens. However, genetic progress was not reflected in the DBR phenotype. These findings provide insights into the potential and limitations of MAS, suggesting future efforts in breeding programs towards genomic selection.

1. Introduction

Honey bees play an essential role in agriculture by pollinating many crops. However, honey bee health has been at risk over the last few decades due to pathogens and pests, pesticide exposure, extreme weather changes, and landscape impoverishment [1,2,3]. Despite intensified human intervention, including chemical treatments, rapid colony disease management, and breeding efforts, the parasitic mite Varroa destructor remains one of the main threats to honey bees [4,5]. Naturally evolved Varroa resistance has been documented in several unmanaged populations [6,7,8,9,10], but this process often coincides with major colony losses. In the long term, selective breeding provides a more sustainable solution for apiculture. Breeding efforts were initially focused on colony performance (honey yield) and favorable behavioral traits (e.g., gentleness and reduced swarming tendency) [11]. Currently, priorities have shifted toward breeding colonies expressing Varroa resistance [12]. A frequently used approach is field-assisted selection (FAS), which involves selecting Varroa-resistant traits that can be phenotypically observed in a colony by the beekeeper. For example, hygienic behavior, whereby honey bees detect and remove dead brood from sealed cells [13], can be quantified using the pin-killed brood assay [14]. To maintain a breeding stock, continuous selection for multiple traits, taking into account their genetic correlations, heritability, and environmental interactions, is required [11,12,15,16]. In addition, the polyandrous nature of honey bee reproduction [17] makes breeding programs in apiculture challenging and limits their widespread implementation.
An alternative and more advanced approach is to identify and use molecular markers associated with the phenotypes of desirable traits for the selective breeding of mite-resistant colonies. This strategy is called marker-assisted selection (MAS), which accelerates breeding progress, enabling large-scale and more accurate selection than FAS [12,18,19]. Molecular markers for MAS can be genetic markers, such as single-nucleotide polymorphisms (SNPs; variations in only one nucleotide at specific loci in the genome), or expression biomarkers (i.e., transcripts or proteins) [12,15,20]. Genetic and proteomic markers have been identified for the previously mentioned hygienic behavior [21,22].
Another promising Varroa-resistant trait is suppressed mite reproduction (SMR). This colony-level trait can be expressed in two ways: fecundity- or fertility-based reduction in mite reproduction [23]. The former is characterized by the mother mite producing a lower number of viable and/or mated daughter mites due to delayed egg laying or the absence of a male [23,24]. The latter is defined as the inability of the foundress mite to produce any offspring, either male or female, also known as mite non-reproduction (MNR) [23]. Since mites prefer to reproduce in drone brood [25], MNR in drone brood, also called drone brood resistance (DBR), is favored as a Varroa-resistant trait [26]. Since 2017, DBR has been phenotypically assessed within the Honeybee Valley (HBV, Ghent University) mass selection breeding program in Flanders, Belgium [27]. DBR measurement requires a detailed examination of Varroa-infested drone brood to determine mite reproductive success, making the procedure labor-intensive, time-consuming, and dependent on suitable brood samples [28]. Therefore, alternative, easier, and faster methods have been sought.
In 2019, Broeckx et al. [26] found eight SNPs in seven different Apis mellifera genes linked to MNR in drone brood. These findings originated from only one hybrid Varroa-resistant/sensitive (VR/VS) colony from the Amsterdam Water Dunes (The Netherlands) [26]. Consequently, this colony-specificity raised the question of whether the eight-variant model could be implemented for MAS on a population-wide scale, including different A. mellifera subspecies and beekeeping practices, or whether these findings were colony-specific. Therefore, Lefebre et al. [29] built on Broeckx et al.’s [26] study and validated the eight-variant model in Flemish honey bee colonies. Furthermore, they described a new reduced three-variant model, containing only three SNPs of the original eight: SNP2, SNP4, and SNP6 [29]. Two SNPs shifted properties in the reduced model compared to the original model: SNP2 changed from a risk SNP (i.e., the variant-type allele for the SNP was associated with decreased MNR) to a protective SNP (i.e., the variant-type allele for the SNP was associated with increased MNR), and SNP6 changed from a protective SNP to a risk SNP [29]. Based on these associations, Lefebre et al. [29] identified the favorable and unfavorable alleles for each of the three SNPs. This three-variant model [29] was based on Apis mellifera carnica samples (evolutionary A. m. C lineage; [30]), while the original eight-variant model [26] originated from an Apis mellifera mellifera queen (evolutionary A. m. M lineage) [30]. To strengthen the hypothesis that evolutionary background may influence the models’ variant properties, an exploratory association study was performed to screen for the original eight SNPs across 14 European countries and six subspecies [20]. They suggested that the genetic DBR marker-loci linkages may differ between A. mellifera subspecies or phylogenetic lineages; more specifically, the properties (risk or protective) of SNPs associated with DBR may vary [20].
With this knowledge, DBR-associated genetic markers could be used for MAS, considering the subspecies of the tested queens. Consequently, MAS was implemented in the HBV selection program using the three-variant model [29], as the main subspecies of beekeepers in the program was A. m. carnica. The ultimate goal of this MAS application was to enhance the DBR phenotype by reconstructing the genotypic profile with all three SNPs’ protective alleles. This was achieved by providing our participants with advice on breeding and mating. In doing so, we evaluated whether MAS increased the frequency of favorable SNP alleles in Flemish honey bee colonies across years and generations in an ongoing breeding program. Finally, we aimed to analyze whether the genetic progress was mirrored in the phenotypic assessment of DBR. Therefore, phenotypic analyses were continued over the years and were not yet replaced by the MAS procedure. Together, these research questions aim to clarify the efficacy and extent to which current MAS practices translate into expected genetic breeding gains and phenotypic progress in terms of mite resistance.

2. Materials and Methods

2.1. Colony Sampling

From 2022 to 2025, Flemish beekeepers sampled a self-selected number of colonies from their apiaries, preferably with a defined genetic background, in different regions of Flanders, Belgium. Most beekeepers participating in the MAS study were also enrolled in the Flemish mass selection program coordinated by Honeybee Valley, although participation in the mass selection program was not a prerequisite for inclusion in this study. New participants were allowed to join the MAS study annually, with varying numbers of colonies. No restrictions were imposed on honey bee subspecies/breeds for participation. All queen data were centralized using our web-based application, Breed It (https://www.honeybeevalley.eu/, accessed on 3 November 2025). Beekeepers reported the subspecies/breed of their queens, and this was not independently verified. The pedigree data included the maternal and paternal lines, the way of mating, and the associated drone line. Based on this information, and as queens were tested over multiple consecutive years, the resulting dataset contained related lineages.
Within the framework of the mass selection program, the phenotypic traits mite non-reproduction (MNR) and mean V. destructor reproduction rate (mVR) were assessed as described by von Virag et al. [23] and Lefebre et al. [28]. For this purpose, participants acquired capped drone brood of at least 2 dm2 containing 16–18-day-old (purple-eyed) pupae between April and July. From this drone brood sample, 30 pupae were kept separately for subsequent genotyping. If no drone brood sample was available, the beekeepers were instructed to collect a separate specimen of 30 drone pupae of comparable developmental age. Additionally, 30 purple-eyed worker pupae (minimum age of 17 days) per colony were pooled in a single vial. After collection, the labelled samples were immediately frozen by the beekeeper and later transported to the laboratory, maintaining the cold chain, where the samples were stored at −20 °C until further phenotyping or genotyping analyses.

2.2. Phenotyping: Data Collection and Calculations

From each brood sample, capped cells were manually opened and inspected, and data were collected on the number of mother mites and the number of male and female progeny present in each cell. Using these data, different phenotypes were classified as follows: no mites in the cell; one mother mite without progeny; one mother mite with progeny; and multiple mother mites. These phenotypes can be further grouped as Single Infested Cells (SICs), cells with only one mother mite, and Multiple Infested Cells (MICs), cells with multiple mother mites. In addition, the pupal ages of all opened cells (regardless of mite infection) were recorded in accordance with Tofilski [31] to calculate the average pupal age of the brood sample. The opening of cells was grouped into counting phases, whereby counting was stopped if too few mites were found in the brood cells. In this way, we avoided excessive time spent on a brood sample with an insufficient mite load. If enough mites were found in a phase, counting continued to the next phase until a maximum of 350 cells were opened. If 35 SICs were found before the last phase, inspections were halted. The calculations of MNR and mVR followed the definitions described by Lefebre et al. [28]: MNR, defined as the proportion of SICs without offspring over the total number of SICs,
M N R   ( % ) = S I C s   w i t h o u t   o f f s p r i n g t o t a l   n u m b e r   o f   S I C s × 100 ,
with a minimum of 10 SICs, and mVR, defined as the average number of offspring per infested cell, while compensating for the reduced number of offspring with increasing proportions of multiple infested cells.
m V R = t o t a l   n u m b e r   o f   o f f s p r i n g   m i t e s t o t a l   n u m b e r   o f   m o t h e r   m i t e s × t o t a l   n u m b e r   o f   m o t h e r   m i t e s t o t a l   n u m b e r   o f   i n f e s t e d   c e l l s × 1.37 ,
with a minimum of 10 infested cells. Brood samples were excluded for further analysis if the average pupal age was younger than 16.5 days or older than 18.5 days.

2.3. Queen and Colony Genotyping

As this study constitutes an assessment of long-term data rather than a methodological study, the full protocol is not reiterated here; instead, it is provided in the cited references.

2.3.1. Pooled Leg gDNA Extraction

From each sample of worker or drone pupae, 30 different hind legs were pooled in an Eppendorf tube containing 180 µL ATL buffer from the QIAamp® DNA Micro Kit (Qiagen, Hilden, Germany). After overnight incubation at 56 °C with 20 µL proteinase K, gDNA was extracted according to the manufacturer’s instructions. Finally, gDNA was eluted in 50 µL DNase/RNase-free water.

2.3.2. Genotyping and Allelic Frequency Analysis

Drone and worker genotyping for SNP2, SNP4, and SNP6 was performed by qPCR with dual-labelled probes following the protocols of Claeys Bouuaert et al. [32] using pooled gDNA as a template. For each SNP, allelic discrimination plots were constructed by plotting the end-point Relative Fluorescence Units (end-RFU) values of FAM (fluorescein; wild-type fluorophore) against the end-RFU values of TR (Texas Red; variant-type fluorophore) for all pooled drone leg samples. Based on these allelic discrimination plots, the genotypes of the respective queens were reconstructed. Determination of allele frequencies in pooled worker gDNA samples was performed as described by Lefebre et al. [29]. Briefly, per genotyping assay, SNP-specific calibration curves with standards 0%, 10%, 20%, 30%, 40%, 50%, 60%, 70%, 80%, 90%, and 100% variant-type allele were run in duplicate. Data analysis was performed using Bio-Rad CFX Manager 3.1 (Bio-Rad Laboratories, Hercules, CA, USA) and Microsoft Excel for Microsoft 365 (Version 2608; Microsoft Corporation, Redmond, WA, USA). For each pooled worker sample, the percentage of variant-type allele was calculated by regression of the ratio of end-RFU TR to end-RFU FAM against the quadratic intraplate calibration curve. The results were subsequently fine-tuned using the reverse fluorescence ratio (end-RFU FAM/end-RFU TR).

2.3.3. Three-Variant Model: Scoring, Breeding and Mating Strategies

Although samples from different subspecies/breeds were collected, processed and scored, further breeding and mating advice was only provided for colonies headed by carnica ssp. queens. Participants were informed that the interpretation of the results for Apis mellifera Buckfast and A. m. mellifera colonies should be approached with caution, as the variant model used in the present study was developed specifically for A. m. carnica [20]. Results from other subspecies/breeds were retained in the dataset to support future analyses of genetic and phenotypic variation across different honey bee subspecies. Occasionally, laboratory analyses did not yield results for one or more SNP markers, for example, due to insufficient biological material or other technical limitations.
Favorable alleles for the three SNPs in carnica ssp. were the variant-type allele for SNP2 and the wild-type allele for SNP4 and SNP6 [29]. For each SNP, genotyping scores were expressed as the relative proportion (%) of the favorable allele within the analyzed samples. In worker samples, reflecting the colony’s genetic composition, this percentage showed the average allelic composition across the pooled workers owing to their mixed genetic composition, as workers inherit genetic material from both the queen (maternal line) and the (multiple) drones she mated with (paternal line). Consequently, worker-derived allele frequencies could range continuously from 0 to 100%. The pooled drone samples reflected the queen’s allelic composition, as drones originate from unfertilized eggs and therefore inherit only maternal genetic material. When the queen was homozygous for a given SNP allele, the drone samples yielded values of either 0 or 100%. When the queen was heterozygous, the pooled drone sample contained both alleles, resulting in an intermediate percentage of 50.
To improve the overall presence of genetic markers and combine the favorable alleles of the three genetic markers within colonies, the three SNP scores for workers and drones were summed separately, resulting in a cumulative score ranging from 0 to 300. Each SNP was given equal weight in this cumulative score, which was used as a practical selection index rather than an estimate of each SNP’s relative contribution to MNR. Subsequently, the colonies were ranked according to these cumulative scores. Based on the worker-derived cumulative scores, maternal breeding lines for queen rearing were identified (=targeted breeding), and based on the drone-derived cumulative scores, colonies as sources of drones for instrumental insemination (II) were identified (=targeted mating). This enabled the combination of complementary favorable SNP profiles for SNP2, SNP4, and SNP6, on the condition that the donor drone line did not have a 0% score for any of the three SNPs, or in other words, that the paternal line was not homozygous for the unfavorable allele. In an attempt to create this ideal genetic profile in queens (and colonies), multiple years of targeted breeding and targeted mating (TB-TM) of queens were implemented. Since this strategy was not feasible on a large scale, we encouraged our participating beekeepers to at least breed from queens with a favorable genetic profile, or in other words, apply targeted breeding and non-targeted mating (TB-NM). Lastly, queens originating from non-targeted breeding and non-targeted mating (NB-NM) were included as a reference. For all three strategies, progress in the genetic profile could be assessed over generations and could be compared to each other.

2.4. Statistics

Statistical analyses were only performed on the carnica ssp. dataset. Data cleaning, analysis, and visualization were conducted using R version 4.5.1 (R Foundation for Statistical Computing, Vienna, Austria) within RStudio version 2025.09.1 (Posit Software, PBC, Boston, MA, USA). All tests were checked and complied with the required assumptions. Mixed-effects models (LMMs), including beekeeper identity as a random effect, were initially evaluated for all analyses. When the beekeepers’ identity explained negligible variance and did not materially affect the model estimates, simpler linear models (LMs) were retained. To assess temporal trends in worker-derived marker frequencies (individual SNPs and the sum of three SNPs) across sampling years, LMMs were fitted with sampling year as a continuous fixed effect and beekeeper as a random effect to account for repeated sampling of colonies from the same beekeeper. To assess similar temporal trends over generations, LMs with generation as an explanatory variable were used. In separate models, the response variable was the percentage of the favorable allele within each pooled worker sample for each genetic marker (SNP2, SNP4, and SNP6), and the sum of the percentages across the three markers. The estimated regression coefficient (β) represents the annual or generational change in the frequency of the favorable allele or cumulative three-SNP score.
Drone SNP scores were coded as ordered categorical variables (0, 50, and 100), corresponding to increasing representation of the favorable SNP allele. Temporal trends in marker frequencies (individual SNPs and the cumulative three-SNP score) from drone samples over sampling years were analyzed using separate cumulative link mixed models (CLMMs), with sampling year as a continuous fixed effect. Beekeeper identity was included as a random intercept to account for repeated sampling from the same beekeeper in the different years. Model coefficients were reported on the cumulative logit scale, and statistical significance was assessed at α = 0.05. Generational trends in drone SNP scores were not formally analyzed because the number of available drone results was limited and unevenly distributed across generations, particularly in later generations. Therefore, the dataset was considered insufficient for robust statistical inference.
Temporal trends over sampling years for phenotypic traits (MNR and mVR) were assessed using LMs with sampling year as the explanatory variable. MNR values were log-transformed as log(MNR + 1) to improve the model assumptions. Temporal trends in MNR and mVR over generations were assessed using LMMs, with generation as a fixed effect and beekeeper identity as a random intercept. To evaluate the relationship between phenotypic traits (MNR and mVR) and genotyping results obtained from the drone (brood and pupae) samples, a Spearman’s rank correlation was performed.

3. Results

3.1. Descriptive Statistics

Between 2022 and 2025, 975 colonies from 73 beekeepers were sampled for drone brood, worker pupae, and drone pupae, with an average of ≈13 sampled colonies per beekeeper. The sampled colonies were headed by 848 (≈87%) A. m. carnica queens, 55 (≈6%) A. m. Buckfast queens, 67 (≈7%) A. m. mellifera queens, and five (≈1%) queens of an unknown subspecies. Detailed yearly sample numbers for all subspecies/breeds are provided in Supplementary Materials Table S1.
For the subsequent statistical analyses, the dataset was restricted to carnica ssp. colonies (see Section 2.3.3). Table 1 shows the number of samples taken and data-rendering samples in this dataset between 2022 and 2025. Of the screened colonies (N = 848), ≈41% yielded the previously mentioned three sample types, ≈26% yielded two, and ≈33% yielded only a single sample type. In 2022, the sample size was smaller because it included only sampled workers from our own colonies and worker/drone samples from the annually collected worker/drone brood within the framework of the traditional selection workgroup of HBV. Sample sizes increased substantially from 2023 onwards, following the expansion of participant recruitment and sampling efforts. The number of available MNR and mVR measurements was substantially lower than the number of collected drone brood samples because many samples did not meet the requirements for phenotypic assessment. The Supplementary Materials Table S2 shows the individual SNP results for each sampling year in the carnica ssp. dataset.
Across all drone samples, only three colonies achieved the maximum cumulative three-SNP score (=300), corresponding to favorable results for all three markers. Two colonies were observed in 2024 and one in 2025. No worker sample reached a cumulative three-SNP score of 300; the highest observed worker score was 270.91 in 2025. However, for the separate SNPs, there were cases of a perfect score in workers (=100%) over the years, with 70 colonies for SNP2, 8 colonies for SNP4, and 25 colonies for SNP6. The Supplementary Materials Table S3 summarizes the genotyping results for each sampling year.
For the genotyping generational analyses based on worker samples, 301 queens were included, spanning up to four generations, although most lineages comprised three generations. Table 2 shows the variation in worker sample sizes among generations and breeding-mating strategies. The largest number of colonies was available for the NB-NM group (reference group), whereas later generations in the TB-NM group were represented by relatively few colonies. Consequently, results involving later generations should be interpreted cautiously due to reduced statistical power. The number of drone SNP scores available over generations was too limited and therefore not included in the genotyping generational analyses. Drone brood sample sizes—and thus the corresponding phenotyping results (MNR and mVR)—also varied among generations (see Table 2), with lower numbers in the third generation.

3.2. Genotyping Results

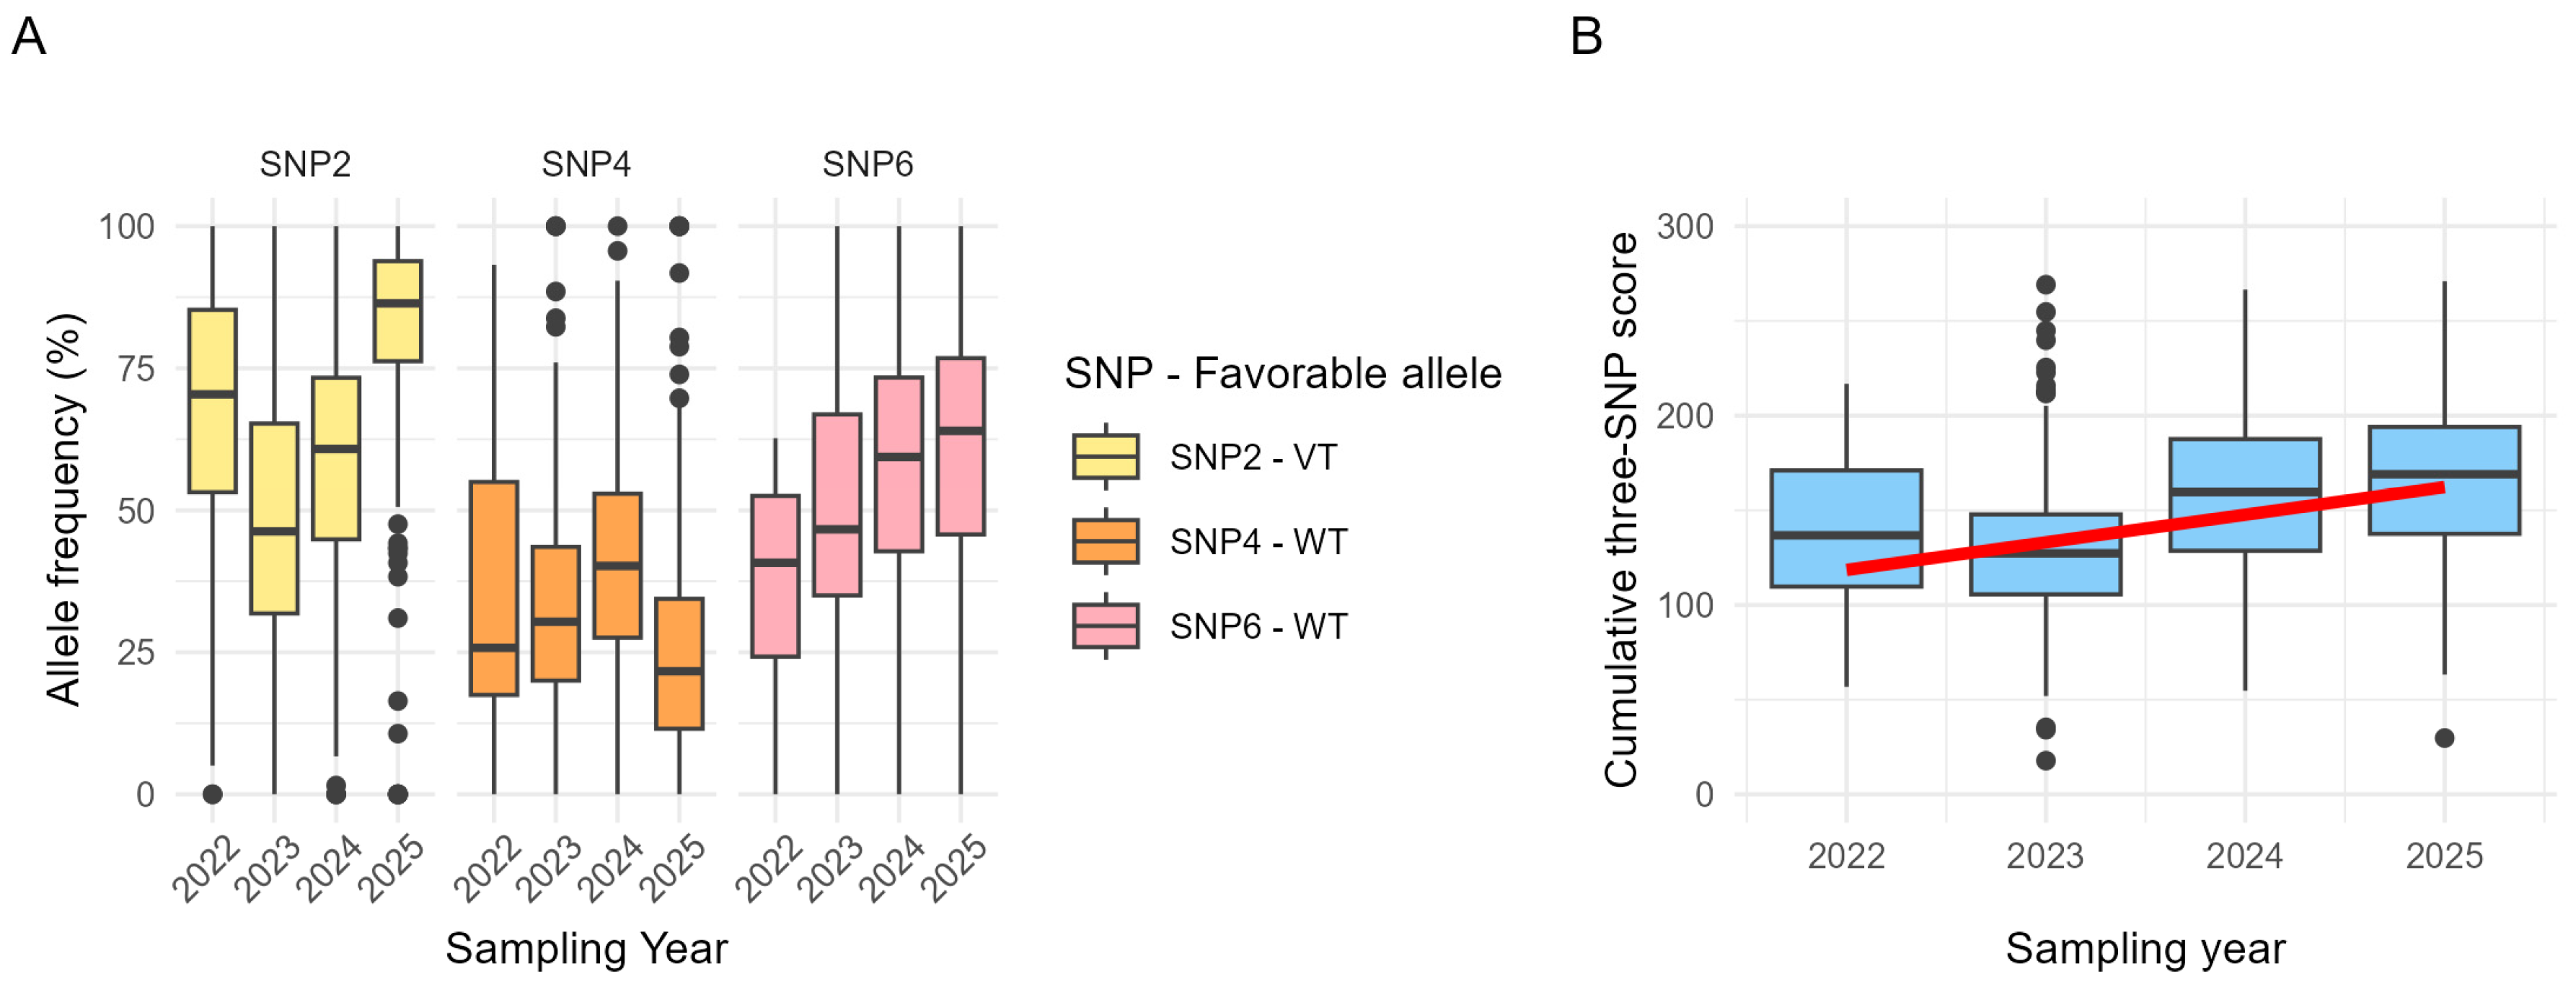
In the worker samples, the linear mixed-effects model showed that the frequency of the favorable SNP2 allele increased significantly over the sampling period (β = 12.20 ± 1.01 SE, t = 12.08, p < 0.001). The frequency of the favorable SNP4 allele significantly decreased over time (β = −2.94 ± 0.85 SE, t = −3.46, p < 0.001). The frequency of the favorable SNP6 allele increased significantly over the sampling period (β = 5.95 ± 0.96 SE, t = 6.23, p < 0.001). So, the temporal trends differed among the three markers (Figure 1A). The cumulative frequency score of the three SNPs in workers increased significantly over time (β = 14.59 ± 1.73 SE, t = 8.44, p < 0.001; Figure 1B).
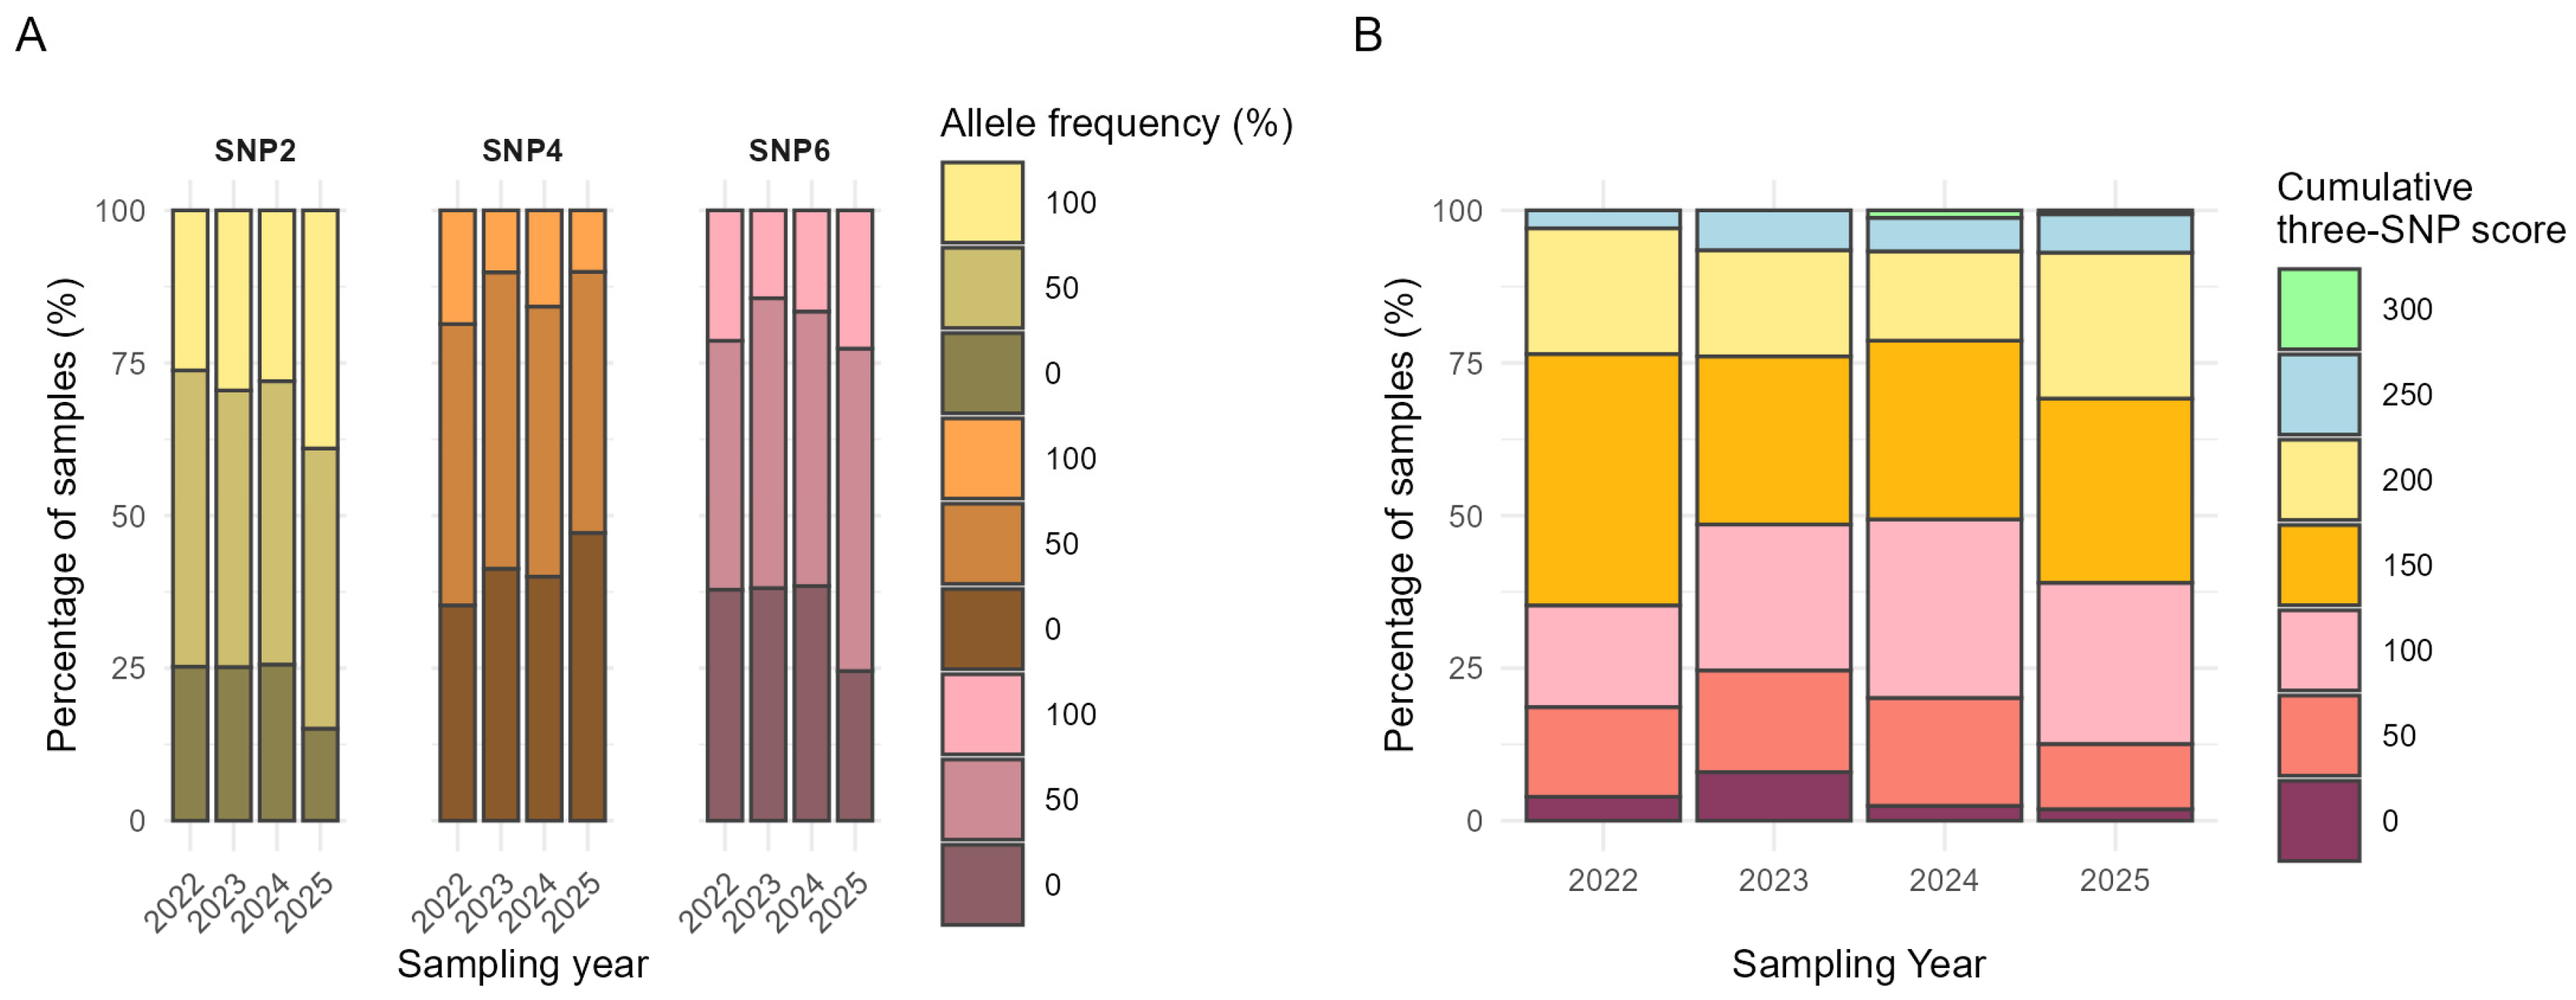
In the drone samples, a non-significant increasing temporal trend was detected in SNP2 scores between 2022 and 2025 (β = 0.10 ± 0.08 SE, z = 1.23, p = 0.22), after accounting for repeated sampling within beekeepers. The SNP4 scores exhibited a non-significant negative temporal trend (β = −0.16 ± 0.08 SE, z = −1.96, p = 0.05). In contrast, the SNP6 scores increased between 2022 and 2025, but this trend was not significant (β = 0.14 ± 0.08 SE, z = 1.68, p = 0.09). Similar to the results in workers, trends differed among the three markers (Figure 2A). The cumulative three-SNP score in drones did not exhibit a significant temporal trend (β = 0.04 ± 0.08 SE, z = 0.63, p = 0.53; Figure 2B).
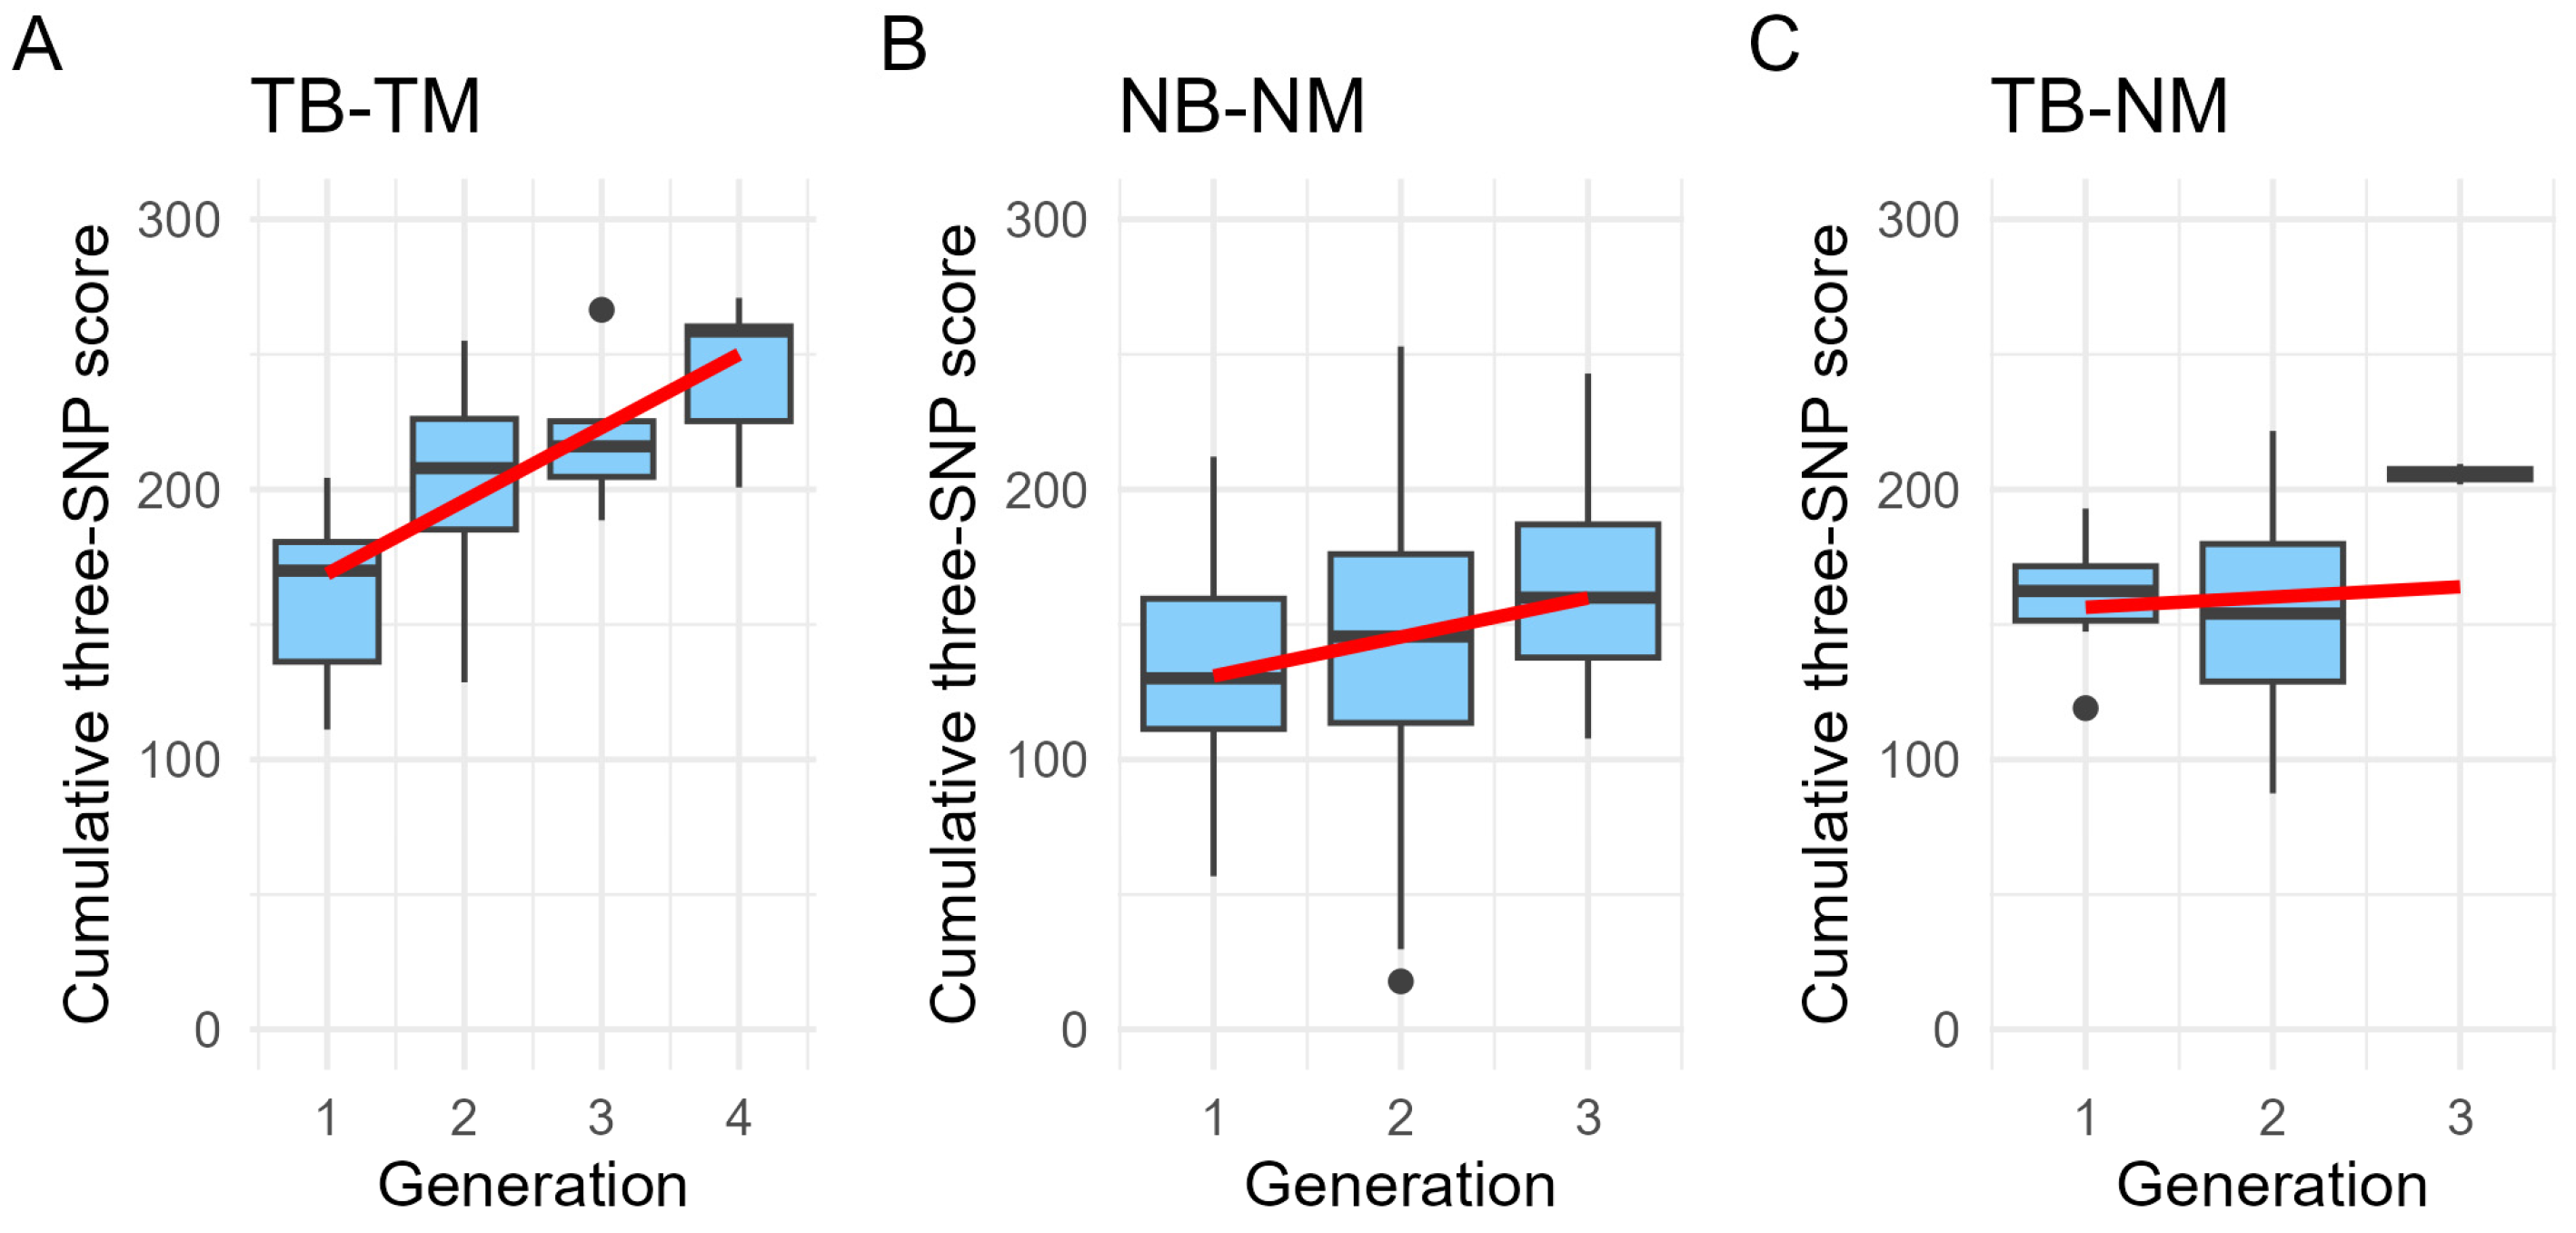
When applying TB-TM over generations, the cumulative three-SNP score increased significantly (β = 27.10 ± 4.85 SE, t = 5.59, p < 0.001; Figure 3A). This indicates that the overall frequency of favorable SNP alleles increased with successive generations. Significant increases were observed in the frequencies of the favorable alleles of SNP2 and SNP4, whereas SNP6 showed no significant trend (Supplementary Materials Table S4). Consequently, the increase in the cumulative three-SNP score was primarily attributable to the changes in SNP2 and SNP4. When NB-NM occurred over generations, the cumulative three-SNP score increased significantly across generations (β = 14.45 ± 5.64 SE, t = 2.56, p = 0.01; Figure 3B). A significant increase in the frequency of the favorable SNP2 allele was observed across generations. In contrast, no significant changes were detected in SNP4 or SNP6 (Supplementary Materials Table S4). These results indicate that changes in SNP2 primarily drove the significant increase observed for the cumulative three-SNP score. When applying TB-NM over generations, the cumulative three-SNP score showed non-significant increasing temporal change (β = 3.81 ± 9.38 SE, t = 0.41, p = 0.69; Figure 3C). Generation 3 was represented by a low number of colonies (n = 2), which should be considered when interpreting the results. No significant generational trends were detected for any of the individual SNP markers (Supplementary Materials Table S4). Comparison of the model estimates indicated that the increase in the cumulative three-SNP score across generations was more pronounced under the TB-TM strategy (β = 27.10 ± 4.85) than under the other two strategies (β = 14.45 ± 5.64; β = 3.81 ± 9.38).

3.3. Phenotyping Results

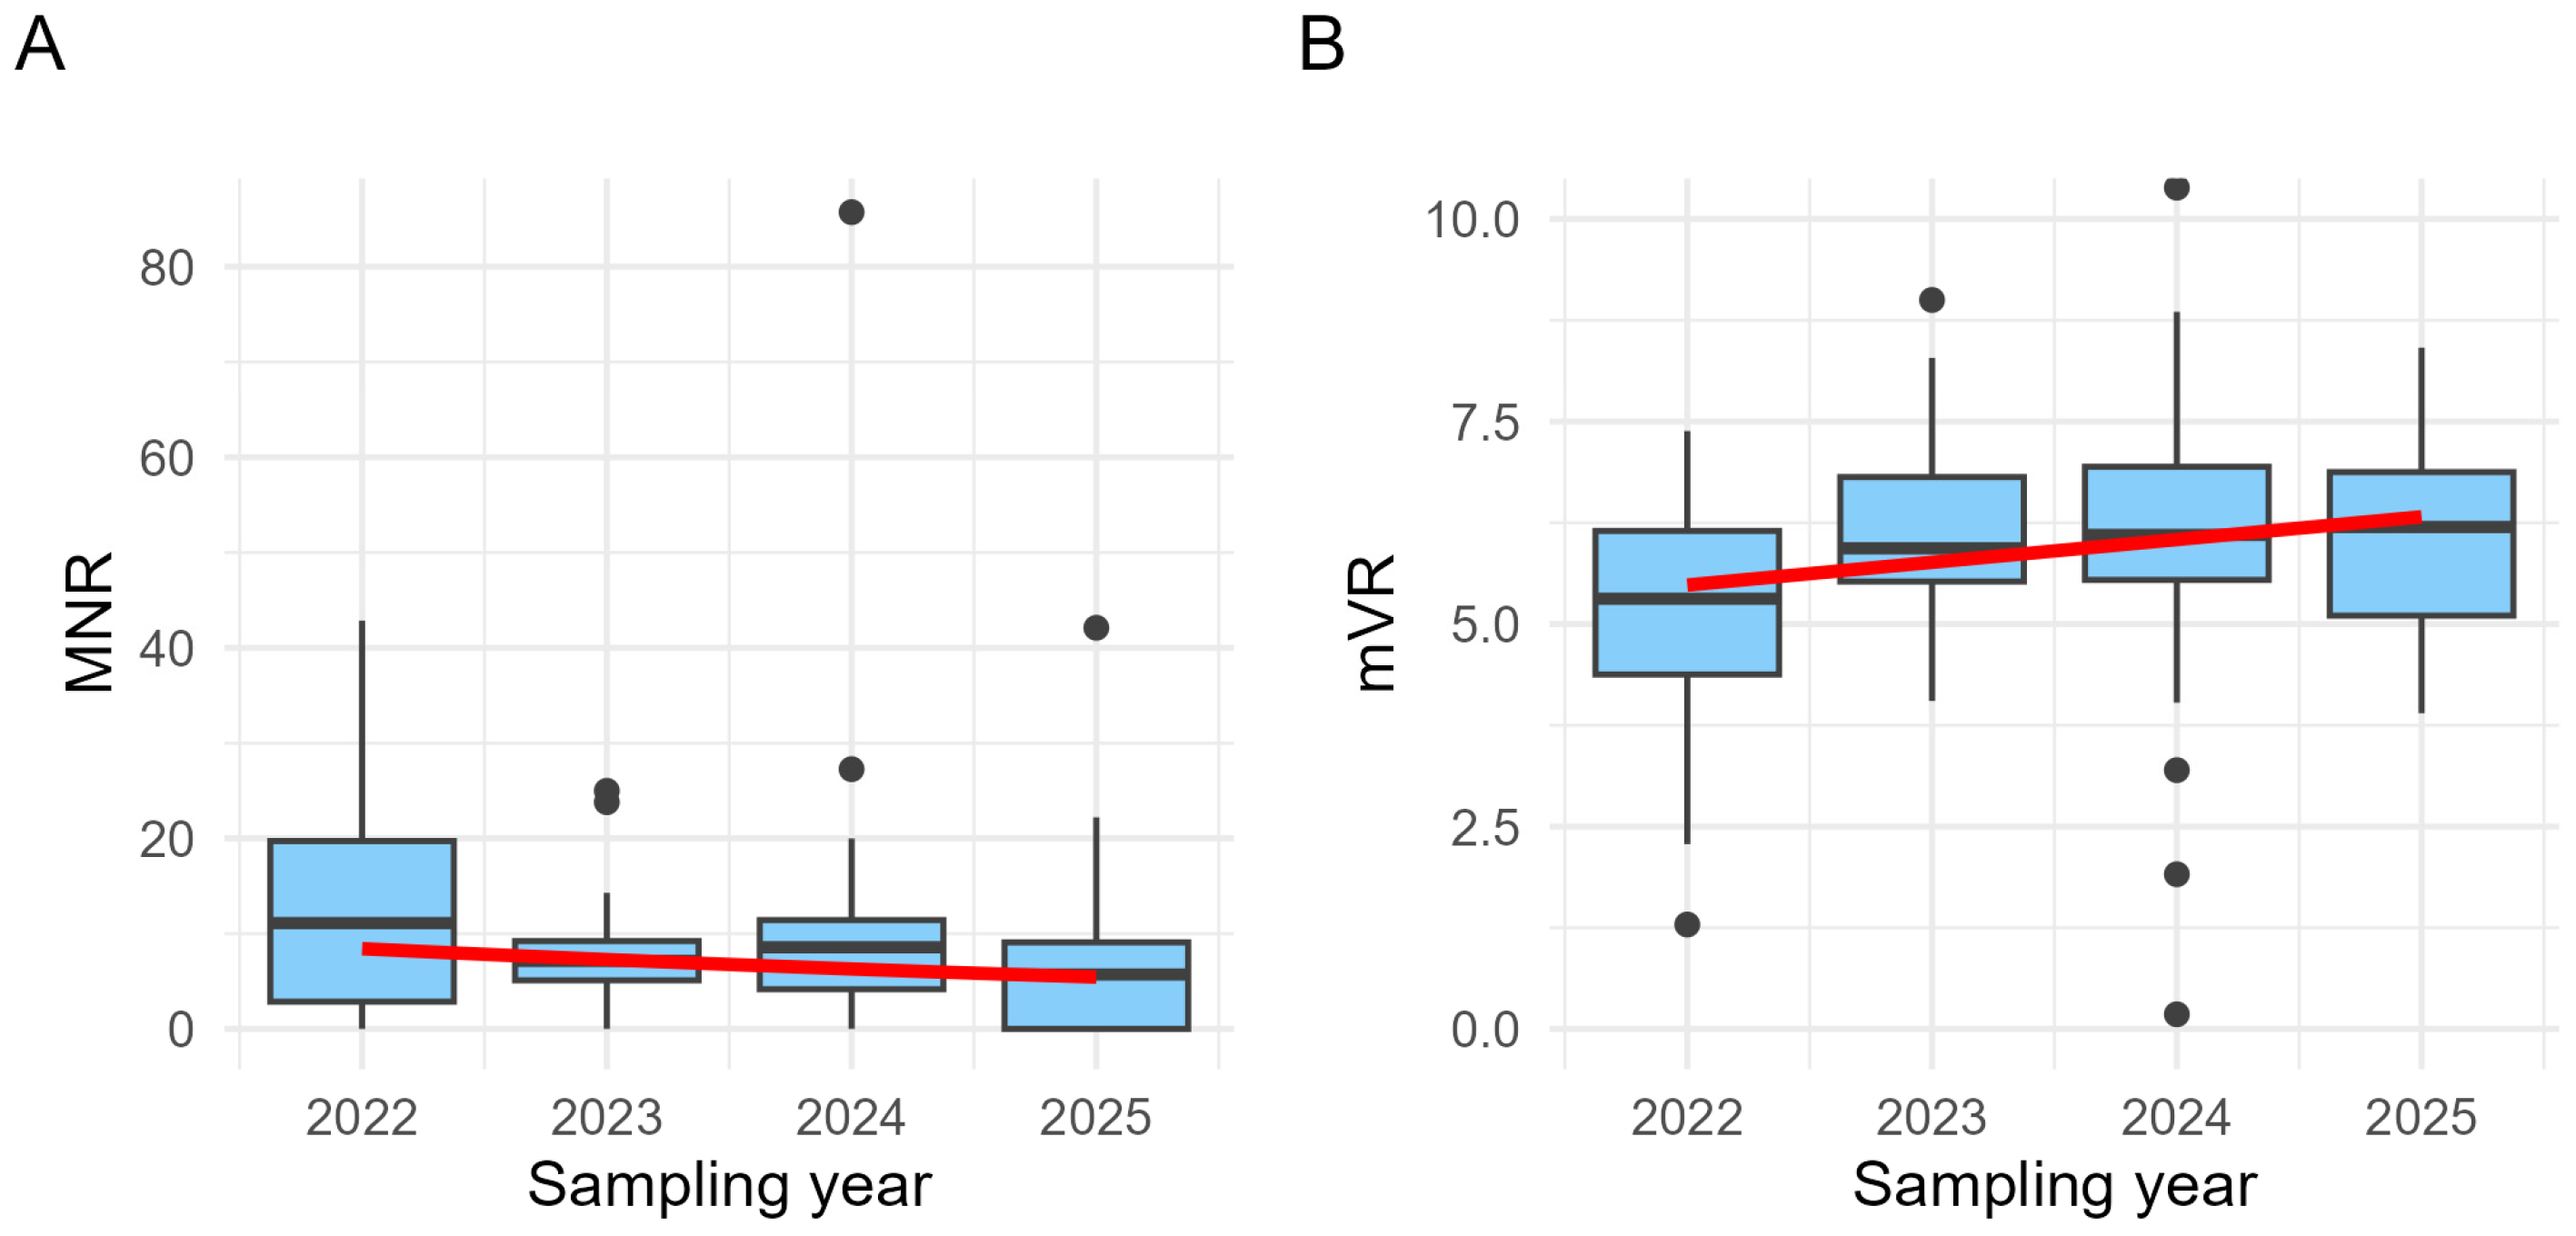
Log-transformed MNR values (back-transformed for visualization) showed a borderline significant negative trend over the study period (β = −0.14 ± 0.07 SE, t = −1.98, p = 0.05; Figure 4A). In contrast, mVR increased significantly over time (β = 0.28 ± 0.11 SE, t = 2.53, p = 0.01; Figure 4B).
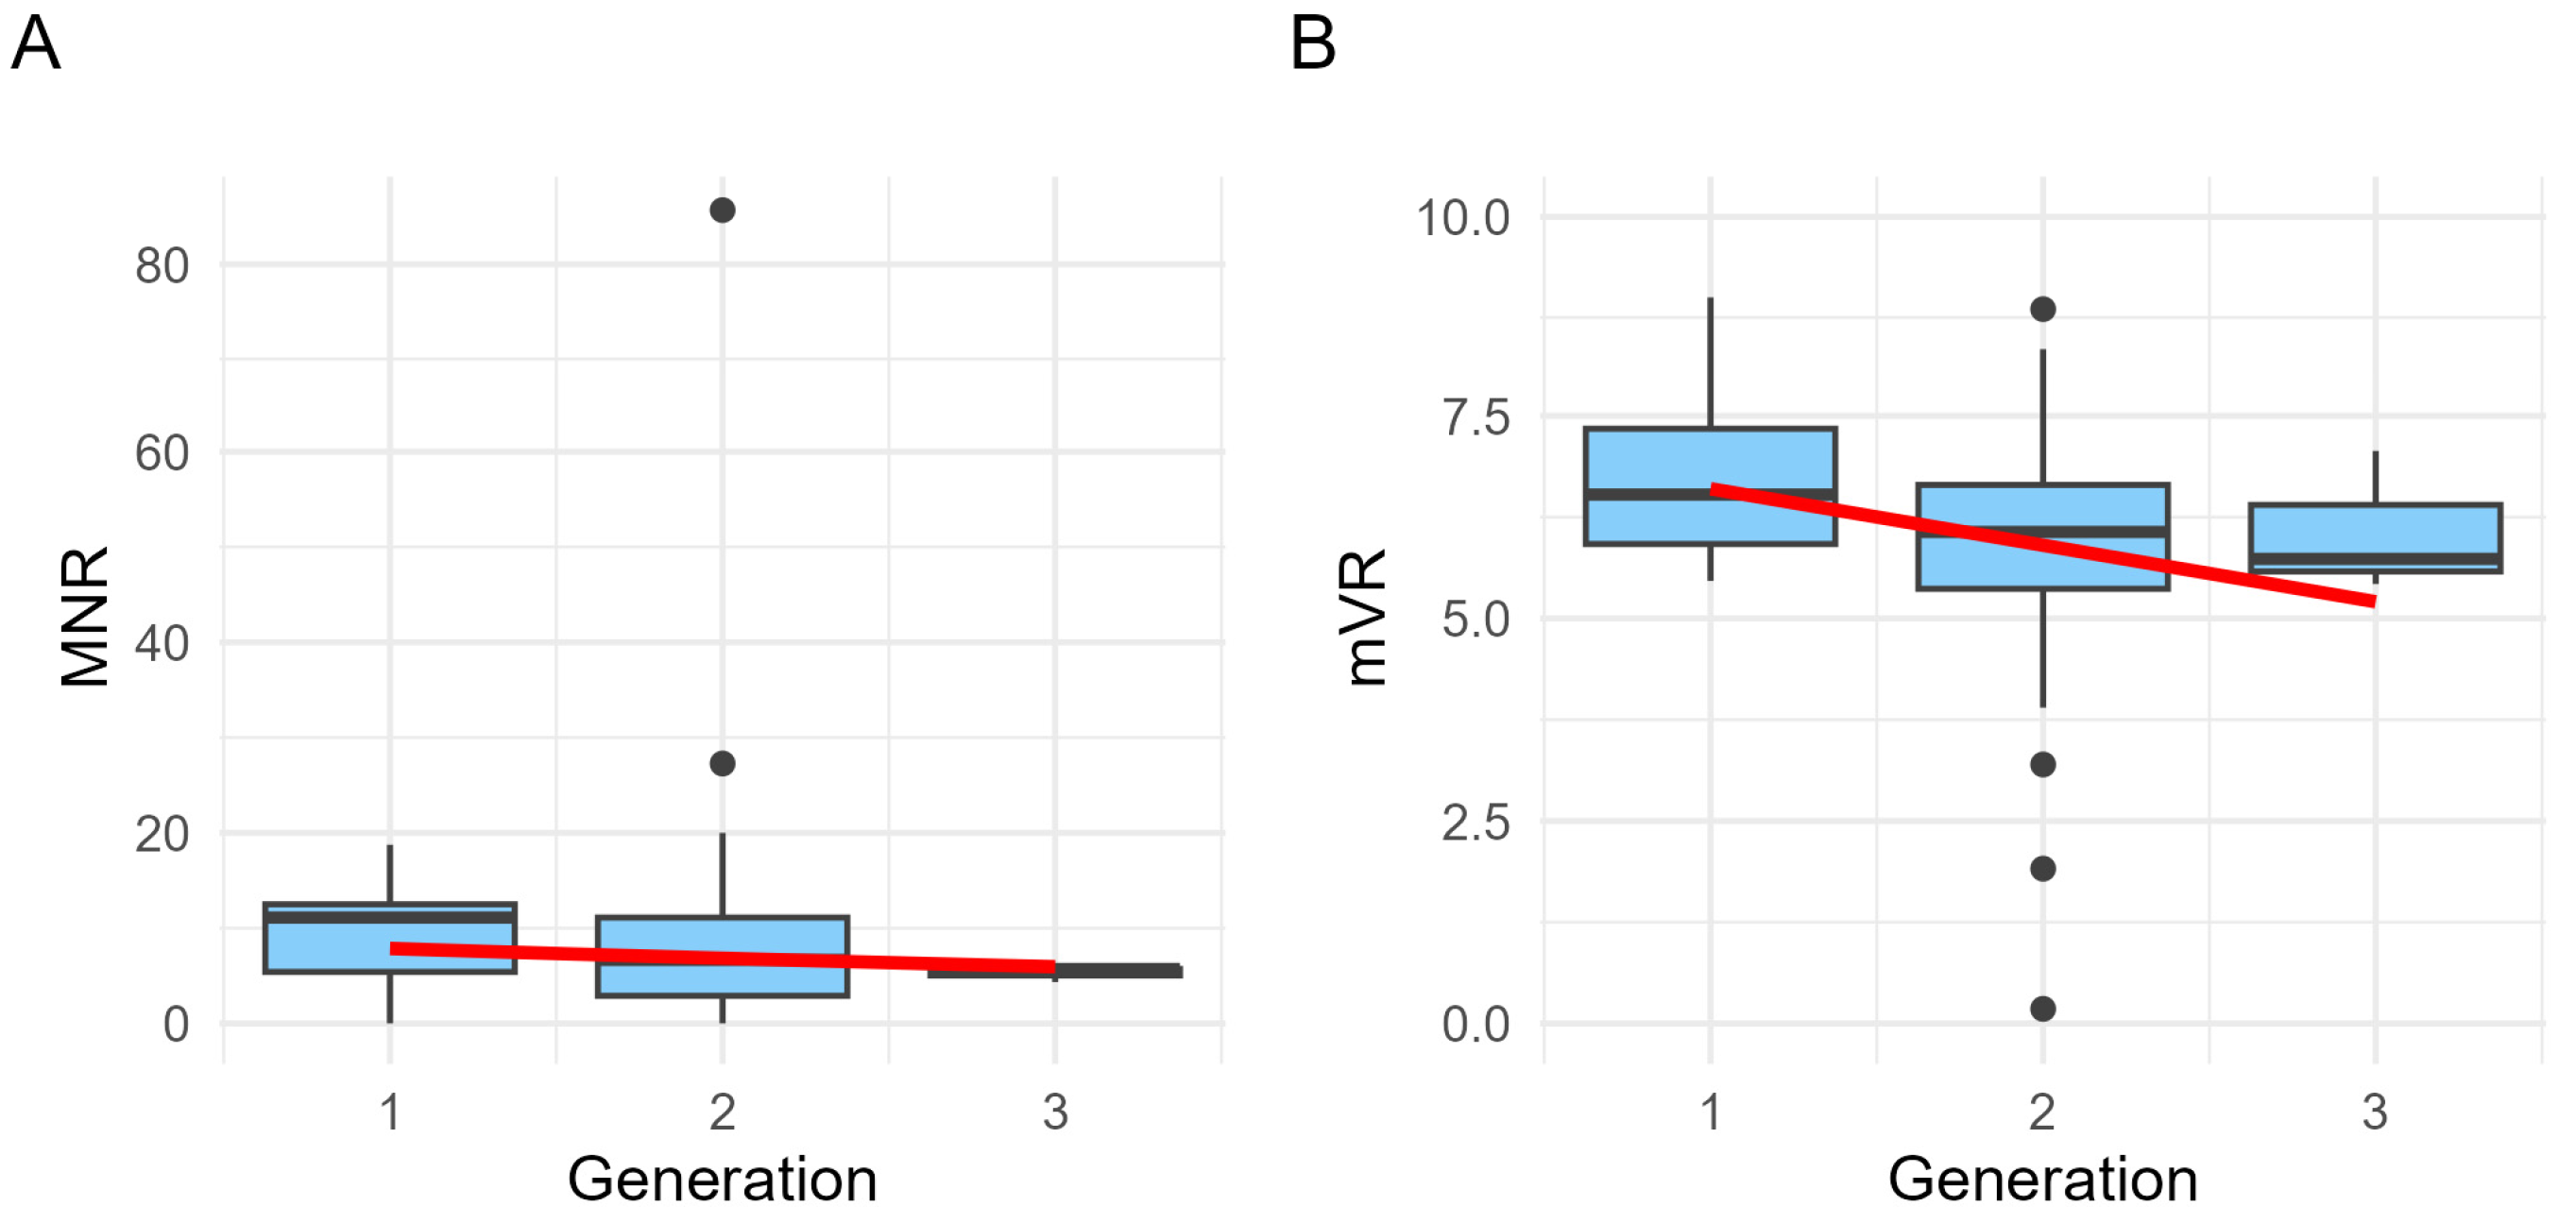
A non-significant decrease in MNR was observed across generations (β = −0.14 ± 0.22 SE, t = −0.62, p = 0.54; Figure 5A). Similarly, mVR decreased, but not significantly, with increasing generation number (β = −0.70 ± 0.39 SE, t = −1.80, p = 0.08; Figure 5B).

3.4. Correlation Between Genotyping and Phenotyping

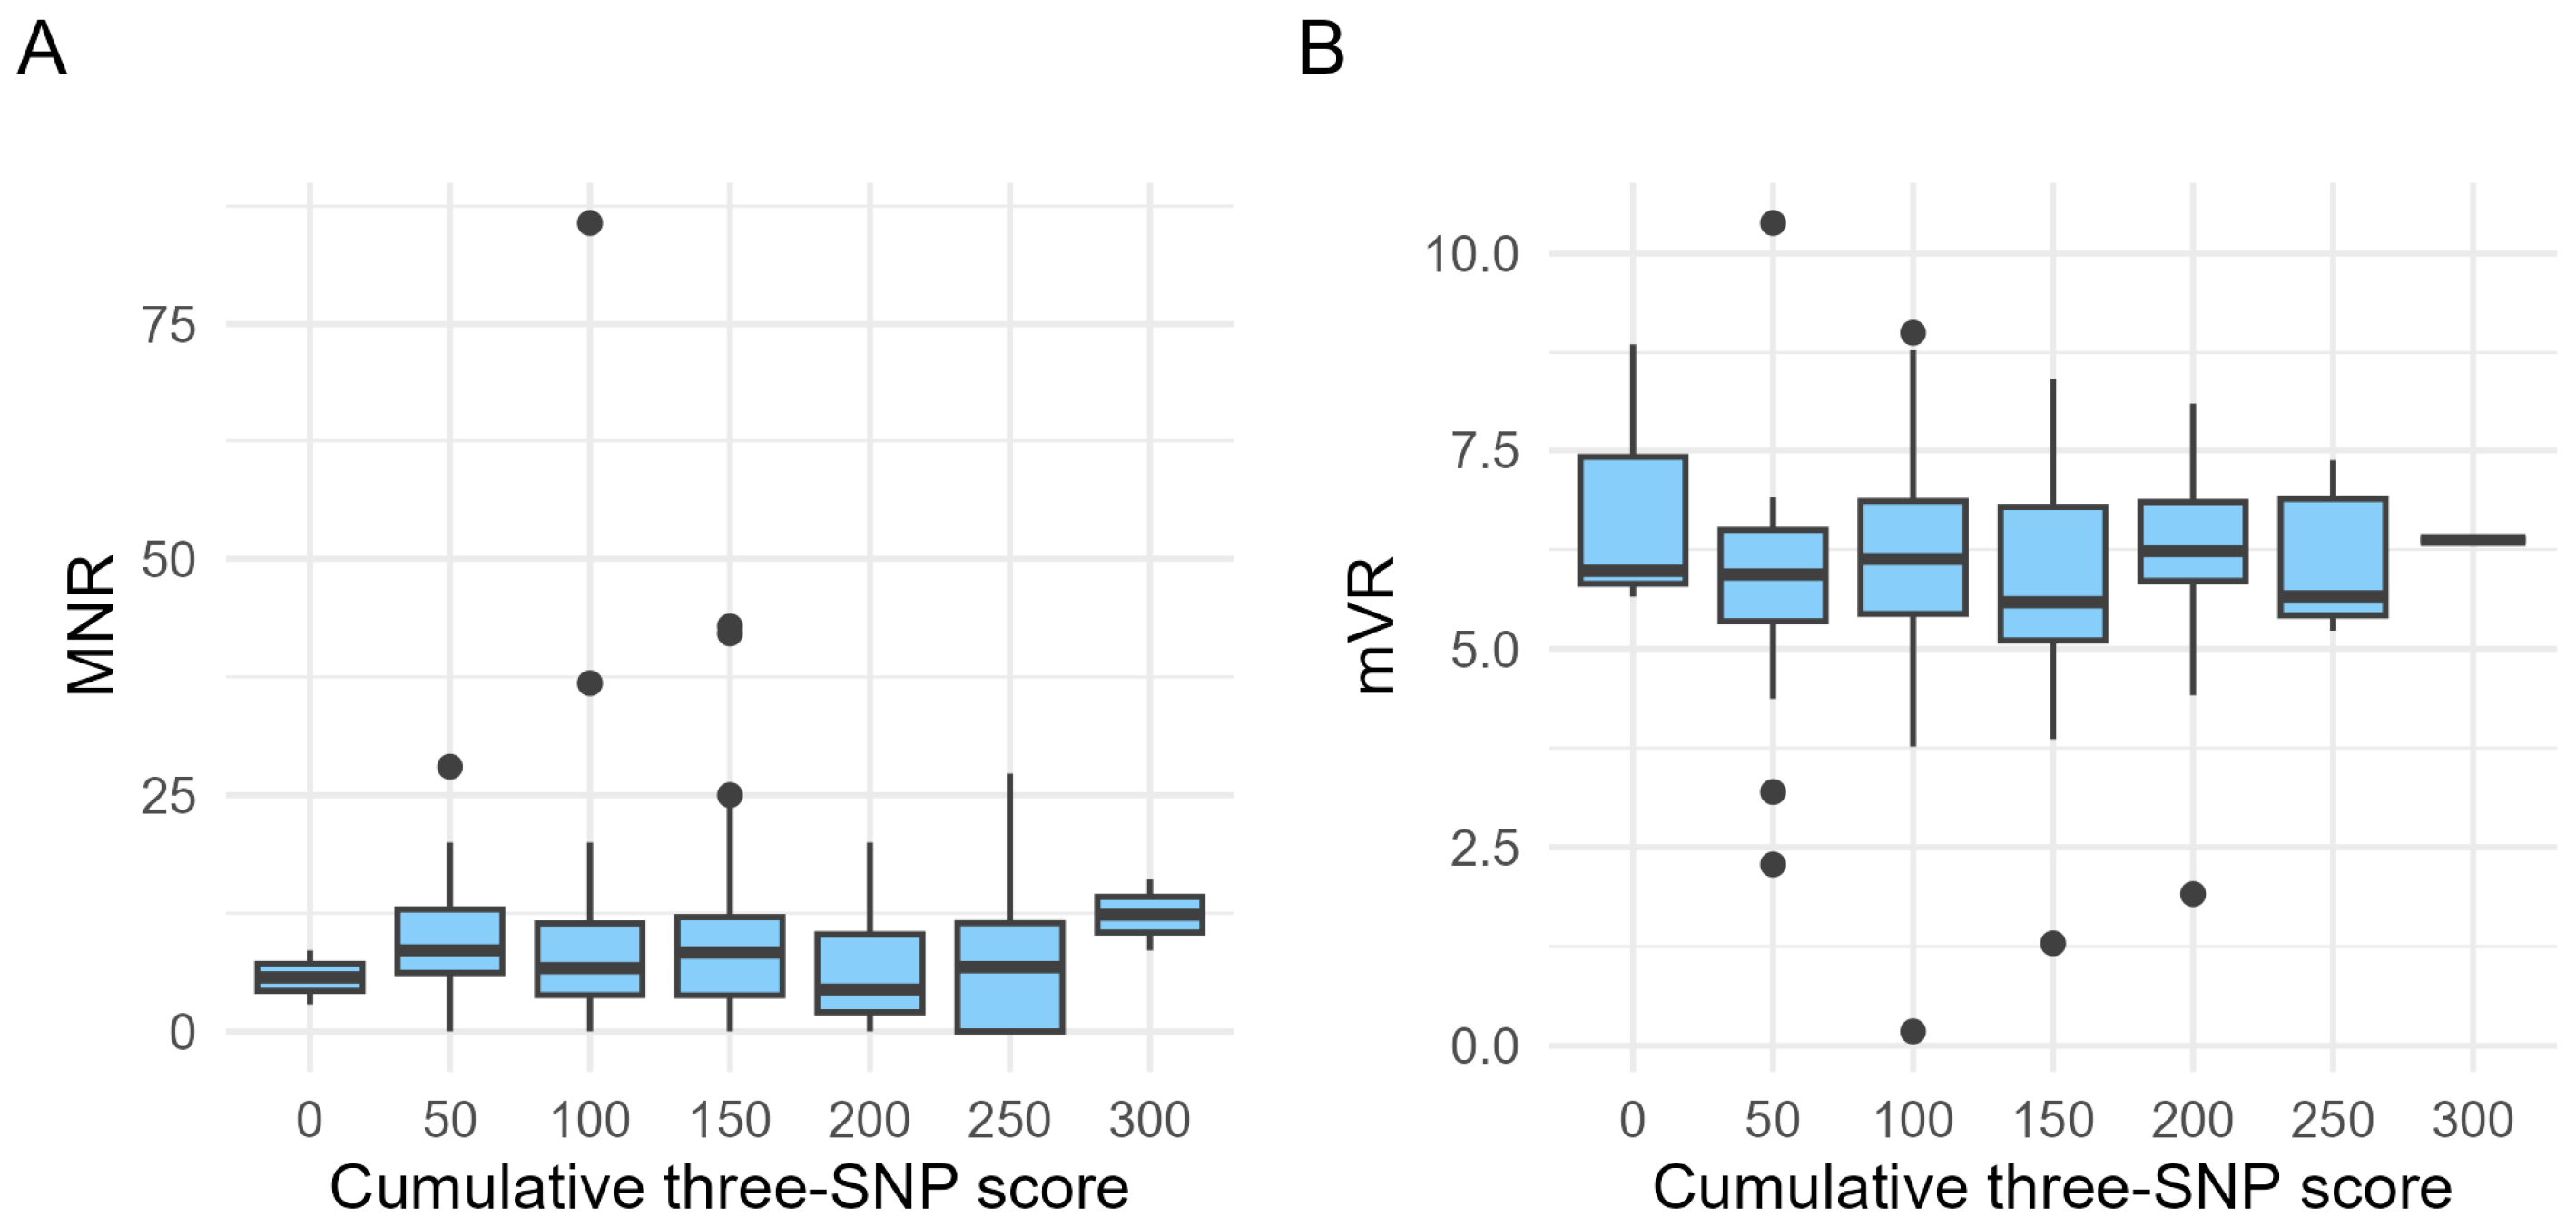
No significant correlations were detected between the cumulative three-SNP score and MNR (ρ = −0.10, p = 0.21; Figure 6A) or mVR (ρ = 0.02, p = 0.85; Figure 6B). Likewise, the individual SNP scores (SNP2, SNP4, or SNP6) were not significantly correlated with either MNR or mVR (all p > 0.05; Supplementary Materials Table S5). Overall, we were unable to show that improvement in SNP scores was associated with improvement in the measured phenotypic resistance traits in the sampled colonies.

4. Discussion

This study evaluated the implementation of marker-assisted selection within the ongoing HBV breeding program by genotyping numerous colonies (workers and drones) across Flanders. By providing participating beekeepers with breeding and mating recommendations based on colony and queen genotypes, we aimed to reconstruct the ideal genetic profile and eventually improve the DBR phenotype.

4.1. Genotyping Results

From the worker samples, it appeared that the breeding population accumulated SNP2 and SNP6 over four years, whereas the occurrence of SNP4 decreased over time. Comparison of the estimates showed that the increase for SNP2 was stronger than for SNP6. The underlying cause of the divergence in SNP4 distribution in the Flemish population could be explained by the distribution of allelic frequencies reported for the reduced three-variant model demonstrated by the screening study of Lefebre et al. [29]. Based on this model, SNP4 had the lowest favorable allele frequency (0.37) compared to SNP2 (0.51) and SNP6 (0.45). Consequently, fewer queens initially carry the favorable SNP4 allele, reducing the opportunity for selection to increase its frequency compared with the other two SNPs. Analysis of the sum of the three SNPs in the workers revealed that the overall presence of genetic markers increased over the study period. After four years, the worker population approached the theoretical maximum three-SNP score (270.91 out of 300, with 100% for SNP2, 100% for SNP4, and 70.91% for SNP6), demonstrating substantial enrichment of the selected markers. Similar SNP distribution trends were observed in drones, although the increases were smaller and not statistically significant. The reduced sample size for the drones likely limited the statistical power to detect significant changes. A very small, non-significant increase was observed in the overall presence of genetic markers in drones. Despite the challenging attempts, a queen line with the desired genetic profile was obtained on three occasions, demonstrating that this genetic combination is achievable within the breeding program.
An important question arising from the observed temporal increase in the overall SNP presence in workers and drones is whether this improvement can be attributed to our efforts in targeted breeding and mating practices. Therefore, three approaches were compared: (1) TB-TM, (2) TB-NM, and (3) NB-NM (reference group). All three strategies increased the cumulative three-SNP scores over subsequent generations, suggesting that genetic markers accumulated throughout the breeding populations, irrespective of the breeding strategy. However, the magnitude of this increase differed among strategies. Colonies resulting from the first strategy showed the strongest increase, indicating that managing both maternal and paternal contributions accelerates the accumulation of genetic markers in the breeding population. This finding is consistent with previous studies demonstrating that controlled mating via II can increase the rate of genetic gain [33,34,35,36]. Despite high interest and its apparent effectiveness, II remains difficult to implement on a large scale. Successful insemination requires several technically demanding steps, each associated with a risk of failure. Furthermore, inseminated queens must survive until the following breeding season before they can contribute both daughter queens and drone-producing colonies. As a result, only a limited number of generations originating from targeted mating could be included in this study, which reduced the sample size available for evaluating this strategy. Nevertheless, targeted breeding without controlled mating also increased the cumulative three-SNP score. Although the increase was smaller, this approach may represent a more feasible strategy for large-scale implementation. Moreover, the limited sample size, particularly in the third generation, likely reduced the precision of the estimated trend. With a larger number of observations, the genetic gain achieved through targeted breeding alone may become more apparent. Several factors may have contributed to the observed increase in this group. First, the initial generation already consisted primarily of queens with the highest cumulative three-SNP scores within their respective testing years, providing a favorable genetic starting point (Figure 3C). Many of the beekeepers in the HBV selection group expressed an interest in rearing new queens from this stock. In addition, mating was not entirely random. Many beekeepers mated their queens at island or land mating stations to improve other desirable traits. It is possible that the drone populations at these isolated mating stations also carried favorable SNP alleles, thereby contributing to the observed genetic gain. This hypothesis could not be confirmed because, to our knowledge, the drone colonies from isolated mating stations have not been genotyped. Interestingly, the reference group, part of the population that was bred from randomly chosen queens and randomly mated, also showed a gradual increase in the total three-SNP score. This was not completely unexpected, as these colonies were still part of the HBV breeding program. Within this program, queens are selected for multiple Varroa-resistant traits, such as hygienic behavior, MNR, and mVR [27]. Many beekeepers purchase daughter queens from stocks proven to possess desirable traits, and unknowingly have favorable SNP results. Consequently, DBR genetic markers may have been unintentionally enriched in the reference group through phenotypic selection rather than through deliberate marker-assisted selection.
Taken together, these findings suggest that marker-assisted selection can increase the frequency of SNPs under different breeding and mating scenarios, with the greatest genetic progress achieved by combining targeted queen breeding and targeted mating. Nevertheless, because targeted mating is labor-intensive and difficult to implement on a large scale, targeted breeding alone may represent a practical compromise that still contributes to the gradual enrichment of favorable alleles within the breeding population.

4.2. Phenotyping Results

While the genotyping results indicate that genetic markers accumulated over time and generations, the question arises as to whether the phenotyping results have also shown an overall improvement. In contrast to our expectations, no phenotypic progress over time was observed for DBR in terms of MNR and mVR. The generational analyses showed a negligible, non-significant negative trend in the MNR results, whereas a favorable generational trend was observed in mVR results. Namely, a decreasing trend, however non-significant, indicating fewer offspring per infested cell, per mother mite, with each generation.
The apparent lack of phenotypic improvement may reflect the complexity of the DBR trait itself. Although SMR has been reported to have relatively high heritability [37], the present study did not demonstrate a clear improvement in MNR (fertility-based SMR) over subsequent generations. There are many influencing factors, such as the mite-infestation level of the sampled colonies, labor-intensive assessment protocol, and the amount of available drone brood in the hives, making it challenging to apply this trait in practice. For instance, the low dataset for MNR and mVR in this study reflects the unsuitable pupal age and low infestation levels in drone brood of the sampled colonies. The accuracy of DBR scoring depends heavily on the number of assessed SICs [24]. For mVR, 10 infested cells are sufficient to distinguish between high and low results [28]. Conversely, there is some debate regarding whether 10 SICs are sufficient for MNR assessment. A minimum of 35 SICs is more commonly accepted for obtaining the MNR score [24]. However, we did not follow this suggestion because a previous study assessing brood samples from Flanders already showed that the brood was not sufficiently infested [28]. The low infestation could be the result of the high investment in Varroa control in the sampled colonies. Although chemical treatment was not allowed during the testing season, biotechnical measures, such as forced brood interruption and brood removal [4,38,39,40] were still allowed and not accounted for. To attain higher infestation rates, the timing of sampling could be changed. For example, at the end of summer, the growth of the mite population is sufficiently high [23]; yet, by that time, there is barely any drone brood available in the colony. However, an excessively high infestation rate can also be disadvantageous, because there will be more MICs, making it more difficult to assess MNR [41]. Repeated measurements could be beneficial for reliability; however, the narrow time window in which drone brood is available in Flemish honey bee populations hinders this. Another approach could be to artificially increase mite load by applying a ‘mite shower’, supplying colonies with a high number of living mites through donation of highly infested emerging brood [8], which is less labor-intensive than individual brood cell infection by inserting a Varroa mite [42].
Besides the infestation levels and protocol concerns, overall, DBR is a very complicated trait to assess. If the colony shows a high expression of DBR, and thus decreases mite infestation in the brood, it becomes more difficult to explore enough SICs to confirm the DBR trait [24]. Furthermore, DBR acts jointly with other resistant traits to control mite population dynamics and secure colony survival, such as Varroa-sensitive Hygiene (VSH) [43,44,45,46] or recapping [44,45,46,47]. For example, if VSH bees show a preference for targeting cells with reproducing mites over cells with non-reproducing mites, DBR results will indirectly increase [24,43,46]. Thus, the resulting phenotype cannot be exclusively credited to the DBR trait. The outlined findings confirm the reported challenges involved in phenotyping brood samples for MNR and mVR [23,24,48].

4.3. Correlation Between Genotyping and Phenotyping

Based on the reduced three-variant model, queens carrying a greater number of favorable SNP alleles (reflected by the genotype of their drones) were expected to have a higher probability of expressing DBR [29]. The outcomes of the correlation analyses were in line with the previous observations of the phenotyping results; improvement in the three-SNP score was not associated with an improvement in the DBR phenotype. However, these findings should not be interpreted as evidence against the reduced three-variant model [29]. The study of Lefebre et al. [29] reported a prediction accuracy of 76%, indicating that drones containing favorable alleles for all three genetic markers have a higher probability of expressing DBR, though not with complete certainty. Furthermore, the selected SNPs represent genetic markers associated with the trait rather than confirmed causal variants. The original eight markers were identified in seven different genes, reflecting the polygenic nature of DBR [26]. The biological relevance of the genetic markers has been supported by Broeckx et al. [26], who proposed that these SNPs influence brood pheromone signaling. One SNP could cause better pheromone sensing by brood-caring bees, and some SNPs might cause lower brood pheromone production by the pupae. Ultimately, this results in a low-level pheromone release that is unable to initiate oogenesis in the mite but allows normal chemical communication for brood care to continue [26]. Another possible hypothesis for the observed genotype–phenotype discrepancy, although not investigated in the present study, could be that trait loci may interact epistatically with other loci [49,50]. In other words, the phenotypic outcome of one locus may depend on other loci, such that the expected DBR phenotype is not always expressed despite the presence of the favorable SNP alleles. Genotyping reflects the genetic potential for DBR expression, whereas phenotyping captures the realized expression of the trait at a single point in time under specific environmental and management conditions. Consequently, phenotypic measurements are inherently more variable and susceptible to external influences than underlying genotypes.
We assumed that the climatic conditions across Flanders were similar. However, the lack of knowledge of the environmental variables (e.g., humidity and temperature) could be seen as a weakness of this study, as genotype-environment interactions could clarify the failure of phenotypic progress in the trait of interest [24,43,48,51]. Furthermore, management of the selection stock can influence the trait by, for example, keeping colonies at high densities [52] and low inter-colony distances [53,54] and the influx of mites from neighboring hives due to drift will increase [23,43].
Another possible reason for the observed non-correlation is the insufficient number of generational rounds for the trait to become phenotypically present in the population. Due to the general lifecycle of honey bees, which produce drones only for a certain period during the year, this study covered only four years and three breeding generations of selection. However, the multigenerational study of Guarna et al. [15] using protein markers observed effective disease-resistant hygienic behavior in their bee stocks after three generations of MAS. More research should be performed to investigate whether the trait DBR requires a longer period of selection to observe phenotypic improvement.
Still, an important observation is that the proportion of usable results obtained from the original samples was considerably lower for phenotyping than for genotyping (see Table 1), suggesting that genotyping is a more productive approach. Eventually, future breeding programs may benefit from combining markers associated with multiple Varroa resistance mechanisms, rather than focusing on a single trait at a time. In general, it is increasingly recognized that Varroa resistance involves several complex polygenic traits, including DBR, VSH, recapping, and grooming, along with colonies expressing these traits simultaneously [46,55]. To select for Varroa resistance while also predicting trait trade-offs before undesirable traits (e.g., aggressiveness) manifest in colonies, genomic selection (GS), rather than MAS, could be applied [46,56]. GS uses thousands of markers across the entire genome to predict complex polygenic traits, in contrast to MAS, which targets only a small number of specific genes or large-effect quantitative trait loci (QTL) [57]. Therefore, genome-assisted breeding (GAB) is expected to be more effective than MAS [58] and has provided meaningful additions to the field of predictive breeding [59,60].

5. Conclusions

This study demonstrated that marker-assisted selection can successfully increase the frequency of genetic markers associated with the predisposition to drone brood resistance (DBR) in the Flemish honey bee breeding population. Specifically, two of the three SNPs from the reduced three-variant model (SNP2 and SNP6) showed increased frequency over sampling years in both the workers and drones. In addition, comparing different breeding and mating strategies provided further insight into the long-term effects of MAS implementation, demonstrating that the combination of targeted breeding and targeted mating promoted the fastest spread of the SNPs in the breeding stock. However, translating this genetic progress into measurable phenotypic improvement under practical breeding conditions remains challenging, as reflected by the MNR and mVR results. The limited phenotypic response highlights the complexity of DBR expression and the difficulties of reliably assessing this trait in field conditions. These findings indicate that larger breeding populations, additional generations of selection (with II as the mating strategy), and continued phenotypic monitoring will likely be required before a consistent genotype–phenotype correlation becomes apparent. The implementation of the reduced three-variant model in a Flemish carnica ssp. population demonstrates the potential usage of genetic markers as a complementary tool in honey bee breeding. Due to the complex associations of DBR with other traits and the general polygenic nature of Varroa resistance, integrating multiple markers via genomic selection into future bee breeding programs could further improve selection efficiency. Overall, this study provides valuable insights into both the opportunities and practical limitations of implementing the MAS strategy, offering a noteworthy contribution to our knowledge of sustainable selection strategies aimed at improving honey bee resilience against V. destructor.

Supplementary Materials

The following supporting information can be downloaded at https://www.mdpi.com/article/10.3390/agriculture16181983/s1. Table S1: Representativeness of the sample collection and corresponding results over sampling years (all ssp.—2022–2025); Table S2: Representativeness of the genotyping sample collection and individual SNP results over sampling years (carnica ssp.—2022–2025); Table S3: Summary of genotyping and phenotyping results for each sampling year (carnica ssp.—2022–2025); Table S4: Genotyping results in carnica ssp. workers over generations assessed via linear regressions; Table S5: Spearman correlation results between phenotypic results and individual SNPs, represented as p-values.

Author Contributions

E.B.: technical support on sample assembly, data curation, data analysis, visualization, writing—original draft preparation and final manuscript; R.L.: laboratory analyses, data analysis, writing—review and editing; E.D.: writing—review and editing, project administration; D.C.d.G.: conceptualization and methodology, resources, funding acquisition, supervision, writing—review and editing. All authors have read and agreed to the published version of the manuscript.

Funding

This research was supported by the ‘Strategisch Plan Bijenteelt 2023–2025’ funded by the Flemish government (Agriculture and Fisheries Agency) and the European Commission, in application of Regulation 1308/2013 of the European Parliament and of the Council and of Regulations 1366/2015 and 1368/2015 of the European Commission.

Institutional Review Board Statement

Not applicable.

Data Availability Statement

The datasets used and analyzed during the current study are available from the corresponding author on request.

Acknowledgments

We thank our colleagues and students at the Laboratory of Molecular Entomology and Bee Pathology, as well as at Honeybee Valley, for their beekeeping work, lab work, administrative contributions, and for sample assembly. The authors also want to thank the participating beekeepers of the selection work group at Honeybee Valley for supplying the honey bee samples. The authors wish to thank Davy Petit, Guido Haagdorens, and Julien Driessen for their assistance with instrumental insemination. The authors have reviewed and edited the output and take full responsibility for the content of this publication.

Conflicts of Interest

The authors declare no conflicts of interest. The funding sponsors had no role in the design of the study; in the collection, analyses, or interpretation of data; in the writing of the manuscript; or in the decision to publish the results.

Abbreviations

The following abbreviations are used in this manuscript:
FASField-assisted selection
MASMarker-assisted selection
SNPSingle-nucleotide polymorphism
SMRSuppressed mite reproduction
MNRMite non-reproduction
DBRDrone brood resistance
HBVHoneybee Valley
VR/VSVarroa-resistant/sensitive
mVRMean Varroa destructor reproduction rate
SICSingle infested cell
MICMultiple infested cell
ATL bufferAnterior Tissue Lysis buffer
QIAampQuality, Ingenuity and Accessibility amplification
DNADeoxyribonucleic acid
DNaseDeoxyribonuclease
RNaseRibonuclease
qPCRQuantitative polymerase chain reaction
end-RFUEnd-point relative fluorescence units
FAMFluorescein
TRTexas red
IIInstrumental insemination
TB-TMTargeted breeding and targeted mating
TB-NMTargeted breeding and non-targeted mating
NB-NMNon-targeted breeding and targeted mating
LMLinear Model
LMMLinear Mixed Model
CLMMCumulative Link Mixed Model
VSHVarroa-sensitive hygiene
GSGenomic selection
QTLQuantitative trait loci
GABGenome-associated breeding

References

  1. Yasrebi-de Kom, I.A.R.; Biesmeijer, J.C.; Aguirre-Gutiérrez, J. Risk of potential pesticide use to honeybee and bumblebee survival and distribution: A country-wide analysis for The Netherlands. Divers. Distrib. 2019, 25, 1709–1720. [Google Scholar] [CrossRef] [Scilit]
  2. van der Zee, R.; Gray, A.; Pisa, L.; de Rijk, T. An Observational Study of Honey Bee Colony Winter Losses and Their Association with Varroa destructor, Neonicotinoids and Other Risk Factors. PLoS ONE 2015, 10, e0131611. [Google Scholar] [CrossRef] [Scilit] [PubMed]
  3. Beyer, M.; Junk, J.; Eickermann, M.; Clermont, A.; Kraus, F.; Georges, C.; Reichart, A.; Hoffmann, L. Winter honey bee colony losses, Varroa destructor control strategies, and the role of weather conditions: Results from a survey among beekeepers. Res. Vet. Sci. 2018, 118, 52–60. [Google Scholar] [CrossRef] [Scilit] [PubMed]
  4. Rosenkranz, P.; Aumeier, P.; Ziegelmann, B. Biology and control of Varroa destructor. J. Invertebr. Pathol. 2010, 103, S96–S119. [Google Scholar] [CrossRef] [Scilit] [PubMed]
  5. Dietemann, V.; Pflugfelder, J.; Anderson, D.; Charrière, J.D.; Chejanovsky, N.; Dainat, B.; Miranda, J.R.D.; Delaplane, K.; Dillier, F.; Fuch, S.; et al. Varroa destructor: Research avenues towards sustainable control. J. Apic. Res. 2012, 51, 125–132. [Google Scholar] [CrossRef] [Scilit]
  6. Le Conte, Y.; De Vaublanc, G.; Crauser, D.; Jeanne, F.; Rousselle, J.C.; Becard, J.M. Honey bee colonies that have survived Varroa destructor. Apidologie 2007, 38, 566–572. [Google Scholar] [CrossRef] [Scilit]
  7. Fries, I.; Imdorf, A.; Rosenkranz, P. Survival of mite infested (Varroa destructor) honey bee (Apis mellifera) colonies in a Nordic climate. Apidologie 2006, 37, 564–570. [Google Scholar] [CrossRef] [Scilit]
  8. Panziera, D.; van Langevelde, F.; Blacquiere, T. Varroa sensitive hygiene contributes to naturally selected varroa resistance in honey bees. J. Apic. Res. 2017, 56, 635–642. [Google Scholar] [CrossRef] [Scilit]
  9. Oddie, M.A.Y.; Dahle, B.; Neumann, P. Norwegian honey bees surviving Varroa destructor mite infestations by means of natural selection. PeerJ 2017, 5 e3956. [Google Scholar] [CrossRef] [Scilit] [PubMed]
  10. Seeley, T.D. Honey bees of the Arnot Forest: A population of feral colonies persisting with Varroa destructor in the northeastern United States. Apidologie 2007, 38, 19–29. [Google Scholar] [CrossRef] [Scilit]
  11. Hoppe, A.; Du, M.; Bernstein, R.; Tiesler, F.K.; Kärcher, M.; Bienefeld, K. Substantial Genetic Progress in the International Apis mellifera carnica Population Since the Implementation of Genetic Evaluation. Insects 2020, 11, 768. [Google Scholar] [CrossRef] [Scilit] [PubMed]
  12. Lin, Z.; Yang, L.; Wang, Z.; Wang, K.; Niu, G.; Ji, T. Honey Bee Breeding and Breed: Advancements, Challenges, and Prospects. Anim. Res. One Health 2025, 3, 350–357. [Google Scholar] [CrossRef] [Scilit]
  13. Leclercq, G.; Francis, F.; Gengler, N.; Blacquiere, T. Bioassays to Quantify Hygienic Behavior in Honey Bee (Apis mellifera L.) Colonies: A Review. J. Apic. Res. 2018, 57, 663–673. [Google Scholar] [CrossRef] [Scilit]
  14. Newton, D.; Ostasiewski, N. A simplified bioassay for behavioral resistance to American foulbrood in honey bees (Apis mellifera L.). Am. Bee J. 1986, 126, 278–281. [Google Scholar]
  15. Guarna, M.M.; Hoover, S.E.; Huxter, E.; Higo, H.; Moon, K.M.; Domanski, D.; Bixby, M.E.F.; Melathopoulos, A.P.; Ibrahim, A.; Peirson, M.; et al. Peptide biomarkers used for the selective breeding of a complex polygenic trait in honey bees. Sci. Rep. 2017, 7, 8381. [Google Scholar] [CrossRef] [Scilit] [PubMed]
  16. Uzunov, A.; Brascamp, E.W.; Büchler, R. The Basic Concept of Honey Bee Breeding Programs. Bee World 2017, 94, 84–87. [Google Scholar] [CrossRef] [Scilit]
  17. Tarpy, D.R.; Keller, J.J.; Caren, J.; Delaney, D.A. Assessing the Mating ‘Health’ of Commercial Honey Bee Queens. J. Econ. Entomol. 2012, 105, 20–25. [Google Scholar] [CrossRef] [Scilit] [PubMed]
  18. Bixby, M.; Baylis, K.; Hoover, S.E.; Currie, R.W.; Melathopoulos, A.P.; Pernal, S.F.; Foster, L.J.; Guarna, M.M. A Bio-Economic Case Study of Canadian Honey Bee (Hymenoptera: Apidae) Colonies: Marker-Assisted Selection (MAS) in Queen Breeding Affects Beekeeper Profits. J. Econ. Entomol. 2017, 110, 816–825. [Google Scholar] [CrossRef] [Scilit] [PubMed]
  19. Sainsbury, J.; Nemeth, T.E.; Baldo, M.; Jochym, M.; Felman, C.; Goodwin, M.; Lumsden, M.; Pattemore, D.; Jeanplong, F. Marker assisted selection for Varroa destructor resistance in New Zealand honey bees. PLoS ONE 2022, 17, e0273289. [Google Scholar] [CrossRef] [Scilit] [PubMed]
  20. Lefebre, R.; De Smet, L.; Tehel, A.; Paxton, R.J.; Bossuyt, E.; Verbeke, W.; van Dooremalen, C.; Ulgezen, Z.N.; van den Bosch, T.; Schaafsma, F.; et al. Allele Frequencies of Genetic Variants Associated with Varroa Drone Brood Resistance (DBR) in Apis mellifera Subspecies across the European Continent. Insects 2024, 15, 419. [Google Scholar] [CrossRef] [Scilit] [PubMed]
  21. Guarna, M.M.; Melathopoulos, A.P.; Huxter, E.; Iovinella, I.; Parker, R.; Stoynov, N.; Tam, A.; Moon, K.M.; Chan, Q.W.T.; Pelosi, P.; et al. A search for protein biomarkers links olfactory signal transduction to social immunity. BMC Genom. 2015, 16, 63. [Google Scholar] [CrossRef] [Scilit] [PubMed]
  22. Lapidge, K.; Oldroyd, B.P.; Spivak, M. Seven suggestive quantitative trait loci influence hygienic behavior of honey bees. Sci. Nat. 2003, 89, 565–568. [Google Scholar] [CrossRef] [Scilit] [PubMed]
  23. von Virag, A.; Guichard, M.; Neuditschko, M.; Dietemann, V.; Dainat, B. Decreased Mite Reproduction to Select Varroa destructor (Acari: Varroidae) Resistant Honey Bees (Hymenoptera: Apidae): Limitations and Potential Methodological Improvements. J. Econ. Entomol. 2022, 115, 695–705. [Google Scholar] [CrossRef] [Scilit] [PubMed]
  24. Mondet, F.; Parejo, M.; Meixner, M.D.; Costa, C.; Kryger, P.; Andonov, S.; Servin, B.; Basso, B.; Bienkowska, M.; Bigio, G.; et al. Evaluation of Suppressed Mite Reproduction (SMR) Reveals Potential for Varroa Resistance in European Honey Bees (Apis mellifera L.). Insects 2020, 11, 595. [Google Scholar] [CrossRef] [Scilit] [PubMed]
  25. Fuchs, S. Preference for Drone Brood Cells by Varroa Jacobsoni Oud in Colonies of Apis mellifera Carnica. Apidologie 1990, 21, 193–199. [Google Scholar] [CrossRef] [Scilit]
  26. Broeckx, B.J.G.; De Smet, L.; Blacquiere, T.; Maebe, K.; Khalenkow, M.; Van Poucke, M.; Dahle, B.; Neumann, P.; Nguyen, K.B.; Smagghe, G.; et al. Honey bee predisposition of resistance to ubiquitous mite infestations. Sci. Rep. 2019, 9, 7794. [Google Scholar] [CrossRef] [Scilit] [PubMed]
  27. Bossuyt, E.; Danneels, E.; de Graaf, D.C. Reconsidering the Selection Strategy in a Flemish Honey Bee Breeding Program: Towards Selection by Exclusion. Insects 2026, 17, 689. [Google Scholar] [CrossRef] [Scilit] [PubMed]
  28. Lefebre, R.; Claeys Bouuaert, D.; Bossuyt, E.; De Smet, L.; Brunain, M.; Danneels, E.; de Graaf, D.C. Comprehensive Approach to Phenotype Varroa destructor Reproduction in Honey Bee Drone Brood and Its Correlation with Decreased Mite Reproduction (DMR). Insects 2024, 15, 397. [Google Scholar] [CrossRef] [Scilit] [PubMed]
  29. Lefebre, R.; Broeckx, B.J.G.; De Smet, L.; Peelman, L.; de Graaf, D.C. Population-wide modelling reveals prospects of marker-assisted selection for parasitic mite resistance in honey bees. Sci. Rep. 2024, 14, 7866. [Google Scholar] [CrossRef] [Scilit] [PubMed]
  30. Ilyasov, R.A.; Lee, M.L.; Takahashi, J.I.; Kwon, H.W.; Nikolenko, A.G. A revision of subspecies structure of western honey bee Apis mellifera. Saudi J. Biol. Sci. 2020, 27, 3615–3621. [Google Scholar] [CrossRef] [Scilit] [PubMed]
  31. Tofilski, A. Honey Bee. Available online: http://www.honeybee.drawwing.org (accessed on 11 October 2022).
  32. Claeys Bouuaert, D.; Van Poucke, M.; De Smet, L.; Verbeke, W.; de Graaf, D.C.; Peelman, L. qPCR assays with dual-labeled probes for genotyping honey bee variants associated with varroa resistance. BMC Vet. Res. 2021, 17, 179. [Google Scholar] [CrossRef] [Scilit] [PubMed]
  33. Bossuyt, E.; Brunain, M.; De Smet, L.; Danneels, E.; de Graaf, D. Evaluation of 10-Year Selection for Virus Resistance in a Mass Breeding Program. Insects 2026, 17, 137. [Google Scholar] [CrossRef] [Scilit] [PubMed]
  34. De Iorio, M.G.; Biffani, S.; Pagnacco, G.; Stella, A.; Cozzi, M.C.S.; Maggi, L.A.; Minozzi, G. Results of four generations of selection for Varroa Sensitive hygienic behavior in honey bees. Ital. J. Anim. Sci. 2025, 24, 1959–1967. [Google Scholar] [CrossRef] [Scilit]
  35. Du, M.; Bernstein, R.; Hoppe, A. The Potential of Instrumental Insemination for Sustainable Honeybee Breeding. Genes 2023, 14, 1799. [Google Scholar] [CrossRef] [Scilit] [PubMed]
  36. Cobey, S.W. Comparison studies of instrumentally inseminated and naturally mated honey bee queens and factors affacting their performance. Apidologie 2007, 38, 390–410. [Google Scholar] [CrossRef] [Scilit]
  37. Gabel, M.; Hoppe, A.; Scheiner, R.; Obergfell, J.; Büchler, R. Heritability of Apis mellifera recapping behavior and suppressed mite reproduction as resistance traits towards. Front. Insect Sci. 2023, 3, 1135187. [Google Scholar] [CrossRef] [Scilit] [PubMed]
  38. Gabel, M.; Scheiner, R.; Büchler, R. Immediate and long-term effects of induced brood interruptions on the reproductive success of Varroa destructor. Apidologie 2023, 54, 20. [Google Scholar] [CrossRef] [Scilit]
  39. Büchler, R.; Uzunov, A.; Kovacic, M.; Presern, J.; Pietropaoli, M.; Hatjina, F.; Pavlov, B.; Charistos, L.; Formato, G.; Galarza, E.; et al. Summer brood interruption as integrated management strategy for effective Varroa control in Europe. J. Apic. Res. 2020, 59, 764–773. [Google Scholar] [CrossRef] [Scilit]
  40. Charrière, J.D.; Imdorf, A.; Bachofen, B.; Tschan, A. The removal of capped drone brood: An effective means of reducing the infestation of varroa in honey bee colonies. Bee World 2003, 84, 117–124. [Google Scholar] [CrossRef] [Scilit]
  41. Floris, I.; Pusceddu, M.; Satta, A. How the Infestation Level of Varroa destructor Affects the Distribution Pattern of Multi-Infested Cells in Worker Brood of Apis mellifera. Vet. Sci. 2020, 7, 136. [Google Scholar] [CrossRef] [Scilit] [PubMed]
  42. Rosenkranz, P.; Garrido, C. Volatiles of the honey bee larva initiate oogenesis in the parasitic mite Varroa destructor. Evol. Mech. Environ. Approaches Chem.-Mediat. Interact. 2004, 14, 193–197. [Google Scholar] [CrossRef] [Scilit]
  43. Guichard, M.; Dietemann, V.; Neuditschko, M.; Dainat, B. Advances and perspectives in selecting resistance traits against the parasitic mite Varroa destructor in honey bees. Genet. Sel. Evol. 2020, 52, 71. [Google Scholar] [CrossRef] [Scilit] [PubMed]
  44. Mondet, F.; Beaurepaire, A.; McAfee, A.; Locke, B.; Alaux, C.; Blanchard, S.; Danka, B.; Le Conte, Y. Honey bee survival mechanisms against the parasite Varroa destructor: A systematic review of phenotypic and genomic research efforts. Int. J. Parasitol. 2020, 50, 433–447. [Google Scholar] [CrossRef] [Scilit] [PubMed]
  45. Harris, J.W.; Danka, R.G.; Villa, J.D. Changes in Infestation, Cell Cap Condition; Reproductive Status of Varroa destructor (Mesostigmata: Varroidae) in Brood Exposed to Honey Bees with Varroa Sensitive Hygiene. Ann. Entomol. Soc. Am. 2012, 105, 512–518. [Google Scholar] [CrossRef] [Scilit]
  46. Eynard, S.E.; Mondet, F.; Basso, B.; Bouchez, O.; Le Conte, Y.; Dainat, B.; Decourtye, A.; Genestout, L.; Guichard, M.; Guillaume, F.; et al. Sequence-Based Multi Ancestry Association Study Reveals the Polygenic Architecture of Varroa destructor Resistance in the Honeybee Apis mellifera. Mol. Ecol. 2025, 34, e17637. [Google Scholar] [CrossRef] [Scilit] [PubMed]
  47. Oddie, M.; Büchler, R.; Dahle, B.; Kovacic, M.; Le Conte, Y.; Locke, B.; de Miranda, J.R.; Mondet, F.; Neumann, P. Rapid parallel evolution overcomes global honey bee parasite. Sci. Rep. 2018, 8, 7704. [Google Scholar] [CrossRef] [Scilit] [PubMed]
  48. Eynard, S.E.; Sann, C.; Basso, B.; Guirao, A.L.; Le Conte, Y.; Servin, B.; Tison, L.; Vignal, A.; Mondet, F. Descriptive Analysis of the Varroa Non-Reproduction Trait in Honey Bee Colonies and Association with Other Traits Related to Varroa Resistance. Insects 2020, 11, 492. [Google Scholar] [CrossRef] [Scilit] [PubMed]
  49. Rüppell, O.; Pankiw, T.; Page, R.E.J. Pleiotropy, epistasis and new QTL: The genetic architecture of honey bee foraging behavior. Heredity 2004, 95, 481–491. [Google Scholar] [CrossRef] [Scilit] [PubMed]
  50. Page, R.E.J.; Rueppell, O.; Amdam, G.V. Genetics of reproduction and regulation of honeybee (Apis mellifera L.) social behavior. Annu. Rev. Genet. 2012, 46, 97–119. [Google Scholar] [CrossRef] [Scilit] [PubMed]
  51. Büchler, R.; Costa, C.; Hatjina, F.; Andonov, S.; Meixner, M.D.; Le Conte, Y.; Uzunov, A.; Berg, S.; Bienkowska, M.; Bouga, M.; et al. The influence of genetic origin and its interaction with environmental effects on the survival of Apis mellifera L. colonies in Europe. J. Apic. Res. 2014, 53, 205–214. [Google Scholar] [CrossRef] [Scilit]
  52. Frey, E.; Rosenkranz, P. Autumn Invasion Rates of Varroa destructor (Mesostigmata: Varroidae) Into Honey Bee (Hymenoptera: Apidea) Colonies and the Resulting Increase in Mite Poppulations. J. Econ. Entomol. 2014, 107, 508–515. [Google Scholar] [CrossRef] [Scilit] [PubMed]
  53. Seeley, T.D.; Smith, M.L. Crowding honeybee colonies in apiaries can increase their vulnerability to the deadly ectoparasite Varroa destructor. Apidologie 2015, 46, 716–727. [Google Scholar] [CrossRef] [Scilit]
  54. Nolan, M.P.; Delaplane, K.S. Distance between honey bee Apis mellifera colonies regulates populations of Varroa destructor at a landscape scale. Apidologie 2017, 48, 8–16. [Google Scholar] [CrossRef] [Scilit] [PubMed]
  55. Akongte, P.N.; Oh, D.; Kim, J.M.; Lee, C.; Choi, Y.S.; Kim, D. Differential diversity of heritable traits among honeybee (Apis mellifera) colonies: Challenges in selecting Varroa-resistant strains. Heliyon 2026, 12, e44631. [Google Scholar] [CrossRef] [Scilit]
  56. Goddard, M.E.; Hayes, B.J. Genomic selection. J. Anim. Breed. Genet. 2007, 124, 323–330. [Google Scholar] [CrossRef] [Scilit] [PubMed]
  57. Li, J.Y.; Chen, M.Y. Genomic selection in livestock breeding: Advances and applications. Anim. Mol. Breed. 2024, 14, 239–251. [Google Scholar] [CrossRef] [Scilit]
  58. Bernardo, R.; Yu, J. Prospects for Genomewide Selection for Quantitative Traits in Maize. Crop Sci. 2007, 47, 1082–1090. [Google Scholar] [CrossRef] [Scilit]
  59. Lee, A.M.J.; Foong, M.Y.M.; Song, B.K.; Chew, F.T. Genomic selection for crop improvement in fruits and vegetables: A systematic scoping review. Mol. Breed. New Strateg. Plant Improv. 2024, 44, 60. [Google Scholar] [CrossRef] [Scilit] [PubMed]
  60. Bernardo, R. Predictive breeding in maize during the last 90 years. Crop Sci. 2021, 61, 2872–2881. [Google Scholar] [CrossRef] [Scilit]
Figure 1. Genotyping results in carnica ssp. workers per sampling year (2022–2025). (A) The frequency (%) of the favorable allele for the three separate SNPs across the sampling years. (B) The sum of the percentages of the three favorable SNP alleles (=cumulative three-SNP score), with the red line representing the overall trend estimated using a linear mixed-effects model that accounts for repeated measurements within beekeepers.
Agriculture 16 01983 g001
Figure 2. Genotyping results in carnica ssp. drones per sampling year (2022–2025). (A) Distribution of the percentage of samples for the three separate SNPs, with the least favorable score (0%) at the bottom of the bar graph. (B) Distribution of the sum of the percentages of the three favorable SNP alleles (=cumulative three-SNP score), with the least favorable score (0%) at the bottom of the bar graph.
Agriculture 16 01983 g002
Figure 3. Sum of the percentages of the three favorable SNP alleles (=cumulative three-SNP score) in carnica ssp. workers per generation, with different breeding and mating backgrounds: (A) targeted breeding and targeted mating (TB-TM), (B) non-targeted breeding and non-targeted mating (NB-NM), and (C) targeted breeding and non-targeted mating (TB-NM). The red lines represent the overall trend estimated using linear models.
Agriculture 16 01983 g003
Figure 4. Phenotypic trait results across sampling years (2022–2025). (A) Mite non-reproduction (MNR) and (B) mean V. destructor reproduction rate (mVR) results in carnica ssp. drone brood per sampling year (2022–2025). (A) MNR is defined as the proportion of SICs without offspring over the total number of SICs. (B) mVR is defined as the average number of offspring per infested cell, while compensating for the reduced number of offspring with increasing proportions of multiple infested cells. The red lines represent the overall trend estimated using linear models.
Agriculture 16 01983 g004
Figure 5. Phenotypic trait results across generations. (A) Mite non-reproduction (MNR) and (B) mean V. destructor reproduction rate (mVR) results in carnica ssp. drone brood per generation. (A) MNR is defined as the proportion of SICs without offspring over the total number of SICs. (B) mVR is defined as the average number of offspring per infested cell, while compensating for the reduced number of offspring with increasing proportions of multiple infested cells. The red lines represent the overall trend estimated using mixed-effects models that account for repeated measurements within beekeepers.
Agriculture 16 01983 g005
Figure 6. Correlation results between the cumulative three favorable SNP alleles and the phenotypic traits: (A) mite non-reproduction (MNR) and (B) mean V. destructor reproduction rate (mVR) results in carnica ssp. drone brood.
Agriculture 16 01983 g006
Table 1. Representativeness of the sample collection and corresponding results over sampling years (carnica ssp.; 2022–2025).
2022202320242025
Sampled workers49198201250
Result for sum of three SNPs49194198245
Sampled drones103141169159
Result for sum of three SNPs102138164159
Sampled drone brood103126138130
Result for MNR34306543
Result for mVR26245939
Bold text indicates the sample type from which the results in the subsequent rows were obtained. SNPs = single-nucleotide polymorphisms; MNR = mite non-reproduction; mVR = mean V. destructor reproduction rate.
Table 2. Overview of the genotyping sample size for the different breeding and mating strategy groups, and phenotyping sample size, per generation (carnica ssp.).
Generation 1Generation 2Generation 3Generation 4
Sampled workers—Result for sum of 3SNPs
Targeted breeding & targeted mating (TB-TM) 133076
Non-targeted breeding & non-targeted mating (NB-NM) 3513729
Targeted breeding & non-targeted mating (TB-NM)12402
Sampled drone brood
Result for MNR21423
Result for mVR14373
Bold text indicates the sample type from which the results in the subsequent rows were obtained. SNPs = single-nucleotide polymorphisms; MNR = mite non-reproduction; mVR = mean V. destructor reproduction rate.
Disclaimer/Publisher’s Note: The statements, opinions and data contained in all publications are solely those of the individual author(s) and contributor(s) and not of MDPI and/or the editor(s). MDPI and/or the editor(s) disclaim responsibility for any injury to people or property resulting from any ideas, methods, instructions or products referred to in the content.