Article

Impact of Organic Material Return on Greenhouse Gas Emission Flux and Soil Microorganisms in Paddy Soil


Institute of Resources, Environment and Soil Fertilizer, Fujian Academy of Agricultural Sciences, Fuzhou 350003, China
*
Author to whom correspondence should be addressed.
Agriculture 2026, 16(17), 1829; https://doi.org/10.3390/agriculture16171829
Submission received: 29 June 2026 / Revised: 12 August 2026 / Accepted: 20 August 2026 / Published: 26 August 2026
(This article belongs to the Section Agricultural Soils)

Abstract

The incorporation of Chinese milk vetch (CMV, Astragalus sinicus L.) and rice straw is a common strategy to reduce chemical fertilizer in Chinese southern paddy fields. However, the effect of replacing part of the chemical fertilizer with organic material on greenhouse emissions is still a subject of controversy. Therefore, a field experiment initiated in 2009 was conducted to investigate the effects of different organic material return on greenhouse emissions, soil microbial community and soil fertility. There were five treatments, including CK (no chemical fertilizer, no CMV, no straw); NPK (chemical fertilizer alone); MF40 (CMV plus 40% of NPK); MS (CMV plus rice straw return); and MSF40 (CMV plus straw return plus 40% of NPK). The results showed that, compared with CK, all fertilization treatments significantly increased rice yield, with MSF40 treatment achieving a yield 19.98% ± 1.57% higher than that of NPK. Relative to NPK, the application of organic material significantly increased soil organic matter (SOM), total nitrogen (TN), and available phosphorous (AP) contents, and the available potassium (AK) content under MSF40 increased by 25.87% ± 2.15%. Compared with NPK, although MSF40 significantly increased cumulative CH4 emissions and global warming potential (GWP), it exhibited a comparable yield-scaled GWP with that of NPK. The cumulative N2O emissions were negative across all treatments with −8.54 ± 0.67 to −3.61 ± 0.27 kg ha−1, indicating that the paddy field acted as a sink for N2O, with MSF40 treatment showing the strongest absorption capacity. Organic material return enriched microbial taxa involved in soil element cycling which may result in improved soil fertility and rice yield, e.g., MS enriched Zavarzinella, Polyangia, Apiosordaria, and Lecythophora; MSF40 enriched Bacteroidales, Clonostachys and Junghuhnia. Redundancy analysis showed that soil OM, TN and AP were significantly positively correlated with rice yield and CH4 emission. In conclusion, MSF40 represents a suitable fertilization strategy for balancing high rice yield, soil fertility improvement, and GHG per unit yield equivalent to NPK in the Fuzhou rice region. However, these findings are based on a single-season field experiment, and therefore require validation across multiple growing seasons.

1. Introduction

Escalating greenhouse gas (GHG) emissions have emerged as a severe threat to the productivity of agricultural systems, thereby posing challenges to food security [1]. Agricultural activities contribute approximately 23% of total anthropogenic GHG emissions, making it imperative to reduce GHG emissions from farmland ecosystems in order to mitigate the greenhouse effect. As the staple food for more than half of the world’s population, rice provides 20% of global dietary energy [2]. China is both a major producer and consumer of rice worldwide. Paddy fields are recognized as a major source of methane (CH4) emissions [3]. Methane emissions from China’s paddy fields contribute 21.9% to global total methane emissions from paddy fields [4]. Methane (CH4) and nitrous oxide (N2O) emissions from paddy fields account respectively for about 30% and 11% of global agricultural GHG emissions [5]. Methane monooxygenase (pmoA) and methyl coenzyme M reductase (mcrA) as catalysts are related to oxidative degradation and vital enzyme of methane production [6]. Nitrification and denitrification are the two main microbial pathways of N2O emissions from soils [7]. Nitrification is mainly catalyzed by ammonia-oxidizing archaea (AOA) and ammonia-oxidizing bacteria (AOB), which carry the amoA gene encoding ammonia monooxygensae. Denitrification occurs through reduction processes carried out by a series of heterotrophic organisms encoded by functional genes, including cytochrome cd1-containing nitrite reductase (nirS), copper-containing nitrite reductase (nirK), and nitrous oxide reductase (nosZ) genes. The prolonged flooded anaerobic conditions during the rice growth period favor the production of GHG such as methane. Many agricultural practices may offer such possibility because they alter soil carbon, nitrogen and oxygen availability [8]. Therefore, it is important to develop paddy field management strategies that simultaneously ensure food security, environmental protection, and climate mitigation.
Organic materials such as green manure and rice straw can contribute to the crop productivity. Straw return helps retain soil carbon and nitrogen nutrients, improves microbial biomass and enzyme activity, and thereby enhances crop yield [9]. China produces over 800 million tons of crop straw annually, accounting for approximately 25% of global straw output [10]. Before implementing straw return on a large scale, it is crucial to clarify the impact of this potential multi-win strategy on soil GHG emission. Microbial decomposition of straw might lead to anaerobic conditions that drive denitrification and N2O emission [11] and straw return also provides more N substrate for denitrification or nitrification, thus contributing to N2O emissions [12]. Moreover, straw incorporation may also significantly increase GHG emissions from paddy fields [13]. In contrast, Chai [14] demonstrated that the impact of straw return on GHG emissions exhibits a threshold effect; beyond a certain amount of returned straw, the increase in emissions tends to stabilize. GHG emissions from paddy fields are influenced not only by straw return but also by nitrogen fertilizer application. Global nitrogen fertilizer use has reached 109 million tons and continues to rise [15]. Excessive use of N fertilizer promotes direct N2O emissions [16], and growth of ineffective rice tillers [17] which can serve as conduit pipe to transport CH4 and N2O into the atmosphere. A 1% increase in nitrogen use efficiency could reduce farmland’s GHG emissions by 2 Tg CO2-eq per year [18]; thus, reducing nitrogen fertilizer application is the most direct approach to lowering GHG emissions. Traditionally, green manure has been used in paddy fields to reduce the need for chemical fertilizers. In southern China, green manure can replace 20–40% of chemical fertilizer application [19].
Chinese milk vetch (CMV, Astragalus sinicus L.) is the most representative green manure crop in southern China, accounting for more than 80% of the total green manure planting area in the region. After the incorporation of green manure, their well-developed root system and symbiotic fixation increased the soil nitrogen pools [20]. Rice straw return enhances soil carbon stock by contributing organic material that decomposes over time [21]. Consequently, the combined incorporation of green manure and crop straw may offer greater advantages for subsequent crops than the use of either material alone [22]. Aljerib et al. [23] showed that while the return of either rice straw or CMV can increase CH4 emissions from paddy fields, their combined return at a 1:1 ratio can reduce CH4 emissions because this treatment was demonstrated to enhance the release of nitrogen, phosphorus, potassium and microbial biomass carbon, thereby beneficial for soil carbon sequestration. At present, no comprehensive analyses have been conducted to determine how substitution of green manure or/and straw return for chemical fertilizer affects rice productivity and GHG emissions, along with the microbial mechanism underlying these effects, which hinders their application in rice-growing regions. Based on a long-term field experiment in a southern Chinese paddy field, this study aims to clarify the effects of CMV incorporation, straw return, and reduced chemical fertilizer application on rice yield, soil fertility, GHG emissions, and soil microorganisms, thereby providing a scientific basis for low-carbon rice production in southern China. We hypothesized that integrating CMV with rice straw plus reduced chemical fertilizer would achieve high rice productivity while not increasing global warming potential (driven by CH4 emission and N2O emission) per unit yield in comparison with chemical fertilizer under field conditions in Fuzhou rice region.

2. Materials and Methods

2.1. Experiment Field and Experiment Design

The study area was at the Baisha Experimental Station (119°03′08″ E, 26°14′27″ N) in Minhou County, Fuzhou, Fujian Province, China. The region has a subtropical monsoonal climate, with an average annual temperature of 19.5 °C and an average annual precipitation of 1350 mm. The soil is classified as typical hapli-stagnic anthrosols (WRB). The soil characteristics were as follows: 24.4 g kg−1 soil organic matter (OM), 171.6 mg kg−1 available nitrogen (AN), 13.5 mg kg−1 available phosphorus (AP), and 83.4 mg kg−1 available potassium (AK), with 4.78 of pH.
A field fertilization experiment was established in 2009. The plots were arranged in a randomized complete block design. The treatments included: CK (no chemical fertilizer, no CMV, no straw); NPK (chemical fertilizer alone: urea at 135 kg N ha−1, superphosphate at 54 kg P2O5 ha−1, and potassium chloride at 94.5 kg K2O ha−1); MF40 (CMV plus 40% of NPK); MS (CMV plus rice straw return); and MSF40 (CMV plus straw return plus 40% of NPK). Each treatment has three replicates and the size of the plot is 15 m2. Plots were separated by 20 cm high cement ridge to prevent the side seepage of water and fertilizer. Phosphorus fertilizer was applied entirely as basal application; nitrogen and potassium fertilizers were split, with 60% applied as basal and 40% as topdressing at the tillering stage. Urea, calcium superphosphate, and potassium chloride were used as the nitrogen, phosphorus, and potassium sources, respectively. CMV was incorporated into the soil at the full flowering stage (April) each year at a rate of 18,000 kg ha−1 (fresh weight). Rice straw was returned after harvest at an average rate of 3750 kg ha−1 on a dry weight basis. From 2009 to 2010, CMV was transplanted from other fields (cultivars ‘Yijiangzi’ and ‘Minzi 7’); in subsequent years, CMV was incorporated in situ (cultivar ‘Minzi 7’) to a depth of 20 cm. During in situ incorporation, excess milk vetch was removed, and insufficient CMV were supplemented from external sources. The average nutrient contents of fresh CMV were 58.7 g kg−1 organic carbon, 4.0 g kg−1 N, 0.9 g kg−1 P2O5, and 2.7 g kg−1 K2O, with a moisture content of 85.9%. On a dry matter basis, the rice straw contained an average of 349.9 g kg−1 organic carbon, 7.9 g kg−1 N, 3.5 g kg−1 P2O5, and 28.9 g kg−1 K2O. The input amount of nutrients in different treatments was listed in Table S1. Rice cultivar is zhongzheyou 8. The paddy field was continuously flooded, with a water layer maintained at 1–2 cm above the soil surface until one week before rice harvest.

2.2. Greenhouse Gas Fluxes in Paddy Fields

Methane (CH4) and nitrous oxide (N2O) fluxes from the paddy field in 2024 were measured using the static closed chamber method [24]. Each static chamber consisted of a top chamber and a base. The top chamber was a cylindrical PVC vessel with a diameter of 25 cm and heights of either 50 cm or 100 cm, with the appropriate height selected according to rice growth stage. A small fan was installed inside each chamber to homogenize gas mixing, and a mercury thermometer was used to record the internal chamber temperature. The top chamber was placed on a circular PVC base pre-embedded 10 cm into the soil; the annular groove of the base was filled with water to ensure an airtight seal. Gas sampling was conducted between 9:00 and 11:00 a.m. Gas samples were collected from the chamber at 0, 15, and 30 min. A 50 mL gas sample was extracted using a syringe and stored in a 100 mL aluminum foil sampling bag. Sampling was performed at 10-day intervals, and there was a total of 11 samplings from the rice transplanting until harvest. GHG concentrations were analyzed using a gas chromatograph (GC-2010 Pro, Shimadzu Corporation, Kyoto, Japan). The GHG flux was calculated using the following equation:
F = ρ × h × d C d t × 273 273 + T
where F is the GHG flux (mg m−2 h−1); ρ is the gas density under standard conditions (0.714 kg m−3 for CH4 and 1.25 kg m−3 for N2O); h is the height of the sampling chamber (m); d C d t is the rate of change in gas concentration (ppm h−1); T is the average temperature inside the chamber (°C). Cumulative GHG emissions were calculated as:
C u m u l a t i v e   e m i s s i o n = n i = 1 ( F i + F i + 1 ) 2 × d × 24
where Fi and Fi+1 represent the gas fluxes at two consecutive sampling dates, and d is the number of days between the two adjacent samplings. On a 100-year time horizon, the total global warming potential (GWP) was calculated as [25]:
  GWP = N 2 O × 273 + CH 4 × 29.8
Yield-scaled global warming potential (Yield-GWP) was defined as the ratio of total GHG emissions during the entire rice growing season to rice yield, calculated as:
Y i e l d G W P = G W P Y i e l d

2.3. Soil Sampling and Analysis

Soil samples were collected at the rice filling stage in 2024. Surface soil samples (0–20 cm depth) were obtained using a five-point sampling method. After removing crop residues, stones and other impurities, the samples were thoroughly mixed, placed in sterile sealed bags, and then transported to the laboratory. A total of 15 soil samples (5 treatments × 3 replicates per treatment) were obtained. One subsample was air-dried, ground, and sieved for the analysis of soil physical and chemical properties, while the other subsample was stored at −80 °C for subsequent microbial molecular analysis. Soil pH was measured using a pH meter at a soil-to-water ratio of 1:5. Soil organic matter (OM) was determined using the potassium dichromate method. Total nitrogen (TN) was analyzed using the Kjeldahl method. Alkali-hydrolyzable nitrogen (AN) was measured by the alkaline hydrolysis diffusion method. Available phosphorus (AP) was extracted with sodium bicarbonate and quantified by the molybdenum-antimony anti-spectrophotometric method. Available potassium (AK) was extracted with ammonium acetate and determined by flame photometry. All soil analyses were conducted following the methods described by Lu [26].

2.4. Soil Microbial Community and Function Gene Analysis

Soil genomic DNA was extracted using the ALFA Soil DNA Extraction Kit (Ark Biosafety Technology Co. Ltd., Guangzhou, China). DNA purity and concentrations were determined using a Nanodrop One spectrophotometer (Thermo Fisher Scientific, Waltham, MA, USA). For bacterial analysis, the V4–V5 region of the 16S rRNA gene was amplified using primers 515F (5′-GTGCCAGCMGCCGCGGTAA-3′) and 907R (5′-CCGTCAATTCMTTRAGTTT-3′) [27]. The PCR amplification program was as follows: 95 °C for 3 min; 30 cycles of 95 °C for 30 s, 53 °C for 30 s, and 72 °C for 30 s; followed by 72 °C for 5 min. Each PCR reaction contained 25 μL of novoprotein taq polymerase, 2 μL of each primer (10 μM), and 50 ng of template DNA, and the volume was adjusted to 50 μL with ddH2O. For fungal analysis, the ITS region was amplified using primers ITS1F (5′-CTTGGTCATTTAGAGGAAGTAA-3′) and ITS2R (5′-GCTGCGTTCTTCATCGATGC-3′) [28]. The PCR amplification program was as follows: 95 °C for 3 min; 32 cycles of 95 °C for 20 s, 56 °C for 30 s, and 72 °C for 30 s; followed by 72 °C for 5 min. The PCR reaction composition was identical to that used for bacteria. After purification and quantification, the PCR products from both bacteria and fungi were subjected to high-throughput sequencing on the Illumina Nova 6000 platform (Guangdong Magigene Biotechnology Co., Ltd., Guangzhou, China). The bacterial and fungal sequenced data has been deposited into the NCBI Sequence Read Archive (SRA) database (accession number: PRJNA1481009, PRJNA 1481368).
The abundances of GHG-related functional genes were quantified by quantitative real-time PCR (qPCR). These included the methanogenic gene mcrA, methanotrophic gene pmoA, ammonia-oxidizing archaea (AOA), ammonia-oxidizing bacteria (AOB), and the denitrification genes nirK, nirS, and nosZ. Primer sequences and amplification protocols are shown in Table S2.

2.5. Bioinformatics and Statistical Analysis

The sequences shorter than 200 bp and of low quality (quality score < 25) were removed from the raw sequence data. The raw sequences were processed to remove primer sequences using Cutadapt (v1.14, https://github.com/marcelm/cutadapt/) (accessed on 5 August 2025). Merged reads were obtained using USEARCH-fastq_mergepairs (v10, http://www.drive5.com/usearch/) (accessed on 5 August 2025), and high-quality valid sequences were generated using fastp (v0.14.1, https://github.com/OpenGene/fastp) (accessed on 5 August 2025). Finally, OTU clustering at a 97% sequence similarity was performed using UPARSE (v10.0240, https://drive5.com/uparse/) (accessed on 5 August 2025), and taxonomic annotation for bacteria and fungi was conducted based on the SILVA (v138) and UNITE (v8.0) databases, respectively. Alpha-diversity was calculated using QIIME software (v1.9.1). The similarity among the microbial communities in different treatments were determined by non-metric multidimensional scaling (NMDS) analysis based on Bray–Curtis distance by the vegan package (v2.5-3) in R (v3.5.1). The linear discriminant analysis effect size (LEfSe) (v1.1.2, http://huttenhower.sph.harvard.edu/LEfSe) (accessed on 5 August 2025) was conducted to identify the significantly abundant genera among the different treatments (LDA > 3, p < 0.05). Redundancy analysis was performed by R to determine the relationship among microbial diversity, functional genes, greenhouse gas emissions and soil properties.
Statistical analyses were performed using SPSS software (version 21.0; SPSS Inc., Chicago, IL, USA). The mean values of each soil property, GHG emission, abundance of function genes and microbial a-diversity indices in the different treatments were compared by one-way analysis of variance (ANOVA) followed by Duncan’s test, with a significance level set at p < 0.05.

3. Results

3.1. Soil Properties and Rice Yields

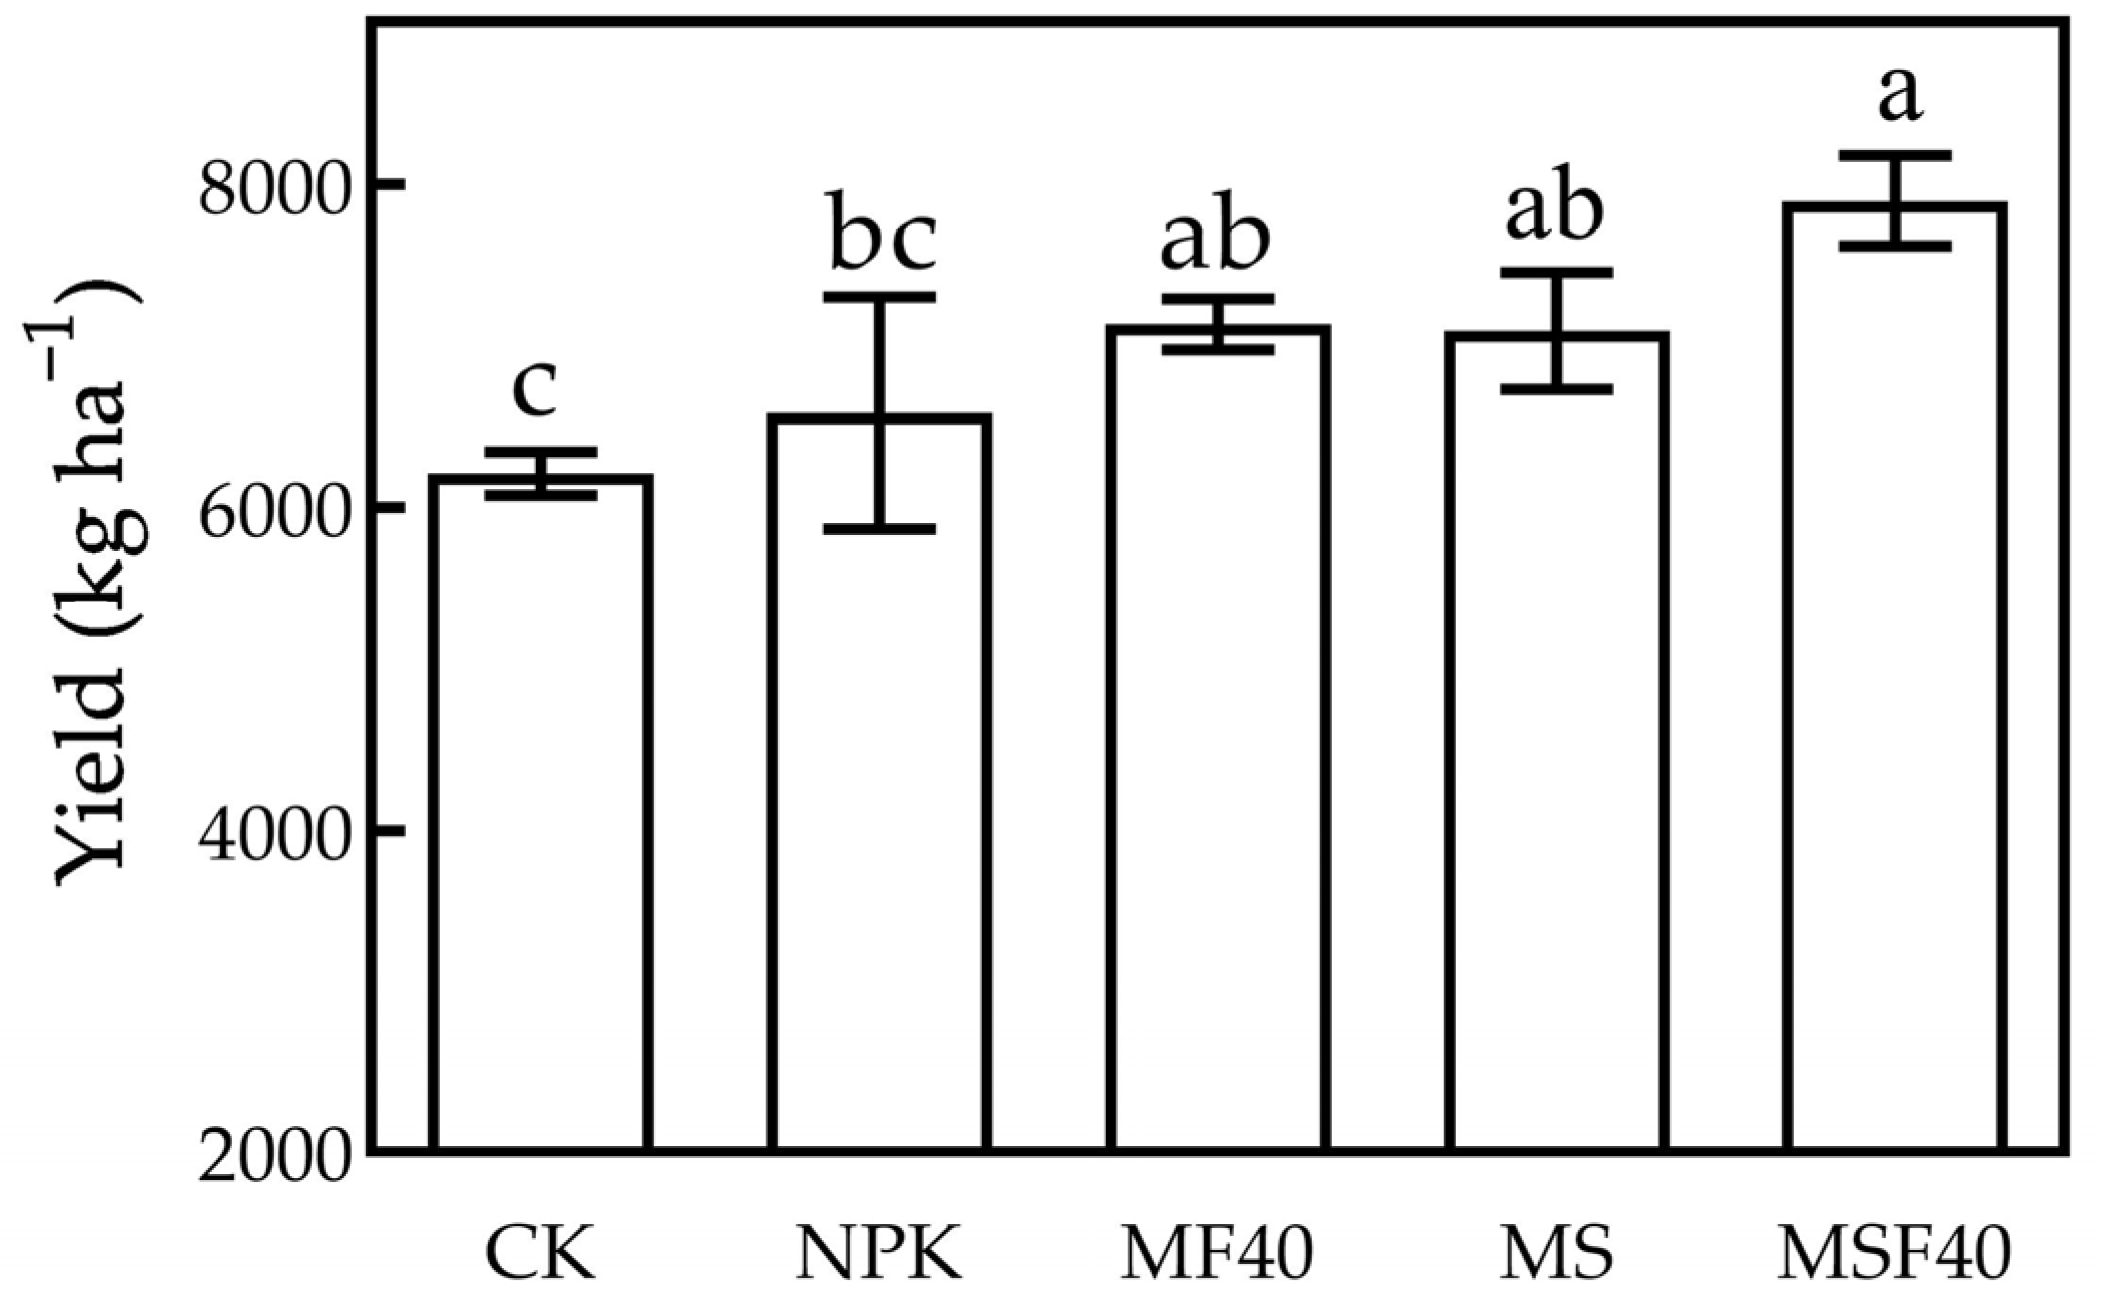
As shown in Table 1, compared with the NPK treatment, the organic material return treatments (MF40, MS, and MSF40) significantly increased soil organic matter (SOM) by 12.08% ± 0.48%, 17.10% ± 1.14%, and 12.34% ± 1.02%, respectively (p < 0.05). Soil total nitrogen (TN) and available phosphorus (AP) contents were also significantly elevated (p < 0.05), with no significant differences observed among the organic material return treatments. The alkali-hydrolyzable nitrogen (AN) content in MSF40 was 11.24% higher than that in NPK. Compared with NPK, the available potassium (AK) content significantly increased by 25.87% ± 2.15% in MSF40 (p < 0.05) and by 7.77% ± 0.53% in MS. No significant differences in soil pH were observed among all treatments, with values ranging from 5.02 ± 0.14 to 5.10 ± 0.11, indicating that long-term organic material incorporation did not alter the acidic nature of the paddy soil. Long-term organic material incorporation significantly increased rice yield (Figure 1). Compared with NPK, the yield increase rates in MF40, MS, and MSF40 were 8.35% ± 0.78%, 7.74% ± 0.69%, and 19.98% ± 1.57%, respectively. MSF40 achieved the highest yield of 7897.32 ± 500.26 kg ha−1, suggesting that the combined application of CMV and rice straw with reduced chemical fertilizer can maximize rice yield improvement.

3.2. Greenhouse Gas Emission Under Different Treatments

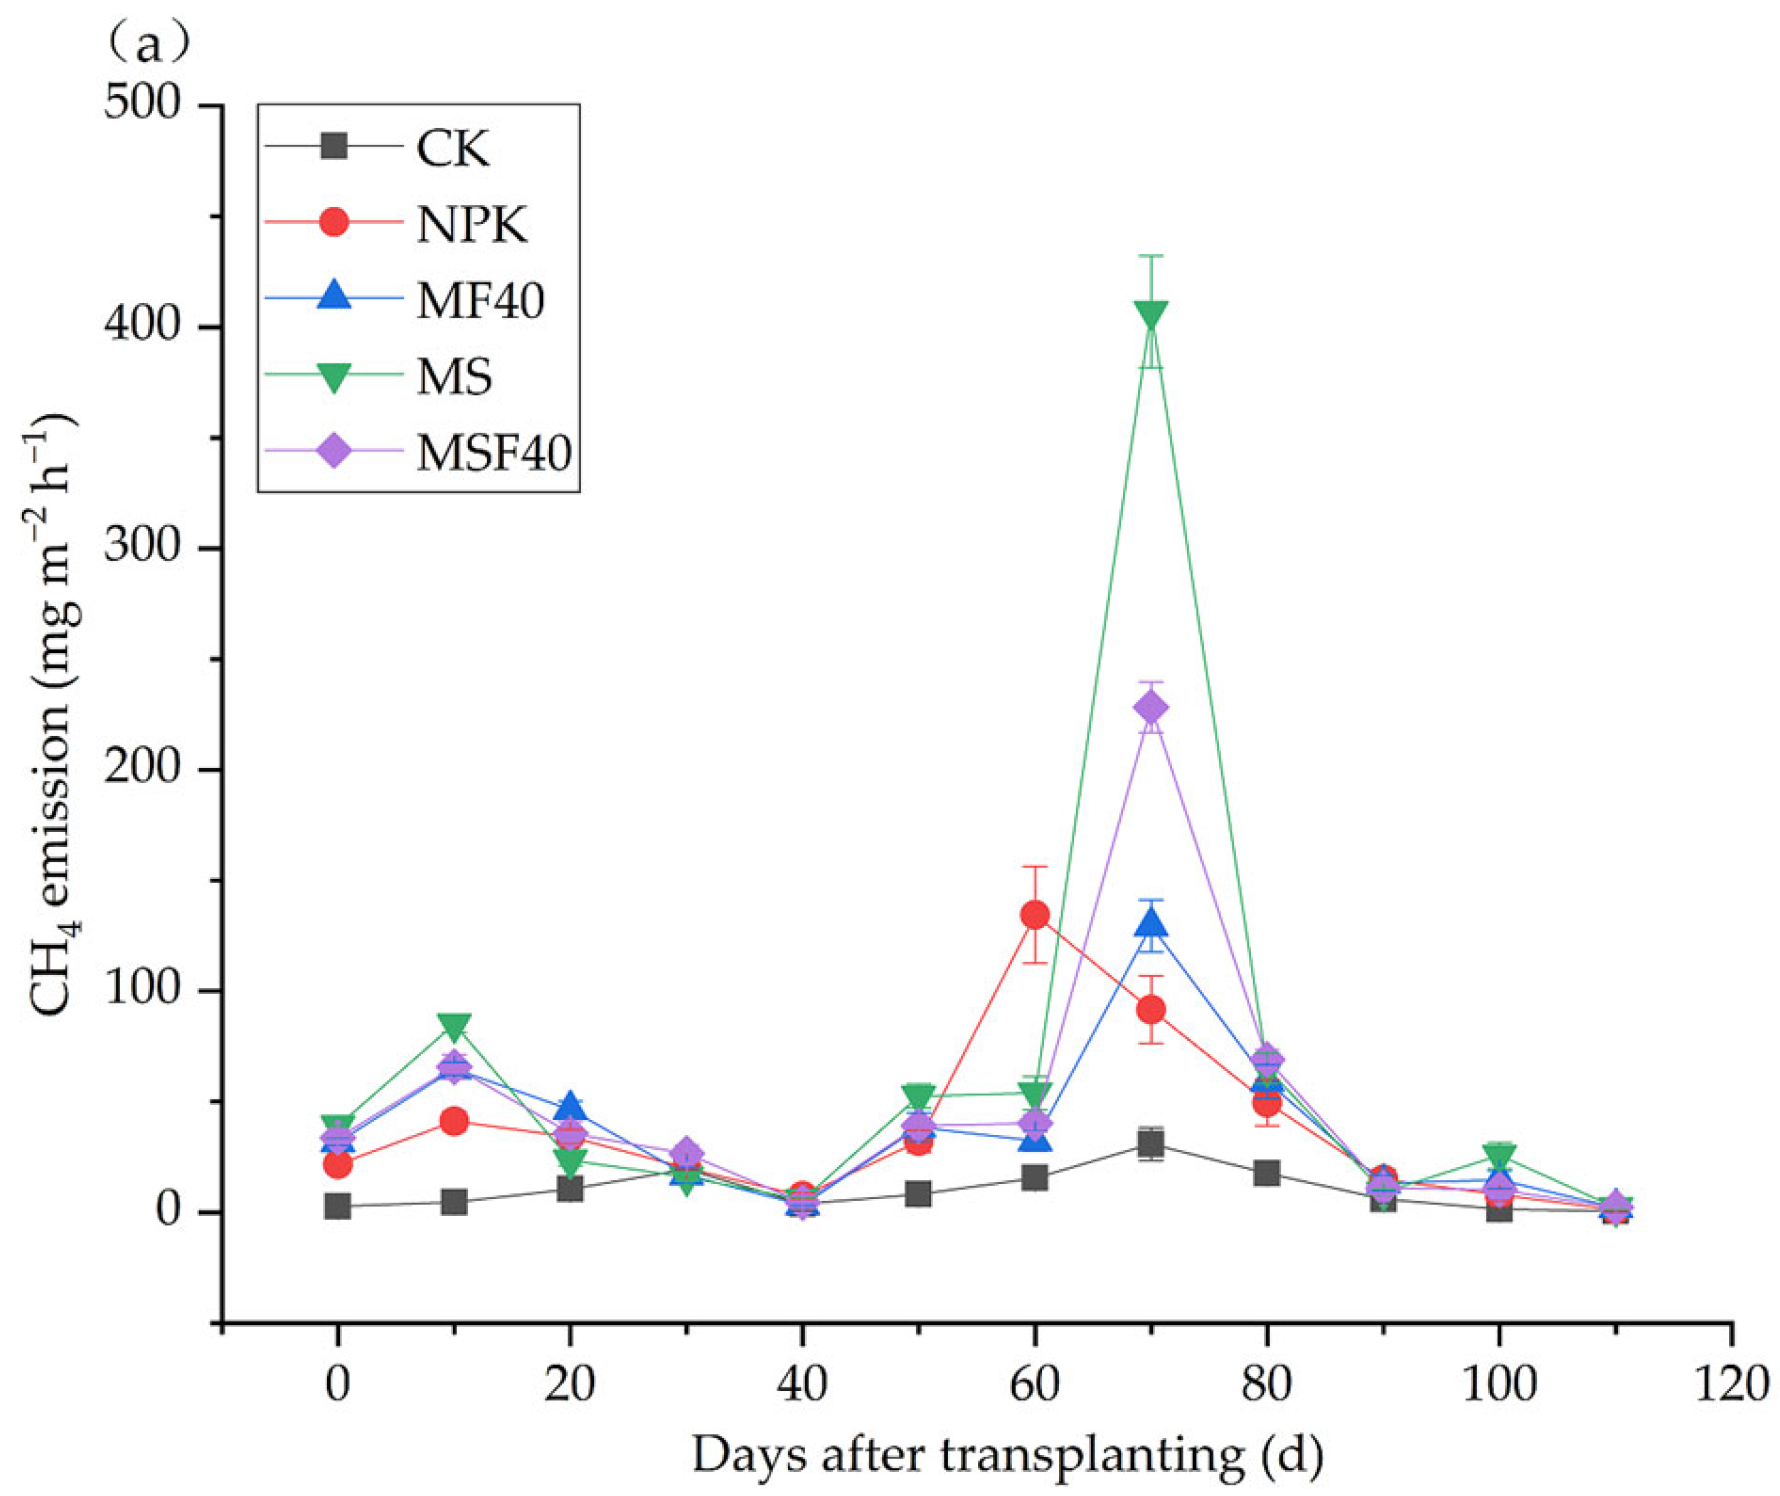
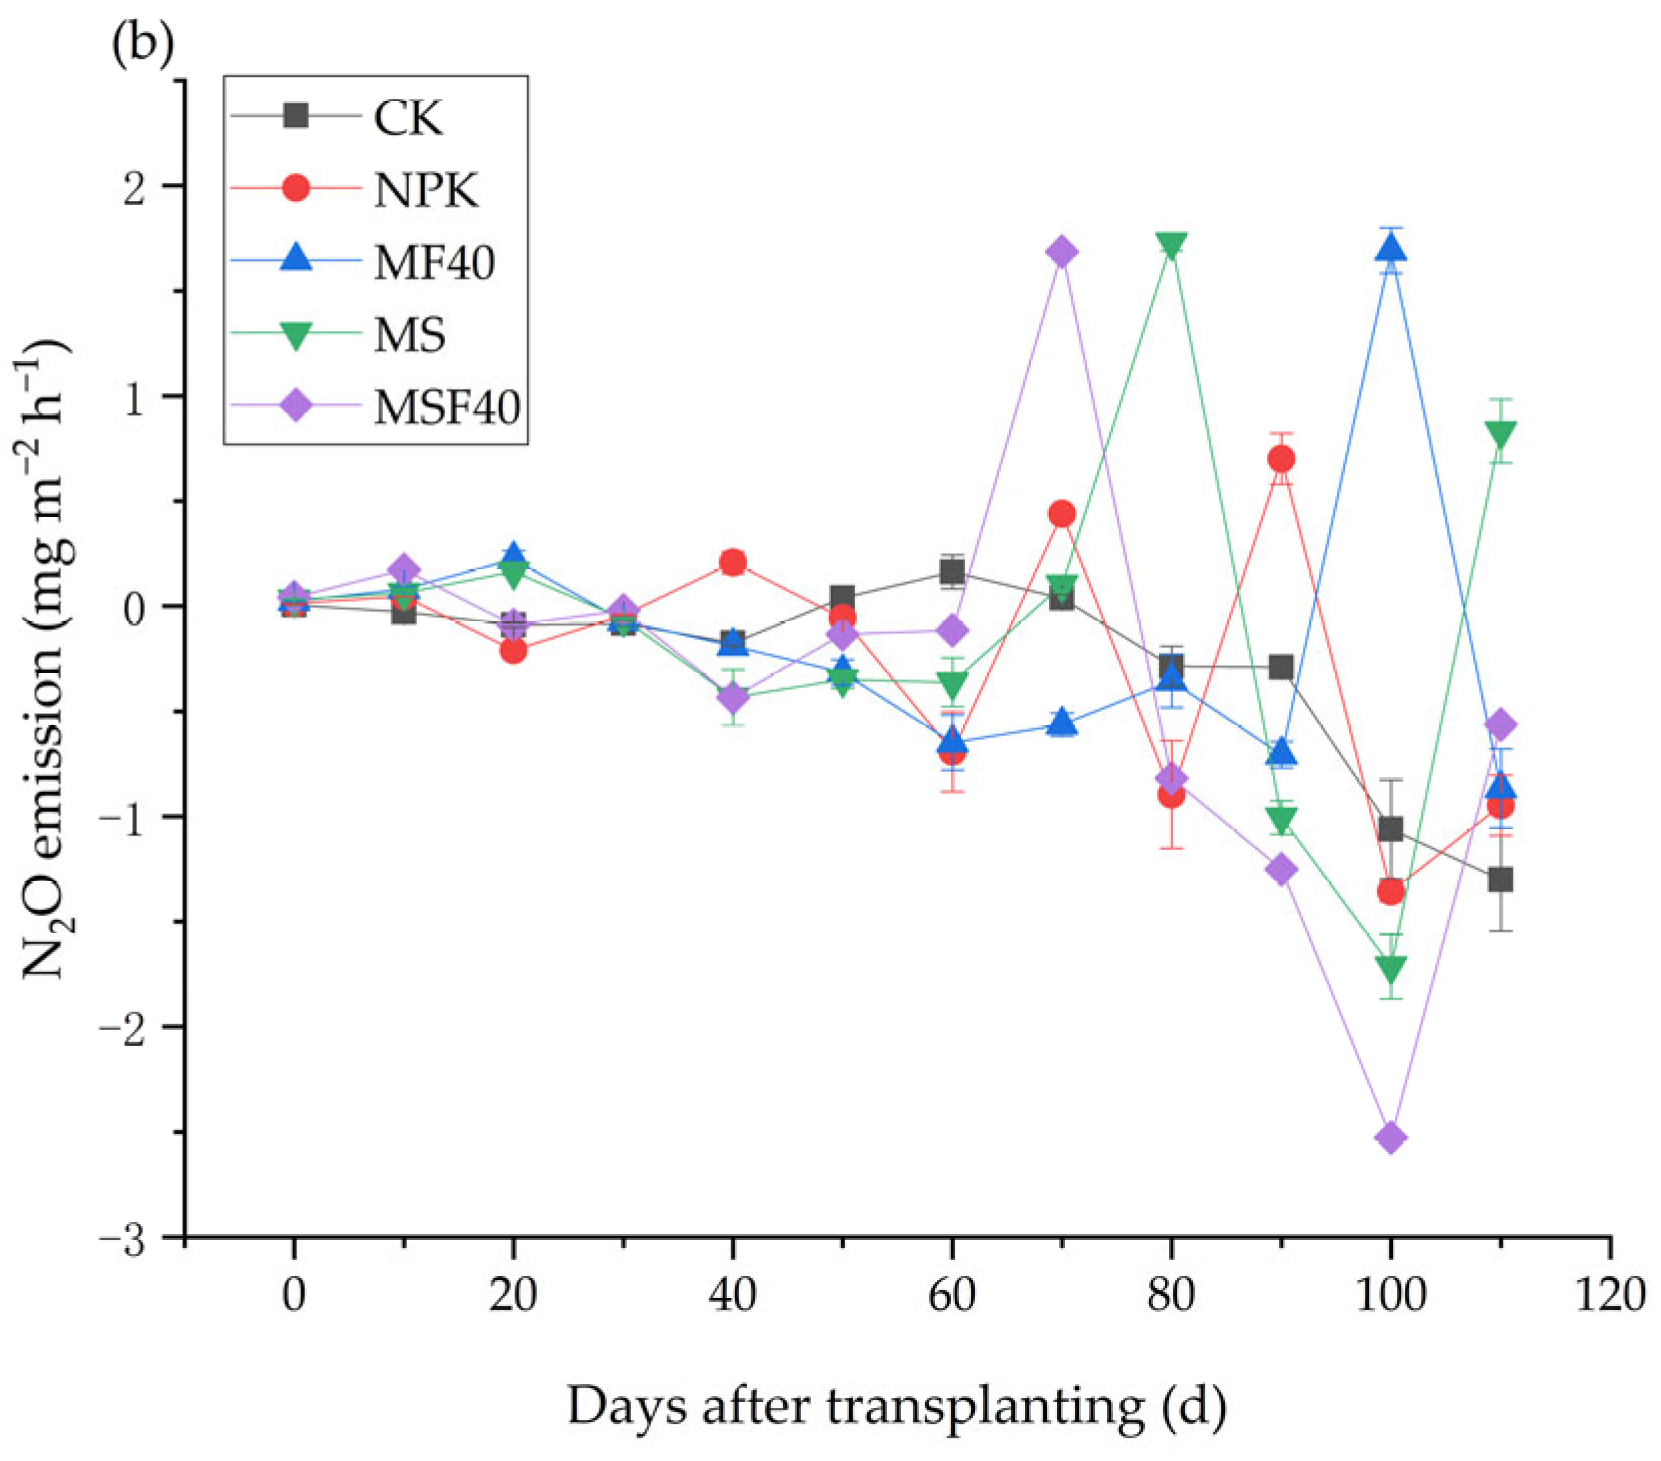
Figure 2a illustrates the temporal variation in CH4 emission fluxes under different treatments during the rice growing season. Across all treatments in 2024, CH4 emission fluxes ranged from 0.39 ± 0.03 to 435.93 ± 39.47 mg m−2 h−1. Emissions in the CK treatment remained relatively stable with no obvious peak. In the NPK treatment, the CH4 flux peaked at 60 days after transplanting (DAT) (134.45 ± 12.97 mg m−2 h−1). For all organic material return treatments, the CH4 flux peaks occurred at 70 DAT: MS treatment exhibited the highest peak (407.01 ± 38.21 mg m−2 h−1), followed by MSF40 (228.21 ± 20.63 mg m−2 h−1), and MF40 with the lowest peak (129.45 ± 11.58 mg m−2 h−1). As shown in Figure 2b, N2O emission patterns differed significantly among treatments, with fluxes ranging from −2.53 ± 0.18 to 1.73 ± 0.13 mg m−2 h−1. Emission fluxes were near zero or negative during most periods, with only small emission peaks appearing in the late growing stage. The peak N2O fluxes for MF40, MS, and MSF40 were observed at 100 DAT (1.69 ± 0.14 mg m−2 h−1), 80 DAT (1.73 ± 0.12 mg m−2 h−1), and 70 DAT (1.69 ± 0.11 mg m−2 h−1), respectively, indicating that different organic material incorporation altered the temporal patterns of N2O emissions.
As shown in Table 2, the cumulative CH4 emissions in the CK treatment were significantly lower than those in all fertilization treatments (p < 0.05). No significant difference was observed between NPK and MF40, whereas MS and MSF40 treatments significantly increased CH4 emissions by 73.45% and 22.85%, respectively, compared with NPK (p < 0.05). Cumulative N2O emissions were negative across all treatments, indicating a significant N2O sink effect. MSF40 exhibited the strongest N2O absorption capacity (−8.54 ± 0.64 kg ha−1), with no significant difference observed between MF40 and MS. Compared with CK, all fertilization treatments significantly increased the global warming potential (GWP) of paddy fields (p < 0.05). No significant difference in GWP was found between MF40 and NPK, whereas MS and MSF40 significantly increased GWP by 78.68% ± 6.53% and 21.59% ± 1.87% (p < 0.05), respectively, relative to NPK. The GWP per unit yield was the highest in MS treatment (8.30 ± 0.33 kg CO2-eq kg−1), which was significantly higher than that of NPK (p < 0.05). However, no significant differences in GWP per unit yield were observed among MF40, MSF40, and NPK.

3.3. Soil Microbial Diversity

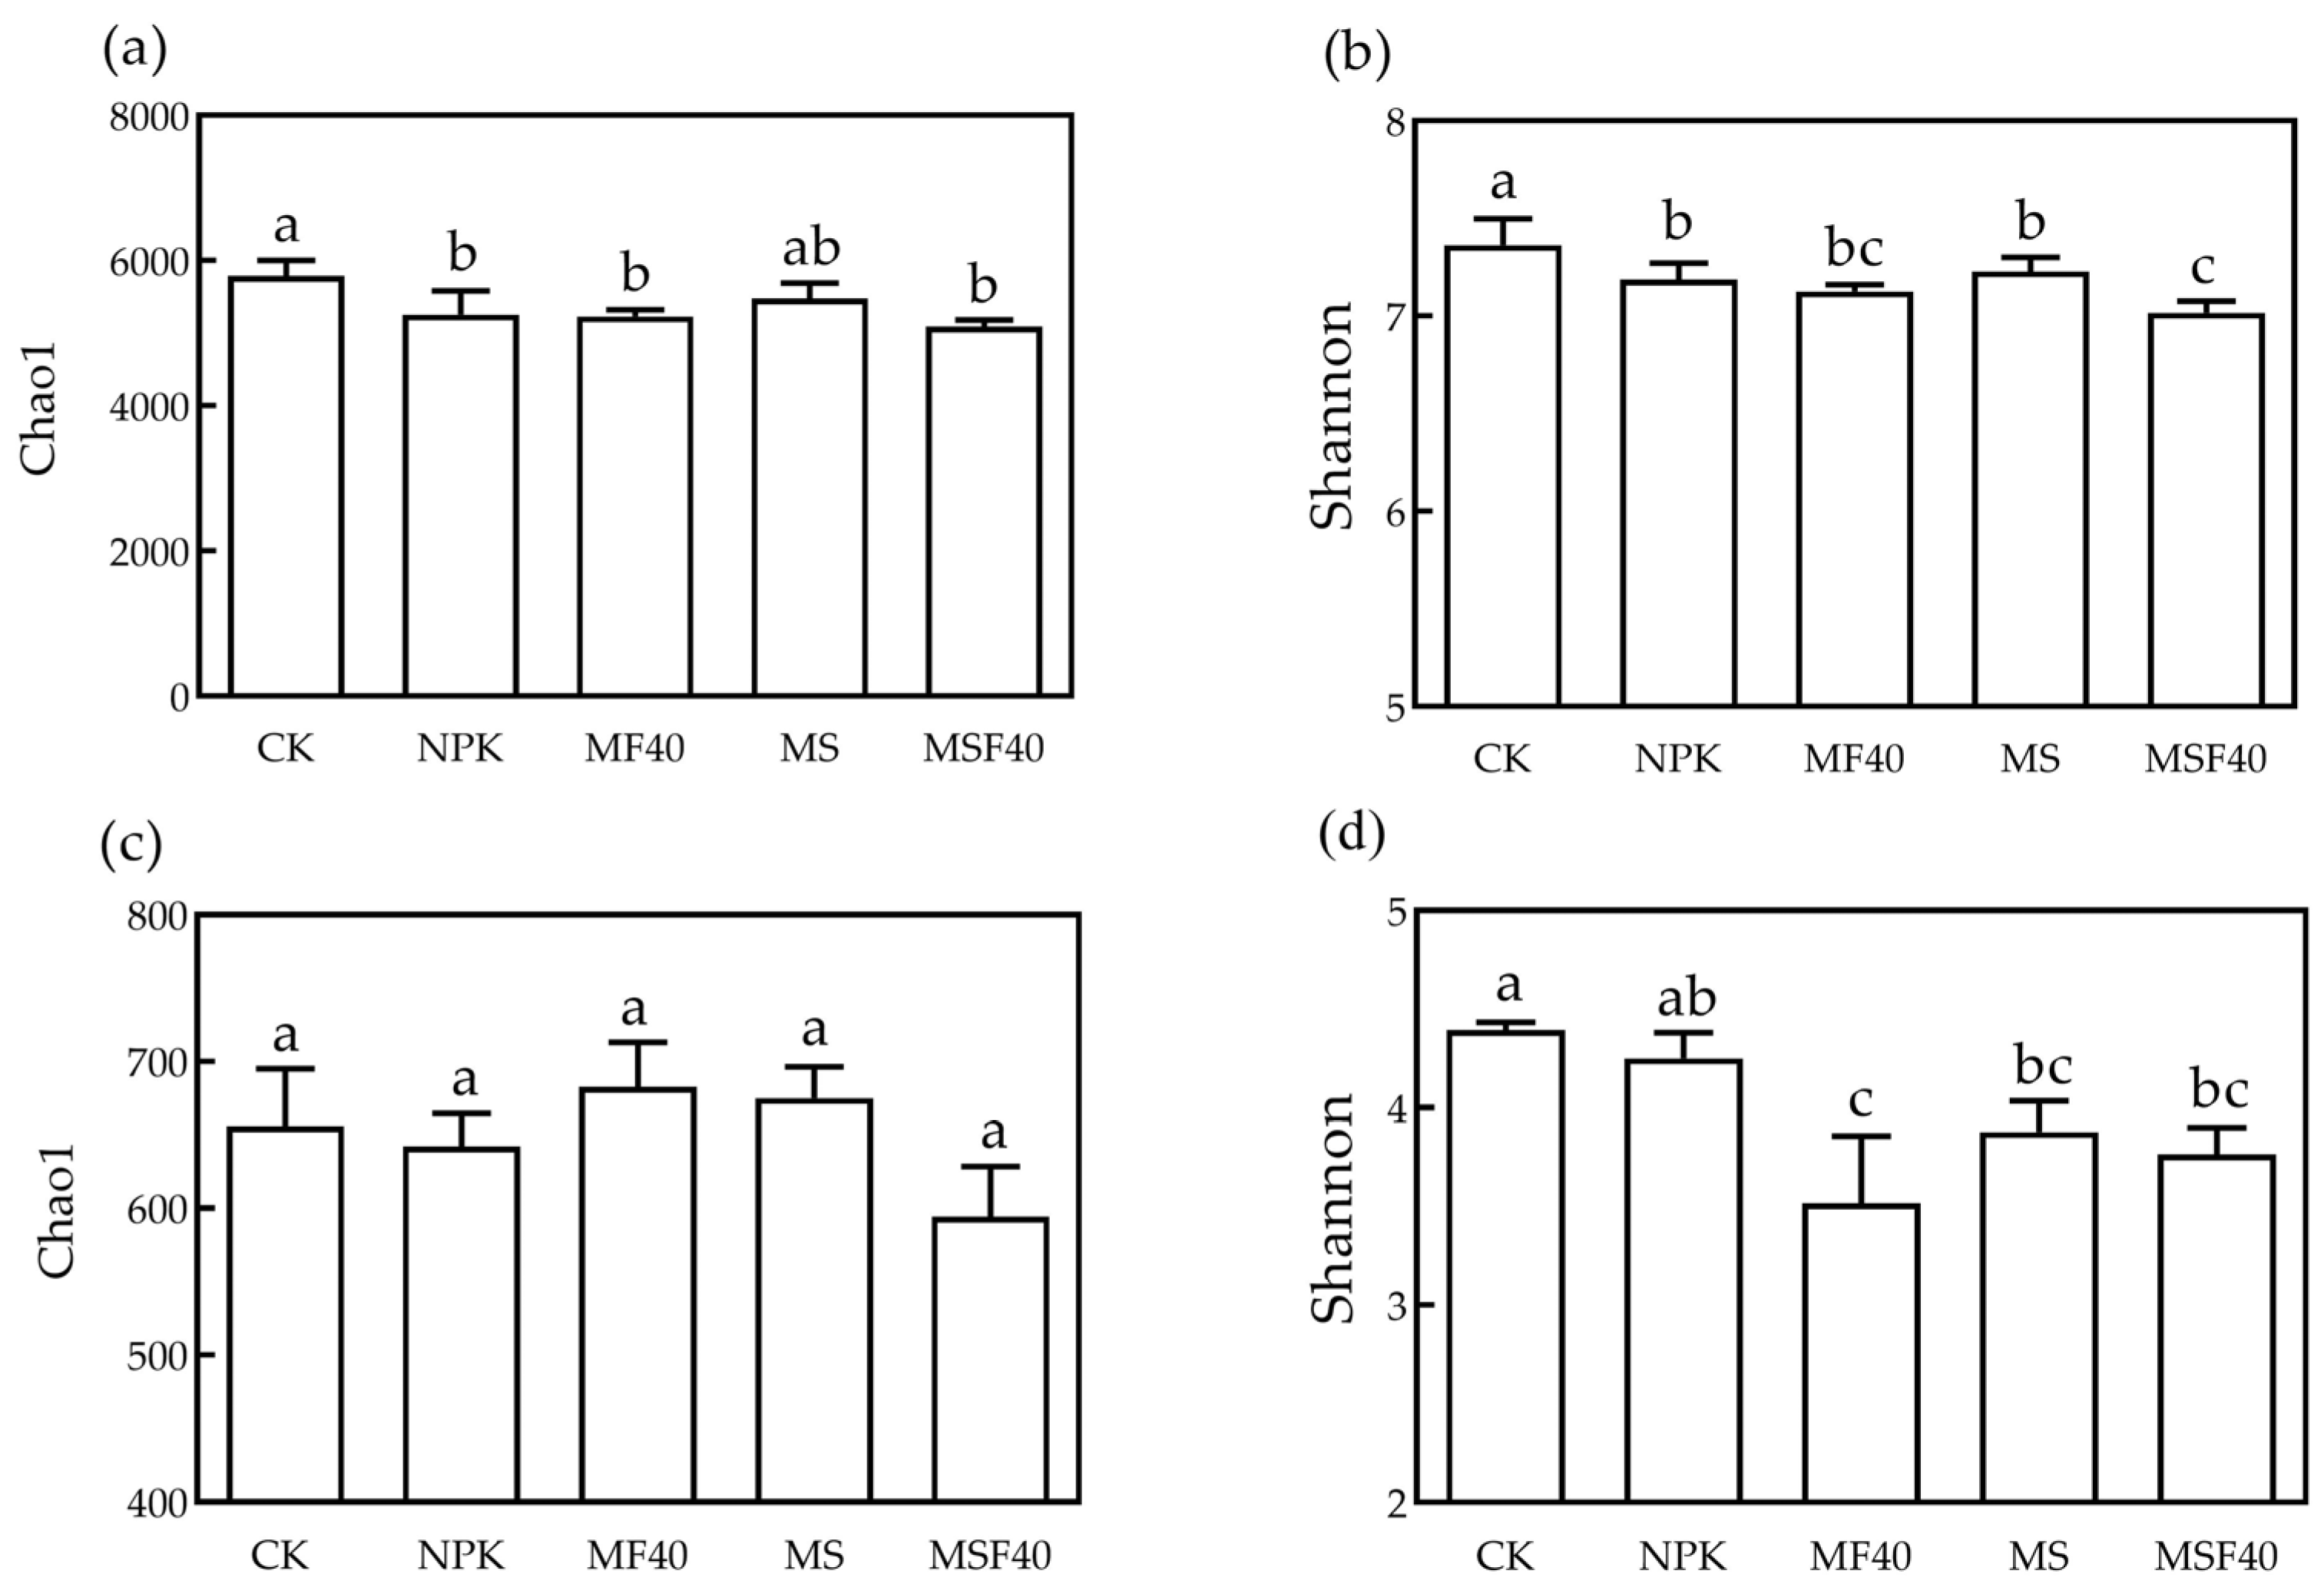
After quality filtering, the number of bacterial and fungal sequences ranged from 75,337 to 91,875, and 74,174 to 91,914 per sample, respectively. The soil bacterial Chao1 index (richness) and Shannon index (diversity) were highest in the CK treatment, and fertilization treatments significantly reduced bacterial α-diversity (p < 0.05) (Figure 3a,b). Compared with CK, the Chao1 index decreased by 9.24% ± 0.63%, 9.71% ± 0.68%, 5.40% ± 0.48%, and 12.08% ± 1.07% in NPK, MF40, MS, and MSF40, respectively, while the Shannon index decreased by 2.40% ± 0.17%, 3.21% ± 0.19%, 1.81% ± 0.12%, and 4.71% ± 0.29%, respectively. Compared with NPK, none of the organic material return treatments (MF40, MS, and MSF40) showed significant differences in the Chao1 index; however, only MSF40 treatment exhibited a significantly lower Shannon index (p < 0.05). The responses of fungal α-diversity differed from those of bacteria (Figure 3c,d). No significant differences in the fungal Chao1 index were observed among all treatments. Compared with NPK, the Shannon index was significantly decreased in MF40 which exhibited the lowest Shannon index (p < 0.05).
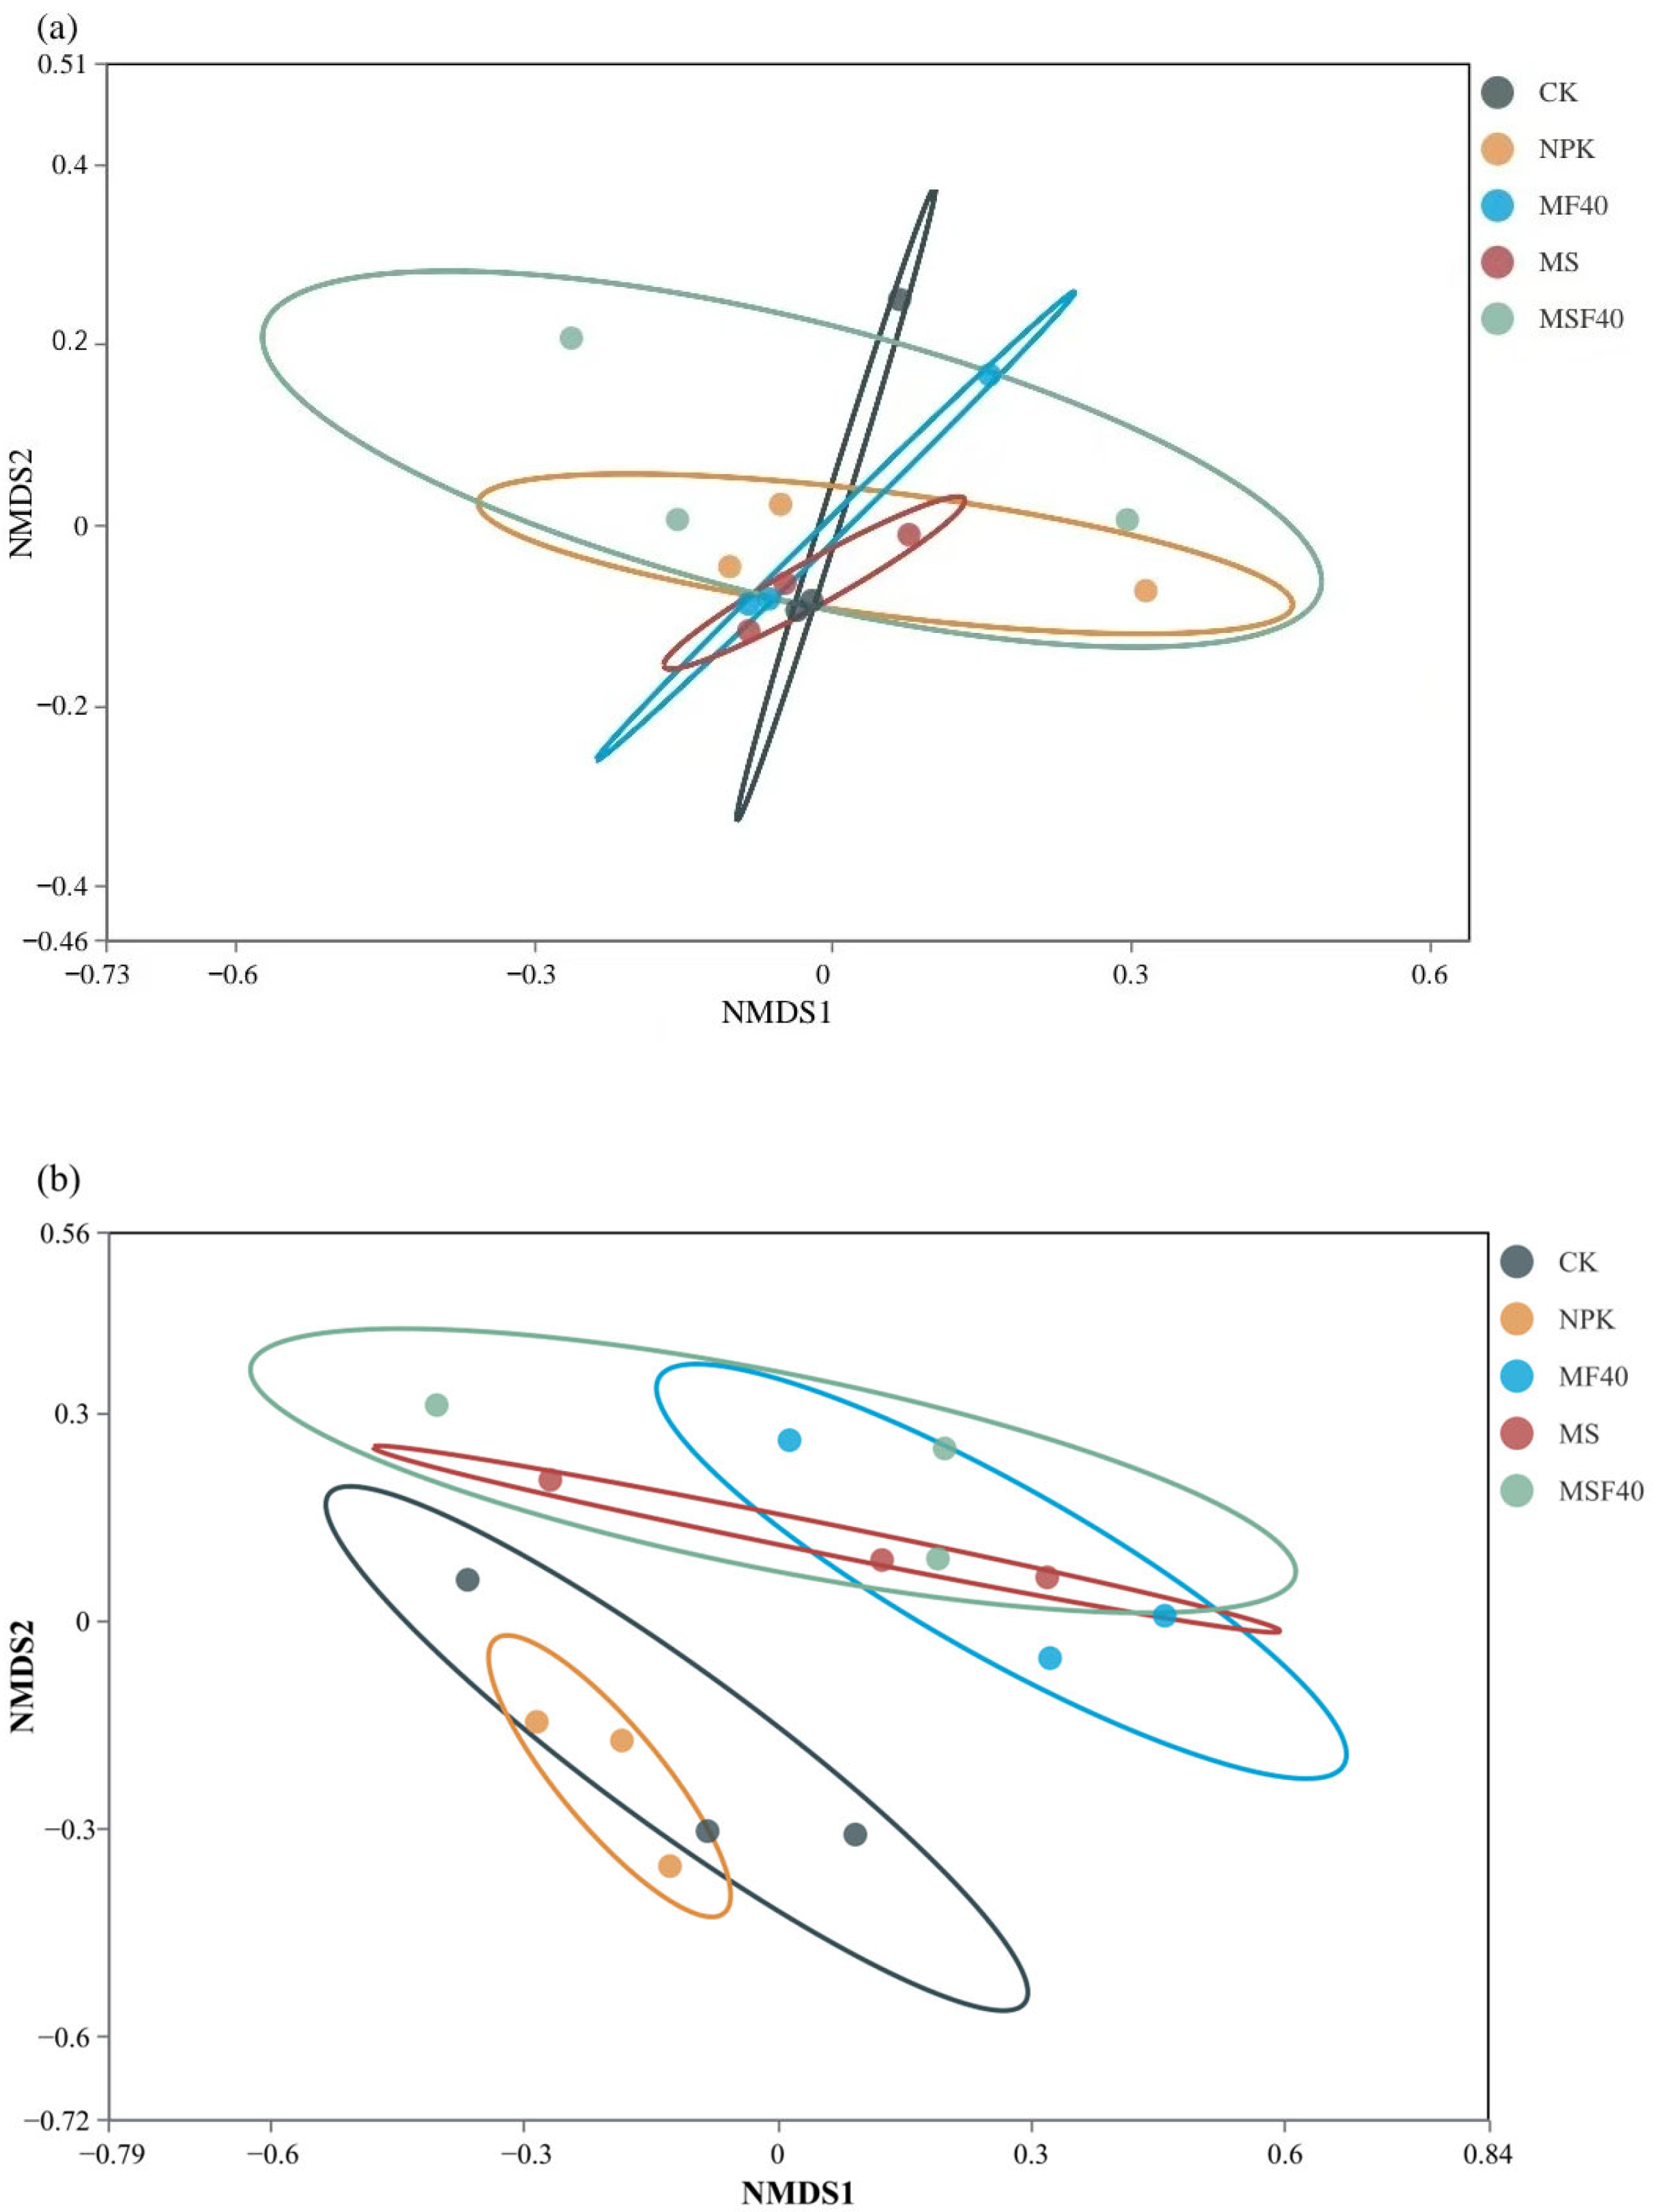
Non-metric multidimensional scaling (NMDS) analysis revealed no distinct separation of soil bacterial community structures among treatments, indicating that organic material incorporation did not significantly affect bacterial community structures (Figure 4a, stress = 0.09). The ANOSIM test showed that there were no significant differences across all treatments in the bacterial communities (R = 0.01, p = 0. 5). In contrast, fungal community structures formed two distinct groups (Figure 4b, stress = 0.10): CK and NPK clustered together, while MF40, MS, and MSF40 formed another cluster. This demonstrates that organic material incorporation significantly altered soil fungal community structures. The ANOSIM test showed that there was significant difference between the organic material treatments and other treatments in the fungal communities (R = 0.62, p = 0.04).

3.4. Soil Microbial Community

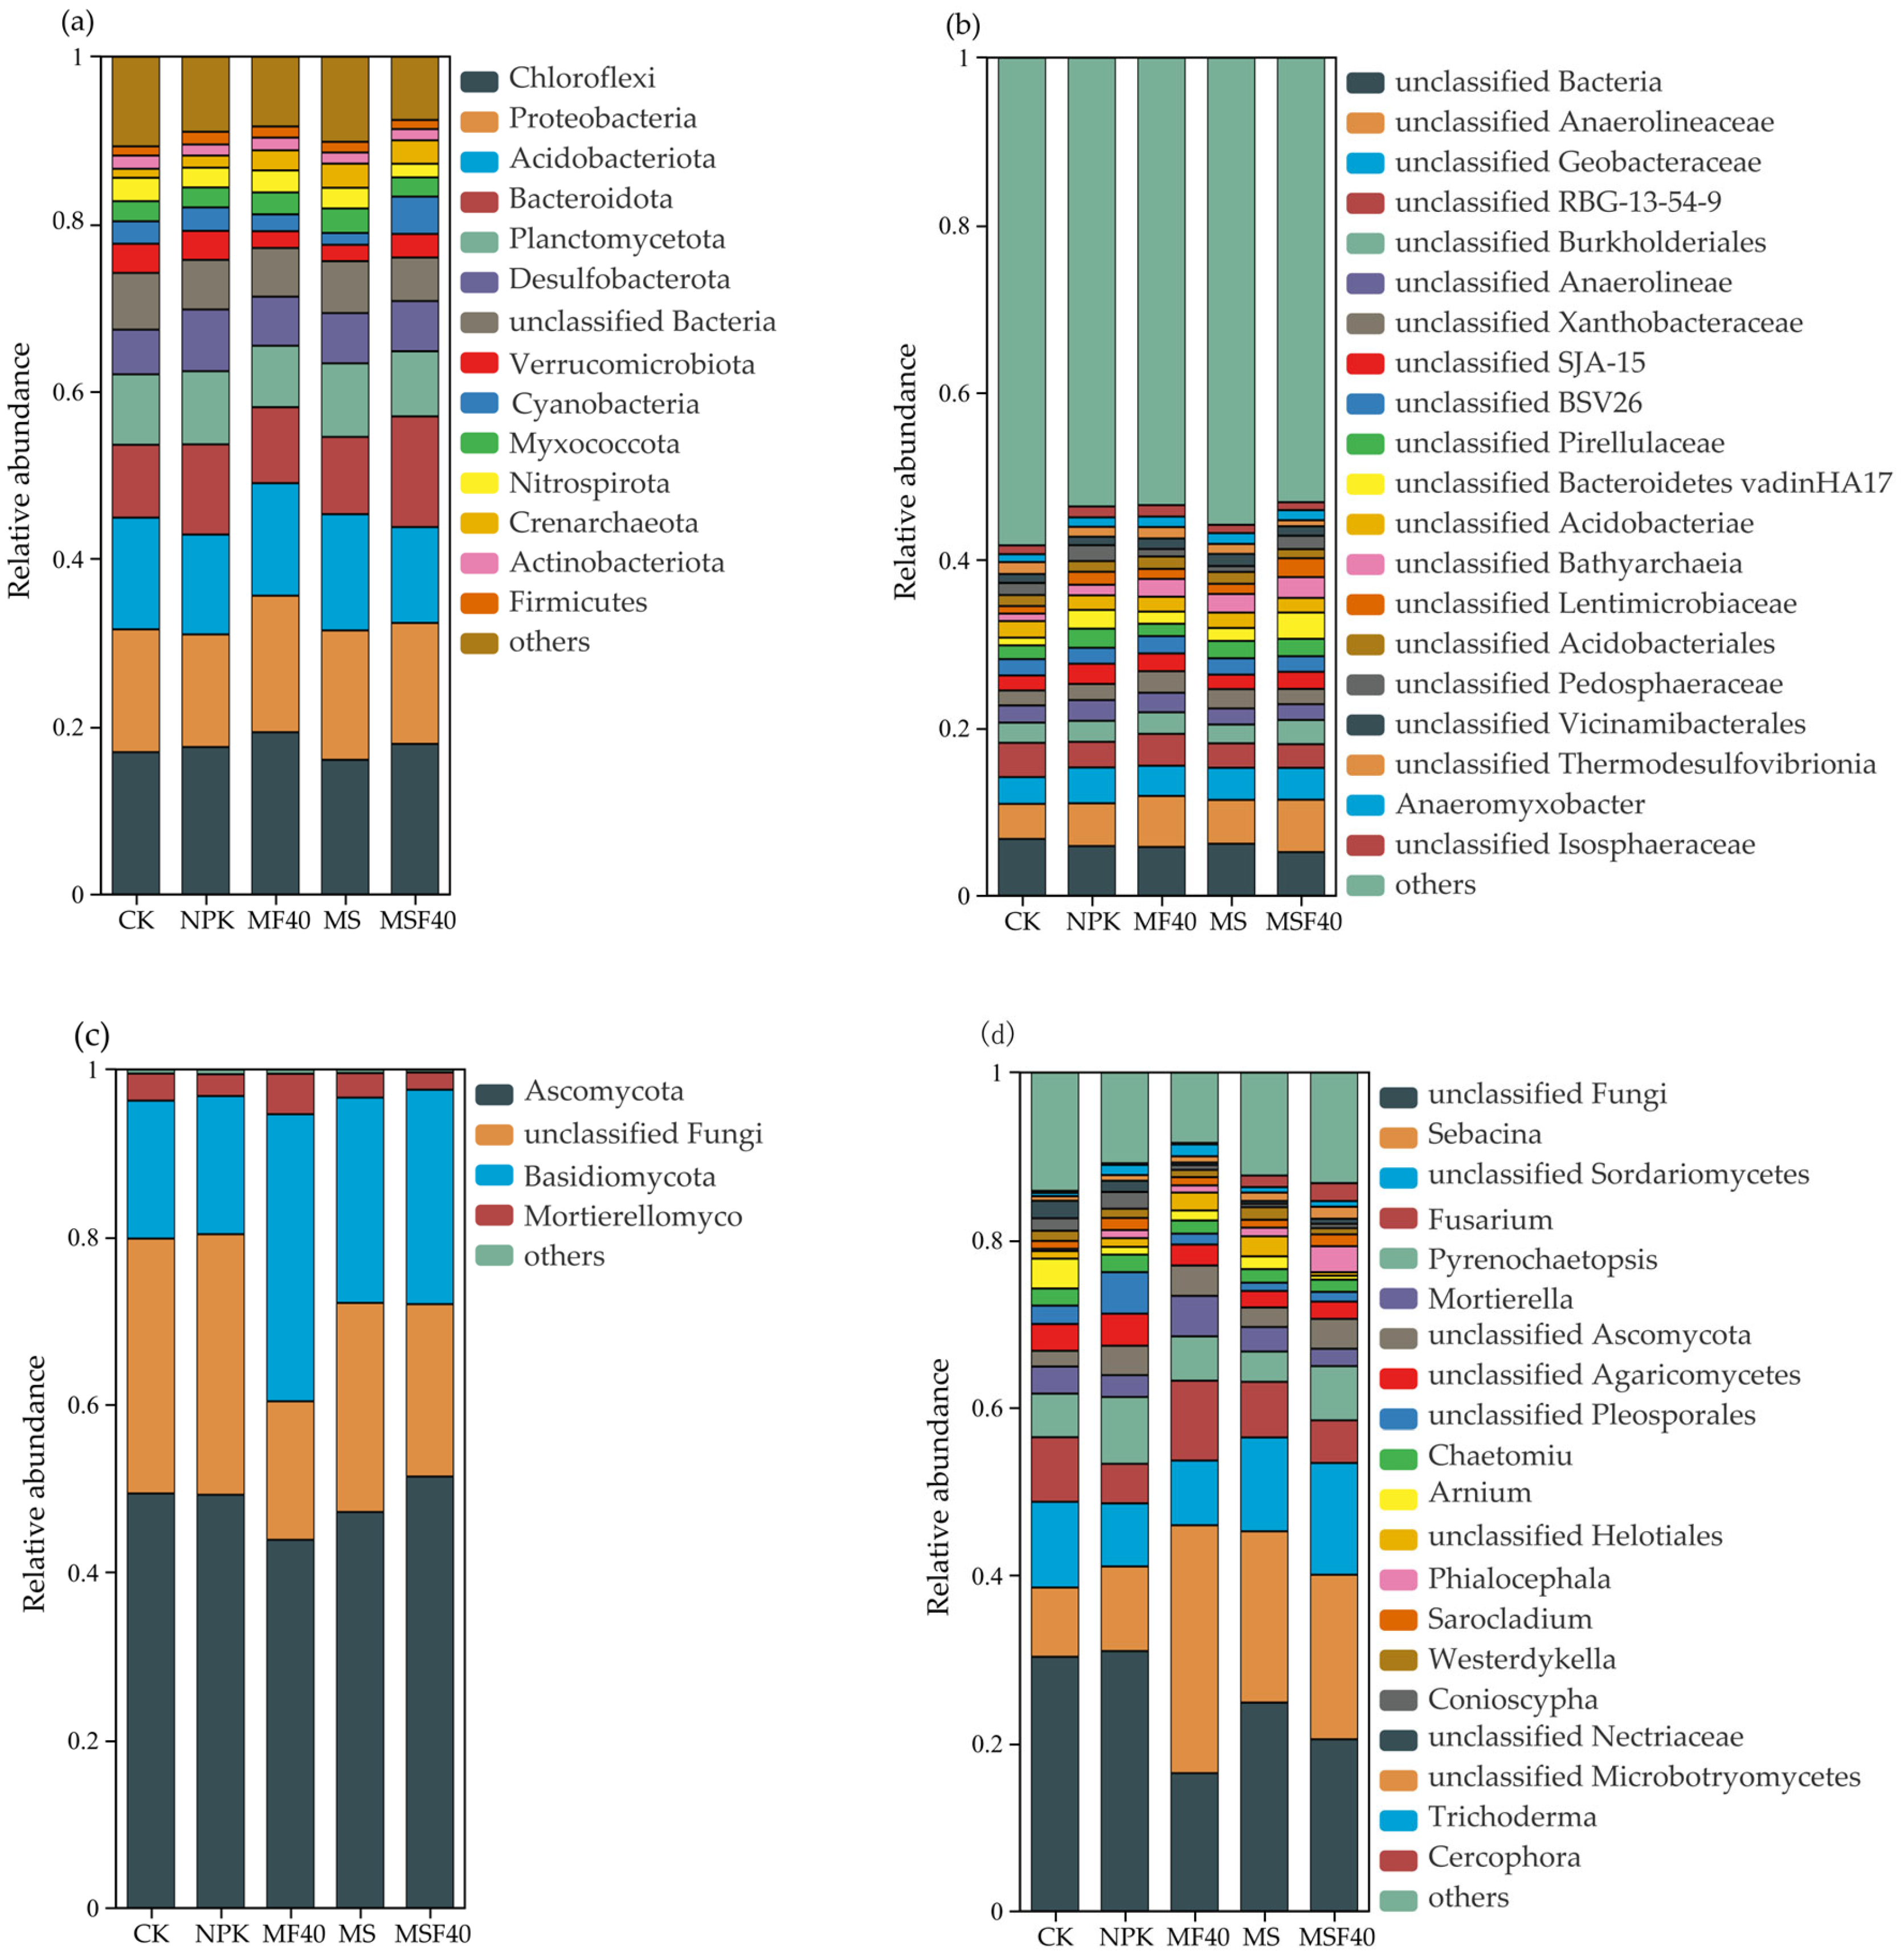
At the phylum level, soil bacteria across all treatments were mainly affiliated with Chloroflexi, Proteobacteria, Acidobacteriota, Bacteroidota, Planctomycetota, Desulfobacterota, Verrucomicrobiota, Cyanobacteria, Myxococcota, Nitrospirota, Crenarchaeota, Actinobacteriota, and Firmicutes (relative abundance > 1%) (Figure 5a). Compared with CK and NPK, organic material return treatments significantly increased the relative abundance of Crenarchaeota and decreased that of Verrucomicrobiota (p < 0.05). At the genus level, the dominant bacterial genera belonged to unclassified taxa, indicating that a large number of uncharacterized bacterial groups exist in the paddy soil (Figure 5b). The genus composition was similar across all treatments. At the phylum level, the dominant fungal taxa in the soil were Ascomycota, unclassified_k_Fungi, Basidiomycota, and Mortierellomycota, which together accounted for 99.43–99.65% of the fungal community (Figure 5c). Compared with NPK, the relative abundance of Ascomycota in MF40 decreased by 10.90% ± 0.78%, while those of Basidiomycota and Mortierellomycota increased by 107.85% ± 8.62% and 85.47% ± 6.23%, respectively. The relative abundance of Basidiomycota was also significantly higher in MS and MSF40 than in NPK treatment (p < 0.05). At the genus level, the dominant fungal groups included unclassified_k_Fungi, Sebacina, unclassified_c_Sordariomycetes, Fusarium, Pyrenochaetopsis, and Mortierella etc (Figure 5d). Compared with CK and NPK, organic material return treatments (MF40, MS, and MSF40) significantly increased the relative abundance of Sebacina by 19.29–257.68% (p < 0.05), with the highest abundance observed in MF40. The relative abundance of Fusarium was lowest in the NPK treatment; CK, MF40, and MS increased its abundance by 63.00% ± 5.7%, 100.00% ± 9.1%, and 38.9% ± 3.1%, respectively. The relative abundance of Mortierella was the highest in MF40 (4.83% ± 0.31%) and lowest in MSF40 (2.07% ± 0.11%). The relative abundance of Arnium was highest in CK, and significantly decreased in NPK (0.93% ± 0.08%) (p < 0.05). Compared with NPK, MF40 and MS increased the abundance of Arnium by 27.96% ± 2.07% and 63.44% ± 5.37%, respectively (p < 0.05).

3.5. Differential Analysis of Soil Microbial Community Structures

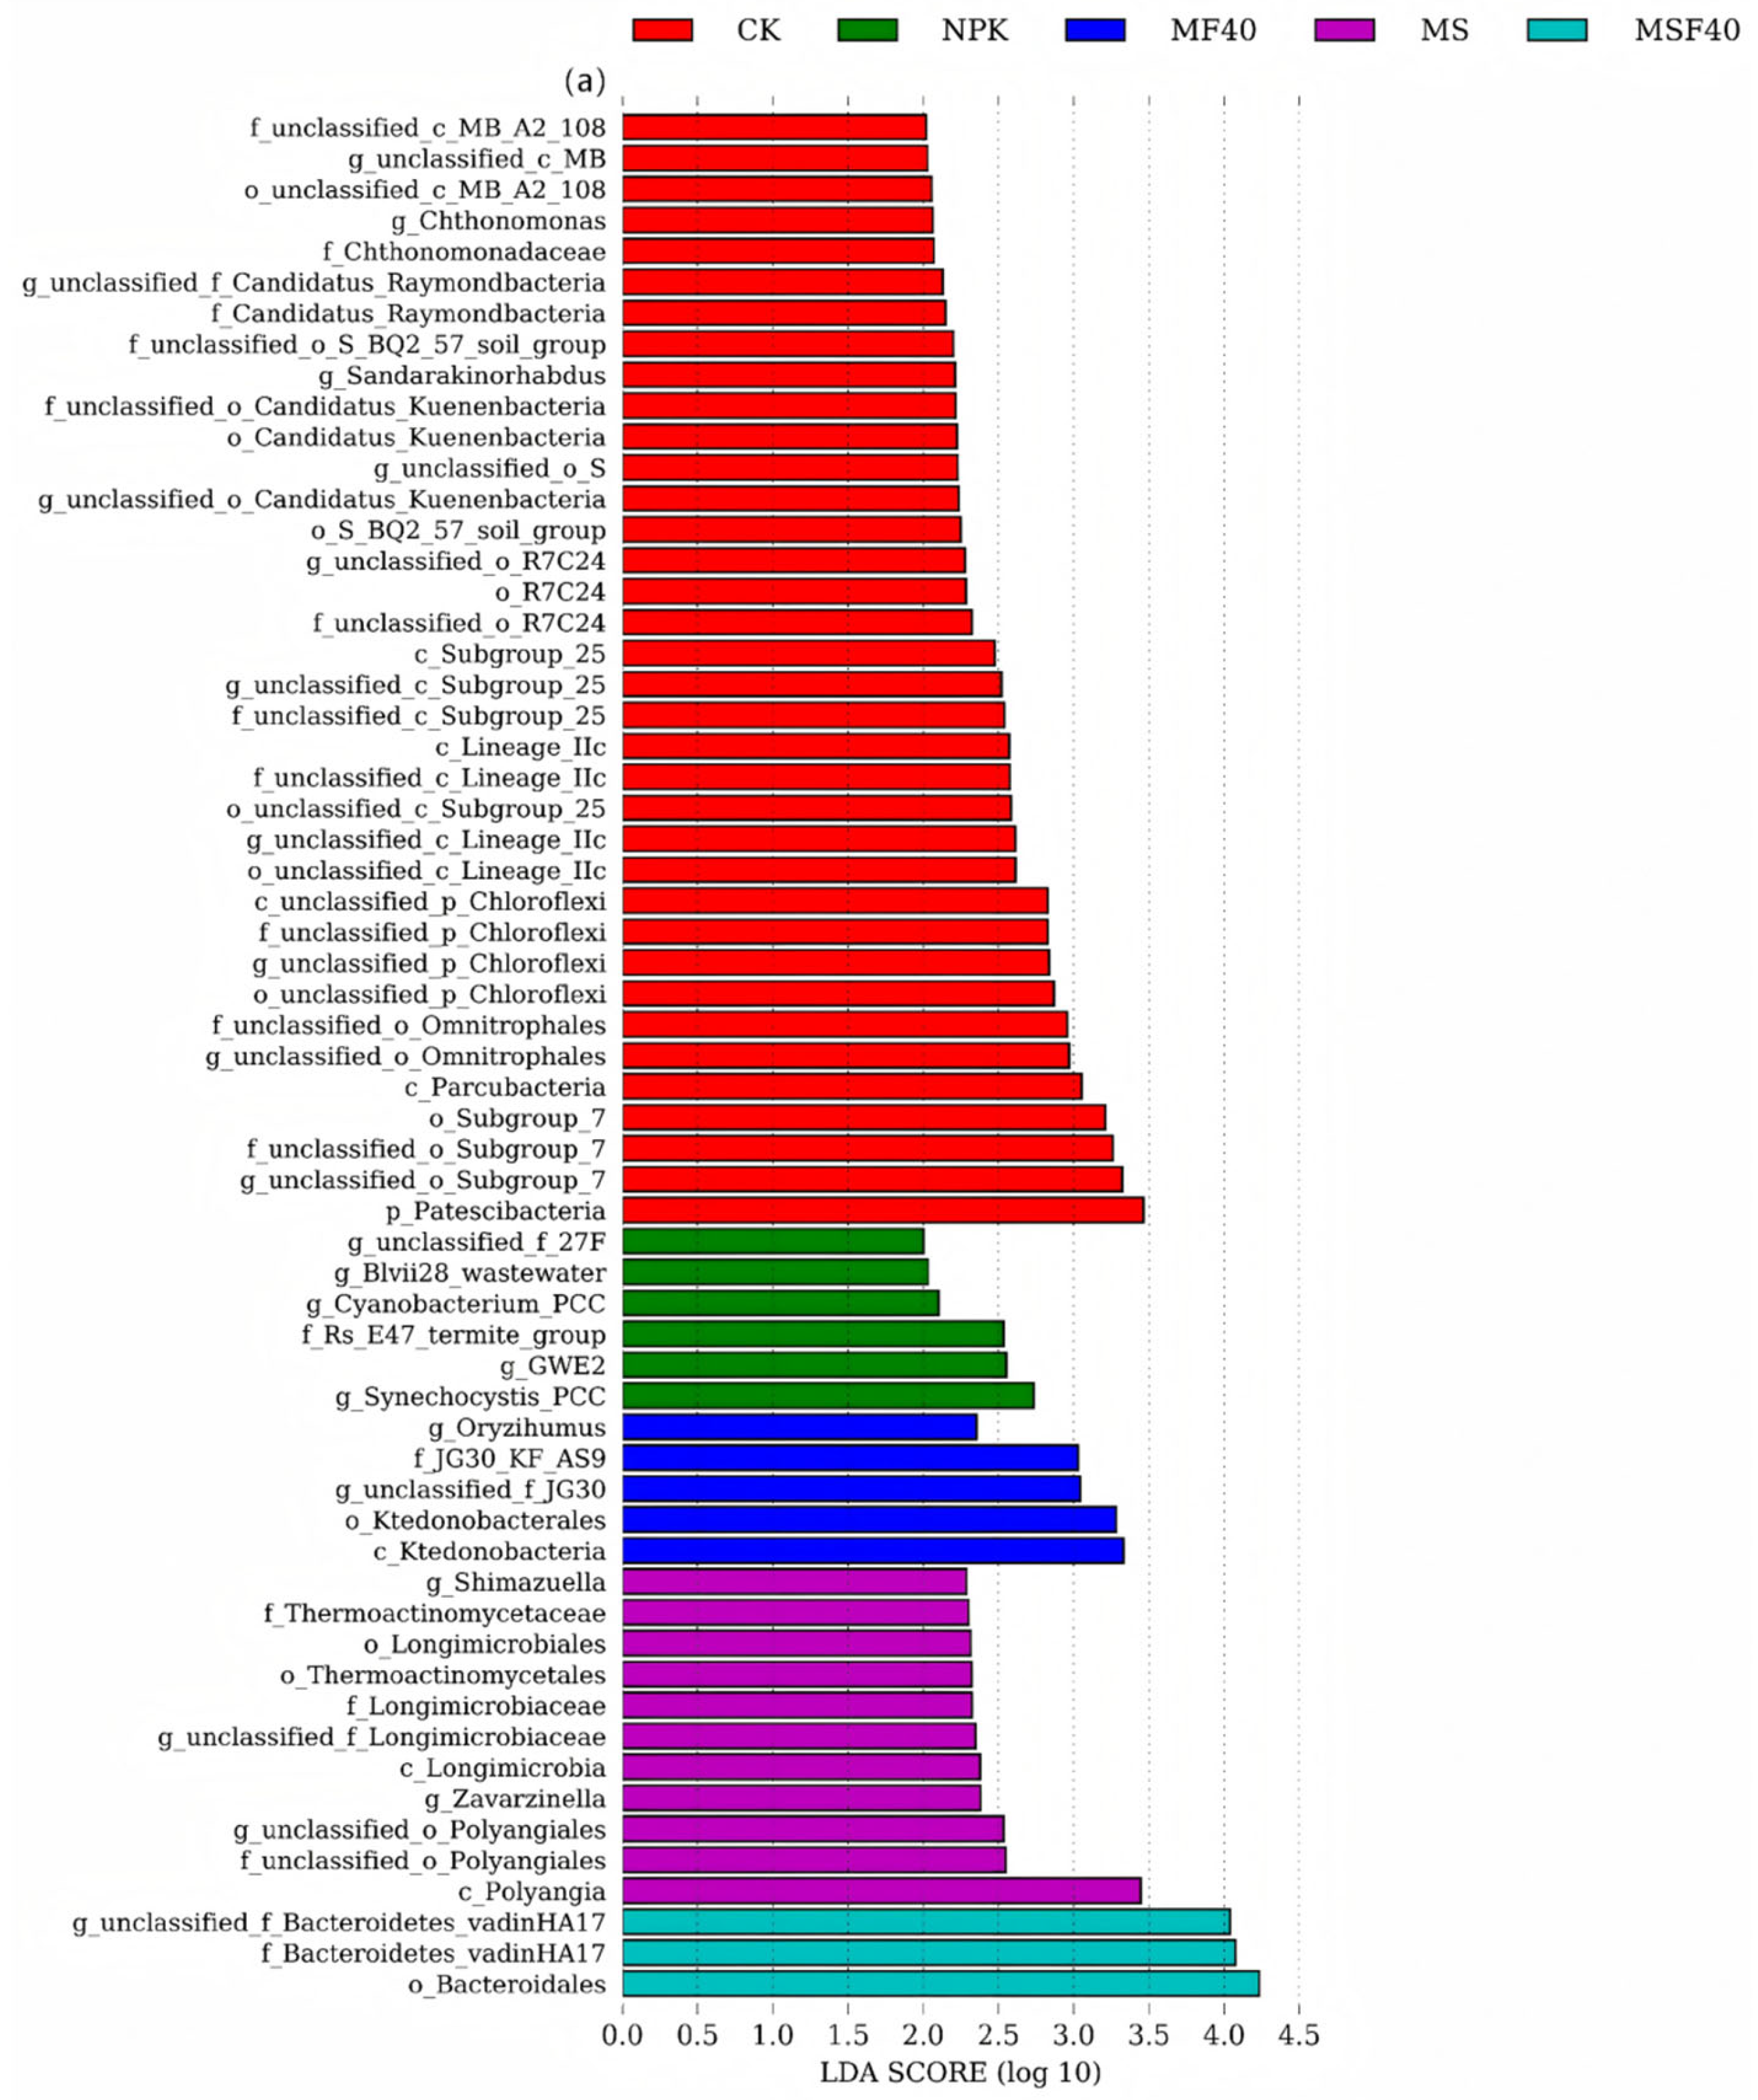
A total of 61 significantly differential bacterial taxa were identified by linear discriminant analysis effect size (LEfSe) (LDA > 2, Figure 6a), including 36, six, five, 11, and three biomarkers in CK, NPK, MF40, MS, and MSF40, respectively. Apart from some unclassified taxa, Chthonomonas, Chthonomonadaceae, Candidatus_Raymondbacteria, Sandarakinorhabdus, Candidatus_Kuenenbacteria, Parcubacteria, and Patescibacteria were significantly enriched in CK. NPK treatment enriched Blvii28_wastewater, Cyanobacterium_PCC, GWE2, and Synechocystis_PCC. MF40 significantly enriched Oryzihumus, Ktedonobacteria, and Ktedonobacterales. MS significantly enriched Shimazuella, Thermoactinomycetaceae, Thermoactinomycetales, Longimicrobiaceae, Longimicrobiales, Longimicrobia, Zavarzinella, and Polyangia. MSF40 significantly enriched Bacteroidetes_vadinHA17 and Bacteroidales.
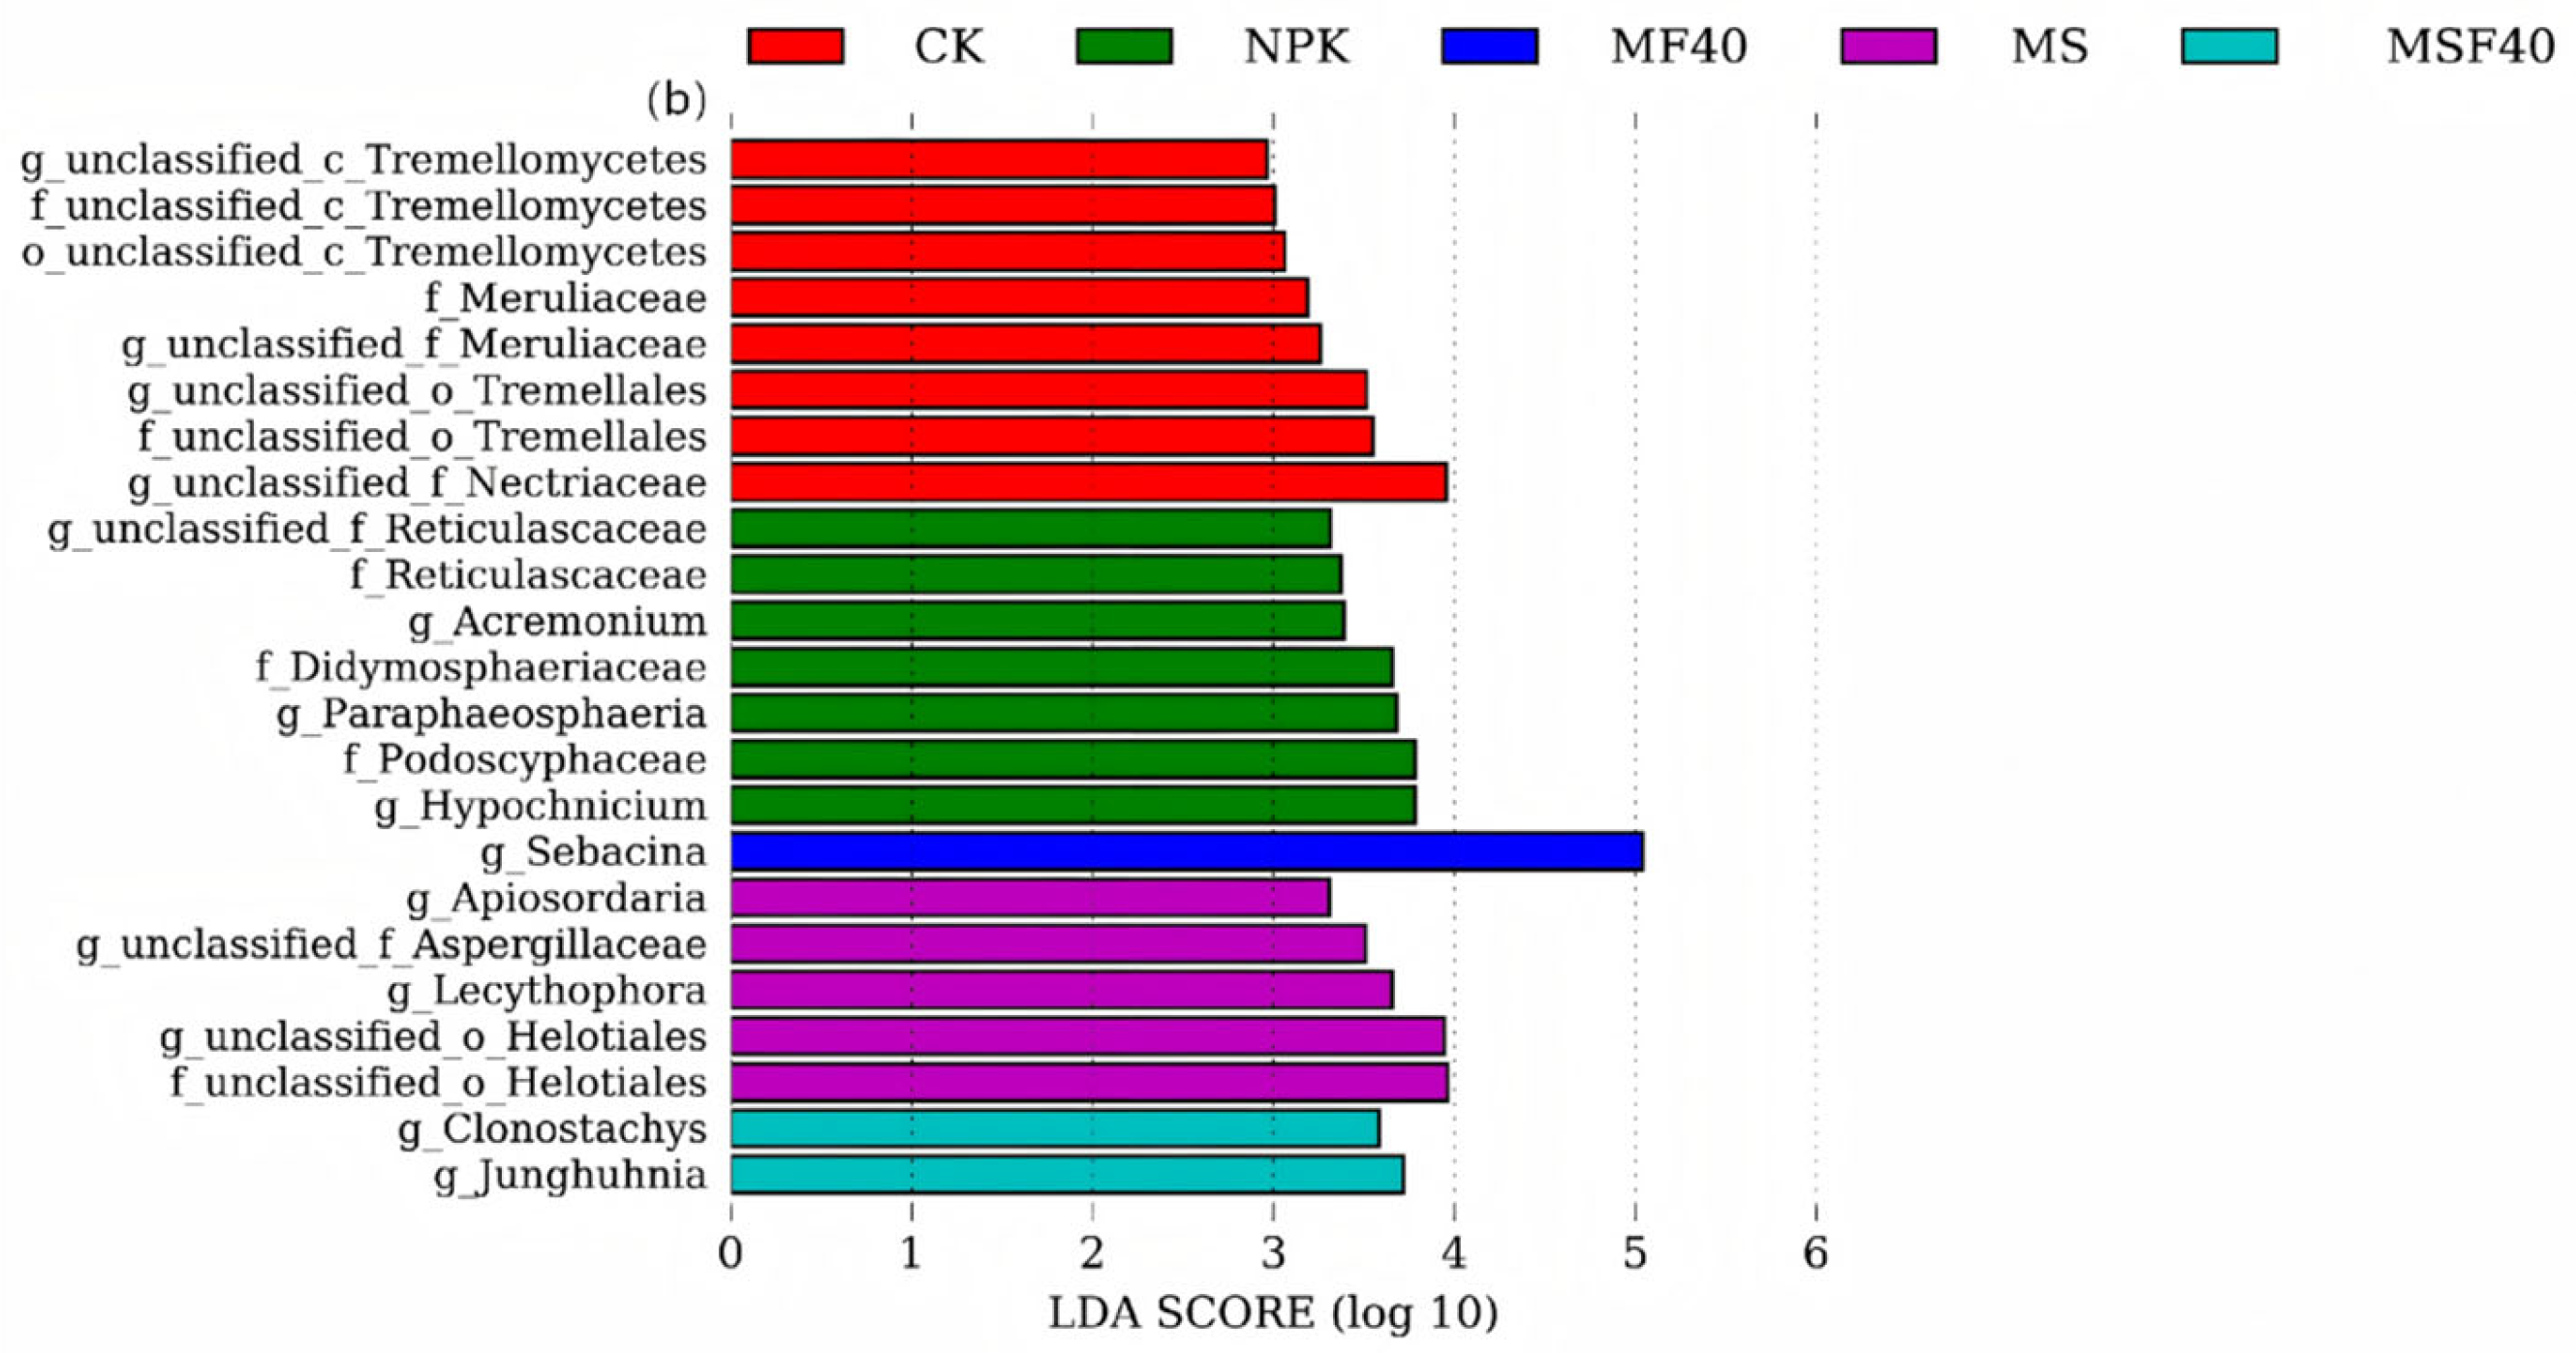
A total of 29 significantly differential fungal taxa were identified by LEfSe analysis (Figure 6b), with eight, seven, one, five, and two biomarkers detected in CK, NPK, MF40, MS, and MSF40 treatments, respectively. CK was significantly enriched by Meruliaceae; NPK was significantly enriched by Reticulascaceae, Acremonium, Didymosphaeriaceae, Paraphaeosphaeria, Podoscyphaceae, and Hypochnicium; only the genus Sebacina was enriched in MF40; MS was significantly enriched by Apiosordaria and Lecythophora, while MSF40 was significantly enriched by Clonostachys and Junghuhnia. These findings indicate that different organic material incorporation patterns can shape distinct soil microbial community structures.

3.6. Soil Greenhouse Gas-Related Functional Gene Abundances

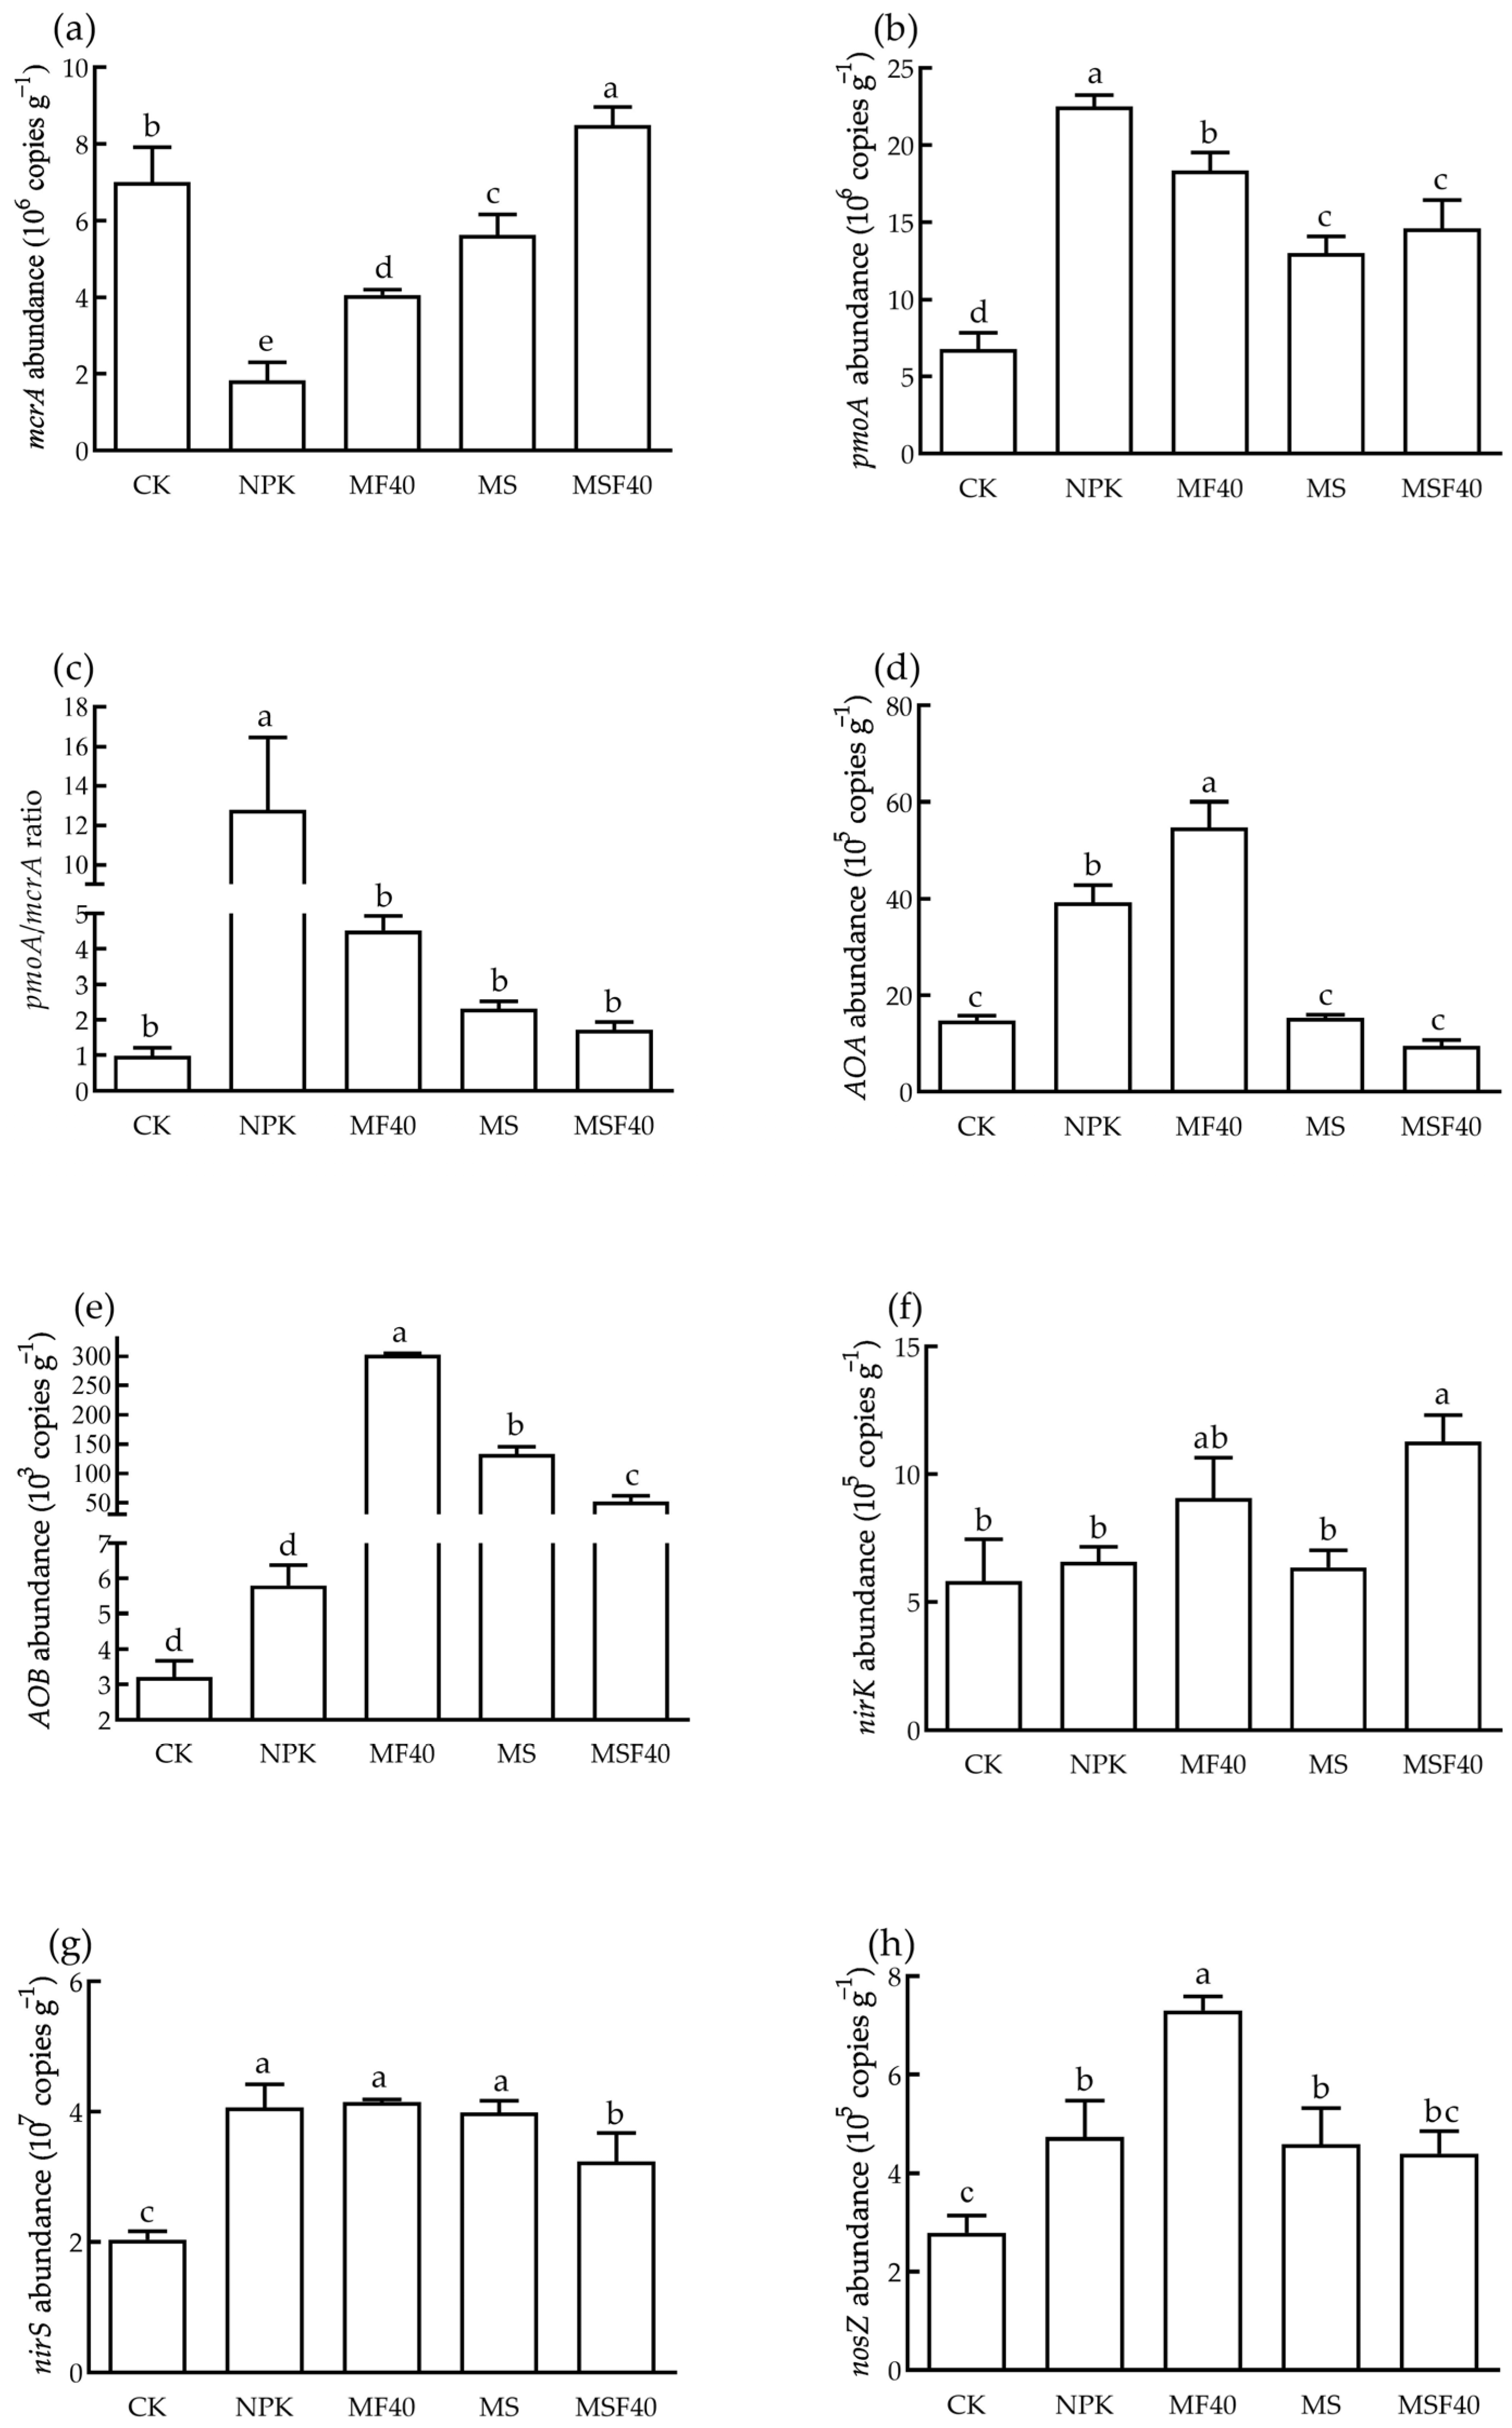
Different treatments significantly affected the abundance of GHG–related functional genes. Compared with NPK, the organic material return treatments (MF40, MS and MSF40) significantly increased the abundance of the mcrA gene by 120.98% ± 10.36%, 205.24% ± 18.24%, and 361.30% ± 29.27% (p < 0.05), respectively (Figure 7a). In contrast, the abundance of pmoA gene and pmoA/mcrA ratio were significantly decreased (p < 0.05) (Figure 7b,c). The abundance of AOA was significantly higher in MF40 than in NPK but lower in MS and MSF40 (Figure 7d) (p < 0.05). AOB abundances were significantly higher in all organic material return treatments than in NPK (p < 0.05) (Figure 7e). Regarding denitrification genes, the abundances of nirK and nirS genes in MF40 and MS showed no significant differences from those in NPK. MSF40 significantly increased the abundance of nirK gene but significantly decreased that of nirS in comparison with NPK treatment (p < 0.05) (Figure 7f,g). Compared with NPK, only MF40 significantly increased the abundance of nosZ gene (p < 0.05) (Figure 7h).

3.7. Relationships Among Soil Microbial Diversity, Functional Genes Abundances, Soil Properties and Greenhouse Gas Emissions

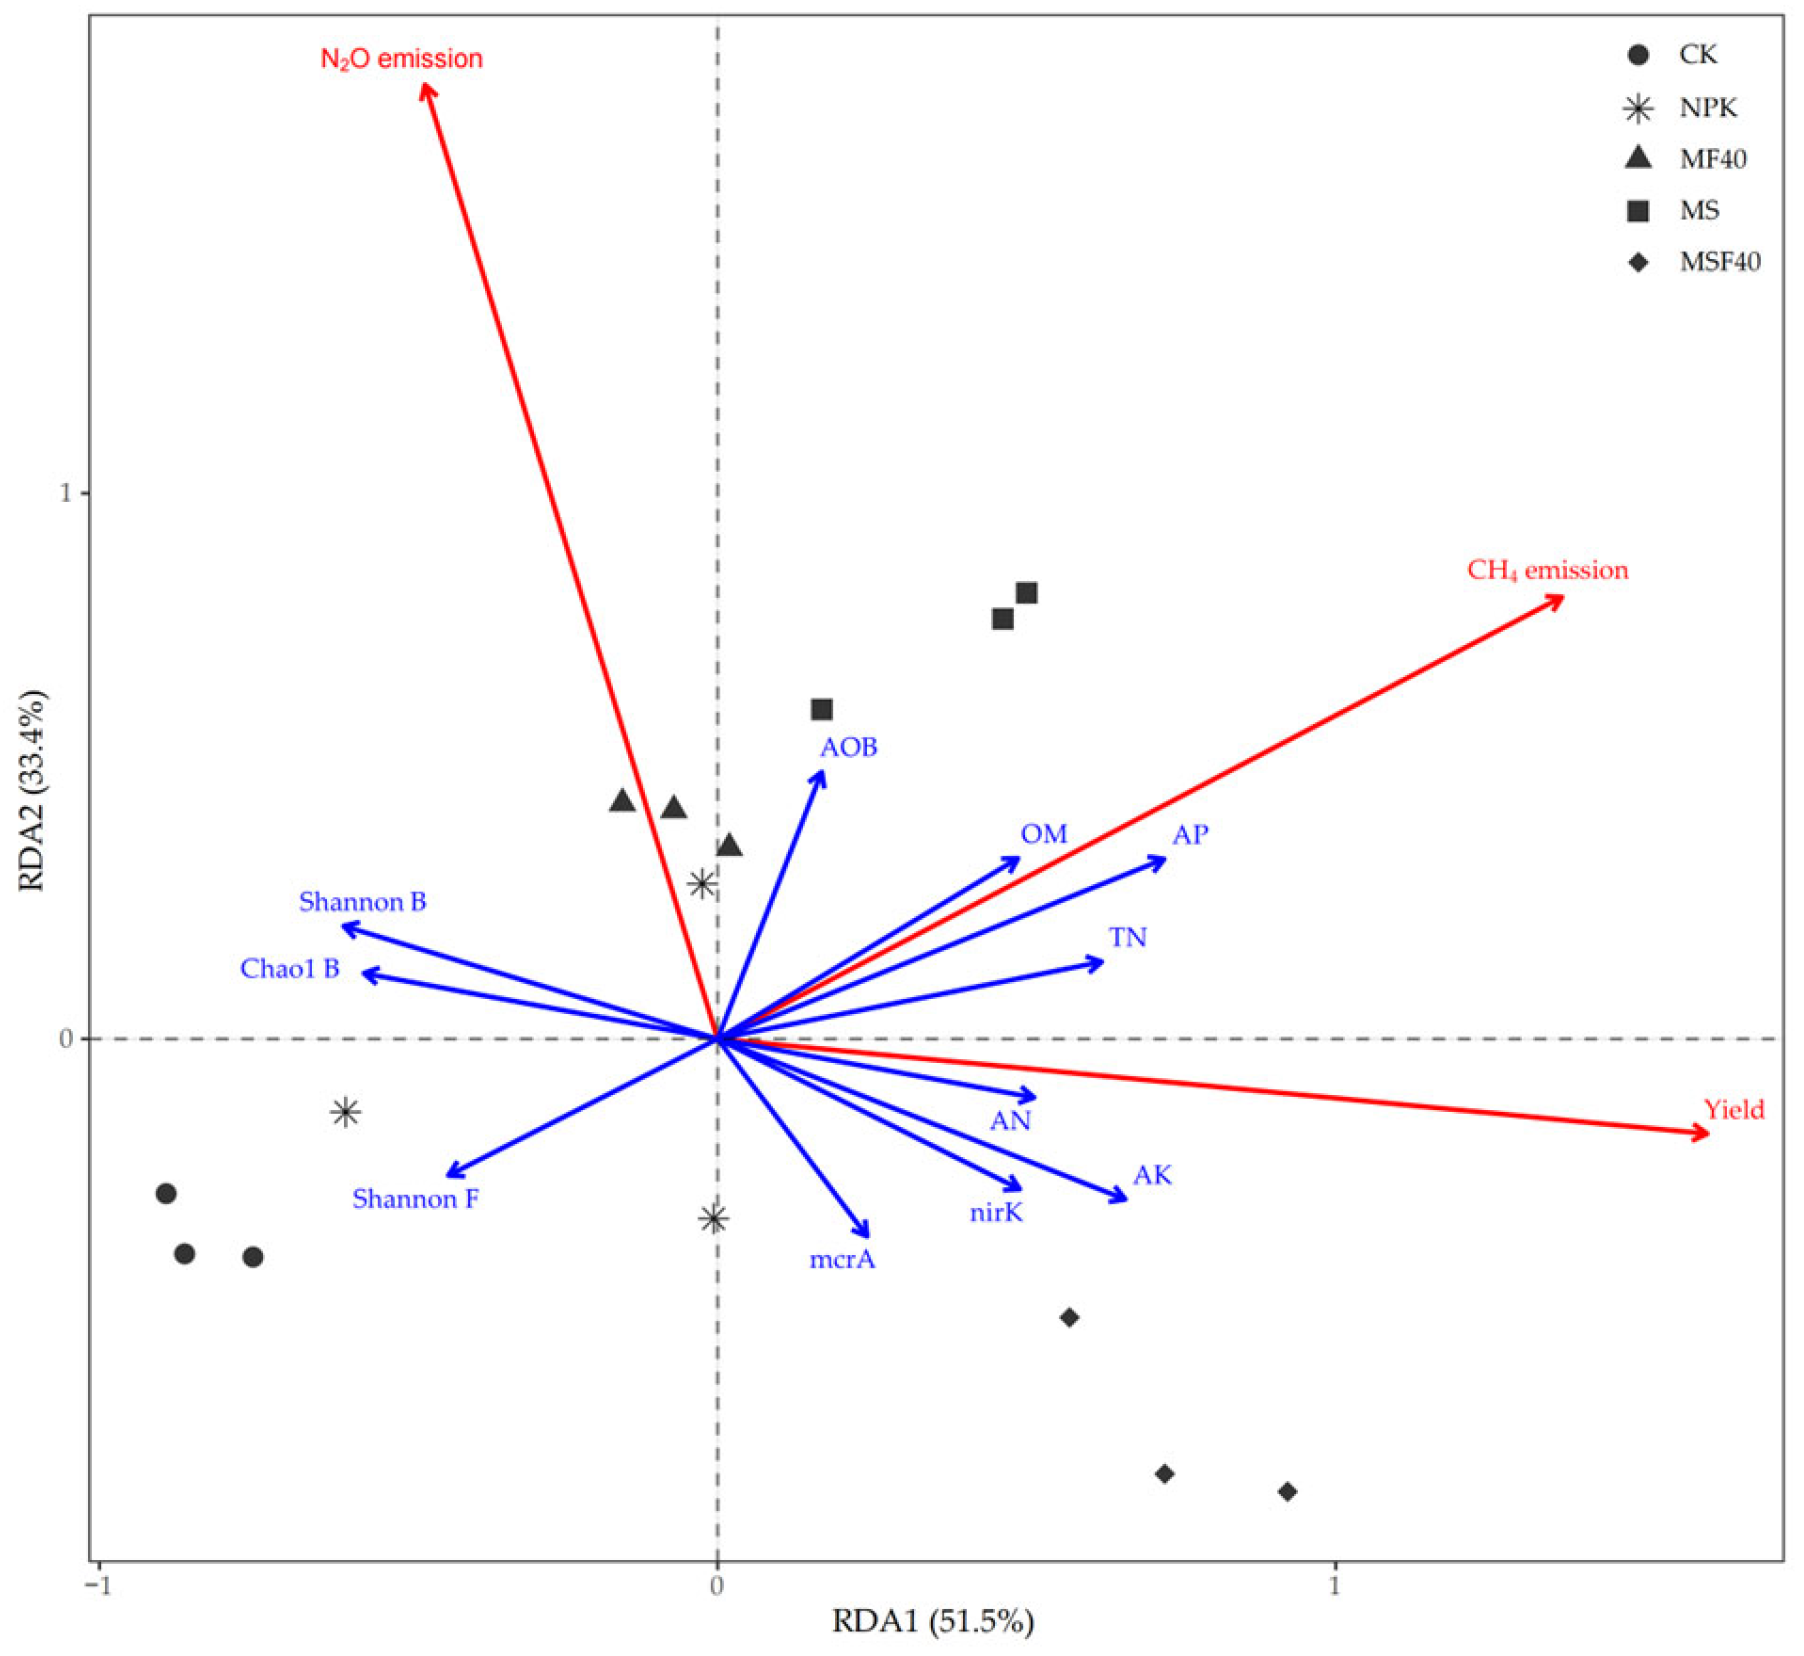
According to redundancy analysis (Figure 8), the first and second axes explained 51.5% and 33.4% of the variance of the response variables (GHG emission and yield). The overall model was statistically significant (p = 0.046), indicating that the combined effects of these factors on GHG emissions and yield were significant. The response variables were significantly correlated with soil OM (F = 8.65, p = 0.006), TN (F = 6.55, p = 0.014), and AP (F = 6.61, p = 0.021). Moreover, MS and MSF40 achieved both high rice yields and high CH4 emissions.

4. Discussion

4.1. Effects of Organic Material Return on Rice Yield and Soil Fertility

Paddy soil fertility is fundamental to achieve high rice yields, and fertilization is the primary strategy for improving soil quality and ensuring rice production. Owing to the high solubility of conventional chemical fertilizers, the rate of nutrient release per unit time far exceeds crop uptake, resulting in a seasonal nitrogen use efficiency of only 30% and phosphorus use efficiency of merely 25% [29]. In the present study, although the N and P inputs in NPK treatment were the highest (Table S1), soil TN and AP contents were significantly lower than those in treatments with organic material return (p < 0.05) (Table 1). Moreover, organic material return treatments significantly increased soil OM, TN, and AP contents (p < 0.05). Compared with NPK, MSF40 significantly increased AK content by 25.87% ± 2.15% (p < 0.05). These improvements were attributed to the low C/N ratio and rapid mineralization rate of CMV, which rapidly replenished available soil nitrogen and phosphorus. Crop straw, a natural nutrient reservoir, rich in N, P, K, and other mineral elements, gradually releases nutrients through microbial decomposition after incorporation, thereby providing a sustained and effective nutrient supply for subsequent crops [30]. A previous study also demonstrated that long-term rice–green-manure rotation significantly increased soil organic matter and total nitrogen contents [31]. The combined application of CMV and crop straw achieved complementary effects between readily available and slow-releasing nutrients. Meanwhile, humus formed during organic matter decomposition promotes soil aggregate formation and enhances soil nutrient retention capacity. Organic material return increased rice yield in this study, and MSF40 significantly increased the rice yield by 19.98% ± 1.57% compared with NPK (p < 0.05), a higher increase than those observed in MF40 and MS. On the one hand, MSF40 treatment had the highest nutrient inputs. On the other hand, the combined application of CMV and rice straw with 40% chemical fertilizer achieved synergistic enhancement of organic and inorganic nutrients. Chemical fertilizers provide readily available nutrients during critical rice growth stages, such as tillering and booting, preventing insufficient nutrient supply. The slow decomposition of green manure and rice straw continuously releases nutrients and improves soil physical properties (e.g., increasing porosity), which helps create aerated and permeable soil conditions conducive to root development [32]. Previous studies have shown that the incorporation of CMV and rice straw can increase rice biomass and ensure yield enhancement. Under the CMV and rice rotation system in southern Henan Province, China, 40% reduction in chemical nitrogen input improves the soil nitrogen and carbon pool storage, stimulates the absorption of N, P, K elements in the grain, keeps rice yield stable, and improves the agronomic efficiency and partial factor productivity of N fertilizer [33]. Zhou et al. [34] also reported that the incorporation of green manure and rice straw (FMS) achieved higher yield than chemical fertilizer (F), F plus green manure (FM) and F plus rice straw (FS). Moreover, FMS enhanced soil organic carbon (SOC), total nitrogen (TN) and available potassium (AK) levels by combining the advantage of FM in increasing total nitrogen and mineral nitrogen and the advantage of FS in increasing SOC and AK in comparison with F. Furthermore, no significant differences in soil pH were observed among all treatments, suggesting that long-term organic material incorporation did not alter the soil acidic environment. This management practice may therefore be suitable for acidic rice-growing regions of southern China.

4.2. Effects of Organic Material Return on Soil Microbial Communities

Soil microorganisms are the primary drivers of organic matter decomposition and nutrient cycling. In the present study, bacterial α-diversity was the highest in CK and significantly decreased after fertilization. Long-term chemical-only fertilization is known to modify soil nutrients and soil structure, which will induce selection pressure on the soil microorganism reservoir [35]. Xu et al. [36] also found a clear decrease in bacterial community richness and diversity in long-term chemical-only fertilization treatment in comparison with the control. Under nutrient-rich organic material treatments, bacterial taxa associated with element cycling were significantly enriched (Figure 6a) and they may occupy the ecological niches of rare genera, leading to reduced diversity. Compared with NPK, the organic material treatments showed no significant differences in bacterial α-diversity, and NMDS analysis revealed no distinct separation of bacterial community structures across all treatments. These results indicated that long-term organic material incorporation had no significant effect on the bacterial community structure in paddy soil, reflecting the relative stability of bacterial communities under organic material return practices.
In contrast, organic material return treatments significantly altered the fungal community structure. Fungi play a vital role in decomposing organic material such as lignocellulose [37]. Green manure and rice straw provide abundant carbon and energy sources for fungi, thereby substantially reshaping the fungal community structure in paddy soil. In our study, the relative abundance of Basidiomycota was significantly increased in the organic material return treatments. Most Basidiomycota are saprotrophic fungi that can secrete laccase, an enzyme capable of oxidizing lignin [38], making them the key taxa involved in soil carbon cycling following organic material incorporation. The genus Sebacina was significantly enriched in the organic material return treatments (especially MF40). As a mycorrhizal fungus, Sebacina can form a symbiont with rice, thereby promoting nutrient uptake and utilization by rice plants [39].
LEfSe analysis revealed the characteristic microbial taxa under each treatment, reflecting the directional selection of soil microorganisms by different management practices. MF40 significantly enriched the genus Oryzihumus and Ktedonobacteria. Oryzihumus can secrete extracellular enzymes such as lipase and α-glucosidase, which decompose soil organic macromolecules and promote carbon cycling and nutrient release. It also produces acid phosphatase, naphthol-AS-BI-phosphohydrolase, and other enzymes that hydrolyze organic phosphorus compounds, thereby enhancing soil phosphorus availability [40,41]. Ktedonobacteria, which exhibit an actinomycete-like morphology, possess diverse capabilities for carbohydrate utilization and degradation [42]. These findings were consistent with the significantly higher soil AP content observed in MF40 compared with NPK. The genus Zavarzinella and Polyangia were significantly enriched in MS. Zavarzinella is commonly found in acidic wetland environments [43] and secretes various extracellular enzymes, including acid and alkaline phosphatases, N-acetyl-β-glucosaminidase, and α-glucosidase [44], thereby participating in soil carbon, nitrogen, and phosphorus cycling and improving soil nutrient supply. Polyangia can produce multiple extracellular enzymes, including proteases, cellulases, and chitinases, which decompose complex organic matter such as plant residues in soil and accelerate the cycling of carbon, nitrogen, and phosphorus. Bacteroidales were significantly enriched in MSF40. Members of Bacteroidales secrete extracellular enzymes including cellulase and ligninase, which decompose plant residues, promote humus formation, and improve soil fertility.
Regarding the fungal community, MF40 treatment significantly enriched the genus Sebacina, a mycorrhizal fungal group that can form symbiotic relationships with rice to promote plant growth and stress tolerance [45]. MS was enriched with Apiosordaria and Lecythophora. As saprotrophic fungi, these microorganisms can degrade complex organic compounds, including cellulose and hemicellulose in the soil, thereby driving carbon cycling. MSF40 significantly enriched Clonostachys and Junghuhnia. Clonostachys acts as a saprotroph in various ecological niches, including soil and dead organic matter. Some species thrive in the rhizosphere, colonize root surfaces, and establish beneficial associations with plant hosts as endophytes [46]. Strains of Clonostachys produce multi-enzyme complexes with lignin- and cellulose-degrading activities and can also be used as biocontrol agents against fungal diseases such as gray mold and sheath blight [47]. Junghuhnia is a representative group of white-rot fungi capable of producing lignin-degrading enzymes; for instance, Junghuhnia separabilima exhibited high laccase production capacity [48].

4.3. Effects of Organic Material Return on Greenhouse Gas Emissions and Functional Genes

In our study, there was no significant difference in CH4 emission between MF40 and NPK (Table 2). Zhou et al. [49] demonstrated that a relatively high substitution rate of CMV could promote CH4 emission, and that improving rice productivity without increasing CH4 emission was feasible with an appropriate amount of green manure. However, CH4 emissions in MS and MSF40 were significantly higher than that in NPK (p < 0.05). The MS and MSF40 treatments markedly enriched many microbial taxa that are putatively involved in organic matter degradation, e.g., Zararzinella, Polyangia, Bacteroidales, Apiosordaria, Lecythophora, Clonostachys and Junghuhnia. Straw incorporation introduced a large amount of organic matter into the paddy soil. The microbial decomposition of these organic matter generated abundant carbon substrates which served as direct precursors for methanogenesis. Meanwhile, straw decomposition consumed soil oxygen and intensified the anaerobic environment, thereby promoting the proliferation of methanogens. In our study, MS and MSF40 exhibited significantly higher mcrA gene abundance but significantly lower pmoA gene abundance than NPK (p < 0.05), resulting in increased CH4 flux. Although MF40 involved the incorporation of CMV, this material mineralized rapidly before rice transplanting, leading to relatively low carbon input. Notably, CH4 emissions in MF40 showed no significant difference from that in NPK, which was consistent with the finding by Raheem et al. [50] that Chinese milk vetch did not increase CH4 emissions from paddy fields. This effect can be attributed to the low C/N ratio and fast mineralization rate of Chinese milk vetch, which hardly causes a persistent intensification of soil anaerobic conditions. Moreover, more ammonium derived from chemical fertilizer induces inhibition on methanotrophic activity. Ammonia competes with CH4 for the active site of methane monooxygenase [51]. Consequently, the actual methane oxidation efficiency in the NPK treatment may not reach the potential implied by its high pmoA/mcrA ratio. RDA showed that MS and MSF40 achieved high rice yields alongside high CH4 emissions, indicating that high rice yield may be accompanied by high GHG emissions. Moreover, MS exhibited the highest GWP and GWP per unit yield, suggesting that although this practice improved soil fertility and rice yield, the increase in CH4 emissions far exceeded the increase in grain yield, resulting in a significant GHG effect. Although the GWP of MSF40 was 21.59% ± 1.87% higher than that of NPK, its GWP per unit yield did not differ significantly from that of NPK, achieving the synergistic goal of high yield and low emission. This supports the conclusion by Ma that the combined application of Chinese milk vetch and straw with reduced chemical fertilizer can mitigate GHG emissions from paddy fields [52], indicating that the combined application of organic material with reduced chemical fertilizer can achieve a win–win situation for grain production and GHG mitigation. In the present study, cumulative N2O emissions were negative across all treatments, and the paddy field acted as N2O sink. This may be explained by the long-term flooded anaerobic environment, under which denitrifying bacteria further reduce soil N2O to N2, thereby greatly suppressing N2O emissions.
As important microbiological parameters, the relative abundance of specific cycling genes (mcrA and pmoA) correlates with methane flux in the soil [53]. In the present study, the application of green manure and straw significantly increased the abundances of methanogens (mcrA gene) and decreased the abundance of methanotrophs (pmoA gene) as well as pmoA/mcrA ratio compared with NPK (p < 0.05) (Figure 7a–c). The increased abundance of methanogens may be associated with organic residue application, which provides more dissolved organic carbon (DOC) directly. DOC can act as an energy source for anaerobic methanogenic microorganisms [54]. Furthermore, the application of organic residues can affect rice growth, leading to an increase in root exudates released into the soil system [55], which may favor an increase in methanogenic microorganisms. Zhou et al. [56] also found a higher abundance of mcrA gene copy number in the plant residue-treated soils even though the volume of crop residues applied was different from those in our study. For methanotrophs, organic material treatments resulted in lower abundances of pmoA genes than NPK treatment (Figure 7b). Decomposition of green manure and rice straw releases massive labile DOC, which fuels vigorous heterotrophic microbial respiration and rapidly depletes soil dissolved oxygen, forming persistent anoxic microsites unfavorable to aerobic methanotrophs. Straw addition treatments (MS and MSF40) aggravate oxygen depletion to a greater extent than MF40, leading to stronger suppression of pmoA abundance in MS and MSF40 treatments. Previous studies on paddy soils have demonstrated a higher abundance of nirS gene than nirK gene [57]. Consistent with these reports, the abundance of nirS gene in this study was 25.23 to 71.05 times greater than that of nirK gene, which aligns with the better adaptation of nirS gene to waterlogged environments compared with nirK gene [58]. However, compared with NPK treatment, no regular variations in the abundances of denitrifying communities were observed in the soils of organic amendments.

5. Conclusions

Long-term incorporation of green manure and/or rice straw significantly improved soil fertility and rice yields. Compared with NPK (chemical fertilizer), MSF40 (Chinese milk vetch plus straw return and 40% of NPK) exhibited the most pronounced enhancement effects on soil fertility and rice yield. Moreover, although MSF40 increased the total warming potential, it did not increase GWP (global warming potential)-yield compared to NPK. Cumulative N2O emissions were negative across all treatments, indicating that the paddy fields acted as N2O sink, with the strongest absorption capacity observed in MSF40. Therefore, MSF40 was considered the most suitable fertility regime in this study. Long-term green manure and straw incorporation significantly influenced soil fungal community structure rather than bacterial community structure. Meanwhile, organic material return promoted the significant enrichment of functional bacteria, like Oryzihumus, Ktedonobacteria, Zavarzinella, Polyangia, and Bacteroidales, and functional fungi such as Sebacina, Apiosordaria, Lecythophora, Clonostachys and Junghuhnia. These microorganisms are involved in soil element cycling and contributed to soil fertility. Organic material return significantly increased the abundance of methanogenic gene mcrA and decreased the abundance of methanotrophic gene pmoA. No correlations were observed between functional gene abundances and greenhouse gas emissions which indicates that higher gene abundance does not necessarily imply that all corresponding genes are simultaneously active. Owing to the relatively short experiment duration and soil microbial analysis only with one time, these findings should be interpreted with caution. Further research should focus on long-term field-level monitoring to determine whether these findings persist over time.

Supplementary Materials

The following supporting information can be downloaded at https://www.mdpi.com/article/10.3390/agriculture16171829/s1, Table S1: The input amounts of nutrients (kg ha−1) in different treatments; Table S2: Primers and PCR thermal conditions used in qPCR analysis [59,60,61,62,63].

Author Contributions

Conceptualization, Y.F.; methodology, H.Z. and L.C.; software, Y.Y.; validation, Y.F. and H.Z.; formal analysis, Y.F. and C.L.; investigation, L.C.; resources, Y.F.; data curation, C.L.; writing—original draft preparation, Y.F.; writing—review and editing, X.J. and Y.Y.; visualization, L.C.; supervision, X.J.; project administration, Y.F.; funding acquisition, Y.F. and X.J. All authors have read and agreed to the published version of the manuscript.

Funding

This research was funded by the Fujian Provincial Natural Science Foundation (2023J01360), the Scientific Research in the Public Interest of Fujian Province (2026R1069), East–West Cooperation Project of Fujian Academy of Agricultural Sciences (DKBF-2025-13), and Special Program for Outstanding Scientific and Technological Innovation Talents of Fujian Academy of Agricultural Sciences (YCZX202409).

Data Availability Statement

The raw data supporting the conclusions of this article will be made available by the authors on request.

Conflicts of Interest

The authors declare no conflicts of interest.

Abbreviations

The following abbreviations are used in this manuscript:
CMVChinese milk vetch
GHGGreenhouse gas

References

  1. Shakoor, A.; Shakoor, S.; Rehman, A.; Ashraf, F.; Abdullah, M.; Shahzad, S.M.; Farooq, T.H.; Ashraf, M.; Manzoor, M.A.; Altaf, M.M.; et al. Effect of animal manure, crop type, climate zone, and soil attributes on greenhouse gas emissions from agricultural soils—A global meta-analysis. J. Clean. Prod. 2021, 278, 124019. [Google Scholar] [CrossRef] [Scilit]
  2. Yuan, S.; Linquist, B.A.; Wilson, L.T.; Cassman, K.G.; Stuart, A.M.; Pede, V.; Miro, B.; Saito, K.; Agustiani, N.; Aristya, V.E.; et al. Sustainable intensification for a larger global rice bowl. Nat. Commun. 2021, 12, 7163. [Google Scholar] [CrossRef] [Scilit]
  3. Hasukawa, H.; Inoda, Y.; Toritsuka, S.; Toritsuka, S.; Sudo, S.; Oura, N.; Sano, T.; Shirato, Y.; Yanai, J. Effect of paddy-upland rotation system on the net greenhouse gas balance as the sum of methane and nitrous oxide emissions and soil carbon storage: A case in western Japan. Agriculture 2021, 11, 52. [Google Scholar] [CrossRef] [Scilit]
  4. FAO. FAOSTAT Emission Shares [DB/OL]; FAO: Rome, Italy, 2019. [Google Scholar]
  5. Carlson, K.M.; Gerber, J.S.; Mueller, N.D.; Herrero, M.; Macdonald, G.K.; Brauman, K.A.; Havlik, P.; O’Connell, C.S.; Johnson, J.A.; Saatchi, S.; et al. Greenhouse gas emissions intensity of global croplands. Nat. Clim. Change 2017, 7, 63–68. [Google Scholar] [CrossRef] [Scilit]
  6. Stein, L.Y. The long-term relationship between microbial metabolism and greenhouse gases. Trends Microbiol. 2020, 28, 500–511. [Google Scholar] [CrossRef] [Scilit]
  7. Chen, M.M.; Pan, H.; Sun, M.J.; He, W.; Wei, M.; Lou, Y.H.; Wang, H.; Yang, Q.G.; Feng, H.J.; Zhuge, Y.P. Nitrosospira cluster 3 lineage of AOB and nirK of Rhizobiales respectively dominated N2O emissions from nitrification and denitrification in organic and chemical N fertilizer treated soils. Ecol. Indic. 2021, 127, 107722. [Google Scholar] [CrossRef] [Scilit]
  8. Qian, H.Y.; Zhu, X.C.; Huang, S.; Linquist, B.; Kuzyakov, Y.; Wassmann, R.; Minamikawa, K.; Martinez-Eixarch, M.; Yan, X.Y.; Zhou, F.; et al. Greenhouse gas emissions and mitigation in rice agriculture. Nat. Rev. Earth Environ. 2023, 4, 716–732. [Google Scholar] [CrossRef] [Scilit]
  9. Han, X.; Xu, C.; Dungait, J.A.J.; Bol, R.; Wang, X.J.; Wu, W.L.; Meng, F.Q. Straw incorporation increases crop yield and soil organic carbon sequestration but varies under different natural conditions and farming practices in China: A system analysis. Biogeosciences 2018, 15, 1933–1946. [Google Scholar] [CrossRef] [Scilit]
  10. Zhuang, M.H.; Zhang, J.; Kong, Z.Y.; Fleming, R.M.; Zhang, C.Y.; Zhang, Z.Y. Potential environmental benefits of substituting nitrogen and phosphorus fertilizer with usable crop straw in China during 2000–2017. J. Clean. Prod. 2020, 267, 12212. [Google Scholar] [CrossRef] [Scilit]
  11. Chen, H.; Li, X.; Hu, F.; Shi, W. Soil nitrous oxide emissions following crop residue addition: A meta-analysis. Glob. Change Biol. 2013, 19, 2956–2964. [Google Scholar] [CrossRef] [Scilit]
  12. Young, M.D.; Ros, G.H.; de Vries, W. Impacts of agronomic measures on crop, soil, and environmental indicators: A review and synthesis of meta-analysis. Agric. Ecosyst. Environ. 2021, 319, 107551. [Google Scholar] [CrossRef] [Scilit]
  13. Zhou, J.W.; Xiang, Q.P.; Xiang, J.J.; Zhou, Z.Q.; Li, J.Q.; Xu, S.Q.; Zhou, J.H. Impact of biochar application on soil carbon sink 603 and greenhouse gas emissions of farmlands in China: A meta-analysis. J. Anhui Norm. Univ. (Nat. Sci.) 2024, 47, 422–429. (In Chinese) [Google Scholar] [CrossRef]
  14. Chai, K.B. The Effects of Straw Incorporation on Crop Yield and Greenhouse Gas Emissions Under Rice-Wheat Cropping System. Master’s Thesis, Huazhong Agricultural University, Wuhan, China, 2018. [Google Scholar]
  15. FAO. Food and Agriculture Organization [OL]; FAO: Rome, Italy, 2023. [Google Scholar]
  16. Gu, J.; Yang, J. Nitrogen (N) transformation in paddy rice field: Its effect on N uptake and relation to improved N management. Crop Environ. 2022, 1, 7–14. [Google Scholar] [CrossRef] [Scilit]
  17. Zou, Y.; Zhang, Y.; Cui, J.; Gao, J.; Guo, L.; Zhang, Q. Nitrogen fertilization application strategies improve yield of the rice cultivars with different yield types by regulating phytohormones. Sci. Rep. 2023, 13, 21803. [Google Scholar] [CrossRef] [Scilit]
  18. Dai, X.L.; Liu, Y.H.; Xun, J.P.; Zhao, Z.J.; Zuo, Y.M.; Gen, L.Y.; Zhang, J.E. Combined effects of straw return and reduced nitrogen fertilizer application on greenhouse gas emissions and nitrogen use efficiency in a coastal saline paddy field. Chin. J. Appl. Environ. Biol. 2023, 29, 994–1005. [Google Scholar] [CrossRef]
  19. Gao, S.J.; Zhou, G.P.; Chang, D.N.; Liang, H.; Nie, J.; Liao, Y.L.; Lu, Y.H.; Xu, C.X.; Liu, J.; Wu, J.; et al. Southern China can produce more high-quality rice with less N by green manuring. Resour. Conserv. Recy. 2023, 196, 107025. [Google Scholar] [CrossRef] [Scilit]
  20. Li, Z.; Ye, R.Q.; Sun, H.J.; Guo, W.H.; Luo, Z.H.; Liu, S.; Ren, R.F.; Zhang, W.; Gong, X.W.; Jiang, Y. Effects of intercropping green manure on spring maize grain yield and farmland soil quality in Northeast China. Acta Agron. Sin. 2026. Online first (In Chinese) [Google Scholar]
  21. Li, B.; Liang, F.; Wang, Y.; Cao, W.D.; Song, H.; Chen, J.; Guo, J. Magnitude and efficiency of straw return in building up soil organic carbon: A global synthesis integrating the impacts of agricultural managements and environmental conditions. Sci. Total Environ. 2023, 875, 162670. [Google Scholar] [CrossRef] [Scilit]
  22. Yu, K.; Xiao, S.Q.; Shen, Y.; Liu, S.W.; Zou, J.W. Enhanced carbon sinks following double-rice conversion to green-manure-rice cropping rotation systems under optimized nitrogen fertilization in southeast China. Agric. Ecosyst. Environ. 2024, 362, 108845. [Google Scholar] [CrossRef] [Scilit]
  23. Aljerib, Y.M.; Geng, M.J.; Xu, P.D.; Li, D.H.; Rana, M.S.; Zhu, Q. Equivalent incorporation of Chinese milk vetch and rice straw enhanced nutrient mineralization and reduced greenhouse gas emissions. Soil Sci. Plant Nutr. 2022, 68, 167–174. [Google Scholar] [CrossRef] [Scilit]
  24. Wang, W.; Sardans, J.; Lai, D.Y.F.; Wang, C.; Zeng, C.; Tong, C.; Liang, Y.; Peñuelas, J. Effects of steel slag 593 application on greenhouse gas emissions and crop yield over multiple growing seasons in a subtropical paddy field in 594 China. Field Crops Res. 2015, 171, 146–156. [Google Scholar] [CrossRef] [Scilit]
  25. IPCC. Climate Change 2021: The Physical Science Basis; Contribution of Working Group I to the Sixth Assessment Report of the Intergovernmental Panel on Climate Change; Cambridge University Press: Cambridge, UK, 2021. [Google Scholar] [CrossRef] [Scilit]
  26. Lu, R.K. Analytical Methods for Soil and Agrochemistry; China Agricultural Science and Technology Press: Beijing, China, 2000. (In Chinese) [Google Scholar]
  27. Zhang, M.Q.; Hou, L.P.; Zhu, Y.T.; Zhang, C.P.; Li, W.; Lai, X.X.; Yang, J.L.; Li, S.S.; Shu, H. Composition and distribution of bacterial communities and antibiotic resistance genes in fish of four mariculture systems. Environ. Pollut. 2022, 311, 119934. [Google Scholar] [CrossRef] [Scilit]
  28. Xu, M.L.; Dai, W.J.; Zhao, Z.L.; Zheng, J.T.; Huang, F.; Mei, C.; Huang, S.T.; Liu, C.F.; Wang, P.; Xiao, R.B. Effects of rice straw biochar on three different levels of Cd-contaminated soils: Cd availability, soil properties, and microbial communities. Chemosphere 2022, 301, 134551. [Google Scholar] [CrossRef] [Scilit]
  29. Bi, S.W.; Barinelli, V.; Sobkowicz, M.J. Degradable controlled release fertilizer composite prepared via extrusion: Fabrication, characterization and release mechanism. Polymers 2020, 12, 301. [Google Scholar] [CrossRef] [Scilit]
  30. Gao, Y.X.; Feng, H.J.; Zhang, M.; Shao, Y.Q.; Wang, J.Q.; Liu, Y.L.; Li, C.L. Straw returning combined with controlled-release nitrogen fertilizer affected organic carbon storage and crop yield by changing humic acid composition and aggregate distribution. J. Clean. Prod. 2023, 415, 137783. [Google Scholar] [CrossRef] [Scilit]
  31. Gao, J.S.; Xu, M.G.; Dong, C.H.; Huang, J.; Cao, W.D.; Zeng, X.B.; Wen, S.L.; Nie, J. Effects of long-term rice-rice-green manure cropping rotation on rice yield and soil fertility. Acta Agron. Sin. 2013, 39, 343–349. [Google Scholar] [CrossRef] [Scilit]
  32. Wei, X.F.; He, K.X.; Ma, B.L.; Guo, S.; Feng, C.C.; Liu, C.Y.; Ma, Y.Q.; Li, P.F. Straw return significantly enhances wheat yield in higher precipitation environment by promoting larger root diameters, wider xylem channels, and thinner root cortex. Plant Soil 2025, 514, 2217–2233. [Google Scholar] [CrossRef] [Scilit]
  33. Wang, H.; Zhang, L.; Chang, D.N.; Zhou, G.P.; Gao, S.J.; Zeng, N.H.; Nie, L.P.; Lv, Y.H.; Cao, W.D. Nutrient absorption and transport characteristics of rice under different nitrogen reduction ratios in a Chinese milk vetch and rice rotation system in southern Henan Province, China. J. Plant Nutr. Fertil. 2022, 28, 1194–1207. [Google Scholar] [CrossRef]
  34. Zhou, G.P.; Gao, S.J.; Lu, Y.H.; Liao, Y.L.; Nie, J.; Cao, W.D. Co-incorporation of green manure and rice straw improves rice production, soil chemical, biochemical and microbiological properties in a typical paddy field in southern China. Soil Tillage Res. 2020, 197, 104499. [Google Scholar] [CrossRef] [Scilit]
  35. Geisseler, D.; Scow, K.M. Long-term effects of mineral fertilizers on soil microorganisms- a review. Soil Biol. Biochem. 2014, 75, 54–63. [Google Scholar] [CrossRef] [Scilit]
  36. Xu, Q.C.; Ling, N.; Chen, H.; Duan, Y.H.; Wang, S.; Shen, Q.R.; Vandenkoornhyse, P. Long-term chemical-only fertilization induces a diversity decline and deep selection on the soil bacteria. mSystems 2020, 5, e00337-20. [Google Scholar] [CrossRef] [Scilit]
  37. Xiong, Y.; Yang, F.Y.; Ni, K.K.; Xu, Q.F. Progress in application of microorganisms in lignocellulosic degradation. J. Grassl. Forage Sci. 2019, 5, 1–7. (In Chinese) [Google Scholar] [CrossRef]
  38. Molpeceres, G.; Aza, P.; Ayuso-Fernández, I.; Padilla, G.; Ruiz-Dueñas, F.J.; Camarero, S. Deciphering the distribution and types of multicopper oxidases in Basidiomycota fungi. Mol. Phylogenet. Evol. 2025, 206, 108310. [Google Scholar] [CrossRef] [Scilit]
  39. Wang, X.H.; Wu, Y.T.; Zhao, W.Q.; Yin, H.J. The rhizosphere and hyphosphere differentially regulate microbiomes and nutrient cycling within soil aggregates in an ectomycorrhiza-dominated forest. Geoderma 2025, 463, 117570. [Google Scholar] [CrossRef] [Scilit]
  40. Lim, J.M.; Kim, S.J.; Hamada, M.; Ahn, J.H.; Weon, H.Y.; Suzuki, K.I.; Ahn, T.Y.; Kwon, S.W. Oryzihumus terrae sp. nov., isolated from soil and emended description of the genus Oryzihumus. Int. J. Syst. Evol. Microbiol. 2014, 64, 2395–2399. [Google Scholar] [CrossRef] [Scilit]
  41. Kageyama, A.; Takahashi, Y.; Seki, T.; Tomoda, H.; Õmura, S. Oryzihumus leptocrescens gen. nov., sp. nov. Int. J. Syst. Evol. Microbiol. 2005, 55, 2555–2559. [Google Scholar] [CrossRef] [Scilit]
  42. Zheng, Y.; Maruoka, M.; Nanatani, K.; Hidaka, M.; Abe, N.; Kaneko, J.; Sakai, Y.; Abe, K.; Yokota, A.; Yabe, S. High cellulolytic potential of the Ktedonobacteria lineage revealed by genome-wide analysis of CAZyme. J. Biosci. Bioeng. 2021, 131, 622–630. [Google Scholar] [CrossRef] [Scilit]
  43. Dedysh, S.N.; Ivanova, A.A. Planctomycetes in boreal and subarctic wetlands: Diversity patterns and potential ecological functions. FEMS Microbiol. Ecol. 2019, 95, fiy227. [Google Scholar] [CrossRef] [Scilit]
  44. Dedysh, S.N.; Kulichevskaya, I.S. Zavarzinella . In Bergey’s Manual of Systematics of Archaea and Bacteria; Wiley: Hoboken, NJ, USA, 2020. [Google Scholar] [CrossRef] [Scilit]
  45. Sharma, M.; Schmid, M.; Rothballer, M.; Hause, G.; Zuccaro, A.; Imani, J.; Kämpfer, P.; Domann, E.; Schäfer, P.; Hartmann, A.; et al. Detection and identification of bacteria intimately associated with fungi of the order Sebacinales. Cell. Microbiol. 2008, 10, 2235–2246. [Google Scholar] [CrossRef] [Scilit]
  46. Piombo, E.; Guaschino, M.; Jensen, D.F.; Karlsson, M.; Dubey, M. Insights into the ecological generalist lifestyle of Clonostachy fungi through analysis of their predicted secretomes. Front. Microbiol. 2023, 14, 112673. [Google Scholar] [CrossRef] [Scilit]
  47. Wang, G.H.; Fan, J.; Liu, H.Q. Research progress, application and prospects of Clonostachys fungi. Acta Phytopathol. Sin. 2024, 54, 225–234. (In Chinese) [Google Scholar] [CrossRef]
  48. Vares, T.; Lundell, T.K.; Hatakka, A.I. Novel heme-containing enzyme possibly involved in lignin degradation by the white-rot fungus Junghuhnia separabilima. FEMS Microbiol. Lett. 1992, 99, 53–58. [Google Scholar] [CrossRef]
  49. Zhou, N.N.; Jiang, T.F.; Wang, J.J.; Chen, Y.J.; Yang, W.B.; Tang, S.; Han, S.; Wang, Y. Optimizing the incorporated amount of Chinese milk vetch (Astragalus sinicus L.) to improve rice productivity without increasing CH4 and N2O emissions. Agronomy 2023, 13, 1636. [Google Scholar] [CrossRef] [Scilit]
  50. Raheem, A.; Wang, T.S.; Huang, J.; Danso, F.; Bankole, O.O.; Deng, A.X.; Gao, J.S.; Zhang, J.; Zhang, W.J. Leguminous green manure mitigates methane emissions in paddy field by regulating acetoclastic and hydrogenotrophic methanogens. Eur. J. Soil Biol. 2022, 108, 103380. [Google Scholar] [CrossRef] [Scilit]
  51. Bédard, C.; Knowles, R. Physiology, biochemistry, and specific inhibitors of CH4, NH4+, and CO oxidation by methanotrophs and nitrifiers. Microbiol. Rev. 1989, 53, 68–84. [Google Scholar] [CrossRef]
  52. Ma, T.T. Effects of Chinese Milk Vetch and Rice Straw Returning on Greenhouse Gas Emissions and Nitrogen and Phosphorus Losses in Paddy Fields. Master’s Thesis, Anhui University, Wuhu, China, 2024. [Google Scholar]
  53. Nwokolo, N.L.; Enebe, M.C. Methane production and oxidation- A review on the pmoA and mcrA gene abundances for understanding the functional potentials of agricultural soils. Pedosphere 2025, 35, 161–181. [Google Scholar] [CrossRef] [Scilit]
  54. Thauer, R.K.; Kaster, A.K.; Seedorf, H.; Buckel, W.; Hedderich, R. Methanogenic archaea: Ecologically relevant differences in energy conservation. Nat. Rev. Microbiol. 2008, 6, 579–591. [Google Scholar] [CrossRef] [Scilit]
  55. Inubushi, K.; Cheng, W.; Aonuma, S.; Hoque, M.M.; Kobayashi, K.; Miura, S.; Kim, H.Y.; Okada, M. Effects of free-air CO2 enrichment (FACE) on CH4 emission from a rice paddy field. Glob. Change Biol. 2003, 9, 1458–1464. [Google Scholar] [CrossRef] [Scilit]
  56. Zhou, G.P.; Gao, S.J.; Xu, C.X.; Zeng, N.H.; Rees, R.M.; Cao, W.D. Co-incorporation of Chinese milk vetch (Astragalus sinicus L.) and rice (Oryza sativa L.) straw minimizes CH4 emissions by changing the methanogenic and methanotrophic communities in a paddy soil. Eur. J. Soil Sci. 2020, 71, 924–939. [Google Scholar] [CrossRef] [Scilit]
  57. Zhang, X.; Dang, D.; Zheng, L.S.; Wu, L.Y.; Wu, Y.; Li, H.R.; Yu, H.R. Effect of Ag nanoparticles on denitrification and microbial community in a paddy soil. Front. Microbiol. 2021, 12, 785439. [Google Scholar] [CrossRef] [Scilit]
  58. Petersen, D.G.; Blazewicz, S.J.; Firestone, M.; Herman, D.J.; Turetsky, M.; Waldrop, M. Abundance of microbial genes associated with nitrogen cycling as indices of biogeochemical process rates across a vegetation gradient in Alaska. Environ. Microbiol. 2012, 14, 993–1008. [Google Scholar] [CrossRef] [Scilit]
  59. Francis, C.A.; Roberts, K.J.; Beman, J.M.; Santoro, A.E.; Oakley, B.B. Ubiquity and diversity of ammonia-oxidizing archaea in water columns and sediments of the ocean. Proc. Natl. Acad. Sci. USA 2005, 102, 14683–14688. [Google Scholar] [CrossRef] [Scilit]
  60. Feng, Y.Z.; Xu, Y.P.; Yu, Y.C.; Xie, Z.B.; Lin, X.G. Mechanisms of biochar decreasing methane emission from Chinese paddy soils. Soil Biol. Biochem. 2012, 46, 80–88. [Google Scholar] [CrossRef] [Scilit]
  61. Jones, C.M.; Graf, D.R.H.; Bru, D.; Philippot, L.; Hallin, S. The unaccounted yet abundant nitrous oxide-reducing microbial community: A potential nitrous oxide sink. ISME J. 2013, 7, 417–426. [Google Scholar] [CrossRef] [Scilit]
  62. Rotthauwe, J.H.; Witzel, K.P.; Liesack, W. The ammonia monooxygenase structural gene amoA as a functional marker: Molecular fine-scale analysis of natural ammonia-oxidizing populations. Appl. Environ. Microbiol. 1997, 63, 4704–4712. [Google Scholar] [CrossRef] [Scilit]
  63. Throbäck, I.N.; Enwall, K.; Jarvis, A.; Hallin, S. Reassessing PCR primers targeting nirS, nirK and nosZ genes for community surveys of denitrifying bacteria with DGGE. FEMS Microbiol. Ecol. 2024, 49, 401–417. [Google Scholar] [CrossRef] [Scilit]
Figure 1. Rice yields under different treatments. CK, no chemical fertilizer, no Chinese milk vetch (CMV, Astragalus sinicus L.) and no straw; NPK, chemical fertilizer alone; MF40, CMV plus 40% of NPK; MS, CMV plus rice straw return; MSF40, CMV plus straw return and 40% of NPK. Different letters indicate significant differences at p < 0.05. The error bars represent the standard deviations.
Agriculture 16 01829 g001
Figure 2. Dynamic variations in CH4 (a) and N2O (b) emissions under different treatments. CK, no chemical fertilizer, no Chinese milk vetch (CMV, Astragalus sinicus L.) and no straw; NPK, chemical fertilizer alone; MF40, CMV plus 40% of NPK; MS, CMV plus rice straw return; MSF40, CMV plus straw return and 40% of NPK. The error bars represent the standard deviations.
Agriculture 16 01829 g002aAgriculture 16 01829 g002b
Figure 3. Soil bacterial (a,b) and fungal (c,d) α-diversity under different treatments. CK, no chemical fertilizer, no Chinese milk vetch (CMV, Astragalus sinicus L.) and no straw; NPK, chemical fertilizer alone; MF40, CMV plus 40% of NPK; MS, CMV plus rice straw return; MSF40, CMV plus straw return and 40% of NPK. Different letters indicate significant differences at p < 0.05. The error bars represent the standard deviations.
Agriculture 16 01829 g003
Figure 4. Non-metric multidemensional scaling analysis of soil bacterial (a) and fungal (b) community under different fertilization treatments. CK, no chemical fertilizer, no Chinese milk vetch (CMV, Astragalus sinicus L.) and no straw; NPK, chemical fertilizer alone; MF40, CMV plus 40% of NPK; MS, CMV plus rice straw return; MSF40, CMV plus straw return and 40% of NPK.
Agriculture 16 01829 g004
Figure 5. Soil bacterial ((a), phylum; (b), genus) and fungal ((c), phylum; (d), genus) community compositions under different treatments. CK, no chemical fertilizer, no Chinese milk vetch (CMV, Astragalus sinicus L.) and no straw; NPK, chemical fertilizer alone; MF40, CMV plus 40% of NPK; MS, CMV plus rice straw return; MSF40, CMV plus straw return and 40% of NPK.
Agriculture 16 01829 g005
Figure 6. LEfSe analysis of soil bacterial (a) and fungal (b) communities under different treatments. CK, no chemical fertilizer, no Chinese milk vetch (CMV, Astragalus sinicus L.) and no straw; NPK, chemical fertilizer alone; MF40, CMV plus 40% of NPK; MS, CMV plus rice straw return; MSF40, CMV plus straw return and 40% of NPK.
Agriculture 16 01829 g006aAgriculture 16 01829 g006b
Figure 7. Effects of long-term organic amendment return on the mcrA (a), pmoA (b), pmoA/mcrA ratio (c), AOA (d), AOB (e), nirK (f), nirS (g) and nosZ (h). CK, no chemical fertilizer, no Chinese milk vetch (CMV, Astragalus sinicus L.) and no straw; NPK, chemical fertilizer alone; MF40, CMV plus 40% of NPK; MS, CMV plus rice straw return; MSF40, CMV plus straw return and 40% of NPK. Different letters indicate significant differences at p < 0.05. The error bars represent the standard deviations.
Agriculture 16 01829 g007
Figure 8. Redundancy analysis (RDA) of the microbial diversity, functional genes, greenhouse gas emissions and soil properties. CK, no chemical fertilizer, no Chinese milk vetch (CMV, Astragalus sinicus L.) and no straw; NPK, chemical fertilizer alone; MF40, CMV plus 40% of NPK; MS, CMV plus rice straw return; MSF40, CMV plus straw return and 40% of NPK. OM: organic matter; TN: total nitrogen; AN: alkali-hydrolyzable nitrogen; AP: available phosphorus; AK: available potassium; Shannon B: bacterial Shannon index; Chao1 B: bacterial Chao1 index; Shannon F: fungal Shannon index. Red arrows indicate response variables, and blue arrows indicate explanatory variables.
Agriculture 16 01829 g008
Table 1. Soil physicochemical properties under different treatments.
TreatmentCKNPKMF40MSMSF40
SOM (g kg−1)27.07 ± 0.12 bc25.93 ± 0.70 c29.07 ± 1.00 ab30.37 ± 2.21 a29.13 ± 0.32 ab
TN (g kg−1)1.41 ± 0.01 b1.35 ± 0.01 c1.56 ± 0.04 a1.56 ± 0.14 a1.59 ± 0.01 a
AN (mg kg−1)138.67 ± 4.73 b142.33 ± 9.50 ab145.00 ± 13.11 ab151.33 ± 7.02 ab158.33 ± 15.04 a
AP (mg kg−1)6.44 ± 0.15 c7.32 ± 0.26 b8.50 ± 0.50 a8.60 ± 0.53 a8.66 ± 0.26 a
AK (mg kg−1)76.00 ± 9.54 b81.03 ± 7.03 b81.67 ± 7.77 b87.33 ± 6.03 ab102.00 ± 7.81 a
pH5.05 ± 0.08 a5.06 ± 0.10 a5.03 ± 0.08 a5.10 ± 0.11 a5.02 ± 0.14 a
CK, no chemical fertilizer, no Chinese milk vetch (CMV, Astragalus sinicus L.) and no straw; NPK, chemical fertilizer alone; MF40, CMV plus 40% of NPK; MS, CMV plus rice straw return; MSF40, CMV plus straw return and 40% of NPK. The data are presented as the mean ± standard deviation (n = 3). Different letters indicate significant differences at p < 0.05. SOM: soil organic matter; TN: total nitrogen; AN: alkali-hydrolyzable nitrogen; AP: available phosphorus; AK: available potassium.
Table 2. Cumulative emissions of greenhouse gas in paddy field under different fertilization treatments.
TreatmentCumulative Emission of
CH4 (kg ha−1)
Cumulative Emission of N2O (kg ha−1) aGWP
(t CO2-eq ha−1)
GWP-Yield
(kg CO2-eq kg−1 Yield)
CK311.56 ± 3.81 d−5.75 ± 0.26 b7.71 ± 0.08 d1.24 ± 0.04 c
NPK1157.42 ± 104.73 c−5.74 ± 0.22 b32.93 ± 3.43 c5.04 ± 0.76 b
MF401109.77 ± 45.67 c−3.56 ± 0.14 a32.10 ± 1.35 c4.50 ± 0.23 b
MS2007.58 ± 70.79 a−3.61 ± 0.51 a58.84 ± 2.18 a8.30 ± 0.33 a
MSF401421.91 ± 44.11 b−8.54 ± 0.64 c40.04 ± 1.38 b5.08 ± 0.27 b
CK, no chemical fertilizer, no Chinese milk vetch (CMV, Astragalus sinicus L.) and no straw; NPK, chemical fertilizer alone; MF40, CMV plus 40% of NPK; MS, CMV plus rice straw return; MSF40, CMV plus straw return and 40% of NPK. Different letters indicate significant differences at p < 0.05. a negative value of cumulative N2O emission means the uptake of N2O by soil. The data are presented as the mean ± standard deviation (n = 3). GWP: global warming potential; GWP-yield: yield-scaled global warming potential.
Disclaimer/Publisher’s Note: The statements, opinions and data contained in all publications are solely those of the individual author(s) and contributor(s) and not of MDPI and/or the editor(s). MDPI and/or the editor(s) disclaim responsibility for any injury to people or property resulting from any ideas, methods, instructions or products referred to in the content.