Article

Price Dispersion and Income Risk at Greenhouse Vegetable Auctions in Ierapetra, Crete: Implications for Smallholder and Family-Farm Resilience

by
Angelos Liontakis
1,*,
Alexandra Sintori
2 and
Konstantinos Tsiboukas
3
1
Department of Agribusiness and Supply Chain Management, Agricultural University of Athens, 32200 Theves, Greece
2
Agricultural Economics Research Institute (AGR.E.R.I), Hellenic Agricultural Organization-DIMITRA, 11145 Athens, Greece
3
Department of Agricultural Economics and Rural Development, Agricultural University of Athens, 11855 Athens, Greece
*
Author to whom correspondence should be addressed.
Agriculture 2026, 16(17), 1830; https://doi.org/10.3390/agriculture16171830
Submission received: 22 July 2026 / Revised: 19 August 2026 / Accepted: 24 August 2026 / Published: 26 August 2026
(This article belongs to the Special Issue Sustainability and Resilience of Smallholder and Family Farms)

Abstract

Smallholder and family farms underpin Mediterranean horticulture, yet their incomes are exposed to price risk because they sell as price-takers in opaque channels. In Ierapetra, Crete, greenhouse vegetables are traded at several independent physical auctions. This study quantifies within-venue price risk using 6281 product-day observations (daily minimum, maximum and mean prices) for six greenhouse products, November 2019–May 2026. Four indicators are computed per product-day: within-day relative spread, daily price change, coefficient of variation and a downside income-at-risk gap. Dispersion is compared across products against a reference band built from the within-day spreads of the three higher-priced products (p25–p75), a common descriptive yardstick drawn from the data themselves. On the same day, the highest price exceeds the lowest by 23% on average, and by above 100% on extreme days. A low-end seller earns 16–19% below the daily mean for commodities. The contrasts survive restriction to actively traded days and comparison at equal price levels. All series come from a single operator: the analysis therefore documents dispersion within one venue, and the contribution of fragmentation across venues remains open. Price risk is treated as a determinant of farm resilience rather than a measure of it; a unified, transparent digital auction is assessed as a design-conditional adaptation, its effect hinging on buyer participation, product representation and grading.

1. Introduction

Smallholder and family farms remain central to food security, rural employment and the cultural identity of rural areas [1,2,3]. Yet these farms face intensifying pressures from climate change, market volatility, resource degradation and socio-demographic change [4,5]. Among these pressures, exposure to volatile and opaque farm-gate prices is one of the most direct threats to farm-income stability, and hence to the economic resilience of small producers. Such producers typically operate as price-takers, with weak bargaining power relative to the concentrated downstream actors (wholesalers, exporters and retailers) that set the terms of trade.
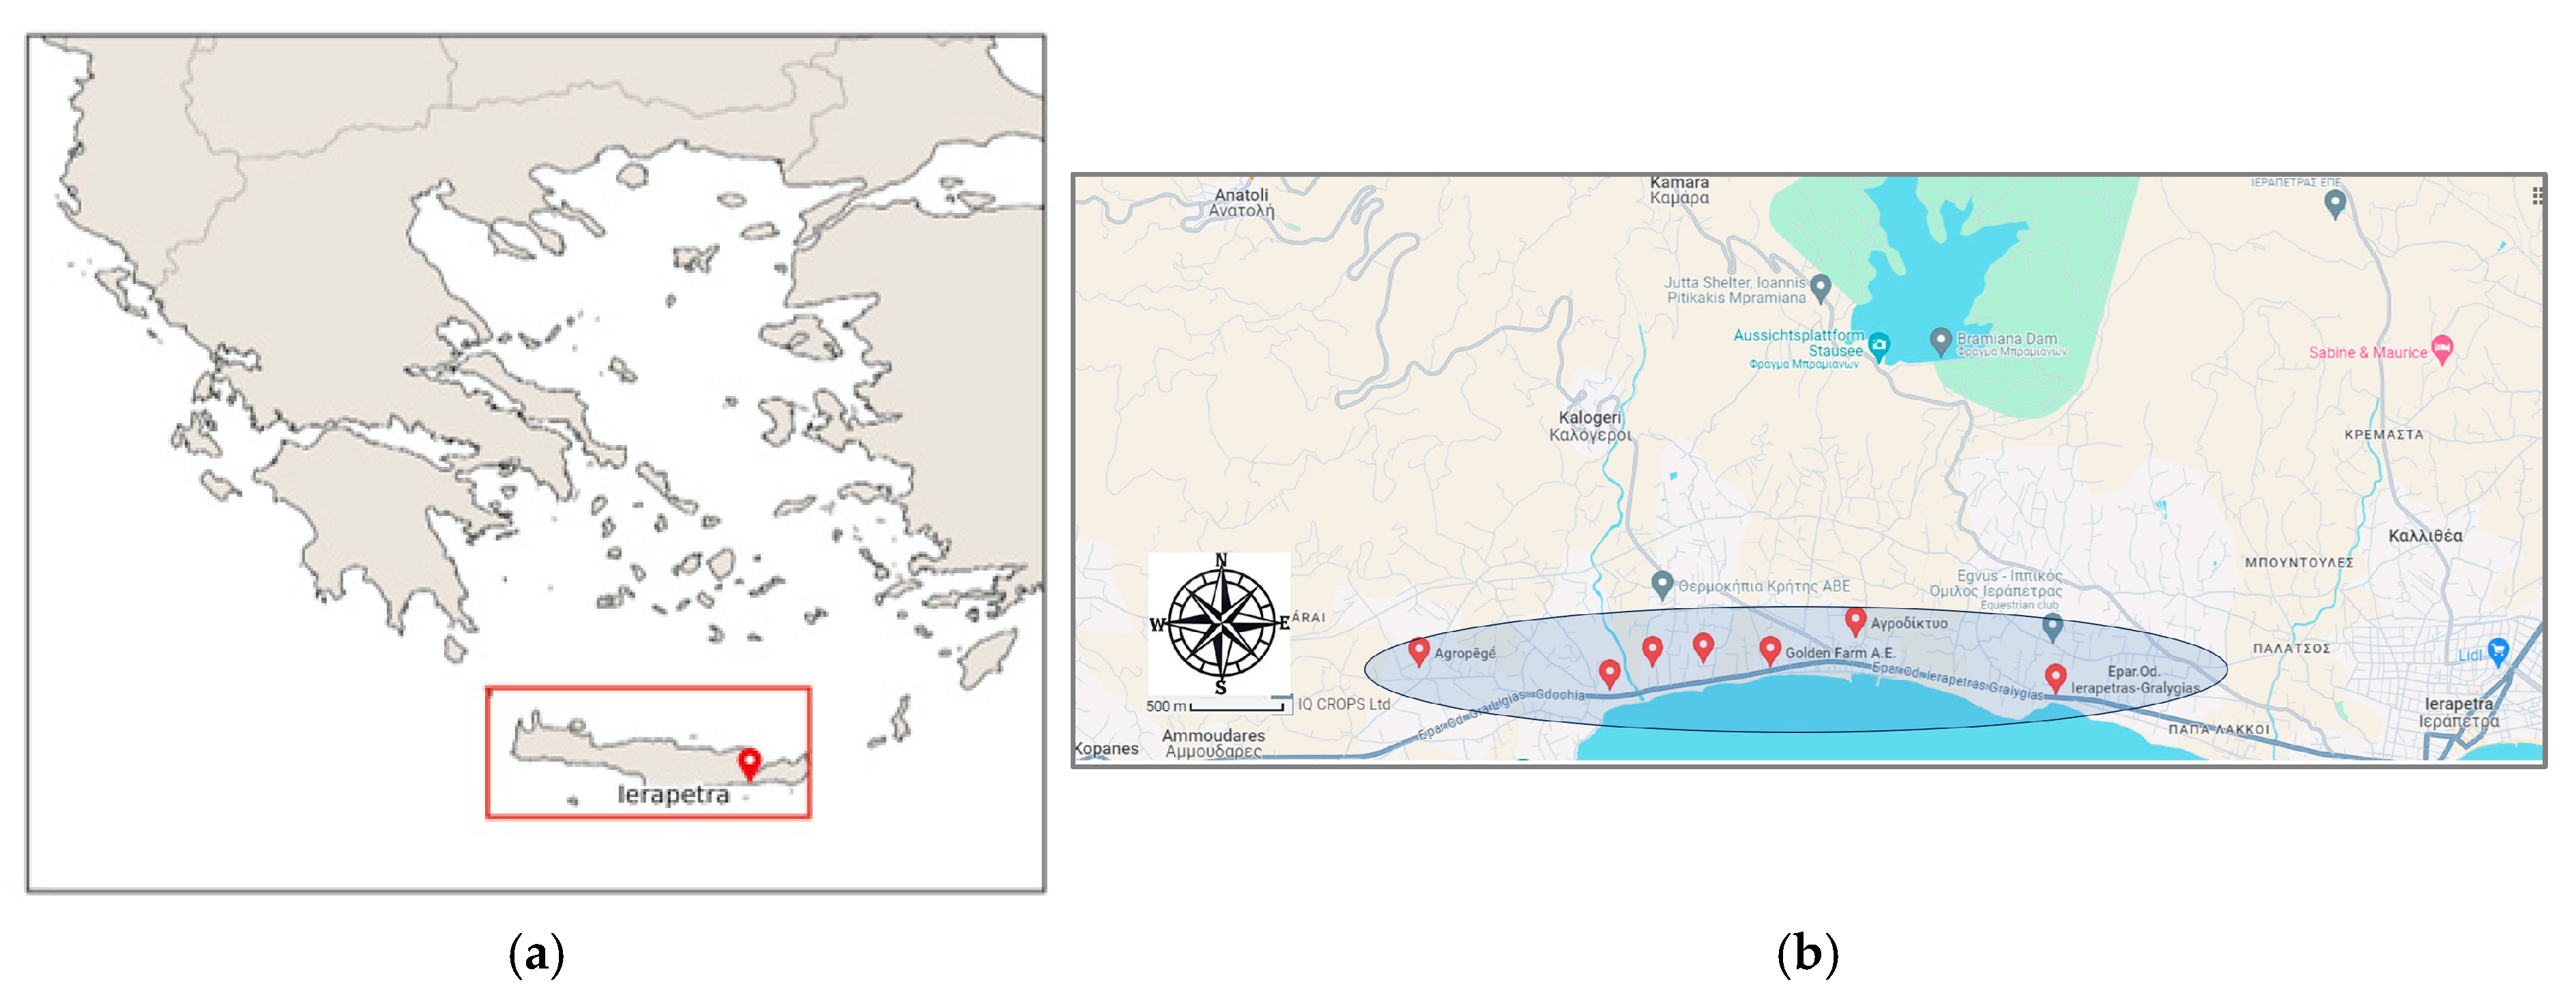
Intensive greenhouse horticulture in Ierapetra (south-eastern Crete, Greece; see Figure 1) is an exemplifying case. This area is one of Greece’s leading producers of greenhouse vegetables, such as cucumbers, tomatoes and peppers, cultivated overwhelmingly by small and family-run holdings. Price formation is organised around physical auctions that act as a price-discovery mechanism, in which producers offer their lots to competing buyers at freely negotiated prices. The auction-cleared price in Ierapetra also serves as the reference used by later links of the chain to remunerate producers even for produce sold outside the auction. This auction channel is not, however, the universal route to market, since a substantial share of producers bypass the auctions and sell directly to traders and exporters, so the auctions set the reference price for the sector rather than intermediating all of its volume [6].
Greenhouse horticulture is the economic backbone of the greater area of Ierapetra, and the local farm economy rests almost exclusively on greenhouse vegetables and olive growing. As Ierapetra is among Greece’s leading suppliers of off-season (early) vegetables, the sector’s health is inseparable from rural employment, the local economy and the livelihoods of local residents [6]. This dependence is demographically consequential, as much of rural Greece has undergone sustained depopulation and ageing driven by youth out-migration and the contraction of agricultural employment, which erodes the demographic reproductive capacity of affected areas [7]. Against this backdrop, the year-round income and employment generated helps retain the working-age population in Ierapetra. Yet over the past fifteen years, the living standards of these producers have declined, tracking the broader fall in Greek farm incomes, as lower average producer prices have combined with rising input costs, energy above all, and a less favourable tax regime to squeeze household margins [6]. As succession decisions depend heavily on the expected economic stability of the holding [8], such income pressure bears directly on generational renewal. Young farmers themselves stress that taking over the family enterprise rests on a credible expectation of a stable and competitive livelihood rather than on short-term young-farmer support measures [9,10].
In principle, auctions improve competition, discover a fair market price within a short time window, and protect the weaker party, the small, low-bargaining-power producer [11,12]. In practice, however, the Ierapetra auction system is fragmented. Several independent venues operate within a very small geographical area (see Figure 1) and hold their auctions sequentially rather than concurrently, beginning at the westernmost venue and ending at the easternmost over the course of the day. A further venue was added in the same area in early 2026. Field research [6] documented a widely shared perception that producer prices vary substantially even for qualitatively similar produce. This perception aligns with a large body of evidence that fragmented markets fail to enforce a single price for homogeneous goods. Baye et al. [13], using an internet price-comparison site, find that even for strictly identical products, the gap between the two lowest competing offers averages about 23% when only two sellers compete but narrows monotonically as their number rises. Anania and Nisticò [14] show that in retail food markets, price dispersion across sellers for perfectly homogeneous products remains substantial, even when controlling for product characteristics. The same pattern appears in first-sale auctions. Graddy [15], at the Fulton fish market, finds that buyers pay systematically different prices for fish of identical type and quality on a single trading floor; in the same context, Kirman and Vignes [16] document stable and persistent dispersion for a homogeneous good among the same buyers and sellers meeting in the same hall each day.
For a price-taking smallholder, price dispersion for a homogeneous good is a source of risk exposure. Two features of the auction sharpen this exposure. First, produce traded under the same commercial code is not perfectly homogeneous, since lots of the same grade may differ in freshness, presentation and the incidence of substandard or defective units, so part of the observed spread reflects genuine, if unrecorded, quality heterogeneity. Second, because lots are auctioned sequentially, the within-day spread also reflects potential shifts in the balance of supply and demand over the trading session rather than differences in the produce itself. For example, as successive lots clear and residual demand is progressively satisfied, later lots tend to transact at lower prices, with the declining-price pattern documented in sequential auctions [17]; conversely, transient positive demand shocks during the session can lift later lots above earlier ones, so the intraday drift can run in either direction. Because each holding’s produce enters under its own code rather than being pooled, the price a lot realises depends partly on when it happens to be sold relative to these movements, widening the gap between the highest and lowest transacted prices on the same day, even in the same auction.
This study makes that exposure explicit and attempts to quantify it using daily auction prices for six greenhouse vegetable products in Ierapetra over the period 2019–2026. It explores how large and persistent within-day price dispersion and day-to-day volatility are at a major auction venue of the area, how these patterns differ across products, varieties and seasons, and what they imply for the income risk borne by smallholder price-takers. The study concludes by considering how, and under what conditions, a unified, transparent digital auction might plausibly mitigate them.
To the authors’ knowledge, this study is one of the first that measure within-day price dispersion, the max–min spread for nominally similar produce on the same day, at a European produce auction; prior work has instead quantified dispersion across competing sellers [13,14] or across successive lots within a single sale [17], rather than the within-day, same-good spread used in this study. This gap is not incidental. At the largest clock cooperatives in northern Europe, supply is fully homogenised before it reaches the clock, with Belgian auctions such as BelOrta and REO Veiling having replaced per-grower sales with pooled “block” sales of a single product and quality class [18]. In the Dutch auctions, similarly, lots may remain grower-specific but pass rigorous grading into rigid quality classes [19], so within-session dispersion for a genuinely identical good is compressed. Southern-European systems that auction each producer’s consignment lot by lot, as in Ierapetra [6,20,21], are the setting in which within-day dispersion of an essentially identical good becomes observable.
The study further proposes an operational reference band for interpreting the observed dispersion, anchored on an empirical higher-priced-product frontier and read alongside external comparators. It also reports robustness checks against the two most obvious statistical alternatives to a frictional reading, namely, differences in trading thickness and differences in price level. Finally, it relates the resulting “income-at-risk” to the resilience agenda for smallholder and family farms, while making explicit that the analysis measures exposure to price risk rather than resilience outcomes themselves, and evaluates, cautiously, the case for a unified digital auction as an adaptation. The remainder of this article is organised as follows. Section 2 describes the study area and auction context, the daily price series for the six products, and the indicators used. Section 3 presents the empirical results, including the robustness analysis in Section 3.6, while Section 4 discusses the findings and their implications for the resilience of smallholder and family farms, and further appraises the case for a unified digital auction as an adaptation measure. Finally, Section 5 concludes and outlines directions for policy and further research.

2. Materials and Methods

2.1. Study Area and Auction Context

Ierapetra and its surroundings concentrate a large share of Greece’s greenhouse vegetable production, which is dominated by small and family holdings producing vegetables for the domestic market and export. Marketing is organised around several independent physical auctions, but produce is also channelled to direct-to-consumer sales, to local and mainland wholesalers (in Athens and Thessaloniki) and to exporters; an end-to-end mapping of the Cretan vegetable chain documents these parallel marketing routes and identifies fragmentation at the marketing stage and weak vertical coordination among its principal sustainability bottlenecks [22]. Even though the governing framework, Law 4015/2011 [11], envisages a small number of organised auction venues per region (at most two in the Region of Crete), the Ierapetra area has seven parallel venues, so the sector operates with more fragmentation than the statutory model implies (see Figure 1). Price discovery is the core economic function these auctions perform. In the absence of posted prices, the repeated interaction of competing buyers reveals, within a short time window, a market-clearing price for perishable lots whose value is uncertain at the moment of sale, and this discovered price becomes a public signal that coordinates the rest of the chain [12]. The efficiency of that mechanism, however, depends on the thickness of participation and the transparency of information, and where venues are thin, opaque and disconnected, the discovered price is noisier and more dispersed, and its informational benefits accrue unequally to the parties best placed to observe it.

2.2. Data

The study selects daily auction price series for six greenhouse vegetable products, of the highest quality grade (grade A), namely cucumber and the small-sized cucumber variety (Knossos), tomatoes and a specialty premium small-fruited tomato variety (Lobello) and two pepper varieties, the Florina pepper and the horn or “kerato” pepper. These series derive from one of the major auction operators in the Ierapetra area, handling a substantial share of local greenhouse-vegetable sales. The within-day spread therefore reflects price differences within that single venue, for produce entering under the same commercial code. Two first-order limitations of the data are carried through the whole analysis. First, because only one operator is observed, nothing in these data identifies the contribution of the multi-venue structure to area-wide dispersion. The dispersion measured here is therefore dispersion at one venue of a fragmented system, not dispersion across that system. Second, the series report the daily minimum, maximum and mean transacted price but not the number of lots traded per product-day. Since the observed range is an order statistic, its expected width increases with the number of transactions, so comparisons of the range across products are potentially confounded by differences in trading thickness. Section 3.6 reports what the data can and cannot establish about this confound.
Because the sample contains two cucumber, two tomato and two pepper varieties, it allows dispersion to be compared across differentiation within the same botanical product. For each product, the data record the minimum, maximum and mean transacted price (€/kg) per day, spanning from November 2019 to May 2026. Due to the high seasonality of the produce, we only consider the period November–May. This is the high period for vegetable production, yielding about 1000–1100 trading-day observations per product. Outside this window, the series are sparse and single-price days are frequent, because only one producer, or very few, channel their production through this auction in the off-season. Participation is therefore thin precisely in the months that lie outside the analysis window, which has a direct bearing on how the seasonal pattern reported in Section 3.4 should be read.

2.3. Dispersion and Volatility Indicators

For each product-day (i, t), dispersion, volatility and price-level variability are quantified with four indicators, defined in Equations (1)–(4) below, in which all prices are daily transacted auction prices expressed in €/kg.
The primary measure is the within-day relative spread S i , t , the same-day gap between the highest and lowest transacted price expressed as a percentage of the mean price (Equation (1)); it captures how much nominally similar produce disperses on a single day and is summarised for each product by its mean, median, 90th percentile and maximum across all valid product-days.
Day-to-day volatility is summarised by two statistics computed on the daily percentage change in the mean price between consecutive trading days, r i , t (defined in Equation (2)), namely its standard deviation, SD( r i , t ), and the mean of its absolute value, mean(| r i , t |). In addition, price-level variability C V i is approached by the coefficient of variation of the mean price (Equation (3)). Because the analysis is restricted to the dense November–May season, consecutive trading observations are typically one or two days apart; day-to-day changes are therefore measured between consecutive sessions without time-scaling, and pairs separated by a gap of more than seven days (which occur mainly at the season’s edges) are excluded.
Finally, an income-at-risk measure D i , t is utilised to translate dispersion into a welfare consequence for the producer. For a seller clearing at the low end of the day’s range, the downside gap between the mean and the minimum price (see D i , t , in Equation (4)) is summarised by its mean and 90th percentile for each product, quantifying the income shortfall borne by low-end sellers. Seasonality is examined through the calendar-month means of the S i , t and between-season trends through its per-season means (a season running from November of one year to May of the next), together with day-to-day volatility computed for each season.
S i , t = P i , t m a x P i , t m i n P i , t m e a n × 100
where Si,t = the within-day relative price spread (%) of product i on trading day t; Pmaxi,t, Pmini,t and Pmeani,t = the maximum, the minimum and the mean transacted price (€/kg) of product i on day t, respectively.
r i , t = P i , t m e a n P i , t 1 m e a n P i , t 1 m e a n × 100
where ri,t = the day-to-day change (%) in the mean price of product i between two consecutive trading sessions; and Pmeani,t−1 = the mean transacted price (€/kg) of product i in the preceding trading session t − 1.
C V i = s d ( P i , t m e a n ) a v g ( P i , t m e a n ) × 100
where CVi = the coefficient of variation (%) of the daily mean price of product i; and sd(Pmeani,t) and avg(Pmeani,t) = the standard deviation and the arithmetic mean, respectively, of the daily mean price of product i computed over all its valid trading days.
D i , t = P i , t m e a n P i , t m i n P i , t m e a n × 100
where Di,t = the income-at-risk (downside) gap (%) of product i on day t, that is, the shortfall of a producer whose lot clears at the daily minimum price relative to the mean price of the same product-day.

2.4. A Higher-Priced-Product Reference Band for Interpreting Dispersion

Some dispersion is expected even in a well-functioning market, since nominally identical goods may differ in grade, freshness, lot size and buyer, and since search and transaction costs sustain an equilibrium level of dispersion [12,23,24]. These determinants are transaction-specific and unobservable in any auction record, so the component of the observed spread attributable to genuine product or transaction heterogeneity cannot be measured directly. Rather than partition the spread into “justified” and “excess” components, which these data cannot support, the study uses an internal reference band that gives the cross-product comparison a common yardstick.
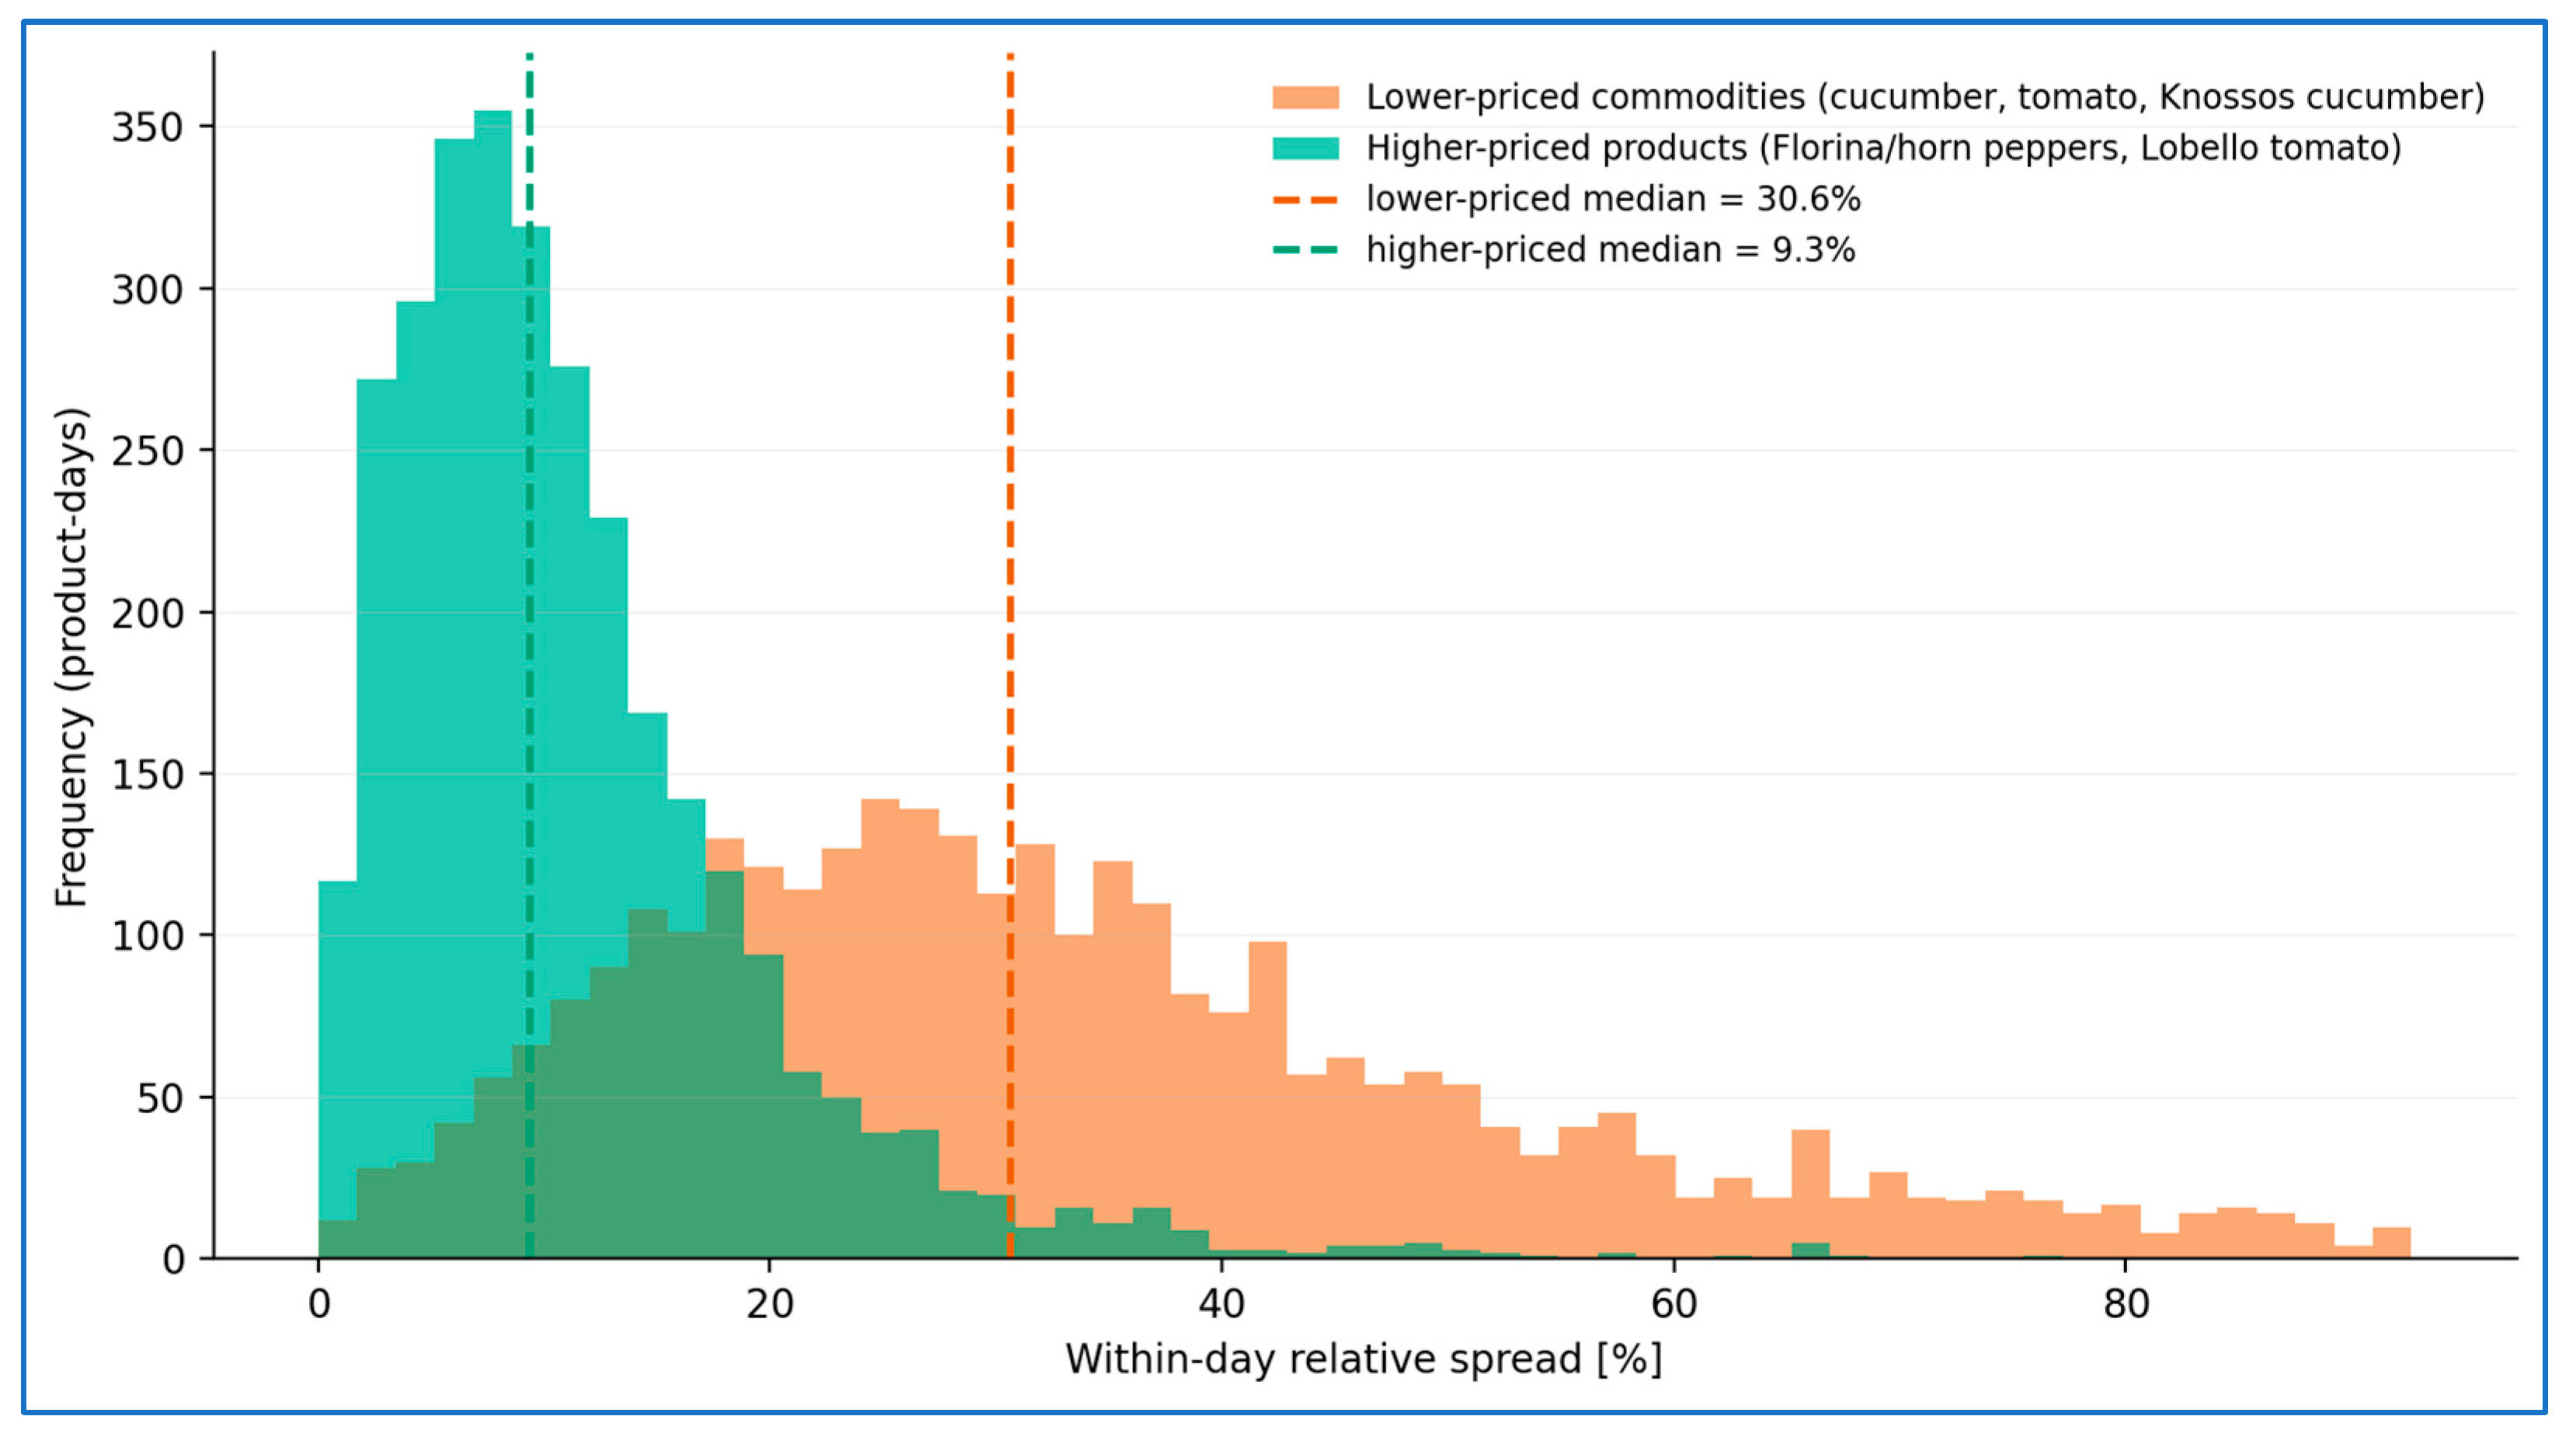
The band is drawn from the within-day spreads of the three higher-priced products (the two pepper varieties and the Lobello tomato). Their median within-day spread (about 9.3%) anchors the band, and their 25th and 75th percentiles define its lower and upper bounds (p25 = 5.5%, p75 = 14.6%). Two properties of this construction should be stated explicitly. It is an internal descriptive benchmark, not an efficiency or welfare threshold, and no claim is made that spreads above it are inefficient, frictional or removable by digitisation. It is also defined by one of the two groups being compared, so the finding that the lower-priced commodities lie above it restates, in a common metric, the difference between the two spread distributions rather than providing independent evidence of a distinct cause. The band is retained because it makes the size of that difference legible across products, and because the frequencies and average distances reported in Section 3.5 convey information that group means alone do not. The checks that do not depend on the band, comparing the two groups at the same price level and after removing thin trading days, are reported in Section 3.6.
For each product, the analysis computes the share of days on which the spread exceeds each bound of the reference band (b) and the average amount by which it does so (Equation (5)).
share i b = 100 T i t 1 S i , t > b ;   excess i b = t 1 S i , t > b S i , t b t 1 S i , t > b
where sharei(b) = the percentage of trading days on which the within-day spread of product i exceeds the benchmark b; excessi(b) = the average amount, in percentage points, by which the spread exceeds that benchmark, computed only over the days on which it is exceeded; b = the bound of the higher-priced-product reference band (lower bound p25 = 5.5% or upper bound p75 = 14.6%); Ti = the number of valid trading days of product i; and 1(·) = the indicator function, equal to 1 when the condition in parentheses holds and 0 otherwise.
External comparators are discussed qualitatively in Section 4. Independent studies of dispersion in near-homogeneous goods report irreducible floors of a broadly similar order of magnitude. Direct numerical comparison is nevertheless avoided, because of a metric mismatch: the within-day, same-good transaction spread used in this study differs from the cross-seller (often posted-price) and sequential measures reported elsewhere, which tend to be higher. These comparators situate the present estimates within the literature; the band itself is defined by the data analysed here.

3. Results

3.1. Price Levels and Trends

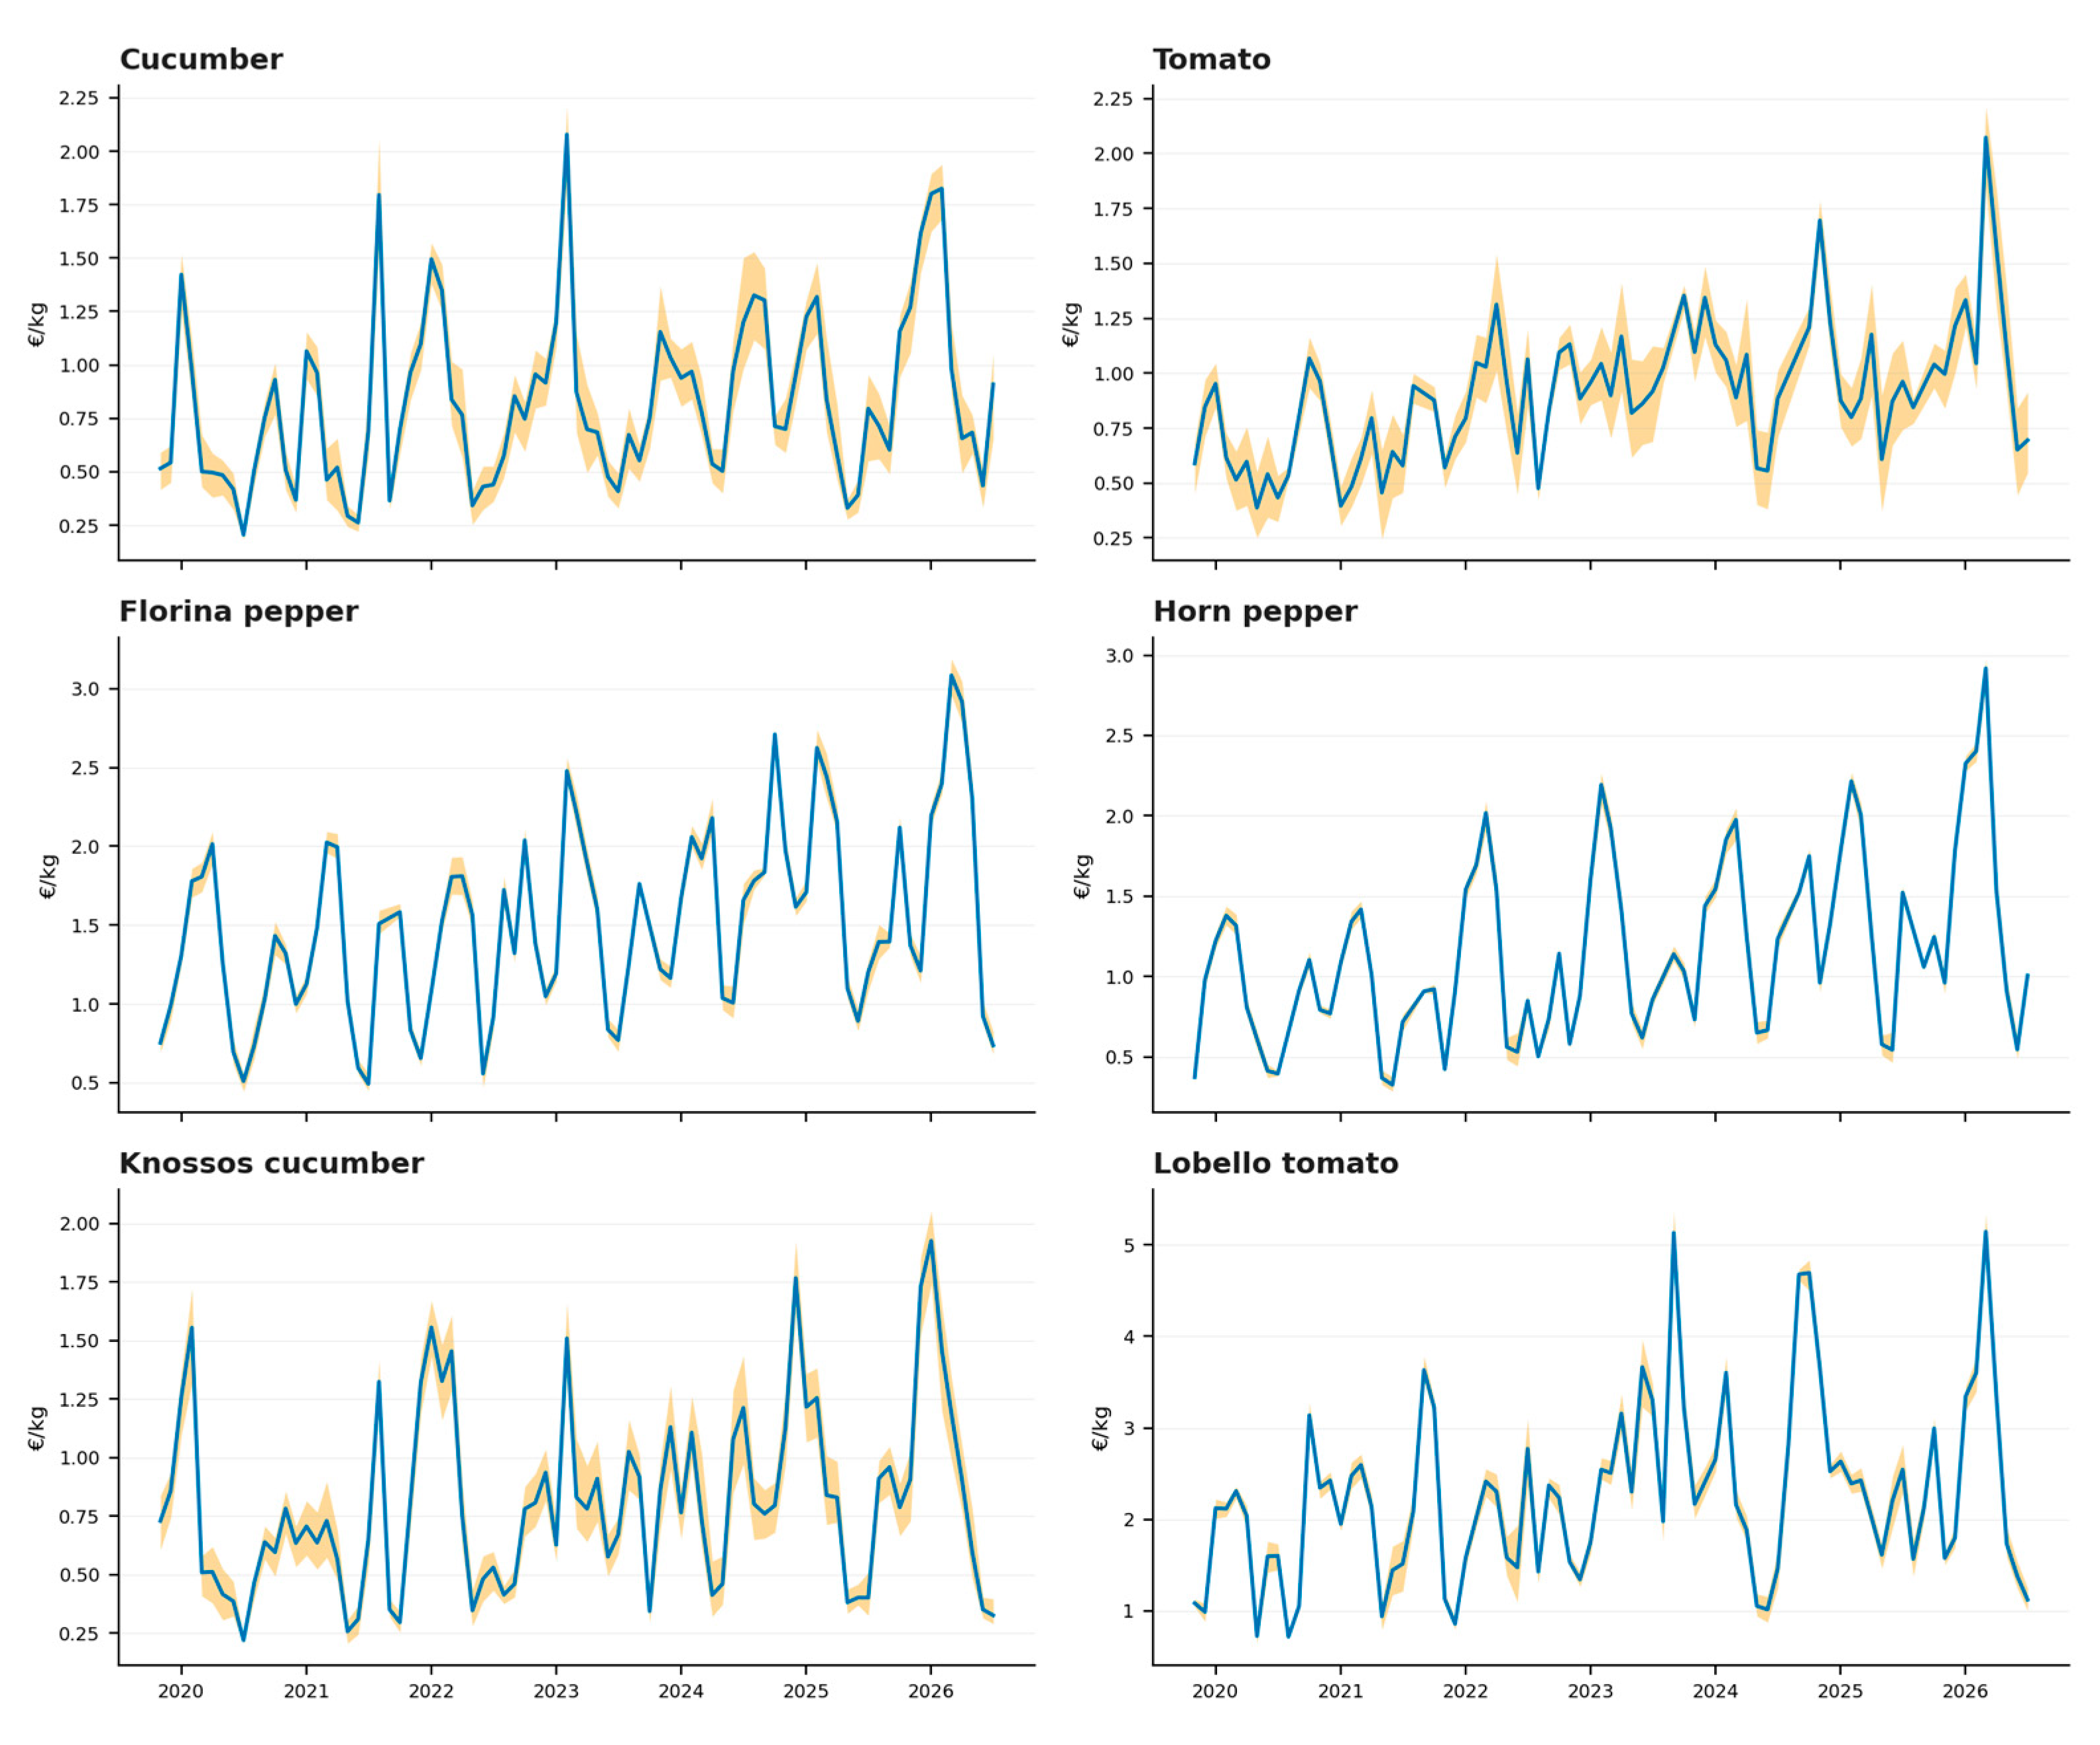
According to Table 1, mean auction prices differ markedly across the six commodities, from ~0.89–0.94 €/kg for the cucumber, the tomato and the Knossos cucumber to 1.29–1.66 €/kg for the horn and Florina peppers and 2.19 €/kg for the Lobello tomato. The relatively low mean price of the Lobello reflects the lower average prices recorded in the early years of the series (Figure 2). Beyond these averages, every product traversed a very wide price band over the period under investigation. The daily mean price of the cucumber and the Knossos cucumber ranged from about 0.16 €/kg to roughly 2.7–2.8 €/kg, that is, more than a fifteen-fold range, while even the specialty Lobello tomato spanned 0.53 to 6.30 €/kg. Such ranges, combined with CV of the mean price of 39% (Florina pepper) to 54% (cucumber and Knossos cucumber), point to substantial variability in the price level itself, before any within-day effects, and hence sizeable seasonal and year-to-year income risk for producers.
Although the two cucumber and the two tomato varieties are botanically paired, they behave as distinct products in price terms. The two cucumber varieties co-move moderately in levels (Pearson r = 0.66), as do the two tomato varieties (commodity tomato and Lobello) (r = 0.66). Day-to-day price changes, by contrast, are only weakly correlated across the cucumber and tomato varieties (r = 0.28 and r = 0.22, respectively); although both remain statistically significant given the large sample, their small magnitude indicates that short-run price formation is largely variety-specific rather than shared. This supports treating each product as a separate market and reinforces that the dispersion contrasts documented below track the unit value and differentiation rather than the type of vegetable.

3.2. Within-Day Price Dispersion

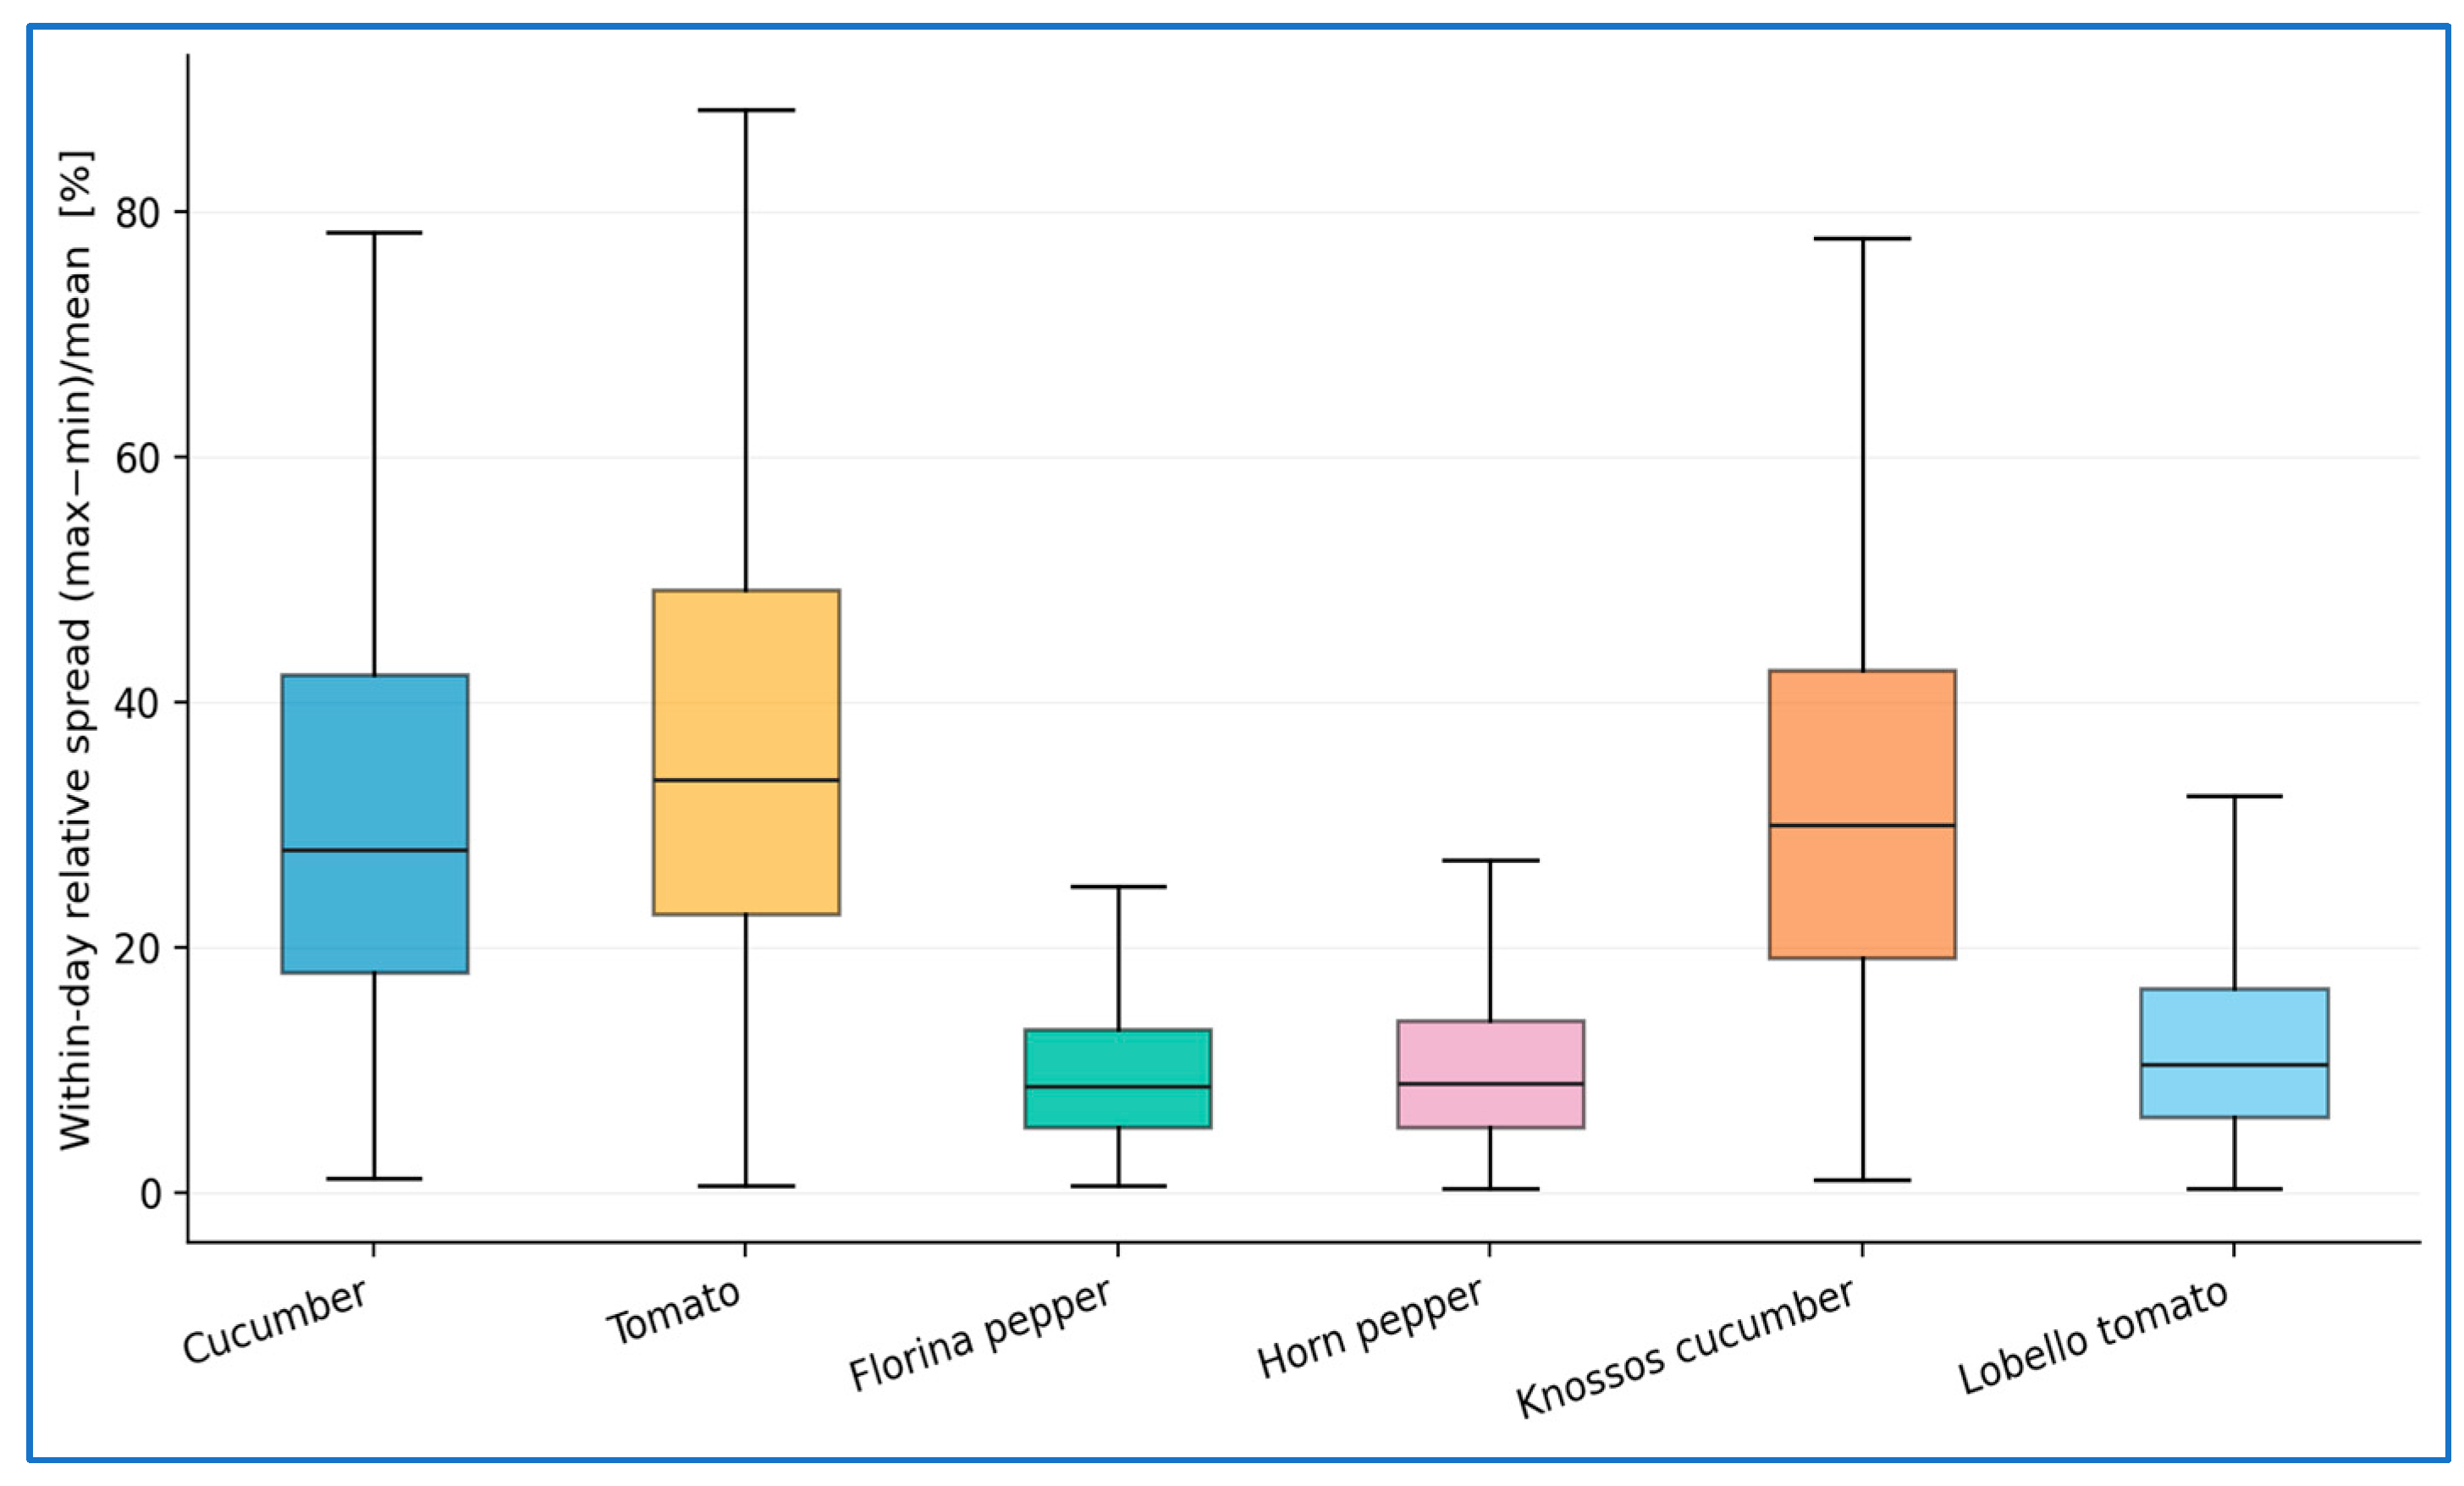
Within-day dispersion is large and strongly heterogeneous across products (Table 1; Figure 3). Cucumber, tomato and the Knossos cucumber show mean spreads of 33.6%, 38.2% and 33.2%, whereas the three higher-priced products (the Florina pepper, horn pepper and Lobello tomato) show 10.1%, 10.9% and 12.7%. On extreme days, the spread exceeds 100% of the mean price (with maxima of cucumber 150%, tomato 138% and Knossos cucumber 121%). On the worst tenth of trading days, the within-day spread still reaches 58–71% of the mean price for the commodities, versus only 19–24% for the higher-priced products (Table 1). Notably, the distinction is not botanical. The commodity tomato disperses about three times as widely as the specialty Lobello tomato, and the commodity cucumber disperses about as widely as the Knossos cucumber, so dispersion tracks the unit value and product differentiation, not the type of vegetable. Holding botanical type fixed sharpens the contrast. The two cucumbers are both lower-priced commodities (0.89 and 0.94 €/kg) and both highly dispersed (33.6% and 33.2%), whereas the two tomatoes differ sharply in unit value (0.92 vs. 2.19 €/kg) and correspondingly in dispersion (38.2% vs. 12.7%). The data thus separate cleanly into a high-dispersion group (lower-priced commodities) and a low-dispersion group (higher-priced products); see also the pooled distribution (Figure 4). Whether this contrast can instead be produced by differences in trading thickness or by the price level itself is examined in Section 3.6.

3.3. Day-to-Day Volatility

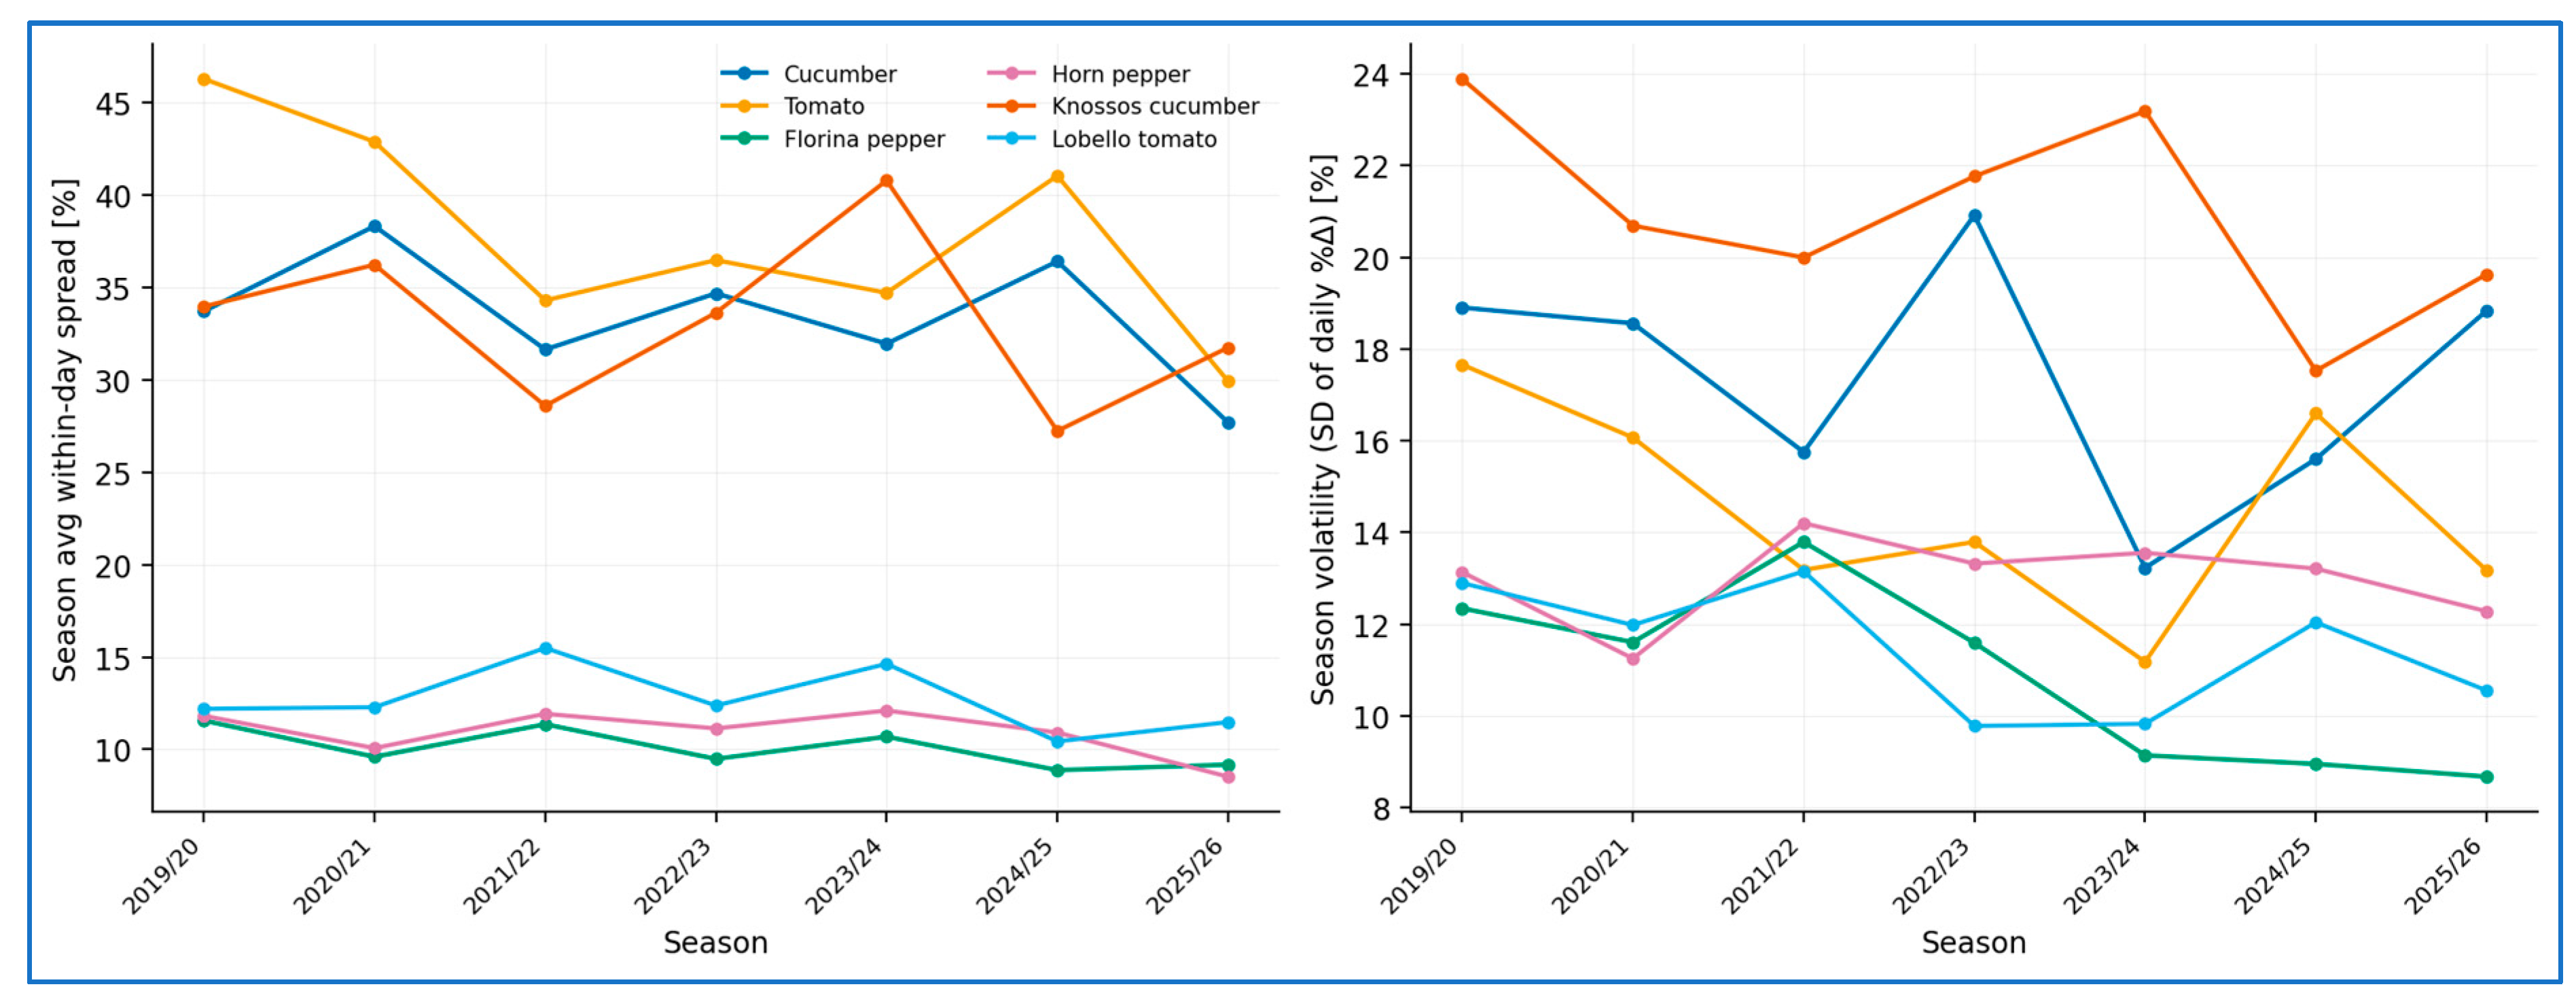
Daily mean prices are highly volatile. The standard deviation of the daily percentage change ranges from 11.0% (Florina pepper) to 21.1% (Knossos cucumber), and the mean absolute daily change ranges from 7.7% to 15.2% (Table 1). Volatility is highest for the same lower-priced commodities that show the widest within-day dispersion, compounding the risk their producers bear (Figure 5).

3.4. Seasonality

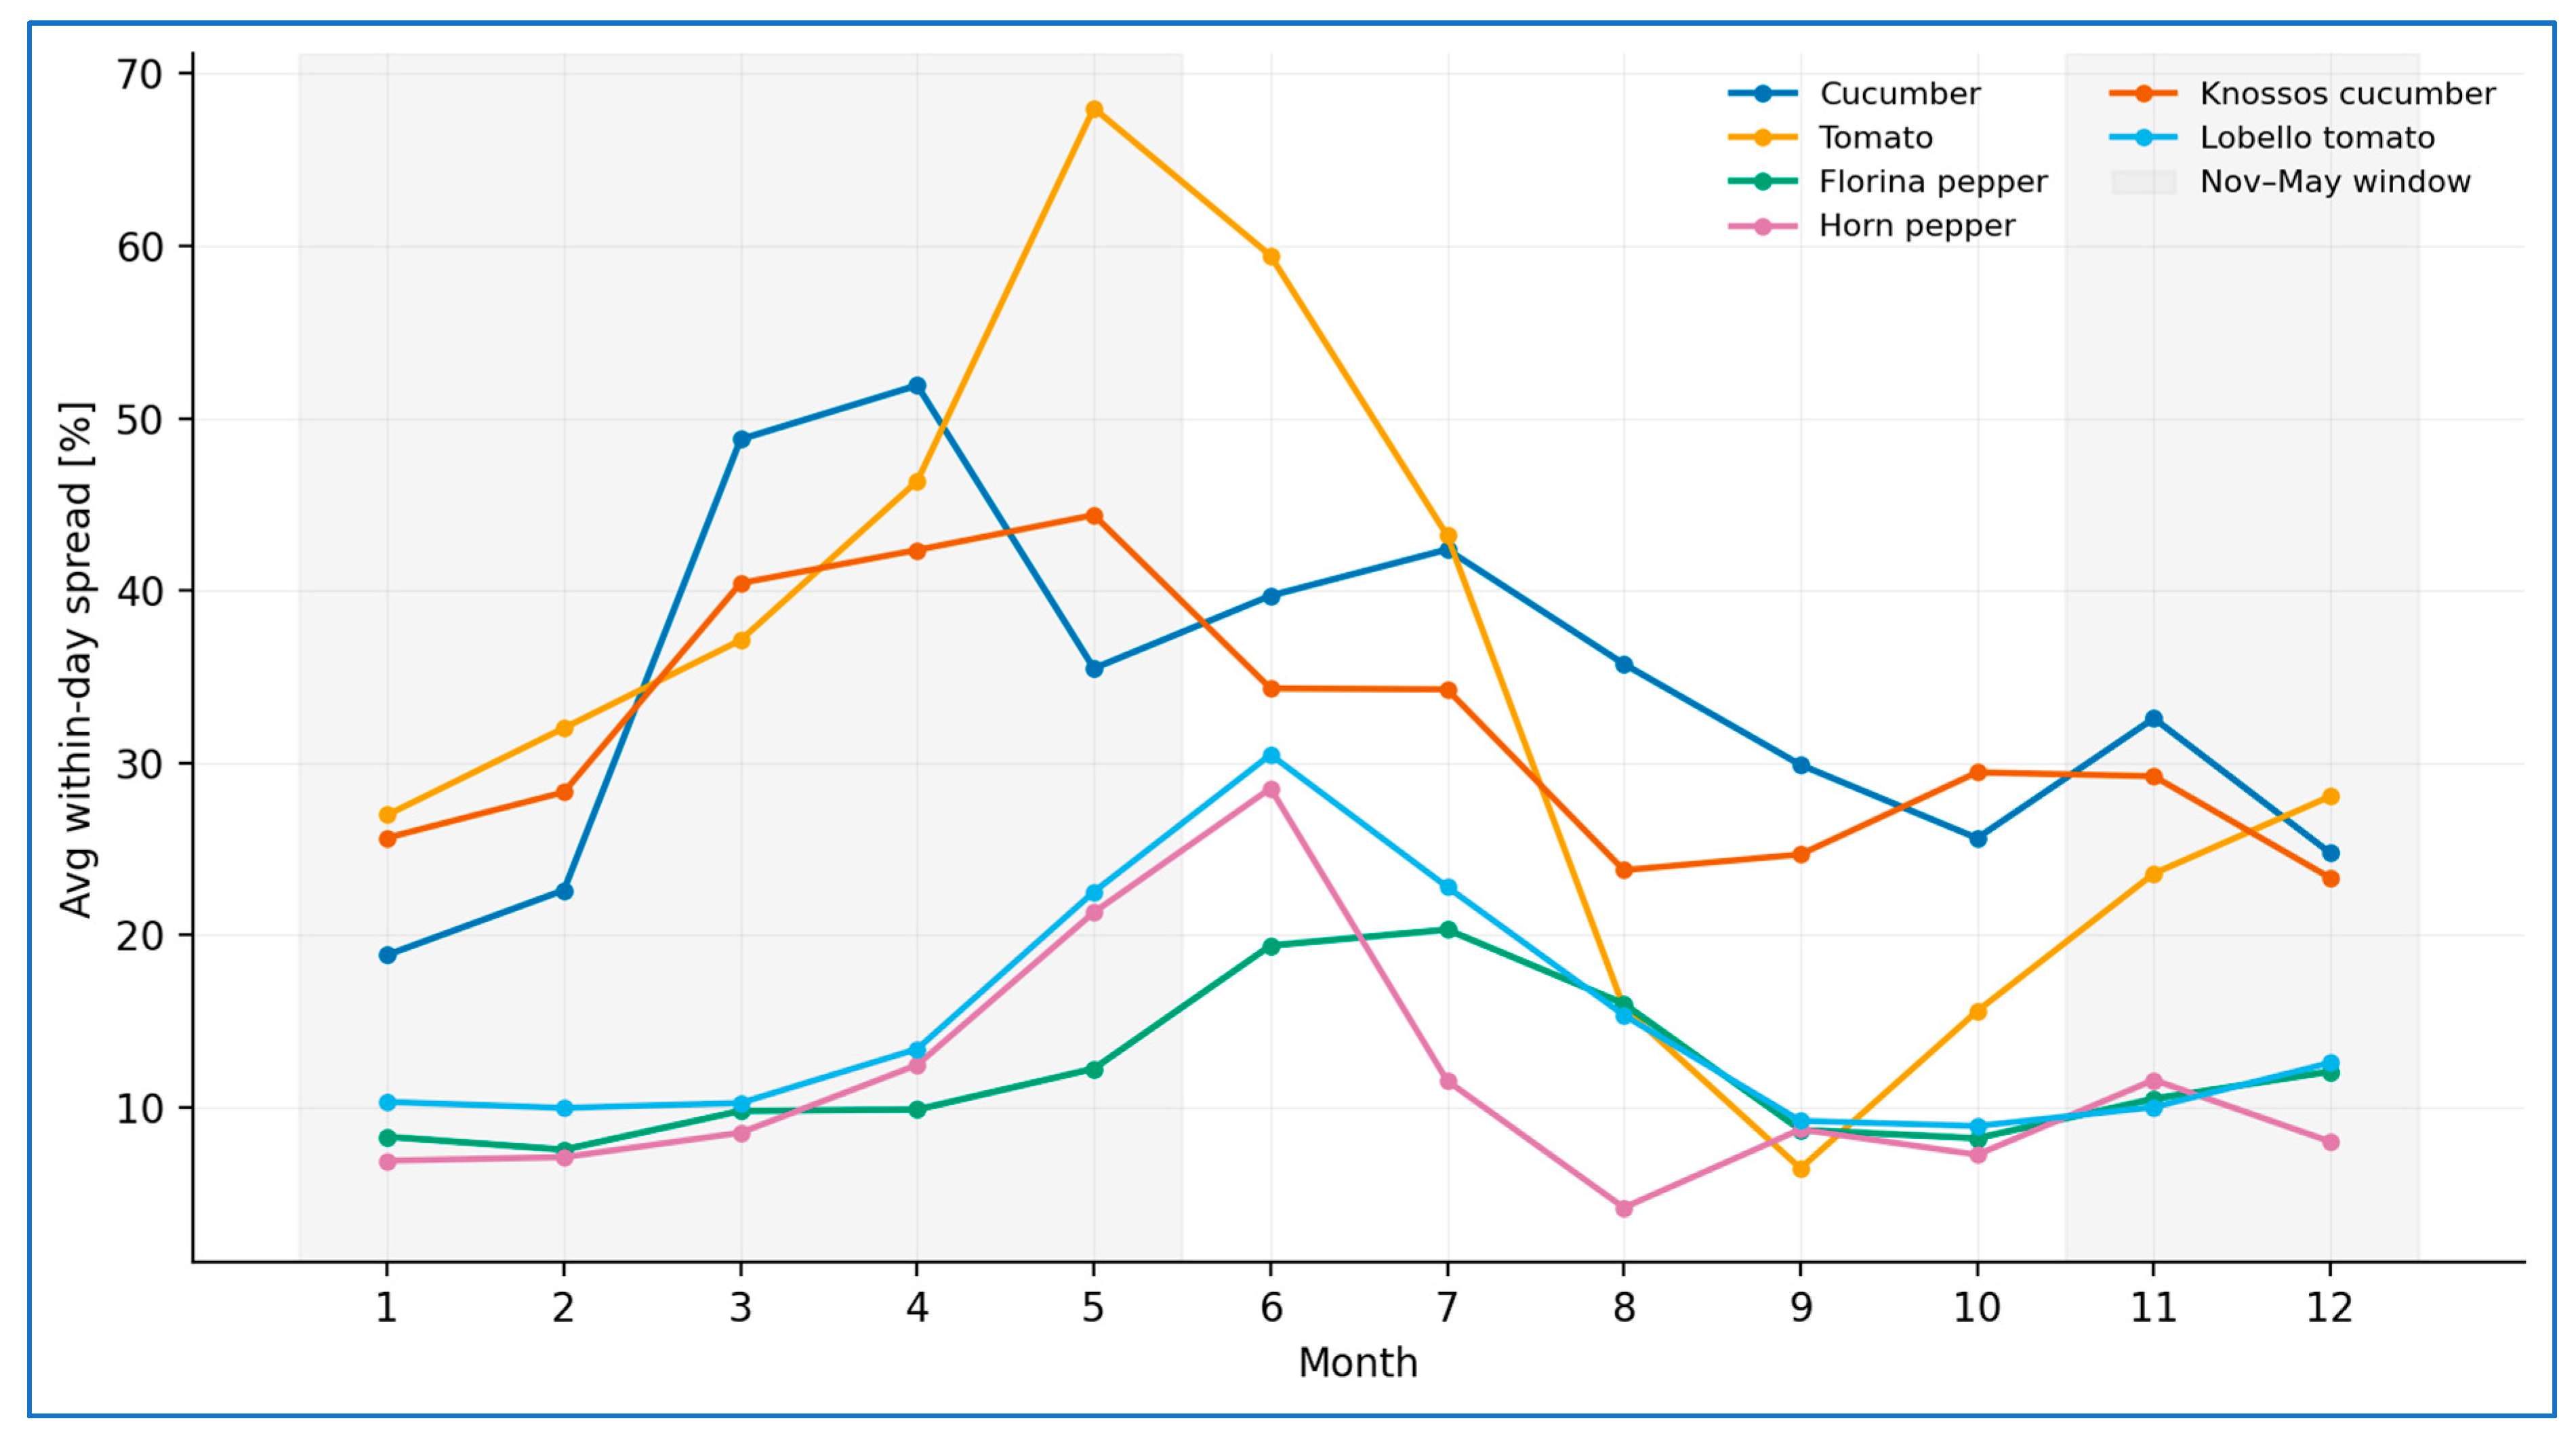
Within the November–May window, dispersion follows a clear seasonal pattern (Figure 6): monthly averages peak in spring (tomato ~68% in May, cucumber ~52% in April), when volumes and quality are most variable, and the higher-priced products trace the same shape at a much lower level. Figure 6 also shows the off-season months, where participation falls to one or very few producers (Section 2.2) and the observed range narrows mechanically with the number of transactions; the seasonal analysis is therefore confined to the November–May window.

3.5. Dispersion Relative to the Reference Band and Income-at-Risk

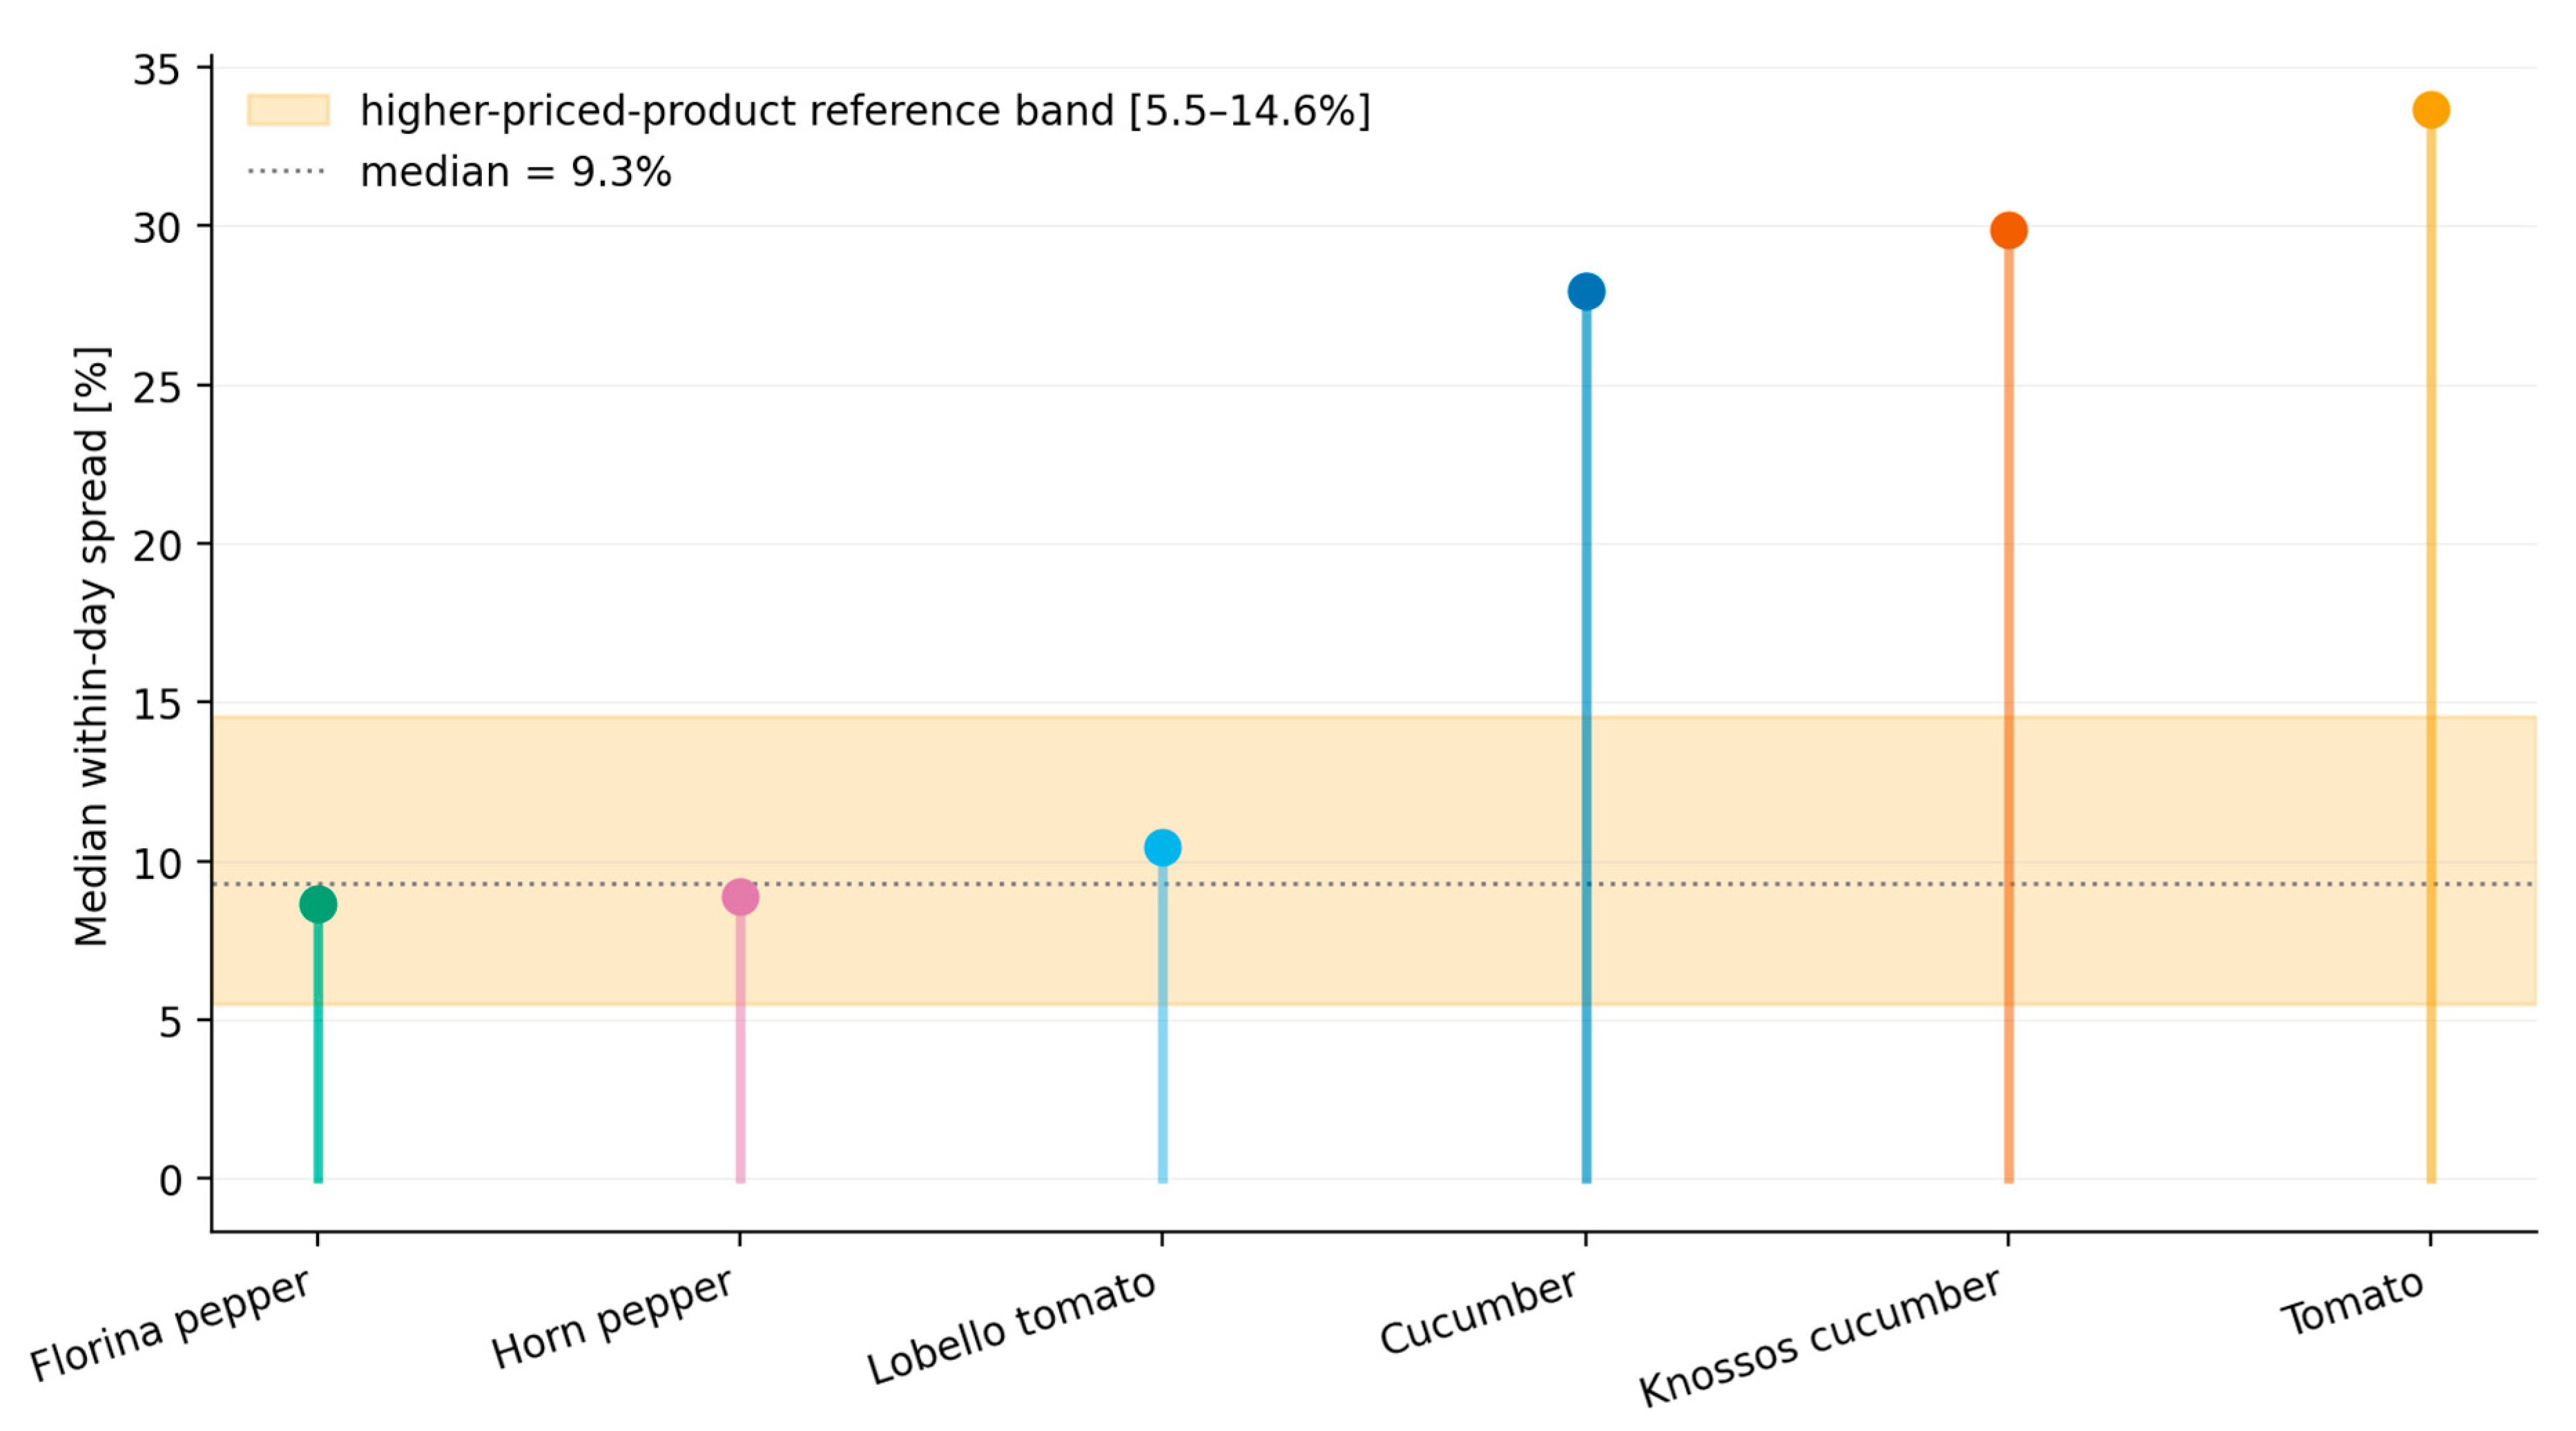
Relative to the higher-priced-product reference band, running from the 25th percentile (5.5%) to the 75th percentile (14.6%) of the three higher-priced products, dispersion is large and pervasive for the commodities (Table 2). Cucumber, tomato and the Knossos cucumber exceed the lower bound (5.5%) on 97–98% of days and the upper bound (14.6%) on 83–89% of days, with an average distance of 22–27 percentage points above the upper bound, whereas the higher-priced products exceed 14.6% on only 21–31% of days (Figure 7). In income terms, a producer clearing at the low end earns, on average, 16.1% (cucumber), 18.9% (tomato) and 15.7% (Knossos cucumber) below the day’s mean (rising at the 90th percentile to 31%, 35% and 28%) versus only ~5–6% for the higher-priced products (Table 2). Given the narrow margins in greenhouse production, a shortfall of this order is material for small and family holdings, and it is likely to fall hardest on the smallest and least well-connected producers. The transactions observed here are a subset of those taking place across the area on the same day, so the within-day range for a given product across the area is at least as wide as the range reported above. Table 2 therefore describes dispersion within one venue and understates the spread at which identical produce changes hands across the area; by how much is not observed.

3.6. Robustness: Thin Trading Days and the Price Level

Two features of the data could, in principle, generate the contrast between the two product groups without any appeal to market frictions. First, the within-day range is an order statistic: for a given underlying price distribution, the expected gap between the highest and the lowest transaction widens with the number of lots traded, which the series do not record. Second, the relative spread carries the price level in its denominator, and low-price days are also the days on which volumes are highest, within-grade quality most heterogeneous and distress selling most likely.
The data provide a partial check on the first concern. Product-days on which a single price is recorded, the clearest signature of very thin trading, represent 2.1–8.3% of observations and are already excluded from every indicator reported above (Table 3). Furthermore, because the recorded mean is a transaction mean rather than the midpoint of the daily range, a mean that differs from the midrange implies at least three distinct transaction prices on that day. This holds on 89.0–95.5% of valid product-days, and in similar proportions for the lower-priced commodities (93.3–95.5%) and the higher-priced products (89.0–92.1%), so the two groups do not differ appreciably in the frequency of very thin sessions. Restricting the indicators to these days leaves the spreads essentially unchanged and preserves the gap between the groups (Table 3). An explanation resting on trading thickness would therefore have to operate through the upper tail of the lot-count distribution. Testing that possibility requires the number of lots traded per product-day, which the series do not record, so a residual order-statistic bias in the level of the reported spreads remains possible.
The second concern is partly borne out. Within every product, the relative spread declines markedly as the price level rises. The fitted gradient ranges from −4.9 percentage points per log-point of price for the Florina pepper to −26.1 for the tomato (Table 3). The mean spread of the commodity tomato, for example, falls from 58.2% in the lowest quintile of its own price distribution to 26.3% in the highest. Part of the cross-product contrast is therefore a price-level effect rather than a differentiation effect. It is not, however, only a level effect. Comparing the two groups on days when they trade at the same price shows the gap persisting throughout the region of common support. For daily mean prices of 0.8–1.2 €/kg, the commodities average a 30.2% spread against 13.2% for the higher-priced products; at 1.2–1.6, 1.6–2.0 and 2.0–3.0 €/kg, the corresponding pairs are 25.1% versus 10.3%, 19.7% versus 9.7% and 14.4% versus 9.3%. Dispersion thus falls with the price level both within and between products, and the difference between the groups narrows as prices converge without disappearing. A third source, the sequential clearing of lots within a session, cannot be assessed at all with daily data, and is discussed in Section 4.

4. Discussion

4.1. Price Dispersion, Income Risk and Farm Resilience

The Ierapetra auctions perform essential price discovery but transmit substantial, unequal price risk to producers. Within-day dispersion is large for lower-priced commodities and much smaller for the higher-priced products (the two peppers and the specialty tomato), the pattern predicted by search-cost and heterogeneity models in which relative dispersion falls as products become more differentiated and higher-valued [14,23]. The within-species contrast is particularly informative. The specialty Lobello tomato, priced near €2.2/kg, disperses about one-third as much as the €0.9/kg commodity tomato.
For a price-taking smallholder, this dispersion is a direct source of income risk, since a seller who clears at the low end receives, on average, 16–19% below the daily mean for the commodities, and up to ~28–35% on adverse days. Three implications for resilience follow. First, it does not merely lower average revenue but raises its variance, because a grower cannot know in advance where within the day’s range their lot will be sold, so income becomes harder to predict and to plan for. Such instability erodes a farm’s capacity to absorb shocks, to invest and to service debt. Second, the burden is likely to fall disproportionately on the smallest producers, who have the weakest bargaining position, the least scope to time or redirect their sales, and the thinnest financial buffers, so that an unfavourable price outcome does proportionally more damage to them. Third, to the extent that part of this dispersion is frictional rather than intrinsic to the produce, it is in principle amenable to institutional design; the present data, however, do not identify how large that part is.
This exposure also has a distributional and perceptual dimension that field research in the area made explicit. That research reports that significant same-day price differences between the auction venues are common, and that producers experience them as unfair relative to colleagues selling comparable produce, which erodes trust in the auction as an institution and in the sense that quality and effort are justly rewarded [6]. That evidence is testimony rather than measurement and supports no estimate of magnitude, but it indicates that the between-venue component these data cannot observe is unlikely to be negligible. For a family farm, recurrent income shocks of this magnitude do more than lower average earnings. They raise the variance of the household’s income, make it harder both to plan capital investments (e.g., greenhouse upgrades or heating) and to meet fixed loan repayments on schedule, and bear on whether a successor will take over, with direct implications for generational renewal and the economic sustainability of the holding.
Even though there is no single acceptable within-day threshold in the literature, non-trivial dispersion for identical goods is a structural, irreducible feature of even transparent, homogeneous markets [12,23,25], so the objective is not to eliminate dispersion but to keep it close to an attainable floor. In the literature, the closest analogues come from fresh-food auctions. The Marseille wholesale fish market is the tightest institutional parallel, since the same buyers and sellers meet in the same hall each day, yet stable and persistent price dispersion for homogeneous fish is documented that no arbitrage eliminates [16,26]. Where a magnitude is reported, price differences of roughly 7% arise for fish of identical type and quality at the Fulton fish market [15,27], and an exhaustive panel of French first-sale fish auctions confirms sizeable price disparities for the same species after controlling for quality, timing and trader heterogeneity [28]. A benchmark based on strictly identical non-food goods indicates the same. Matched pairs of identical DVDs auctioned within the same 24 h on eBay show mean within-pair dispersion of ~11% (9–28% by item) [29]. Such a floor is what canonical models of equilibrium price dispersion predict for homogeneous goods [30]. It is corroborated by producer micro-data, in which output-price dispersion for narrowly defined products reflects both genuine producer heterogeneity and irreducible noise [31], and by strictly standardised goods such as Medigap health-insurance policies, which are identical by regulation yet still vary widely in price across sellers [32]. Against these comparators, the higher-priced-product reference band reported here (5.5–14.6%) sits at the low end of documented dispersion, while the 33–38% commodity spreads are far larger. These remain directional analogies, since each external benchmark measures a different construct, whether cross-seller or spatial dispersion, the sequential declining-price anomaly, matched-pair gaps, or lowest-offer gaps, so the within-day, same-good measure used here at a physical produce auction fills a genuine gap. Evidence at higher levels of aggregation is consistent with this. Food-price differentials across European markets are persistent and converge only slowly [33,34], which suggests that price heterogeneity in food markets is durable at every scale, from a single trading hall to the European single market.
The mechanism most consistently linked to lower dispersion is stronger competition and greater transparency. In posted-price markets, where sellers advertise fixed prices and buyers compare them, the gap between the lowest offers falls sharply as the number of competing sellers rises [23]. The same logic maps to an auction through the buyer side, since more buyers bidding on each lot should likewise compress the price gap for identical produce.
A unified digital auction that pools fragmented venues into one transparent marketplace, widening the bidder pool per lot and publishing prices, operates on exactly these levers, and it is on this reasoning that such a platform would be expected to move high-dispersion commodities towards the higher-priced-product reference band. The dispersion documented here, however, is observed at a single venue, so the contribution of the multi-venue structure to it cannot be isolated. Establishing how much that structure adds, and how much of the measured spread a unified auction could compress, would require price observations from several venues on the same day, which this study does not have.
A concrete European precedent exists, namely the French cadran cooperative auction (SICA Saint-Pol-de-Léon/Prince de Bretagne), a unified, transparent clock auction adopted in 1961 to protect producers. The magnitude of any compression, however, cannot be estimated here, since no post-treatment data are available and the wider evidence on digitisation is mixed [35]. In the French fish auctions, electronification and market expansion raised both the price level and its variability [36]. At a Dutch flower auction, a switch to screen bidding, where buyers bid on an on-screen image rather than on the physical flowers, degraded the quality information reaching buyers and, in a before/after analysis, was associated with lower prices [37]. A further and more basic qualification concerns the sequencing of lots. Because lots clear one after another within a session, an unknown share of the within-day spread measured here reflects intraday drift over the trading session, including the declining-price pattern documented in sequential auctions [17], rather than differences between lots or between venues. A unified auction would still clear lots sequentially and would therefore not remove this component, whose size cannot be recovered from daily minimum, maximum and mean prices and would require lot-level records with timestamps. Taken together, these cases and qualifications point to a single conclusion. What determines the outcome is design, namely the breadth of buyer participation, the fidelity of product representation and the strength of grading, rather than electronification in itself. Digitisation is therefore not sufficient on its own, since the same technology may compress dispersion or amplify it according to how it is implemented. The unified digital auction is accordingly a plausible, design-conditional proposition, whose outcome these data cannot settle.
From a policy standpoint, what matters is not price dispersion as such but the income risk it transmits to producers and the part of it that institutional design could realistically compress. The levers most robustly linked to compressing dispersion in the wider literature are market integration and transparency, namely, unifying scattered venues, widening buyer competition for each lot, and publishing prices. How far the within-sample evidence supports this reading should be stated carefully. All six products trade at a single quality grade, yet lots within a grade still differ in freshness, presentation and the incidence of substandard units, so common grading does not by itself establish that the commodity spread is frictional. What the data do show is that the contrast between the groups is not an artefact of thin trading and survives comparison at equal price levels (Section 3.6), which makes an interpretation based purely on measurement or on the price level insufficient. The frictional share nonetheless remains unidentified, and design remains decisive, since any digital auction that fails to preserve credible quality signalling and genuine buyer competition risks the adverse outcomes observed at other electronified markets.

4.2. Policy Outlook: Design Options Beyond the Evidence

This section asks what would have to hold for a unified auction to reduce the exposure documented above. A cooperative or non-profit vehicle federating the existing venues, with local-government participation as a guarantor of transparency, is the natural institutional form in this setting, consistent with the cooperative tradition of most established European produce auctions. Organised that way, a unified auction could do more than compress dispersion. It could widen the bidder pool facing each lot, restore a price signal shared across the area, and rebuild trust among actors who currently meet in separate halls, with steadier incomes and the retention of rural employment as the broader objective. That objective is aligned with the emphasis placed by current European agricultural and rural policy on the position of farmers in the food value chain, on market transparency and on generational renewal. One mechanism specific to this setting deserves note. Because the venues hold their auctions sequentially over the same day, a buyer who does not bid up at one venue can source the remaining quantity at the next, and that outside option weakens competition for any individual lot; unification would remove it. The same sequencing, however, also produces the intraday drift discussed above, which unification would not remove, so the net effect cannot be determined from these data. Each of these propositions has clear empirical content and is testable with the data a pilot would itself generate: the between-venue price gap before and after unification, the number of buyers bidding per lot, and the dispersion of prices within a single grade. Establishing them is the task of such an evaluation, not of the present study.

5. Conclusions

Using a record of daily auction prices for greenhouse vegetables in Ierapetra spanning almost seven years (November 2019–May 2026), this study documents large and unequal within-day price risk at a major auction venue of the area. Within-day dispersion for produce of equal grading averages ~23% across the six products and reaches 33–38% for lower-priced commodity cucumbers and tomatoes, with extremes above 100%; day-to-day volatility is 11–21%. A low-end seller earns 16–19% below the daily mean for commodities, a shortfall that is material for the viability of small and family holdings. These commodity spreads lie well above the higher-priced-product reference band, and the contrast between the two product groups is neither an artefact of thin trading nor merely a price-level effect. The share attributable to market frictions, as distinct from unobserved lot heterogeneity or intraday sequencing, nevertheless cannot be identified with these data. Three features of the data define the scope of these results. First, the series come from a single operator, so dispersion between the venues serving the area is not observed and no causal role can be assigned to the fragmentation of the auction system. Second, the number of lots traded per product-day is not recorded. Third, the study measures exposure to price risk, a determinant of farm resilience, rather than resilience outcomes such as income, investment, recovery after shocks or succession. A unified, transparent digital auction is accordingly a plausible, design-conditional proposal, and testing it calls for observations from several venues on the same day. Extending the analysis to the other auctions operating in the area, and obtaining lot-level records with timestamps, are the natural next steps. Beyond the case of Ierapetra, the within-day dispersion measure used here offers a simple and transferable indicator of how evenly a market treats its weakest participants. It also underlines that transparent price formation at the point of first sale is inseparable from the income security of small producers and from the vitality of the rural areas they sustain.

Author Contributions

Conceptualization, A.L. and A.S.; methodology, A.L.; software, A.L.; validation, A.L., A.S. and K.T.; formal analysis, A.L. and A.S.; investigation, A.L. and A.S.; data curation, A.L.; writing—original draft preparation, A.L.; writing—review and editing, A.L., A.S. and K.T.; visualization, A.L., A.S. and K.T. All authors have read and agreed to the published version of the manuscript.

Funding

This research received no external funding.

Institutional Review Board Statement

Not applicable.

Informed Consent Statement

Not applicable.

Data Availability Statement

The daily auction price series analysed in this study were obtained from GOLDEN FARM and are available in: https://goldenfarm.gr/τιμές-ανά-προϊόν/ (assessed on 15 July 2026).

Acknowledgments

The authors thank the various stakeholders who contributed data and insights to the underlying feasibility study.

Conflicts of Interest

Authors are Guest Editor of this Special Issue of Agriculture; to avoid any conflict of interest, the peer-review and editorial decision process for this manuscript was handled independently by another Editor. The authors declare no other conflicts of interest.

References

  1. Ricciardi, V.; Mehrabi, Z.; Wittman, H.; James, D.; Ramankutty, N. Higher yields and more biodiversity on smaller farms. Nat. Sustain. 2021, 4, 651–657. [Google Scholar] [CrossRef] [Scilit]
  2. FAO. The State of the World’s Biodiversity for Food and Agriculture; Bélanger, J., Pilling, D., Eds.; FAO Commission on Genetic Resources for Food and Agriculture Assessments: Rome, Italy, 2019. [Google Scholar]
  3. Bravo-Peña, F.; Yoder, L. Agrobiodiversity and smallholder resilience: A scoping review. J. Environ. Manag. 2024, 351, 119882. [Google Scholar] [CrossRef] [Scilit] [PubMed]
  4. Darnhofer, I. Resilience and why it matters for farm management. Eur. Rev. Agric. Econ. 2014, 41, 461–484. [Google Scholar] [CrossRef] [Scilit]
  5. Meuwissen, M.P.; Feindt, P.H.; Spiegel, A.; Termeer, C.J.; Mathijs, E.; De Mey, Y.; Finger, R.; Balmann, A.; Wauters, E.; Urquhart, J.; et al. A framework to assess the resilience of farming systems. Agric. Syst. 2019, 176, 102656. [Google Scholar] [CrossRef] [Scilit]
  6. Liontakis, A.; Anastasiades, F.; Sintori, A.; Karantininis, K. Investigation of the Benefits of a Unified Digital Auction of Greenhouse Vegetables in Ierapetra; Deliverable Π.3.2 (Feasibility Study); Region of Crete: Crete, Greece, 2024; (In Greek, Not Public). [Google Scholar]
  7. Papadopoulos, A.G.; Baltas, P. Rural depopulation in Greece: Trends, processes, and interpretations. Geographies 2024, 4, 1–20. [Google Scholar] [CrossRef] [Scilit]
  8. Calafat-Marzal, C.; Roig-Tierno, N.; Cervera, F.J.; Gallego-Salguero, Á.; García-Álvarez-Coque, J.-M. Ensuring agriculture’s future: How to foster generational renewal in a semi-arid Mediterranean region. Cities 2026, 168, 106422. [Google Scholar] [CrossRef] [Scilit]
  9. Mattas, K.; Staboulis, C.; Tsakiridou, E.; Natos, D.; Polymeros, A.; Baranowski, P.; Bojar, W.; Parra Rivero, O.; Ojeda Roldán, Á.; Baldi, L.; et al. Facilitating generational renewal in rural areas by responding to young farmers’ voices: Echoes from the Greek territory. J. Rural Stud. 2024, 112, 103480. [Google Scholar] [CrossRef] [Scilit]
  10. Gkatsikos, A.; Natos, D.; Staboulis, C.; Mattas, K.; Tsagris, M.; Polymeros, A. An impact assessment of the Young Farmers Scheme policy on regional growth in Greece. Sustainability 2022, 14, 2882. [Google Scholar] [CrossRef] [Scilit]
  11. Hellenic Republic. Law 4015/2011 on the Institutional Framework for Agricultural Cooperatives, Collective Organizations and Entrepreneurship of the Rural World; Government Gazette A’ 210/21.09.2011; Hellenic Republic: Athens, Greece, 2011. [Google Scholar]
  12. Stigler, G.J. The economics of information. J. Polit. Econ. 1961, 69, 213–225. [Google Scholar] [CrossRef] [Scilit] [PubMed]
  13. Baye, M.R.; Morgan, J.; Scholten, P. Price dispersion in the small and in the large: Evidence from an internet price comparison site. J. Ind. Econ. 2004, 52, 463–496. [Google Scholar] [CrossRef] [Scilit]
  14. Anania, G.; Nisticò, R. Price dispersion and seller heterogeneity in retail food markets. Food Policy 2014, 44, 190–201. [Google Scholar] [CrossRef] [Scilit]
  15. Graddy, K. Testing for imperfect competition at the Fulton Fish Market. RAND J. Econ. 1995, 26, 75–92. [Google Scholar] [CrossRef] [Scilit]
  16. Kirman, A.P.; Vignes, A. Price dispersion: Theoretical considerations and empirical evidence from the Marseilles fish market. In Issues in Contemporary Economics, Vol. 1: Markets and Welfare; Arrow, K.J., Ed.; Macmillan: London, UK, 1991; pp. 160–185. [Google Scholar] [CrossRef] [Scilit] [PubMed]
  17. van den Berg, G.J.; van Ours, J.C.; Pradhan, M.P. The declining price anomaly in Dutch rose auctions. Am. Econ. Rev. 2001, 91, 1055–1062. [Google Scholar] [CrossRef] [Scilit]
  18. Searle, F. Could Britain Learn from Belgium’s Auction System? Fresh Produce Journal (Fruitnet). 13 April 2023. Available online: https://www.fruitnet.com/fresh-produce-journal/could-britain-learn-from-belgiums-auction-system/248793.article (accessed on 12 July 2026).
  19. Kambil, A.; van Heck, E. Reengineering the Dutch flower auctions: A framework for analyzing exchange organizations. Inf. Syst. Res. 1998, 9, 1–19. [Google Scholar] [CrossRef] [Scilit]
  20. Katsoulaki, M.; Kougra, N. Statistical Analysis of Vegetable Auction Prices in Crete. Bachelor’s Thesis, Technological Educational Institute of Crete, Heraklion, Greece, 2016. (In Greek) [Google Scholar]
  21. Kalabalis, E.I. Agricultural Product Auctions: A Case Study of the Dodecanese. Master’s Thesis, Agricultural University of Athens, Athens, Greece, 2013. (In Greek) [Google Scholar]
  22. Anastasiadis, F.; Liontakis, A.; Tsoulfas, G.T. End-to-end mapping towards sustainability: The case of the Cretan vegetable supply chain. In Value Chain Dynamics in a Biodiverse Environment: Advances in Biodiversity, Sustainability, and Agri-Food Supply Chain Development; Mattas, K., Baourakis, G., Zopounidis, C., Staboulis, C., Eds.; Cooperative Management; Springer: Cham, Switzerland, 2024; pp. 1–14. [Google Scholar] [CrossRef] [Scilit]
  23. Baye, M.R.; Morgan, J.; Scholten, P. Information, search, and price dispersion. In Handbook on Economics and Information Systems; Hendershott, T., Ed.; Elsevier: Amsterdam, The Netherlands, 2006; pp. 323–375. [Google Scholar] [CrossRef] [Scilit]
  24. Burdett, K.; Judd, K.L. Equilibrium price dispersion. Econometrica 1983, 51, 955–969. [Google Scholar] [CrossRef] [Scilit]
  25. Vignes, A.; Etienne, J.-M. Price formation on the Marseille fish market: Evidence from a network analysis. J. Econ. Behav. Organ. 2011, 80, 50–67. [Google Scholar] [CrossRef] [Scilit]
  26. Härdle, W.; Kirman, A. Nonclassical demand: A model-free examination of price-quantity relations in the Marseille fish market. J. Econom. 1995, 67, 227–257. [Google Scholar] [CrossRef] [Scilit]
  27. Graddy, K. Markets: The Fulton Fish Market. J. Econ. Perspect. 2006, 20, 207–220. [Google Scholar] [CrossRef] [Scilit]
  28. Gobillon, L.; Wolff, F.-C.; Guillotreau, P. The effect of buyers and sellers on fish market prices. Eur. Rev. Agric. Econ. 2017, 44, 149–176. [Google Scholar] [CrossRef] [Scilit]
  29. Backus, M.; Podwol, J.U.; Schneider, H.S. Search costs and equilibrium price dispersion in auction markets. Eur. Econ. Rev. 2014, 71, 173–192. [Google Scholar] [CrossRef] [Scilit]
  30. Varian, H.R. A model of sales. Am. Econ. Rev. 1980, 70, 651–659. [Google Scholar]
  31. Roberts, M.J.; Supina, D. Output price and markup dispersion in micro data: The roles of producer heterogeneity and noise. Adv. Appl. Microecon. 2000, 9, 1–36. [Google Scholar] [CrossRef] [Scilit]
  32. Maestas, N.; Schroeder, M.; Goldman, D. Price Variation in Markets with Homogeneous Goods: The Case of Medigap; NBER Working Paper 14679; National Bureau of Economic Research: Cambridge, MA, USA, 2009. [Google Scholar] [CrossRef] [Scilit]
  33. Liontakis, A. Food price inflation rates in the Euro zone: Distribution dynamics and convergence analysis. Econ. Res. Int. 2012, 2012, 868216. [Google Scholar] [CrossRef] [Scilit]
  34. Liontakis, A.; Kremmydas, D. Food inflation in the European Union: Distribution analysis and spatial effects. Geogr. Anal. 2014, 46, 148–164. [Google Scholar] [CrossRef] [Scilit]
  35. Heezen, J.; Baets, W. The impact of electronic markets: The case of the Dutch flower auctions. J. Strateg. Inf. Syst. 1996, 5, 317–333. [Google Scholar] [CrossRef] [Scilit]
  36. Guillotreau, P.; Jiménez-Toribio, R. The price effect of expanding fish auction markets. J. Econ. Behav. Organ. 2011, 79, 211–225. [Google Scholar] [CrossRef] [Scilit]
  37. Koppius, O.R.; van Heck, E.; Wolters, M.J.J. The importance of product representation online: Empirical results and implications for electronic markets. Decis. Support Syst. 2004, 38, 161–169. [Google Scholar] [CrossRef] [Scilit]
Figure 1. (a) (in the left) Location of the study area, Ierapetra in south-eastern Crete, Greece. Natural Earth (public domain). Source: authors’ own elaboration; (b) (in the right) Locations of the vegetable auctions serving the Ierapetra area (source: [6]).
Agriculture 16 01830 g001
Figure 2. Auction price levels and within-day dispersion by product, showing the monthly mean price (line) and the typical within-day range (shaded band = monthly average of the daily minimum and maximum price). Note: the full November 2019–May 2026 series is shown for visual continuity. Source: authors’ own elaboration.
Agriculture 16 01830 g002
Figure 3. Within-day relative price spread (max − min)/mean by product; boxes show the interquartile range and median. Source: authors’ own elaboration.
Agriculture 16 01830 g003
Figure 4. Distribution of the within-day relative spread by product group (lower-priced commodities vs. higher-priced products), with each group’s median marked. Source: authors’ own elaboration.
Agriculture 16 01830 g004
Figure 5. Season average within-day spread (left) and season volatility (right) by product; a season runs from November (year t) to May (year t + 1). Source: authors’ own elaboration.
Agriculture 16 01830 g005
Figure 6. Seasonality of within-day price dispersion (monthly average relative spread), full 12-month series; the shaded band marks the November–May window used for the indicators in Table 1. Source: authors’ own elaboration.
Agriculture 16 01830 g006
Figure 7. Dispersion ladder showing the median within-day relative spread (max − min)/mean by product, ranked from lowest to highest, relative to the higher-priced-product reference band [5.5–14.6%] (shaded, defined as the p25–p75 of the three higher-priced products), with the median (9.3%) marked. Source: authors’ own elaboration.
Agriculture 16 01830 g007
Table 1. Summary indicators by product (November 2019–May 2026; November–May trading window). Mean Price range = min–max of the daily mean price; Spread = within-day (max − min)/mean; Volatility SD = standard deviation of the daily % change in the mean price; Mean abs. change = mean absolute daily % change in the mean price; CV = coefficient of variation of the mean price.
ProductNMean €/kgMean Price Range €/kgSpread Mean %Spread Median %Spread p90%Spread Max %Volatility SD %Mean abs. Change %CV Mean %
Cucumber10950.890.16–2.7233.628.06615017.612.254
Tomato10720.920.22–2.9838.233.77113814.710.545
Florina pepper9981.660.38–3.5810.18.7195011.07.739
Horn pepper10681.290.25–3.8710.98.9216513.09.051
Knossos cucumber10520.940.16–2.8133.229.95812121.115.254
Lobello tomato9962.190.53–6.3012.710.4247611.58.143
Source: authors’ own elaboration.
Table 2. Dispersion relative to the higher-priced-product reference band (lower bound p25 = 5.5%, upper bound p75 = 14.6%) and income-at-risk. The band is the interquartile range of the within-day spreads observed for the three higher-priced products, a descriptive reference derived from the same data. Mean distance above p75 = the average amount, in percentage points (pp), by which the spread exceeds the upper bound (14.6%), taken over the days on which it does exceed it. Downside = (mean − min)/mean, the shortfall of a seller clearing at the daily minimum relative to the day’s mean price; Mean downside and Downside p90 report, respectively, its average and its 90th percentile across product-days. Source: authors’ own elaboration.
Product% Days > 5.5% (p25)% Days > 14.6% (p75)Mean Distance Above p75 (pp)Mean
Downside %
Downside p90%
Cucumber978324.016.131
Tomato988927.218.935
Florina pepper74215.75.010
Horn pepper73238.45.411
Knossos cucumber978622.515.728
Lobello tomato78319.16.212
Table 3. Robustness of the within-day relative spread to thin trading and to the price level (November–May window). Single-price days = product-days on which the minimum, maximum and mean coincide; these are excluded from all indicators reported in this study. Days with ≥3 distinct prices = product-days on which the recorded transaction mean differs from the midpoint of the daily range, expressed as a percentage of valid product-days. Gradient = OLS slope of the relative spread (in percentage points) on the natural logarithm of the daily mean price, estimated separately within each product. Source: authors’ own elaboration.
ProductSingle-Price Days %Days with ≥3 Distinct Prices %Spread, All Valid Days %Spread, Days with ≥3 Prices %Gradient dS/dln(P)
Cucumber2.193.633.634.3−16.1
Tomato2.193.338.238.8−26.1
Florina pepper7.389.210.110.4−4.9
Horn pepper4.289.010.911.3−8.0
Knossos cucumber4.095.533.233.7−16.2
Lobello tomato8.392.112.713.1−8.4
Disclaimer/Publisher’s Note: The statements, opinions and data contained in all publications are solely those of the individual author(s) and contributor(s) and not of MDPI and/or the editor(s). MDPI and/or the editor(s) disclaim responsibility for any injury to people or property resulting from any ideas, methods, instructions or products referred to in the content.