Article

Quantitative Relationship Between Microstructure and Mechanical Properties of Taro Stem: Spatial Heterogeneity Revealed by Image Analysis


1
School of Information and Communication Engineering, Hainan University, Haikou 570100, China
2
Hainan Institute of Northwest A&F University, Sanya 572000, China
3
Institute of Agricultural Machinery, Chinese Academy of Tropical Agricultural Sciences, Zhanjiang 524000, China
4
School of Breeding and Multiplication (Sanya Institute of Breeding and Multiplication), Hainan University, Sanya 572000, China
*
Author to whom correspondence should be addressed.
Agriculture 2026, 16(17), 1817; https://doi.org/10.3390/agriculture16171817
Submission received: 28 July 2026 / Revised: 16 August 2026 / Accepted: 18 August 2026 / Published: 25 August 2026
(This article belongs to the Section Agricultural Technology)

Abstract

Taro (Colocasia esculenta) stems are promising bio-based feedstocks for composite materials, textile fibres and adsorbents; however, a quantitative understanding of how their microstructure governs mechanical behaviour remains lacking, constraining their application. This study conducted mechanical tests and scanning electron microscopy (SEM) tests on stems harvested from different ground elevations. The results show that axial tensile strength (σt) and nominal radial compressive stress (σc) increase first and then decrease with height above ground. σt (2.67 MPa) and σc (7.64 MPa) both peak at 50–100 mm above ground level. Furthermore, the ultimate nominal compressive strength (σc) is significantly higher than the ultimate tensile strength (σt) at all heights above ground. Correlation analysis revealed that cross-sectional area Ac (r = 0.83), fibre bundle area fraction Pc (r = 0.78) and fibre wall thickness Tc (r = 0.77) were significantly positively correlated with σt, while Ac (r = 0.62) and Tc (r = 0.70) were positively correlated with σc. The tensile and compressive properties are closely associated with three microstructural parameters: cross-sectional area, fibre bundle area fraction, and fibre wall thickness—whereas fibre cell area shows only weak correlations with all mechanical indicators (r < 0.5) and is not a key regulatory factor. The stem cross-section transitions from crescent at the base to near-circular at the apex, with the reduction in bearing area underlying the decline in mechanical properties. These results offer a fundamental basis for tailoring mechanical preprocessing parameters and for selective utilisation of stem segments with distinct mechanical performance, thereby supporting the efficient conversion of this abundant biomass into value added materials.

1. Introduction

Taro (Colocasia esculenta) is a tropical and subtropical crop whose stems are rich in fibre and offer potential for food applications, biodegradability, and chemical processing, with broad prospects in industrial sectors such as biomass resources, textiles, and functional adsorbents [1,2,3]. However, the rational utilisation of taro stems as an engineering material requires a quantitative understanding of their mechanical behaviour and its microstructural origins, which remain largely unexplored.
The microstructure of crop stems plays a crucial regulatory role in their nutritional quality, mechanical properties and end-product performance, and related studies have revealed this relationship at multiple scales. Wang et al. (2025) found that increasing cell wall components in wheat stems significantly enhances their mechanical strength [4]. Huang et al. (2017) observed that microscopic parameters such as cell wall thickness and vascular bundle diameter directly influence the macroscopic mechanical properties of maize stalks, including their compressive strength [5]. Xiao et al. (2025) confirmed that molecular mixing patterns, rather than lignin content per se, are the key determinants of material properties [6]. Xiang et al. (2025) established correlations between peanut kernel microstructure (surface morphology, single-cell) and both engineering properties (density, porosity) and nutritional composition (proteins, sucrose) [7]. Robertson et al. (2022) reported that stalk architecture has approximately four times the influence of chemical composition on bending strength in maize and sorghum [8]. Xue et al. (2023) revealed that three types of material-protoplasts, parenchyma cell walls and collenchyma cell walls-influence the biomechanical behaviour of rice seedling stems under mechanical loading [9]. Collectively, these multi-species studies confirm that internal microstructure—encompassing tissue thickness, fibre bundle density and cell wall composition—is decisive in determining macroscopic mechanical properties. However, most of these studies have focused on single-height or bulk measurements, with limited attention to the systematic variation in microstructure along the stem axis and its quantitative relationship with mechanical performance across different height sections. This lack of height-resolved data hinders the precise design of graded biomass utilisation strategies.
It is worth noting that the microstructure and mechanical properties of stems are not uniformly distributed, but rather exhibit significant gradient differences along the plant’s height from the ground. Research conducted by Li et al. (2012) revealed that the fibre sizes, crystallisation degrees, and mechanical properties of different height parts of the collected cannabis stems varied [10]. Wang et al. (2025) showed that vascular bundle distribution patterns across maize internodes are closely associated with yield traits, with basal internodes exhibiting more stable microstructure than apical ones [11]. Han et al. (2025) identified the order of importance of factors affecting tea stem shear strength as stem segment position > variety > moisture content > shear rate, providing a reference for understanding stem biomechanics, improving resource utilisation and optimising cutting device design [12]. Li et al. (2024) found that the maximum inter-tissue separation force and tensile strength of high-moisture maize silage stalks increase with internode position from the base [13]. Shi et al. (2025) reported that vascular bundle stiffness in rice stems decreases gradually from base to apex, with bundle cross-sectional area and sheath area as the main determinants [14]. Collectively, existing studies consistently demonstrate that structural variation along the vertical axis is not a crop-specific phenomenon but a universal pattern in plant stem development. This longitudinal heterogeneity must therefore be fully considered in stem resource utilisation research. Relying on single-location measurements to represent overall stem mechanical properties would not only hinder the precise design of key parameters for harvesting, cutting and shredding equipment, but also introduce substantial systematic biases in assessing fibre extraction efficiency, predicting composite material performance and guiding graded raw material utilisation. Despite the growing recognition of longitudinal heterogeneity, quantitative studies that systematically correlate height-dependent microstructural features with mechanical properties across multiple height sections remain scarce, particularly for species with irregular cross-sectional morphologies such as taro.
Scanning electron microscopy (SEM), with its high-resolution imaging capabilities, is able to clearly visualise the microstructural characteristics of pecans [15], flax stalks [16] and tea stalks [17]. Coupled with image processing techniques, SEM provides reliable data support for the development of quantitative models relating microstructure to mechanical properties. Existing research on taro stems has primarily focused on composite materials and fibre preparation processes [18]; however, studies on their mechanical properties remain insufficient, and quantitative investigations into the relationship between mechanical properties and microstructure are still lacking. Specifically, the following critical gaps remain unaddressed: (i) the axial tensile and radial compressive behaviours of taro stems have not been systematically characterised across different height sections; (ii) the quantitative contributions of key microstructural parameters—such as cross-sectional area, fibre bundle area fraction, fibre wall thickness, and fibre cell area—to mechanical performance have not been established; and (iii) the extent to which longitudinal variations in microstructure drive the observed spatial heterogeneity in mechanical properties remains unknown. These gaps not only limit our fundamental understanding of taro stem biomechanics but also impede the rational design of processing parameters for fibre extraction and composite material fabrication. To utilise taro stem efficiently in composite products, it is necessary to better understand the mechanical properties at the microscopic level.
This study aims to: (1) determine mechanical parameters, including maximum axial tensile strength and maximum nominal radial compressive strength, and to elucidate the typical mechanical responses and failure modes of taro stems during tensile and compressive loading; (2) analyse the microstructural differences in cross-sectional area, fibre bundle area fraction, fibre wall thickness and fibre cell area of stems at different heights above ground; (3) establish quantitative relationships between the microstructural parameters and mechanical properties. The results of this study will provide a theoretical basis for graded stem utilisation, optimisation of fibre processing techniques and selection of taro varieties with superior mechanical performance.

2. Materials and Methods

2.1. Taro Stem Samples Collection and Preparation

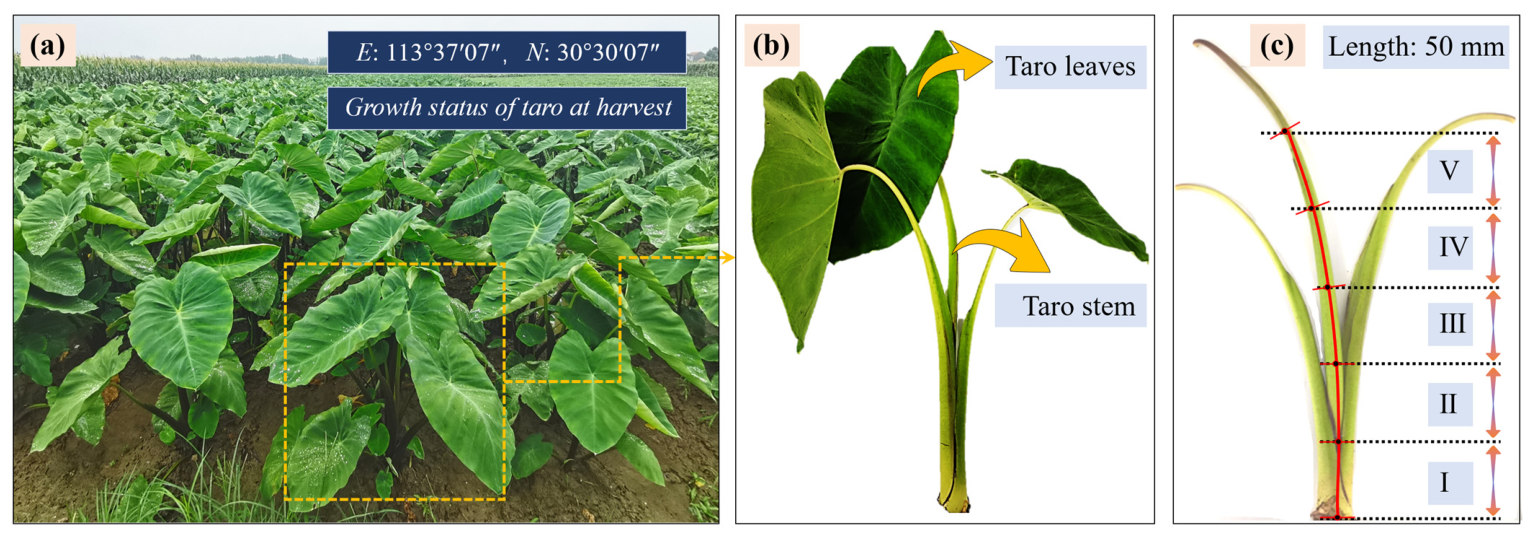
Sixty taro plants that had reached maturity—free from damage, pests and diseases, and exhibiting uniform growth—were collected from the field at Hanchuan City, Hubei Province (E: 113°37′07″, N: 30°30′07″) in August 2024. The 60 healthy plants were randomly divided into five groups of 12 plants, with each group corresponding to one of the five height intervals. From each group, 5 plants were randomly selected for tensile tests and 5 for radial compression tests. For the same 5 plants used for mechanical tests, additional adjacent stem segments were collected for SEM observation. The remaining 2 plants served as backups. Following collection, the taro tubers and leaves were removed, and the stems were cut at ground level. Using a digital vernier calliper (Model 500-172-30, Mitutoyo Corporation, Kawasaki, Japan, accuracy 0.01 mm), samples were taken from five sections based on height above ground: 0–50 mm (base, I), 50–100 mm (lower section, II), 100–150 mm (middle, III), 150–200 mm (upper, IV) and 200–250 mm (top, V), as shown in Figure 1. Immediately after sampling, the specimens were placed in sealed food-grade bags to prevent moisture loss and rapidly transferred to a 4 °C refrigerator for storage in preparation for subsequent mechanical testing and microstructural observation.
Moisture content was determined using an SDH-1202 rapid halogen moisture analyser (Zhejiang Saide Instrument Equipment Co., Ltd., Shaoxing, China, accuracy 0.002 g). The samples were heated at 105 °C until constant weight was achieved [18]. The average moisture contents of the I, II, III, IV and V stem segments were (85.78 ± 0.54)%, (84.96 ± 0.42)%, (86.20 ± 0.48)%, (86.37 ± 0.51)% and (86.41 ± 0.39)%, respectively; the moisture content at the base was slightly lower than that in the middle and upper sections, with an overall coefficient of variation of only 0.98%. This indicates that moisture content was relatively consistent across all height sections, suggesting that its confounding effect on the comparison of mechanical properties among sections may be limited.

2.2. Axial Tensile Mechanical Tests

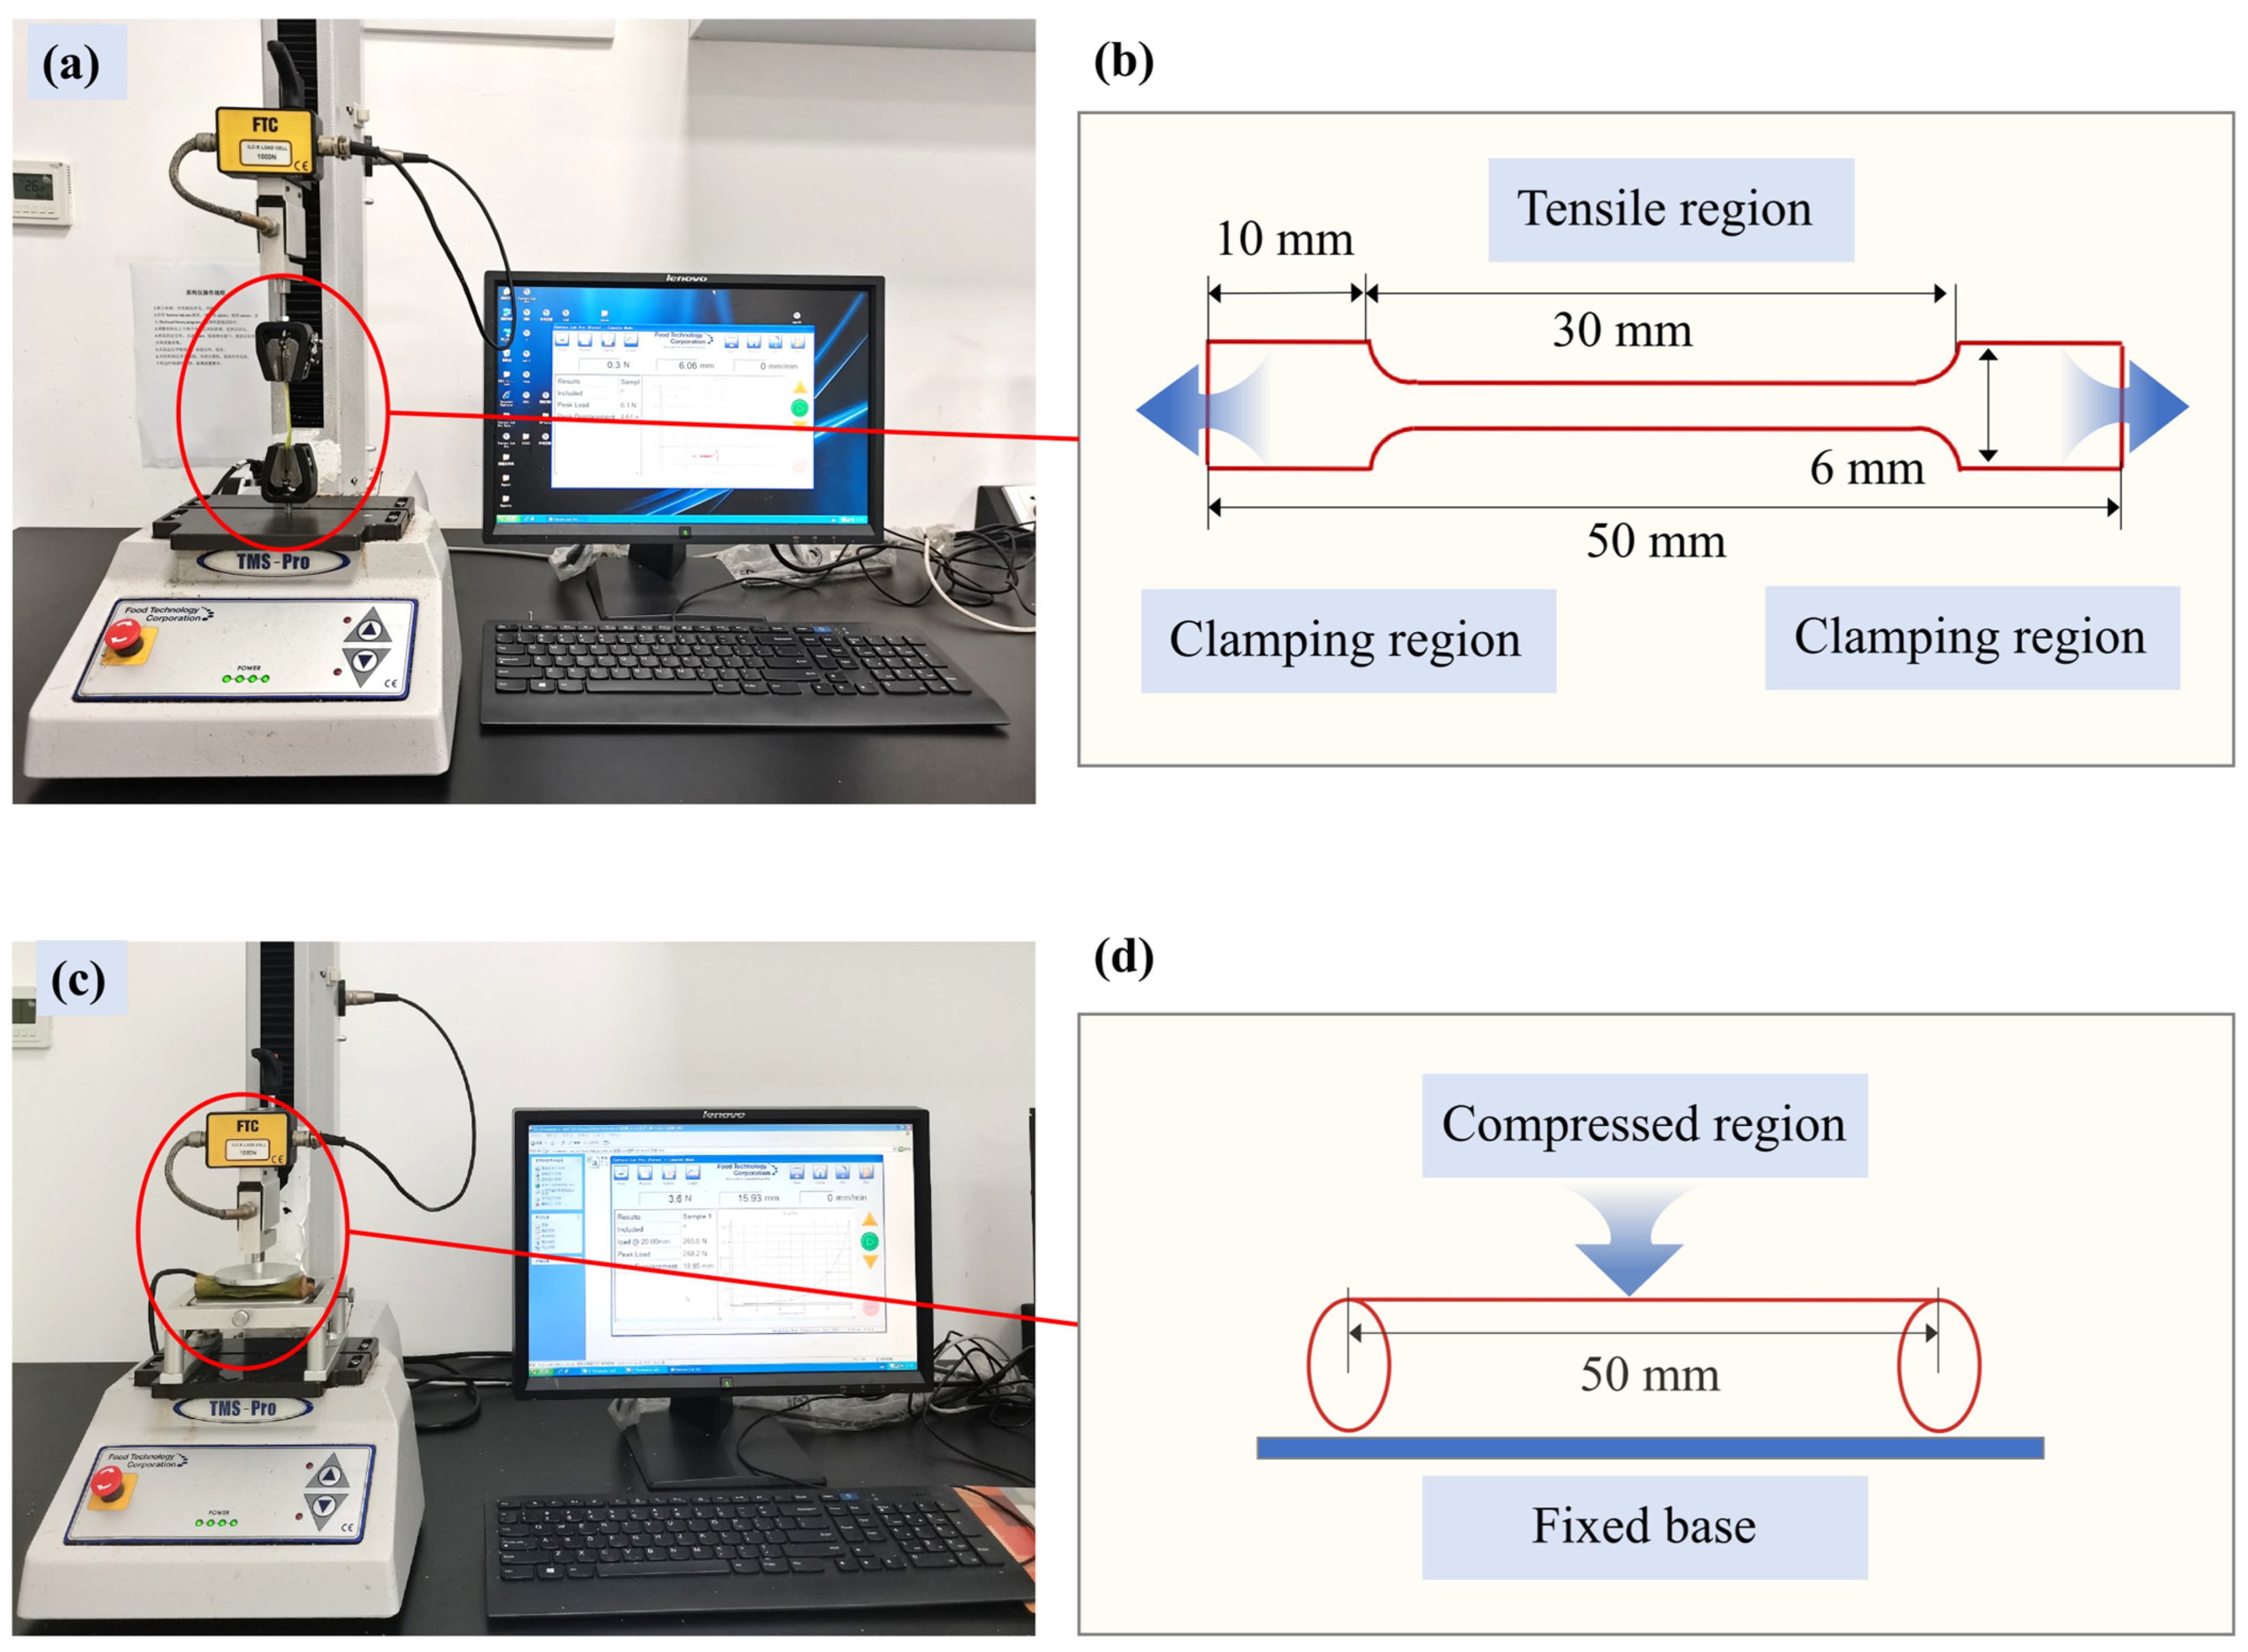
Dumbbell-shaped specimens were prepared for axial tensile testing to avoid grip-induced damage and ensure measurement accuracy [19,20]. The specimen geometry is shown in Figure 2, with overall length of 50 mm, effective tensile length of 30 mm, width of 6 mm, thickness of 3 mm, and grip width of 10 mm at each end. The dumbbell-shaped samples were cut longitudinally along the stem axis, with the flat surfaces corresponding to the radial-longitudinal plane of the stem. The width (6 mm) was measured across the tangential direction, and the thickness (3 mm) was measured in the radial direction. For each specimen, the width and thickness were measured individually at three positions along the effective gauge length using a digital vernier calliper (accuracy 0.01 mm), and the average of these three measurements was used as the representative dimensions for that specimen. The effective cross-sectional area (A) used in Equation (1) was then calculated as A = width × thickness. For the five replicates at each height interval, the measured widths ranged from 5.94 to 6.07 mm, and thicknesses ranged from 2.91 to 3.08 mm, with coefficients of variation below 2%, confirming the consistency of specimen preparation.
Tensile tests were performed on a TMS-PRO texture analyser (FTC, Sterling, VA, USA; accuracy ±1%, range 0–1000 N) at a loading rate of 50 mm/min and a return speed of 100 mm/min. Both the force and displacement transducers had an accuracy within ±1%, and data were acquired at 50 Hz. Prior to each test, a preload of 0.5 N was applied to eliminate the initial gap between the specimen and the grips, ensuring consistent starting conditions. Five replicates were performed for each height section.
The maximum axial tensile strength (σt) was calculated using Equation (1) [21].
σ t = F t max A
where Ftmax is the maximum tensile force (N), and A is the cross-sectional area of the effective stretch section (mm2).

2.3. Radial Compression Mechanical Tests

Specimens from sections I to V were trimmed at both ends to ensure parallel and smooth surfaces, as shown in Figure 2. Compression tests were conducted on a TMS-PRO texture analyser (Model TMS-PRO, Food Technology Corporation, Sterling, VA, USA) using a rigid flat platen (50 mm diameter) to ensure uniform stress distribution during loading. The test was performed at a loading speed of 10 mm/min, with a return speed of 100 mm/min, and data were acquired at 50 Hz. Five replicates were performed for each height section.
All specimens were oriented consistently during testing, with the flat (outer) side of the stem facing upward and the crescent-shaped cavity facing downward toward the lower platen. The characteristic dimension D was defined as the average transverse diameter of the specimen measured perpendicular to the loading direction. For each specimen, D was determined by measuring the diameter at three positions along the specimen length (top, middle, and bottom) using a digital vernier calliper (accuracy 0.01 mm), and then averaging the three values. For the irregular basal sections (Section I), the measurement was taken as the maximum transverse width at each position. The tests were terminated when the compressive strain reached approximately 50% of the original diameter, following common practice for biological tissue compression. The maximum load Fcmax was identified as the peak force recorded on the force–displacement curve during the test.
The maximum nominal radial compressive strength σc was calculated using Equation (2) [22,23].
σ c = F c max l D
where Fcmax is the maximum compressive force (N); l is the specimen length (mm); D is the average transverse diameter (mm) of the specimen as defined above. It should be noted that this parameter represents a nominal (engineering) stress based on the average cross-sectional dimension, rather than an intrinsic compressive strength.

2.4. Scanning Electron Microscopy Tests and Microstructural Image Processing Methods

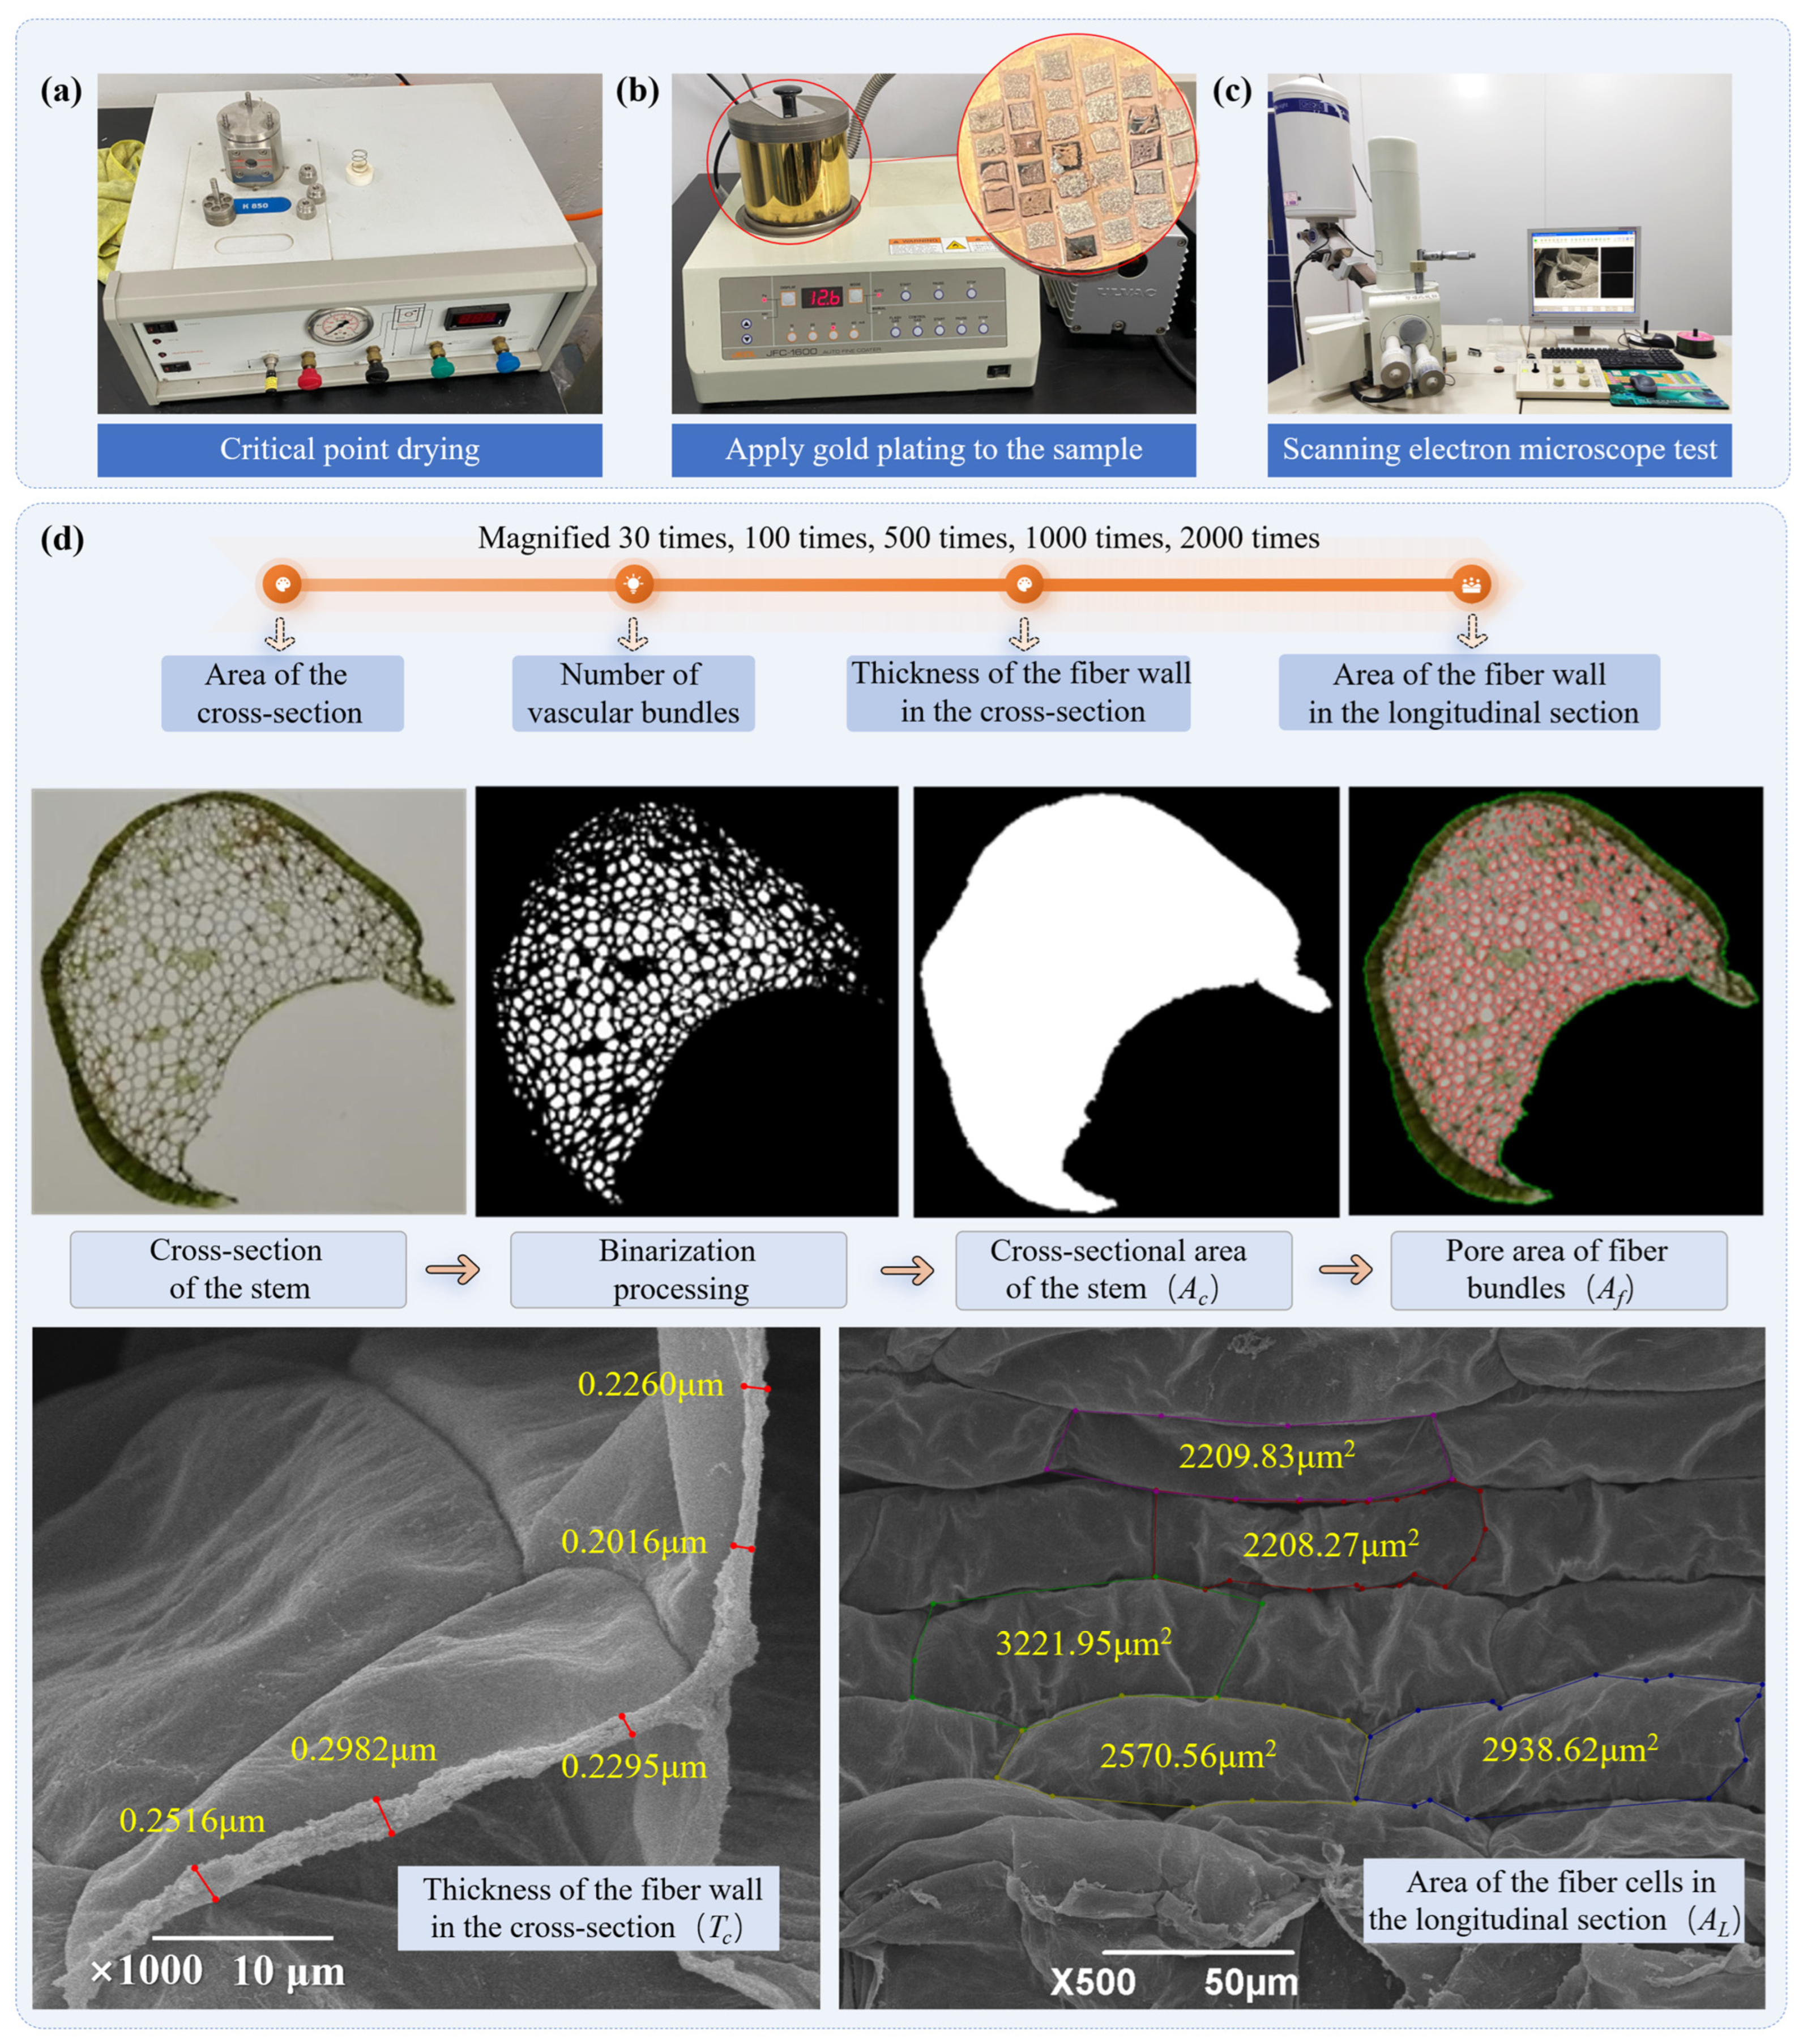
Cross-sections of stem samples from different heights above ground were cut into 3 mm × 3 mm pieces. After sectioning, the samples were immersed in 3% glutaraldehyde fixative using toothpicks and fixed for at least 24 h. The samples were then dried using critical-point drying with a Quorum critical-point dryer (Quorum Technologies Ltd., East Grinstead, West Sussex, UK) under CO2 critical-point conditions (31 °C, 7.4 MPa) (Figure 3a). Isoamyl acetate was used as the intermediate medium to minimise surface tension-induced damage to the biological samples [24]. The dried samples were mounted on specimen stubs and sputter-coated with gold using a JFC-1600 ion sputter coater (JEOL Ltd., Tokyo, Japan, K850) (Figure 3b). After coating, a JSM-6390LV scanning electron microscope (JEOL Ltd., Tokyo, Japan, magnification range 5–300,000 times) was used to observe the microstructural features of the stem cross-sections at different heights above ground (Figure 3c). Images were captured at magnifications of 30×, 100×, 500×, 1000× and 2000×, respectively.
For whole-stem cross-section imaging, a Manta G-505B industrial camera (Allied Vision, Stadtroda, Germany) equipped with a Sony IMX264 CMOS sensor (Sony Semiconductor Solutions Corporation, Atsugi, Kanagawa, Japan) (5.1 megapixels, 2448 × 2048 pixels) and a Computar M1214-MP2 12 mm fixed focal length lens (CBC Co., Ltd./Computar, Tokyo, Japan) was used. The imaging conditions were as follows: working distance = 150 mm (fixed for all samples); magnification = 0.5× (field of view ≈ 9.8 mm × 8.2 mm); spatial calibration = 250 pixels per mm (determined using a 1 mm grid calibration scale, captured under identical conditions); image resolution = 2448 × 2048 pixels; illumination = uniform LED ring light (2000 lux) positioned at a 45° angle to the sample plane, maintained consistently for all images; exposure time = 50 ms; gain = 0 dB; white balance = manual preset. To ensure imaging conditions were identical for all samples, the camera, lens, illumination, and working distance were not adjusted throughout the entire imaging session. A calibration scale was imaged at the beginning and end of each session to verify stability.
To minimise human measurement error, image processing was performed using the OpenCV library. The complete image-processing pipeline comprised the following steps, with all parameters fixed consistently across all images:
Step 1—Segmentation using GrabCut: The GrabCut algorithm was initialised by manually drawing a rectangular bounding box around the stem cross-section in each image, with a 5-pixel margin from the estimated boundary to ensure full inclusion of the foreground. The algorithm was then run for 5 iterations of the iterative energy-minimisation scheme (OpenCV implementation).
Step 2—Binarization: The segmented foreground was converted to greyscale and binarized using Otsu’s automatic thresholding method (cv2.threshold with cv2.THRESH_OTSU) to generate binary images of the fibre bundles. For the whole-stem cross-section images, a fixed threshold of 127 (on the 0–255 greyscale range) was applied after Otsu thresholding to ensure consistent separation of stem tissue from background.
Step 3—Morphological opening: The fibre bundle binary image was processed with a morphological opening operation (cv2.morphologyEx with cv2.MORPH_OPEN) using a 5 × 5 elliptical structuring element (cv2.getStructuringElement(cv2.MORPH_ELLIPSE, (5,5))) for one iteration to remove noise and eliminate high-threshold artefacts.
Step 4—Edge detection: The Canny edge detector (cv2.Canny) was applied to both binary images with the following parameters: lower threshold = 50, upper threshold = 150, aperture size = 3, L2gradient = False.
Step 5—Contour extraction: Contours were extracted using cv2.RETR_EXTERNAL mode, which retrieves only the outermost contours and ignores internal holes, with cv2.CHAIN_APPROX_SIMPLE for contour approximation [25].
Step 6—Area calculation: Finally, the pixel areas of fibre bundles (Af) and the total cross-sectional pixel area of the stem (Ac) were calculated using the contourArea algorithm. In this segmentation, the foreground represents the fibre bundles, which appear as distinct contrasting regions in the SEM images, while the background represents the surrounding parenchyma (ground) tissue. Ac is reported in pixels because it is used exclusively as the denominator in the fibre bundle area fraction calculation, where both Af and Ac are measured in the same unit, and the ratio is dimensionless. Reporting Ac in pixels does not affect the calculation of Pc or any of the reported correlations.
The fibre bundle area fraction (Pc) is used to quantify the proportion of the stem cross-section occupied by fibre bundles:
P c = A f A c
It should be noted that a higher Pc value indicates a greater abundance of load-bearing vascular bundle tissue per unit cross-sectional area of the stem.
To ensure the reliability and reproducibility of the segmentation pipeline, a quantitative validation was performed on a representative subset of 10 images (including examples from each height section). For each image, manual annotations of the stem cross-section and fibre bundles were prepared using LabelMe software (https://labelme.io) as reference standards.
Fibre wall thickness (Tc) was determined from scanning electron micrographs of stem cross-sections at 1000× magnification. For each image, five measurement points were selected using a systematic random sampling protocol: the image was divided into five equal regions (top-left, top-right, centre, bottom-left, and bottom-right), and within each region, the fibre wall with the clearest visible boundaries was selected for measurement. For each selected fibre wall, the thickness was measured at three positions along its visible length, and the average of these three values was recorded as the representative thickness for that measurement point. This protocol ensured objective and representative sampling across the entire image. The coordinates of the endpoints were extracted using LabelMe software and used to calculate the average fibre wall thickness. The calibration was performed using a grating standard with 0.1 µm divisions (Ted Pella, Inc., Redding, CA, USA), with a calibration uncertainty of ±0.005 µm (coefficient of variation < 2% from 10 repeated measurements).
Fibre cell area (Al) was determined from scanning electron micrographs of longitudinal stem sections at 500× magnification (Figure 3d). For each image, five regions enclosing cell outlines of distinct colours were annotated using LabelMe software, and the corresponding coordinate data were exported as JSON files. Using a custom Python (https://www.python.org) script with the OpenCV library, the images were processed to extract pixel counts for each labelled region. A reference square of known dimensions within each image was used to calibrate the pixel-to-area conversion, yielding the pixel density (pixels·μm−2). The area of each target region was then calculated by dividing its pixel count by the pixel density, and the fibre cell area (Al) for each sample was reported as the average of five measurements per image.

2.5. Statistical Methods

Since each replicate came from an independent plant and only one height level was sampled per plant, a one-way analysis of variance (ANOVA) was employed, followed by Duncan’s multiple range test for post hoc comparisons. Pearson’s correlation analysis was used to examine relationships between mechanical and microstructural parameters. For each height section, mechanical tests and microstructural observations were performed on the same set of plants (n = 5 per height section; total n = 25), ensuring natural pairing of the data at the plant level. To account for the systematic variation in all parameters with stem height, partial correlation analysis controlling for height was also performed. Stepwise multiple linear regression was also employed to assess the relative contributions of Ac, Pc, Tc and height to σt and σc. All correlation coefficients are reported with their p-values and 95% confidence intervals. Origin 9.0 software was used for data analysis, processing and plotting, whilst SPSS Statistics 26.0 was employed to perform these analyses. All data are presented as mean ± standard deviation; the normality of the data was verified using the Shapiro–Wilk test, and homogeneity of variances was verified using Levene’s test; a p-value < 0.01 indicates a highly significant difference, whilst a p-value < 0.05 indicates a significant difference.

3. Results

3.1. Analysis of the Mechanical Response to Axial Tensile Forces

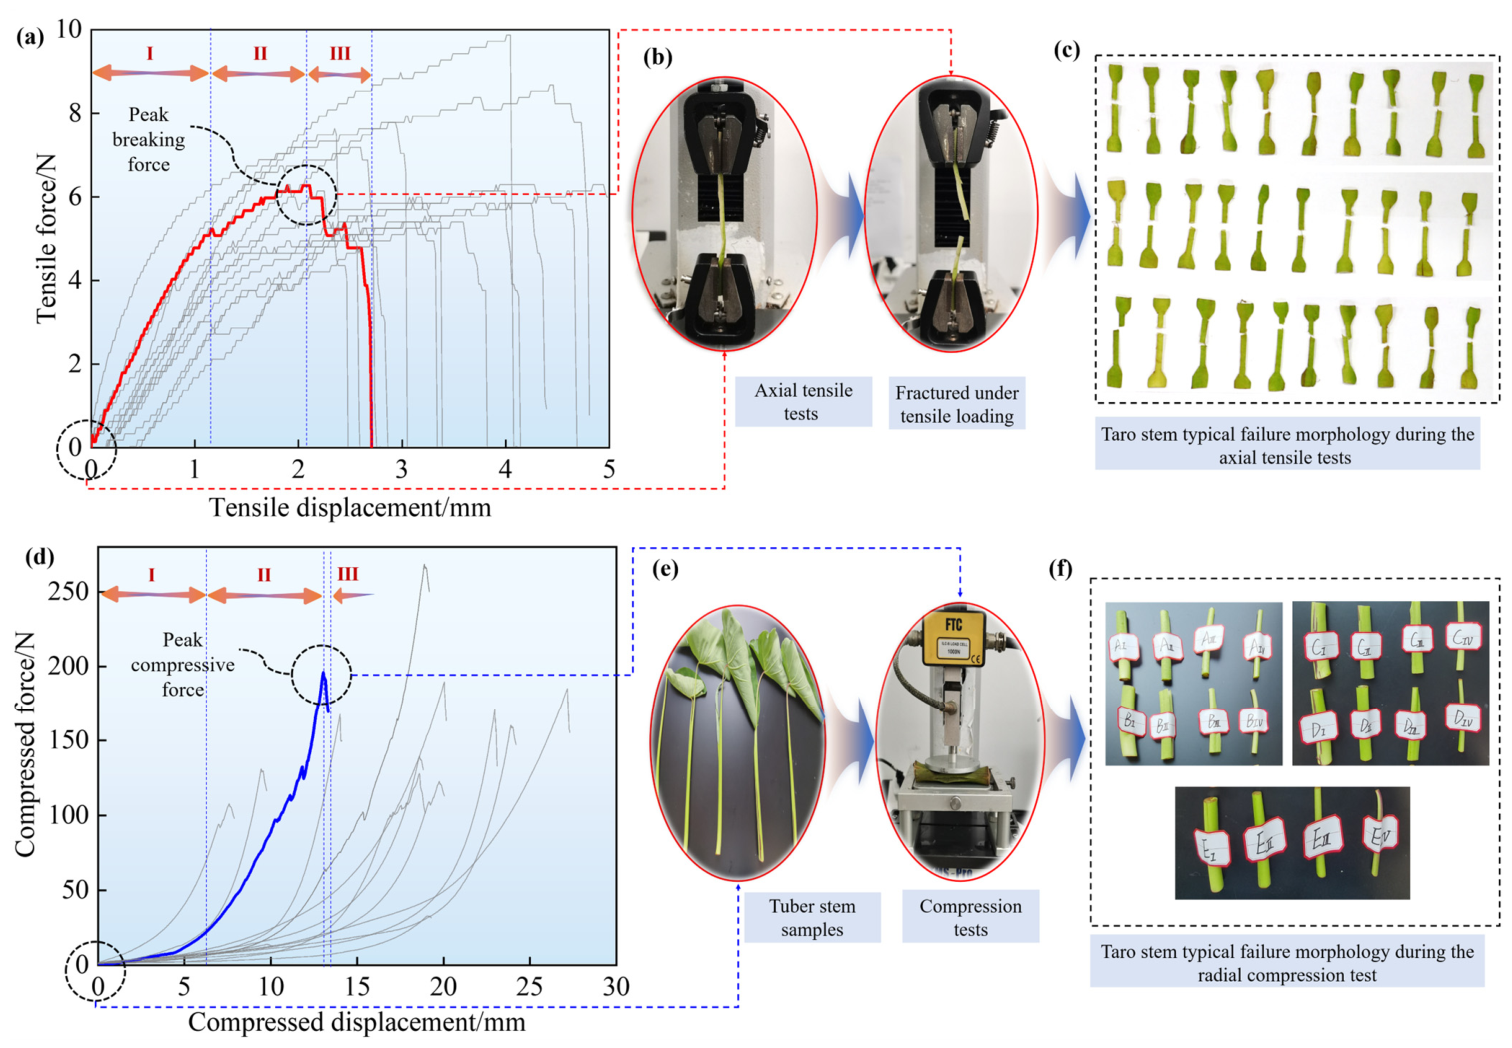
The tensile load–displacement curve of taro stems is presented in Figure 4a, which can be divided into three distinct stages. The first is the elastic deformation stage (EDS). At the onset of loading, the axial fibre bundles align with the tensile direction, and the tensile force increases approximately linearly with displacement. This stage is likely to be largely reversible, as the applied load remains below the yield threshold of the main load-bearing components, and no significant residual deformation was observed upon unloading in preliminary tests.
The second stage is the cumulative damage stage (CDS). As tensile displacement increases, the finer fibre bundles with relatively low load-bearing capacity reach their tensile limit first and undergo localised fracture. Owing to the inherent heterogeneity in fibre bundle diameter and wall thickness, the bundles may fail sequentially and intermittently, rather than simultaneously. Macroscopically, this is reflected in a slowly rising tensile load with repeated minor drops, which likely reflects the progressive accumulation of microdamage within the stem. This interpretation is consistent with the observation of fibre pull-out and fractured bundle ends on the post-failure fracture surfaces (Figure 4b,c).
The third stage is the plastic fracture stage (EFS). When the displacement approaches a critical value, the primary load-bearing fibre bundles approach their ultimate strain, and the tensile load rises rapidly to its peak within a short displacement interval. Beyond the peak, the remaining fibre bundles appear to fail completely in quick succession, and the load drops abruptly to zero, resulting in complete tensile fracture of the specimen. Representative failure modes are shown in Figure 4b,c.

3.2. Analysis of the Mechanical Response to Radial Compressive Forces

The load–displacement curve from the radial compression test is presented in Figure 4d and can be divided into three distinct stages. The first is the elastic deformation stage (EDS). At the onset of compression, the applied load primarily compresses the internal pores and intercellular spaces, with the fibre bundles undergoing only minor elastic deformation in the radial direction. During this stage, the compressive load increases slowly and approximately linearly with displacement, and the curve remains relatively flat.
The second stage is the slippage and reorganisation stage (SRS). As compressive displacement increases, the internal cavities and intercellular spaces of the stem are largely compressed, and the applied load is progressively transferred through the parenchyma tissue to the fibre bundles. This may cause adjacent fibre bundles to slip relative to one another and undergo rearrangement, accompanied by continuous microstructural damage. Macroscopically, these processes could manifest as a marked increase in the rate of load rise, with minor load fluctuations. This interpretation is supported by the observation of compressed and reoriented fibre bundles in SEM images of the compressed regions.
The third stage is the plastic damage stage (PDS). After the interfibrillar voids have been completely eliminated, the applied load acts directly on the parenchyma cells. The compressive load then rises steeply to its peak as the fibre bundles reach their ultimate radial bearing capacity, beyond which the internal structure sustains progressive crushing damage.

3.3. Effect of Stem Height Above Ground on σt and σc

Normality of the data was verified using the Shapiro–Wilk test, and homogeneity of variances was verified using Levene’s test (Table 1); all p-values were >0.05, confirming that the assumptions for ANOVA were met.
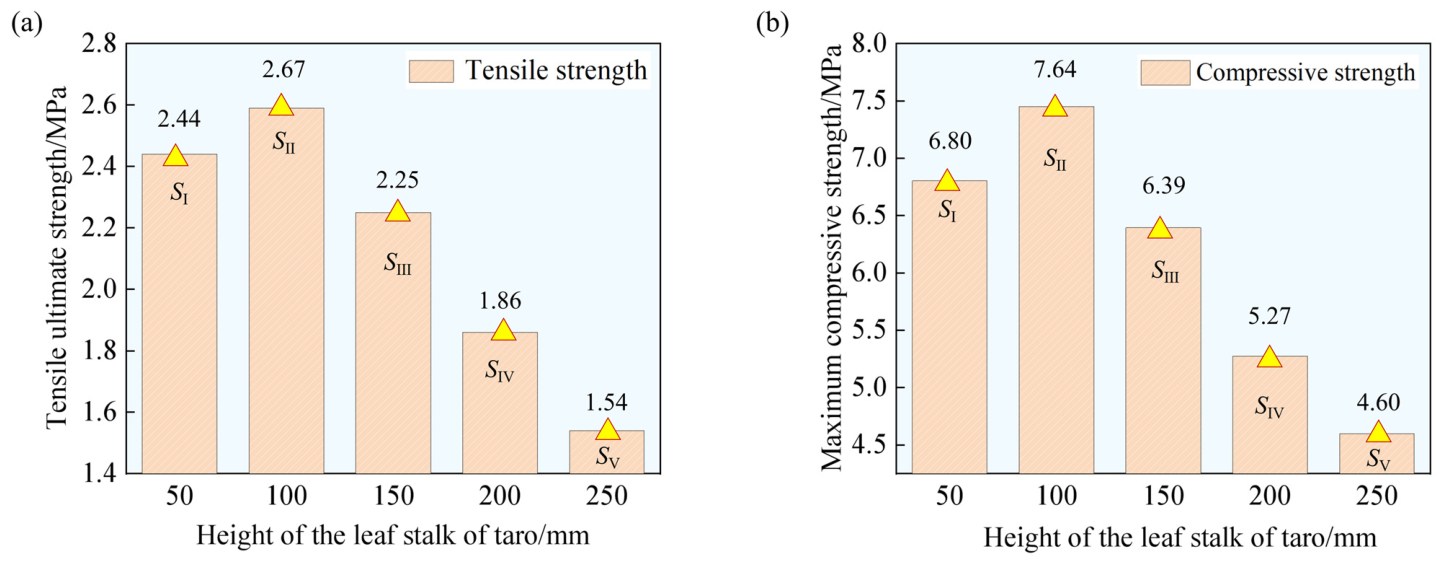
The trends in σt and σc with increasing stem height are presented in Figure 5. As the height above ground increased, σt initially increased and then decreased. It rose from 2.44 MPa at 0–50 mm (SI) to a peak of 2.67 MPa at 50–100 mm (SII), a 9.43% increase, and then progressively declined to 1.54 MPa at 200–250 mm (SV), a 42.32% reduction relative to SII. Duncan’s multiple range test (Table 2) confirmed that σt at SII was significantly higher than at SIV and SV (p < 0.05), while the differences between SI, SII, and SIII were not statistically significant.
A similar trend was observed for σc, which increased from 6.80 MPa (SI) to a maximum of 7.64 MPa at 50–100 mm (SII)—a 12.35% increase—and then decreased continuously to 4.60 MPa at 200–250 mm (SV), a 39.79% decrease relative to SII. Duncan’s test (Table 2) showed that σc at SII was significantly higher than at SIV and SV (p < 0.05), while the difference between SI and SII was not statistically significant.
Notably, both σt and σc exhibited a unimodal pattern with height, peaking at the same height of 50–100 mm, and the peak value of σc was considerably higher than that of σt across all heights, indicating that the stems are more resistant to compressive loading than to tensile loading.

3.4. Spatial Patterns of Microstructural Changes in Stems with Increasing Height

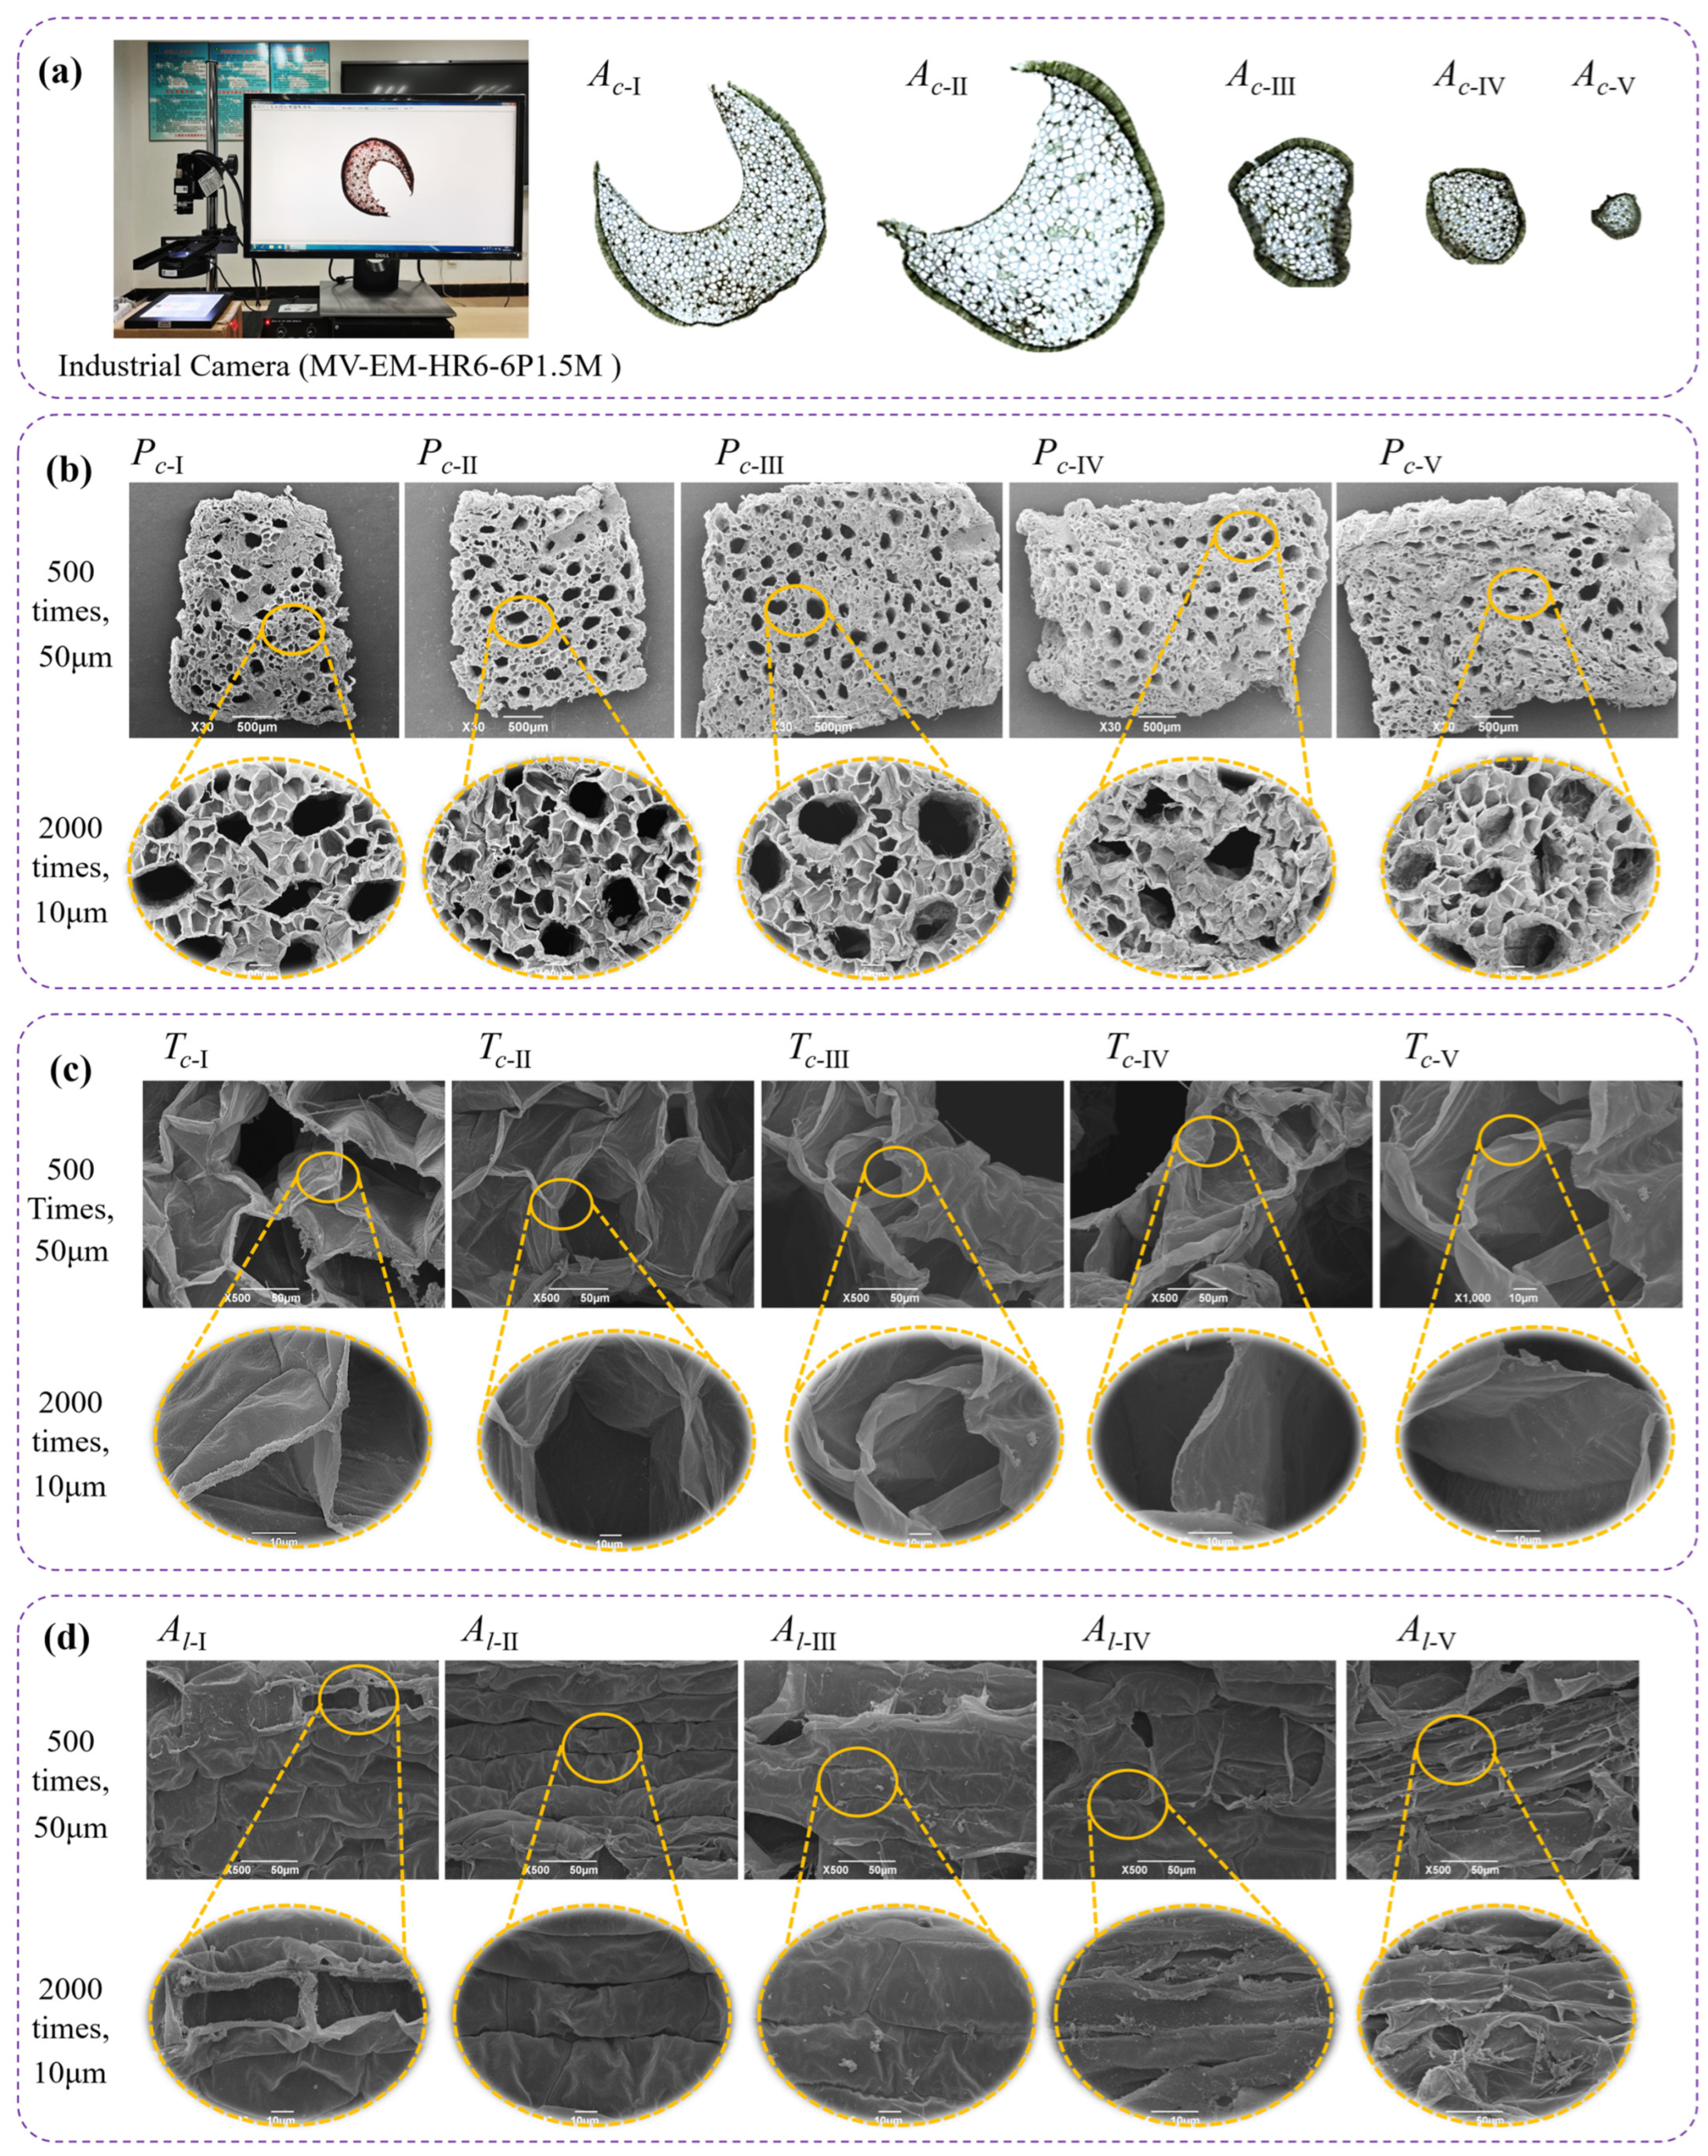
The taro stem cross-section exhibits a layered structure, characterised by a dense outer epidermis and loose, porous internal parenchyma tissue (Figure 6a). Notably, the Ac-I and Ac-II samples near the base display a distinct crescent-shaped cavity, with the largest cross-sectional area and an irregular contour. As the stem ascends towards the Ac-III, Ac-IV and Ac-V sections, this crescentic lumen progressively shrinks and eventually disappears, while the cross-sectional shape transitions from crescentic to approximately circular. Concurrently, both the cross-sectional area and the effective load-bearing area decrease substantially. This morphological gradient along the stem height is likely the primary structural factor underlying the simultaneous decline in tensile and nominal compressive strengths.
The stem cross-section contains fibre bundles of varying sizes, with pores interconnected to form a network of channels (Figure 6b). Samples Pc-I and Pc-II exhibited larger pores and greater connectivity, whereas the Pc-III, Pc-IV and Pc-V samples displayed a more uniform pore size distribution and a denser structure. As the cross-sectional area decreased with height, the proportion of macropores progressively diminished, while the number of micropores increased markedly.
Taro stem fibre cells are thin-walled and folded in appearance (Figure 6c). Fibre wall thickness was significantly greater at the base (Tc-I) than at the top (Tc-V). This gradient likely reflects the greater mechanical demands at the base, where thicker fibre walls enhance flexural stiffness and deformation resistance [5], though the specific relationship between fibre wall thickness and stem position requires further investigation.
Fibre cells at the basal positions (Al-I and Al-II) are elongated with well-defined boundaries. At higher positions, cells become progressively wider in the transverse direction (Figure 6d). This morphological gradient reflects functional differentiation along the stem: at the base, fibre cells undergo axial elongation, which enhances stem toughness and vascular transport efficiency; towards the apex, cells tend to thicken radially, contributing to greater tissue compactness.

3.5. ANOVA and Multiple Comparisons of the Mechanical Properties and Microstructure

ANOVA results (Table 2) revealed that stem height had a highly significant effect (p < 0.01) on σt, σc, Ac, Pc and Tc, confirming that both mechanical responses and microstructural parameters exhibit spatial heterogeneity along the stem longitudinal axis. In contrast, the p-value for fibre cell area (Al) was 0.293, indicating that there was no statistically significant effect of stem height on Al. Consequently, Al was excluded from further analysis as a key regulatory factor, although its potential influence warrants investigation with a larger sample size in future studies.
Duncan multiple range test results (Table 3) revealed that σt peaked in Group II (2.67 ± 0.16), significantly exceeding that of Groups IV and V (p < 0.05). Similarly, σc was highest in Group II (7.64 ± 1.15) and lowest in Group V (4.60 ± 0.94), with significant differences between Group II and both Groups IV and V.
This variation can be attributed to differences in fibre bundle lignification during stem development. Specifically, Group II, corresponding to the middle stem section, was at a mature stage of fibre bundle development, with denser cell wall deposition, conferring superior tensile and nominal compressive strengths. However, it should be noted that this explanation needs to be verified through histological or biochemical analysis. The basal section (Group I) exhibited slightly lower mechanical strength than Group II, likely due to structural discontinuities in the basal cavity region. In contrast, the apical sections (Groups IV and V) displayed poorly developed fibre bundles, resulting in markedly lower mechanical performance.
Group II exhibited the greatest cross-sectional area (Ac), significantly exceeding that of Groups IV and V (p < 0.05), which provided ample space for fibre bundle differentiation. This group also showed higher fibre bundle area fraction (Pc), reflecting well-developed conducting tissue and optimal transport efficiency for water and nutrients.
Group II exhibited the greatest fibre wall thickness (Tc) (0.26 ± 0.07), which was significantly higher than in Groups IV and V (p < 0.05), and also significantly different from Groups I and III. Such thickening reinforces the stem’s compressive and flexural resistance per unit cross-sectional area.

3.6. Effect of Stem Microstructure on Mechanical Properties

3.6.1. Effect of the Stem Cross-Sectional Area (Ac) on σt and σc

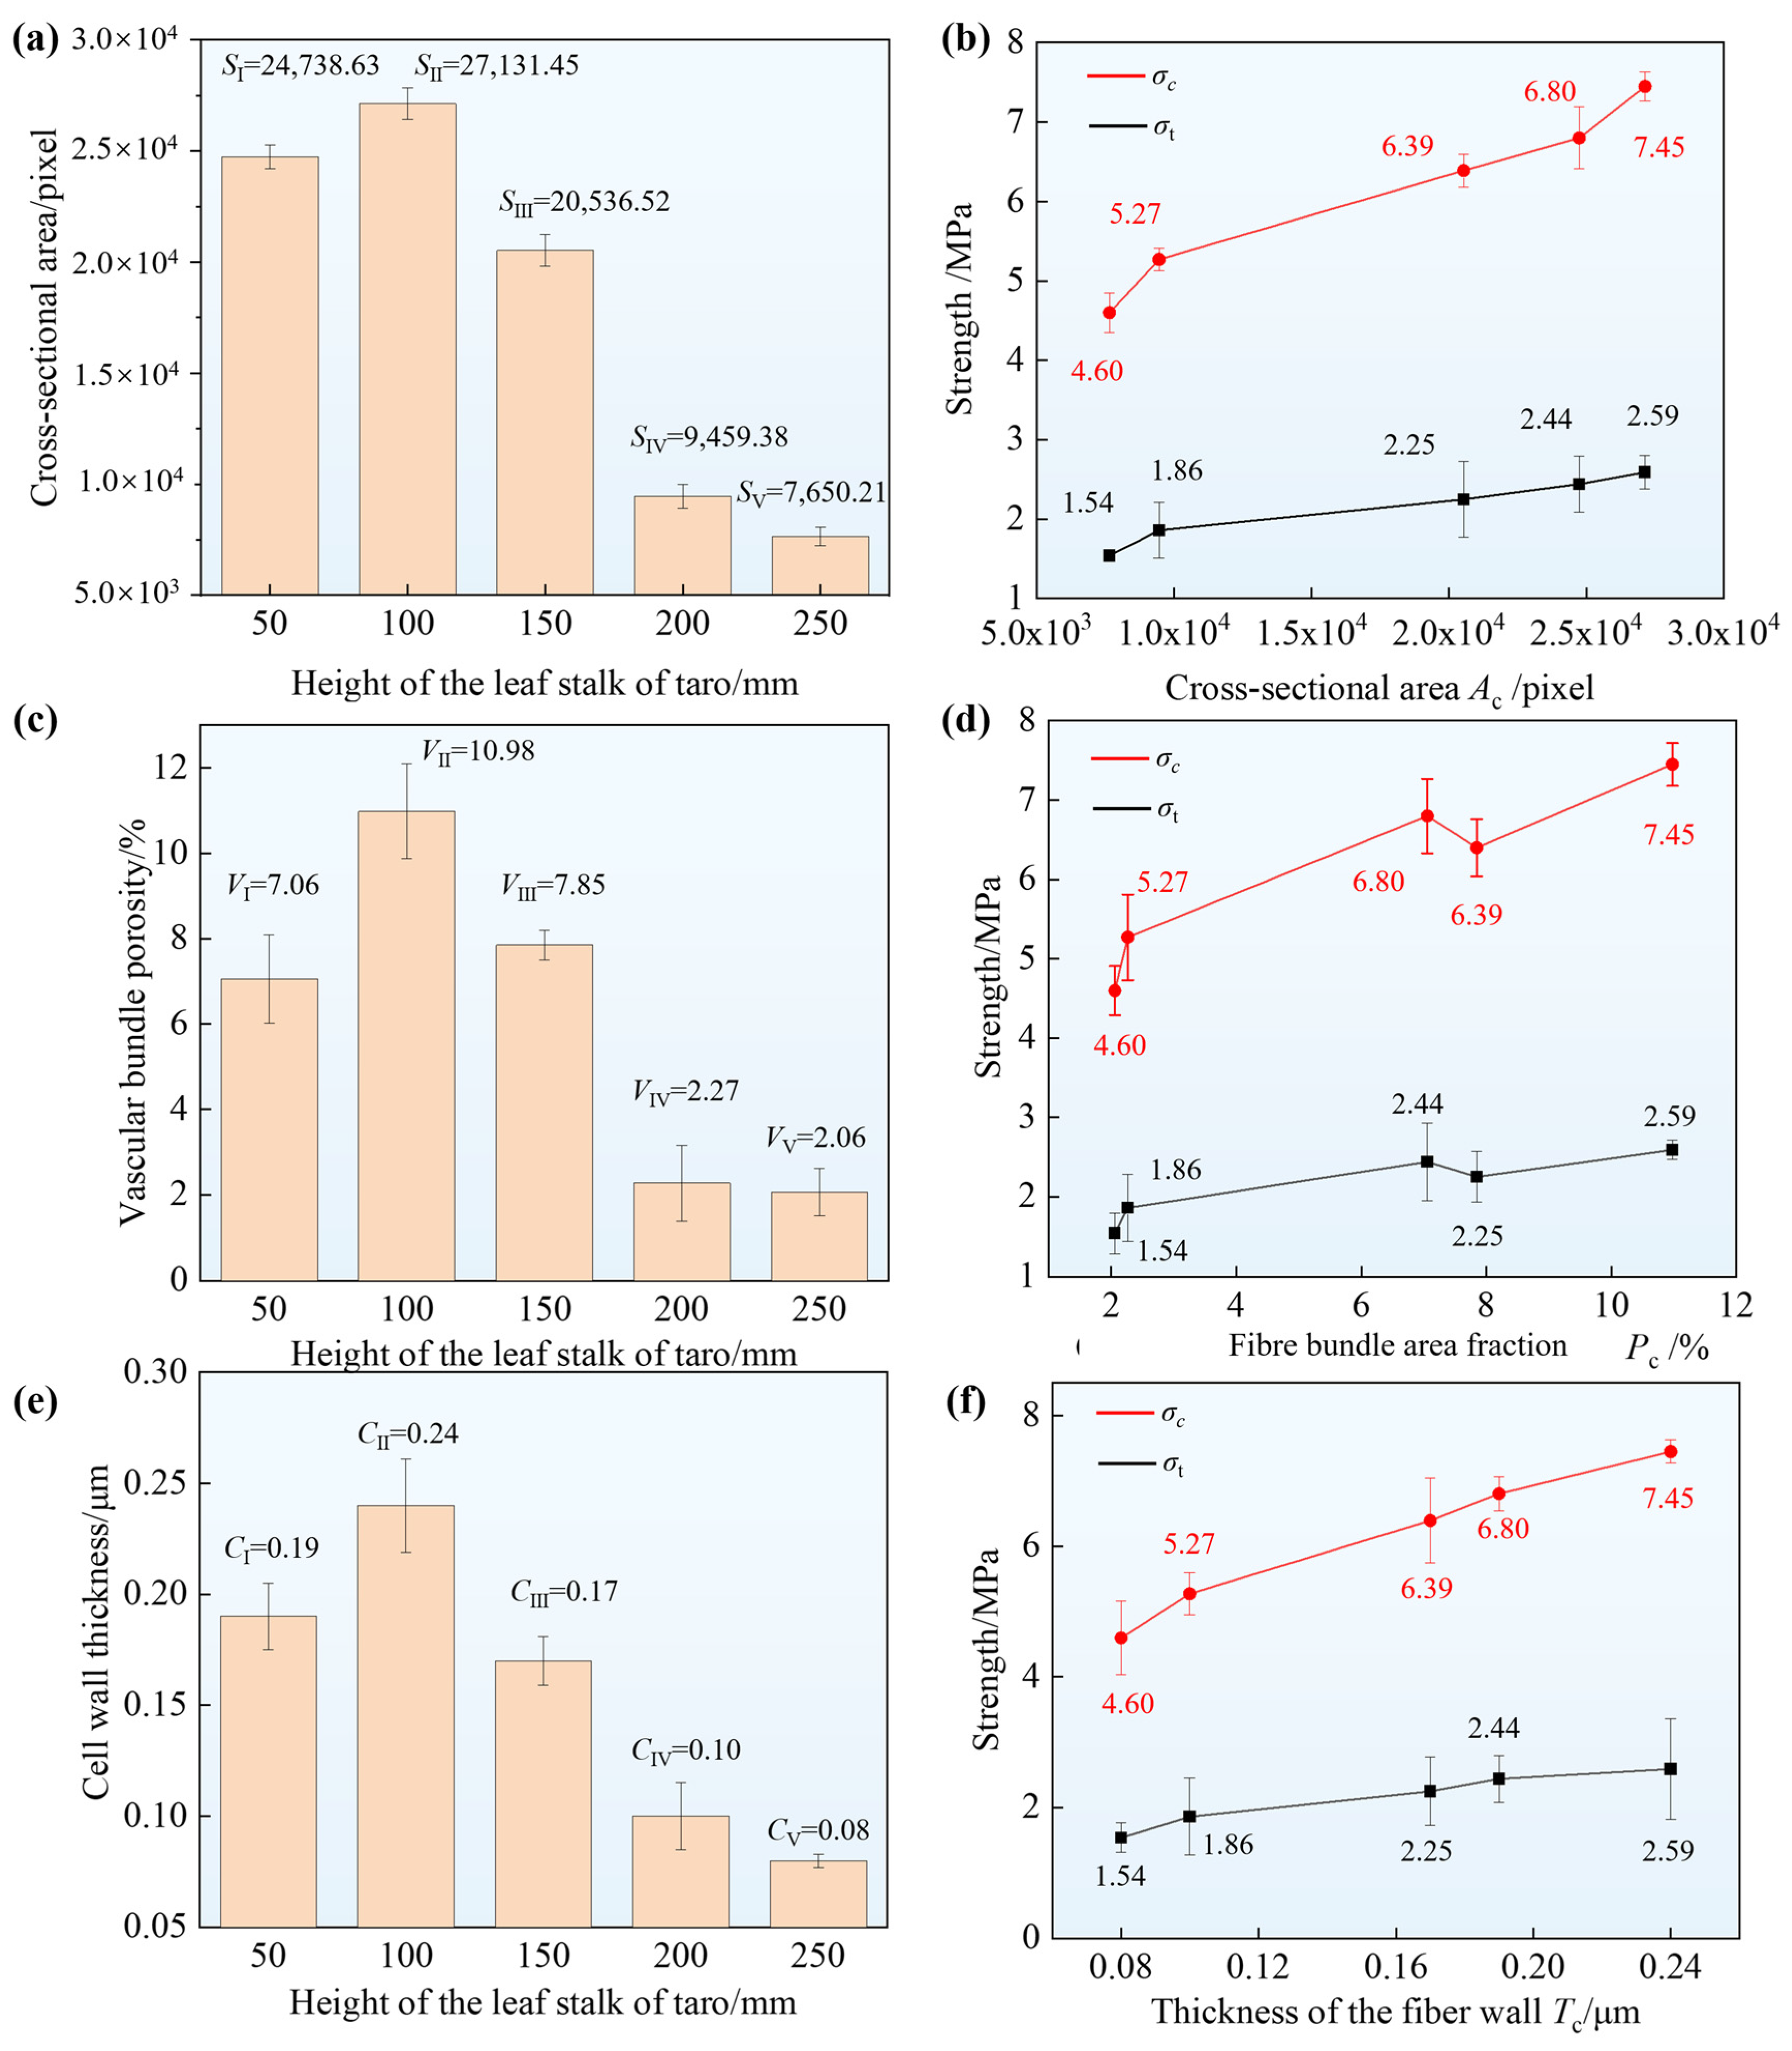
With increasing above-ground stem height of taro, Ac exhibited a unimodal response, initially rising and then declining (Figure 7a). Ac increased from Section I to Section II (peak value), and then decreased progressively through Sections III, IV, and V (Table 2). Duncan’s test confirmed that Ac at SII was significantly greater than at SIV and SV (p < 0.05).
Both σt and σc increased progressively with rising Ac (Figure 7b), with σc consistently exceeding σt. Specifically, σc rose from 4.60 MPa at Ac-V to 7.64 MPa at Ac-II, corresponding to a 61.96% increase, while σt increased from 1.54 MPa to 2.67 MPa over the same range, representing a 73.38% rise. It should be noted that σt is calculated as Ftmax/A, where A_sample is the cross-sectional area of the dumbbell-shaped tensile specimen at the gauge section (approximately 18 mm2). Ac, in contrast, is the whole-stem cross-sectional area, which serves as a structural-level geometric parameter reflecting the overall size and developmental stage of the stem at a given height. The observed correlation between Ac and σt therefore reflects that more developed stem regions (with larger whole-stem cross-sections) also tend to possess stronger fibrous tissue at the material level.

3.6.2. Effect of the Fibre Bundle Area Fraction (Pc) on σt and σc

As the above-ground height of taro stems increased, Pc exhibited a unimodal response, initially rising and then declining (Figure 7c). The value of Pc-I was 7.06%, which reached a maximum of 10.98% at Pc-II, and subsequently dropped to only 2.06% at Pc-V towards the stem apex. Duncan’s test (Table 2) showed that Pc at SII was significantly higher than at SIV and SV (p < 0.05).
Both σt and σc increased progressively with rising Pc, with σc consistently exceeding σt across the entire range (Figure 7d). At the lowest value (Pc-V = 2.06%), σc and σt reached their respective minima of 4.60 MPa and 1.54 MPa; at the highest value (Pc-II = 10.98%), they attained their maxima of 7.64 MPa and 2.67 MPa, respectively.

3.6.3. Effect of the Fibre Wall Thickness (Tc) on σt and σc

As the above-ground height of taro stems increased, Tc exhibited a unimodal response, initially rising and then declining (Figure 7e). The value of Tc-I was 0.19 μm, which reached a maximum of 0.24 μm at Tc-II, and subsequently decreased to only 0.08 μm at Tc-V towards the stem apex. Duncan’s test (Table 2) confirmed that Tc at SII was significantly higher than at SI, SIII, SIV, and SV (p < 0.05).

3.7. Correlation Analysis of Stem Mechanical Properties and Microstructure

Pearson correlation analysis (Table 4, n = 25, based on plant-level data) revealed a positive correlation between σt and σc (r = 0.73, p < 0.001, 95% CI: 0.48–0.87), suggesting that these two strength parameters are consistent in reflecting the load-bearing capacity of the stem. However, their failure modes are fundamentally distinct: under tensile loading, the load is transmitted axially through the fibre bundles, and failure occurs primarily via axial fracture of the fibres; in contrast, under compressive loading, failure is predominantly associated with relative slippage between adjacent fibre bundles.
With respect to microstructural parameters, Ac exhibited a strong positive correlation with σt (r = 0.83, p < 0.001, 95% CI: 0.65–0.93), indicating that larger Ac is associated with greater tensile strength. In contrast, Ac showed only a moderate positive correlation with σc (r= 0.62, p < 0.01, 95% CI: 0.30–0.82). This disparity may be explained by the fact that radial compressive resistance depends primarily on inter-fibre bundle bonding; while increasing Ac augments the total fibre mass, the bonding force between bundles does not scale linearly with Ac, thus resulting in a comparatively limited improvement in compressive performance.
Similarly, Pc was strongly correlated with σt (r = 0.78 p < 0.001, 95% CI: 0.55–0.90), as higher Pc is associated with denser fibre arrangement within bundles and a larger effective contact area among fibres, which may facilitate efficient load transfer and thereby potentially enhance axial tensile strength. However, the correlation between Pc and σc was only moderate (r = 0.49, p < 0.05, 95% CI: 0.13–0.73), suggesting that the internal pore structure of fibre bundles primarily influences the efficiency of axial load transmission, while exerting limited constraint on radial slippage between bundles, hence producing a weaker enhancement of nominal compressive strength.
In contrast, Tc was positively correlated with both σt (r = 0.77 p < 0.001, 95% CI: 0.54–0.90) and σc (r = 0.70 p < 0.001, 95% CI: 0.42–0.86). Given that the fibre wall serves as the core load-bearing unit for both tension and compression, increased wall thickness directly improves the stiffness and nominal compressive strength of individual fibres, thereby significantly benefiting both tensile and compressive properties. By contrast, the fibre cell area (Al) exhibited weak positive correlations with all measured indicators (all r < 0.5, p > 0.05).
However, because Ac, Pc, and Tc are themselves inter-correlated and all vary systematically with stem height, the above Pearson correlations may partly reflect confounding by height. To address this, we performed partial correlation analysis controlling for height. After controlling for height, the partial correlations between Ac and σt (r_partial = 0.67, p < 0.01) and between Tc and σc (r_partial = 0.61, p < 0.01) remained statistically significant, whereas the partial correlation between Pc and σt dropped to r_partial = 0.41 (p = 0.052), suggesting that the observed association between Pc and σt is largely mediated by their common dependence on height.
Furthermore, stepwise multiple linear regression was performed to assess the relative contributions of Ac, Pc, and Tc and height to the mechanical properties. For σt, the final model (R2 = 0.79, p < 0.001) retained Ac (standardised β = 0.56, p < 0.01) and Tc (standardised β = 0.34, p < 0.05) as significant predictors. For σc, the final model (R2 = 0.68, p < 0.01) retained Tc (standardised β = 0.48, p < 0.01) and Ac (standardised β = 0.31, p < 0.05). These results suggest that Ac and Tc are the strongest independent correlates of mechanical performance, while the contribution of Pc is largely indirect via its association with height.
Collectively, these findings demonstrate that stem cross-sectional area, fibre bundle area fraction, and fibre wall thickness are the principal determinants of the mechanical properties of taro stems.

4. Discussion

4.1. Influence of the Longitudinal Spatial Heterogeneity of the Stem on Mechanical Properties

Axial tensile testing of taro stems involved three stages: elastic deformation, damage accumulation, and plastic fracture—a behaviour analogous to that reported for sweet potato stems and leaves [26]. In contrast, radial compression proceeds through elastic deformation, slip reorganisation, and plastic damage, following a multi-stage progressive failure mode similar to that observed in pennisetum sinense roxb stems [12]. These observations collectively indicate that the load-induced failure of crop stems commonly exhibits a transition from elastic to plastic behaviour across species.
It is worth noting that taro stems exhibit distinct morphological differences at varying heights above ground; the cross-sectional shape of the taro stem gradually transitions from a crescent shape at the base to a near-circular shape at the apex (Figure 6a), which accounts for the high load-bearing capacity of the basal portion of the taro stem. However, the stems of grasses such as rice, wheat [27,28] and maize stems [29], are predominantly solid or have a regular cylindrical hollow structure, with little variation in cross-sectional morphology with height above ground; their mechanical properties rely primarily on the radial and axial gradient distribution of fibre bundles [30]. The morphology of taro stems stands in stark contrast to the relatively uniform circular cross-sectional configuration typical of grass family crops.
The results showed that both the axial tensile strength and nominal radial compressive strength of taro stems peak at 50–100 mm above ground level. This height range coincides with the morphological transition zone, where the stem cross-section changes from crescent-shaped at the base to a more cylindrical form towards the middle. At this position, the stem retains a relatively large cross-sectional area while avoiding the strength reduction caused by excessively thin fibre walls near the apex. These findings suggest that the middle stem section (50–100 mm) possesses optimal mechanical performance for potential industrial applications, providing a basis for the graded utilisation of taro stems based on their height-dependent mechanical properties.

4.2. Correlation Between the Microstructure and Mechanical Properties of Taro Stems

The mechanical properties of plant stems are associated with not any single structural parameter, but rather with the coupled effects of morphological traits and microstructural features [31,32]. Our findings demonstrate that the mechanical behaviour of taro stems is correlated with the synergistic interplay of three microstructural determinants-cross-sectional area, fibre bundle area fraction, and fibre wall thickness—rather than with any independent factor. This observation is in line with the results of [33], who showed that stem stiffness is jointly determined by morphological and compositional variables across multiple organisational levels, spanning organs, tissues, cells, and cell walls.
Our findings further indicate that the cross-sectional area is associated with the total volume of fibre bundles, the vascular bundle pore structure correlates with the packing density and interfacial contact area of these bundles, and the fibre wall thickness relates to the intrinsic strength of individual fibres. The correlation between Ac and σt indicates that stems with larger whole-stem cross-sections (typically at the middle height) also possess more developed fibre tissues with higher intrinsic strength, rather than implying that whole-stem area directly increases material strength. Therefore, without altering the cross-sectional geometry or material type, tensile and compressive properties may be potentially enhanced by tailoring fibre bundle area fraction and cell wall thickness. These insights offer biological guidance for optimising fibre extraction processes from taro stems, designing composite material interfaces, and developing biomimetic lightweight structures. Notably, studies on bamboo [34], hemp stems [35], and Polygonum cuspidatum stems [36] have also successfully informed the biomimetic design of lightweight, high-strength composites.

4.3. Limitations and Future Works

This study offers novel insights into the microstructure–mechanical property relationships of taro stems with irregular cross-sections. Nevertheless, the mechanical behaviour of plant stems is governed by the synergistic regulation of multiple factors, and substantial varietal differences exist in fibre bundle arrangement and fibre content. Our investigation was limited to a single taro variety. Consequently, the specific height at which peak mechanical performance occurs (50–100 mm above ground level) may not be universally applicable across all taro cultivars, as genetic background and growth vigour can influence stem morphology, fibre development, and mechanical properties. The generalisability of the optimal height position identified in this study requires validation across multiple varieties, growth stages, and environmental conditions.
Moreover, previous studies have demonstrated that stem mechanical properties are highly sensitive to moisture content [37,38]. In the present study, moisture content was measured and found to be relatively consistent across all height sections (coefficient of variation < 1%, Section 2.1). However, it was not included as a covariate in the statistical models. Therefore, we cannot completely exclude the possibility that residual moisture variation may have contributed to the observed differences in mechanical properties among sections, or that the associations between microstructural parameters and mechanical properties may be partially confounded by moisture content. Therefore, future work will employ factorial experimental designs incorporating multiple varieties, growth stages, moisture gradients, and diverse soil environmental conditions to quantify the main and interaction effects of these factors on microstructure and mechanical performance. In addition, we plan to introduce micro-computed tomography (micro-CT) to enable three-dimensional visualisation of the entire damage evolution process—from crack initiation and propagation to final failure—during stem loading. Additionally, it should be acknowledged that the SEM measurements were obtained after chemical fixation, dehydration, critical-point drying, and sputter coating, whereas the mechanical tests were performed on fresh, high-moisture tissues. To eliminate this limitation in future work, it is recommended in future studies to employ cryo-SEM (cryogenic scanning electron microscopy) to observe fresh, hydrated tissues without chemical fixation or drying, which would preserve native dimensions and enable more accurate quantitative microstructural analysis. Furthermore, future work will employ transmission electron microscopy (TEM) or higher-resolution field-emission SEM to obtain more precise measurements at the sub-micrometre scale, particularly for the apical sections where fibre walls are thinner. This will provide a robust foundation for the utilisation of taro stems as an industrial biomass feedstock.

5. Conclusions

(1) The cross-sectional morphology of taro stems undergoes a progressive transition from a crescent shape at the base to a nearly circular shape towards the apex. Both axial tensile strength (σt) and nominal radial compressive strength (σc) exhibit a unimodal response to increasing stem height, with σc consistently exceeding σt across all heights under the conditions of this study.
(2) Among the five height sections examined in this variety, the section at 50–100 mm above ground level exhibited the highest mechanical performance, with σt and σc reaching their maxima of 2.67 MPa and 7.64 MPa, respectively. This height range maintains a large cross-sectional moment of inertia while avoiding the strength degradation associated with excessively thin fibre walls near the apex. It should be noted that the specific peak height may vary with cultivar, growth conditions, and plant age.
(3) The tensile and compressive properties are closely associated with three microstructural parameters—cross-sectional area, fibre bundle area fraction, and fibre wall thickness—whereas fibre cell area shows only weak correlations with all mechanical indicators (r < 0.5) and is not a key regulatory factor. These findings provide a quantitative basis for the graded valorisation of taro stem biomass and for optimising mechanical pre-processing in biorefinery feedstock preparation, although the specific optimal height may require adjustment for different cultivars or growing conditions.

Author Contributions

This study presented here was carried out by all authors collaboratively. Conceptualization, G.J. and W.L.; methodology, C.J., Q.K. and W.L.; software, C.J. and Q.K.; validation, W.L.; formal analysis, C.J., Q.K. and W.L.; writing—original draft preparation, G.J.; writing—review and editing, W.L.; funding acquisition, W.L.; visualisation, C.J. and Q.K.; supervision, W.L.; project administration, W.L. All authors have read and agreed to the published version of the manuscript.

Funding

This work was supported by the China Postdoctoral Science Foundation (2026M792650).

Data Availability Statement

The original contributions presented in this study are included in the article. Further inquiries can be directed to the corresponding author.

Acknowledgments

The authors gratefully acknowledge the administrative and technical support provided by Hainan University, Northwest A&F University, and Chinese Academy of Tropical Agricultural Sciences.

Conflicts of Interest

The authors declare no conflicts of interest.

Abbreviations

The following abbreviations are used in this manuscript:
ANOVAAnalysis of Variance

References

  1. Hoque, M.B.; Oyshi, T.H.; Baria, B.; Tanjila, M.J.; Ayman, U.; Hosen, M.I.; Sheikh, S.; Rahman, M.M. Taro Fiber: A Comprehensive Review of Extraction, Properties, Applications, and Future Perspectives. J. Eng. Adv. 2025, 6, 31–40. [Google Scholar] [CrossRef] [Scilit]
  2. Mitharwal, S.; Kumar, A.; Chauhan, K.; Taneja, N.K. Nutritional, phytochemical composition and potential health benefits of taro (Colocasia esculenta L.) leaves: A review. Food Chem. 2022, 383, 132406. [Google Scholar] [CrossRef] [Scilit]
  3. Terasawa, N.; Saotome, A.; Tachimura, Y.; Mochizuki, A.; Ono, H.; Takenaka, M.; Murata, M. Identification and some properties of anthocyanin isolated from zuiki, stalk of Colocasia esculenta. J. Agric. Food Chem. 2007, 55, 4154–4159. [Google Scholar] [CrossRef] [Scilit]
  4. Wang, J.Y.; Cui, H.X.; Jin, M.; Li, C.H.; Luo, Y.L.; Li, Y.; Wang, Z.L. Supplemental red light improves wheat stem quality by regulating cell wall components and structure. J. Integr. Agric. 2025, in press. [Google Scholar] [CrossRef] [Scilit]
  5. Huang, J.; Liu, W.; Zhou, F.; Peng, Y. Stiffness variability analysis of maize fiber bundles via multiscale simulation. J. Mater. Sci. 2017, 52, 7917–7928. [Google Scholar] [CrossRef] [Scilit]
  6. Xiao, P.; Pfaff, S.A.; Zhao, W.C.; Debnath, D.; Vojvodin, C.S.; Liu, C.J.; Cosgrove, D.J.; Wang, T. Emergence of lignin-carbohydrate interactions during plant stem maturation visualized by solid-state NMR. Nat. Commun. 2025, 16, 8010. [Google Scholar] [CrossRef] [Scilit]
  7. Xiang, F.; Li, Z.Y.; Zheng, Y.C.; Ding, C.X.; Adhikari, B.; Ma, X.J.; Xu, X.B.; Zhu, J.J.; Abubakar, B.Z.; Shi, A.M.; et al. Characterization and correlation of engineering properties with microstructure in peanuts: A microscopic to macroscopic analysis. J. Integr. Agric. 2025, 24, 339–352. [Google Scholar] [CrossRef] [Scilit]
  8. Robertson, D.J.; Brenton, Z.W.; Kresovich, S.; Cook, D.D. Maize lodging resistance: Stalk architecture is a stronger predictor of stalk bending strength than chemical composition. Biosyst. Eng. 2022, 219, 124–134. [Google Scholar] [CrossRef] [Scilit]
  9. Xue, K.; Gao, K.J.; Wang, T.J.; Zhang, X.S.; Zhang, S.; Kuang, F.M.; Zhu, D.Q. Biomechanical modeling of rice seedling stalk based on multi-scale structure and heterogeneous materials. Comput. Electron. Agric. 2023, 210, 107904. [Google Scholar] [CrossRef] [Scilit]
  10. Li, X.P.; Wang, S.Q.; Du, G.B.; Wu, Z.K.; Meng, Y.J. Variation in physical and mechanical properties of hemp stalk fibers along height of stem. Ind. Crops Prod. 2012, 42, 344–348. [Google Scholar] [CrossRef] [Scilit]
  11. Wang, Y.R.; Zhang, Y.; Huang, G.M.; Wang, J.L.; Lv, L.J.; Zhao, S.H.; Lu, X.J.; Zhang, M.G.; Guo, M.K.; Zhang, C.Y.; et al. Association analysis of maize stem vascular bundle micro-characteristics with yield components based on micro-CT and identification of related genes. Sci. Rep. 2025, 15, 13009. [Google Scholar] [CrossRef] [Scilit]
  12. Han, C.Y.; Lv, J.H.; Li, H.X.; Wan, C.Y.; Chen, Y.M.; Wu, W.B.; Luo, Y.Q.; Li, J.H. From microstructure to multivariate prediction models: Decoding the biomechanical properties of tea stems via PLSR-Ridge regression and multifactorial orthogonal design. Ind. Crops Prod. 2025, 230, 121143. [Google Scholar] [CrossRef] [Scilit]
  13. Li, S.B.; Huan, X.L.; Wang, T.Y.; Hui, Y.T.; You, Y.; Wang, D.C. Biomechanical properties and discrete element modeling of PSR stalks during silage harvest. Comput. Electron. Agric. 2024, 217, 108644. [Google Scholar] [CrossRef] [Scilit]
  14. Shi, M.H.; Wang, T.J.; Sun, D.D.; Xiong, W.; Kuang, F.M.; Zhu, D.Q. Distribution law of vascular bundle stiffness in rice stems and microscale simulation. Biosyst. Eng. 2025, 250, 325–342. [Google Scholar] [CrossRef] [Scilit]
  15. Xue, K.; Wang, Y.; Fan, B.B.; Hu, K.; Fang, J.; Chen, W.; Zhang, J.; Wang, C.; Lu, B.Y.; An, M.H.; et al. Study on the mechanical behavior and failure mechanisms of pecans based on multiscale biomechanical modeling. Comput. Electron. Agric. 2026, 251, 112029. [Google Scholar] [CrossRef] [Scilit]
  16. Chatron-Michaud, P.; Trillaud, V.; Lesaint, B.; Adrien, J.; Beaugrand, J.; Steyer, P. Towards dynamic in situ observation of flax fibres under varying water contents through environmental SEM and X-ray tomography. Ind. Crops Prod. 2024, 215, 118654. [Google Scholar] [CrossRef] [Scilit]
  17. Lu, Y.Z.; Hu, Y.G.; Snyder, R.L.; Kent, E.R. Tea leaf’s microstructure and ultrastructure response to low temperature in indicating critical damage temperature. Inf. Process. Agric. 2019, 6, 247–254. [Google Scholar] [CrossRef] [Scilit]
  18. Yang, T.; Qi, Q.; Ma, L.; Li, T.; Li, J.T.; Yang, Q.; Meng, F.B. Lightweight composites derived from carbonized taro stems for microwave energy attenuation and thermal energy storage. Compos. Sci. Technol. 2024, 258, 110874. [Google Scholar] [CrossRef] [Scilit]
  19. Liu, W.; Zhang, G.; Wang, H.; Liu, H.; Kang, Q.; Zhao, Z.; Pei, L.; Li, Z. Microscopic deformation and fragmentation energy consumption characteristics of soils with various moisture contents using discrete element method. Soil Tillage Res. 2024, 241, 106131. [Google Scholar] [CrossRef] [Scilit]
  20. Hao, X.L.; Wei, Y.H.; Yao, K.T.; Chen, Y.; Zhou, H.Y.; Ou, R.X.; Wang, Q.W. Hierarchical characteristics in radial direction of Bambusa textilis McClure and their influence on tensile properties. Ind. Crops Prod. 2025, 224, 120376. [Google Scholar] [CrossRef] [Scilit]
  21. Guo, J.; Karkee, M.; Yang, Z.; Fu, H.; Li, J.; Jiang, Y.L.; Jiang, T.T.; Liu, E.X.; Duan, J.L. Discrete element modeling and physical experiment research on the biomechanical properties of banana bunch stalk for postharvest machine development. Comput. Electron. Agric. 2021, 188, 106308. [Google Scholar] [CrossRef] [Scilit]
  22. Yue, H.; Lu, C.; Wang, C.H.; Yang, F. Optimizing tensile strength and failure prediction in hemp fiber composites: Coupling effects of microfibril angle and fiber orientation under off-axis loading. Ind. Crops Prod. 2024, 222, 119872. [Google Scholar] [CrossRef] [Scilit]
  23. Che, H.L.; Gao, C.X.; Ma, M.S.; Xu, B.; Zhang, Y.H.; Shi, F.X. Revealing the role of internodal–nodal heterogeneity in wheat straw compression densification and pellet formation using an anisotropic DEM model. Ind. Crops Prod. 2026, 249, 123753. [Google Scholar] [CrossRef] [Scilit]
  24. Li, X.L.; Li, A.Q.; Han, Y.L.; Li, H.; Sun, Z.; Gao, H.N.; Wang, X.L. Mechanism of impact breakage in paddy rice: A cohesive zone model-based research on crack evolution and energy dissipation. Biosyst. Eng. 2026, 267, 104473. [Google Scholar] [CrossRef] [Scilit]
  25. Zhuang, Y.; Wang, Y.D.; Yang, H. Characterizing digestibility of potato starch with cations by SEM, X-ray, LF-NMR, FTIR. Food Chem. 2023, 424, 136396. [Google Scholar] [CrossRef] [Scilit]
  26. Gu, X.Y.; Tang, Z.; Chen, S.R.; Wang, B.Z.; Shen, J.H.; Du, Z.Q. Design and optimization of a low-damage harvesting system for stems and leaves of leaf-vegetable sweet potato based on stem–leaf mechanical properties. Comput. Electron. Agric. 2026, 251, 112068. [Google Scholar] [CrossRef] [Scilit]
  27. Leblicq, T.; Smeets, B.; Ramon, H.; Saeys, W. A discrete element approach for modelling the compression of crop stems. Comput. Electron. Agric. 2016, 123, 80–88. [Google Scholar] [CrossRef] [Scilit]
  28. Zhao, C.F.; Yang, S.K.; Chang, M.J.; Bao, T.X.; Duan, Y.H.; Tian, Z.W.; Dai, T.B. Low red/far-red ratio inhibits spike development by impeding photosynthesis and carbohydrate allocation from leaves to stems in wheat. J. Integr. Agric. 2026. [Google Scholar] [CrossRef] [Scilit]
  29. Zhang, Y.; Ma, L.M.; Wang, J.L.; Wang, X.D.; Guo, X.Y.; Du, J.J. Phenotyping analysis of maize stem using micro-computed tomography at the elongation and tasseling stages. Plant Methods 2020, 16, 2. [Google Scholar] [CrossRef] [Scilit]
  30. Wang, P.H.; Pang, J.R.; Zhang, H.; Liao, H.Y.; Xiong, D.A.; Zhu, L.J.; Xue, D.; You, M.; Liu, Y.K.; Li, J.; et al. Composition, structural, and thermal analysis of cellulose, hemicellulose, and lignin of reconstituted cut stems in tobacco. Ind. Crops Prod. 2024, 222, 119614. [Google Scholar] [CrossRef] [Scilit]
  31. Shah, D.U.; Reynolds, T.P.S.; Ramage, M.H. The strength of plants: Theory and experimental methods to measure the mechanical properties of stems. J. Exp. Bot. 2017, 68, 4497–4516. [Google Scholar] [CrossRef] [Scilit]
  32. Speck, T.; Burgert, I. Plant Stems: Functional Design and Mechanics. Annu. Rev. Mater. Res. 2011, 41, 169–193. [Google Scholar] [CrossRef] [Scilit]
  33. Brulé, V.; Rafsanjani, A.; Pasini, D.; Western, T.L. Hierarchies of plant stiffness. Plant Sci. 2016, 250, 79–96. [Google Scholar] [CrossRef] [Scilit]
  34. Hu, X.Y.; Zhang, Z.Y.; Tao, Y.P.; Zhou, X.Y.; Zhao, H.; Han, S.Y.; Xia, C.L. Structural characteristics of bamboo and research progress in bamboo-inspired composites. J. Bionic Eng. 2026, 23, 126–138. [Google Scholar] [CrossRef] [Scilit]
  35. Brachi, P.; Ruoppolo, G.; Faga, M.G.; Di Maro, M.; Malucelli, G.; Duraccio, D. Hemp hurd torrefaction as an effective strategy to enhance PLA-based composite mechanical and tribological properties. Sci. Rep. 2026, 16, 21303. [Google Scholar] [CrossRef] [Scilit]
  36. Wunsch, T.; Kelch, M.; Röhl, V.; Wieland, H.; Labisch, S.; van den Oever, M.; Huber, T.; Müssig, J. Structure-property relationships in Japanese knotweed—The potential of using the stem for composite applications. Ind. Crops Prod. 2022, 186, 115191. [Google Scholar] [CrossRef] [Scilit]
  37. Sun, S.N.; Mathias, J.D.; Toussaint, E.; Grédiac, M. Hygromechanical characterization of sunflower stems. Ind. Crops Prod. 2013, 46, 50–59. [Google Scholar] [CrossRef] [Scilit]
  38. Bai, T.; Yan, J.; Lu, J.Q.; Zhou, J.; Yao, H.; He, X.W.; Gu, S.H.; Tong, Z.H.; Shi, S.Q.; Li, J.; et al. Engineering transverse cell deformation of bamboo by controlling localized moisture content. Nat. Commun. 2025, 16, 4077. [Google Scholar] [CrossRef] [Scilit]
Figure 1. Preparation of taro stem samples: (a) sampling locations on taro plants; (b) morphology of taro plants; (c) division of taro stem sections.
Agriculture 16 01817 g001
Figure 2. Mechanical testing of stems: (a) axial tensile tests; (b) geometry of dumbbell-shaped specimens; (c) radial compression tests; (d) dimensions of stems for the compression tests.
Agriculture 16 01817 g002
Figure 3. Scanning electron microscopy (SEM) tests and microstructural image processing methods. (a) biological critical point drying process; (b) gold sputtering process using the JFC-1600 ion sputtering system; (c) observation using the JSM-6390LV scanning electron microscope (Model JSM-6390LV, JEOL Ltd., Tokyo, Japan); (d) methods for processing microstructural images.
Agriculture 16 01817 g003
Figure 4. Mechanical properties and failure modes of taro stems: (a) axial tensile load–displacement curve; (b) comparison of stem morphology before and after fracture; (c) typical failure modes of taro stems; (d) radial compressive load–displacement curve; (e) comparison of specimen morphology before and after compression; (f) typical crushing failure mode of taro stems. The first is the elastic deformation stage (EDS). The second stage is the slippage and reorganisation stage (SRS). The third stage is the plastic damage stage (PDS).
Agriculture 16 01817 g004
Figure 5. Trends in ultimate tensile strength (σt) and ultimate nominal compressive strength (σc); (a) Trends in axial tensile strength (σt) with stem height above ground; (b) trends in nominal radial compressive stress (σc) with stem height above ground.
Agriculture 16 01817 g005
Figure 6. Spatial patterns of microstructural changes in stems with increasing height: (a) microscopic morphology of a stem cross-section; (b) microscopic morphology of the pore distribution in fibre bundles; (c) microscopic morphology of fibre wall thickness; (d) microscopic morphology of fibre cells.
Agriculture 16 01817 g006
Figure 7. Effects of taro stem microstructure on mechanical properties. (a) Relationship between above-ground stem height and Ac; (b) dependence of σt and σc on Ac; (c) Pc as a function of above-ground stem height; (d) σt and σc versus Pc; (e) variation in Tc with above-ground stem height; (f) σt and σc as a function of Tc.
Agriculture 16 01817 g007
Table 1. Results of Shapiro–Wilk normality test and Levene’s homogeneity of variance test.
ModelShapiro–Wilk p-Value
(Range Across Groups)
Levene’s Test p-Value
Axial maximum tensile strength (σt)/MPa0.21–0.680.34
Radial maximum nominal compressive strength (σc)/MPa0.18–0.720.41
Cross-sectional area (Ac)/pixels0.15–0.630.29
Fibre bundle area fraction (Pc)/%0.23–0.700.38
Fibre wall thickness (Tc)/μm0.19–0.650.45
Fibre area (Al)/μm20.28–0.740.52
Table 2. ANOVA of the mechanical properties and microstructure.
ModelSum of SquaresdfMean SquareF-Valuep-Value
Axial maximum tensile strength (σt)/MPa4.06841.01720.267<0.0001 **
Radial maximum nominal compressive strength (σc)/MPa27.56446.8915.8560.003 **
Cross-sectional area (Ac)/pixels1.93 × 10944.82 × 10829.657<0.0001 **
Fibre bundle area fraction (Pc)/%309.633477.4089.364<0.0001 **
Fibre wall thickness (Tc)/μm0.09040.0228.473<0.0001 **
Fibre area (Al)/μm29.75 × 10642.44 × 1061.3300.293
Note: ** p < 0.01 (highly significant). Values without asterisks are not significant (p ≥ 0.05).
Table 3. Multiple comparisons of the mechanical properties and microstructure.
IndexStem Height
IIIIIIIVV
Axial maximum tensile strength (σt)/MPa2.44 ± 0.28 ab2.67 ± 0.16 a2.20 ± 0.18 b1.86 ± 0.13 c1.54 ± 0.34 d
Radial maximum nominal compressive strength (σc)/MPa6.80 ± 1.16 ab7.64 ± 1.15 a6.09 ± 0.94 bc5.47 ± 1.21 c4.60 ± 0.94 d
Cross-sectional area (Ac)/pixels21,188.40 ± 4771.66 b29,210.01 ± 2644.58 a22,565.90 ± 5153.90 ab7882.65 ± 3421.58 c6682.60 ± 3646.09 d
Fibre bundle area fraction (Pc)/%7.25 ± 1.81 ab10.82 ± 4.65 a7.74 ± 2.26 ab2.15 ± 2.64 b1.61 ± 2.08 c
Fibre wall thickness (Tc)/μm0.19 ± 0.07 b0.26 ± 0.07 a0.15 ± 0.04 b0.12 ± 0.02 bc0.12 ± 0.02 bc
Note: Identical superscript letters in the same row indicate that there is no significant difference between the values (p ≥ 0.05); different superscript letters indicate a significant difference between the values (p < 0.05).
Table 4. Correlation matrix with p-values and 95% confidence intervals (n = 25).
ParameterStem Height
Axial Maximum Tensile Strength σt/MPaRadial Maximum Nominal Compressive Strength
σc/MPa
Cross-Sectional Area Ac/PixelsFibre Bundle Area Fraction Pc/%Fibre Wall Thickness Tc/μm
Axial maximum tensile strength (σt)/MPa10.73 ***
(0.48, 0.87)
0.83 ***
(0.65, 0.93)
0.78 ***
(0.55, 0.90)
0.77 ***
(0.54, 0.90)
Radial maximum nominal compressive strength (σc)/MPa0.73 *** (0.48, 0.87)10.62 **
(0.30, 0.82)
0.49 *
(0.13, 0.73)
0.70 ***
(0.42, 0.86)
Cross-sectional area (Ac)/pixels0.83 ***
(0.65, 0.93)
0.62 **
(0.30, 0.82)
10.58 **
(0.25, 0.79)
0.72 ***
(0.45, 0.87)
Fibre bundle area fraction (Pc)/%0.78 ***
(0.55, 0.90)
0.49 *
(0.13, 0.73)
0.58 **
(0.25, 0.79)
10.66 ***
(0.35, 0.84)
Fibre wall thickness (Tc)/μm0.77 ***
(0.54, 0.90)
0.70 ***
(0.42, 0.86)
0.72 ***
(0.45, 0.87)
0.66 ***
(0.35, 0.84)
1
Note: * p < 0.05; ** p < 0.01; *** p < 0.001. Values in parentheses indicate 95% confidence intervals.
Disclaimer/Publisher’s Note: The statements, opinions and data contained in all publications are solely those of the individual author(s) and contributor(s) and not of MDPI and/or the editor(s). MDPI and/or the editor(s) disclaim responsibility for any injury to people or property resulting from any ideas, methods, instructions or products referred to in the content.