1. Introduction
Microplastics generally refer to plastic particles or fragments with a diameter of less than 5 mm. Due to their wide sources, strong environmental persistence, and high mobility and accumulation across ecosystems, they have become emerging contaminants of concern in the fields of environmental science, agricultural safety, and food safety [
1]. In recent years, microplastics have not only been widely reported in environmental media such as water bodies, soils, and the atmosphere [
2], but have also increasingly attracted attention in agricultural products, animal-derived foods, and feed systems [
3]. Feed, as a critical input in livestock and poultry production, may introduce plastic particles or fragments through multiple stages, including raw material processing, transportation, packaging, and storage [
4]. Once microplastics enter the feed system, they may be ingested by animals and transferred along the production chain, thereby raising concerns regarding animal health and food safety. Previous studies have detected microplastics such as polyethylene terephthalate (PET), polypropylene (PP), and polyvinyl chloride (PVC) in livestock and poultry feed [
5], while recent investigations have reported microplastic abundances of 90–330 items/kg in commercial chicken feeds and 8.3–39.3 MPs/g in ruminant feeds, with polyethylene (PE), PP, PET, and PVC among the detected polymers [
6,
7,
8]. Following ingestion, microplastics may interact with the gastrointestinal tract and potentially undergo translocation into internal tissues, raising concerns about their biological effects in livestock and poultry and their potential implications for food-chain exposure [
3,
4]. Therefore, the development of rapid detection methods for microplastics in a complex chicken-feed matrix is of great significance for feed quality control and livestock farming safety regulation.
Currently, commonly used methods for microplastic detection include microscopic observation [
9], Fourier transform infrared spectroscopy (FTIR), Raman spectroscopy [
10], pyrolysis–gas chromatography/mass spectrometry (Py-GC/MS) [
11], and hyperspectral imaging (HSI) [
12]. These techniques provide high accuracy in the morphological characterization, polymer identification, and quantitative analysis of microplastics, but often require complex sample pretreatment, lengthy analytical procedures, expensive instrumentation, or laboratory-based operation. These limitations are particularly relevant to complex matrices such as chicken feed, where heterogeneous particle sizes and abundant organic components can interfere with microplastic signals through absorption and scattering effects. Such matrix interference can obscure the relatively weak spectral contribution of microplastics at low concentrations, highlighting the need for effective spectral preprocessing and chemometric modeling to extract polymer-related information from the feed background [
13]. In the present study, an upper microplastic concentration of 1% (
w/
w) was included to provide a sufficiently broad analytical range for evaluating concentration-dependent spectral responses and model performance, rather than to represent a typical contamination level in commercial feed. Therefore, the development of rapid and portable detection approaches capable of identifying microplastics directly in complex chicken-feed matrices is of considerable practical importance.
Near-infrared spectroscopy (NIRS) offers advantages such as rapid detection, minimal sample pretreatment, nondestructive measurement, and ease of miniaturization, and has therefore been widely applied in agricultural product quality evaluation and rapid feed composition analysis. The near-infrared region mainly reflects overtone and combination-band absorptions of hydrogen-containing functional groups such as C–H, O–H, and N–H, providing rich chemical information for both organic polymers and feed matrices. However, near-infrared spectra are characterized by broad absorption bands and severe peak overlap. In addition, the absorption signals of multiple organic components in feed overlap with the spectral responses of microplastic polymers, leading to compounded interference effects. As a result, spectral variations induced by microplastic contamination are typically manifested as weak responses distributed across multiple wavelength regions rather than distinct and well-defined characteristic peaks [
14]. Therefore, relying solely on conventional peak-based spectral interpretation is insufficient for accurate identification of microplastics in complex feed systems. It is necessary to integrate chemometrics and machine learning approaches to extract effective discriminative and quantitative information from high-dimensional spectral data.
In recent years, NIR combined with machine learning has demonstrated considerable application potential in the detection of microplastics in soils, water bodies, ash, and certain feed or food matrices. Corradini et al. further employed visible–near-infrared spectroscopy to predict microplastic concentrations in soil [
15]. In the field of feed analysis, Masoero et al. demonstrated the feasibility of using near-infrared spectroscopy for rapid detection of low-density polyethylene (LDPE) and polystyrene (PS) microplastics in ruminant feed [
13]; Liu et al. integrated near-infrared spectroscopy with machine learning algorithms to achieve rapid identification of PP, PVC, and polyethylene terephthalate (PET) microplastics in chicken feed [
16]. Another study based on a portable near-infrared spectrometer also showed that NIR combined with partial least squares regression (PLSR) and wavelength selection could be used for both qualitative and quantitative analysis of microplastics in chicken feed [
17]. However, most existing studies have focused on single matrices or a limited number of polymer types, and systematic identification and low-concentration quantitative prediction of multiple types of microplastics in chicken feed remain relatively insufficient. In particular, there is still a lack of systematic comparison and in-depth analysis regarding the spectral response differences in various microplastic materials in chicken feed matrices, the influence of different spectral preprocessing methods on the performance of qualitative and quantitative models, and the role of training set augmentation in improving the generalization capability of quantitative prediction models. Existing studies have shown that data augmentation using spectra of interfering substances can improve the recognition performance of near-infrared–machine learning models in complex environments [
18]. Due to differences in chemical structures, spectral response intensities of different polymers, and their interaction patterns with feed matrices, developing robust modeling strategies suitable for multi-type microplastic detection remains a key challenge in the application of rapid near-infrared analysis. These reports differ in matrix, polymer coverage, sample presentation, and analytical endpoint: Corradini et al. studied concentration prediction in soil [
15], Masoero et al. examined LDPE and PS in ruminant feed [
13], and Liu et al. evaluated fewer polymer types in chicken feed [
16,
17]. Therefore, this study systematically investigates seven common microplastic polymers in chicken feed by integrating multiple spectral preprocessing methods, machine learning models, and training-set augmentation strategies, with the aim of elucidating polymer-dependent spectral responses and establishing robust qualitative and quantitative modeling approaches.
Based on this, the present study focuses on seven common types of microplastics in chicken feed, namely polyamide (PA), polycarbonate (PC), polyethylene (PE), PET, PP, PS, and PVC. Microplastic-doped samples with different mass fraction gradients were prepared. A portable near-infrared spectrometer was used to acquire diffuse reflectance spectra of the samples, and a combination of multiple spectral preprocessing methods and machine learning models was employed to perform qualitative identification and quantitative prediction. The specific objectives are as follows:
(1) To characterize the NIR spectral changes associated with seven microplastic polymers in a chicken-feed matrix;
(2) To compare the performance of different machine learning models in microplastic classification, and to identify the optimal model for rapid discrimination of microplastics in chicken feed;
(3) To evaluate the effects of different preprocessing methods and regression models on the prediction of microplastic mass fractions, and to investigate the differences in quantitative modeling among different polymer types;
(4) To examine the impact of training set augmentation strategies on quantitative prediction performance and optimal model selection. The results of this study are expected to provide a methodological reference for rapid and nondestructive screening of microplastic contamination in chicken feed, and to offer theoretical support for the application of near-infrared spectroscopy in agricultural production and feed safety testing.
2. Materials and Methods
2.1. Sample Preparation
This study was conducted in January 2026. Microplastic materials—polyvinyl chloride (PVC), polystyrene (PS), polyethylene terephthalate (PET), polypropylene (PP), polyethylene (PE), polyamide (PA), and polycarbonate (PC)—were obtained from Jiangsu Ruixiang Polymer Materials Co., Ltd. (Changzhou, China), with a uniform particle size of 50 μm and purity of 99%. The chicken feed (CP 522, Zhengda Feed Co., Ltd., Shijiazhuang, China) was ground and sieved through a 60-mesh screen to obtain a homogeneous powder matrix. For each polymer type, the microplastic powder was incorporated into the feed matrix at ten mass fractions: 0.01%, 0.04%, 0.08%, 0.12%, 0.16%, 0.20%, 0.40%, 0.60%, 0.80%, and 1.00%. For each polymer–concentration combination, 12 independent replicate samples were prepared. Each replicate was individually formulated by weighing the appropriate amounts of microplastic and feed powder according to the designed ratio, followed by thorough mixing using an NP35-PRO vortex mixer (Changzhou Hongze Experimental Technology Co., Ltd., Changzhou, China) to ensure uniform distribution. Thus, the 12 replicates represented separate experimental units rather than repeated measurements of a single mixture. After mixing, 4.0000 g of each independently prepared sample was precisely weighed (0.0001 g analytical balance) and pressed into a circular pellet using an HY-12 tablet press (Tianjin Optical Instrument Factory, Tianjin, China) with a 25 mm diameter mold and controlled thickness of 5 mm. Pressing was performed at 10 MPa for 30 s to achieve a smooth surface and consistent packing density. This procedure yielded 120 independent samples per polymer type (10 concentrations × 12 replicates), totaling 840 microplastic-containing samples across the seven polymers, along with 60 pure feed samples. All samples were labeled by polymer type and concentration and stored in sealed aluminum containers prior to analysis.
2.2. Spectral Data Acquisition
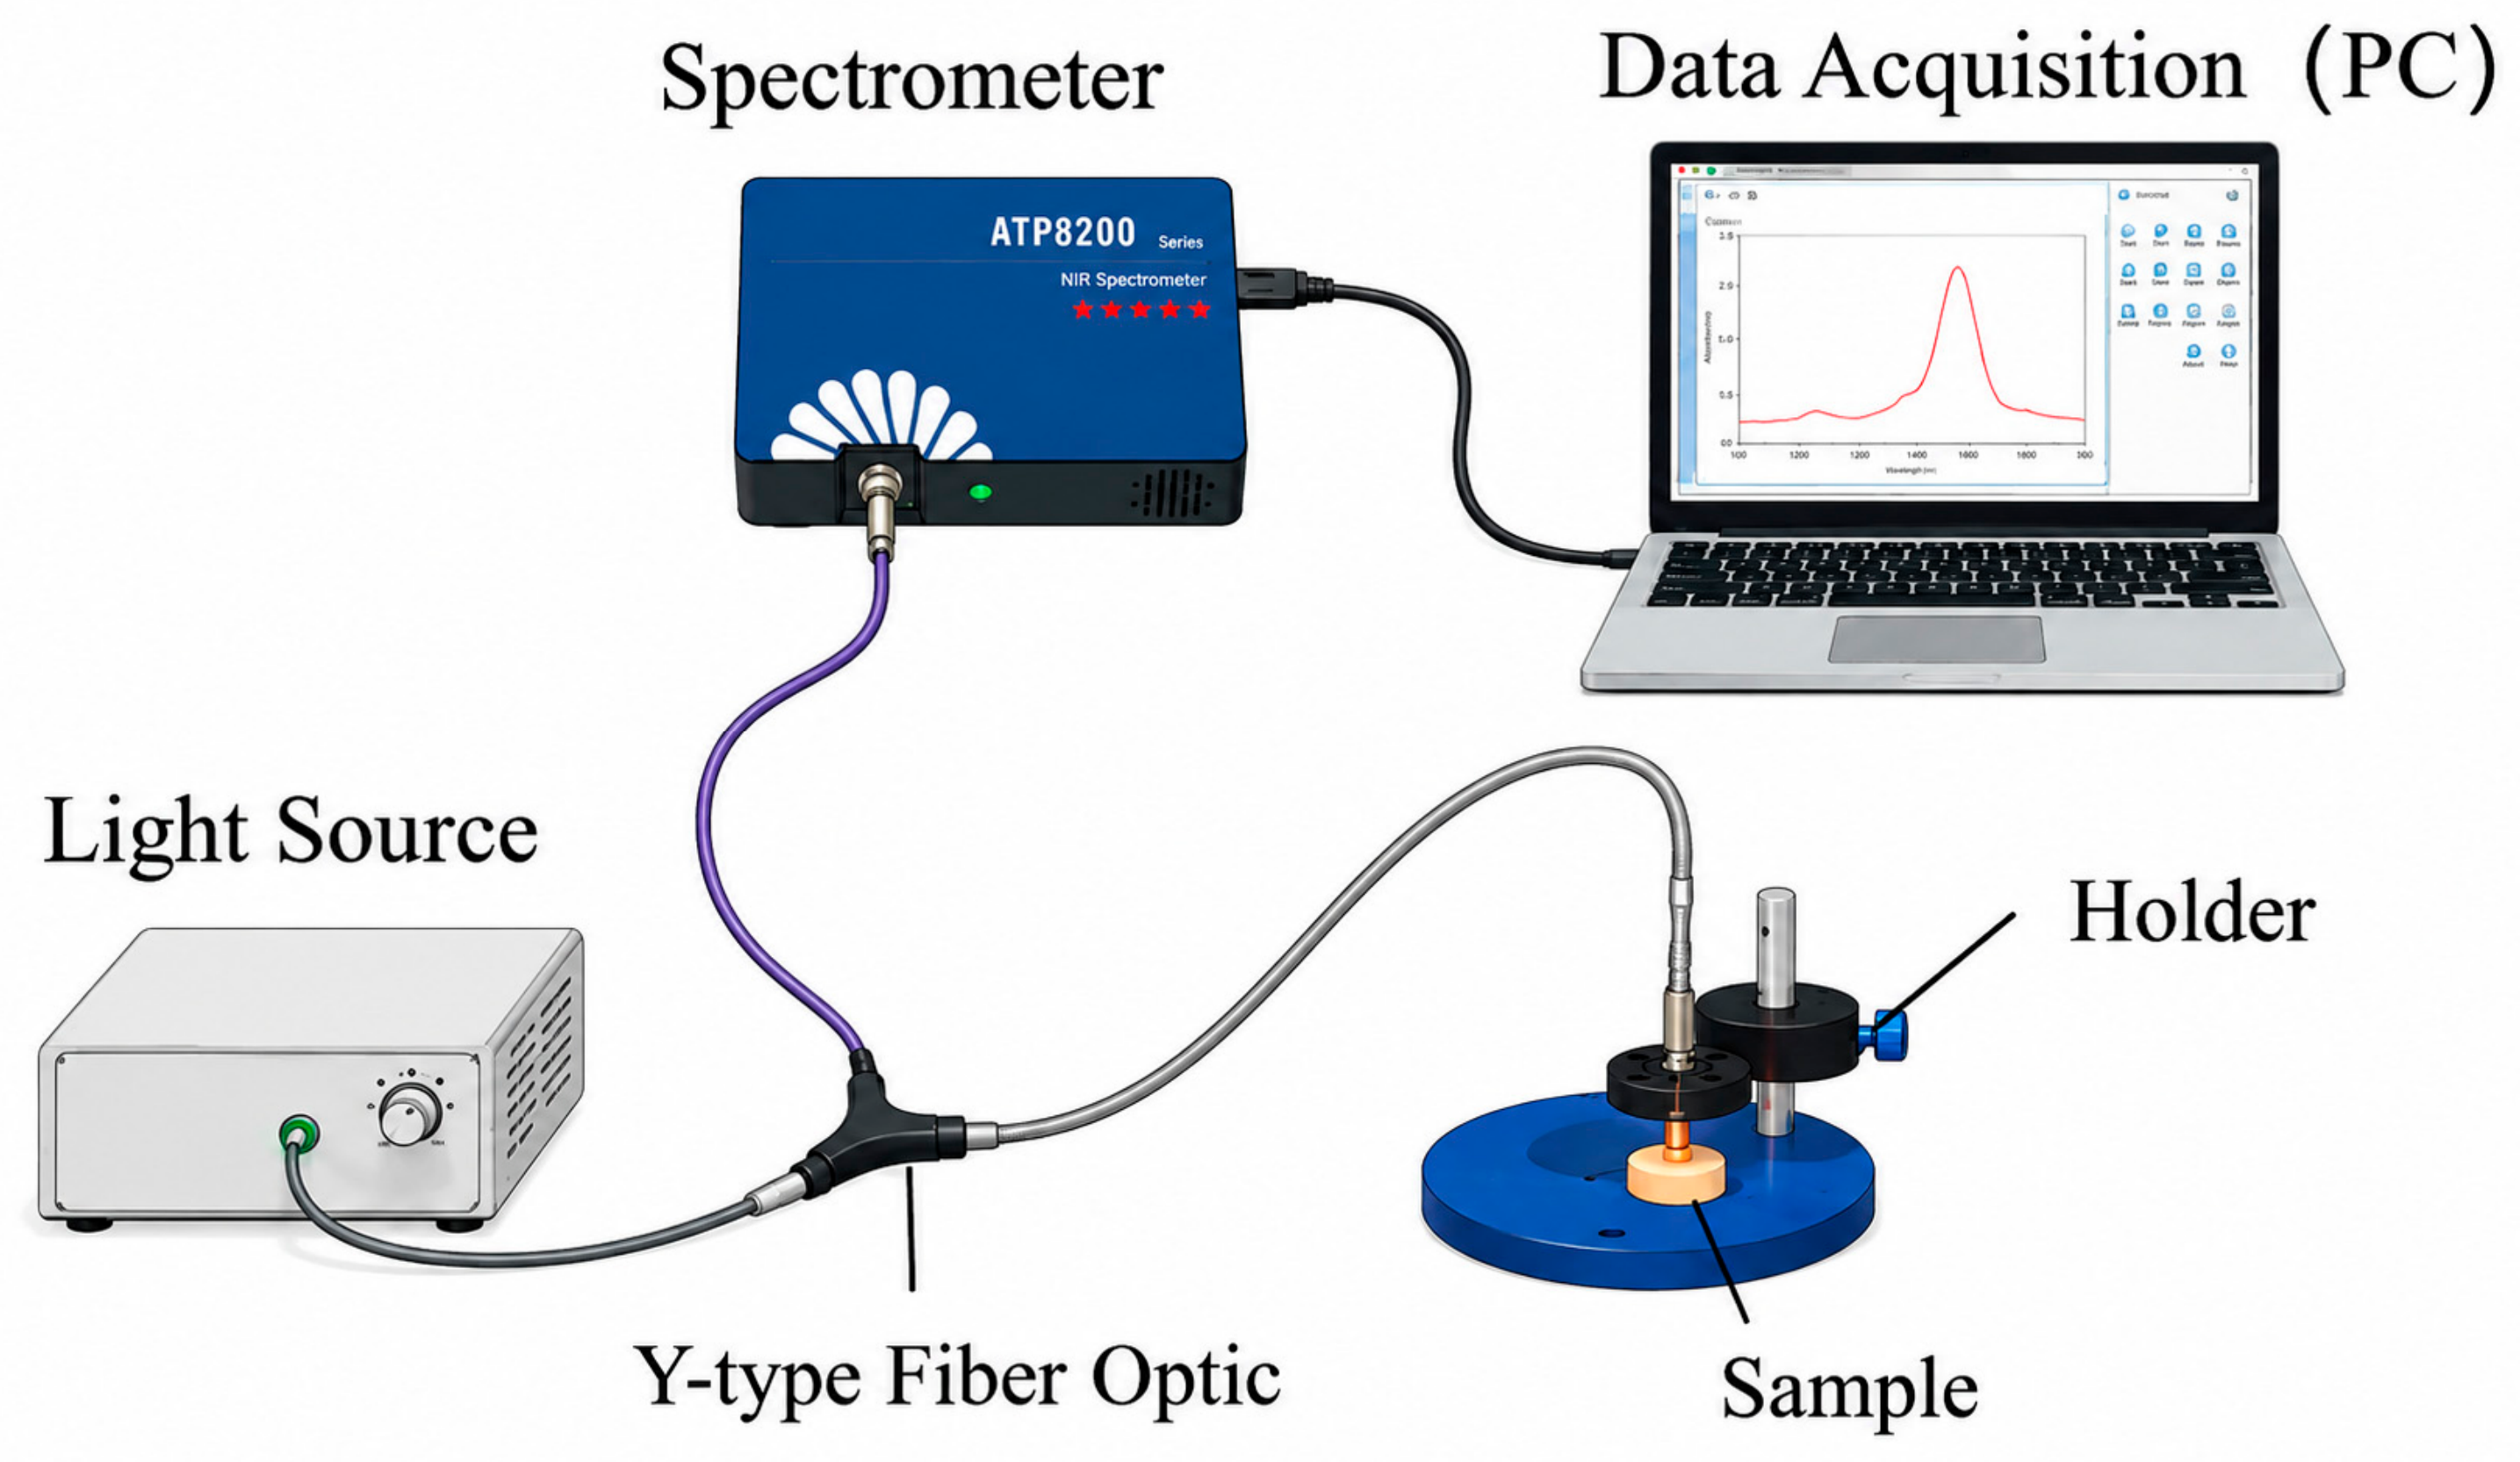
Near-infrared spectral data were collected using a portable near-infrared spectrometer (ATP8200, Optosky, Xiamen, China). Prior to acquisition, the spectrometer was connected to a computer via a USB Type-C interface, and a diffuse reflectance spectral acquisition system was constructed in combination with an LWD-100W light source (Guangzhou Tianpu Broadcasting, Guangzhou, China) and an SIH600 μm Y-type optical fiber, as shown in
Figure 1. All spectral data were acquired using SkyView software (Optosky, Xiamen, China). The spectral acquisition range was set to 900–2500 nm, with a spectral resolution of 3.2 nm, an integration time of 400 ms, three average scans, and a smoothing window of seven points. Before sample measurement, black-and-white calibration of the spectrometer was performed. Specifically, the light source was first turned off and the dust cap of the spectrometer was tightened to acquire the dark current signal; subsequently, the light source was turned on, and a polytetrafluoroethylene (PTFE) standard white reference board with 99% reflectance was used as the white reference to collect the white reference spectrum. The sample reflectance spectra were then corrected according to Equation (1):
where
denotes the relative reflectance at wavelength
;
Is(
λ) denotes the spectral signal intensity of the sample;
denotes the dark current signal intensity; and
denotes the white reference spectral signal intensity.
During spectral acquisition, the pressed sample pellets were placed beneath the optical fiber probe, and measurements were performed in diffuse reflectance mode. To reduce the influence of sample surface inhomogeneity and sampling position variability on the spectral results, each sample was measured at three different rotational angles. At each angle, three consecutive scans were performed, and the resulting spectra were averaged to obtain a representative spectrum for each sample. After completing spectral acquisition for all samples, the raw spectral data were subjected to wavelength range truncation. Due to the low signal-to-noise ratio at both ends of the spectra, only the effective spectral information in the range of 1100–2200 nm was retained in this study. Ultimately, each sample yielded near-infrared spectral data consisting of 353 valid wavelength variables. To further reduce the influence of variations in light intensity on spectral analysis and enhance the spectral response of compositional differences among samples, the corrected reflectance spectra were subsequently transformed into absorbance spectra using the following equation:
2.3. Spectral Preprocessing
To reduce interference caused by instrumental noise, sample particle heterogeneity, light scattering effects, and baseline drift during spectral acquisition, the raw near-infrared absorbance spectra were preprocessed in this study. The preprocessing methods included mean centering (MC), multiplicative scatter correction (MSC), standard normal variate (SNV), moving average (MA), Savitzky–Golay (SG) smoothing, and detrending (DT).
MC eliminates overall offsets by subtracting the mean value of each individual spectrum [
19]; MSC uses the mean spectrum of all samples as a reference spectrum and corrects multiplicative and additive scattering effects through linear regression [
20]; SNV performs normalization of mean and standard deviation for each spectrum individually to reduce the influence of particle size and scattering variations on spectral data [
21]. MA smoothing was applied using a 21-wavelength-point moving window to reduce random noise; SG smoothing was implemented with a window length of 21 and a polynomial order of 3 to preserve relevant peak information while smoothing the spectra [
22]. DT removes linear drift in the spectra by fitting and subtracting a linear baseline from each individual spectrum [
23]. The preprocessed spectral data were used for subsequent feature analysis and the construction of qualitative and quantitative models to evaluate the impact of different preprocessing methods on model performance.
2.4. Model Development
To achieve both qualitative identification and quantitative prediction of microplastic-spiked chicken feed samples, all absorbance variables retained in the 1100–2200 nm range were used as input features to construct classification and regression models, respectively. In the qualitative analysis, the microplastic type was used as the classification label to identify the categories of microplastics doped in chicken feed; in the quantitative analysis, the mass fraction of microplastics was used as the prediction target to estimate their concentrations in the samples. In this study, partial least squares discriminant analysis (PLS-DA), support vector machine (SVM), random forest (RF), extremely randomized trees (ET), k-nearest neighbors (KNN), extreme gradient boosting (XGBoost, XGB), and extreme learning machine (ELM) were employed for qualitative modeling; correspondingly, partial least squares regression (PLSR), support vector regression (SVR), RF, ET, KNN, ELM, and XGB were adopted for quantitative prediction.
PLS-DA and PLSR are both based on the partial least squares (PLS) algorithm. This method extracts a set of latent variables from high-dimensional spectral predictors and response variables, such that these latent variables maximize the covariance between the predictor matrix and the response matrix. In this way, the influence of multicollinearity and high-dimensional redundancy in near-infrared spectral data on model performance can be effectively reduced. Specifically, PLS-DA transforms categorical labels into numerical values and establishes a discriminant relationship between spectral variables and class responses through PLS, making it suitable for sample classification; PLSR, on the other hand, directly builds a linear regression relationship between spectral variables and the mass fraction of microplastic doping, and is therefore suitable for concentration prediction.
SVM is a supervised learning method based on statistical learning theory. Its core idea is to identify an optimal separating hyperplane in the feature space that maximizes the margin between different classes, thereby improving the generalization capability of the model. For nonlinear spectral data, SVM can map the original spectral variables into a higher-dimensional feature space through kernel functions, enhancing its ability to represent complex nonlinear relationships [
24]. In quantitative analysis, support vector regression (SVR) constructs a regression function by introducing an insensitive loss function, enabling continuous prediction of microplastic concentration within an allowable error margin.
RF is a machine learning algorithm based on the Bagging ensemble strategy. It constructs multiple training subsets through bootstrap sampling and builds decision tree models on each subset. The final classification or regression result is obtained by majority voting or averaging. Due to the introduction of both sample and feature randomness, RF effectively reduces the overfitting risk of a single decision tree and improves model stability [
25]. ET is an improved variant of RF, which further increases randomness during tree construction by not only randomly selecting features but also randomly generating candidate split thresholds and selecting the optimal split among them [
26].
KNN is a non-parametric learning method based on distance metrics that does not require an explicit mathematical model. Instead, it makes predictions based on the distance relationships between the sample to be predicted and samples in the training set [
27]. In classification tasks, KNN determines the class of a sample by majority voting among its nearest neighbors; in regression tasks, the predicted value is obtained by averaging or weighted averaging the responses of neighboring samples. This method is simple in principle and is suitable when samples exhibit strong local similarity in the spectral feature space.
XGB is an ensemble learning algorithm based on gradient boosting decision trees. It iteratively builds multiple weak learners, with each subsequent model continuously fitting the residuals of the previous model, thereby improving overall performance. Compared with traditional gradient boosting trees, XGB introduces a regularization term into the objective function and adopts strategies such as shrinkage learning rate, column sampling, and optimized tree structures to enhance generalization ability and reduce overfitting risk. This algorithm exhibits strong nonlinear fitting capability and is well suited for modeling complex nonlinear relationships between near-infrared spectra and microplastic type or concentration [
28].
ELM is a single-hidden-layer feedforward neural network model. Unlike traditional neural networks that require iterative optimization of weights, ELM randomly assigns input weights and hidden-layer biases during training and keeps them fixed, while the output weights are analytically determined using least squares or the Moore–Penrose generalized inverse [
29]. Therefore, ELM is characterized by fast training speed, relatively simple parameter tuning, and strong nonlinear mapping capability, making it suitable for rapid classification and regression modeling of high-dimensional spectral data.
Different spectral preprocessing methods were applied to the spectra and then evaluated using the models described above. To ensure representative coverage of spectral variability, samples within each polymer category were partitioned into training and test sets using the Kennard–Stone (KS) algorithm based on Euclidean distances in the spectral feature space. For classification, 588 spectra (84 per polymer) were assigned to the training set and 252 spectra (36 per polymer) to the test set. For polymer-specific regression, each polymer contributed 80 training spectra and 40 test spectra. Hyperparameters were selected by grid search with five-fold cross-validation conducted exclusively within the training set. The parameter combination yielding the best cross-validation performance was subsequently refitted using the complete training set and evaluated on the held-out test set. Calculations were performed under 64-bit Windows 11 on an AMD Ryzen 9 7945HX processor with 16 GB RAM using Python 3.11.7 and scikit-learn 1.2.2.
2.5. Data Augmentation
To evaluate the impact of training set size on the performance of microplastic quantitative prediction models, the synthetic minority over-sampling technique (SMOTE) was employed to augment the training set samples. SMOTE generates new synthetic samples by searching for nearest neighbors in the feature space and performing linear interpolation between original samples and their neighbors, thereby increasing the number of training samples and improving the model’s ability to learn data distribution characteristics [
30]. Compared with simple random oversampling, SMOTE-generated synthetic samples expand the local coverage of the training feature space through interpolation between neighboring observations, which may help the models better represent spectral variations within the available training data.
In this study, SMOTE was applied only to the training set, while the test set was kept completely independent and was not involved in sample generation, parameter optimization, or model training, in order to avoid data leakage and ensure objective model evaluation. For quantitative prediction tasks of different microplastic types, training datasets were constructed based on the original training set with two augmentation levels, namely 1× augmentation (+1x) and 2× augmentation (+2x). Subsequently, the original training set and the augmented datasets with different scaling factors were separately used to train quantitative models including KNN, SVR, RF, ET, and XGB, and the same independent test set was used to evaluate model predictive performance.
2.6. Model Evaluation
To evaluate the performance of different models in microplastic detection in chicken feed, classification and regression metrics were respectively used to assess qualitative identification models and quantitative prediction models. As detailed in
Section 2.4, all models were optimized by five-fold cross-validation on the training set and finally evaluated using the independent test set. For qualitative models, accuracy, precision, recall, and F1-score were adopted to evaluate the classification performance for seven types of microplastics, namely PA, PC, PE, PET, PP, PS, and PVC. Accuracy reflects the overall correctness of classification, while precision and recall measure the reliability and completeness of predictions for each class, respectively. The F1-score provides a comprehensive evaluation of the balance between precision and recall. A confusion matrix was further used to analyze misclassification patterns among different microplastic categories. The formulas for each metric are given as follows:
where TP, TN, FP, and FN denote true positives, true negatives, false positives, and false negatives, respectively.
For quantitative prediction models, the coefficient of determination (
R2), root mean square error (RMSE), and residual predictive deviation (RPD) were used to evaluate the predictive performance of the models for microplastic mass fraction. Specifically, a higher
R2 indicates better model fitting performance, a lower RMSE indicates smaller prediction error, and a higher RPD indicates a lower prediction error relative to the variation in reference values.
R2 was used as the primary visual summary because it is dimensionless and permits comparison across polymers, while RMSE and RPD were retained in the tables to avoid relying on a single metric. The corresponding formulas are given as follows:
where
presents the predicted value of the
i-th sample,
is the corresponding true value,
n is the total number of samples,
is the mean of the actual values, and SD denotes the standard deviation of the actual values.
3. Results
3.1. Near-Infrared Spectral Feature Analysis
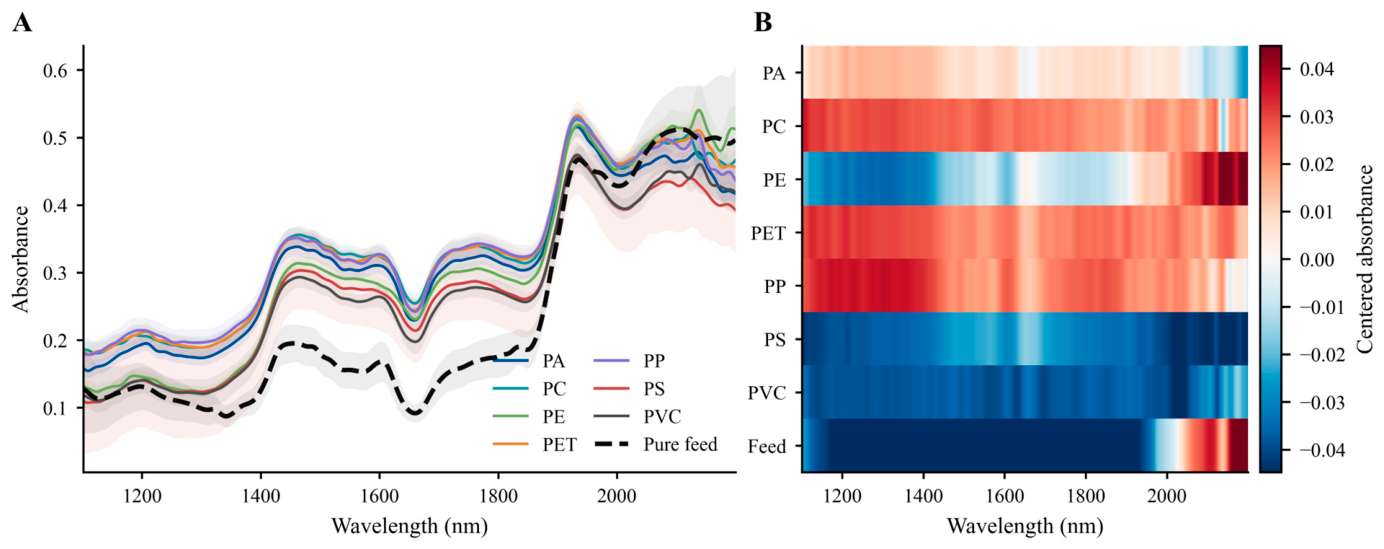
Figure 2A shows that all seven types of microplastic-spiked chicken feed samples exhibit the typical characteristics of near-infrared spectra, namely broad absorption bands and overlapping peaks, within the wavelength range of 1100–2200 nm. Components in chicken feed, including corn, proteins, amino acids, lipids, and moisture, are rich in N–H, C–H, and O–H bonds. The overlapping absorption signals of these constituents substantially enhance the matrix background, thereby reducing the resolvability of characteristic peaks of individual polymers [
13,
16,
31]. The overall absorption intensity of pure chicken feed is lower than that of most microplastic-doped samples, with more pronounced differences observed in the 1100–1850 nm range. However, beyond 1900 nm, the absorption of pure chicken feed increases rapidly and becomes comparable to, or even overlaps with, that of some doped samples in the 2000–2200 nm region, indicating that water, proteins, and oxygen-containing functional groups in the feed matrix still contribute strongly at higher wavelengths. In contrast, after the addition of microplastics, the average spectra of the doped samples show an overall upward shift, and more stable differences are observed in local absorption intensity, shoulder features, and spectral slope, indicating that the introduction of microplastics alters the original near-infrared response characteristics of chicken feed.
As shown in
Figure 2A, the spectra of both pure chicken feed and microplastic-spiked samples exhibited broad absorption bands and overlapping peaks in the 1100–2200 nm range [
32,
33]. In the 1100–1400 nm region, broad differences in spectral intensity and baseline level were observed among the samples, which may reflect the combined effects of particle scattering and matrix-related absorption. From approximately 1400 to 1900 nm, the pure feed spectrum remained relatively distinguishable from several of the microplastic-spiked spectra, indicating comparatively clearer spectral separation in this region. In contrast, beyond 1900 nm, the absorbance of pure feed increased sharply, and spectral overlap became more pronounced, particularly within the 2000–2200 nm region [
34,
35]. This stronger overlap is consistent with increased interference from feed-matrix constituents at higher wavelengths. Thus,
Figure 2A shows both regions of relatively clear separation and regions of substantial spectral overlap between pure feed and microplastic-spiked samples.
Figure 2B illustrates the spectral deviation of each sample group relative to the global mean spectrum. Pure chicken feed showed a negative deviation across 1100–1900 nm, which transitioned to a positive deviation above 2000 nm. In comparison, microplastic-spiked samples exhibited distinct class-dependent variations across multiple spectral intervals, particularly within the 1100–1400 nm and 2000–2200 nm ranges. The pure chicken feed spectra were used only as a non-doped matrix reference for spectral comparison and were not included in subsequent model development.
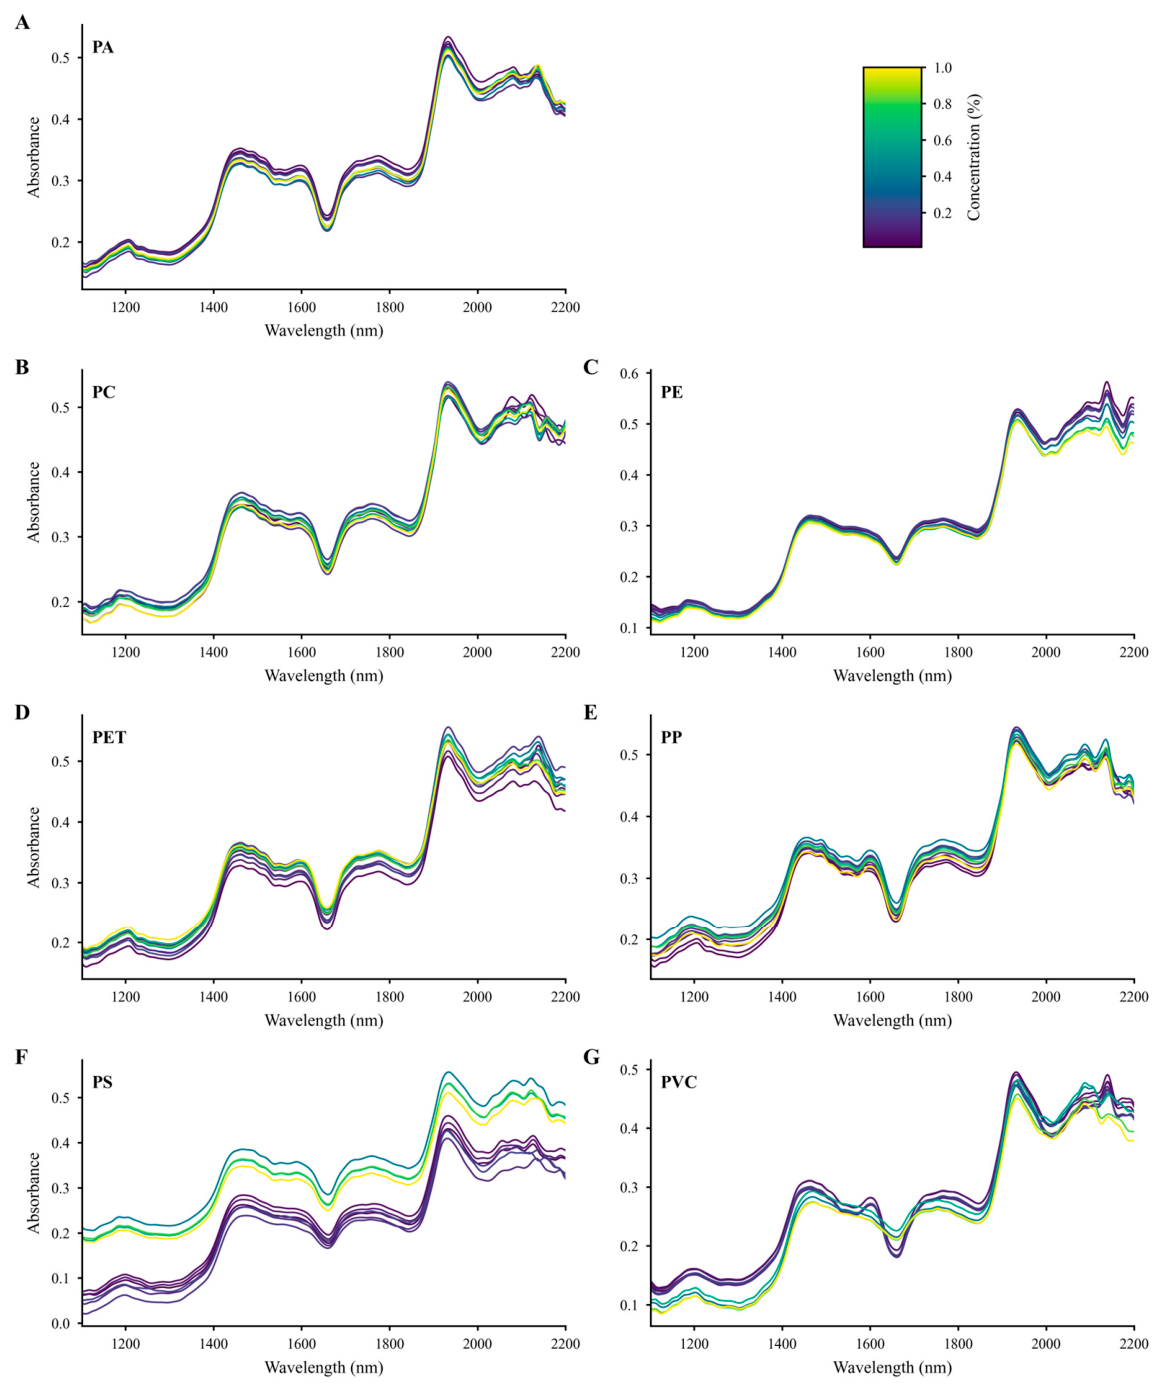
Figure 3 further illustrates the influence of concentration gradients on the spectra. PE, PS, and PVC exhibit relatively clear systematic responses with increasing concentration, which is consistent with their higher
R2 values in subsequent analyses. In contrast, PA, PC, PET, and PP show more pronounced spectral overlap at certain concentration levels, suggesting that their quantitative prediction is more susceptible to matrix background effects, sample heterogeneity, and particle scattering.
Supplementary Figure S1 presents the spectral profiles after different preprocessing methods used for qualitative analysis: MC mainly removes overall mean offsets; MSC and SNV reduce scattering effects and intensity variations; MA and SG smooth high-frequency noise while preserving broad absorption trends; and DT is used to correct slow baseline drift. After preprocessing, inter-class differences remain primarily characterized by weak variations across multiple spectral bands; therefore, full-spectrum machine learning models were subsequently employed for both classification and prediction tasks.
3.2. Comparison of Qualitative Identification Model Performance Using Raw Near-Infrared Spectra
As shown in
Table 1, the evaluated models showed different classification performance for identifying microplastic-spiked chicken feed samples. Overall, the ET model achieved the best performance on the test set, with Accuracy, Precision, Recall, and F1-score values of 0.9603, 0.9617, 0.9603, and 0.9602, respectively, all numerically higher than those of the other evaluated models. These results indicate that ET provided the best overall discrimination among the seven microplastic classes under the present experimental conditions and was more effective in distinguishing polymer-related spectral differences within the compositionally complex chicken-feed matrix. As an ensemble tree-based model, ET has strong nonlinear modeling capability and can reduce sensitivity to noise, scattering effects, and local spectral fluctuations through integration of multiple decision trees. Therefore, it maintains relatively high classification accuracy and good generalization performance even under conditions of broad and heavily overlapping near-infrared spectral bands and complex matrix backgrounds. SVR and ELM achieved the second-best classification performance on the test set, with F1-scores of 0.9437 and 0.9401, respectively, indicating that both models can capture, to some extent, the nonlinear spectral differences among different microplastic-doped samples. Specifically, SVR benefits from the kernel function in modeling complex nonlinear relationships, while ELM enhances feature representation through nonlinear mapping in the hidden layer. However, both methods are relatively sensitive to parameter settings, sample distribution, and data preprocessing, which leads to slightly lower performance compared with ET on the test set. In contrast, although KNN, XGB, and RF all achieved or approached 100% accuracy on the training set, their test set performance decreased to varying degrees, indicating potential overfitting. KNN relies on distance-based classification, but near-infrared spectral data are typically characterized by high dimensionality, strong multicollinearity, and redundant information, making the model sensitive to noise and scattering variations and limiting its generalization ability on unseen samples. Although XGB and RF have strong nonlinear modeling capabilities, with limited sample sizes and highly correlated spectral variables, these models may capture local fluctuations or incidental patterns specific to the training set, thereby degrading test performance.
The PLS-DA model achieved the lowest test performance, with an Accuracy of 0.8810 and an F1-score of 0.8816. This may be attributed to its largely linear nature. As shown in
Figure 2A, broad and overlapping absorption features are present across the 1100–2200 nm range, with pronounced spectral overlap particularly in the 2000–2200 nm region. Meanwhile, polymer-related spectral differences are distributed across multiple wavelength intervals rather than concentrated in a single region. This distributed and overlapping spectral pattern may limit the ability of a linear model such as PLS-DA to discriminate among the seven microplastic classes. Overall, ET achieved the best classification performance among the evaluated models.
3.3. Influence of Spectral Preprocessing Methods on Qualitative Identification Model Performance
In addition to modeling based on the raw spectra, the effects of different preprocessing methods—including MC, MSC, SNV, MA, SG, and DT—on the qualitative identification performance of microplastic-spiked chicken feed samples were further compared.
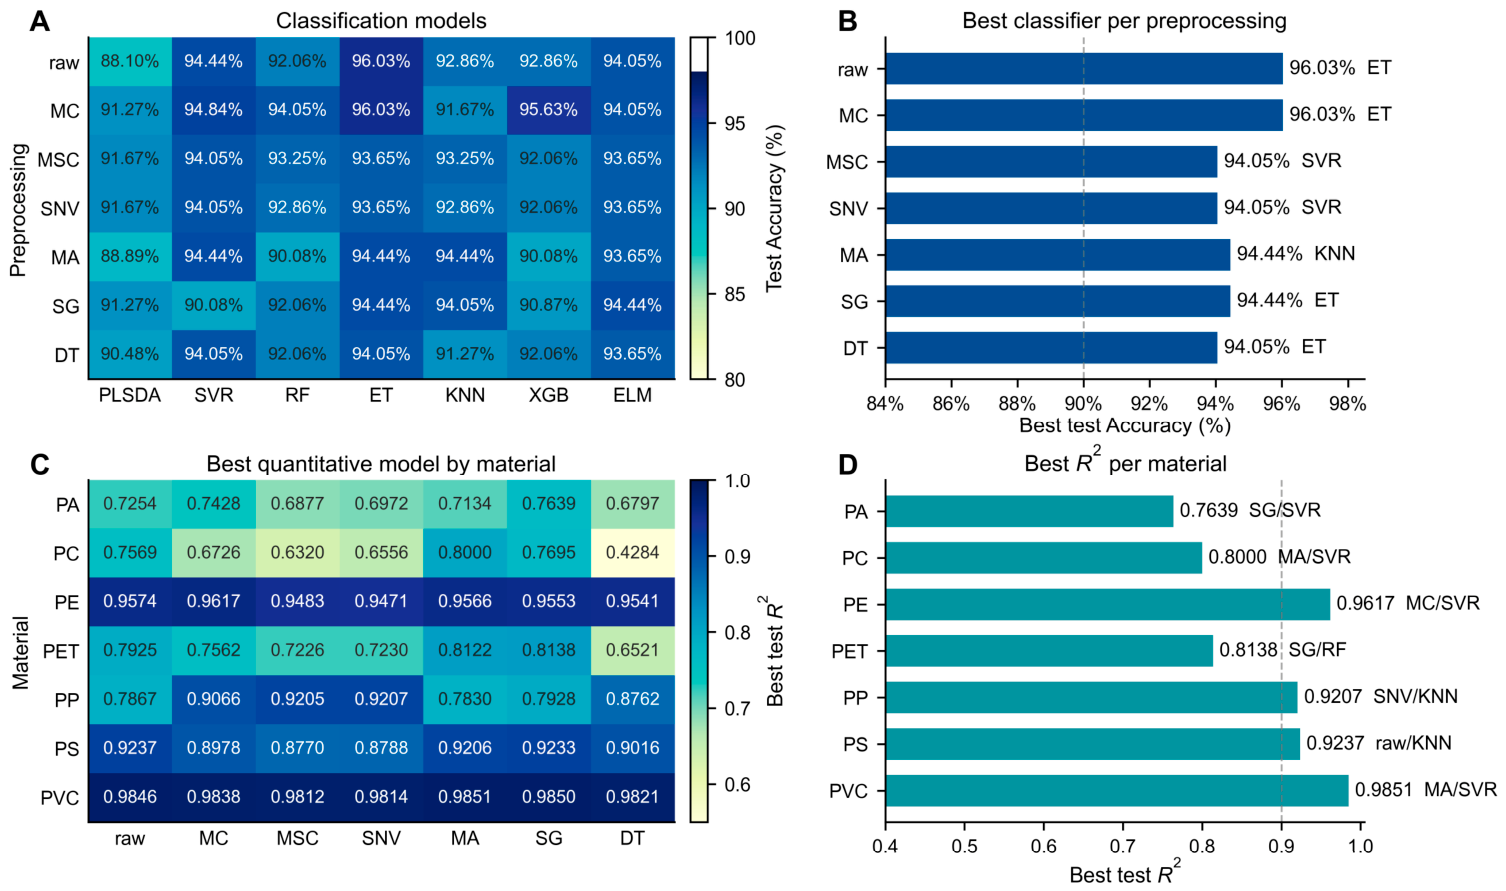
Figure 4A presents a heatmap of test set accuracy for different combinations of preprocessing methods and classification models, while
Figure 4B summarizes the optimal classification model under each preprocessing method along with the corresponding highest test set accuracy. The results indicate that the influence of preprocessing methods on classification performance is relatively limited, with the highest test set accuracy across different conditions ranging from 94.05% to 96.03%. Among them, both the raw spectra and MC-preprocessed data combined with the ET model achieved the highest test set accuracy of 96.03%, indicating that the original spectral data already contain sufficient discriminative information for class separation under the current experimental conditions. MC preprocessing can partially correct overall intensity variations and baseline shifts, but provides only limited improvement in model performance.
From the perspective of optimal models under different preprocessing methods, SVR performed best after MSC and SNV preprocessing, with a maximum test set accuracy of 94.05%; KNN achieved the best performance after MA preprocessing, with an accuracy of 94.44%; and ET performed best after SG and DT preprocessing, with accuracies of 94.44% and 94.05%, respectively. These results suggest that although MSC, SNV, SG, and DT can reduce certain background interferences in the spectra, they may also attenuate local spectral information related to microplastic-type differences, and therefore do not necessarily lead to improved classification accuracy. In contrast, the ET model consistently maintained optimal performance on both raw and MC-processed spectra, indicating its strong robustness in handling multi-band spectral variations under complex matrix backgrounds.
These findings further indicate that qualitative identification mainly depends on the overall spectral shape differences among different polymers. MC can partially reduce the effects of sample packing variation, overall intensity differences, and baseline shifts. However, given that the ET model already achieves an accuracy of 0.9603 on raw spectra, the improvement brought by preprocessing is limited. Therefore, for practical applications aimed at rapid identification of microplastic types, a relatively simple workflow based on raw spectra or MC preprocessing combined with ET or SVR can be considered sufficient for qualitative analysis.
3.4. Comparison of Quantitative Prediction Model Performance Using Raw Near-Infrared Spectra
For further comparison of the quantitative prediction capability of different algorithms under raw spectral conditions, the present study used the coefficient of determination (
R2) of the test set as the primary evaluation metric to analyze the modeling performance of KNN, SVR, ET, RF, XGB, and ELM in predicting the contents of seven types of microplastics. As shown in
Table 2 and
Supplementary Figure S2, there are clear differences in the applicability of different algorithms for the quantitative prediction task. SVR achieved the best performance for PA, PC, PE, and PVC, indicating its strong adaptability to nonlinear relationships and high multicollinearity characteristics in raw near-infrared spectra. In contrast, although ET and ELM also achieved relatively high test set
R2 values for certain categories—for example, ET achieved
R2 values of 0.9660 and 0.9364 for PVC and PE, respectively, while ELM achieved
R2 values of 0.9552 and 0.9285 for PVC and PE, respectively—their overall stability was inferior to that of SVR. As an ensemble tree-based model, ET is more suitable for capturing pronounced nonlinear differences among categories; however, in continuous concentration prediction, its node-splitting mechanism may struggle to finely characterize the spectral gradients associated with concentration changes, leading to limited performance for materials such as PA, PC, PET, and PP, which exhibit weaker signals or stronger matrix interference. The ELM model relies on random hidden-layer mapping, and its performance is sensitive to the number of hidden nodes, sample distribution, and noise level. Under conditions of limited sample size and high spectral collinearity, ELM is particularly sensitive to local fluctuations and redundant information, resulting in lower test set R
2 values for PA, PET, and PP of 0.5324, 0.3577, and 0.5940, respectively, indicating insufficient generalization ability.
From the perspective of optimal models, SVR achieved the best predictive performance for PA, PC, PE, and PVC, with test set
R2 values of 0.7254, 0.7569, 0.9574, and 0.9846, respectively, demonstrating its strong adaptability to nonlinear relationships and multicollinearity in raw near-infrared spectra. Among them, PVC achieved the best prediction performance, with test set
R2, RMSE, and RPD values of 0.9846, 0.0409, and 8.1642, respectively. In
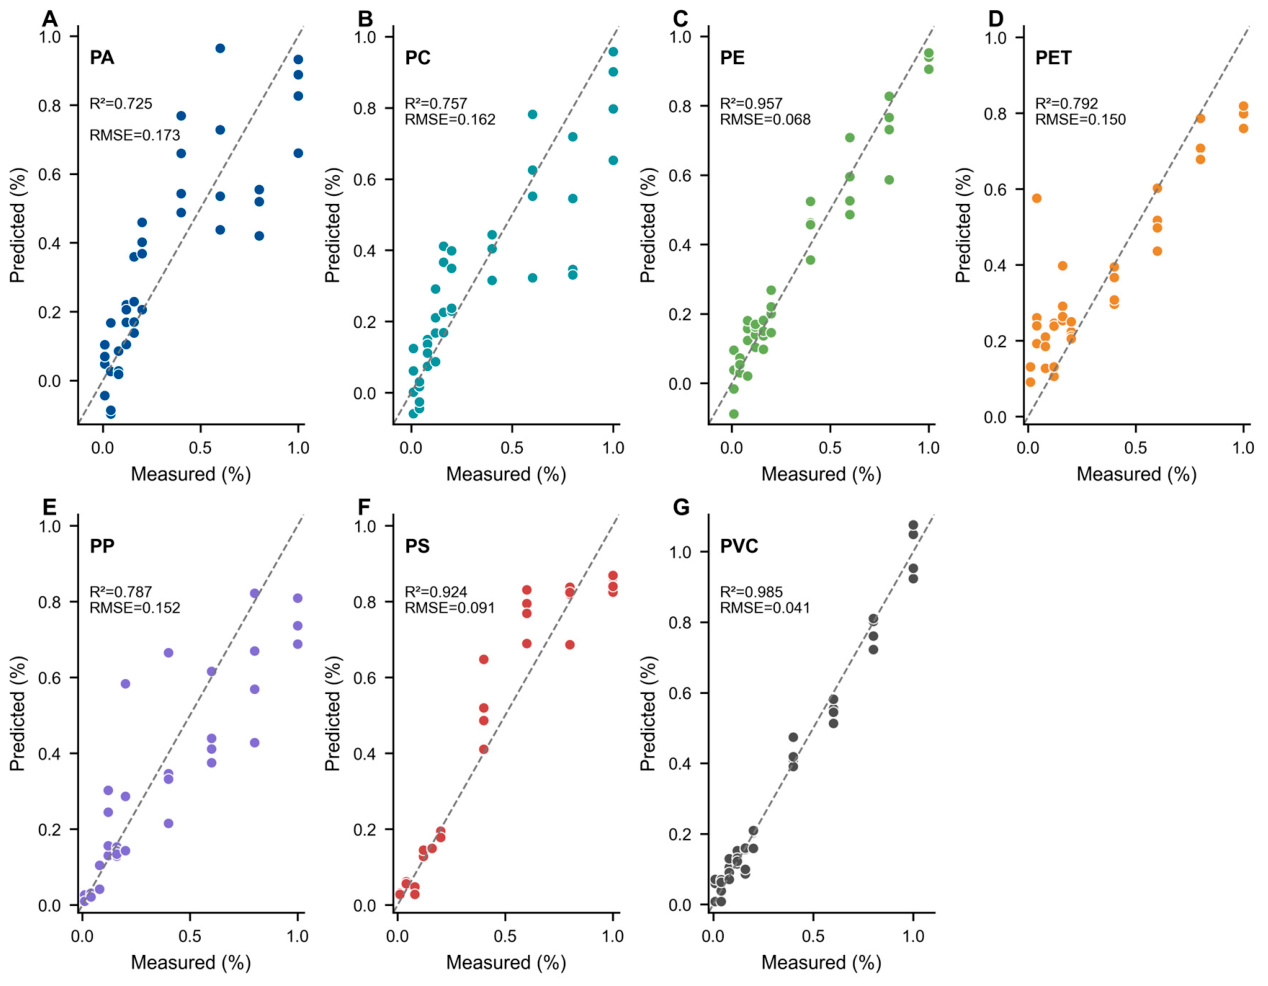
Figure 5G, the predicted values closely align with the 1:1 reference line, with tightly clustered scatter points, indicating high prediction accuracy and RPD. PE also showed strong performance, with test set
R2 and RPD values of 0.9574 and 4.9064, respectively, and the scatter points in
Figure 5C are similarly distributed along the 1:1 line, indicating that raw spectra can effectively capture PE concentration variations. PS achieved the best performance with the KNN model, with test set
R2, RMSE, and RPD values of 0.9237, 0.0910, and 3.6670, respectively; as shown in
Figure 5F, predicted and measured values show good agreement, indicating strong quantitative modeling potential.
In contrast, the prediction performance of PA, PC, PET, and PP was relatively limited. Although SVR remained the best model for PA and PC, the test set
R2 values were only 0.7254 and 0.7569, with RPD values of 1.9325 and 2.0541, respectively. As shown in
Figure 5A,B, the scatter points deviate noticeably from the 1:1 line, particularly at higher concentration levels, indicating larger prediction errors and suggesting that their concentration-related spectral information may be weak or more strongly affected by matrix interference. PET achieved the best performance with the RF model, with a test set
R2 of 0.7925, RMSE of 0.1501, and RPD of 2.2231, indicating moderate predictive capability. PP achieved the best performance with the KNN model, with test set
R2, RMSE, and RPD values of 0.7867, 0.1522, and 2.1927, respectively; however, its training set
R2 reached 1.0000 with an RMSE of only 0.0034, indicating a substantial gap between training and test performance and suggesting potential overfitting. In
Figure 5E, the PP samples show noticeable dispersion in the medium- and high-concentration regions, further indicating limited predictive stability for unseen samples. These results suggest that quantitative prediction based on raw spectra is influenced not only by the nonlinear modeling capability of algorithms but also by the spectral response intensity of target materials, the separability of concentration gradients, and the degree of matrix interference.
Overall, raw spectra can be used for quantitative prediction of all seven types of microplastic-spiked chicken feed samples, but prediction difficulty varies among materials. The models for PVC, PE, and PS exhibit higher prediction accuracy and higher RPD, making them more suitable for quantitative analysis under raw spectral conditions, whereas the models for PA, PC, PET, and PP show relatively weaker predictive performance and still require appropriate spectral preprocessing to further improve accuracy and generalization ability.
3.5. Influence of Spectral Preprocessing Methods on Quantitative Prediction Model Performance
In addition to the quantitative modeling results based on raw spectra, the effects of preprocessing methods including MC, MSC, SNV, MA, SG, and DT on the prediction performance of seven types of microplastic contents were further investigated.
Figure 4C presents the test set
R2 values of the optimal quantitative models under different preprocessing methods for each material, while
Figure 4D summarizes the highest test set
R2 achieved for each material across all preprocessing conditions along with the corresponding models. The results indicate that preprocessing has markedly different effects on quantitative prediction performance among different microplastic types, suggesting that their spectral responses in chicken feed matrices and their susceptibility to scattering, baseline drift, and noise interference are not consistent.
From the optimal results of each material, PVC, PE, and PS still exhibit relatively strong quantitative prediction performance. For PVC, the highest test set R2 of 0.9851 was achieved using MA preprocessing combined with the SVR model, which is slightly higher than that obtained from raw spectra (0.9846). Moreover, the R2 values under different preprocessing conditions all remained above 0.9812, indicating that PVC-related spectral information is highly stable and insensitive to preprocessing methods. For PE, the best performance was obtained using MC preprocessing combined with SVR, where the test set R2 increased from 0.9574 (raw spectra) to 0.9617, with only a marginal improvement, suggesting that raw spectra already capture PE concentration variations well, while MC further reduces overall intensity variation or baseline drift. For PS, the highest R2 of 0.9237 was obtained using the KNN model with raw spectra, and no improvement was observed after preprocessing, indicating that the key quantitative information of PS may be mainly contained in local spectral features of the raw data, while certain preprocessing steps may weaken concentration-related signals.
For PA, PC, PET, and PP, preprocessing led to more pronounced improvements. For PA, SG preprocessing combined with SVR increased the test set
R2 from 0.7254 (raw spectra,
Section 3.4) to 0.7639, indicating that smoothing helps reduce the influence of noise on PA prediction. For PC, MA preprocessing combined with SVR achieved the best performance, with
R2 increasing from 0.7569 to 0.8000, suggesting that moderate smoothing can enhance concentration-related spectral features. For PET, SG preprocessing combined with RF improved the
R2 from 0.7925 to 0.8138, indicating a limited improvement in predictive performance. PP showed the largest improvement among all materials, with the test set
R2 increasing from 0.7867 (raw spectra) to 0.9207 after SNV preprocessing, and a similar result of 0.9205 after MSC, indicating that PP prediction is strongly affected by scattering effects and sample physical variability, and that SNV and MSC effectively enhance concentration-related spectral information.
From the perspective of model types, SVR remains the optimal model for PA, PC, PE, and PVC, demonstrating its strong applicability in handling high-dimensional, collinear, and nonlinear near-infrared spectral data. RF performed best only for PET, indicating its ability to capture nonlinear spectral responses related to PET. KNN achieved the best performance for PP and PS, but with different behaviors: PP showed a marked improvement after SNV preprocessing, whereas PS performed best with raw spectra, indicating that a marked improvement after distance-based methods is highly sensitive to both preprocessing strategies and sample distribution characteristics.
Overall, compared with qualitative identification, quantitative prediction is more sensitive to spectral preprocessing. The optimal preprocessing strategies vary among different microplastics. PVC, PE, and PS are less dependent on preprocessing, whereas PP, PC, PA, and PET benefit from appropriate preprocessing, with PP being particularly sensitive to scattering correction. Therefore, a unified preprocessing strategy is not suitable for quantitative modeling of microplastic-spiked chicken feed samples; instead, preprocessing methods should be selected according to the spectral characteristics of the target material and model performance. The complete preprocessing results are provided in
Supplementary Figure S3, while the main text only presents representative results with interpretative significance for model selection.
3.6. Effect of Training Set Augmentation on Quantitative Models
To further investigate the influence of training set size on the quantitative prediction performance of microplastics in chicken feed, SMOTE was applied to augment the training set. The optimal models and their predictive performance before and after augmentation for different materials were compared, as shown in
Table 3. The results indicate that the performance changes induced by SMOTE augmentation are not consistent across different microplastic types, and the degree of improvement is closely related to the intrinsic spectral response characteristics of each material, the distribution of the original training samples, and the selected modeling algorithms.
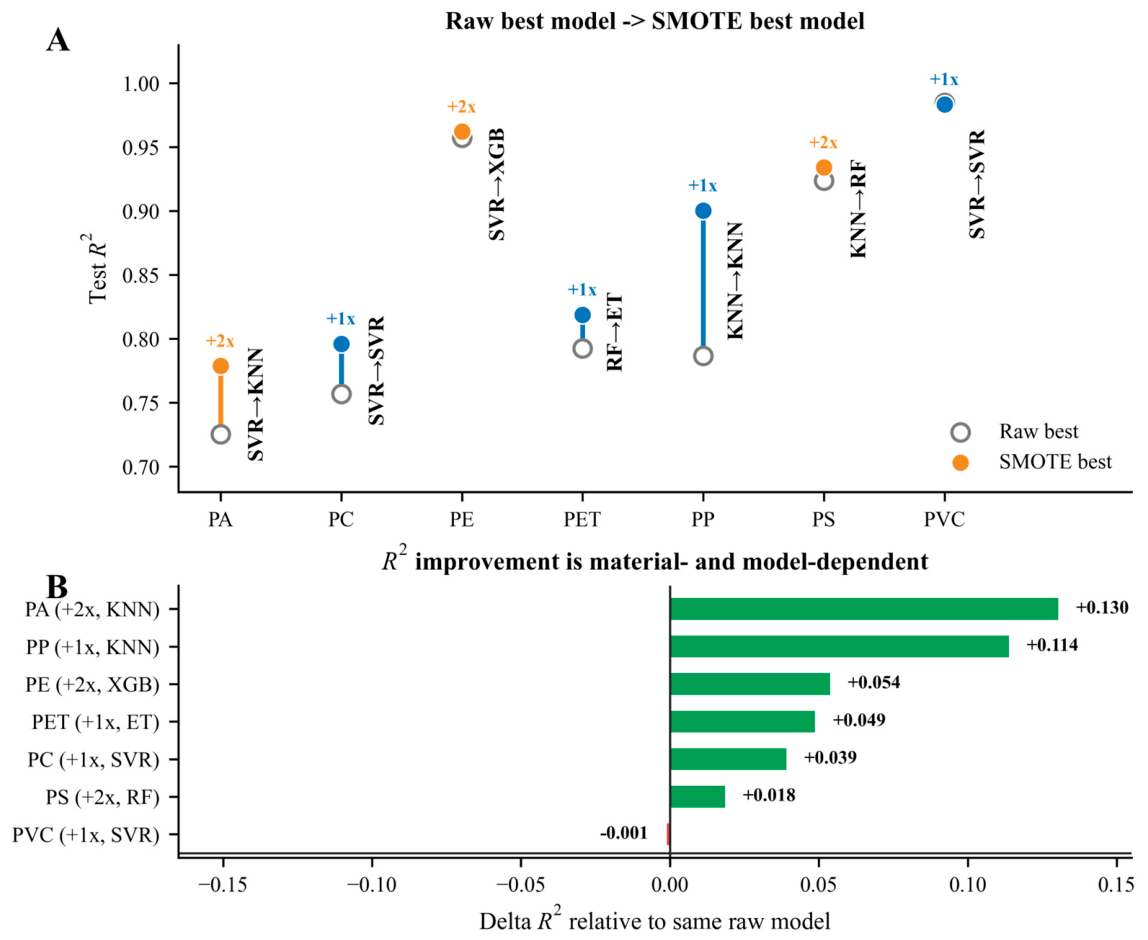
By comparing the optimal models for each material before and after SMOTE augmentation, it can be observed that training set expansion affects the selection of optimal algorithms for certain materials. As shown in
Figure 6, the optimal model for PA changes from SVR before augmentation to KNN after SMOTE augmentation; PE changes from SVR to XGB; PET changes from RF to ET; and PS changes from KNN to RF. In contrast, the optimal models for PC and PVC remain SVR, while PP remains KNN. These results indicate that training set augmentation not only increases the number of samples but also alters the local distribution structure of samples in the spectral feature space, thereby affecting the adaptability of different algorithms to the data distribution. For models such as KNN, RF, ET, and XGB, which can be sensitive to sample distribution or local neighborhood structure, the expanded training set may provide broader local coverage of spectral variations across different concentration gradients and consequently contribute to improved prediction performance.
Further comparison of the test set R2 values between SMOTE-augmented models and their corresponding baseline models shows that PA exhibits the largest improvement, with ΔR2 = 0.130, followed by PP with ΔR2 = 0.114. The improvements for PE, PET, PC, and PS are 0.054, 0.049, 0.039, and 0.018, respectively. These results indicate that, for certain materials, employing SMOTE to interpolate between existing training samples may help improve the coverage and distribution representation of the training data in the spectral feature space. Since SMOTE was applied only to the training set while the test set remained un-augmented, the increase in R2 for the augmented models suggests that this method can enhance the predictive performance for test samples. In particular, PA and PP show relatively large improvements in R2 after augmentation, suggesting that their quantitative prediction models may be more sensitive to the distribution and local coverage of the available training samples in the spectral feature space. However, augmentation does not always lead to performance improvement. For PA, the SVR model shows lower performance after both +1x and +2x augmentation compared with the original SVR model. For PC, SVR performance improves at +1x but decreases at +2x. For PET, RF shows improvement at +1x but a decline at +2x. For PVC, the original model already achieves a very high R2, and further augmentation provides limited benefit.
Overall, SMOTE augmentation can improve the test set predictive performance of quantitative prediction models for some materials; however, its effect is not universally consistent and is influenced by the spectral characteristics of the materials, the distribution of the original training samples, and the characteristics of the modeling algorithms. For materials with limited sample size and relatively continuous spectral responses with respect to concentration changes, SMOTE can enhance the representativeness of the training set and improve model generalization. In contrast, for materials where the original models already achieve strong predictive performance or exhibit complex local feature distributions, the benefits of SMOTE augmentation may be limited. Therefore, in near-infrared spectral quantitative modeling, training set augmentation should be evaluated in combination with specific materials and model types rather than being treated as a universal preprocessing strategy.
4. Discussion
This study demonstrates that portable near-infrared (NIR) spectroscopy combined with machine learning enables rapid identification and quantification of microplastics in chicken feed. Despite strong interference from feed components (proteins, lipids, starch, and moisture), microplastics induce subtle but detectable spectral variations across multiple wavelengths. The discriminative information is not concentrated in single characteristic peaks but distributed over a broad spectral region (1100–2200 nm), owing to overlapping absorptions of organic feed constituents and polymer functional groups. Therefore, traditional peak-based interpretation is insufficient, and chemometric or machine learning approaches are required to extract useful information from high-dimensional spectral data.
Compared with previous studies on near-infrared microplastic detection, the present work provides key scientific and methodological advances in matrix complexity, polymer coverage, and modeling strategy. Earlier investigations typically examined only 2–3 polymers in ruminant feed [
13] or chicken feed [
16,
17] using conventional PLS/PLSR modeling, although recent studies have further extended NIR-based microplastic detection to quantitative analysis in feed matrices and animal-derived foods [
36,
37]. In contrast, this study establishes the first comprehensive multi-polymer benchmark simultaneously covering seven common polymers (PA, PC, PE, PET, PP, PS, and PVC) across seven classifiers and seven regressors under an identical experimental pipeline. Consistent with Wu et al. [
32] and Vidal and Pasquini [
31], we confirm that discriminative information is distributed across multiple near-infrared bands rather than concentrated in isolated peaks, explaining why nonlinear ensemble models (ET) outperformed linear PLS-DA. Moreover, we elucidate polymer-dependent physical and chemical mechanisms: while scattering-correction methods (SNV/MSC) markedly improve PP quantification (in agreement with Saha et al. [
34] on soil microplastics), raw spectra are sufficient for PVC, PE, and PS. Methodologically, we also clarify the boundaries of SMOTE-based feature augmentation in continuous spectral regression, demonstrating substantial gains for weak-signal polymers (PA and PP). A concise comparison of representative NIR-based feed/soil microplastic studies is summarized in
Table 4 to highlight the incremental contribution of this work.
Among the evaluated classification models, ET achieved the highest test set performance and remained competitive across preprocessing conditions. This result is consistent with the ability of randomized tree ensembles to model high-dimensional nonlinear predictors [
26] and with previous NIR microplastic studies showing that discriminative information is distributed across overlapping spectral regions [
31,
32]. In contrast, the lower performance of PLS-DA indicates that a linear decision structure captured the matrix-dependent class differences less effectively under the present experimental conditions; it should not be interpreted as evidence that all relationships between NIR spectra and microplastic categories are universally nonlinear.
Quantitative performance was also polymer-dependent. SVR produced the best raw-spectrum results for PA, PC, PE, and PVC, consistent with the use of kernel-based regression for high-dimensional, collinear spectral variables [
24]. Lower prediction accuracy for PA, PC, PET, and PP coincided with stronger spectral overlap and greater matrix or scattering interference, patterns also reported for microplastics in complex agricultural matrices [
31,
32,
33]. Preprocessing therefore had a material-dependent effect: scattering corrections such as SNV and MSC were beneficial for PP, whereas the already strong results for PVC, PE, and PS changed little. These findings support retaining raw spectra when they perform comparably to preprocessed spectra, while selecting preprocessing separately for polymers whose concentration-related signals are more affected by scattering or baseline variation.
SMOTE-based augmentation improved model performance for several polymer-specific quantitative tasks, with larger gains observed for PA and PP than for polymers whose original models already performed well. This pattern suggests that, for some polymers, the available training samples may have provided limited coverage of concentration-related variation in the spectral feature space. Limited and insufficiently diverse calibration datasets are a recognized constraint in optical spectroscopy, and data augmentation can partly improve model generalization by expanding the range of training samples [
38]. By generating synthetic observations along the line segments between neighboring samples, SMOTE increases the local coverage and continuity of the feature space rather than simply duplicating existing observations [
30,
38]. However, the magnitude and direction of the performance changes varied among polymers and modeling algorithms. Studies using GAN-generated Vis–NIR and NIR spectra have similarly shown that the benefits of augmentation depend on the predicted property, model type, and number and quality of synthetic samples; adding more synthetic spectra beyond an optimal range does not necessarily produce further improvement and may even reduce predictive performance [
39,
40]. This may explain why augmentation produced relatively large improvements for PA and PP but only limited benefits for PVC, whose original model already achieved high prediction accuracy. Thus, augmentation can partly compensate for sparse sampling but cannot resolve intrinsic spectral overlap, matrix interference, or sample heterogeneity. Moreover, because the synthetic samples were derived from existing spectra rather than obtained through independent measurements, the observed gains should be interpreted as improved model generalization within the present data domain, rather than evidence of increased analytical sensitivity or robustness across different feed matrices.
The spectral profiles observed in this study reflect the complex chemical composition of both the feed matrix and the polymer additives. In the 1100–1350 nm region, the elevated absorption in microplastic-doped samples is primarily associated with higher-order overtones of aliphatic and aromatic C–H bonds (such as the characteristic PE-related band around 1210 nm [
32]), alongside particle scattering effects. The 1350–1500 nm range reflects combined O–H and N–H absorptions from feed moisture, protein background, and amide bonds in PA [
31]. The distinct band in the 1600–1800 nm region corresponds to the first overtone of C–H stretching, where PS-specific features around 1650–1720 nm facilitate its separation from the matrix background [
33]. Furthermore, combination bands of water, ester linkages, and C=O/C–O/N–H groups dominate the 1850–2200 nm region [
34,
35].
These multi-band variations confirm that discriminative and quantitative information is broadly distributed across the near-infrared spectrum rather than confined to isolated peaks, which aligns with previous vis-NIR studies on soil microplastics [
31]. These spectral characteristics also help explain the substantial differences in quantitative prediction performance among polymers. Quantitative accuracy depends not only on the presence of polymer-related spectral features, but also on their intensity, specificity, overlap with feed-matrix absorptions, and sensitivity to scattering effects. PVC, PE, and PS showed relatively high prediction accuracy, suggesting that their concentration-related spectral variations were sufficiently distinct and stable to be captured directly from raw spectra. In contrast, the weaker performance of PA, PC, PET, and PP likely reflects weaker or less specific spectral responses, stronger overlap with feed components, and greater scattering or baseline effects. The marked improvement of PP after SNV preprocessing further supports the important role of scattering-related variability. Thus, the differences among polymers result from the combined effects of polymer-specific spectral characteristics, matrix interference, particle scattering, and the degree to which spectral changes vary consistently with concentration.
Several limitations should be considered when interpreting the present findings. Although pure feed samples were collected as non-doped matrix references, they were not incorporated into model development or formal zero-concentration validation. Model performance was not evaluated using concentration-stratified validation or a dedicated series of blank and near-zero-concentration samples. Therefore, 0.01% represents only the lowest concentration tested rather than a formally validated limit of detection or quantification. Second, the experiments used a single feed formulation (CP 522) and a single-polymer sample system. Although this design facilitated control of experimental variables, it substantially limits external validity. Differences in feed composition may alter matrix physicochemical properties, affecting sample homogeneity, pellet preparation, and spectral responses; therefore, the current quantitative relationships cannot be directly extrapolated to other feed formulations. In addition, actual microplastic contamination commonly involves multiple polymers, whereas the single-polymer system does not capture spectral overlap and interactions among different polymers, which may reduce model performance under realistic conditions. The robustness of the models to variations in particle size, sample batches, and feed brands also remains to be established. Lightweight machine-learning algorithms were adopted in this study, while deep-learning approaches could be explored when larger datasets become available. Although SMOTE increased the diversity of the training data, the number of independently measured samples remained limited. Overall, portable NIR spectroscopy combined with machine learning shows considerable potential for screening microplastics in chicken feed; qualitative identification was relatively robust, whereas quantitative accuracy was strongly influenced by polymer-specific spectral responses, matrix interference, scattering effects, and training-set distribution. Future studies should expand independent sampling, include blanks, near-zero-concentration samples, mixed polymers, multiple particle sizes, and diverse feed formulations and batches, and conduct external validation to establish polymer-specific detection capabilities and improve practical reliability.
5. Conclusions
This study established a near-infrared spectroscopy combined with machine learning approach for detecting microplastic-spiked chicken feed samples, enabling both qualitative identification and quantitative prediction of seven types of microplastics, namely PA, PC, PE, PET, PP, PS, and PVC. Spectral analysis results indicated that microplastic-related information is mainly manifested as weak multi-band variations superimposed on a complex feed matrix background, making it difficult to achieve identification based on a single characteristic peak. The qualitative modeling results showed that the ET model achieved the best classification performance, with a test set Accuracy of 0.9603, demonstrating that near-infrared spectroscopy combined with nonlinear ensemble learning models can effectively distinguish different types of microplastic-doped samples. In quantitative prediction, model performance varied across materials, where PVC, PE, and PS exhibited relatively high prediction accuracy, among which PVC achieved a test set R2 of 0.9846 and an RPD of 8.1642, while PA, PC, PET, and PP were more susceptible to feed matrix absorption, particle scattering, and variations in sample physical state. Spectral preprocessing and SMOTE-based training set augmentation can improve the quantitative prediction performance for certain materials to some extent; however, their effectiveness is closely related to the spectral characteristics of the materials, sample distribution, and modeling algorithms. Therefore, near-infrared detection of microplastics in chicken feed should be optimized by selecting appropriate preprocessing methods, modeling algorithms, and data augmentation strategies according to the target material. Overall, portable near-infrared spectroscopy combined with machine learning provides a feasible proof-of-concept approach for the rapid and nondestructive screening of microplastic contamination in feed under controlled laboratory conditions, and offers methodological insights for the development of related detection methods.