Article

Pen-Scale Heat-Risk Mapping in an Open-Sided Beef Cattle Barn Using Long-Range Wireless Multi-Point Monitoring

1
College of Animal Science and Technology, China Agricultural University, Beijing 100193, China
2
State Key Laboratory of Animal Nutrition and Feeding, Beijing 100193, China
*
Author to whom correspondence should be addressed.
Agriculture 2026, 16(14), 1505; https://doi.org/10.3390/agriculture16141505
Submission received: 1 June 2026 / Revised: 2 July 2026 / Accepted: 9 July 2026 / Published: 10 July 2026

Abstract

Barn-level monitoring may mask local heat-risk exposure in open-sided beef cattle barns. This study evaluated a long-range wireless multi-point monitoring framework for pen-scale heat-risk mapping in a commercial open-sided double-row barn during the hot season. Environmental data were continuously collected from representative front, middle, and rear pens, and the temperature–humidity index (THI) was matched with respiration rate, per-head daily water intake, and descriptive body-weight records. The data completeness of the main analytical nodes was 99.75–99.88%. Mixed-effects models showed that the middle and rear pens had higher daily and daytime THI intensity than the front pen (p < 0.001), whereas the daytime duration of THI ≥ 78 was similar among pens. The rear–front THI difference was amplified during 10:00–16:00 (β = 1.19, p = 0.006). Respiration rate increased by 1.25 breaths min−1 for each one-unit increase in THI (95% CI: 0.92–1.57, p < 0.001). Per-head daily water intake was more strongly associated with daily mean THI than with daily maximum THI. These findings indicate that pen-scale monitoring can identify local thermal heterogeneity and provide a data basis for targeted environmental assessment in open-sided beef cattle barns.

1. Introduction

Heat stress is a major environmental challenge in beef cattle production during the hot season. High temperature and humidity increase the thermal load experienced by cattle and can induce physiological, behavioral, and productive responses, including increased respiration rate, greater water demand, reduced feed intake, and impaired growth performance [1,2,3,4,5]. Therefore, accurate environmental monitoring is not only necessary for describing barn conditions, but also provides an essential basis for heat-stress assessment, animal-welfare management, and precision environmental management [6,7].
Under commercial production conditions, the thermal environment inside open-sided beef cattle barns is often spatially heterogeneous. Barn orientation, solar radiation, shading conditions, ventilation pathways, fan-assisted airflow, pen layout, and animal distribution may cause cattle in different pens within the same barn to experience different levels of thermal exposure [8,9,10]. Such differences may become more pronounced during daytime high-heat periods, when local solar radiation input and airflow patterns jointly affect heat accumulation and dissipation. Consequently, environmental assessment based only on barn-level averages or limited monitoring points may not fully represent the actual thermal exposure experienced by cattle in different pens and may mask local high-heat-risk areas [11].
Internet of Things and wireless sensor network technologies have become important tools for environmental monitoring in livestock housing [12,13]. Communication technologies such as wireless fidelity (Wi-Fi), Bluetooth, ZigBee, and long range (LoRa) have enabled continuous acquisition of environmental variables, including air temperature, relative humidity, wind speed, illuminance, carbon dioxide (CO2), and ammonia (NH3) [9,14,15]. Among these technologies, LoRa is suitable for long-distance, low-power, and multi-node deployment in commercial farms, where monitoring points are often spatially distributed [8,16,17]. However, many existing studies have focused mainly on monitoring-system construction, communication performance, or general barn-level environmental variation [15,17,18,19,20]. Less attention has been paid to how continuous multi-point monitoring data can be converted into pen-scale heat-risk information, and field evidence linking local thermal heterogeneity with cattle responses remains limited.
The effects of environmental heat load on cattle are not reflected only in environmental variables, but also in animal responses across different timescales. Respiration rate can respond rapidly to short-term changes in thermal load and is commonly used as a physiological indicator of heat stress [21,22]. Water intake can reflect drinking demand and is often associated with cumulative daily heat exposure and herd-level management conditions [11]. Body-weight change is influenced by multiple factors, including feed intake, individual variation, health status, and routine management, but it can still provide descriptive information on group-level growth trends during the monitoring period [5,23]. Integrating pen-scale environmental data with these animal-response indicators may help evaluate whether local thermal differences have practical biological and management relevance.
Despite these advances, three gaps remain in the application of environmental monitoring to open-sided beef cattle barns. First, continuous field evidence on pen-scale thermal heterogeneity under commercial production conditions is still limited. Second, most barn-monitoring studies rely primarily on environmental records alone, with insufficient linkage between local microclimatic variation and cattle responses. Third, a practical workflow for transforming multi-point monitoring data into pen-scale heat-risk information for localized environmental management remains insufficiently developed.
Existing heat-stress monitoring studies in cattle barns have often relied on barn-level or limited-point environmental measurements, which may overlook local thermal heterogeneity within open-sided housing systems. Therefore, cattle housed in different pens within the same barn may be exposed to different heat-risk intensities even under the same general management conditions. The contribution of the present study is not limited to wireless data acquisition, but lies in developing and evaluating a pen-scale heat-risk mapping framework that integrates long-range wireless multi-point environmental monitoring, pen-scale temperature–humidity index (THI) characterization, and matching with cattle-response indicators. Specifically, this study aimed to: (1) evaluate the feasibility and data completeness of the monitoring framework under commercial barn conditions; (2) quantify daily and diurnal thermal heterogeneity among representative front, middle, and rear pens; and (3) explore the associations between pen-level thermal exposure and respiration rate, per-head daily water intake, and descriptive body-weight changes.

2. Materials and Methods

The study was approved by the Animal Care and Use Committee of China Agricultural University (approval number: AW12506202-1-05) and was conducted at the beef cattle farm of Xinhaoxiang Food Co., Ltd., Lixin County, Bozhou City, Anhui Province, China, from 16 August to 16 September 2025. The experiment was carried out under routine commercial farm management conditions. Animal-related measurements included non-invasive respiration-rate observations, water-meter records, and routine body-weight measurements, without invasive procedures or additional experimental treatments.
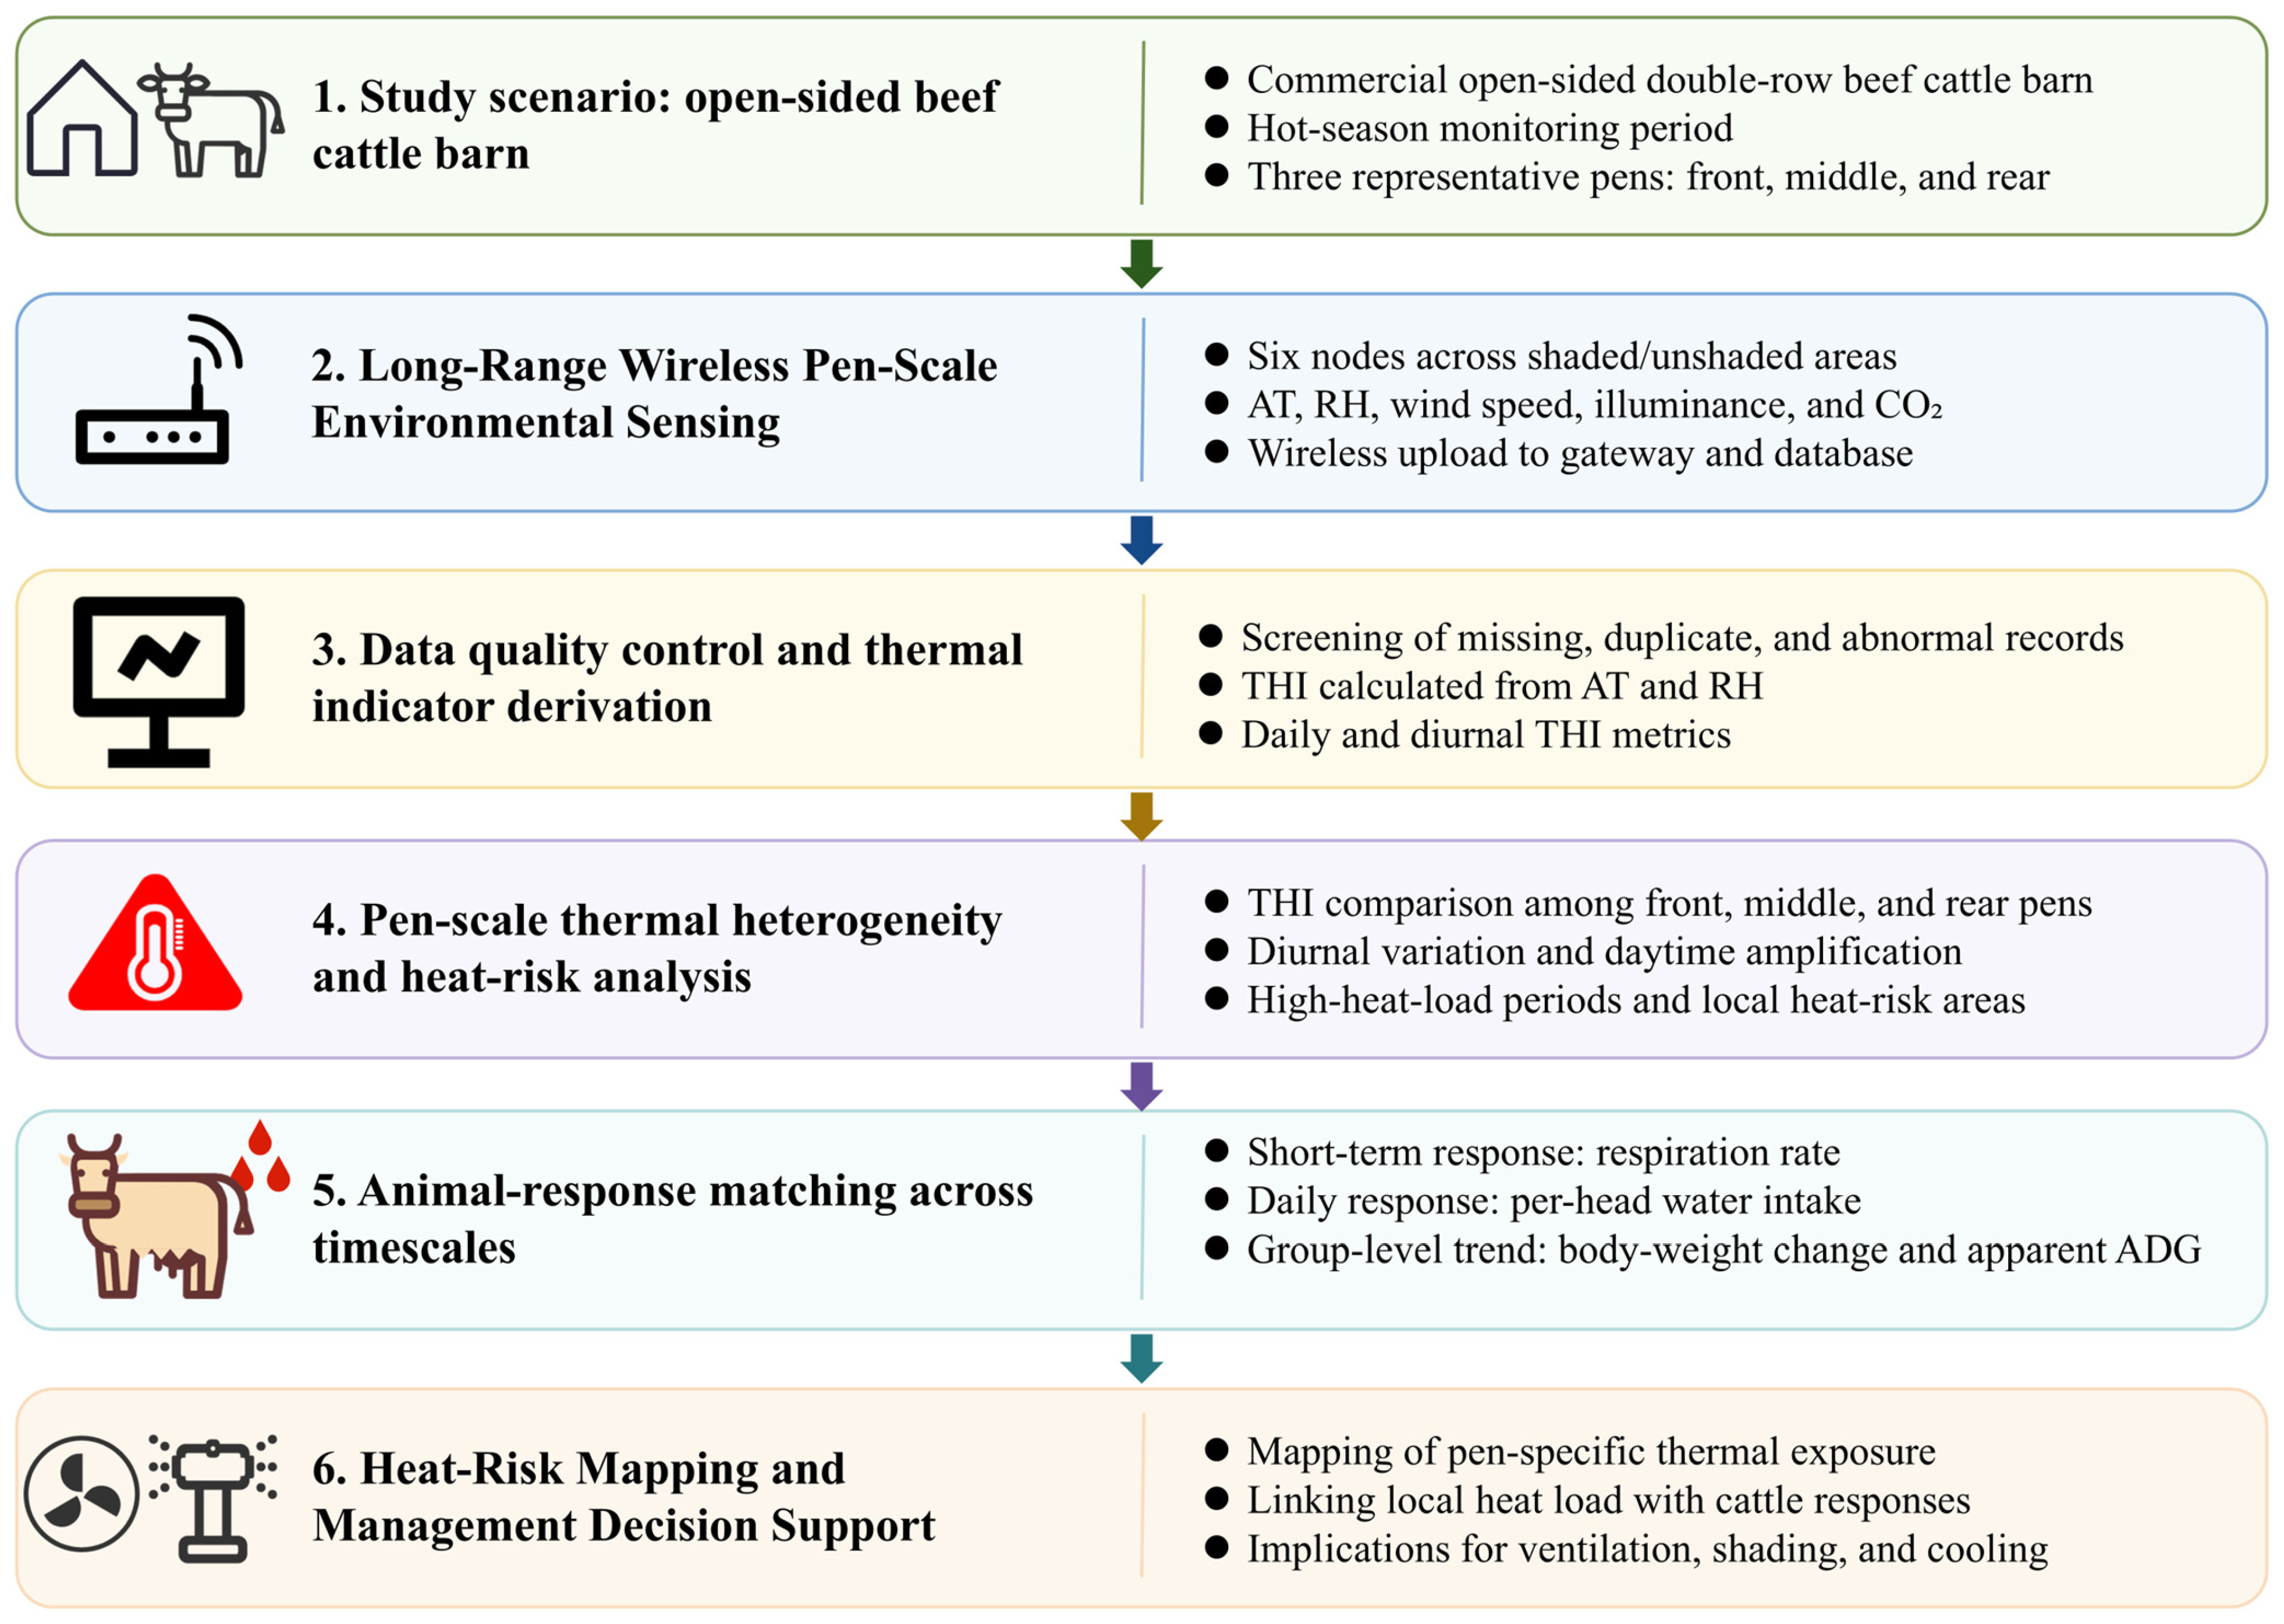
The overall workflow of the LoRa-based pen-scale heat-risk mapping framework is shown in Figure 1. Environmental data were collected from multiple monitoring nodes deployed in representative pens. After quality control and THI derivation, pen-scale thermal heterogeneity was analyzed and matched with cattle-response indicators, including respiration rate, per-head daily water intake, and body-weight change.

2.1. Experimental Site, Barn Structure, and Node Deployment

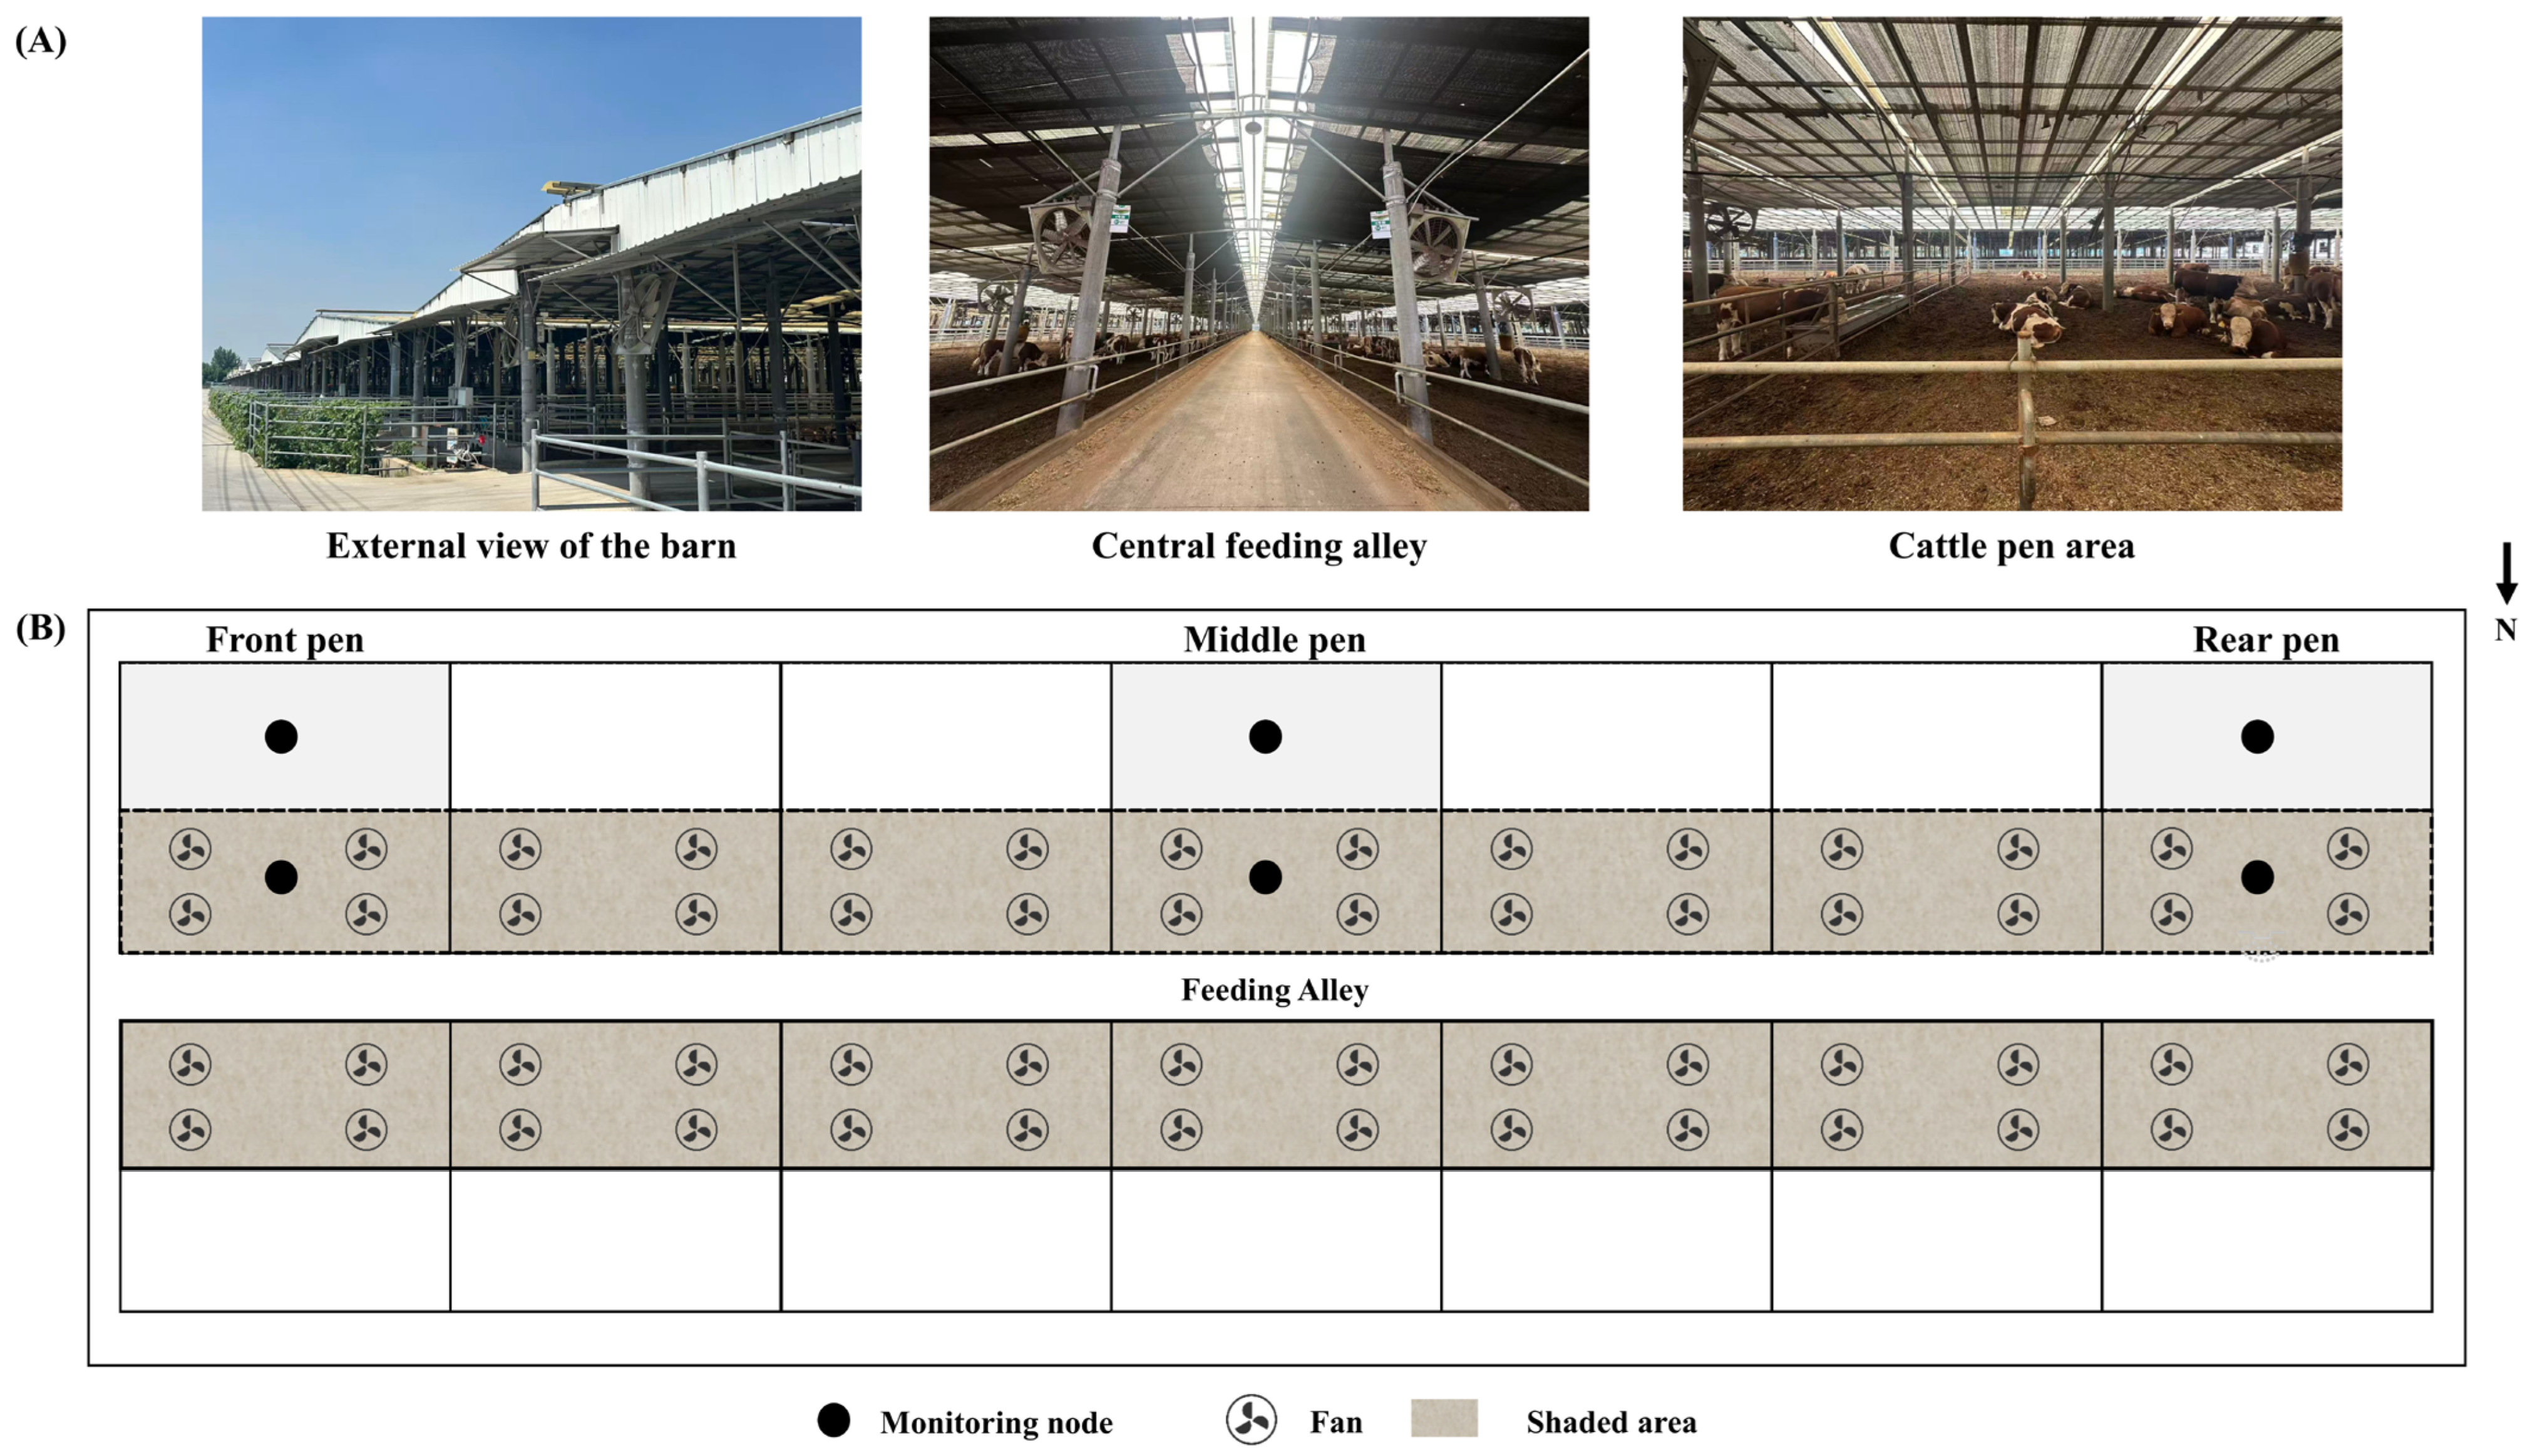
The experimental barn was an open-sided double-row beef cattle barn with a single central feeding alley and cattle pens arranged on both sides. Each side of the barn contained seven pens. The barn was 176 m long and 44.5 m wide, with an eave height of 4.5 m. The roof had a double-slope semi-monitor structure and was covered with daylighting panels. Shade cloth was installed beneath part of the roof daylighting panels on both sides of the barn, covering the side-wall half of each pen rather than the entire pen area. For each 24 m × 18 m pen, the shaded area was approximately 24 m × 9 m. The barn was naturally ventilated through the open sidewalls and was equipped with auxiliary cooling facilities, including fans and misting devices, for summer environmental control. The fans were arranged longitudinally, and the general auxiliary airflow direction was from the front toward the rear of the barn.
The experimental animals were Simmental finishing cattle. Three representative pens located at the front, middle, and rear positions on one side of the barn were selected and referred to as the front, middle, and rear pens, respectively. Each selected pen housed 28 cattle during the monitoring period.
The three pens were selected to represent different longitudinal positions within the same barn, along the general auxiliary airflow direction from the front toward the rear. Because all the selected pens were located on the same side of the barn, this design reduced variation caused by side-specific management and shading arrangements and allowed the study to focus on front–middle–rear thermal patterns under the same building structure and management conditions.
Within each selected pen, one monitoring node was deployed in the shaded area and one in the unshaded area, resulting in six monitoring nodes in total (Figure 2). All nodes were installed at approximately 1.5 m above the ground. Based on on-site observations, cattle mainly remained in the shaded area close to the feeding zone under high-temperature conditions. Therefore, data from the shaded-area node in each pen were used as the main analytical environmental data, whereas illuminance records were used as auxiliary information for interpreting local light exposure among pens.

2.2. LoRa-Based Multi-Point Monitoring System

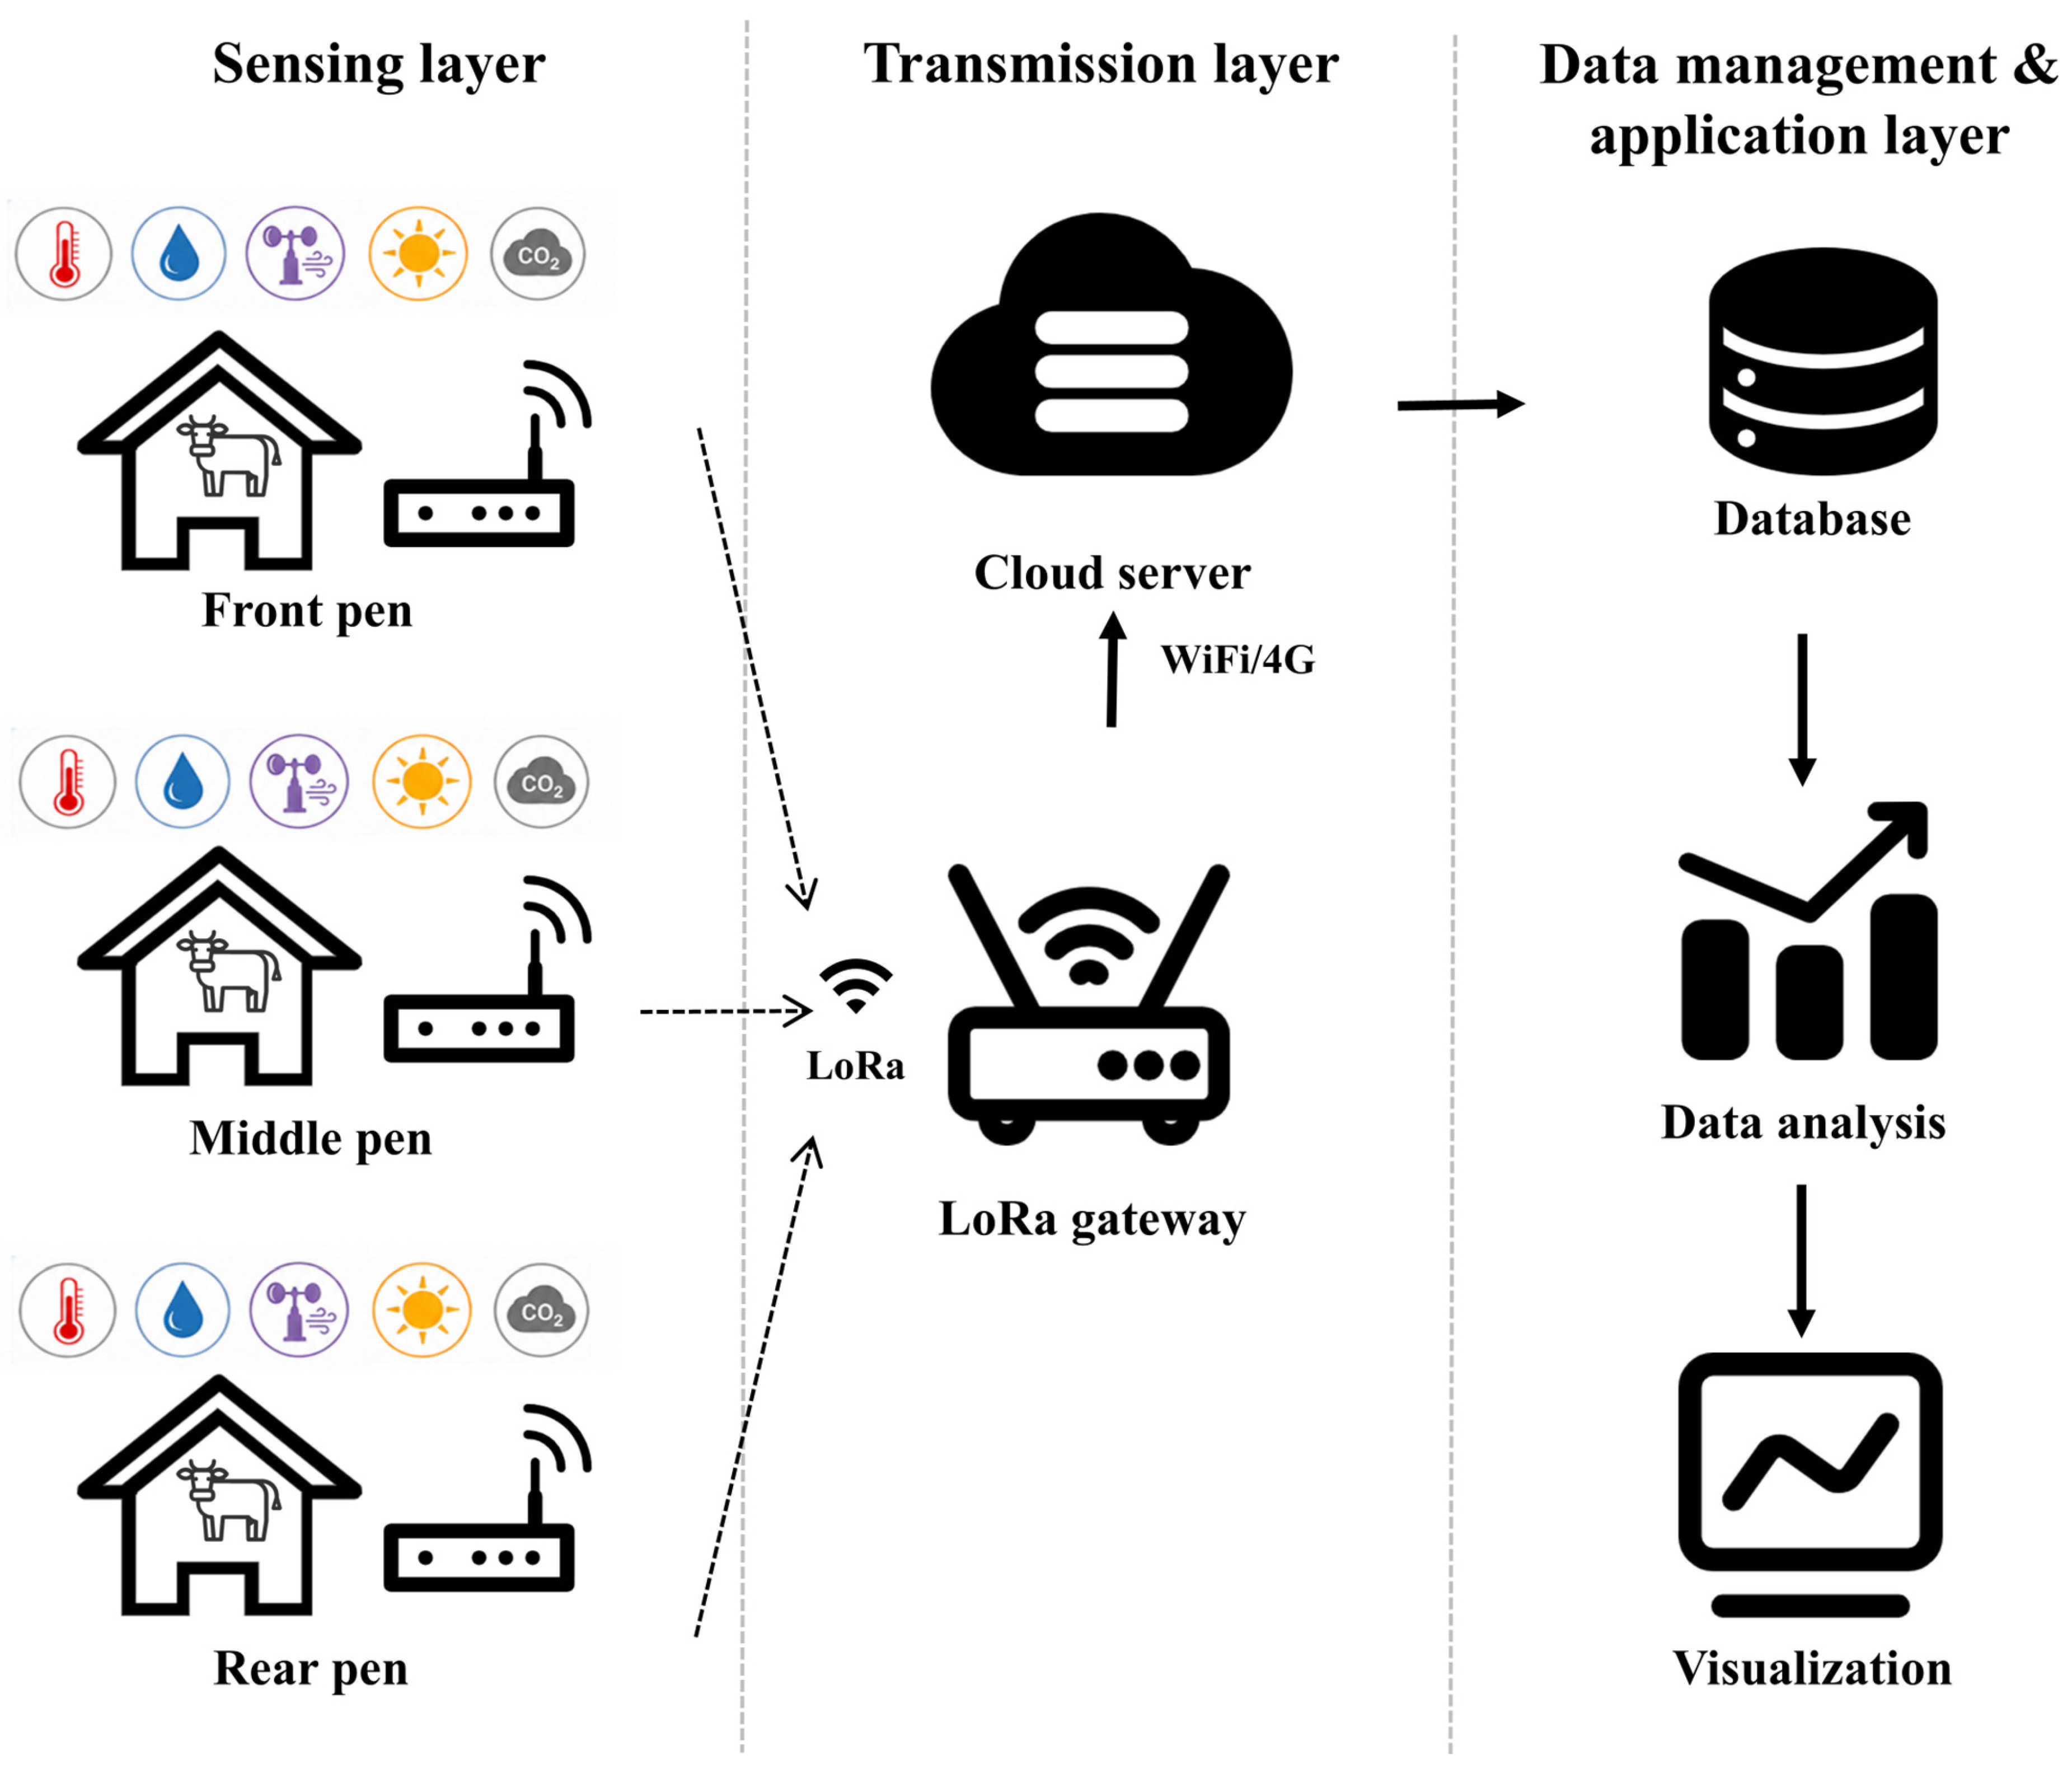
A LoRa-based wireless multi-point monitoring system was developed for continuous environmental data acquisition. The system consisted of a sensing layer, a transmission layer, and a data management and application layer (Figure 3) [17,24].
In the sensing layer, each monitoring node integrated a temperature and humidity sensor (SHT35), a cup anemometer, an illuminance sensor module (BH1750), a CO2 sensor (SCD41), an ESP32-based microcontroller board, and a long-range (LoRa) wireless communication module (E22-400TBL, 470 MHz; Chengdu Ebyte Electronic Technology Co., Ltd., Chengdu, China). The monitored variables included air temperature, relative humidity, wind speed, illuminance, and CO2 concentration. The manufacturers, measurement ranges, and accuracies of the main environmental sensors are summarized in Table 1.
Before field deployment, all monitoring nodes were operated under the same indoor conditions to check sensor communication, time synchronization, and the consistency of readings among the nodes. During data preprocessing, records with missing timestamps, communication errors, or physically implausible values were excluded, and data completeness was calculated for each monitoring node. The measurement ranges and accuracies of the main environmental sensors were reported to indicate the potential measurement uncertainty of the monitored variables. Because THI was calculated directly from air temperature and relative humidity, the accuracy of the SHT35 sensor was particularly relevant to the main heat-load indicator used in this study.
In the transmission layer, environmental data were transmitted from each monitoring node to the LoRa gateway and then uploaded to the cloud server through Wi-Fi or 4G communication [12,25].
In the data management and application layer, the uploaded data were stored in a MySQL database with timestamps and node identifiers. The sampling interval was set to 1 min. The system was mainly powered by mains electricity and was equipped with a 5600 mAh 18650 lithium battery as a backup power source [8,15,19].

2.3. Environmental and Animal Measurements

2.3.1. Environmental Measurements

The monitored environmental variables included air temperature, relative humidity, wind speed, illuminance, and CO2 concentration. Air temperature was recorded in °C, relative humidity in %, wind speed in m s−1, illuminance in lx, and CO2 concentration in ppm.
The temperature–humidity index (THI) was calculated from air temperature and relative humidity and was used as the main thermal exposure indicator:
T H I = 1.8 × T + 32 0.55 0.0055 × R H × 1.8 × T 26
where T is air temperature (°C), and RH is relative humidity (%) [21,26].
The main analyses were based on air temperature, relative humidity, and calculated THI from the shaded-area nodes. Illuminance was used as an auxiliary variable to describe differences in solar exposure among pens. Wind speed and CO2 concentration were collected as background environmental variables.

2.3.2. Respiration Rate

Respiration rate was measured manually by observing thoracoabdominal movements. Measurements were conducted daily at 08:00, 14:00, and 19:00. At each observation time, respiration rate was recorded for all cattle in each selected pen. For each animal, thoracoabdominal movements were counted for 30 s and multiplied by two to obtain respiration rate in breaths min−1 [22,27,28].
Two trained observers independently recorded respiration rate, and the average of their measurements was used to reduce observer-related variation. The pen-level mean respiration rate was calculated for each pen at each observation time. The corresponding THI was obtained from the shaded-area node in the same pen using the mean THI within ±5 min of the respiration-rate observation time.

2.3.3. Water Intake

Water intake data were obtained from water-meter records for each selected pen. Cumulative water-meter readings were exported and organized by calendar day. Daily pen-level water intake was calculated as the difference between readings at 00:00 on two consecutive days, representing the 24 h water intake from 00:00 to 24:00.
Per-head daily water intake was calculated by dividing daily pen-level water intake by the number of cattle in the corresponding pen. Daily mean THI and daily maximum THI were calculated using the same calendar-day window.

2.3.4. Body-Weight Measurement

Body weight was measured for the cattle in each selected pen at the beginning and end of the monitoring period using an electronic platform weighing system (Keli; Ningbo Keli Sensing Technology Co., Ltd., Ningbo, China). Initial mean body weight, final mean body weight, mean weight gain, and apparent average daily gain were calculated for each pen to describe pen-level growth trends during the monitoring period.

2.4. Data Processing and Statistical Analysis

All data processing and statistical analyses were performed in Python 3.11.5 using pandas 2.2.2, NumPy 1.26.4, SciPy 1.13.1, statsmodels 0.14.2, and matplotlib 3.9.2. Raw environmental data were checked for timestamp consistency, node identifiers, duplicate records, missing values, sensor-stagnation artifacts, and values outside reasonable ranges. Abnormal records that could be verified from backup logs were replaced using the original backup data, whereas unrecoverable abnormal records were excluded from subsequent analyses.
Environmental data were aggregated to pen-day and pen-period-day levels to reduce pseudo-replication from minute-level records. For each pen, daily mean THI, daily maximum THI, daytime mean THI, daytime maximum THI, hours with THI ≥ 78, and the daytime proportion of records with THI ≥ 78 were calculated. Daytime was defined as 10:00–16:00. Diurnal curves were used to describe average daily patterns, and rolling averages were applied only for visualization. Pairwise differences in THI metrics were calculated among pens. Linear mixed-effects models were used to compare THI-related metrics among pens, with pen as a fixed effect and date as a random intercept. A pen × period mixed model was further used to evaluate the daytime amplification of between-pen THI differences, with pen, period, and their interaction as fixed effects and date as a random intercept.
Respiration-rate data were analyzed at the pen-time level. According to previously reported beef cattle heat-stress classification criteria and respiration-rate response studies, THI = 78 was used as the threshold to classify observations into lower- and higher-heat-load conditions [22,27,28]. This threshold was selected because it has been commonly used to indicate the onset of marked heat-load responses in cattle under hot conditions. A mixed-effects model including THI, observation time, and pen as fixed effects and date as a random intercept was used to evaluate the association between thermal load and respiration rate. Water intake was analyzed at the pen-day level. Pearson and Spearman correlation analyses were used to evaluate the associations between per-head daily water intake and daily THI metrics, including daily mean THI and daily maximum THI. To provide effect-size estimates for water intake, exploratory ordinary least-squares models adjusted for pen were also fitted separately for daily mean THI and daily maximum THI.
Body-weight data were analyzed descriptively at the pen level because strict one-to-one individual matching between initial and final body-weight records was not available. No individual-level paired statistical test was performed for body-weight change. Statistical significance was set at p < 0.05.

3. Results

3.1. Data Completeness of the LoRa-Based Multi-Point Monitoring System

The LoRa-based multi-point monitoring system operated continuously in the beef cattle barn from 16 August to 16 September 2025, with a sampling interval of 1 min. According to the node deployment and data selection strategy described in the Materials and Methods, records from the shaded-area nodes in the front, middle, and rear pens were used as the primary environmental dataset for the pen-scale thermal analysis. Data acquisition and completeness after quality control are summarized in Table 2.
After quality control, all three shaded-area nodes maintained high data completeness (>99%). The retained minute-level dataset was therefore considered suitable for subsequent pen-day, diurnal, and pen-scale thermal heterogeneity analyses.

3.2. Pen-Scale Heat-Risk Metrics and Thermal Heterogeneity

Daily and daytime THI-related metrics were calculated at the pen-day level to quantify pen-scale thermal exposure in the selected pens (Table 3).
As shown in Table 3, the middle and rear pens generally had higher THI intensity metrics than the front pen, especially during the daytime period. In contrast, duration-based indicators of high-THI exposure showed smaller between-pen differences. These results indicate that pen-scale differences were reflected mainly in thermal intensity rather than in the daytime duration of high-heat exposure.
Linear mixed-effects models with date as a random intercept further confirmed the presence of pen-scale thermal differences. Compared with the front pen, daily mean THI was higher in the middle pen (β = 0.793, 95% CI: 0.534–1.053, p < 0.001) and rear pen (β = 0.517, 95% CI: 0.258–0.777, p < 0.001). Daily maximum THI was also higher in the middle pen (β = 1.492, 95% CI: 0.987–1.997, p < 0.001) and rear pen (β = 1.961, 95% CI: 1.456–2.466, p < 0.001). Similar patterns were observed during the daytime period, with higher daytime mean THI in the middle pen (β = 0.943, 95% CI: 0.543–1.342, p < 0.001) and rear pen (β = 1.413, 95% CI: 1.013–1.812, p < 0.001), as well as higher daytime maximum THI in the middle pen (β = 1.511, 95% CI: 1.084–1.938, p < 0.001) and rear pen (β = 1.864, 95% CI: 1.437–2.291, p < 0.001). For duration-based heat exposure, the middle pen showed a longer 24 h exposure time above THI = 78 than the front pen, whereas daytime hours and daytime proportion with THI ≥ 78 did not differ significantly among pens. The pen × period model further showed that the rear–front THI difference was amplified during 10:00–16:00 (β = 1.194, 95% CI: 0.350–2.038, p = 0.006), whereas this daytime amplification was not significant for the middle–front comparison. Detailed mixed-effects model results for pen-scale THI metrics and daytime amplification analysis are provided in Supplementary Tables S2 and S3, respectively.
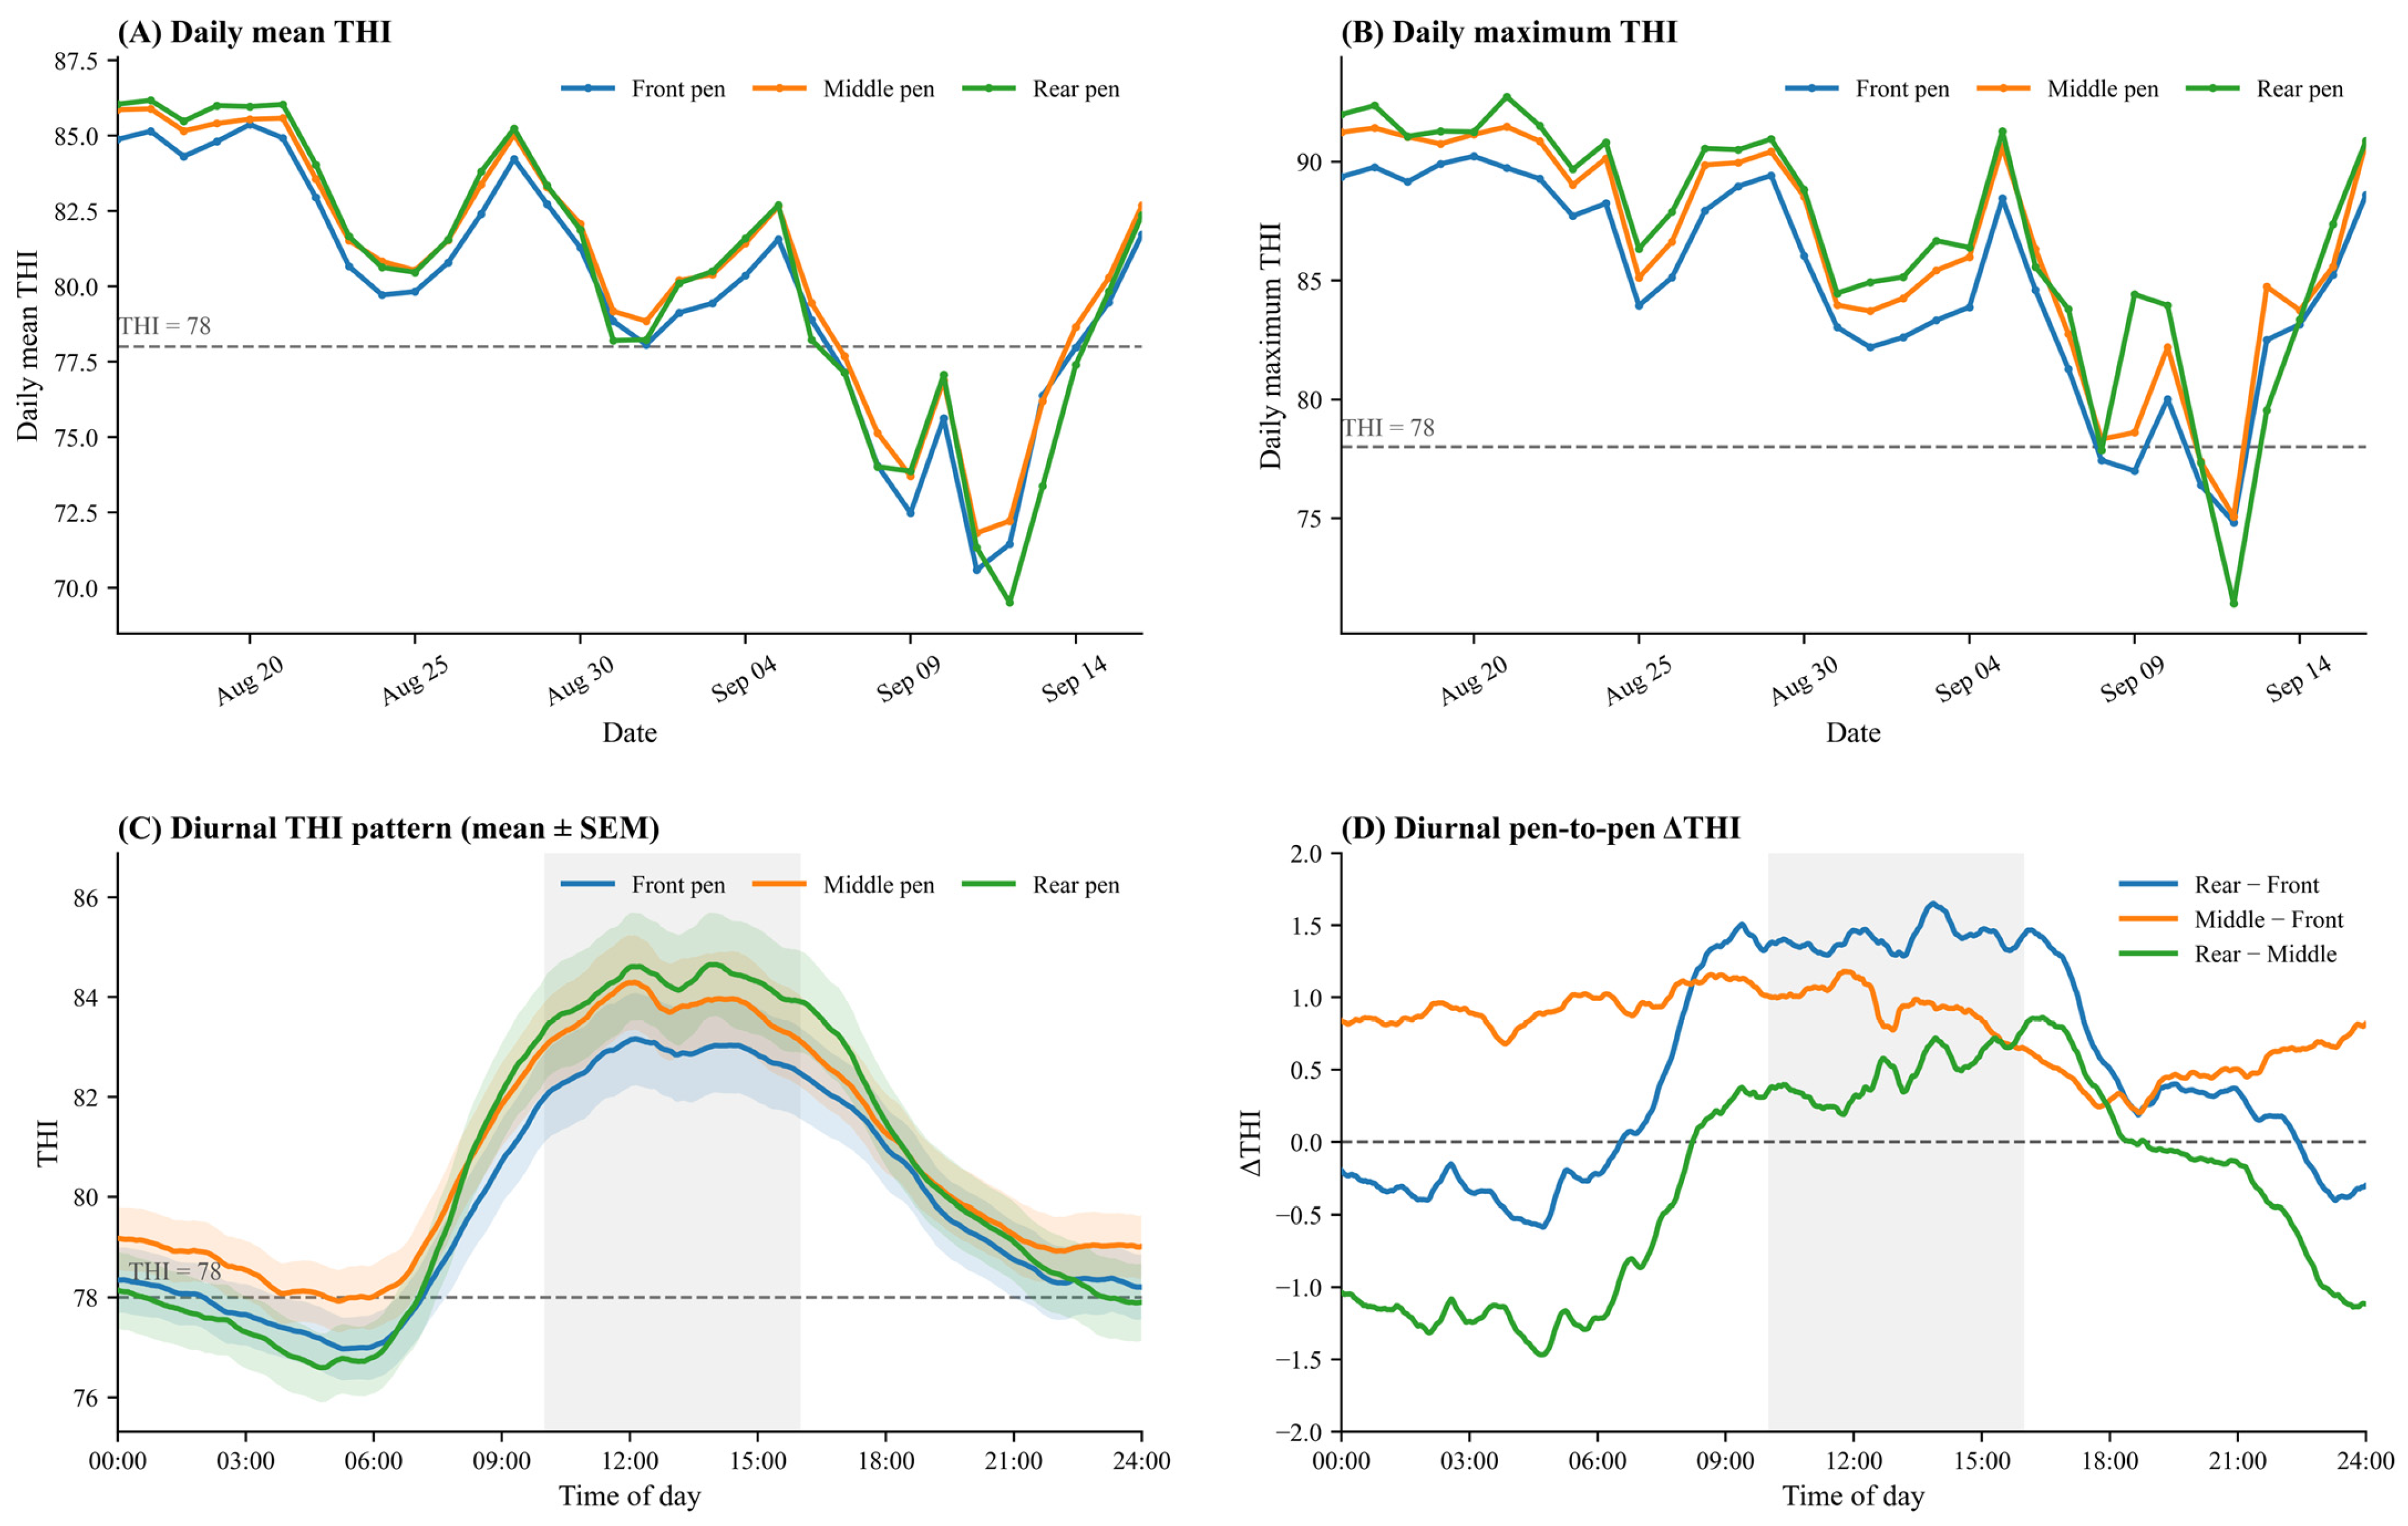
The temporal dynamics of THI showed that pen-scale thermal differences varied across the experimental period and over the day (Figure 4). Daily mean THI remained relatively high in mid-to-late August, decreased from late August to early September, and then increased again toward the end of the monitoring period. Daily maximum THI followed a similar pattern, with higher values during the early stage of the experiment and lower values during the cooling period in early September (Figure 4A,B). Although the three pens followed broadly similar day-to-day trends, the middle and rear pens generally maintained higher THI values than the front pen during high-heat-load days.
Diurnal THI patterns showed a clear increase from morning to afternoon, followed by a gradual decrease in the evening (Figure 4C). During the daytime high-heat period from 10:00 to 16:00, THI values in the middle and rear pens were generally higher than those in the front pen. The between-pen differences were more clearly shown by the ΔTHI curves (Figure 4D). The rear–front difference increased during the daytime period and reached higher positive values from midday to afternoon, whereas differences among pens were smaller during nighttime and early morning hours. These results indicate that pen-scale thermal heterogeneity was not constant throughout the day but was more pronounced during the daytime high-heat period.
Pairwise difference analysis showed that the daytime mean THI difference between the rear and front pens averaged 1.41 THI units, while the middle–front difference averaged 0.94 THI units (Supplementary Table S1). Daytime amplification analysis further showed that the rear–front THI difference increased from 0.22 THI units during other periods to 1.41 THI units during 10:00–16:00, corresponding to a daytime amplification of 1.19 THI units. The pen × period mixed model showed a significant rear × daytime interaction (β = 1.19, p = 0.006), whereas the middle × daytime interaction was not significant (β = 0.20, p = 0.643; Supplementary Table S3). These results suggest that the rear pen was more susceptible to daytime amplification of local thermal exposure than the front pen.
Supplementary illuminance monitoring provided additional environmental context for the daytime THI differences. During 10:00–16:00, illuminance exposure in the rear and middle pens was generally higher than that in the front pen (Figure S1), which was consistent with the higher daytime THI observed in these pens. Overall, the continuous multi-point monitoring data demonstrated that thermal heterogeneity within the open-sided barn was both spatially and temporally dynamic, with the most evident pen-scale differences occurring during daytime high-heat periods.

3.3. Animal Responses to Pen-Scale Thermal Exposure

3.3.1. Respiration-Rate Responses

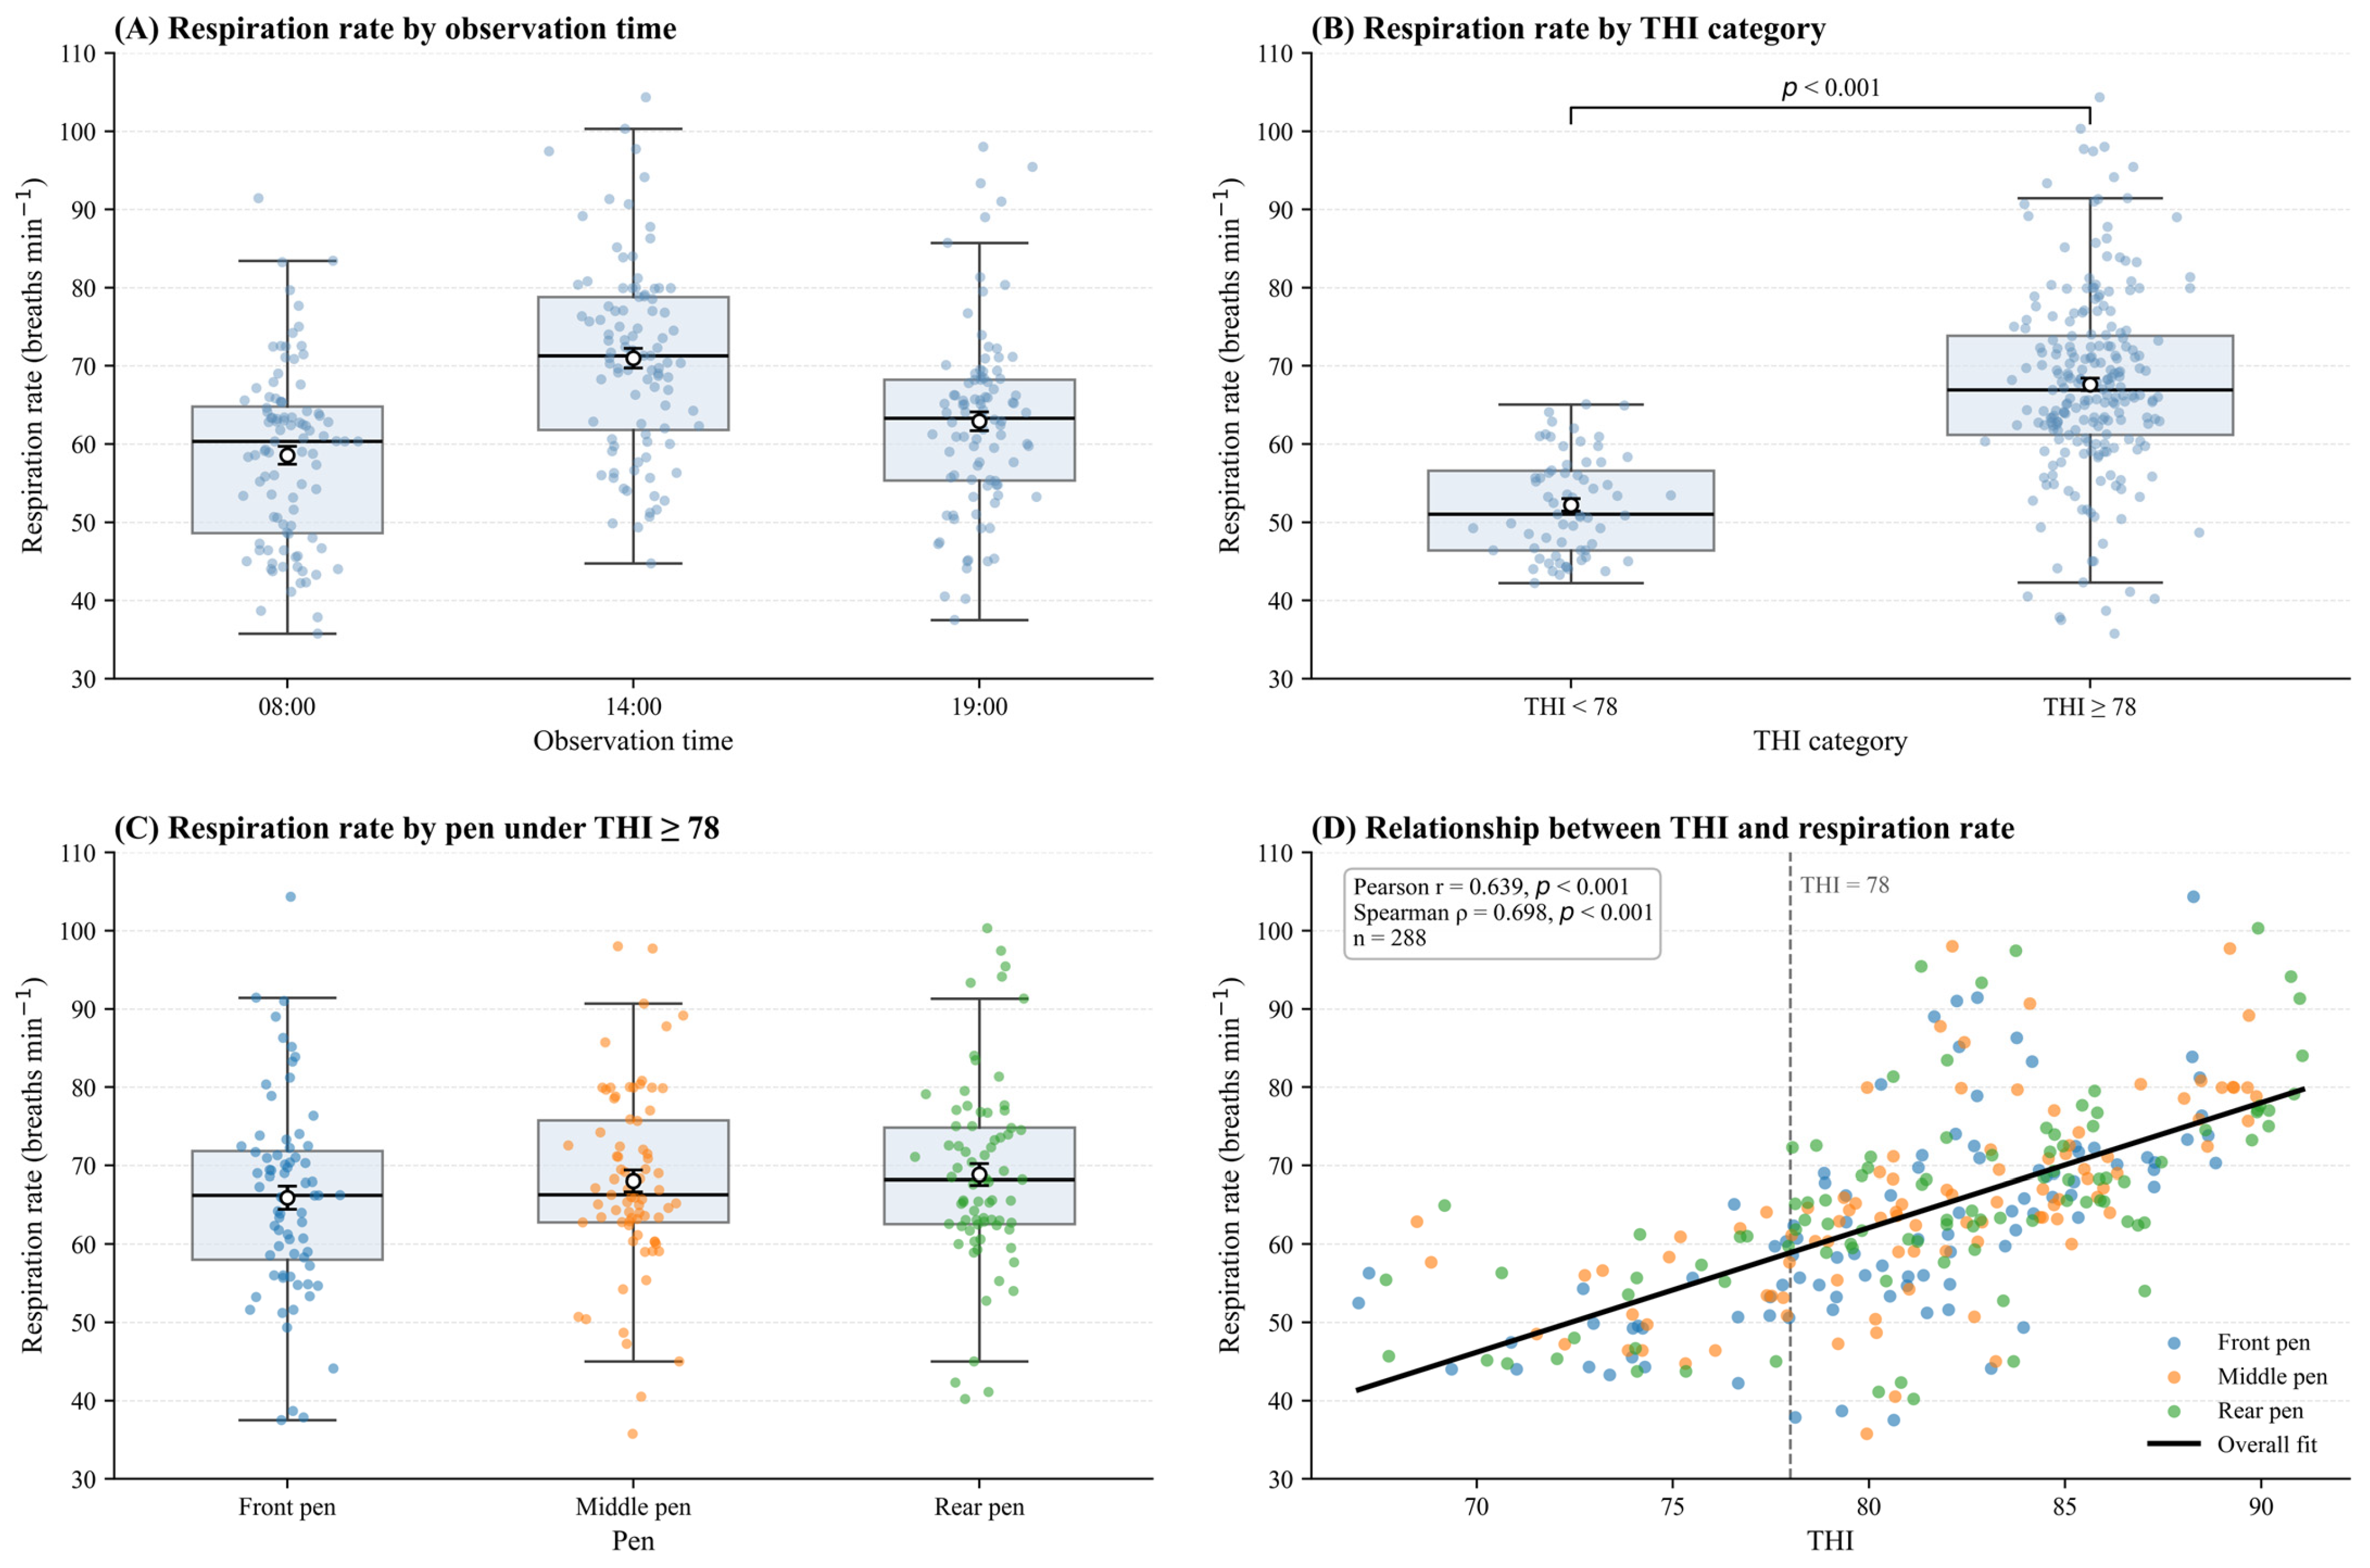
Respiration rate showed clear variation across observation times and thermal conditions (Figure 5). Among the three observation times, respiration rate was highest at 14:00 and lower at 08:00 and 19:00, indicating a stronger respiratory response during the midday high-heat period. When observations were classified using THI = 78 as the threshold, cattle exposed to THI ≥ 78 showed markedly higher respiration rates than those exposed to THI < 78. The distribution of respiration-rate observations was also wider under THI ≥ 78, indicating greater variability in respiratory responses under higher-heat-load conditions. Under high-heat-load conditions, respiration rate tended to be slightly higher in the middle and rear pens than in the front pen, but the distributions overlapped among pens, suggesting that respiration rate was more strongly associated with short-term thermal load than with pen location alone.
The positive association between THI and respiration rate was further supported by the mixed-effects model and correlation analysis. After accounting for observation time, pen, and date-level variation, THI remained positively associated with respiration rate. Each one-unit increase in THI was associated with an increase of 1.247 breaths min−1 in respiration rate (95% CI: 0.919–1.575, p < 0.001; Supplementary Table S4). Correlation analysis also showed a positive relationship between THI and respiration rate at the overall level (Pearson r = 0.639; Spearman ρ = 0.698; both p < 0.001), with similar positive associations observed within the front, middle, and rear pens. Compared with 08:00, respiration rate was higher at 14:00 and 19:00 by 7.59 and 3.95 breaths min−1, respectively. The rear pen showed a slightly higher respiration rate than the front pen after adjustment, whereas the middle–front difference showed only a weak trend. These results indicate that respiration rate reflected short-term thermal exposure and was more closely associated with changes in THI than with pen location alone.

3.3.2. Water-Intake Responses

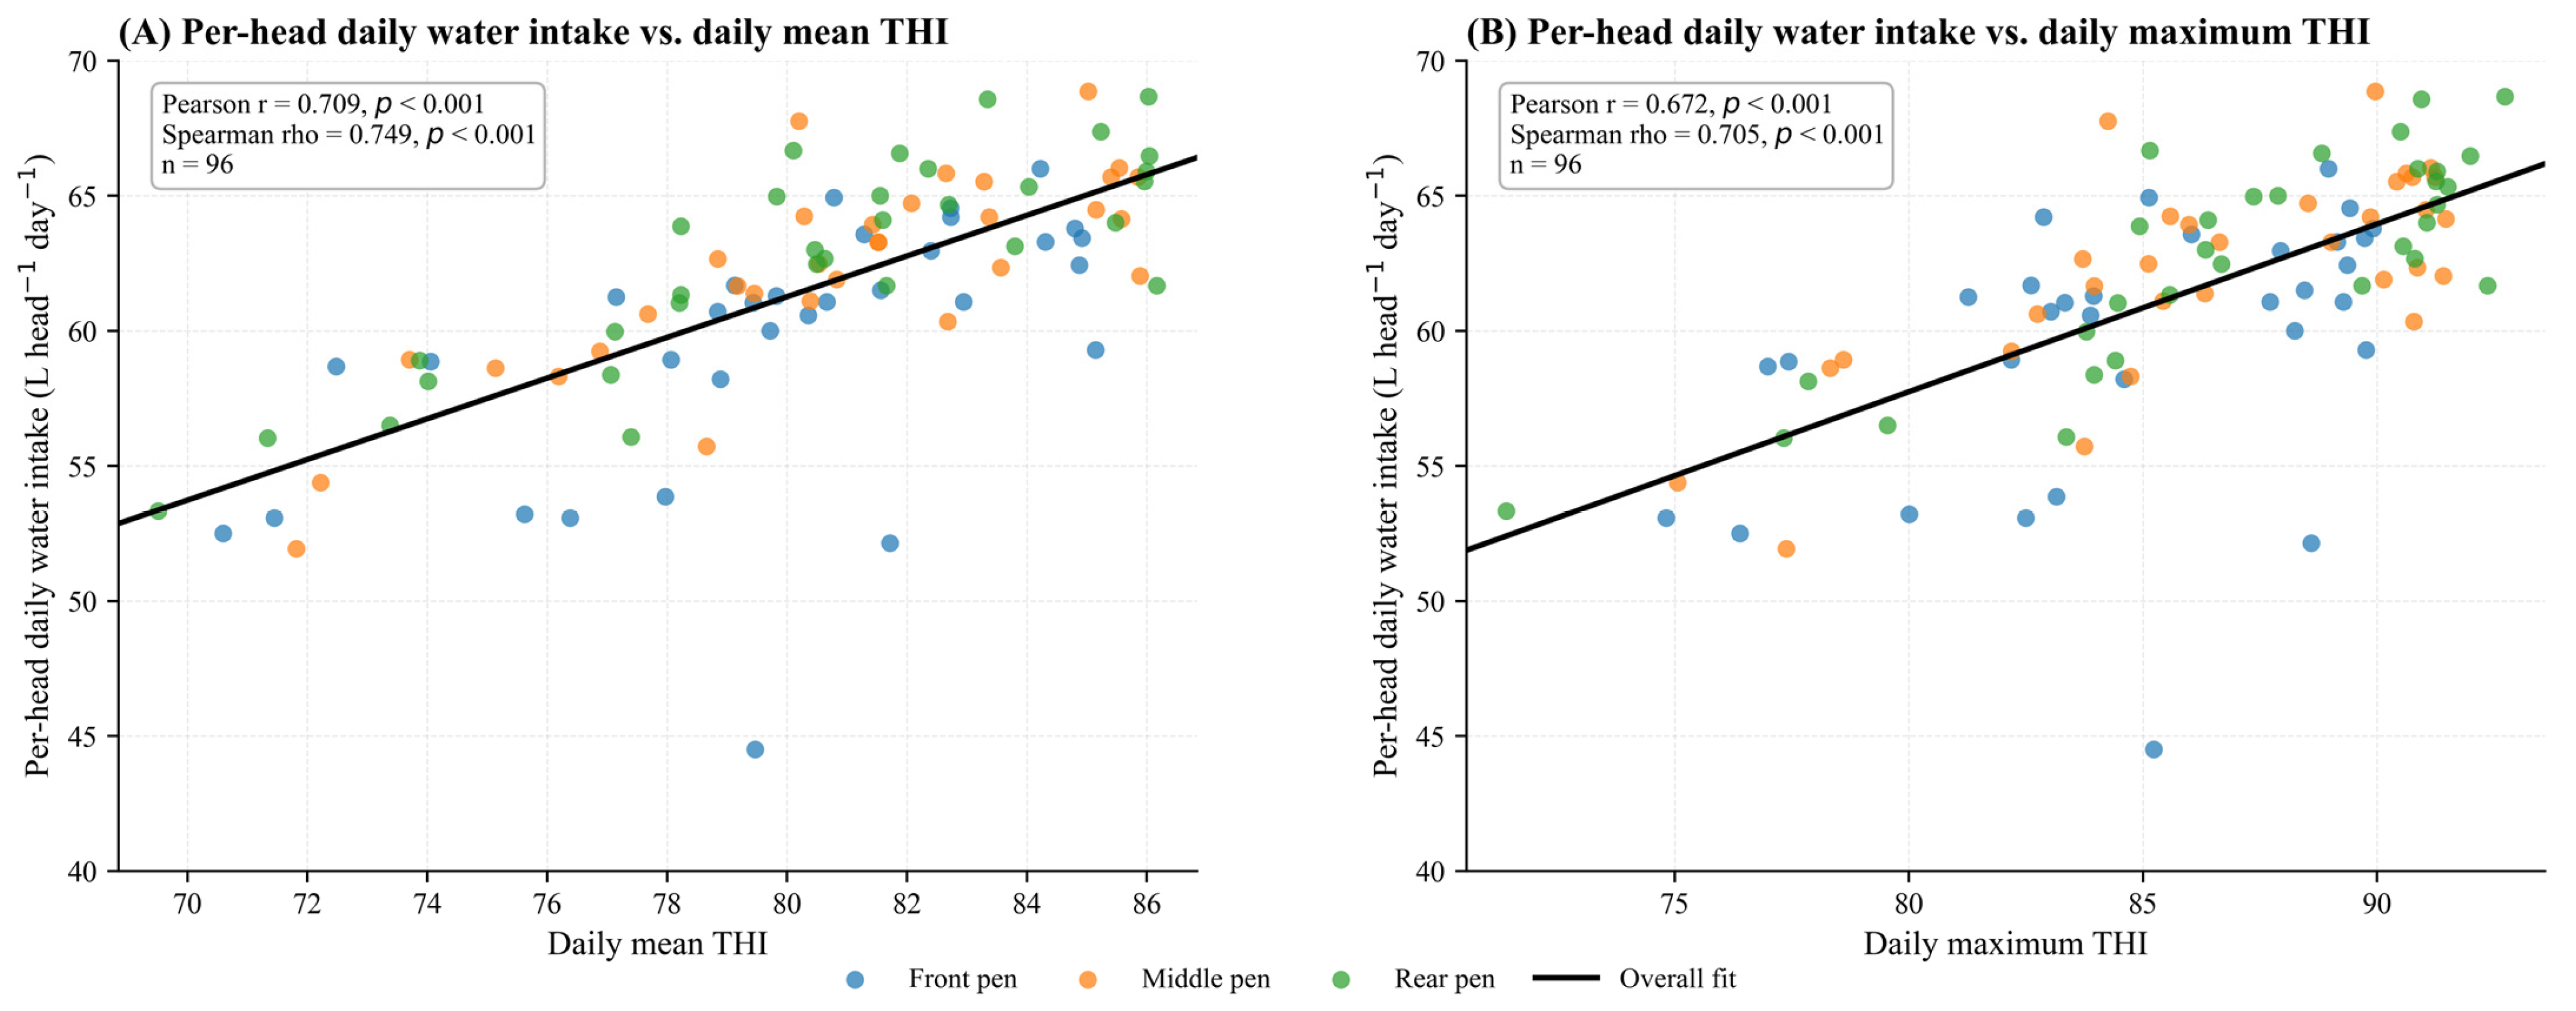
Per-head daily water intake showed a positive association with daily thermal exposure (Figure 6). Across the monitoring period, water intake tended to remain higher during periods with greater heat load and decreased when daily THI declined. Compared with respiration rate, which reflected short-term responses to the immediate thermal environment, per-head daily water intake was evaluated as a daily-scale response indicator of cumulative thermal exposure.
Per-head daily water intake was positively associated with daily THI metrics. The association was stronger for daily mean THI (Pearson r = 0.709; Spearman ρ = 0.749; both p < 0.001) than for daily maximum THI (Pearson r = 0.672; Spearman ρ = 0.705; both p < 0.001). In exploratory ordinary least-squares models adjusted for pen, per-head daily water intake increased by 0.732 L head−1 day−1 for each one-unit increase in daily mean THI (95% CI: 0.588–0.875, p < 0.001), whereas the estimate for daily maximum THI was 0.585 L head−1 day−1 per THI unit (95% CI: 0.445–0.725, p < 0.001). Detailed correlation results between THI metrics and per-head daily water intake are provided in Supplementary Table S5.

3.3.3. Descriptive Trends in Body-Weight Changes

Body weight was measured for the cattle in the front, middle, and rear pens at the beginning and end of the monitoring period. Because strict one-to-one individual matching between the initial and final measurements was not established, body-weight change and apparent average daily gain were analyzed only as descriptive pen-level indicators rather than as inferential performance outcomes (Table 4).
The mean body weight increased in all three pens during the monitoring period, and the front pen showed a numerically higher apparent ADG than the middle and rear pens. Because these values were calculated from pen-level mean body weights, they were used only to describe group-level growth trends during the monitoring period, rather than to infer individual growth responses.
Overall, the animal-response measurements provided information at different temporal scales. Respiration rate reflected short-term responses to thermal conditions, whereas daily water intake was associated with daily thermal exposure. Body-weight change was retained as a descriptive background indicator of group-level performance during the monitoring period. These results indicate that combining environmental monitoring with animal-response indicators can help characterize heat-risk patterns in open-sided beef cattle barns, while causal relationships between local thermal exposure and growth performance require further validation with individually matched longitudinal data.

4. Discussion

4.1. Formation and Characteristics of Pen-Scale Thermal Environmental Heterogeneity in the Open-Sided Beef Cattle Barn

The present study showed that the thermal environment within the open-sided beef cattle barn was spatially heterogeneous at the pen scale. Although the front, middle, and rear pens followed similar day-to-day THI trends over the monitoring period, the middle and rear pens generally showed higher THI intensity than the front pen. Notably, these differences were more evident in daily maximum THI and daytime THI metrics than in the daytime duration of exposure to THI ≥ 78. This indicates that cattle in different pens may experience similar periods of heat exposure but different thermal intensity during those periods.
A key feature of this heterogeneity was its dependence on time of day. Pen-scale THI differences were small during nighttime and early morning hours but became more pronounced during the daytime high-heat period. In particular, the rear–front difference was significantly amplified during 10:00–16:00, suggesting that local heat accumulation varied dynamically with daytime heat load rather than remaining constant throughout the day. This diurnal pattern is important because the greatest risk of heat stress usually occurs when high ambient heat load, solar radiation, and limited heat dissipation overlap [29,30,31].
Although several between-pen THI differences were statistically significant, their practical relevance should be interpreted together with the magnitude, timing, and concurrent animal-response indicators. In this study, pen-scale differences were more evident in THI intensity than in daytime high-THI duration, and the rear–front difference was amplified during the daytime high-heat period. The positive association between THI and respiration rate further supports the relevance of these local thermal differences as short-term heat-risk signals. However, these findings should be interpreted as evidence of pen-scale variation in thermal exposure and short-term animal response, rather than as direct evidence of long-term production effects.
The observed daytime amplification may be related to the structural and microclimatic characteristics of open-sided barns. In such barns, solar exposure, shading distribution, wind direction, and local airflow pathways can vary among pens and may jointly affect heat gain and dissipation. In this study, the rear and middle pens showed higher illuminance exposure during 10:00–16:00, which was consistent with their higher daytime THI. In addition, the front pen was closer to the incoming direction of fan-assisted airflow, whereas the middle and rear pens were located further downstream. These factors may have contributed to the observed pen-scale differences; however, because detailed radiation balance and airflow-field measurements were not conducted, they should be regarded as plausible explanations rather than confirmed causal mechanisms [32,33].
These findings suggest that barn-level average values or single-point measurements may not be sufficient to characterize local thermal exposure in open-sided beef cattle barns. A single monitoring point can capture the general temporal trend of the barn environment but may miss local areas with higher thermal intensity, particularly during daytime high-heat periods. Therefore, pen-scale monitoring provides additional information for identifying local heat-risk areas and improving the spatial resolution of thermal environmental assessment.

4.2. Pen-Scale Thermal Environmental Differences and Multi-Timescale Responses of Beef Cattle

The animal-response indicators shown in Figure 5 and Figure 6 and Table 4 reflected different timescales of response to thermal exposure. Respiration rate showed the most immediate association with THI and remained positively related to THI after accounting for observation time, pen, and date-level variation. This supports the use of respiration rate as a sensitive short-term indicator of heat-load response in beef cattle. Physiologically, increased respiratory activity is an important pathway for evaporative heat loss when cattle are exposed to high thermal load [5,34]. However, the pen effect on respiration rate was weaker than the overall THI effect, suggesting that respiratory response was mainly driven by the current thermal environment rather than pen location alone.
Per-head daily water intake provided complementary information at a daily scale. Its stronger association with daily mean THI than with daily maximum THI suggests that drinking demand was more closely related to cumulative daily heat exposure than to short-term thermal peaks. This is reasonable because water intake is affected by total daily heat load, evaporative water loss, feed intake, and metabolic heat production, rather than by a single short period of high THI. Therefore, respiration rate and water intake should not be treated as interchangeable indicators; instead, they represent short-term physiological adjustment and daily cumulative response, respectively [35,36,37].
Body-weight change was used as a descriptive pen-level indicator of group performance during the monitoring period. Although the front pen showed numerically higher apparent average daily gain than the middle and rear pens, this pattern should be interpreted cautiously because growth can be influenced by initial body weight, feed intake, health status, social hierarchy, and routine management. Moreover, the initial and final body-weight records were not individually matched over time. Thus, the body-weight results provide background information on group-level growth trends, while future studies with individually matched growth records, feed intake, behavior, and physiological measurements are needed to evaluate the production consequences of local heat exposure more rigorously [34,38,39].

4.3. Implications of LoRa-Based Continuous Multi-Point Monitoring for Barn Environmental Assessment and Management

The practical value of the LoRa-based monitoring system in this study lies in its ability to provide continuous spatial information on thermal exposure within a commercial beef cattle barn. Rather than only recording barn-level environmental trends, the multi-point deployment allowed local differences among pens to be detected and quantified. This is particularly relevant for open-sided barns, where solar exposure, airflow pathways, shading conditions, and pen position may cause uneven thermal conditions within the same building. Therefore, pen-scale monitoring can help reveal local heat-risk patterns that may be overlooked by single-point measurements or barn-level averages [40,41].
From a management perspective, identifying repeated high-heat areas within a barn may help farm managers prioritize pens or time periods requiring closer attention during hot weather. For example, if the middle or rear pens consistently experience higher daytime THI or stronger heat-load amplification, managers could further evaluate local shading, fan layout, airflow distribution, or cooling strategies. This does not mean that each pen must be controlled independently, but it suggests that spatial imbalance should be considered when assessing barn ventilation, shading, and cooling conditions [6,12,22].
Although LoRa communication provided stable minute-level data acquisition in this study, the system should be regarded primarily as a monitoring and decision-support tool. Its main contribution is to generate reliable pen-scale environmental information that can support heat-risk assessment and management decision-making. Further controlled studies are needed before this framework can be directly linked to specific environmental-control interventions, such as differential fan operation or misting control.
Because the present study did not collect cost, labor, maintenance, or economic-return data, a formal cost–benefit analysis was beyond its scope. Future large-scale applications should further evaluate deployment cost, appropriate sensor density, maintenance requirements, data-management workload, and potential economic benefits before recommending routine commercial implementation.

4.4. Limitations

This study has several limitations that should be considered when interpreting the results. The experiment was conducted in a single open-sided beef cattle barn, and the main analysis focused on three representative pens on one side of the barn. This design allowed pen-scale thermal heterogeneity to be characterized under a real commercial production scenario, but the spatial coverage was still limited. In addition, synchronized outdoor meteorological data, including outdoor air temperature and relative humidity, were not continuously recorded, and solar radiation intensity and radiation balance inside and outside the barn were not measured. Although illuminance was recorded as an auxiliary environmental variable, it cannot fully represent radiative heat load. Therefore, the observed front–middle–rear differences should be interpreted as pen-scale thermal patterns within the monitored barn rather than as direct evidence of specific causal drivers such as outdoor weather, solar radiation, roof structure, or shading conditions.
The monitoring period lasted approximately one month and mainly covered hot-season conditions. This period was sufficient to evaluate the feasibility of continuous pen-scale monitoring and to capture short-term associations between thermal exposure, respiration rate, and water intake. However, it was not designed to fully assess long-term production consequences. Body-weight change was based on pen-level mean values rather than individually matched longitudinal records; therefore, apparent average daily gain was used only as a descriptive background indicator. These limitations should be considered when interpreting the applicability of the observed pen-scale thermal patterns and their associations with cattle-response indicators.
Future studies combining denser microclimate mapping, direct airflow measurements, solar-radiation measurements, or computational fluid dynamics analyses would help verify the mechanisms underlying the observed pen-scale thermal heterogeneity.

5. Conclusions

This study showed that long-range wireless multi-point monitoring is feasible for identifying pen-scale thermal heterogeneity in a commercial open-sided beef cattle barn during the hot season. The monitoring framework provided highly complete continuous environmental data, and the middle and rear pens showed higher THI intensity than the front pen, particularly during the daytime high-heat period. Respiration rate increased by 1.247 breaths min−1 for each one-unit increase in THI, supporting its use as a short-term animal-response indicator. Per-head daily water intake was more strongly associated with daily mean THI than with daily maximum THI, suggesting that water intake may better reflect cumulative daily heat exposure. Apparent ADG was treated as a descriptive group-level indicator because individual longitudinal matching was not available.
Overall, the proposed framework improved the spatial resolution of barn environmental assessment and provided a practical data basis for identifying local heat-risk areas that may be masked by barn-level averages or single-point measurements. These findings support the use of pen-scale monitoring for heat-risk assessment and targeted management evaluation in open-sided beef cattle barns. Further studies across multiple barns, seasons, and longer monitoring periods, combined with outdoor meteorological, solar-radiation, behavioral, and individually matched performance data, are needed to further evaluate management effectiveness and production responses.

Supplementary Materials

The following supporting information can be downloaded at https://www.mdpi.com/article/10.3390/agriculture16141505/s1: Figure S1: Diurnal variation and high-heat-period distribution of illuminance in the shaded-area nodes of the selected pens; Table S1: Pairwise pen differences in THI-related heat-risk metrics; Table S2: Linear mixed-effects model results for pen-scale THI metrics; Table S3: Pen × period mixed model for daytime amplification of THI differences; Table S4: Mixed-effects model results for respiration rate; Table S5: Correlation analysis between THI and per-head daily water intake.

Author Contributions

Conceptualization, G.Y., T.H. and Z.C.; methodology, G.Y. and Z.C.; software, Z.C.; validation, S.J., J.Z. and M.Z.; formal analysis, G.Y. and Z.C.; investigation, G.Y., S.J., X.W., J.Z. and M.Z.; resources, M.Z., T.H. and Z.C.; data curation, S.J., X.W. and Z.C.; writing—original draft preparation, G.Y.; writing—review and editing, G.Y., T.H. and Z.C.; visualization, G.Y. and X.W.; supervision, T.H. and Z.C.; project administration, T.H. and Z.C.; funding acquisition, T.H. and Z.C. All authors have read and agreed to the published version of the manuscript.

Funding

This research was funded by the National Key Research and Development Program of China, grant number 2023YFD1300804; the China Agriculture Research System of MOF and MARA, grant number CARS-37; and the 2115 Talent Development Program of China Agricultural University, grant number 1041-00109019.

Institutional Review Board Statement

The study was reviewed and approved by the Animal Care and Use Committee of China Agricultural University (protocol code: AW12506202-1-05). The study was conducted under routine commercial farm management conditions and involved only non-invasive respiration-rate observations, water-meter records, routine body-weight measurements, and environmental monitoring, without additional experimental treatment or invasive procedures.

Informed Consent Statement

Informed consent was obtained from the owner or authorized manager of the commercial beef cattle farm before animal-related observations and the use of routine production records. The study involved only non-invasive respiration-rate observations, water-meter records, routine body-weight measurements, and environmental monitoring, without additional experimental treatments or invasive procedures.

Data Availability Statement

The data presented in this study are available from the corresponding author upon reasonable request.

Acknowledgments

The authors thank the staff of the experimental beef cattle farm for their assistance during field data collection and animal management.

Conflicts of Interest

The authors declare no conflicts of interest. The funders had no role in the design of the study; in the collection, analyses, or interpretation of data; in the writing of the manuscript; or in the decision to publish the results.

Abbreviations

ADG, average daily gain; AT, air temperature; CI, confidence interval; CO2, carbon dioxide; LoRa, long range; NH3, ammonia; RH, relative humidity; RR, respiration rate; SD, standard deviation; SEM, standard error of the mean; THI, temperature–humidity index; Wi-Fi, wireless fidelity.

References

  1. Hasan, F.M.; Chlingaryan, A.; Thomson, P.C.; Clark, C.E.F.; Islam, M.R.; Lomax, S. Impact of heat stress on cattle systems: Responses of production metrics to thermal stress. Comput. Electron. Agric. 2026, 240, 111143. [Google Scholar] [CrossRef]
  2. Tian, F.; Zhang, L.; Zhang, J.; Zhang, S.; Soomro, S.A.; Xiong, B.; Shen, W.; Song, Z.; Yan, Y.; Yu, Z. Cattle-ES3D: A spatiotemporal feature fusion method for detecting tachypnea and salivation behaviors in beef cattle. Comput. Electron. Agric. 2025, 239, 110907. [Google Scholar] [CrossRef]
  3. Baccouri, W.; Wanjala, G.; Tóth, V.; Komlósi, I.; Mikó, E. The effect of different levels of heat stress on the behaviour of cows at different stage of lactation. J. Therm. Biol. 2025, 134, 104334. [Google Scholar] [CrossRef] [PubMed]
  4. Chopra, K.; Hodges, H.R.; Barker, Z.E.; Vázquez Diosdado, J.A.; Amory, J.R.; Cameron, T.C.; Croft, D.P.; Bell, N.J.; Thurman, A.; Bartlett, D.; et al. Bunching behavior in housed dairy cows at higher ambient temperatures. J. Dairy Sci. 2024, 107, 2406–2425. [Google Scholar] [CrossRef] [PubMed]
  5. Idris, M.; Sullivan, M.; Gaughan, J.B.; Keeley, T.; Phillips, C.J.C. Faecal cortisol metabolites, body temperature, and behaviour of beef cattle exposed to a heat load. Animal 2024, 18, 101112. [Google Scholar] [CrossRef] [PubMed]
  6. Nsabiyeze, A.; Zhang, M.; Li, J.; Zhao, Q.; Zhang, X. Precision livestock farming for climate-resilient livestock management: A review of real-time monitoring and decision support systems. J. Clean. Prod. 2025, 524, 146454. [Google Scholar] [CrossRef]
  7. Papakonstantinou, G.I.; Voulgarakis, N.; Terzidou, G.; Fotos, L.; Giamouri, E.; Papatsiros, V.G. Precision Livestock Farming Technology: Applications and Challenges of Animal Welfare and Climate Change. Agriculture 2024, 14, 620. [Google Scholar] [CrossRef]
  8. Yi, G.; Wang, X.; Jiang, S.; He, T.; Chen, Z. A deployable LoRa-based end-to-end monitoring architecture for commercial beef cattle barns under limited-connectivity conditions. J. Agric. Food Res. 2026, 28, 103001. [Google Scholar] [CrossRef]
  9. Wang, M.; Yao, C.; Xu, L.; Ji, Y.; Ding, L.; Jiang, R.; Li, J.; Shan, F.; Li, Q. Towards intelligent microclimate control in cattle housing: A dynamic-balance framework via multi-constraint optimization. Smart Agric. Technol. 2026, 13, 101697. [Google Scholar] [CrossRef]
  10. Ma, H.; Wang, S.; Gu, J.; Xie, Q.; Wang, W.; Dong, S.; Sun, C.; Li, J.; Ma, C.; Dong, J.; et al. IoT-based smart environmental control and air emission management in animal farming: A systematic review. Inf. Process. Agric. 2026; in press. [CrossRef]
  11. Singaravadivelan, A.; Prasad, A.; Balusami, C.; Harikumar, S.; Beena, V.; Gleeja, V.L.; Sejian, V.; Vijayakumar, P.; Sachin, P.B.; Praveen Kumar, I.; et al. Navigating the Labyrinth of heat stress assessment in dairy cattle: A comprehensive review of methods and emerging technologies. Comput. Electron. Agric. 2025, 237, 110517. [Google Scholar] [CrossRef]
  12. Alonso, R.S.; Sittón-Candanedo, I.; García, Ó.; Prieto, J.; Rodríguez-González, S. An intelligent Edge-IoT platform for monitoring livestock and crops in a dairy farming scenario. Ad. Hoc Netw. 2020, 98, 102047. [Google Scholar] [CrossRef]
  13. Provolo, G.; Brandolese, C.; Grotto, M.; Marinucci, A.; Fossati, N.; Ferrari, O.; Beretta, E.; Riva, E. An Internet of Things Framework for Monitoring Environmental Conditions in Livestock Housing to Improve Animal Welfare and Assess Environmental Impact. Animals 2025, 15, 644. [Google Scholar] [CrossRef] [PubMed]
  14. Wang, Z. Greenhouse data acquisition system based on ZigBee wireless sensor network to promote the development of agricultural economy. Environ. Technol. Innov. 2021, 24, 101689. [Google Scholar] [CrossRef]
  15. Sadowski, S.; Spachos, P. Wireless technologies for smart agricultural monitoring using internet of things devices with energy harvesting capabilities. Comput. Electron. Agric. 2020, 172, 105338. [Google Scholar] [CrossRef]
  16. Qin, H.; Li, N.; Yang, G.; Peng, Y. Cross-network cross-interface relaying via LoRa-ZigBee synergy: Enabling energy-efficient delay-constrained communication across low-power IoT networks. Internet Things 2026, 36, 101878. [Google Scholar] [CrossRef]
  17. Jabbar, W.A.; Mei Ting, T.; Hamidun, M.F.I.; Che Kamarudin, A.H.; Wu, W.; Sultan, J.; Alsewari, A.A.; Ali, M.A.H. Development of LoRaWAN-based IoT system for water quality monitoring in rural areas. Expert Syst. Appl. 2024, 242, 122862. [Google Scholar] [CrossRef]
  18. Ojo, M.; Wang, Y.; Bua, C.; Sher, M.; Zahid, A. A crop digital twin system for predictive growth monitoring and adaptive light control in controlled environment agriculture. Internet Things 2026, 37, 101935. [Google Scholar] [CrossRef]
  19. Sharma, K.; Shivandu, S.K. Integrating artificial intelligence and Internet of Things (IoT) for enhanced crop monitoring and management in precision agriculture. Sens. Int. 2024, 5, 100292. [Google Scholar] [CrossRef]
  20. Chamara, N.; Islam, M.D.; Bai, G.; Shi, Y.; Ge, Y. Ag-IoT for crop and environment monitoring: Past, present, and future. Agric. Syst. 2022, 203, 103497. [Google Scholar] [CrossRef]
  21. Jeelani, R.; Konwar, D.; Khan, A.; Kumar, D.; Chakraborty, D.; Brahma, B. Reassessment of temperature-humidity index for measuring heat stress in crossbred dairy cattle of a sub-tropical region. J. Therm. Biol. 2019, 82, 99–106. [Google Scholar] [CrossRef] [PubMed]
  22. Gutierrez, W.-M.; Oh, T.-K.; Kim, D.-H.; Lee, J.-J.; Kim, S.; Min, W.; Lee, S.; Kim, B.-W.; Chang, H.-H.; Chikushi, J. Respiration Rate Predictive Equation and Effective Heat Stress Relief Ways for Hanwoo Steers. J. Fac. Agric. Kyushu Univ. 2012, 57, 161–164. [Google Scholar] [CrossRef] [PubMed]
  23. Chopra, K.; Zhang, C.; Liu, C.; Luo, Z.; Reynolds, C.K.; Amory, J.R.; Barker, Z.E.; Thurman, A.; Codling, E.A. Associations between space-use behaviour and temperature-humidity index in barn-housed dairy cows. Appl. Anim. Behav. Sci. 2026, 299, 106965. [Google Scholar] [CrossRef]
  24. Yi, G.; Jiang, S.; Liu, X.; He, T.; Chen, Z. LoRa-Based Environmental Monitoring in Beef Cattle Barns: A Time-Slot Scheduling with Jitter Strategy for Stable Multi-Node Uplinks Under Production Disturbances. Smart Agric. Technol. 2026, 14, 102227. [Google Scholar] [CrossRef]
  25. Carpio Hallasi, R.V.; Mamani Arqque, Y.; Arenas Mamani, F.A.; Contreras Corzo, A.E.; Pari Pinto, P.L.; Sulla Espinoza, E. PyLoGreen: Design and implementation of a low-cost agricultural data acquisition and monitoring system using Raspberry Pi, LoRa, and nRF24L01 in the High-Andean Tundra. HardwareX 2026, 26, e00766. [Google Scholar] [CrossRef] [PubMed]
  26. Mbuthia, J.M.; Eggert, A.; Reinsch, N. Cooling temperature humidity index-days as a heat load indicator for milk production traits. Front. Anim. Sci. 2022, 3, 946592. [Google Scholar] [CrossRef]
  27. Strutzke, S.; Fiske, D.; Hoffmann, G.; Ammon, C.; Heuwieser, W.; Amon, T. Technical note: Development of a noninvasive respiration rate sensor for cattle. J. Dairy Sci. 2019, 102, 690–695. [Google Scholar] [CrossRef] [PubMed]
  28. Dißmann, L.; Heinicke, J.; Jensen, K.; Amon, T.; Hoffmann, G. How should the respiration rate be counted in cattle? Vet. Res. Commun. 2022, 46, 1221–1225. [Google Scholar] [CrossRef] [PubMed]
  29. Fournel, S.; Ouellet, V.; Charbonneau, É. Practices for Alleviating Heat Stress of Dairy Cows in Humid Continental Climates: A Literature Review. Animals 2017, 7, 37. [Google Scholar] [CrossRef] [PubMed]
  30. Edwards-Callaway, L.N.; Cramer, M.C.; Cadaret, C.N.; Bigler, E.J.; Engle, T.E.; Wagner, J.J.; Clark, D.L. Impacts of shade on cattle well-being in the beef supply chain. J. Anim. Sci. 2021, 99, skaa375. [Google Scholar] [CrossRef] [PubMed]
  31. Vieira, F.M.C.; Soares, A.A.; Herbut, P.; Vismara, E.D.S.; Godyń, D.; dos Santos, A.C.Z.; Lambertes, T.D.S.; Caetano, W.F. Spatio-Thermal Variability and Behaviour as Bio-Thermal Indicators of Heat Stress in Dairy Cows in a Compost Barn: A Case Study. Animals 2021, 11, 1197. [Google Scholar] [CrossRef] [PubMed]
  32. VanderZaag, A.; Le Riche, E.; Baldé, H.; Kallil, S.; Ouellet, V.; Charbonneau, É.; Coates, T.; Wright, T.; Luimes, P.; Gordon, R. Comparing thermal conditions inside and outside lactating dairy cattle barns in Canada. J. Dairy Sci. 2023, 106, 4738–4758. [Google Scholar] [CrossRef] [PubMed]
  33. Angrecka, S.; Herbut, P.; Godyń, D.; Vieira, F.; Zwolenik, M. Dynamics of Microclimate Conditions in Freestall Barns During Winter—A Case Study from Poland. J. Ecol. Eng. 2020, 21, 129–136. [Google Scholar] [CrossRef] [PubMed]
  34. Brown-Brandl, T. Understanding heat stress in beef cattle. Rev. Bras. Zootec. 2018, 47, e20160414. [Google Scholar] [CrossRef]
  35. Becker, C.A.; Collier, R.J.; Stone, A.E. Invited review: Physiological and behavioral effects of heat stress in dairy cows. J. Dairy Sci. 2020, 103, 6751–6770. [Google Scholar] [CrossRef] [PubMed]
  36. West, J.W. Effects of Heat-Stress on Production in Dairy Cattle. J. Dairy Sci. 2003, 86, 2131–2144. [Google Scholar] [CrossRef] [PubMed]
  37. Idris, M.; Sullivan, M.; Gaughan, J.B.; Phillips, C.J.C. Behavioural Responses of Beef Cattle to Hot Conditions. Animals 2024, 14, 2444. [Google Scholar] [CrossRef] [PubMed]
  38. Kim, W.-S.; Nejad, J.G.; Park, K.-K.; Lee, H.-G. Heat Stress Effects on Physiological and Blood Parameters, and Behavior in Early Fattening Stage of Beef Steers. Animals 2023, 13, 1130. [Google Scholar] [CrossRef] [PubMed]
  39. Slayi, M.; Jaja, I.F. Strategies for mitigating heat stress and their effects on behavior, physiological indicators, and growth performance in communally managed feedlot cattle. Front. Vet. Sci. 2025, 12, 1513368. [Google Scholar] [CrossRef] [PubMed]
  40. Jawad, H.M.; Nordin, R.; Gharghan, S.K.; Jawad, A.M.; Ismail, M. Energy-Efficient Wireless Sensor Networks for Precision Agriculture: A Review. Sensors 2017, 17, 1781. [Google Scholar] [CrossRef] [PubMed]
  41. Godinho, A.; Vicente, R.; Silva, S.; Coelho, P.J. Wireless Environmental Monitoring and Control in Poultry Houses: A Conceptual Study. IoT 2025, 6, 32. [Google Scholar] [CrossRef]
Figure 1. The workflow of the long-range (LoRa)-based pen-scale heat-risk mapping framework. Environmental data collected from multi-point LoRa monitoring nodes were processed to derive THI-related indicators, followed by pen-scale thermal heterogeneity analysis and matching with cattle-response variables. Abbreviations: LoRa, long range; AT, air temperature; RH, relative humidity; CO2, carbon dioxide; THI, temperature–humidity index; ADG, average daily gain.
Agriculture 16 01505 g001
Figure 2. The experimental barn and monitoring-node deployment. (A) Photographs of the commercial open-sided double-row beef cattle barn, including the external view of the barn, central feeding alley, and cattle pen area. (B) The layout of the selected front, middle, and rear pens and deployment of monitoring nodes. Black circles indicate monitoring nodes, fan symbols indicate fans, and shaded rectangles indicate shaded areas. The arrow indicates north.
Agriculture 16 01505 g002
Figure 3. The architecture of the LoRa-based multi-point environmental monitoring system. The system consisted of a sensing layer, a transmission layer, and a data management and application layer. Environmental data collected by the distributed monitoring nodes were transmitted to the LoRa gateway, uploaded to the cloud server, stored in the database, and used for data analysis and visualization.
Agriculture 16 01505 g003
Figure 4. Temporal dynamics and pen-scale heterogeneity of the temperature–humidity index (THI) in the selected pens of the open-sided beef cattle barn. (A) Daily mean THI. (B) Daily maximum THI. (C) Diurnal THI patterns expressed as mean ± standard error of the mean (SEM). (D) Diurnal between-pen differences in THI. The dashed horizontal line indicates THI = 78, representing higher-heat-load conditions. The shaded background in panels (C,D) indicates the daytime high-heat period from 10:00 to 16:00.
Agriculture 16 01505 g004
Figure 5. The respiration-rate responses of cattle to thermal conditions. (A) Respiration rate by observation time. (B) Respiration rate under lower and higher-heat-load conditions classified by temperature–humidity index (THI) = 78. (C) Pen-level respiration rate under THI ≥ 78. (D) The relationship between THI and respiration rate. The dashed vertical line in panel D indicates THI = 78, and the black line represents the overall linear fit.
Agriculture 16 01505 g005
Figure 6. Relationships between temperature–humidity index (THI) and per-head daily water intake. (A) The relationship between daily mean THI and per-head daily water intake. (B) The relationship between daily maximum THI and per-head daily water intake. The points represent pen-day observations for the front, middle, and rear pens. The black line indicates the overall linear fit.
Agriculture 16 01505 g006
Table 1. The technical specifications of the main environmental sensors used in the monitoring system.
Measured VariableModelManufacturerMeasurement RangeAccuracy
Air temperatureSHT35Sensirion AG, Stäfa, Switzerland−40 to 125 °C±0.1 °C
Relative humiditySHT35Sensirion AG, Stäfa, Switzerland0% to 100% RH±1.5% RH
Wind speedCup anemometerJinan Zhaotaisheng Electronic Technology Co., Ltd., Jinan, China0 to 30 m s−1±0.3 m s−1
IlluminanceBH1750Shenzhen Xintai Microelectronics Technology Co., Ltd., Shenzhen, China0 to 65,535 lx±1%
CO2 concentrationSCD41Sensirion AG, Stäfa, Switzerland0 to 5000 ppm±(40 ppm + 5%)
Note: RH, relative humidity; CO2, carbon dioxide.
Table 2. Data acquisition and completeness of the shaded-area monitoring nodes used for the main analysis.
PenNode LocationExpected Records (n)Valid Records After Quality Control (n)Data Completeness (%)
FrontShaded area46,08046,01899.87
MiddleShaded area46,08046,02799.88
RearShaded area46,08045,96499.75
Note: Expected records were calculated based on a 32-day monitoring period and a 1 min sampling interval. Valid records refer to records retained after quality control, including screening for missing records, sensor-stagnation artifacts, and unrecoverable abnormal values.
Table 3. Pen-scale heat-risk metrics in the selected pens of the open-sided beef cattle barn.
PennMean THI (24 h)Max THI (24 h)Mean THI (Daytime)Max THI (Daytime)Hours/Day with THI ≥ 78THI ≥ 78 During Daytime (%)
Front pen3279.91 ± 4.0184.98 ± 4.4382.80 ± 5.0484.84 ± 4.7216.00 ± 8.0283.80 ± 33.84
Middle pen3280.71 ± 3.9486.47 ± 4.6183.74 ± 5.1186.35 ± 4.8717.60 ± 8.1385.10 ± 33.35
Rear pen3280.43 ± 4.5386.94 ± 5.0584.21 ± 5.7786.70 ± 5.3115.97 ± 7.8383.66 ± 33.53
Note: Values are presented as mean ± SD. THI = temperature–humidity index. Daytime was defined as 10:00–16:00. n = number of pen-days.
Table 4. Descriptive statistics of the body weight and apparent average daily gain of the cattle in the selected pens.
PenInitial nFinal nInitial Body Weight (kg)Final Body Weight (kg)Mean Weight Gain (kg)Apparent ADG
(kg day−1)
Front2828502.40 ± 30.78540.04 ± 26.6037.641.21
Middle2828505.74 ± 23.09534.39 ± 28.4528.650.92
Rear2828479.69 ± 27.05509.34 ± 33.4229.650.96
Note: Initial and final body weights are presented as mean ± standard deviation (SD). n, number of cattle; ADG, average daily gain. Mean weight gain and apparent ADG were calculated from the difference between final and initial pen-level mean body weights. Body-weight results were used only as descriptive indicators of pen-level growth trends because individual-level matching was not available.
Disclaimer/Publisher’s Note: The statements, opinions and data contained in all publications are solely those of the individual author(s) and contributor(s) and not of MDPI and/or the editor(s). MDPI and/or the editor(s) disclaim responsibility for any injury to people or property resulting from any ideas, methods, instructions or products referred to in the content.