Article

Traditional Sweet Peppers as Resources for Internal Fruit Quality: Evidence from Experimental F1 Hybrids Across Two Organic Growing Environments

by
Marisa Jiménez-Pérez
1,
Monica Boscaiu
2 and
Adrián Rodríguez-Burruezo
1,*
1
Instituto Universitario de Conservación y Mejora de la Agrodiversidad Valenciana (COMAV), Universitat Politècnica de València, Camino de Vera s/n, 46022 Valencia, Spain
2
Instituto Agroforestal Mediterráneo (IAM), Universitat Politècnica de València, Camino de Vera s/n, 46022 Valencia, Spain
*
Author to whom correspondence should be addressed.
Agriculture 2026, 16(13), 1431; https://doi.org/10.3390/agriculture16131431
Submission received: 24 May 2026 / Revised: 25 June 2026 / Accepted: 26 June 2026 / Published: 30 June 2026

Abstract

Traditional sweet pepper germplasm represents a valuable source of variation in fruit quality traits for hybrid breeding and sustainable production. Although hybridization has mainly exploited heterosis for yield and related traits, its effect on fruit quality remains underexplored. In this single-year study, traditional Spanish genotypes and their hybrids, derived from crosses with modern virus-resistance donor lines, were evaluated in two organic environments in southeastern Spain: open-field conditions in Valencia and greenhouse conditions in Murcia. Sugars, vitamin C and flavonoids were determined by HPLC, while red and yellow-orange carotenoids were assessed spectrophotometrically. Genotype × environment responses, heterosis, principal component analysis and trait correlations were also evaluated. Genotype explained substantial variation in sugars, vitamin C and carotenoids, whereas environment was the main factor for flavonoids. Significant G × E interactions were detected for all traits. Sugars and vitamin C differed less between the two environments, while flavonoids and carotenoids tended to reach higher levels in the open-field trial. Positive mid-parent heterosis was more frequent than best-parent heterosis, highlighting P10 × P5 in sugars (26%, open-field), P6 × P10 in vitamin C (33%, greenhouse), P9 × P10 in flavonoids (82%, open-field) and P10 × P2 in carotenoids (87%, open-field). These results identified promising traditional genotypes and hybrids with high internal fruit quality under the tested conditions, although multi-year confirmation is needed.

1. Introduction

Capsicum annuum L. is the most widely cultivated species of the genus Capsicum and one of the most valuable vegetable crops worldwide, consumed both fresh and processed, for example as spices, paprika or sauces. Peppers are distinguished by their remarkable diversity in flavor, color, shape and size, and are also recognized for their high nutritional value [1]. Internal fruit quality in pepper is largely determined by sugars and antioxidant compounds. Sugars are major contributors to sweetness and flavor in non-pungent peppers [2,3]. Vitamin C, flavonoids and carotenoids are natural antioxidants involved in protection against free radical damage [4], and have been associated with anti-inflammatory, cardioprotective and other beneficial health effects, including cancer prevention [5,6,7]. In addition, some carotenoids, such as β-carotene, act as precursors of vitamin A [7]. Indeed, a 100 g portion of ripe pepper usually exceeds the recommended daily intake (RDI) of vitamin C [8] and can provide around 10% of the RDI of provitamin A [8,9].
Peppers were introduced into Europe following the Columbus expeditions in the late 15th century and subsequently spread to Africa, India and China [10]. After centuries of cultivation and selection, centers of diversification emerged, giving rise to a wide range of landraces and local cultivars adapted to diverse agroclimatic and management conditions [11,12]. Spain represents an important secondary center of diversification and harbors a broad range of traditional and local sweet pepper ecotypes, many of which are still cultivated and valued by consumers. Among them, fleshy and large morphotypes commonly referred to as ‘Morrón’ are particularly relevant and include ‘Valenciano’, ‘Trompa/Morro de vaca’ and ‘Largo de Reus’, among others [13,14]. This diversity is also reflected in the large number of protected designations of origin (PDOs) and protected geographical indications (PGIs) associated with Spanish peppers [15].
Since the 1950s, crop improvement has been strongly influenced by the “Green Revolution”, which combined conventional breeding with advances in mechanization and agronomic practices, leading to major increases in crop yields worldwide [16]. In this context, F1 hybrids became widely adopted because of their high productivity and uniformity, their capacity to exploit heterosis for other vigor-related traits, such as growth and earliness [17], and the incorporation of resistance genes against pathogens [14,18]. However, the extensive use of a limited number of commercial hybrids has contributed to the displacement of landraces and local cultivars, increasing concerns about genetic erosion and reduced crop diversity [18,19]. At the same time, climate change and intensive agricultural practices can accelerate soil degradation and the limitation of natural resources [20,21]. These effects, together with reduced biodiversity in agroecosystems, potentially increase vulnerability to pests, diseases and climatic variability [22]. Consequently, there is broad consensus on the importance of preserving and using crop diversity to enhance resilience under future climatic scenarios [23].
In the transition towards low-input and more environmentally friendly production systems, traditional and landrace materials represent valuable sources of variation for agroecosystem diversification [24] and breeding [25]. Their long-term cultivation and selection under specific local conditions may have favored the maintenance of adaptive traits related to biotic and abiotic stress tolerance [23], as well as internal quality traits associated with taste and nutraceutical value [26,27], frequently linked to local identity [25,27]. Although these materials are often less suited to intensive production because of their greater heterogeneity [19] and frequently lower yields than modern hybrids, their potential becomes particularly relevant in low-input systems, where reduced chemical inputs may limit the yield advantage of commercial cultivars [23,24].
A major limitation to the broader use of traditional pepper materials is their susceptibility to important pathogens [25], particularly viruses such as Tomato spotted wilt virus (TSWV) and Pepper mild mottle virus (PMMoV), which represent major concerns for pepper cultivation [28]. Resistance breeding against TSWV and PMMoV has relied largely on the dominant Tsw gene [29,30] and alleles at the L locus (L1, L1a, L2, L3 and L4), respectively [28,31]. Thus, introgressing resistance alleles into traditional cultivars represents a useful breeding strategy to promote their cultivation [32,33,34].
Despite the increasing number of studies characterizing traditional germplasm, information on Spanish sweet pepper materials under Mediterranean conditions remains limited, particularly for experimental F1 hybrids. Within this framework, our group initiated a breeding program using eleven traditional Spanish cultivars to generate experimental F1 hybrids with modern donor breeding lines, homozygous for the resistance alleles Tsw and L4. These donor lines were selected as sources of virus resistance genes, although resistance itself was not assessed in this study. The resulting hybrids and their parents were evaluated for internal fruit quality traits in two contrasting organic production environments in the Mediterranean basin: greenhouse and open-field conditions.
The traditional cultivars selected for this study represented well-recognized Spanish morphotypes, including types traditionally cultivated in Mediterranean regions [13]. Based on their origin and genetic background, we expected them to show favorable and variable performance for quality traits under Mediterranean growing conditions. We also anticipated that their hybrid combinations would retain part of the internal fruit quality associated with the traditional germplasm. Because internal fruit quality is influenced by both genotype and management conditions [35], we expected the two growing environments to elicit differential responses among at least some of the evaluated parents and hybrids, resulting in significant genotype × environment interaction effects. We also hypothesized that specific hybrid combinations could exhibit heterosis for some quality traits.
The present study assessed the entire collection for key components of internal fruit quality: sugars, vitamin C, flavonoids and carotenoids. We also evaluated trait responses between the two growing environments and quantified hybrid performance relative to parental values through mid-parent and best-parent heterosis. Together, these analyses were used to identify promising traditional genotypes and hybrid combinations between traditional germplasm and modern virus-resistance donor breeding lines with favorable internal fruit quality in the two tested organic environments.

2. Materials and Methods

2.1. Plant Material

A collection of thirteen parental genotypes, including traditional cultivars and breeding lines (Table 1), was used to obtain sixteen experimental F1 hybrids (Table 2). The traditional parents were selected to represent well-known Spanish sweet pepper materials of local or commercial relevance and diverse geographical origins, including cultivars associated with PDOs and PGIs. Some genotypes had previously been characterized for specific fruit quality traits under different conditions [36,37,38]. Hybrids were generated by crossing these traditional materials with two California Wonder-type breeding lines developed by the Capsicum breeding team at the COMAV Institute, which served as homozygous donors of Tsw and L4 resistance alleles. Controlled crosses were performed by hand under greenhouse conditions. Flowers at the appropriate developmental stage were emasculated before anthesis, manually pollinated and labelled. For each parental combination, the crossing direction used in this study was selected based on seed production feasibility under greenhouse conditions.

2.2. Experimental Design and Growing Conditions

The trials were conducted in 2022. Parents and experimental F1 hybrids were evaluated in two contrasting organic growing environments representative of pepper cultivation in the Spanish Mediterranean basin: (i) an open-field spring–summer season in Valencia and (ii) a greenhouse winter–spring season in Murcia [39]. Monthly climatic data for both trial locations were obtained from the SiAR database [40] and are summarized in Supplementary Table S1.
Trial 1 was conducted under open-field conditions at the organic farm Hortet La Masieta (Les Cases de Bàrcena, Valencia, Spain; 39°31′40.0″ N, 0°21′20.2″ W) during the spring–summer season (April–September). Trial 2 was carried out in a 300 m2 polyethylene greenhouse at the Torreblanca experimental farm of the IMIDA Institute (Torre-Pacheco, Murcia, Spain; 37°46′33.6″ N, 0°53’47.1″ W) during the winter–spring season (February–June). Both crops were managed in accordance with regulation (EU) 2018/848 on organic production and labelling of organic products [41].
In both trials, ten plants of each genotype were arranged in five independent experimental units of two plants each, randomly distributed throughout the experimental areas. Plants were supported using horizontal plastic-twine trellising, with parallel twine lines along both sides of each row. Plant spacing was 0.5 × 1.0 m in trial 1 and 0.4 × 1.0 m in trial 2. This difference reflected the standard planting layout used at each experimental site.
In trial 1, basal organic fertilization was applied using composted goat, horse and poultry manure at 3.5 kg m−2. Water was supplied by furrow irrigation and adjusted to seasonal crop demand, with a lower irrigation frequency during periods of lower evaporative demand (April–June and September) and weekly irrigation during July–August. Crop management followed the grower’s standard practices, including preventive applications of copper-based products against fungal infections and manual weed control.
In trial 2, composted manure was incorporated before transplanting at 2 kg m−2. Irrigation and fertigation were supplied through a drip irrigation system, with a total irrigation volume of approximately 2500 m3 ha−1. Total nutrient inputs over the crop cycle were 120 kg N ha−1, 50 kg P2O5 ha−1 and 240 kg K2O ha−1, using products authorized for organic production. Crop protection relied on biological control and preventive measures, including sulfur applications, colored sticky traps and mass-trapping systems. Greenhouse temperature was managed through natural ventilation.

2.3. Fruit Analysis

2.3.1. Sample Preparation

Peppers were harvested at the fully ripe stage, defined as firm fruits with uniform red coloration. For each genotype × environment combination, five biological replicates were prepared, corresponding to the five independent experimental units. Each replicate consisted of a pooled sample of six to eight fruits collected from the two plants within each experimental unit, with at least three fruits per plant. After harvest, fruits were immediately transported to the laboratory, washed and deseeded.
Each replicate was divided into two subsamples. One subsample was freeze-dried using a VirTis Genesis unit (SP Scientific, Warminster, PA, USA). Fresh and dry masses were recorded before and after lyophilization. The dried peppers were ground to a fine powder using a ML130 domestic grinder (Jata, Tudela, Spain) and stored in plastic tubes under dark and dry conditions until flavonoid and carotenoid analyses. The second subsample was homogenized into a liquid extract using a BAPI 1000 PLUS INOX domestic blender (Taurus, Oliana, Spain) and stored at −80 °C until sugar and vitamin C analyses.

2.3.2. Sugar Analysis

Fructose, glucose and sucrose were quantified by high-performance liquid chromatography (HPLC) using an Agilent 1220-Infinity LC System (Agilent Technologies, Santa Clara, CA, USA), following the protocol of Rosa-Martínez et al. [42], with minor modifications. Liquid extracts were centrifuged at 12,000 rpm for 5 min, and the supernatant was diluted 1:4 (v/v) with Milli-Q® water. Samples were homogenized, centrifuged and filtered using a 0.20 µm Phenex-Regenerated Cellulose 15 mm syringe filter (Phenomenex, Torrance, CA, USA).
The HPLC system was equipped with an autosampler and a binary pump. Separation was achieved on a Luna Omega SUGAR LC column (3 µm, 150 × 4.6 mm; Phenomenex, Torrance, CA, USA) under isocratic conditions using acetonitrile:water (75:25, v/v) as the mobile phase at 0.8 mL min−1. Column temperature was set at 35 °C and the injection volume was 10 µL. Sugars were detected with a Varian ProStar 350 RI detector (Varian, Palo Alto, CA, USA) and quantified using calibration curves prepared with external standards of glucose (≥99.5%), fructose (≥99%) and sucrose (≥99.5%) (Sigma-Aldrich, St. Louis, MO, USA). Total sugars were calculated as the sum of glucose, fructose and sucrose, and expressed as g kg−1 fresh mass (FM). Sucrose was included in total sugars but not considered as an individual variable because its concentration was negligible in most samples and showed a high proportion of zero values.

2.3.3. Vitamin C Analysis

Total vitamin C, calculated as the sum of ascorbic acid and dehydroascorbic acid, was determined using an Agilent 1220-Infinity LC System, following the protocol of Chebrolu et al. [43]. Liquid extracts were centrifuged at 12,000 rpm for 5 min at 4 °C. The supernatant was diluted 1:4 (v/v) in 3% metaphosphoric acid (Acros Organics, Geel, Belgium), homogenized, centrifuged and filtered through a 0.20 µm Phenex-RC 15 mm syringe filter (Phenomenex, Torrance, CA, USA). Samples were reduced with 5 mM Tris(2-carboxyethyl)phosphine hydrochloride (Sigma-Aldrich, St. Louis, MO, USA) to convert dehydroascorbic acid into ascorbic acid and quantify total vitamin C.
Separation was carried out on a Brisa LC2 C18 column (3 µm; 150 × 4.6 mm; Teknokroma, Barcelona, Spain), and compounds were detected at 254 nm using the integrated UV-Vis detector of the HPLC system under isocratic conditions for 15 min. The mobile phase consisted of methanol and HPLC-grade water containing 1% acetic acid (5:95, v/v). A flow rate of 1 mL min−1 and an injection volume of 5 µL were used. Quantification was based on a calibration curve prepared with an external standard of ascorbic acid (99%) (Sigma-Aldrich, St. Louis, MO, USA) and expressed as mg kg−1 FM.

2.3.4. Flavonoid Analysis

The flavonoids quercetin, luteolin, apigenin and kaempferol were quantified using the Agilent 1220-Infinity LC System, according to Bae et al. [44], with minor modifications. A 0.1 g portion of each freeze-dried sample was extracted with methanol:water (80:20, v/v) containing 0.1% (w/v) 2,6-di-tert-butyl-4-methylphenol (Fluka Analytical, Buchs, Switzerland) and sonicated for 1 h at 40 °C in an Elmasonic Select ultrasonic bath (Elma, Singen, Germany). Samples were centrifuged at 10,000 rpm for 5 min. Flavonoid glycosides were hydrolyzed to their aglycones by adding 3 M HCl (2:1, v/v) and incubating for 1 h at 95 °C in a dry block heater (J.P. SELECTA®, Barcelona, Spain). Samples were centrifuged at 7000 rpm for 5 min and filtered with a 0.20 µm Econofltr PTFE 13 mm syringe filter (Agilent Technologies, Santa Clara, CA, USA).
Separation was carried out on a Brisa LC2 C18 column (3 µm; 150 × 4.6 mm; Teknokroma, Barcelona, Spain), and compounds were detected by UV-Vis at 360 nm. Column temperature was set at 30 °C and the injection volume was 10 µL. The mobile phase consisted of HPLC-grade water containing 0.1% formic acid (A) and HPLC-grade methanol containing 0.1% formic acid (B), delivered at 0.8 mL min−1. A 20 min gradient was applied as follows: a linear gradient of 40–100% B (0–10 min), 100% B (10–15 min), and a linear gradient of 100–40% B (15–20 min). Quantification was performed using calibration curves prepared with external standards of quercetin (≥95%), luteolin (98%), kaempferol (97%) and apigenin (95%) (Sigma-Aldrich, St. Louis, MO, USA). Total flavonoids were calculated as the sum of the quantified individual flavonoids and expressed as mg kg−1 FM.

2.3.5. Carotenoid Analysis

Red and yellow-orange carotenoids were determined spectrophotometrically following the method of Hornero-Méndez and Mínguez-Mosquera [45], with modifications. A 0.1 g portion of each freeze-dried sample was extracted with 20 mL acetone (ITW Reagents, Monza, Italy) for 1 h at 200 rpm in the dark using an Orbital Vibrax shaker (OVAN, Barcelona, Spain). Extracts were filtered through 0.11 mm FILTER-LAB® filter paper (Filtros Anoia, Barcelona, Spain) and brought to a final volume of 25 mL with acetone.
Absorbance was measured at 472 nm (Δ472) and 508 nm (Δ508) using a BioTek Epoch 2 microplate spectrophotometer (Agilent BioTek, Agilent Technologies, Santa Clara, CA, USA). Red and yellow-orange carotenoids were calculated according to the following equations:
R e d   c a r o t e n o i d s µ g   m L 1 = 508 · 2144 472 · 403.3 270.9
Y e l l o w o r a n g e   c a r o t e n o i d s µ g   m L 1 = 472 · 1724.3 508 · 2450.1 270.9
Total carotenoids were calculated as the sum of red and yellow-orange carotenoids and expressed as mg kg−1 FM. According to this method, the red fraction is mainly associated with capsanthin and capsorubin, whereas the yellow-orange fraction mainly includes β-carotene, β-cryptoxanthin, and zeaxanthin, among others [45]. The method estimates the concentrations of the two carotenoid fractions but does not allow the identification or quantification of individual compounds.

2.4. Statistical Analyses

All statistical analyses were performed in R v.4.5.2 [46], using functions from the base R ‘stats’ package unless otherwise stated. Potentially unusual observations were screened within each trait × genotype × environment combination using Tukey’s 1.5 × IQR criterion as an initial diagnostic and by inspecting dispersion among replicates. Only a limited number of individually reviewed values were treated as missing without imputation. This affected 0–5% of the observations for each trait and 1% of the complete dataset, with at least four biological replicates retained per combination.
For total sugars, vitamin C, total flavonoids and total carotenoids, two-way analyses of variance (ANOVAs) were performed including genotype (G), environment (E) and their interaction (G × E). Environment referred to the two contrasting composite organic growing environments, open-field cultivation in Les Cases de Bàrcena, Valencia, during spring–summer, and greenhouse cultivation in Torre-Pacheco, Murcia, during winter–spring. Linear models were fitted using the lm function, and Type III sums of squares were obtained using the Anova function from the ‘car’ package v.3.1-3 [47], with sum-to-zero contrasts. Genotype effects were also assessed separately within each environment using one-way ANOVAs fitted with the aov function. Residual normality was evaluated using Q–Q plots and the Shapiro–Wilk test. Total flavonoid content was natural-log transformed before analysis, whereas the remaining traits were analyzed on the original scale. Descriptive values were reported on the original scale.
For each trait and environment, group summaries (hybrid mean, parent mean and global mean) were reported as mean ± standard error (SE), together with the coefficient of variation (CV, %). Differences between environments within each group were evaluated using two-sided t-tests with the t.test function.
Genotype responses to the two environments were described using regression coefficients (β), following the methods described by Ribes-Moya et al. [36] and Rodríguez-Burruezo et al. [48]. Genotype β coefficients and their significance against zero were obtained using the emtrends function from the ‘emmeans’ package v.2.0.1 [49]. Because only two environments were evaluated, β was interpreted as a descriptive measure of response to this specific environmental contrast, and values not significantly different from 0 according to the two-sided tests were considered to show limited differential response.
Mid-parent heterosis (MPH, %) and best-parent heterosis (BPH, %) were calculated separately for each hybrid and environment [50]. The significance of MPH and BPH was assessed from linear models using the contrasts F1–0.5P1–0.5P2 and F1–BP, respectively, with the ‘emmeans’ package v.2.0.1 [49]. p-values were adjusted using the Benjamini–Hochberg false discovery rate (FDR) procedure.
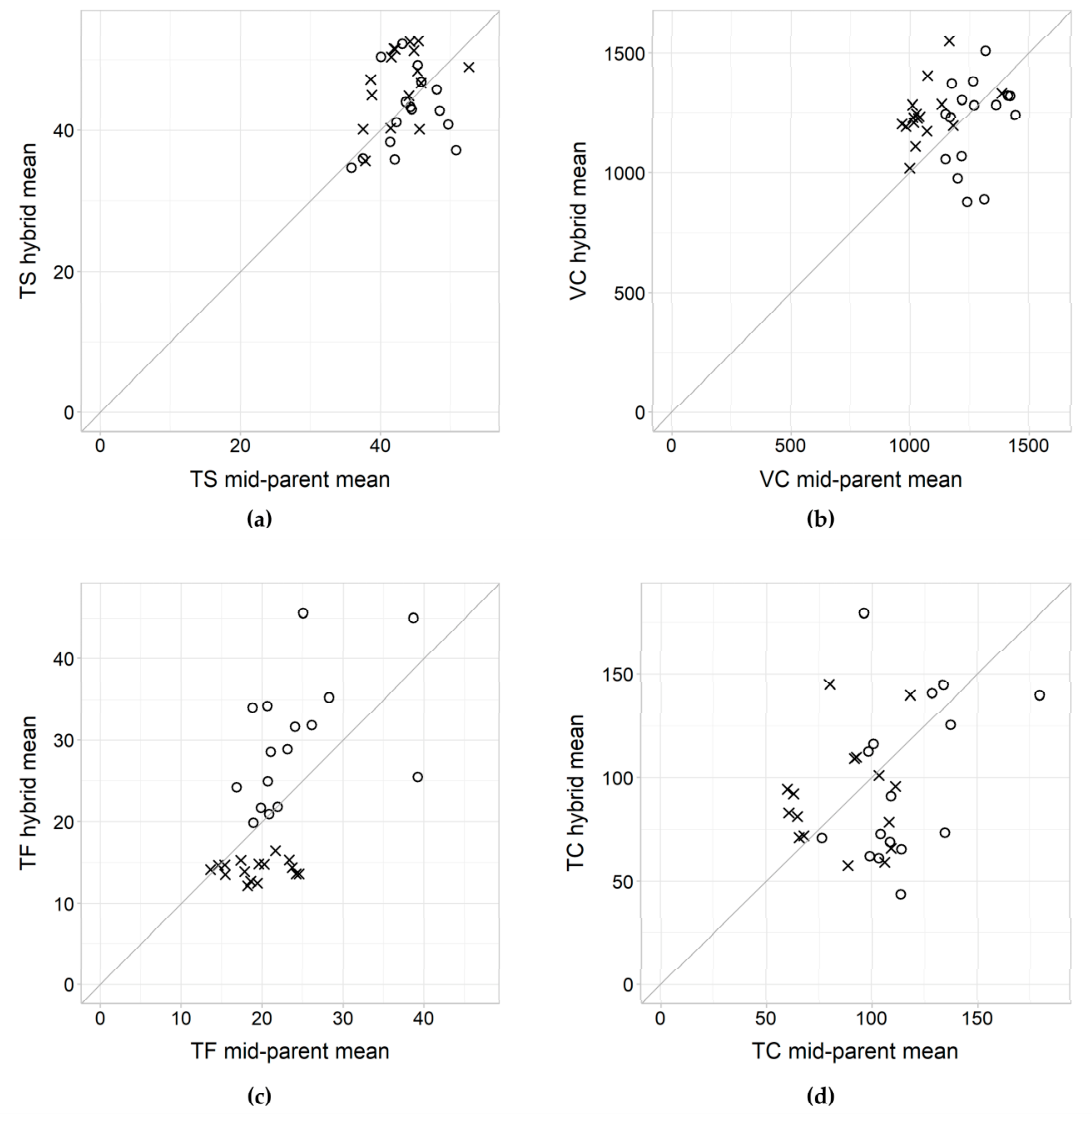
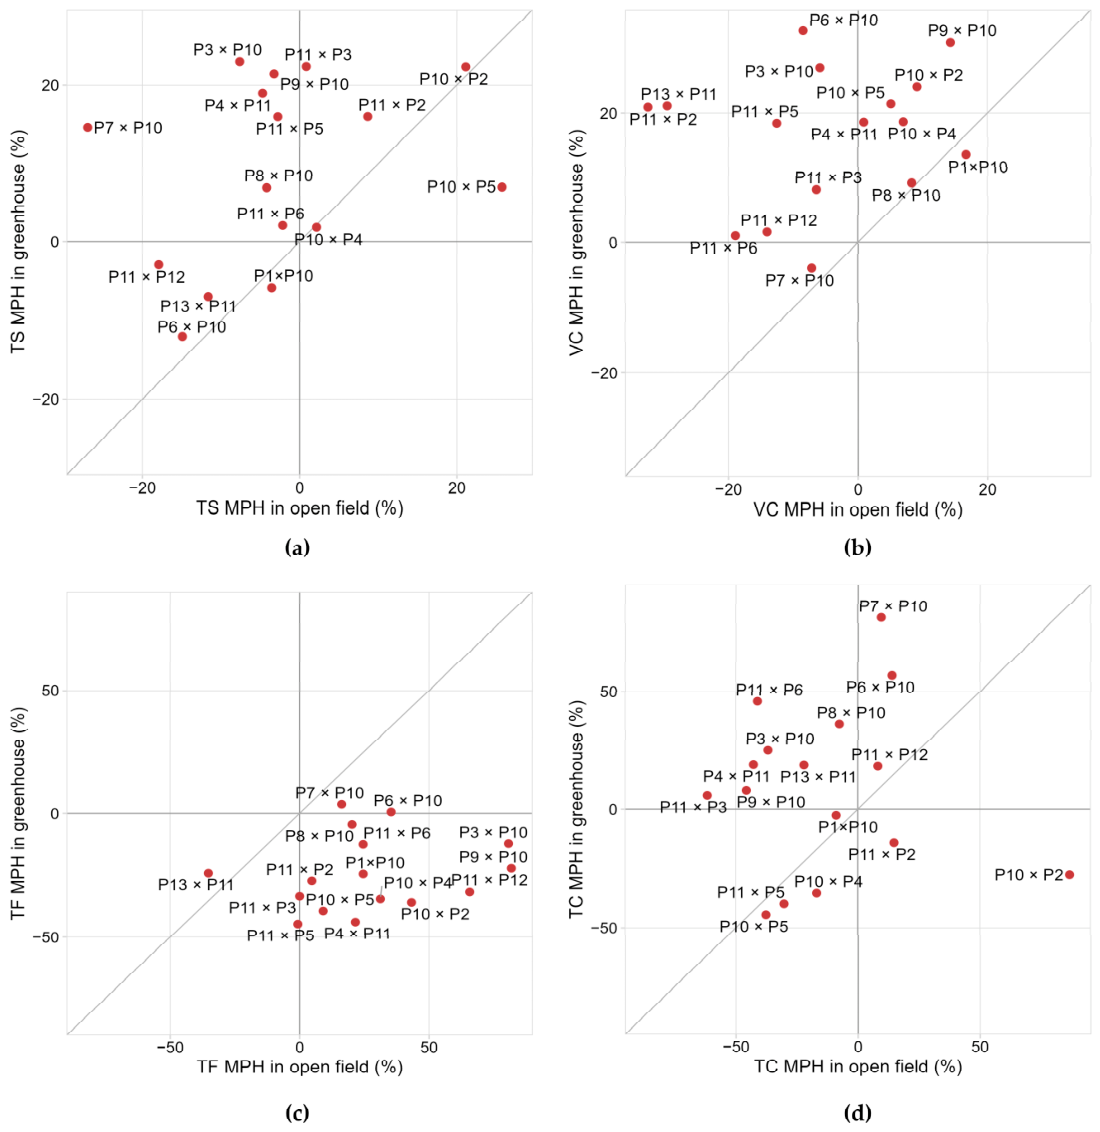
Hybrid means were plotted against their corresponding mid-parent means for each trait and environment. A slope = 1 reference line was included to identify hybrids performing above or below their mid-parent value. In addition, MPH (%) values obtained in the two environments were plotted against each other. Points close to the slope = 1 reference line indicated similar responses in both environments.
Principal component analysis (PCA) was performed separately for each environment using centered and scaled genotype means and the prcomp function. Spearman’s rank correlation coefficients (ρ) were calculated among traits within each environment using the cor.test function. Significance was evaluated using two-sided tests, and p-values were adjusted using the Benjamini–Hochberg FDR procedure. For all analyses, statistical significance was set at α = 0.05.

3. Results

3.1. Genotypic and Environmental Effects on Fruit Quality Traits

Genotype (G) had a significant effect on all evaluated traits, whereas environment (E) was significant only for total flavonoids and total carotenoids, although it explained much less variation in total carotenoids (3%) than in total flavonoids (36%) (Table 3). Variance partitioning based on the percentage of total sum of squares showed that genotype was the main source of variation for total sugars, vitamin C and total carotenoids, explaining approximately 44%, 37% and 69% of the total variation, respectively, while environment was the main contributor only for total flavonoids (Table 3). The G × E interaction was significant for all traits and made a substantial contribution to total variation, especially for vitamin C (30%), total flavonoids (23%) and total sugars (21%). Its contribution was lower for total carotenoids (16%). Residual variation ranged from 13% for total carotenoids to 35% for total sugars (Table 3). Separate ANOVAs performed for each environment confirmed a strong genotypic effect under both open-field and greenhouse conditions, explaining from approximately 64% of the variation in total sugars under greenhouse conditions to 91% in total carotenoids under open-field conditions (Table 3).

3.2. Genotypic Variability and Differential Responses Between Environments

Total sugar content consisted mainly of fructose and glucose, which accounted for an average of approximately 48.0% and 50.5% of total sugars, respectively, across both environments (Table S2). By contrast, sucrose showed a very low global mean concentration across genotypes and environments (0.67 ± 0.10 g kg−1 FM), representing approximately 1.5% of total sugars. Mean total sugar content was similar under open-field and greenhouse conditions, with global means of 44 g kg−1 FM (CV = 16%) and 45 g kg−1 FM (CV = 15%), respectively (Table 4). However, hybrids showed significantly higher mean values in the greenhouse (47 g kg−1, CV = 11%) than in the open field (43 g kg−1, CV = 13%), whereas parental means showed similar contents in both environments, averaging 45 g kg−1 (CV = 18%) and 42 g kg−1 (CV = 19%) in the open field and greenhouse, respectively. Total sugars ranged from 31 g kg−1 (P1) to 61 g kg−1 (P7) under open-field conditions, and from 32 g kg−1 (P1 and P8) to 61 g kg−1 (P13) under greenhouse conditions (Table 4). Most genotypes showed non-significant β values, indicating limited differential response between the two tested environments. Significant differential responses tended to be more frequent among parents. Notably, P2, P7 and P12 showed significantly higher values in the open field, whereas P13 showed higher values under greenhouse conditions. Among hybrids, P3 × P10, P11 × P5 and P7 × P10 highlighted for their higher sugar content in the greenhouse (Table 4).
Vitamin C content was also similar under open-field and greenhouse conditions, with global means of 1204 mg kg−1 FM (CV = 16%) and 1187 mg kg−1 FM (CV = 15%), respectively (Table 4). Hybrids averaged 1209 mg kg−1 (CV = 15%) in the open field and 1243 mg kg−1 (CV = 10%) in the greenhouse, whereas parents averaged 1197 mg kg−1 (CV = 17%) and 1119 mg kg−1 (CV = 20%), respectively. No significant differences between environments were detected for global, hybrid or parent means. Vitamin C ranged from 877 to 889 mg kg−1 (P13 × P11 and P11 × P2) to 1488–1509 mg kg−1 (P7 and P9 × P10) in the open field, and from 922 mg kg−1 (P2) to 1751 mg kg−1 (P7) in the greenhouse (Table 4). Significant β values in a subset of genotypes reflected differential responses between environments. However, most hybrids showed non-significant β values, indicating limited differential response between the two tested environments. Among the most responsive parents, P3, P10, P11 and P12 reached higher contents in the open field, whereas P6 and P7 showed higher values in the greenhouse. Among hybrids, P11 × P3 and P11 × P12 exhibited higher contents in the open field, whereas P11 × P2, P6 × P10 and P13 × P11 showed higher values in the greenhouse (Table 4).
Total flavonoid content consisted predominantly of quercetin and luteolin, followed by apigenin and kaempferol, which accounted for approximately 59.0%, 25.6%, 12.7% and 2.7%, respectively, across both environments (Table S3). Quercetin, apigenin and kaempferol generally reached higher concentrations in the open field, whereas luteolin showed a more variable response and reached higher values in the greenhouse for several genotypes (Table S3). Total flavonoid content was significantly higher in the open field than in the greenhouse, with global means of 30.1 mg kg−1 FM (CV = 37%) and 17.3 mg kg−1 FM (CV = 32%), respectively (Table 5). Hybrids showed significantly higher mean values in the open field (29.6 mg kg−1, CV = 27%) than in the greenhouse (14.2 mg kg−1, CV = 8%), while parents followed the same trend, averaging 30.6 mg kg−1 (CV = 48%) and 21.1 mg kg−1 (CV = 31%), respectively. Total flavonoids ranged from 16.1 mg kg−1 (P10) to 58.3–61.3 mg kg−1 (P13 and P7) in the open field, and from 12.2 to 12.4 mg kg−1 (P11 × P3 and P7) to 31.8–32.6 mg kg−1 (P4 and P5) in the greenhouse (Table 5). Many genotypes showed significant β values, indicating marked differential responses and a general tendency toward higher flavonoid accumulation in the open-field environment. Notably, P7, P9 × P10 and P7 × P10 stood out for their higher values in the open field than in the greenhouse, whereas only a few genotypes, such as P2 and P5, showed higher values in the greenhouse (Table 5).
Red carotenoids accounted for approximately 76.7% of total carotenoid content, whereas yellow-orange carotenoids represented the remaining 23.3% (Table S4). Total carotenoid content was similar under open-field and greenhouse conditions, with global means of 120 mg kg−1 FM (CV = 45%) and 104 mg kg−1 FM (CV = 40%), respectively (Table 5). Hybrids averaged 98 mg kg−1 (CV = 40%) in the open field and 91 mg kg−1 (CV = 28%) in the greenhouse, whereas parents showed significantly higher values in the open field (148 mg kg−1, CV = 39%) than in the greenhouse (119 mg kg−1, CV = 43%). Total carotenoids ranged from 44 to 62 mg kg−1 (P11 × P3, P11 × P6 and P10 × P5) to 273 mg kg−1 (P13) in the open field, and from 38 to 44 mg kg−1 (P10 and P11) to 192 mg kg−1 (P13) in the greenhouse (Table 5). As observed for total flavonoids, although less markedly, many genotypes showed significant β values, particularly in the parental group. Among the most responsive genotypes, P10 × P2 and P9 showed higher carotenoid contents in the open field, whereas only a few genotypes, such as P2 and P5, accumulated higher contents in the greenhouse (Table 5).
Overall, the global, hybrid and parent means of the evaluated traits observed in both environments (Table 4 and Table 5), together with the regression coefficients (β), were consistent with the ANOVA results (Table 3). On the whole, the environmental effect was non-significant for total sugars and vitamin C, but significant for total flavonoids and total carotenoids. However, the significant G × E interaction detected by the ANOVA for all traits indicated that individual genotypes differed in their responses between the two growing environments, with some genotypes showing limited differential responses and others reaching higher values under either open-field or greenhouse conditions.

3.3. Heterotic Performance Across the Two Environments

As a first step, hybrid means were plotted against their corresponding mid-parent values for each trait under open-field and greenhouse conditions (Figure 1). For total sugars and vitamin C, most hybrids were distributed close to the slope = 1 line, although hybrid performance tended to be higher in the greenhouse, particularly for vitamin C (Figure 1a,b). By contrast, total flavonoids and total carotenoids showed wider dispersion around the slope = 1 line, indicating greater differences in hybrid responses between the two environments, in agreement with the significant G × E interactions (Figure 1c,d). For total flavonoids, Figure 1c also confirmed generally higher values in the open field.
In agreement with Figure 1, mid-parent heterosis (MPH, %) showed a variable pattern depending on trait and environment (Figure 2). Hybrids close to the slope = 1 line showed similar MPH values in both environments, while large deviations indicated greater differences in MPH between environments. For total sugars, most hybrids showed positive MPH in the greenhouse, with some crosses showing relatively similar responses between the two environments (Figure 2a, Table S5). In particular, P10 × P2 showed significant positive MPH values in both the open field and greenhouse (21% and 22%, respectively). In the open field, the highest positive MPH was observed for P10 × P5 (26%), whereas P7 × P10 showed the most negative value (−27%). Under greenhouse conditions, significant positive MPH was detected for P3 × P10, P11 × P3, P9 × P10 and P4 × P11 (19–23%) (Figure 2a, Table S5).
For vitamin C, positive MPH values predominated under greenhouse conditions, whereas several pronounced negative responses were observed in the open field (Figure 2b, Table S5). The highest positive values were recorded for P6 × P10 and P9 × P10 (31–33%) in the greenhouse, while the most negative values were found for P11 × P2 (−32%) and P13 × P11 (−29%) in the open field (Figure 2b, Table S5).
Total flavonoids showed an opposite pattern, with MPH being mostly positive in the open field and predominantly negative under greenhouse conditions, further indicating a marked differential response between the two environments (Figure 2c, Table S5). In the open field, the strongest positive MPH values were observed for P9 × P10 (82%), P3 × P10 (81%) and P11 × P12 (66%), among other significant positive values. Under greenhouse conditions, the most negative values were recorded for P11 × P5 (−45%), P4 × P11 (−44%) and P10 × P5 (−39%) (Figure 2c, Table S5).
Total carotenoids showed the widest dispersion of MPH values across environments. In the open field, P10 × P2 showed the highest significant positive MPH (87%), whereas marked negative values were observed for P11 × P3 (−62%), P9 × P10 (−46%) and P4 × P11 (−43%) (Figure 2d, Table S5). In the greenhouse, the highest positive MPH values were recorded for P7 × P10 (81%), P6 × P10 (57%) and P11 × P6 (46%), while negative values were observed for P10 × P5 (−44%), P11 × P5 (−40%) and P10 × P4 (−35%) (Figure 2d, Table S5).
Best-parent heterosis (BPH) was used as a stricter criterion to identify hybrids exceeding the best corresponding parent, that is, transgressive hybrids, within each environment (Table S6). Overall, BPH values were predominantly non-significant or significantly negative, indicating that the hybrids rarely outperformed the best parent for quality traits. For vitamin C and, to a lesser extent, total sugars, donor breeding lines P10 and P11 frequently served as the best parent in BPH calculations, whereas for total flavonoids and total carotenoids, the best parent was more often a traditional genotype (Table 4 and Table 5). Significant positive BPH was limited to a few cases: P10 × P5 for total sugars in the open field (25%); P3 × P10, P9 × P10, P10 × P5 and P6 × P10 for vitamin C in the greenhouse (18–26%); P11 × P12 and P3 × P10 for total flavonoids in the open field (58–63%) and P10 × P2 for total carotenoids, also under open-field conditions (54%) (Table S6).
Considering both their overall performance for quality traits and their heterotic responses, hybrids such as P10 × P2, P11 × P12 and P10 × P4 generally stood out under open-field conditions (Table 4, Table 5 and Table S5). Under greenhouse conditions, P7 × P10, P6 × P10 and P4 × P11 were among the most balanced combinations (Table 4, Table 5 and Table S5).

3.4. Multivariate Patterns of Traits and Genotypes Within Each Environment

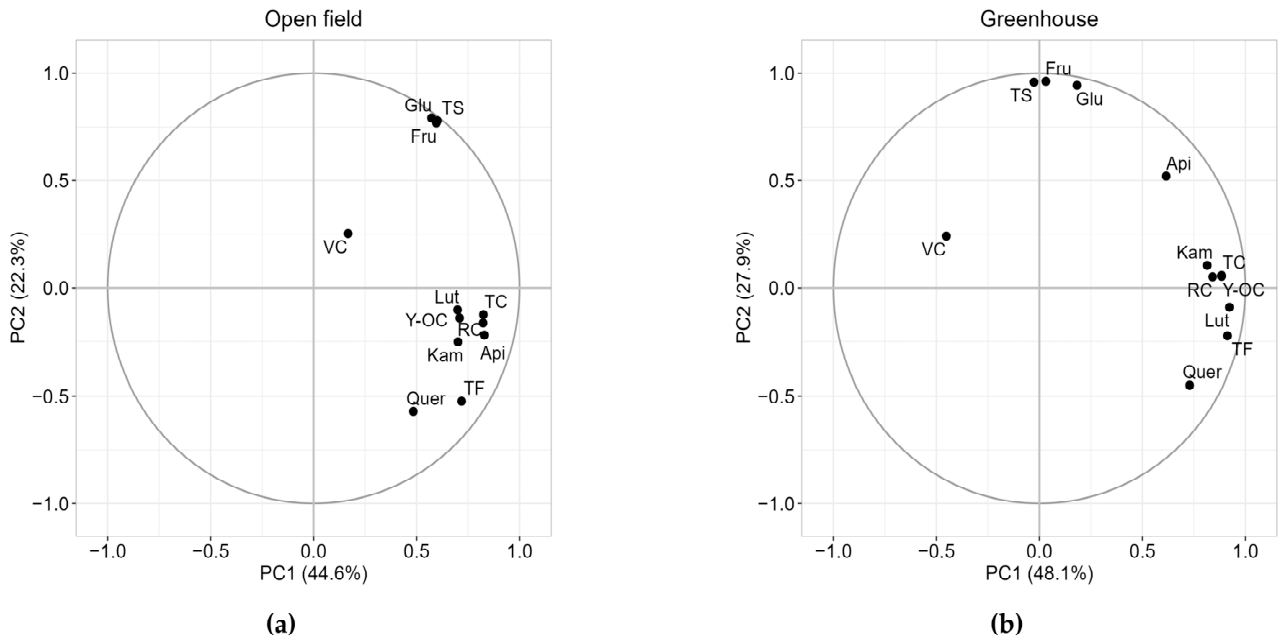
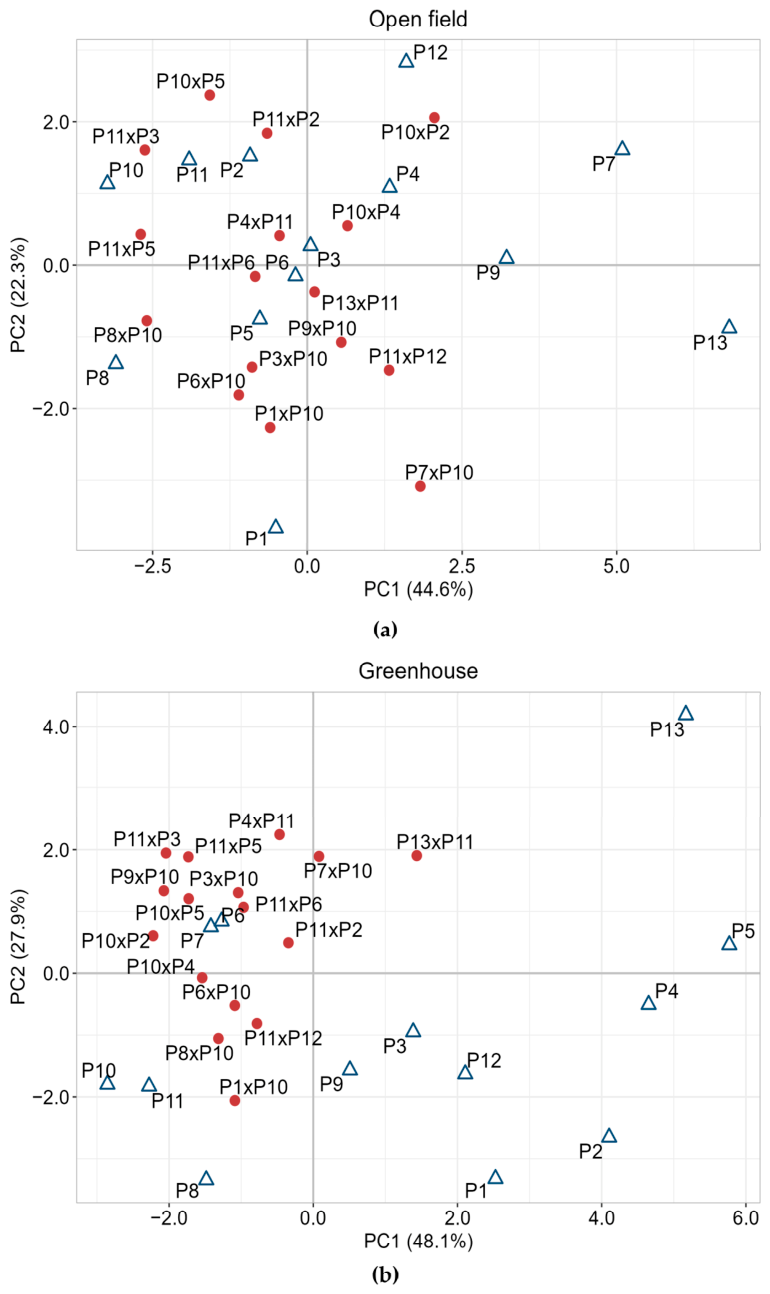
Principal component analysis (PCA) was performed separately for each environment. The first two components explained 66.9% of the total variance in the open field (PC1 = 44.6%, PC2 = 22.3%) and 76.0% in the greenhouse (PC1 = 48.1%, PC2 = 27.9%) (Figure 3 and Figure 4).
In the open field, all traits were located on the positive side of PC1, although vitamin C occupied a more isolated position, closer to the origin. PC2 separated sugar traits, located on the positive side, from flavonoid and carotenoid traits, located on the negative side (Figure 3a). In the greenhouse, PC1 separated flavonoid and carotenoid traits, located on the positive side, from vitamin C on the negative side, while PC2 was mainly associated with variation in sugars, located on the positive side (Figure 3b).
In the open field, most genotypes, including both hybrids and parents, clustered in a central region of the PCA space, although some parents were located on more extreme positions along the positive side of PC1, such as P9, P7 and P13 (Figure 4a). By contrast, under greenhouse conditions, genotype separation was more pronounced, with clearer differentiation between hybrid and parental backgrounds (Figure 4b). In both environments, the donor lines P10 and P11 clustered toward negative PC1 values, whereas highly differentiated traditional materials, especially P13, were located toward the positive PC1 extreme. Many F1 hybrids occupied intermediate positions between parental genotypes, although some crosses shifted toward more extreme positions, such as P10 × P2 and P7 × P10 in the open field and P13 × P11 in the greenhouse (Figure 4).

3.5. Correlations Among Fruit Quality Traits Within Each Environment

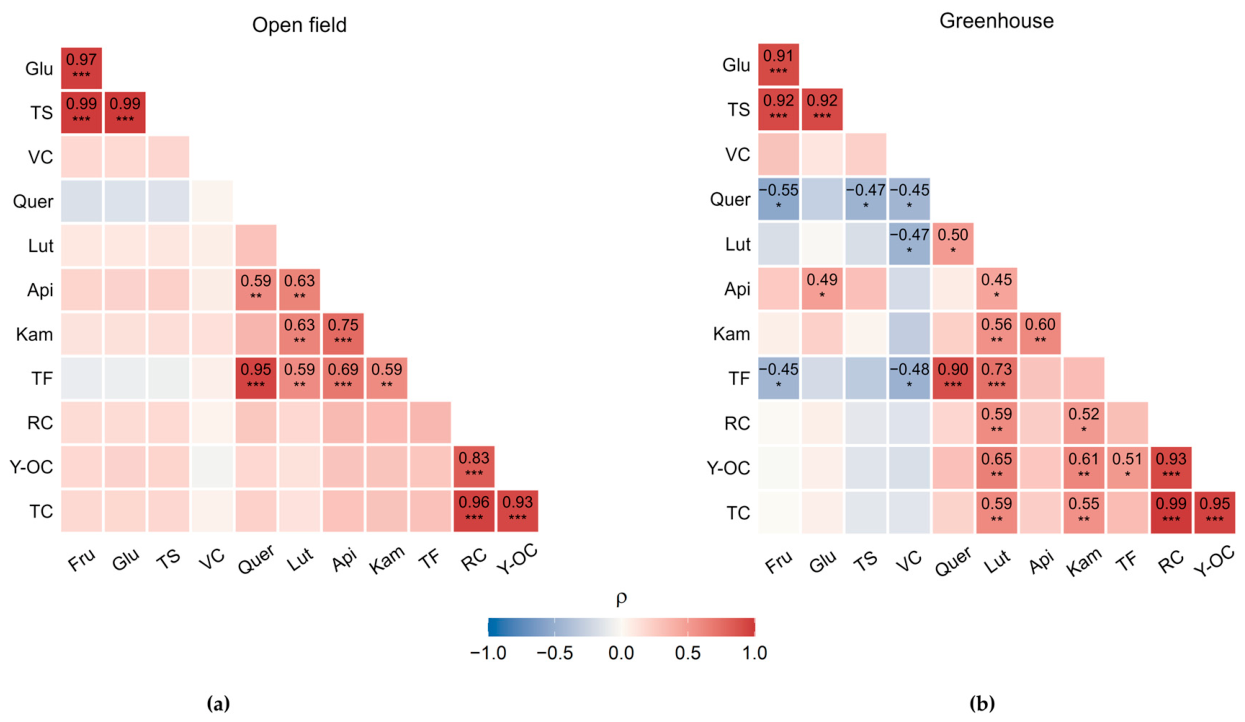
Spearman’s correlation patterns differed between environments and were more complex under greenhouse conditions (Figure 5). In the open field, significant associations were mainly restricted to compounds within the same biochemical class, including correlations between individual compounds and their corresponding total values (Figure 5a). Sugar traits showed very strong positive correlations (ρ = 0.97–0.99), flavonoids displayed positive associations over a wider range (ρ = 0.59–0.95) and carotenoids were also strongly intercorrelated (ρ = 0.83–0.96) (Figure 5a).
In the greenhouse, significant correlations included both positive and negative associations across biochemical traits (Figure 5b). Sugars remained strongly correlated with each other (ρ = 0.91–0.92) and glucose was also positively associated with apigenin (ρ = 0.49). However, negative correlations were detected between sugars and some flavonoids, particularly quercetin (ρ = −0.45 to −0.55). Vitamin C was also negatively associated with several flavonoids (ρ = −0.45 to −0.48). Within flavonoids, positive correlations were observed among individual compounds and total flavonoids (ρ = 0.45 to 0.90). In addition, luteolin, kaempferol and total flavonoids showed positive associations with carotenoid traits (ρ = 0.51–0.65). As in the open field, carotenoid fractions exhibited strong positive intercorrelations (ρ = 0.93 to 0.99) (Figure 5b).

4. Discussion

This study evaluated traditional Spanish sweet pepper germplasm as a source of variation in internal fruit quality. It also examined how this variation was expressed in hybrids derived from crosses with modern virus-resistance donor breeding lines in two organic growing environments. The genotype factor explained a large proportion of the variation in total sugars, vitamin C and total carotenoids, indicating remarkable genetic variation in the evaluated germplasm, in agreement with previous studies [14,51,52]. The effect of the environment was particularly marked for total flavonoids and, to a lesser extent, total carotenoids, suggesting that these compounds were more sensitive to growing conditions. However, total sugars and vitamin C showed no significant overall environmental effect and varied less between environments. Because the trials differed in location, season and production system, the results reflected their combined environmental influence. These trait-specific responses are consistent with the known effects of genotype, ripening stage, season, location and growing conditions on biochemical traits related to internal fruit quality [4,37,38,53,54,55].
Previous studies have reported limited environmental variation in primary metabolites such as sugars in mature peppers [37]. By contrast, vitamin C was expected to be more environmentally responsive, since ascorbic acid accumulation is often influenced by radiation, light regime, temperature and other environmental factors [56]. However, this response appears to depend strongly on genotype and specific growing conditions [57], which may explain the limited overall variation observed here despite the genotype-specific responses reflected by the significant G × E interaction.
Sucrose contributed only marginally to total sugars, as previously reported in fully ripe peppers, likely because it is progressively degraded during ripening through sucrose synthase activity. Glucose was slightly more abundant than fructose, in agreement with previous findings [37], which may reflect differences in the metabolic fate of both hexoses during fruit ripening [58]. Mean total sugar contents in the open field and the greenhouse (44–45 g kg−1) were generally comparable to those reported for a diverse collection of fully ripe peppers, including Spanish germplasm, evaluated under organic and conventional management [37]. Among the genotypes common to both studies, P6 (BGV-010582) and P13 (‘Piquillo’) showed higher contents in the present work, supporting the influence of environmental conditions [37]. Similar values have also been reported for a conventionally grown F1 hybrid [59]. However, the overall means in our collection were lower than those found in another organically grown pepper collection [42], although P7 (BGV-013004) and P13 reached comparable contents under open-field and greenhouse conditions, respectively. The relatively high residual variation detected for total sugars may partly reflect some differences in physiological maturity among fruits harvested at slightly different or visually indistinguishable developmental stages [37,60]. This variation may reduce the precision of sugar estimates when differences among genotypes are small. Nevertheless, the high contents recorded in some genotypes represented potentially useful variation for breeding programs aimed at improving fruit sweetness.
Average vitamin C content was approximately 1200 mg kg−1 in both environments. Thus, a 100 g portion of ripe pepper would provide, on average, more than 130% of the RDI for men and nearly 160% for women [8], confirming the high nutritional value of the fully ripe fruits in this collection, particularly in genotypes such as P7 and P9 × P10. The average concentrations were comparable to those reported for pepper collections that included traditional materials also represented here, such as a ‘Valenciano’ type and P13, grown under conventional and organic management [38,61]. However, higher average concentrations have been reported in other Spanish pepper collections [51], highlighting the variability still available in Spanish germplasm for future studies.
Phenylpropanoid metabolism commonly responds to light and stress conditions [62]. In particular, UV-B and oxidative-stress signaling can promote the expression of key genes in the flavonoid pathway, including those encoding enzymes like PAL (phenylalanine ammonia lyase), CHS (chalcone synthase) and FLS (flavonol synthase), thereby enhancing flavonoid accumulation [63,64]. This may partly explain the generally higher flavonoid contents observed in the open-field trial, where plants were exposed to greater solar radiation. However, individual flavonoids did not respond uniformly, as luteolin reached higher concentrations in the greenhouse in several genotypes. These compound-specific responses may reflect differential regulation of particular steps in the flavonoid biosynthetic pathway. In pepper, genetic variation in this pathway has been associated with differences in the accumulation of individual flavonoids [65]. Mean total flavonoid content ranged from 17.3 mg kg−1 in the greenhouse to 30.1 mg kg−1 in the open field. These values exceeded those reported for a commercial red hot pepper under organic and conventional management [66], but remained below the averages found in organically grown commercial fully ripe peppers [67]. Nevertheless, genotypes such as P7 × P10, P9 × P10, P13 and P7 reached comparatively high concentrations in the open field. In addition, higher flavonoid contents have also been reported for ‘Bierzo’ and ‘Piquillo’ in previous studies [36,55], further supporting the influence of environment, season and crop management on the accumulation of polyphenolic compounds in pepper.
Carotenoids are major determinants of ripe fruit color [68], a crucial trait for marketability and consumer acceptance [69]. Capsanthin and capsorubin are the main red pigments in red peppers, and their synthesis is catalyzed by capsanthin-capsorubin synthase (CCS) at the end of the carotenoid biosynthetic pathway, when the CCS gene is highly expressed during fruit ripening [70]. Light signaling also regulates carotenoid biosynthesis [71], and peppers grown under protected cultivation have been reported to show lower expression of PSY, a gene involved in carotenoid biosynthesis, than plants grown under direct light [72]. This mechanism may have contributed to the higher carotenoid contents recorded for some genotypes in the open-field trial, although contrasting responses have also been reported [73]. Average total carotenoid contents ranged from 104 to 120 mg kg−1 in our collection. These concentrations were approximately twice the mean reported for commercial red pepper cultivars under organic farming [67], but lower than those observed in a collection including traditional germplasm under the same production system [38]. Taken together, the variation observed in our collection and the broad ranges reported across other Capsicum materials could be exploited to select and develop pepper genotypes with enhanced fruit color and nutritional quality.
The significant G × E interactions suggested that environmental differences did not affect all genotypes uniformly [36,37,38]. However, because climatic data for the greenhouse trial were based on external records rather than internal greenhouse measurements (Table S1), these environmental effects should be interpreted considering this limitation. Changes in the environment, such as light conditions, can alter the expression of genes involved in starch and sucrose metabolism, ascorbate metabolism, phenylpropanoid biosynthesis and carotenoid biosynthesis in pepper fruits [74]. Thus, the responses observed in our collection, particularly for flavonoids and carotenoids, may partly reflect genetic differences in their sensitivity to environmental conditions and in the regulation of these pathways. The β coefficients suggested that, for total sugars, vitamin C and total carotenoids, several parents showed greater environmental responsiveness than hybrids. This may indicate that some hybrids performed comparatively more consistently across the two environments [75]. This pattern was not observed for total flavonoids, indicating that environmental responsiveness was trait-dependent, as also observed for other traits in maize [76].
Previous studies using local, landrace or traditional Capsicum germplasm have reported favorable hybrid performance for yield, fruit morphology or pungency [77,78]. However, heterosis remains poorly studied across a broad range of internal fruit quality traits in hybrids derived from Spanish traditional germplasm. In the present study, hybrid performance varied according to the trait, parental combination and environment [75]. Similar variability has also been reported for volatile compounds in hybrids involving Spanish traditional cultivars [79,80]. The contrasting heterotic responses observed among traits and crosses likely reflect the genetic complexity of biochemical quality traits, which are quantitatively inherited and controlled by multiple loci. QTL analyses in pepper have identified loci with different effects for these metabolites, many of them with small or moderate contribution, suggesting that their expression depends on the combined action of multiple genomic regions [81]. Accordingly, several hybrids showed intermediate values between their parents for different quality traits, as previously observed in pepper [82]. Nevertheless, some hybrid combinations displayed positive heterosis for specific traits. Positive mid-parent heterosis was more frequent than positive best-parent heterosis, indicating that hybrids more often exceeded the parental mean than the best-performing parent. Positive mid-parent and best-parent heterosis for biochemical traits has also been reported in other crops [83,84]. Thus, although heterosis may not provide a general advantage across all traits, specific parental combinations could show potential for improving selected quality attributes. However, these heterotic responses were specific to the evaluated crosses and must be interpreted with caution when predicting the performance of other combinations involving the same parental lines. Full- or half-diallel designs would be required to estimate the general and specific combining abilities of the parents and to identify promising combinations for internal fruit quality [84].
Studies of traditional and local Capsicum germplasm have revealed broad genetic, agronomic, morphological and nutritional variation [38,61,85,86], as well as differential responses to stress [87], highlighting its value as a breeding resource. Despite this diversity, the widespread adoption of a limited number of commercial F1 hybrids has progressively replaced local materials, contributing to their underuse and the loss of genetic variation [13]. The variability in internal quality traits observed in our collection further supported the genetic diversity previously documented in Spanish pepper germplasm [88]. Moreover, most materials evaluated belonged to fleshy, rectangular or conical fruit types corresponding to morphotypes highly valued in the Spanish market [13]. Together, these commercially relevant fruit types and the favorable quality profiles observed in some hybrid combinations with modern breeding lines may facilitate their incorporation into breeding programs.
The evaluated materials generated hybrids with distinct and potentially useful quality profiles despite sharing a common geographic area and a relatively close genetic background [85]. Traditionally, heterosis has been associated with crosses between genetically divergent parents, based on the assumption that greater genetic distance may increase the likelihood of heterotic responses [89]. However, this relationship remains unclear, since several studies in different crops, including peppers, do not show a consistent correlation between parental genetic distance and heterosis for the evaluated traits [90,91,92].
PCA provided an integrated view of internal fruit quality within each environment, as previously reported for biochemical traits in pepper fruits under contrasting growing conditions [93]. The observed patterns indicated that genetic background contributed to the differentiation of genotypes according to their quality profiles [36], while environmental conditions modulated quality profiles and genotype distribution without completely altering the overall structure. Overall, PCA highlighted differences among genotypes and changes in their quality profiles between environments [75].
Correlation analysis provided additional insight into the relationships among biochemical traits. In the open field, significant associations were mainly restricted to compounds within the same biochemical class. Limited associations of vitamin C and carotenoids with other biochemical traits have also been reported in pepper [54]. In contrast, the correlation pattern was more interconnected in the greenhouse environment. Positive associations between yellow-orange carotenoids and some polyphenolic compounds have previously been reported in pepper, although correlations involving vitamin C differed from those found in our study [94]. Thus, relationships within and among primary and secondary metabolites appeared to be modulated by both genotype and growing environment [36,75,95].
Overall, our results showed that crosses between traditional germplasm and modern donor breeding lines could retain or improve favorable internal fruit quality profiles in some combinations. The responses depended on trait, genotype and growing environment, highlighting both traditional parents and hybrid combinations of potential interest for breeding under organic conditions.

5. Conclusions

The variation observed in this study supported the breeding value of traditional Spanish sweet pepper germplasm and its experimental F1 hybrids for internal fruit quality under the two Mediterranean organic environments tested. As expected, responses differed among traits and environments. Total sugars and vitamin C showed smaller overall differences between the two conditions, whereas flavonoids and carotenoids were more responsive and generally reached higher contents in the open-field trial. Significant G × E interactions also revealed genotype-specific responses that may help identify materials performing particularly well in each evaluated environment.
Among the traditional genotypes, P7 (BGV-013004) and P13 (‘Piquillo’) stood out for their favorable quality profiles. Some hybrids retained or improved internal fruit quality traits, and positive heterosis occurred more frequently relative to the mid-parent than to the best parent. Among the experimental hybrids, preliminary, promising combinations included P10 × P2, P11 × P12 and P10 × P4 for internal quality in the open-field trial, and P7 × P10, P6 × P10 and P4 × P11 for balanced quality profiles in the tested greenhouse environment.
Overall, the results obtained supported the value of traditional Spanish germplasm both as a source of favorable quality traits and as parental material for generating useful hybrids with modern donor breeding lines. Future multi-location and multi-year evaluations integrating agronomic traits, such as yield, marketable production and fruit number, will be required to confirm the performance and broader breeding value of the most promising parents and hybrids under organic growing conditions.

Supplementary Materials

The following supporting information can be downloaded at: https://www.mdpi.com/article/10.3390/agriculture16131431/s1, Table S1. Monthly climatic conditions during the cultivation periods at the Valencia and Murcia trial locations in 2022. Table S2: Mean content of fructose and glucose (g kg−1 FM) in fully ripe fruits of the evaluated F1 hybrids and parental genotypes grown under open-field and greenhouse conditions. Table S3: Mean content of quercetin, luteolin, apigenin and kaempferol (mg kg−1 FM) in fully ripe fruits of the evaluated F1 hybrids and parental genotypes grown under open-field and greenhouse conditions. Table S4: Mean content of red carotenoids and yellow-orange carotenoids (mg kg−1 FM) in fully ripe fruits of the evaluated F1 hybrids and parental genotypes grown under open-field and greenhouse conditions. Table S5: Mid-parent heterosis for total sugars (TS), vitamin C (VC), total flavonoids (TF) and total carotenoids (TC) of the evaluated F1 hybrids under open-field and greenhouse conditions. Table S6: Best-parent heterosis for total sugars (TS), vitamin C (VC), total flavonoids (TF) and total carotenoids (TC) of the evaluated F1 hybrids under open-field and greenhouse conditions.

Author Contributions

Conceptualization, A.R.-B.; methodology, M.J.-P. and M.B.; software, M.J.-P.; validation, M.B. and A.R.-B.; formal analysis, M.J.-P. and M.B.; investigation, M.J.-P. and A.R.-B.; resources, A.R.-B.; data curation, M.J.-P. and A.R.-B.; writing—original draft preparation, M.J.-P. and A.R.-B.; writing—review and editing, M.J.-P., M.B. and A.R.-B.; visualization, M.J.-P.; supervision, A.R.-B.; project administration, A.R.-B.; funding acquisition, A.R.-B. All authors have read and agreed to the published version of the manuscript.

Funding

This research was partially funded by projects PID2019-110221RR-C32 and PID2022-137735OR-C33, financed by MCIN/AEI/10.13039/501100011033/FEDER, UE. This study also received funding from the European Union’s Horizon 2020 research and innovation program under grant agreement No. 101059872-LIVESEEDING. Marisa Jiménez Pérez acknowledges her PhD grant FPU20/03486, funded by the Ministerio de Universidades and the short-stay mobility grant EST24/00126, funded by the Ministerio de Ciencia, Innovación y Universidades.

Institutional Review Board Statement

Not applicable.

Data Availability Statement

The raw data supporting the conclusions of this article will be made available by the authors on request.

Conflicts of Interest

The authors declare no conflicts of interest. The funders had no role in the design of the study; in the collection, analyses, or interpretation of data; in the writing of the manuscript; or in the decision to publish the results.

References

  1. Lučić, M.; Miletić, A.; Savić, A.; Lević, S.; Ignjatović, I.S.; Onjia, A. Dietary Intake and Health Risk Assessment of Essential and Toxic Elements in Pepper (Capsicum annuum). J. Food Compos. Anal. 2022, 111, 104598. [Google Scholar] [CrossRef] [Scilit]
  2. Zhang, J.; Wang, C.; Wang, J.; Yang, Y.; Han, K.; Bakpa, E.P.; Li, J.; Lyu, J.; Yu, J.; Xie, J. Comprehensive Fruit Quality Assessment and Identification of Aroma-Active Compounds in Green Pepper (Capsicum annuum L.). Front. Nutr. 2023, 9, 1027605. [Google Scholar] [CrossRef] [Scilit] [PubMed]
  3. Vardanian, I.; Sargsyan, G.; Martirosyan, G.; Shirvanyan, A.; Tadevosyan, L.; Avagyan, A.; Pahlevanyan, A.; Martirosyan, H.; Sukhudyan, D.; Solomonyan, A.; et al. Comprehensive Agrobiological and Biochemical Study of Sweet Pepper (Capsicum annuum L.) Varieties. Funct. Food Sci. 2025, 5, 205–222. [Google Scholar] [CrossRef] [Scilit]
  4. Sanatombi, K. Antioxidant Potential and Factors Influencing the Content of Antioxidant Compounds of Pepper: A Review with Current Knowledge. Compr. Rev. Food Sci. Food Saf. 2023, 22, 3011–3052. [Google Scholar] [CrossRef] [Scilit] [PubMed]
  5. Alberts, A.; Moldoveanu, E.-T.; Niculescu, A.-G.; Grumezescu, A.M. Vitamin C: A Comprehensive Review of Its Role in Health, Disease Prevention, and Therapeutic Potential. Molecules 2025, 30, 748. [Google Scholar] [CrossRef] [Scilit] [PubMed]
  6. Zheng, X.; Zhang, X.; Zeng, F. Biological Functions and Health Benefits of Flavonoids in Fruits and Vegetables: A Contemporary Review. Foods 2025, 14, 155. [Google Scholar] [CrossRef] [Scilit] [PubMed]
  7. Roy, S.; Dora, K.C.; Kumar, S.; Saklani, P.; Muthukumar, A.; Ozogul, F.; Harisankar, K.C.; Mutum, R.D.; Mary, S.C.H.; Surasani, V.K.R.; et al. A Critical Review on Technical Advances and Multifaceted Role of Carotenoids in Human Health with Special Emphasis on Metabolic Diseases. Phytochem. Rev. 2025, 25, 1067–1092. [Google Scholar] [CrossRef] [Scilit]
  8. Dwyer, J.T.; Melanson, K.J.; Sriprachy-anunt, U.; Cross, P.; Wilson, M. Dietary Treatment of Obesity. In Endotext; Feingold, K.R., Adler, R.A., Ahmed, S.F., Eds.; MDText.com, Inc.: South Dartmouth, MA, USA, 2015. [Google Scholar]
  9. Wahyuni, Y.; Ballester, A.-R.; Sudarmonowati, E.; Bino, R.J.; Bovy, A.G. Secondary Metabolites of Capsicum Species and Their Importance in the Human Diet. J. Nat. Prod. 2013, 76, 783–793. [Google Scholar] [CrossRef] [Scilit] [PubMed]
  10. Andrews, J. Peppers: The Domesticated Capsicums; University of Texas Press: Austin, TX, USA, 1995; ISBN 978-0-292-70467-1. [Google Scholar]
  11. Nuez Viñals, F.; Gil Ortega, R.; Costa García, J. El Cultivo de Pimientos, Chiles y Ajies; Ediciones Mundi-Prensa: Madrid, Spain, 1996; ISBN 978-84-7114-609-0. [Google Scholar]
  12. González-Pérez, S.; Garcés-Claver, A.; Mallor, C.; Sáenz de Miera, L.E.; Fayos, O.; Pomar, F.; Merino, F.; Silvar, C. New Insights into Capsicum spp. Relatedness and the Diversification Process of Capsicum annuum in Spain. PLoS ONE 2014, 9, e116276. [Google Scholar] [CrossRef] [Scilit] [PubMed]
  13. Rodríguez, A.; Pereira, L.; Fita, A.M. Pimiento. In Las variedades locales en la mejora genética de plantas; Servicio Central de Publicaciones del Gobierno Vasco: Vitoria-Gasteiz, Spain, 2016; pp. 405–426. ISBN 978-84-457-3395-0. [Google Scholar]
  14. Pereira-Dias, L.; Fita, A.; Vilanova, S.; Sánchez-López, E.; Rodríguez-Burruezo, A. Phenomics of Elite Heirlooms of Peppers (Capsicum annuum L.) from the Spanish Centre of Diversity: Conventional and High-Throughput Digital Tools towards Varietal Typification. Sci. Hortic. 2020, 265, 109245. [Google Scholar] [CrossRef] [Scilit]
  15. Ministerio de Agricultura, Pesca y Alimentación. Listado de Denominaciones de Origen Protegidas (DOP), Indicaciones Geográficas Protegidas (IGP) y Especialidades Tradicionales Garantizadas (ETG) Españolas Registradas En La Unión Europea. Available online: https://www.mapa.gob.es/es/dam/jcr:fdf0c8b7-f92c-404b-ba48-0868c79cb514/04_igs_por_ccaa.pdf (accessed on 20 February 2026).
  16. Hamdan, M.F.; Mohd Noor, S.N.; Abd-Aziz, N.; Pua, T.-L.; Tan, B.C. Green Revolution to Gene Revolution: Technological Advances in Agriculture to Feed the World. Plants 2022, 11, 1297. [Google Scholar] [CrossRef] [Scilit] [PubMed]
  17. Farinati, S.; Scariolo, F.; Palumbo, F.; Vannozzi, A.; Barcaccia, G.; Lucchin, M. Heterosis in Horticultural Crop Breeding: Combining Old Theoretical Bases with Modern Genomic Views. Front. Hortic. 2023, 2, 1250875. [Google Scholar] [CrossRef] [Scilit]
  18. Martínez-Ispizua, E.; Calatayud, Á.; Marsal, J.I.; Mateos-Fernández, R.; Díez, M.J.; Soler, S.; Valcárcel, J.V.; Martínez-Cuenca, M.-R. Phenotypic Divergence among Sweet Pepper Landraces Assessed by Agro-Morphological Characterization as a Biodiversity Source. Agronomy 2022, 12, 632. [Google Scholar] [CrossRef] [Scilit]
  19. Lara, S.W. Forgotten Crops, Future Crops? Perspectives and Potential of Minor Varieties and Underutilised Crops in Diversified Food Systems. Transl. Food Sci. 2025, 1, vxaf016. [Google Scholar] [CrossRef] [Scilit]
  20. Bibi, F.; Rahman, A. An Overview of Climate Change Impacts on Agriculture and Their Mitigation Strategies. Agriculture 2023, 13, 1508. [Google Scholar] [CrossRef] [Scilit]
  21. Apoorva, M.S.; Kundlas, K. Negative Impacts of Intensive Agricultural Practices on Environment and Ecosystem: A Review. Int. J. Res. Agron. 2024, 7, 285–289. [Google Scholar] [CrossRef] [Scilit]
  22. Ray, A. The Decline of Agrobiodiversity: Process of Crop Improvement, Consequent Homogenization, and Impacts. In Emerging Solutions in Sustainable Food and Nutrition Security; Ghosh, S., Kumari Panda, A., Jung, C., Singh Bisht, S., Eds.; Springer International Publishing: Cham, Switzerland, 2023; pp. 79–121. ISBN 978-3-031-40908-0. [Google Scholar]
  23. Calvet-Mir, L.; Benyei, P.; Porcuna-Ferrer, A.; Aceituno-Mata, L.; Braga Junqueira, A.; Mattalia, G.; Miñarro, S.; Reyes-García, V.; Schlingmann, A.; Vieira da Cunha Ávila, J.; et al. Landraces and Climate Change: Global Trends through the Lens of Political Agroecology. Agric. Hum. Values 2025, 42, 1307–1321. [Google Scholar] [CrossRef] [Scilit]
  24. Pietrusińska-Radzio, A.; Bolc, P.; Tratwal, A.; Dziubińska, D. The Role of Plant Genetic Resources and Grain Variety Mixtures in Building Sustainable Agriculture in the Context of Climate Change. Sustainability 2025, 17, 9737. [Google Scholar] [CrossRef] [Scilit]
  25. Dwivedi, S.; Goldman, I.; Ortiz, R. Pursuing the Potential of Heirloom Cultivars to Improve Adaptation, Nutritional, and Culinary Features of Food Crops. Agronomy 2019, 9, 441. [Google Scholar] [CrossRef] [Scilit]
  26. van Zonneveld, M.; Ramirez, M.; Williams, D.E.; Petz, M.; Meckelmann, S.; Avila, T.; Bejarano, C.; Ríos, L.; Peña, K.; Jäger, M.; et al. Screening Genetic Resources of Capsicum Peppers in Their Primary Center of Diversity in Bolivia and Peru. PLoS ONE 2015, 10, e0134663. [Google Scholar] [CrossRef] [Scilit] [PubMed]
  27. Calvet-Mir, L.; Calvet-Mir, M.; Vaqué-Nuñez, L.; Reyes-García, V. Landraces in Situ Conservation: A Case Study in High-Mountain Home Gardens in Vall Fosca, Catalan Pyrenees, Iberian Peninsula. Econ. Bot. 2011, 65, 146–157. [Google Scholar] [CrossRef] [Scilit]
  28. Velasco, L.; Ruiz, L.; Galipienso, L.; Rubio, L.; Janssen, D. A Historical Account of Viruses in Intensive Horticultural Crops in the Spanish Mediterranean Arc: New Challenges for a Sustainable Agriculture. Agronomy 2020, 10, 860. [Google Scholar] [CrossRef] [Scilit]
  29. Macedo, M.A.; Rojas, M.R.; Gilbertson, R.L. First Report of a Resistance-Breaking Strain of Tomato Spotted Wilt Orthotospovirus Infecting Sweet Pepper with the Tsw Resistance Gene in California, U.S.A. Plant Dis. 2019, 103, 1048. [Google Scholar] [CrossRef] [Scilit]
  30. Gautam, S.; Workneh, F.; Chinnaiah, S.; Rush, C.M.; Xue, Q.; Anderson, N.R.; Crosby, K.M.; Gadhave, K.R. Tsw-Resistant Pepper Cultivars Offer Limited Protection Against Resistance-Breaking Isolates of Tomato Spotted Wilt Virus. Plant Health Prog. 2025, 26, 170–176. [Google Scholar] [CrossRef] [Scilit]
  31. Jeyaraj, G.; Jayanthi, P.; Neha Angelin, F.; Nikeshun, V.; Ramesh, S.J.; Swapna Geetanjali, A. Pepper Mild Mottle Virus. In Compendium of Phytopathogenic Microbes in Agro-Ecology: Vol. 2 Viruses and Viroids; Amaresan, N., Kumar, K., Eds.; Springer Nature Switzerland: Cham, Switzerland, 2025; pp. 243–263. ISBN 978-3-031-81884-4. [Google Scholar]
  32. Sánchez, A.; Cava, J.; Hernández, V.; Flores, P.; García-Martínez, S.; Carbonell, P.; Sánchez, E.; López, N.; Molina, E.; Fenoll, J.; et al. Effect of Tm-2a, Sw-5 and Ty-1 Gene Introduction on the Agronomic Performance and Metabolic Profile of Traditional Muchamiel-Type Tomato Varieties. Horticulturae 2025, 11, 838. [Google Scholar] [CrossRef] [Scilit]
  33. Barbieri, M.; Acciarri, N.; Sabatini, E.; Sardo, L.; Accotto, G.P.; Pecchioni, N. Introgression of Resistance to Two Mediterranean Virus Species Causing Tomato Yellow Leaf Curl into a Valuable Traditional Tomato Variety. J. Plant Pathol. 2010, 92, 485–493. [Google Scholar]
  34. Hore, T.K.; Inabangan-asilo, M.A.; Wulandari, R.; Latif, M.A.; Nihad, S.A.I.; Hernandez, J.E.; Gregorio, G.B.; Dalisay, T.U.; Diaz, M.G.Q.; Ch, B.; et al. Introgression of Tsv1 Improves Tungro Disease Resistance of a Rice Variety BRRI Dhan71. Sci. Rep. 2022, 12, 18820. [Google Scholar] [CrossRef] [Scilit] [PubMed]
  35. Tivalli, M.; Kusumiyati, K.; Anwar, S. Biochemical Quality of Green-Harvested Chili: Effects of Cultivation Structures, Watering Applications, and Cultivars Diversity. Cogent Food Agric. 2026, 12, 2651497. [Google Scholar] [CrossRef] [Scilit]
  36. Ribes-Moya, A.M.; Adalid, A.M.; Raigón, M.D.; Hellín, P.; Fita, A.; Rodríguez-Burruezo, A. Variation in Flavonoids in a Collection of Peppers (Capsicum Sp.) under Organic and Conventional Cultivation: Effect of the Genotype, Ripening Stage, and Growing System. J. Sci. Food Agric. 2020, 100, 2208–2223. [Google Scholar] [CrossRef] [Scilit] [PubMed]
  37. Guijarro-Real, C.; Adalid-Martínez, A.M.; Pires, C.K.; Ribes-Moya, A.M.; Fita, A.; Rodríguez-Burruezo, A. The Effect of the Varietal Type, Ripening Stage, and Growing Conditions on the Content and Profile of Sugars and Capsaicinoids in Capsicum Peppers. Plants 2023, 12, 231. [Google Scholar] [CrossRef] [Scilit] [PubMed]
  38. Ribes-Moya, A.M.; Raigón, M.D.; Moreno-Peris, E.; Fita, A.; Rodríguez-Burruezo, A. Response to Organic Cultivation of Heirloom Capsicum Peppers: Variation in the Level of Bioactive Compounds and Effect of Ripening. PLoS ONE 2018, 13, e0207888. [Google Scholar] [CrossRef] [Scilit] [PubMed]
  39. Ministerio de Agricultura, Pesca y Alimentación. Encuesta Sobre Superficies y Rendimientos de Cultivos (ESYRCE). Encuesta de Marco de Áreas de España. Available online: https://www.mapa.gob.es/es/estadistica/temas/estadisticas-agrarias/agricultura/esyrce (accessed on 20 March 2026).
  40. Ministerio de Agricultura, Pesca y Alimentación. Sistema de Información Agroclimática para el Regadío (SiAR). Available online: https://servicio.mapa.gob.es/siarweb/consultaDatos/consultaDatos (accessed on 17 June 2026).
  41. European Parliament and Council of the European Union. Regulation (EU) 2018/848 of the European Parliament and of the Council of 30 May 2018 on Organic Production and Labelling of Organic Products and Repealing Council Regulation (EC) No 834/2007. Off. J. Eur. Union 2018, L 150, 1–92. Available online: https://eur-lex.europa.eu/eli/reg/2018/848/oj/eng (accessed on 17 February 2026).
  42. Rosa-Martínez, E.; García-Martínez, M.D.; Adalid-Martínez, A.M.; Pereira-Dias, L.; Casanova, C.; Soler, E.; Figàs, M.R.; Raigón, M.D.; Plazas, M.; Soler, S.; et al. Fruit Composition Profile of Pepper, Tomato and Eggplant Varieties Grown under Uniform Conditions. Food Res. Int. 2021, 147, 110531. [Google Scholar] [CrossRef] [Scilit] [PubMed]
  43. Chebrolu, K.K.; Jayaprakasha, G.K.; Yoo, K.S.; Jifon, J.L.; Patil, B.S. An Improved Sample Preparation Method for Quantification of Ascorbic Acid and Dehydroascorbic Acid by HPLC. LWT 2012, 47, 443–449. [Google Scholar] [CrossRef] [Scilit]
  44. Bae, H.; Jayaprakasha, G.K.; Jifon, J.; Patil, B.S. Variation of Antioxidant Activity and the Levels of Bioactive Compounds in Lipophilic and Hydrophilic Extracts from Hot Pepper (Capsicum spp.) Cultivars. Food Chem. 2012, 134, 1912–1918. [Google Scholar] [CrossRef] [Scilit] [PubMed]
  45. Hornero-Méndez, D.; Mínguez-Mosquera, M.I. Rapid Spectrophotometric Determination of Red and Yellow Isochromic Carotenoid Fractions in Paprika and Red Pepper Oleoresins. J. Agric. Food Chem. 2001, 49, 3584–3588. [Google Scholar] [CrossRef] [Scilit] [PubMed]
  46. R Core Team. R: A Language and Environment for Statistical Computing, version 4.5.2; R Foundation for Statistical Computing: Vienna, Austria, 2025. Available online: https://www.R-project.org/ (accessed on 12 June 2026).
  47. Fox, J.; Weisberg, S. An R Companion to Applied Regression, 3rd ed.; Sage Publications: Thousand Oaks, CA, USA, 2019. [Google Scholar]
  48. Rodríguez-Burruezo, A.; Prohens, J.; Nuez, F. Genetic Analysis of Quantitative Traits in Pepino (Solanum muricatum) in Two Growing Seasons. J. Am. Soc. Hortic. Sci. 2002, 127, 271–278. [Google Scholar] [CrossRef] [Scilit]
  49. Lenth, R.V.; Piaskowski, J. Emmeans: Estimated Marginal Means, aka Least-Squares Means, version 2.0.1; R Package; R Foundation for Statistical Computing: Vienna, Austria, 2025. [CrossRef] [Scilit]
  50. Shrestha, S.L.; Luitel, B.P.; Kang, W.H. Heterosis and Heterobeltiosis Studies in Sweet Pepper (Capsicum annuum L.). Hortic. Environ. Biotechnol. 2011, 52, 278–283. [Google Scholar] [CrossRef] [Scilit]
  51. Martínez-Ispizua, E.; Martínez-Cuenca, M.-R.; Marsal, J.I.; Díez, M.J.; Soler, S.; Valcárcel, J.V.; Calatayud, Á. Bioactive Compounds and Antioxidant Capacity of Valencian Pepper Landraces. Molecules 2021, 26, 1031. [Google Scholar] [CrossRef] [Scilit] [PubMed]
  52. Ortega-Albero, N.; Barchi, L.; Fita, A.; Díaz, M.; Martínez, F.; Luna-Prohens, J.-M.; Rodríguez-Burruezo, A. Genetic Diversity, Population Structure, and Phylogeny of Insular Spanish Pepper Landraces (Capsicum annuum L.) through Phenotyping and Genotyping-by-Sequencing. Front. Plant Sci. 2024, 15, 1435427. [Google Scholar] [CrossRef] [Scilit] [PubMed]
  53. Lo Scalzo, R.; Campanelli, G.; Paolo, D.; Fibiani, M.; Bianchi, G. Influence of Organic Cultivation and Sampling Year on Quality Indexes of Sweet Pepper during 3 Years of Production. Eur. Food Res. Technol. 2020, 246, 1325–1339. [Google Scholar] [CrossRef] [Scilit]
  54. Tripodi, P.; Cardi, T.; Bianchi, G.; Migliori, C.A.; Schiavi, M.; Rotino, G.L.; Lo Scalzo, R. Genetic and Environmental Factors Underlying Variation in Yield Performance and Bioactive Compound Content of Hot Pepper Varieties (Capsicum annuum) Cultivated in Two Contrasting Italian Locations. Eur. Food Res. Technol. 2018, 244, 1555–1567. [Google Scholar] [CrossRef] [Scilit]
  55. Kim, E.-H.; Lee, K.M.; Lee, S.-Y.; Kil, M.; Kwon, O.-H.; Lee, S.-G.; Lee, S.-K.; Ryu, T.-H.; Oh, S.-W.; Park, S.-Y. Influence of Genetic and Environmental Factors on the Contents of Carotenoids and Phenolic Acids in Red Pepper Fruits (Capsicum annuum L.). Appl. Biol. Chem. 2021, 64, 85. [Google Scholar] [CrossRef] [Scilit]
  56. Agostini-Costa, T.D.S.; da Silva Gomes, I.; de Melo, L.A.M.P.; Reifschneider, F.J.B.; Ribeiro, C.S.D.C. Carotenoid and Total Vitamin C Content of Peppers from Selected Brazilian Cultivars. J. Food Compos. Anal. 2017, 57, 73–79. [Google Scholar] [CrossRef] [Scilit]
  57. Maharaj, R.; Arul, J.; Nadeau, P. UV-C Irradiation Effects on Levels of Enzymic and Non-Enzymic Phytochemicals in Tomato. Innov. Food Sci. Emerg. Technol. 2014, 21, 99–106. [Google Scholar] [CrossRef] [Scilit]
  58. Quinet, M.; Angosto, T.; Yuste-Lisbona, F.J.; Blanchard-Gros, R.; Bigot, S.; Martinez, J.-P.; Lutts, S. Tomato Fruit Development and Metabolism. Front. Plant Sci. 2019, 10, 01554. [Google Scholar] [CrossRef] [Scilit] [PubMed]
  59. Buczkowska, H.; Michalojc, Z. Comparison of Qualitative Traits, Biological Value, Chemical Compounds of Sweet Pepper Fruit. J. Elem. 2012, 17, 367–377. [Google Scholar] [CrossRef] [Scilit]
  60. Rathnayaka, R.M.S.M.B.; Minami, M.; Nemoto, K.; Prabandaka, S.S.; Matsushima, K. Relationship Between Water Supply and Sugar and Capsaicinoids Contents in Fruit of Chili Pepper (Capsicum annuum L.). Hortic. J. 2021, 90, 58–67. [Google Scholar] [CrossRef] [Scilit]
  61. Gerakari, M.; Ralli, P.; Giannakoula, A.; Ouzounidou, G.; Anagnostou, A.; Antoniadis, C.; Avdikos, I.D. Agronomic, Morphological, and Nutritional Characterization of Greek Traditional Pepper (Capsicum annuum L.) Landraces at Commercial and Physiological Maturity for Sustainable and Climate-Smart Vegetable Systems. Plants 2025, 14, 3164. [Google Scholar] [CrossRef] [Scilit] [PubMed]
  62. Jacobo-Velázquez, D.A.; Moreira-Rodríguez, M.; Benavides, J. UVA and UVB Radiation as Innovative Tools to Biofortify Horticultural Crops with Nutraceuticals. Horticulturae 2022, 8, 387. [Google Scholar] [CrossRef] [Scilit]
  63. Schreiner, M.; Mewis, I.; Neugart, S.; Zrenner, R.; Glaab, J.; Wiesner, M.; Jansen, M.A.K. UV-B Elicitation of Secondary Plant Metabolites. In III-Nitride Ultraviolet Emitters: Technology and Applications; Kneissl, M., Rass, J., Eds.; Springer International Publishing: Cham, Switzerland, 2015; Volume 227, pp. 387–414. ISBN 978-3-319-24100-5. [Google Scholar]
  64. Pessarakli, M. Handbook of Plant and Crop Physiology, 3rd ed.; CRC Press: Boca Raton, FL, USA, 2014; ISBN 978-1-4665-5328-6. [Google Scholar]
  65. Wu, Y.; Popovsky-Sarid, S.; Tikunov, Y.; Borovsky, Y.; Baruch, K.; Visser, R.G.F.; Paran, I.; Bovy, A. CaMYB12-like Underlies a Major QTL for Flavonoid Content in Pepper (Capsicum annuum) Fruit. New Phytol. 2023, 237, 2255–2267. [Google Scholar] [CrossRef] [Scilit] [PubMed]
  66. Kim, G.D.; Lee, Y.S.; Cho, J.-Y.; Lee, Y.H.; Choi, K.J.; Lee, Y.; Han, T.-H.; Lee, S.-H.; Park, K.-H.; Moon, J.-H. Comparison of the Content of Bioactive Substances and the Inhibitory Effects against Rat Plasma Oxidation of Conventional and Organic Hot Peppers (Capsicum annuum L.). J. Agric. Food Chem. 2010, 58, 12300–12306. [Google Scholar] [CrossRef] [Scilit] [PubMed]
  67. Hallmann, E.; Marszałek, K.; Lipowski, J.; Jasińska, U.; Kazimierczak, R.; Średnicka-Tober, D.; Rembiałkowska, E. Polyphenols and Carotenoids in Pickled Bell Pepper from Organic and Conventional Production. Food Chem. 2019, 278, 254–260. [Google Scholar] [CrossRef] [Scilit] [PubMed]
  68. Lv, J.; Zhang, R.; Mo, Y.; Zhou, H.; Li, M.; Wu, R.; Cheng, H.; Zhang, M.; Wang, H.; Hua, W.; et al. Integrative Metabolome and Transcriptome Analyses Provide Insights into Carotenoid Variation in Different-Colored Peppers. Int. J. Mol. Sci. 2023, 24, 16563. [Google Scholar] [CrossRef] [Scilit] [PubMed]
  69. Di Vita, G.; Zanchini, R.; Spina, D.; Vastola, A.; D’Amico, M.; Caracciolo, F. Simply Red? The Effects of Distinct Colours and Sustainable Production Methods on the Consumers’ Preferences for Healthier Sweet Peppers. Heliyon 2024, 10, e28661. [Google Scholar] [CrossRef] [Scilit] [PubMed]
  70. Mohd Hassan, N.; Yusof, N.A.; Yahaya, A.F.; Mohd Rozali, N.N.; Othman, R. Carotenoids of Capsicum Fruits: Pigment Profile and Health-Promoting Functional Attributes. Antioxidants 2019, 8, 469. [Google Scholar] [CrossRef] [Scilit] [PubMed]
  71. Jiménez-Viveros, Y.; Núñez-Palenius, H.G.; Fierros-Romero, G.; Valiente-Banuet, J.I. Modification of Light Characteristics Affect the Phytochemical Profile of Peppers. Horticulturae 2023, 9, 72. [Google Scholar] [CrossRef] [Scilit]
  72. Yoo, H.J.; Kim, J.-H.; Park, K.-S.; Son, J.E.; Lee, J.M. Light-Controlled Fruit Pigmentation and Flavor Volatiles in Tomato and Bell Pepper. Antioxidants 2020, 9, 14. [Google Scholar] [CrossRef] [Scilit] [PubMed]
  73. Keyhaninejad, N.; Richins, R.D.; O’Connell, M.A. Carotenoid Content in Field-Grown versus Greenhouse-Grown Peppers: Different Responses in Leaf and Fruit. HortScience 2012, 47, 852–855. [Google Scholar] [CrossRef] [Scilit]
  74. He, X.; Solis, C.A.; Chavan, S.G.; Maier, C.; Wang, Y.; Liang, W.; Klause, N.; Ghannoum, O.; Cazzonelli, C.I.; Tissue, D.T.; et al. Novel Transcriptome Networks Are Associated with Adaptation of Capsicum Fruit Development to a Light-Blocking Glasshouse Film. Front. Plant Sci. 2023, 14, 1280314. [Google Scholar] [CrossRef] [Scilit] [PubMed]
  75. Sran, T.S.; Jindal, S.K. Assessment of Heterotic and Combining Ability Effects along with Genotype × Environment Factors Influencing the Variation of Yield and Quality Components in Pepper. Sci. Hortic. 2022, 299, 111040. [Google Scholar] [CrossRef] [Scilit]
  76. Yu, K.; Wang, H.; Liu, X.; Xu, C.; Li, Z.; Xu, X.; Liu, J.; Wang, Z.; Xu, Y. Large-Scale Analysis of Combining Ability and Heterosis for Development of Hybrid Maize Breeding Strategies Using Diverse Germplasm Resources. Front. Plant Sci. 2020, 11, 660. [Google Scholar] [CrossRef] [Scilit] [PubMed]
  77. Hasanuzzaman, M.; Hakim, M.A.; Hanafi, M.M.; Shukor-Juraimi, A.; Islam, M.M.; Shamsuddin, A.K.M. Study of Heterosis in Bangladeshi Chilli (Capsicum annuum L.) Landraces. Agrociencia 2013, 47, 683–690. [Google Scholar]
  78. Naves, E.R.; Scossa, F.; Araújo, W.L.; Nunes-Nesi, A.; Fernie, A.R.; Zsögön, A. Heterosis for Capsacinoids Accumulation in Chili Pepper Hybrids Is Dependent on Parent-of-Origin Effect. Sci. Rep. 2022, 12, 14450. [Google Scholar] [CrossRef] [Scilit] [PubMed]
  79. Moreno-Peris, E.; Cortés-Olmos, C.; Díez-Díaz, M.; González-Mas, M.C.; de Luis-Margarit, A.; Fita, A.; Rodríguez-Burruezo, A. Hybridization in Peppers (Capsicum spp.) to Improve the Volatile Composition in Fully Ripe Fruits: The Effects of Parent Combinations and Fruit Tissues. Agronomy 2020, 10, 751. [Google Scholar] [CrossRef] [Scilit]
  80. Moreno, E.; Fita, A.; González-Mas, M.C.; Rodríguez-Burruezo, A. HS-SPME Study of the Volatile Fraction of Capsicum Accessions and Hybrids in Different Parts of the Fruit. Sci. Hortic. 2012, 135, 87–97. [Google Scholar] [CrossRef] [Scilit]
  81. Cocozza, A.; D’Alessandro, A.; Macellaro, R.; Francese, G.; Tripodi, P. Integrated High-Density Genetic Maps in Multi-Parent F2 Mapping Populations Provide a Framework to Unravel the Genomic Basis of Agro-Qualitative and Metabolic Traits in Pepper (Capsicum annuum). BMC Plant Biol. 2026, 26, 684. [Google Scholar] [CrossRef] [Scilit] [PubMed]
  82. Syukur, M.; Maharijaya, A.; Nurcholis, W.; Ritonga, A.W.; Istiqlal, M.R.A.; Hakim, A.; Sulassih, S.; Perdani, A.Y.; Pangestu, A.Y.; Hatta, A.N.N.L.; et al. Biochemical and Yield Component of Hybrid Chili (Capsicum annuum L.) Resulting from Full Diallel Crosses. Horticulturae 2023, 9, 620. [Google Scholar] [CrossRef] [Scilit]
  83. Kaur, S.; Sharma, S.P.; Sarao, N.K.; Deol, J.K.; Gill, R.; Abd-Elsalam, K.A.; Alghuthaymi, M.A.; Hassan, M.M.; Chawla, N. Heterosis and Combining Ability for Fruit Yield, Sweetness, β-Carotene, Ascorbic Acid, Firmness and Fusarium Wilt Resistance in Muskmelon (Cucumis melo L.) Involving Genetic Male Sterile Lines. Horticulturae 2022, 8, 82. [Google Scholar] [CrossRef] [Scilit]
  84. Pavan, M.P.; Gangaprasad, S.; Dushyanthakumar, B.M.; Adivappar, N.; Shashikumara, P. Heterosis and Combining Ability Studies by Line × Tester Analysis for Fruit Biochemical, Morpho-Physiological, and Yield Traits Governing Shelf Life in Tomato (Solanum lycopersicum L.). Euphytica 2022, 218, 90. [Google Scholar] [CrossRef] [Scilit]
  85. Pereira-Dias, L.; Vilanova, S.; Fita, A.; Prohens, J.; Rodríguez-Burruezo, A. Genetic Diversity, Population Structure, and Relationships in a Collection of Pepper (Capsicum spp.) Landraces from the Spanish Centre of Diversity Revealed by Genotyping-by-Sequencing (GBS). Hortic. Res. 2019, 6, 54. [Google Scholar] [CrossRef] [Scilit] [PubMed]
  86. Zhang, X.; Zhang, Z.; Gu, X.; Mao, S.; Li, X.; Chadœuf, J.; Palloix, A.; Wang, L.; Zhang, B. Genetic Diversity of Pepper (Capsicum spp.) Germplasm Resources in China Reflects Selection for Cultivar Types and Spatial Distribution. J. Integr. Agric. 2016, 15, 1991–2001. [Google Scholar] [CrossRef] [Scilit]
  87. McCoy, J.E.; McHale, L.K.; Kantar, M.; Jardón-Barbolla, L.; Mercer, K.L. Environment of Origin and Domestication Affect Morphological, Physiological, and Agronomic Response to Water Deficit in Chile Pepper (Capsicum sp.). PLoS ONE 2022, 17, e0260684. [Google Scholar] [CrossRef] [Scilit] [PubMed]
  88. Silvar, C.; Berner, T.; Keilwagen, J.; Perovic, D.; Lehnert, H. Tracing Back the History of Pepper (Capsicum spp.) in the Iberian Peninsula. Sci. Hortic. 2025, 344, 114100. [Google Scholar] [CrossRef] [Scilit]
  89. do Nascimento Costa Ferreira, G.; Ferraz, G.V.; da Silva, L.R.; Oliveira, A.C.; de Almeida, L.R.; Costa, M.F.; Silva, R.N.O.; da Silva, V.B.; de Almeida Lopes, Â.C.; Gomes, R.L.F. Assessment of Phenotypic Divergence and Hybrid Development in Ornamental Peppers (Capsicum spp.). Genet. Resour. Crop Evol. 2025, 72, 5499–5513. [Google Scholar] [CrossRef] [Scilit]
  90. Wu, L. Relationship Between SRAP Marker Based on Genetic Distance, Combining Ability and Heterosis in Pepper. Chin. J. Trop. Crops 2020, 41, 661–668. [Google Scholar] [CrossRef]
  91. Fortuny, A.P.; Bueno, R.A.; Pereira da Costa, J.H.; Zanor, M.I.; Rodríguez, G.R. Tomato Fruit Quality Traits and Metabolite Content Are Affected by Reciprocal Crosses and Heterosis. J. Exp. Bot. 2021, 72, 5407–5425. [Google Scholar] [CrossRef] [Scilit] [PubMed]
  92. Liu, C.; Liu, X.; Wang, X.; Han, Y.; Meng, H.; Cheng, Z. Heterosis Prediction System Based on Non-Additive Genomic Prediction Models in Cucumber (Cucumis sativus L.). Sci. Hortic. 2022, 293, 110677. [Google Scholar] [CrossRef] [Scilit]
  93. Kopta, T.; Sekara, A.; Pokluda, R.; Ferby, V.; Caruso, G. Screening of Chilli Pepper Genotypes as a Source of Capsaicinoids and Antioxidants under Conditions of Simulated Drought Stress. Plants 2020, 9, 364. [Google Scholar] [CrossRef] [Scilit] [PubMed]
  94. Tripodi, P.; Francese, G.; Sanajà, V.O.; Di Cesare, C.; Festa, G.; D’Alessandro, A.; Mennella, G. A Multi-Methodological Approach to Study Genomic Footprints and Environmental Influence on Agronomic and Metabolic Profiles in a Panel of Italian Traditional Sweet Pepper Varieties. J. Food Compos. Anal. 2021, 103, 104116. [Google Scholar] [CrossRef] [Scilit]
  95. Tripodi, P.; Lo Scalzo, R.; Ficcadenti, N. Dissection of Heterotic, Genotypic and Environmental Factors Influencing the Variation of Yield Components and Health-Related Compounds in Chilli Pepper (Capsicum annuum). Euphytica 2020, 216, 112. [Google Scholar] [CrossRef] [Scilit]
Figure 1. Relationship between mid-parent values (x-axis) and hybrid mean values (y-axis) in the open field (○) and greenhouse (×) for each experimental F1 hybrid in (a) total sugars (TS), (b) vitamin C (VC), (c) total flavonoids (TF) and (d) total carotenoids (TC). The slope = 1 line represents equal performance between each hybrid and its corresponding mid-parent mean. Note: Open field: Valencia, spring–summer; greenhouse: Murcia, winter–spring.
Agriculture 16 01431 g001
Figure 2. Relationship between mid-parent heterosis (MPH, %) estimated in the open field (x-axis) and greenhouse (y-axis) for each experimental F1 hybrid in (a) total sugars (TS), (b) vitamin C (VC), (c) total flavonoids (TF) and (d) total carotenoids (TC). The slope = 1 line indicates equal MPH values in both environments. Note: Open field: Valencia, spring–summer; greenhouse: Murcia, winter–spring.
Agriculture 16 01431 g002
Figure 3. Principal component analysis (PCA) representation of the measured traits under (a) open-field and (b) greenhouse conditions. Fru = fructose, Glu = glucose, TS = total sugars, VC = vitamin C, Quer = quercetin, Lut = luteolin, Api = apigenin, Kam = kaempferol, TF = total flavonoids, RC = red carotenoids, Y-OC = yellow-orange carotenoids, TC = total carotenoids. Note: Open field: Valencia, spring–summer; greenhouse: Murcia, winter–spring.
Agriculture 16 01431 g003
Figure 4. PCA representation of experimental hybrids (●) and their corresponding parents (Δ) under (a) open-field and (b) greenhouse conditions. Note: Open field: Valencia, spring–summer; greenhouse: Murcia, winter–spring.
Agriculture 16 01431 g004
Figure 5. Spearman’s rank correlation (ρ) heatmap for sugars, vitamin C, flavonoids and carotenoids under (a) open-field and (b) greenhouse conditions. Fru = fructose, Glu = glucose, TS = total sugars, VC = vitamin C, Quer = quercetin, Lut = luteolin, Api = apigenin, Kam = kaempferol, TF = total flavonoids, RC = red carotenoids, Y-OC = yellow-orange carotenoids, TC = total carotenoids. *, ** and *** indicate FDR-adjusted p < 0.05, 0.01 and 0.001, respectively. Note: Open field: Valencia, spring–summer; greenhouse: Murcia, winter–spring.
Agriculture 16 01431 g005
Table 1. Accession name and code, fruit description and shape, material type, origin and fruit mass range (g) of the parental genotypes used in this study.
Name (Code)DescriptionFruit Shape (Pochard Class 1)TypeOriginFruit Mass 2
BGV-004348 (P1)Trompa de vacaRectangular (B)TraditionalMurcia, Spain62–79
BGV-005030 (P2)ValencianoRectangular (B)TraditionalValencia, Spain114–119
BGV-005103 (P3)ValencianoRectangular (B)TraditionalValencia, Spain90–154
BGV-005121 (P4)ValencianoRectangular (B)TraditionalAlicante, Spain110–134
BGV-005126 (P5)ValencianoRectangular (B)TraditionalAlicante, Spain82–135
BGV-010582 (P6)ValencianoRectangular (B)TraditionalValencia, Spain110–143
BGV-013004 (P7)Bell pepperTriangular (C)LocalVizcaya, Spain37–86
Bierzo (P8)Cons. Reg. PGI Pimiento Asado BierzoHeart-triangular (P)TraditionalLeón, Spain94–124
Largo de Reus (P9)Elongated red sweet pepperRectangular (B)TraditionalBatlle Seeds, Spain102–175
L275 (P10)California Wonder RedQuadrangular (A)Breeding lineCOMAV Institute, Valencia64–104
L277 (P11)California Wonder RedQuadrangular (A)Breeding lineCOMAV Institute, Valencia83–100
Najerano (P12)Cons. Reg. PGI Pimiento RiojanoTriangular (C)TraditionalLa Rioja, Spain66–67
Piquillo (P13)Cons. Reg. PDO Pimiento Piquillo LodosaTriangular (C)TraditionalNavarra, Spain32–37
1 According to the main categories of the Pochard classification, as described by Rodríguez-Burruezo et al. [13]. 2 Fruit mass is expressed as the range of genotype means across the two environments.
Table 2. Hybrid code, corresponding female and male parents, and fruit mass range (g) of the experimental F1 hybrids used in this study.
Hybrid Code♀ Parent♂ ParentFruit Mass
P1 × P10BGV-004348L27581–115
P10 × P2L275BGV-005030134–137
P11 × P2L277BGV-005030103–151
P3 × P10BGV-005103L275100–123
P11 × P3L277BGV-005103112–140
P10 × P4L275BGV-005121119–136
P4 × P11BGV-005121L277102–140
P10 × P5L275BGV-005126104–135
P11 × P5 L277BGV-005126109–132
P6 × P10 BGV-010582L275108–130
P11 × P6 L277BGV-010582144–148
P7 × P10 BGV-013004L27571–114
P8 × P10 BierzoL275120–121
P9 × P10Largo de ReusL275125–137
P11 × P12 L277Najerano110–156
P13 × P11 PiquilloL27748–65
Fruit mass is expressed as the range of genotype means across the two environments.
Table 3. Total sum of squares from ANOVA, expressed as percentages (%), for the effects of genotype (G), environment (E) and their interaction (G × E) on total sugars (TS), vitamin C (VC), total flavonoids (TF) and total carotenoids (TC).
Effectdf 1TSVCTFTC
General ANOVA
Genotype (G)2843.6 ***36.7 ***24.4 ***69.0 ***
Environment (E)10.3 ns0.1 ns36.3 ***2.6 ***
Interaction
G × E2821.1 ***29.9 ***23.2 ***15.8 ***
Residuals 35.033.316.012.5
Open-field ANOVA
Genotype (G)2865.5 ***64.9 ***71.8 ***90.7 ***
Residuals 34.535.228.29.3
Greenhouse ANOVA
Genotype (G)2864.4 ***68.8 ***79.0 ***81.8 ***
Residuals 35.631.221.018.2
1 df: degrees of freedom. ns and *** indicate non-significance (p ≥ 0.05) and significance at p < 0.001, respectively, according to the ANOVA F-Test.
Table 4. Mean content of total sugars (g kg−1 FM) and vitamin C (mg kg−1 FM) in fully ripe fruits of the evaluated F1 hybrids and parental genotypes grown under open-field and greenhouse conditions, and regression coefficient (β) between the two environments.
GenotypeTotal SugarsVitamin C
Open Field 1Greenhouseβ 3Open FieldGreenhouseβ
Hybrids
P1 × P1035 ± 1 236 ± 21.08 ns1371 ± 321286 ± 555.26 ns
P10 × P252 ± 347 ± 2−5.42 ns1380 ± 351203 ± 3710.92 ns
P11 × P249 ± 345 ± 1−4.62 ns889 ± 291191 ± 40−18.62 **
P3 × P1038 ± 252 ± 314.22 ***1281 ± 1141282 ± 56−0.07 ns
P11 × P344 ± 352 ± 58.05 *1321 ± 781109 ± 4513.00 *
P10 × P447 ± 245 ± 2−2.08 ns1303 ± 311208 ± 505.83 ns
P4 × P1146 ± 253 ± 47.32 ns1279 ± 531226 ± 293.28 ns
P10 × P550 ± 248 ± 2−2.15 ns1230 ± 441245 ± 46−0.94 ns
P11 × P541 ± 253 ± 112.34 **1068 ± 841233 ± 30−10.16 ns
P6 × P1036 ± 240 ± 24.61 ns1055 ± 1011550 ± 67−30.46 ***
P11 × P643 ± 447 ± 33.62 ns976 ± 261196 ± 43−13.56 *
P7 × P1037 ± 151 ± 215.17 ***1318 ± 771330 ± 40−0.71 ns
P8 × P1036 ± 140 ± 54.45 ns1244 ± 301172 ± 1104.40 ns
P9 × P1043 ± 150 ± 37.94 *1509 ± 621404 ± 826.50 ns
P11 × P1241 ± 240 ± 4−0.56 ns1240 ± 1031018 ± 9613.67 *
P13 × P1143 ± 149 ± 26.59 ns877 ± 621229 ± 31−21.67 ***
Parents
P131 ± 332 ± 10.98 ns999 ± 851247 ± 82−15.27 **
P246 ± 234 ± 2−12.91 ***1178 ± 34922 ± 4015.77 **
P342 ± 240 ± 2−2.05 ns1370 ± 611002 ± 6122.64 ***
P451 ± 445 ± 2−6.92 ns1084 ± 371019 ± 1093.98 ns
P540 ± 347 ± 17.86 *989 ± 1061033 ± 54−2.74 ns
P644 ± 248 ± 14.38 ns954 ± 231319 ± 17−22.45 ***
P761 ± 546 ± 2−16.05 ***1488 ± 931751 ± 77−16.22 **
P835 ± 332 ± 2−3.17 ns945 ± 901130 ± 46−11.35 *
P948 ± 240 ± 2−9.36 *1290 ± 991128 ± 809.97 ns
P1041 ± 243 ± 33.16 ns1351 ± 581017 ± 4720.55 ***
P1145 ± 144 ± 2−1.17 ns1452 ± 661049 ± 1524.81 ***
P1254 ± 139 ± 2−16.39 ***1432 ± 36955 ± 5829.36 ***
P1352 ± 361 ± 210.09 **1035 ± 75981 ± 293.28 ns
Hybrid mean 443 ± 1 b (13%)47 ± 1 a (11%) 1209 ± 46 a (15%)1243 ± 30 a (10%)
Parent mean45 ± 2 a (18%)42 ± 2 a (19%) 1197 ± 57 a (17%)1119 ± 61 a (20%)
Global mean44 ± 1 a (16%)45 ± 1 a (15%) 1204 ± 35 a (16%)1187 ± 33 a (15%)
1 Open field refers to the spring–summer trial conducted in Valencia, whereas greenhouse refers to the winter–spring trial conducted in Murcia. 2 Values are expressed as mean ± standard error (SE). 3 Significance levels for β according to two-sided tests: ns, *, ** and *** indicate non-significance (p ≥ 0.05) and significance at p < 0.05, p < 0.01 and p < 0.001, respectively. 4 Summary rows are presented as mean ± SE (CV, %). Different letters indicate significant differences between environments within each group and trait according to two-sided t-tests (p < 0.05).
Table 5. Mean content of total flavonoids and total carotenoids (mg kg−1 FM) in fully ripe fruits of the evaluated F1 hybrids and parental genotypes grown under open-field and greenhouse conditions, and regression coefficient (β) between the two environments.
GenotypeTotal FlavonoidsTotal Carotenoids
Open Field 1Greenhouseβ 3Open FieldGreenhouseβ
Hybrids
P1 × P1035.2 ± 2.7 214.8 ± 0.91.64 ***125 ± 6101 ± 81.47 ns
P10 × P224.2 ± 0.812.5 ± 0.11.26 ***180 ± 579 ± 46.09 ***
P11 × P219.9 ± 2.814.8 ± 1.10.51 *116 ± 1096 ± 61.23 ns
P3 × P1034.0 ± 3.215.3 ± 1.21.51 ***69 ± 581 ± 20 −0.75 ns
P11 × P320.9 ± 3.312.2 ± 0.50.95 ***44 ± 272 ± 4−1.7 *
P10 × P431.6 ± 2.515.3 ± 1.61.39 ***91 ± 458 ± 92.01 **
P4 × P1131.8 ± 5.013.6 ± 0.61.53 ***65 ± 7109 ± 9−2.64 ***
P10 × P521.7 ± 1.514.4 ± 0.90.78 **62 ± 659 ± 70.17 ns
P11 × P5 21.8 ± 2.413.6 ± 0.40.86 ***73 ± 366 ± 80.42 ns
P6 × P10 28.5 ± 3.214.7 ± 0.81.24 ***112 ± 994 ± 81.09 ns
P11 × P6 28.8 ± 2.313.5 ± 1.01.44 ***61 ± 192 ± 11−1.88 *
P7 × P10 45.0 ± 8.814.1 ± 0.82.11 ***141 ± 6145 ± 13−0.26 ns
P8 × P10 24.9 ± 2.614.7 ± 1.40.99 ***71 ± 983 ± 8−0.73 ns
P9 × P1045.6 ± 4.213.9 ± 0.82.25 ***73 ± 971 ± 80.14 ns
P11 × P12 34.2 ± 1.4 12.7 ± 0.61.88 ***145 ± 7110 ± 112.11 **
P13 × P11 25.4 ± 0.716.4 ± 0.50.83 ***140 ± 8140 ± 12−0.01 ns
Parents
P140.5 ± 2.924.3 ± 2.00.98 ***200 ± 7169 ± 61.86 *
P217.7 ± 1.224.0 ± 2.5−0.55 *117 ± 7179 ± 18−3.71 ***
P321.6 ± 3.519.9 ± 1.20.08 ns143 ± 692 ± 103.07 ***
P432.1 ± 4.731.8 ± 2.7−0.04 ns143 ± 13140 ± 120.23 ns
P523.7 ± 3.432.6 ± 4.6−0.61 *123 ± 11174 ± 10 −3.08 ***
P626.1 ± 1.514.3 ± 0.81.15 ***122 ± 482 ± 92.4 **
P761.3 ± 10.112.4 ± 0.92.96 ***182 ± 18122 ± 113.6 ***
P825.4 ± 0.915.9 ± 0.40.89 ***78 ± 983 ± 5−0.34 ns
P934.1 ± 1.220.8 ± 2.20.98 ***195 ± 1393 ± 116.11 ***
P1016.1 ± 1.714.9 ± 1.00.13 ns75 ± 1038 ± 12.23 **
P1120.2 ± 1.516.6 ± 0.40.36 ns85 ± 1044 ± 12.47 **
P1221.0 ± 1.320.6 ± 0.60.03 ns182 ± 13142 ± 52.45 **
P1358.3 ± 2.1 26.8 ± 0.81.48 ***273 ± 4192 ± 124.92 ***
Hybrid mean 429.6 ± 2.0 a (27%)14.2 ± 0.3 b (8%) 98 ± 10 a (40%)91 ± 6 a (28%)
Parent mean30.6 ± 4.1 a (48%)21.1 ± 1.8 b (31%) 148 ± 16 a (39%)119 ± 14 b (43%)
Global mean30.1 ± 2.1 a (37%)17.3 ± 1.0 b (32%) 120 ± 10 a (45%)104 ± 8 a (40%)
1 Open field: Valencia, spring–summer; greenhouse: Murcia, winter–spring. 2 Values are expressed as mean ± standard error (SE). 3 Significance levels for β according to two-sided tests: ns, *, ** and *** indicate non-significance (p ≥ 0.05) and significance at p < 0.05, p < 0.01 and p < 0.001, respectively. 4 Summary rows are presented as mean ± SE (CV, %). Different letters indicate significant differences between environments within each group and trait according to two-sided t-tests (p < 0.05).
Disclaimer/Publisher’s Note: The statements, opinions and data contained in all publications are solely those of the individual author(s) and contributor(s) and not of MDPI and/or the editor(s). MDPI and/or the editor(s) disclaim responsibility for any injury to people or property resulting from any ideas, methods, instructions or products referred to in the content.