Article

Impact of Soil Development and Land Use on Concentrations of Potentially Toxic Elements in Soils: Insights from a Multi-Scale Study

1
School of Tourism, Shandong Women’s University, Ji’nan 250300, China
2
School of Geography and Ocean Science, Nanjing University, Nanjing 210023, China
3
School of Resource and Environment, Henan University of Engineering, Zhengzhou 451191, China
4
Department of Asset Appraisal, Inner Mongolia University of Finance and Economics, Hohhot 010070, China
*
Author to whom correspondence should be addressed.
Agriculture 2026, 16(11), 1195; https://doi.org/10.3390/agriculture16111195
Submission received: 15 April 2026 / Revised: 16 May 2026 / Accepted: 26 May 2026 / Published: 29 May 2026

Abstract

Soil potentially toxic elements (PTEs) are crucial indicators of soil quality and ecological risk, especially in areas with complex pedogenesis and intensive anthropogenic activities. However, how soil development and land use jointly shape PTEs’ distribution across multiple scales remains unclear. A multi-scale framework encompassing catchment, sub-catchment, and regional scales was employed to examine the impacts of soil development and land use on PTEs’ (Cr, Ni, Cu, Zn, Pb, Cd, As, and Hg) distribution and their dominant drivers in the lower Yangtze River basin’s alluvial soils. Results showed significant scale-dependent variations in PTEs, with concentrations being highest on the regional scale. During pedogenesis, PTEs exhibited distinct evolutionary patterns across scales: Ni, Cu, Zn, and Cd decreased significantly at both the catchment and sub-catchment scales, whereas Cr, Ni, and As showed increasing trends at the regional scale. Land use also demonstrated scale-dependent effects, with drylands exhibiting PTEs’ enrichment at larger scales but significantly lower concentrations compared to woodlands and paddy-dryland rotation (paddies) at the regional scale. The mechanisms through which the Chemical Index of Alteration (CIA) influences PTE concentrations varied across scales, with metal oxide alteration as a key common pathway. Mantel tests showed that PTE distributions are governed by pH and total phosphorus (TP) at larger scales but by organic carbon (OC) and total nitrogen (TN) regionally. These cross-scale insights reveal how pedogenesis and human activity jointly shape HM patterns, highlighting the potential for scale-appropriate sustainable soil management—for instance, regionally tailored adjustments of pH and organic matter can mitigate metal risks while maintaining soil health. Future studies can build on this multi-scale framework by integrating long-term monitoring with predictive models to assess adaptive strategies under land-use change, thereby advancing sustainability in alluvial agroecosystems.

1. Introduction

Soil PTE contamination represents one of the most pervasive and critical environmental challenges worldwide [1,2,3]. Due to their high toxicity, environmental persistence, potential for bioaccumulation, and tendency to undergo biomagnification through the food chain [4], PTEs pose severe threats to ecosystem stability and human health [5,6]. As industrialization and agricultural intensification continue to advance, PTE accumulation in soils is increasingly exacerbated [7,8]. Therefore, accurately tracing pollution sources, elucidating spatial distribution patterns, and identifying dominant driving factors have become fundamental prerequisites for effective pollution risk management and sustainable land-use planning [9,10]. However, a key knowledge gap remains: how pedogenesis and land use jointly shape PTE distributions across multiple spatial scales is still poorly understood, and the novelty of combining these factors within an integrated nested spatial framework has not been explicitly addressed.
PTEs in soils originate from both the weathering of parent materials and external inputs [11,12]. Background values derived from parent material weathering typically exhibit significant regional heterogeneity [13]. Pedogenic factors, such as climate, biology, parent material, and topography, directly govern the initial content and speciation of PTEs, thereby influencing their bioavailability and ecological risks through various geochemical processes [14,15,16,17]. However, the role of pedogenic time (i.e., soil weathering stages) in regulating the migration and transformation of PTEs remains insufficiently studied. As soils develop, geochemical processes, including mineral decomposition, formation of secondary clay minerals, and elemental leaching or enrichment, significantly affect the distribution and behavior of PTEs [18]. Previous studies have indicated that elements such as Cd and Pb are prone to participate in biogeochemical cycling, whereas elements including Cr and Ni are predominantly influenced by rock weathering processes [19,20,21]. Research in the Yangtze River Delta has further revealed that Cd bioavailability increases with soil age, while Cr tends to leach into deeper soil layers [21]. These divergent evolutionary pathways generate distinct HM distribution patterns across different stages of soil development. Addressing this pedogenic time gap is essential for accurately assessing environmental risks and formulating remediation strategies that account for soil age.
Land use exerts a profound influence on the accumulation and distribution of PTEs in soils through distinct agricultural management practices, including irrigation, fertilization, and crop rotation systems [22]. Human activities alter the speciation, mobility, and bioavailability of PTEs by modifying soil physicochemical properties, such as pH, redox potential, and organic matter content, and by interfering with natural biogeochemical cycles [23]. For instance, in subtropical China, anaerobic conditions in paddy fields promote the formation of insoluble Cd sulfides, while aerobic environments in dryland soils favor the occurrence of highly mobile hexavalent Cr [24,25,26]. Compared with natural woodlands, agricultural soils often exhibit elevated PTE concentrations due to exogenous inputs from phosphate fertilizers, wastewater irrigation, and atmospheric deposition [27,28]. However, complex scenarios may also arise from naturally high background values inherited from parent materials or localized industrial contamination. Therefore, elucidating the response relationship between land use and PTEs’ occurrence is essential for developing precise pollution prevention and control strategies, ensuring agricultural product safety, and maintaining ecological health [22]. Nevertheless, a significant research gap remains: it is unclear how long-term pedogenic processes interact with land use to regulate the dynamic evolution of PTEs. These processes may interact by amplifying anthropogenic disturbances, preserving natural baseline characteristics, or triggering novel geochemical pathways, but the relative importance of these mechanisms remains unknown. This knowledge gap hampers the development of precise pollution prevention strategies that consider both land-use history and soil developmental stage.
Soil, as an inherently heterogeneous and complex system, exhibits distinct scale-dependent spatial variability in its properties [29]. The spatial structure of soil attributes varies considerably with the scale of observation [30]. Features that are discernible at fine scales often become obscured as sampling spacing increases, which makes it challenging to capture multi-level variations within a single-scale study [31]. Consequently, multi-scale analysis has emerged as a crucial methodology for deciphering this complexity. This approach has been widely applied to investigate the spatial patterns of soil nutrients, moisture, and salinity, substantially improving the understanding of their underlying drivers [32,33,34]. However, compared to these attributes, multi-scale research on the spatial variation in PTEs remains relatively limited. Recent investigations across urban, industrial, and mining settings have further characterized PTE contamination patterns at various scales [35,36,37]; yet, they have not integrated pedogenic chronosequences with land use in a unified nested design. Soil PTEs originate from diverse sources, including natural background levels derived from parent materials and anthropogenic inputs such as industrial emissions, agricultural practices, and traffic pollution [38,39]. These natural and human-induced factors interact across multiple spatial scales, generating complex distribution patterns. Catchment-scale distributions are predominantly shaped by geological background, whereas human activities (i.e., cultivation, irrigation, and point-source pollution) play an increasingly critical role at smaller field or regional scales [30]. Relying solely on a single analytical scale may lead to incomplete or biased interpretations. Local anthropogenic influences might be overlooked in larger-scale assessments, while regional geological patterns could remain undetected in smaller-scale studies [32]. Therefore, constructing an integrated multi-scale research framework is essential to accurately identify pollution sources, quantify natural and anthropogenic contributions, clarify migration and transformation mechanisms, and support precise environmental risk assessment.
To address the research gaps identified above, this study adopts a multi-scale nested research design encompassing catchment, sub-catchment, and regional scales to systematically analyze the influence of pedogenesis and agricultural activities on PTE concentrations. We propose the following hypotheses: (1) PTE concentrations exhibit soil-age-dependent evolutionary trends, and these trends become statistically more detectable at larger spatial scales because fine-scale variations are more likely to be masked by localized random disturbances (i.e., fertilization, point-source emissions); (2) compared with natural woodland, agricultural land uses (dryland and paddies) will exhibit elevated PTE concentrations due to exogenous inputs such as fertilizers. Significant differences in PTEs’ distribution between dryland and paddies are anticipated, resulting from contrasting redox conditions and fertilizer management practices, with these disparities becoming more evident at larger sampling scales; and (3) scale effects may reshape the direction and magnitude of the influence exerted by pedogenesis or land use on PTE concentrations, as localized processes (i.e., fertilization, point-source emissions) could mask the role of larger dominant processes (i.e., soil development, land-use type) at certain scales.

2. Materials and Methods

2.1. Site Description and Experimental Design

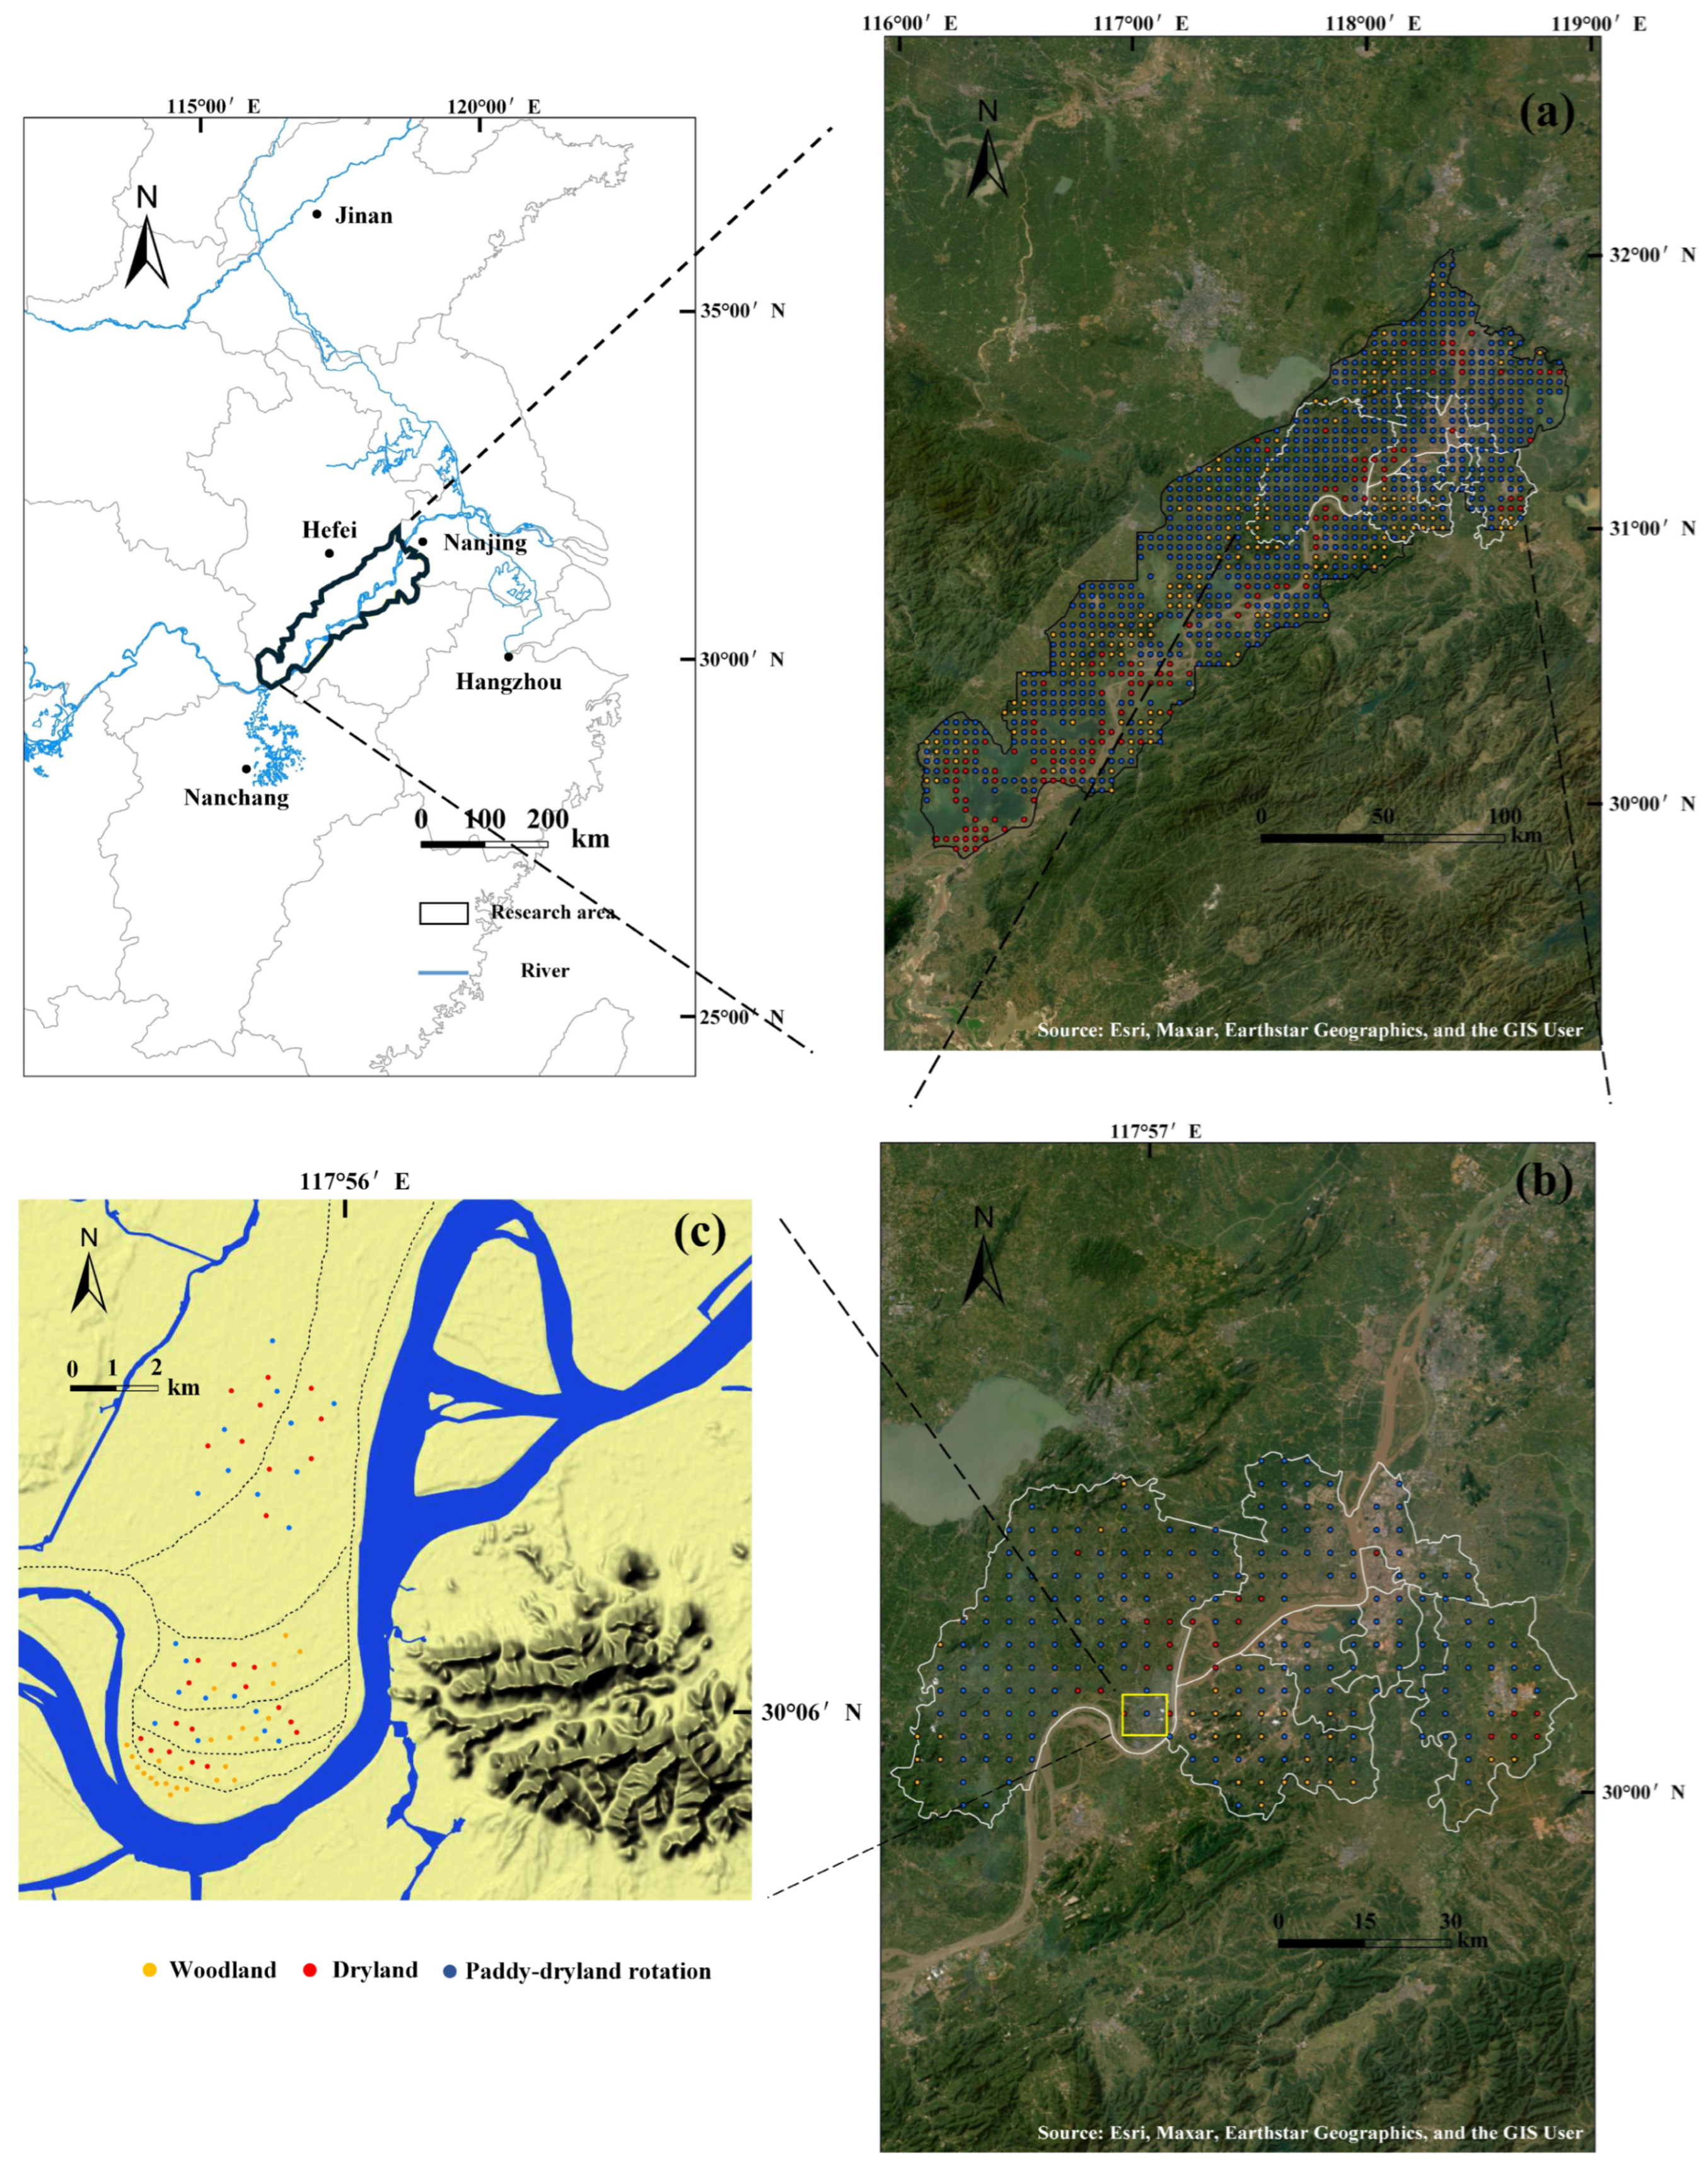
This study was conducted in the Anhui section of the lower Yangtze River (Figure 1), a region with a subtropical monsoon climate. The mean annual temperature is 15.8 °C, with precipitation and evaporation averaging 1170 mm and 1200 mm, respectively. Approximately 60% of the annual precipitation falls between May and September.
A stratified random sampling design was adopted across all three scales, with land-use type (paddy-dryland rotation, dryland, and woodland) and soil developmental stage serving as the primary stratification criteria. A multi-scale analytical framework was employed, investigating the study area at the catchment, sub-catchment, and regional scales. The largest, a catchment-scale area (29°48′–32°03′ N, 116°04′–118°52′ E; approximately 20,200 km2), provided 1029 surface soil samples. These comprised 737 from paddy-dryland rotations, 129 from dryland, and 163 from woodland. At the sub-catchment scale, the study focused on the administrative region of Wuhu City (30°56′–31°34′ N, 117°28′–118°44′ E; approximately 4700 km2), where 247 soil samples were collected. The distribution included 195 from paddy-dryland rotations, 22 from dryland, and 30 from woodland. The finest regional scale examined a typical fluvial riparian zone (31°04′–31°16′ N, 117°54′–118°00′ E; approximately 160 km2) along a meandering segment of the Yangtze River. This landform has developed through the progressive southward lateral accretion of point bars, resulting in a chronosequence of alluvial soils with varying textures and maturities. From this site, 81 soil samples were obtained: 25 from paddy-dryland rotations, 30 from dryland, and 26 from woodland. In total, 1357 soil samples were obtained across the three spatial scales.
The field sampling was carried out from October to November 2003. Although more than two decades have passed, the large sample size of this dataset retains significant scientific value, serving as a historical baseline that captures soil conditions in the lower Yangtze River during a period of intensive agricultural activity and early-stage industrialization. Across all three spatial scales, the paddy-dryland rotation fields were primarily managed under a rice-wheat or rice-rape rotation system, a highly intensive and productive agricultural practice of the region. Dryland fields were predominantly cultivated with wheat (Triticum aestivum) or rapeseed (Brassica campestris), while the woodlands consisted of cultivated plantations of Populus euramevicana. At each sampling location, five sub-samples were collected from within a 10 m radius and homogenized to form a single composite sample representing the 0–20 cm surface soil layer. Following collection, all samples were air-dried at room temperature. Visible plant residues and gravel were then removed, and the soil was passed through a 2 mm sieve in preparation for subsequent analysis.

2.2. Establishment of the Soil Weathering Sequence

This study proposes a quantitative framework for assessing pedogenic weathering stages using the Chemical Index of Alteration (CIA). Chemical weathering progressively leaches labile alkali and alkaline earth metals (e.g., Na+, K+, Ca2+) from the parent material, while less mobile elements such as aluminum are retained. This residual enrichment promotes the formation of clay minerals, including kaolinite and montmorillonite, resulting in a systematic geochemical divergence of the weathering products from the original parent material. The CIA, calculated as the molar ratio of Al2O3 to the sum of CaO, Na2O, and K2O [40], quantifies this weathering intensity. Higher CIA values indicate more advanced weathering [41], a relationship corroborated in our study area by a significant positive correlation between CIA and soil age (Supplementary Figure S1). However, the CIA may also be influenced by parent material composition, drainage conditions, mineralogical characteristics, and sedimentary sorting; therefore, this study interprets it as an integrated proxy of weathering intensity rather than solely as a direct measure of soil developmental stage. Based on their CIA values, soils were classified into six progressive weathering stages: C70, C73, C76, C79, C82, and C85. The CIA was calculated following the methodology of a previous study [42].

2.3. Alternative Indicators for Soil Texture

Due to the prohibitive temporal and financial costs of direct measurement for large sample sizes, the zirconium-to-rubidium (Zr/Rb) ratio was employed as a proxy for soil texture, an approach well documented in the literature [43,44]. The methodology is based on the distinct geochemical behaviors of these elements during weathering. Zirconium (Zr) is concentrated in the highly resistant mineral zircon, whose stability, density, and resistance to abrasion lead to its enrichment in coarser, sand-sized fractions. In contrast, rubidium (Rb) is associated with less durable phyllosilicates, such as mica, which possess lower hardness and well-developed cleavage [45]. These properties make phyllosilicates susceptible to mechanical comminution during weathering and transport, resulting in the preferential enrichment of rubidium in finer, clay-sized fractions. Notably, the Zr/Rb ratio is used as a cost-effective surrogate for the relative abundance of coarse- vs. fine-grained fractions, but we acknowledge that it cannot substitute for direct particle-size analysis.

2.4. Laboratory Analyses and Data Collection

Soil pH was measured potentiometrically using a glass electrode in a 1:2.5 soil-to-water suspension. Organic carbon (OC) content was determined by wet oxidation following the Walkley–Black method [46]. Total nitrogen (TN) was quantified using the Kjeldahl method after sulfuric acid digestion, while total phosphorus (TP) was analyzed by molybdenum-blue colorimetry (Lu, 2000) [47]. For elemental analysis, concentrations of zirconium (Zr), rubidium (Rb), aluminum (Al), calcium (Ca), and iron (Fe) were determined by X-ray fluorescence spectrometry (XRF). For this analysis, approximately 5 g of air-dried soil was finely ground to <75 μm and pressed into pellets. PTEs (Pb, Ni, Cr, Cu, Zn) were digested with a mixture of HNO3–HF–H2O2 and analyzed using inductively coupled plasma mass spectrometry (ICP-MS). Total arsenic (As) and mercury (Hg) were determined by atomic fluorescence spectrometry (AFS) following aqua regia digestion. Total cadmium (Cd) was measured by graphite furnace atomic absorption spectrometry (GFAAS). Quality assurance and control procedures included the analysis of sample replicates, method blanks, and certified reference materials (GBW07446/48/53). Analyte recoveries for the reference materials ranged from 93% to 111%, confirming the accuracy and precision of the analytical data [21].
The environmental data used in this study comprises topographic and climatic variables. Topographic information was derived from a 30 m resolution ASTER Global Digital Elevation Model (GDEM), obtained from the Geospatial Data Cloud platform of the Chinese Academy of Sciences (https://www.gscloud.cn) (accessed on 24 May 2025). From this dataset, elevation data for the study area were extracted. Climatic variables, including mean annual temperature, precipitation, and evaporation for the period 2000–2020, were sourced from the Resource and Environment Science and Data Center of the Chinese Academy of Sciences (https://www.resdc.cn) (accessed on 26 May 2025). These climate datasets have a spatial resolution of 1 km.

2.5. Statistical Analysis

The interval method was used to identify outliers. The interval is defined as [μ − 3 s, μ + 3 s], where μ is the mean of the sample data and s is the standard deviation. Outliers falling outside this interval were replaced by the normal maximum and minimum values. One-way analysis of variance (one-way ANOVA) was used to assess differences in soil PTE concentrations at different soil development stages. Prior to ANOVA, the assumptions of normality and homogeneity of variances were tested using the Kolmogorov–Smirnov test and Levene’s test, respectively. Subsequently, Tukey’s Honest Significant Difference (HSD) test was applied for post hoc comparisons at a 95% significance level (p < 0.05) to control the family-wise error rate across multiple pairwise comparisons. For comparisons across land-use types, permutational multivariate analysis of variance (PERMANOVA) was applied with 999 permutations. Where significant differences were detected, Tukey’s HSD test was used as a post hoc test to determine which groups differed significantly.
To elucidate the associations between the CIA and soil PTE concentrations across sampling scales, we employed partial least squares path modeling (PLS-PM). This multivariate technique examines relationships between latent variables through their observed manifest variables [48], enabling the assessment of both direct and indirect associations, as defined by established a priori knowledge. The constructed model incorporated five latent variables: pH, the Zr/Rb ratio, environmental factors, nutrient factors, and metal oxide factors. The selection of manifest variables for these constructs was guided by reliability assessments, including Cronbach’s alpha, Dillon–Goldstein’s rho, and an analysis of loadings and cross-loadings [49]. Following this screening procedure, the retained manifest variables were as follows: pH; Zr/Rb ratio; environmental factors (temperature, precipitation, and evaporation); nutrient factors (OC, TN, and TP); and metal oxides (Al3+, Fe3+, and Ca2+). Notably, data for TP and Ca2+, which initially exhibited negative weights, were corrected by multiplying their values by −1. The significance of path coefficients, which quantify the relationships between latent variables, was evaluated. To assess the predictive power of the model and guard against overfitting, we performed a k-fold cross-validation using the PLSpredict procedure with ten folds. This approach compares the prediction errors (i.e., RMSE) of the PLS-PM against a simple linear model benchmark, thereby evaluating the model’s out-of-sample predictive capability. Overall model fit was assessed using the goodness-of-fit (GOF) index [50].
Furthermore, Mantel tests were employed to assess the correlations between soil PTE concentrations and their associated environmental variables. All statistical analyses and visualizations were conducted in R version 4.2.3 (R Core Team, 2023), leveraging packages including “vegan” for multivariate analysis, “dplyr” for data manipulation, “ggplot2” for graphics, and “LinkET” for correlation analysis.

3. Results

3.1. Descriptive Statistics

The statistical results of PTE concentrations in soils across different spatial scales within the study area are summarized in Table 1. At the catchment scale, the mean concentrations of Cr, Ni, Cu, Zn, Pb, Cd, As, and Hg were 73.8, 29.0, 36.0, 82.6, 34.5, 0.27, 11.6, and 0.08 mg/kg, respectively. At the sub-catchment scale, no significant differences were observed relative to the catchment scale (p > 0.05), with corresponding values of 76.6, 31.7, 36.2, 87.1, 34.1, 0.27, 10.5, and 0.10 mg/kg. In contrast, regional-scale concentrations were comparable or significantly higher (p < 0.05), measuring 89.2, 43.5, 39.9, 104, 32.8, 0.33, 13.6, and 0.07 mg/kg, respectively. According to the Soil Environmental Quality: Risk Control Standard for Soil Contamination of Agricultural Land [51], the concentrations of Cr, Ni, Cu, Zn, Pb, and Cd exceeded risk screening values at all scales, whereas As and Hg remained at or below the stipulated thresholds. The coefficients of variation (CV) for PTEs ranged from 11.4% to 99.5% across scales, indicating moderate variability (10% < CV < 100%) [52]. Notably, the CV of Cr reached 99.5%, approaching the threshold of weak variability.

3.2. Soil Potentially Toxic Element Dynamics Along the Soil Chronosequence at Different Scales

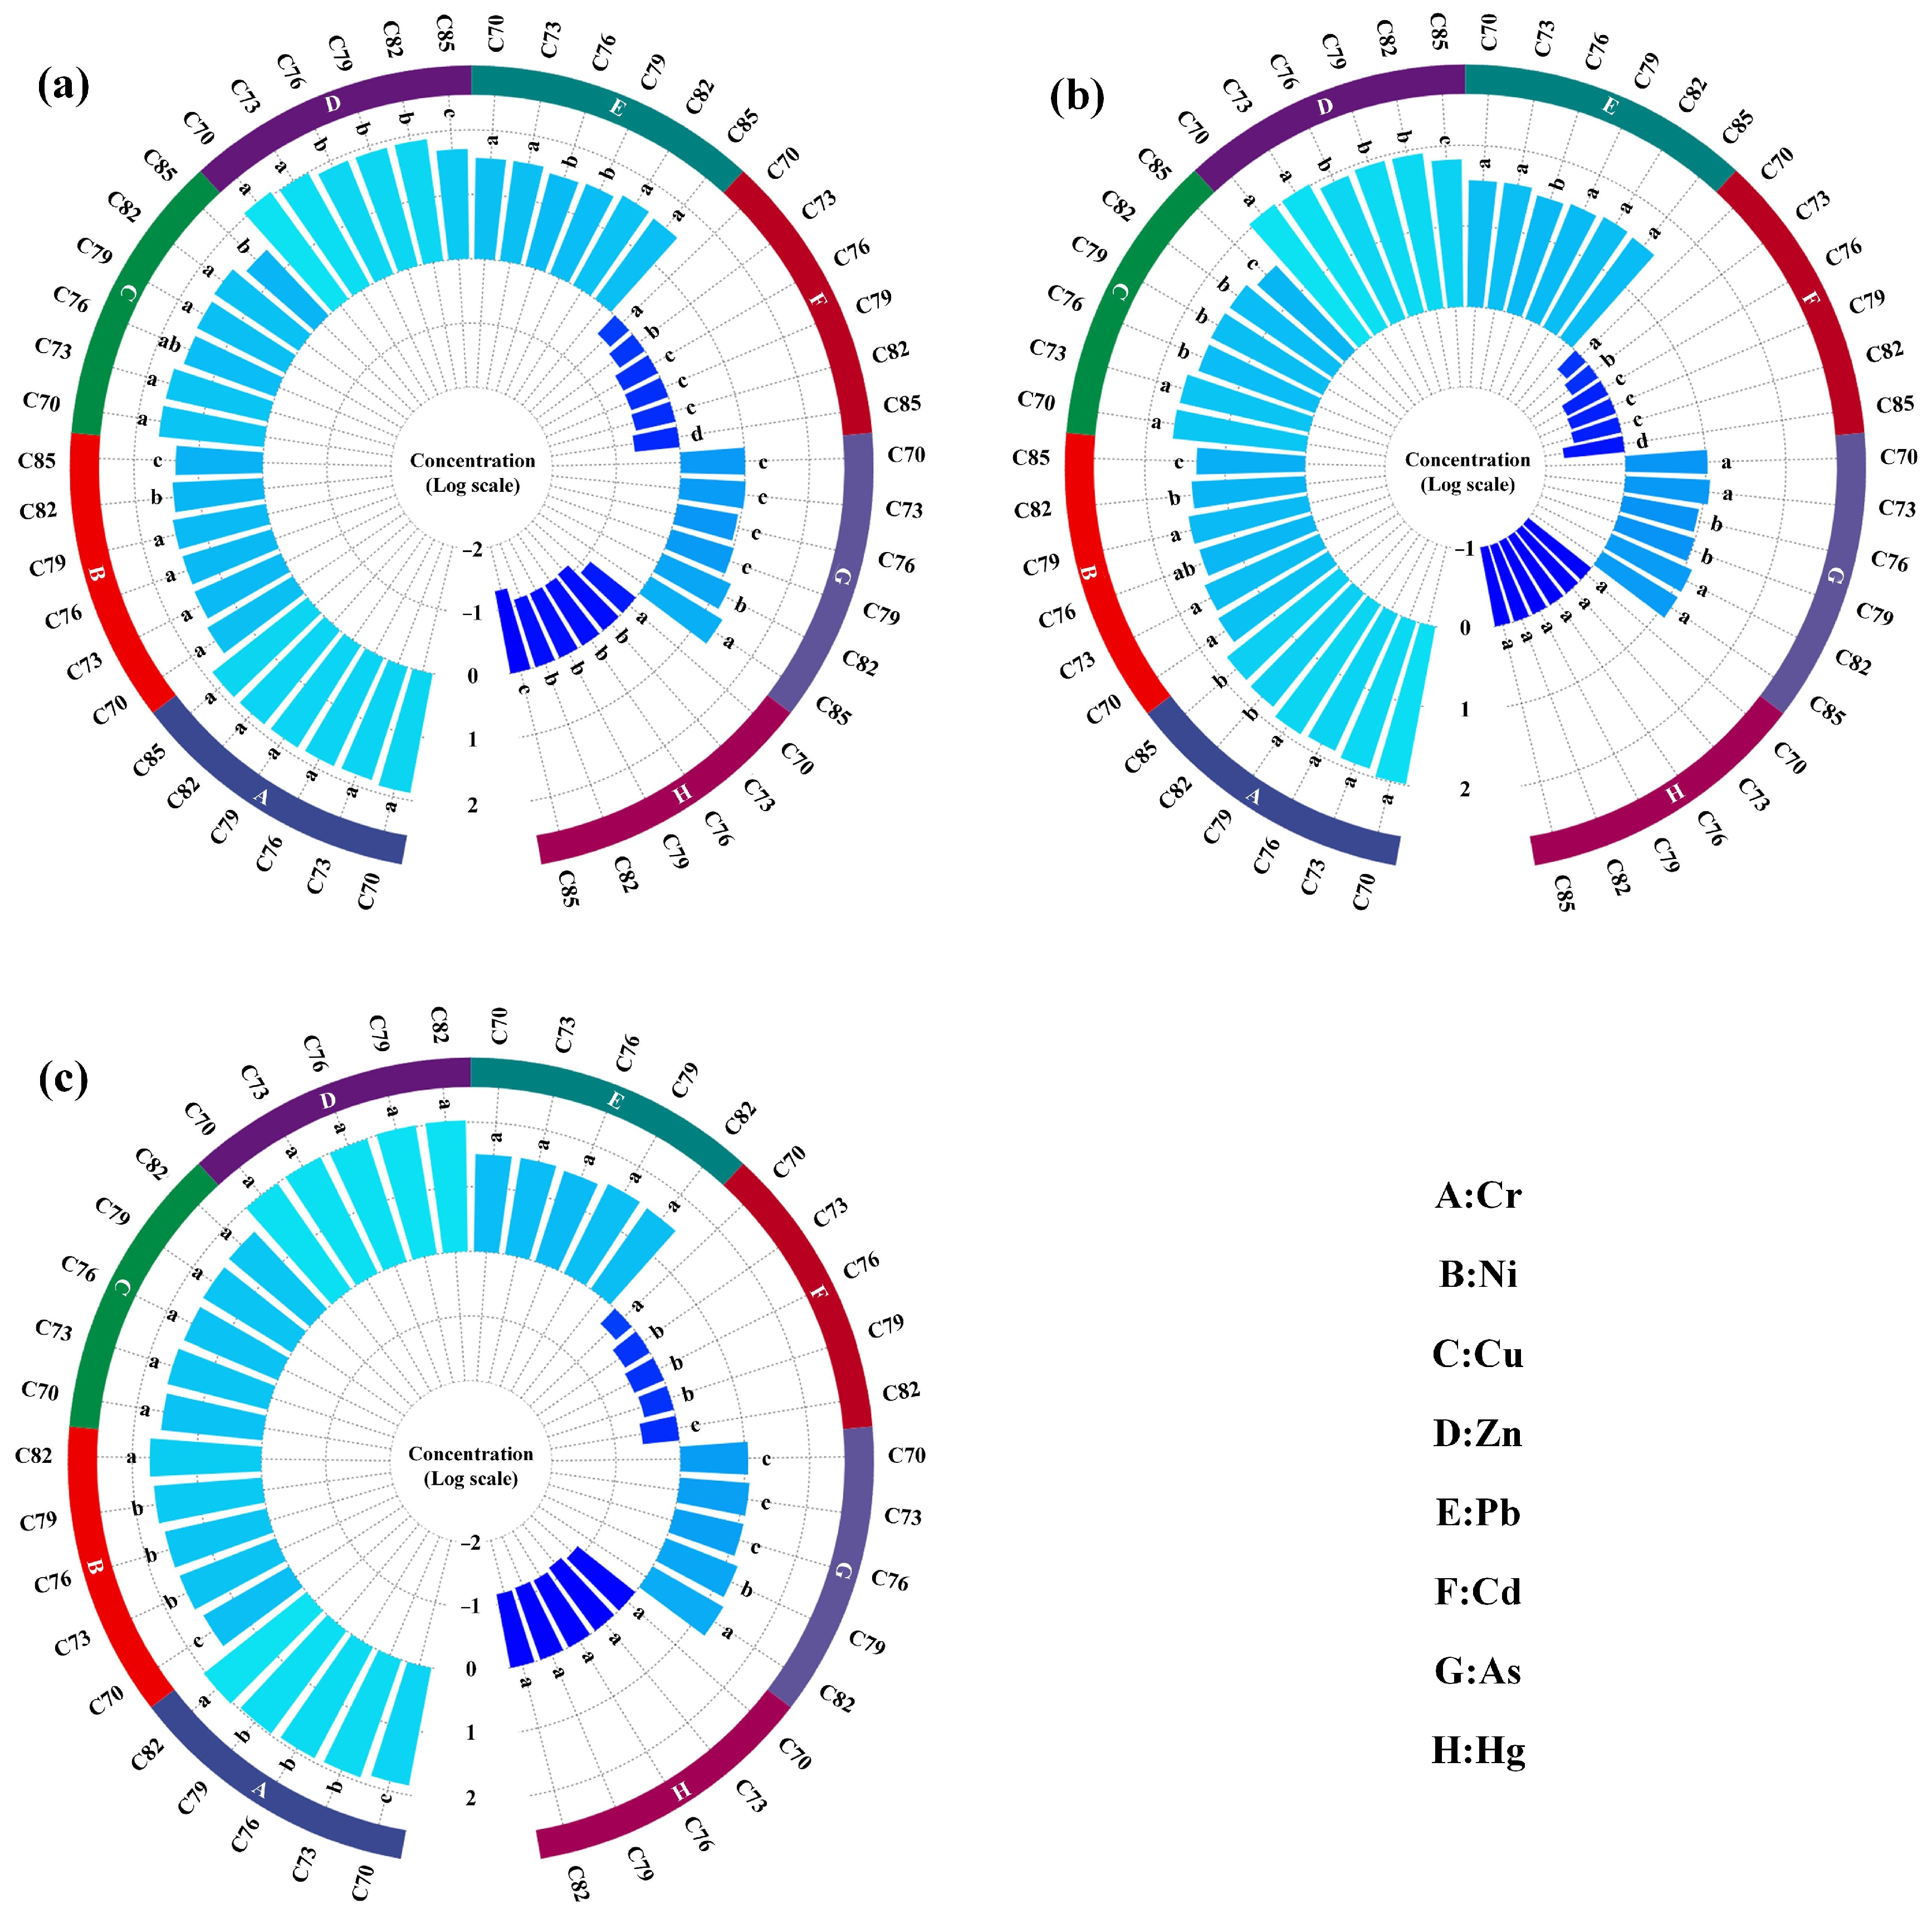
With soil development, the concentrations of PTEs exhibited distinct evolutionary trends that varied significantly across sampling scales (p < 0.05) (Figure 2). At the catchment scale, Ni, Cu, Zn, Cd, and Hg revealed significant decreasing trends (p < 0.05). Of the remaining elements, Cr showed no significant change (p > 0.05), As exhibited a marked increase, and Pb displayed a decrease followed by an increase. At the sub-catchment scale, Cr, Ni, Cu, Zn, and Cd decreased significantly (p < 0.05), whereas Pb and As followed a concave trajectory characterized by an initial decline succeeded by a rise. No significant temporal trend was observed for Hg (p > 0.05). In contrast, at the regional scale, PTEs displayed more divergent behaviors. Cr, Ni, and As concentrations increased over time, Cd decreased significantly (p < 0.05), and Cu, Zn, Pb, and Hg exhibited no statistically significant trends (p > 0.05).

3.3. Variation in Soil Potentially Toxic Elements over Different Land Uses at Different Scales

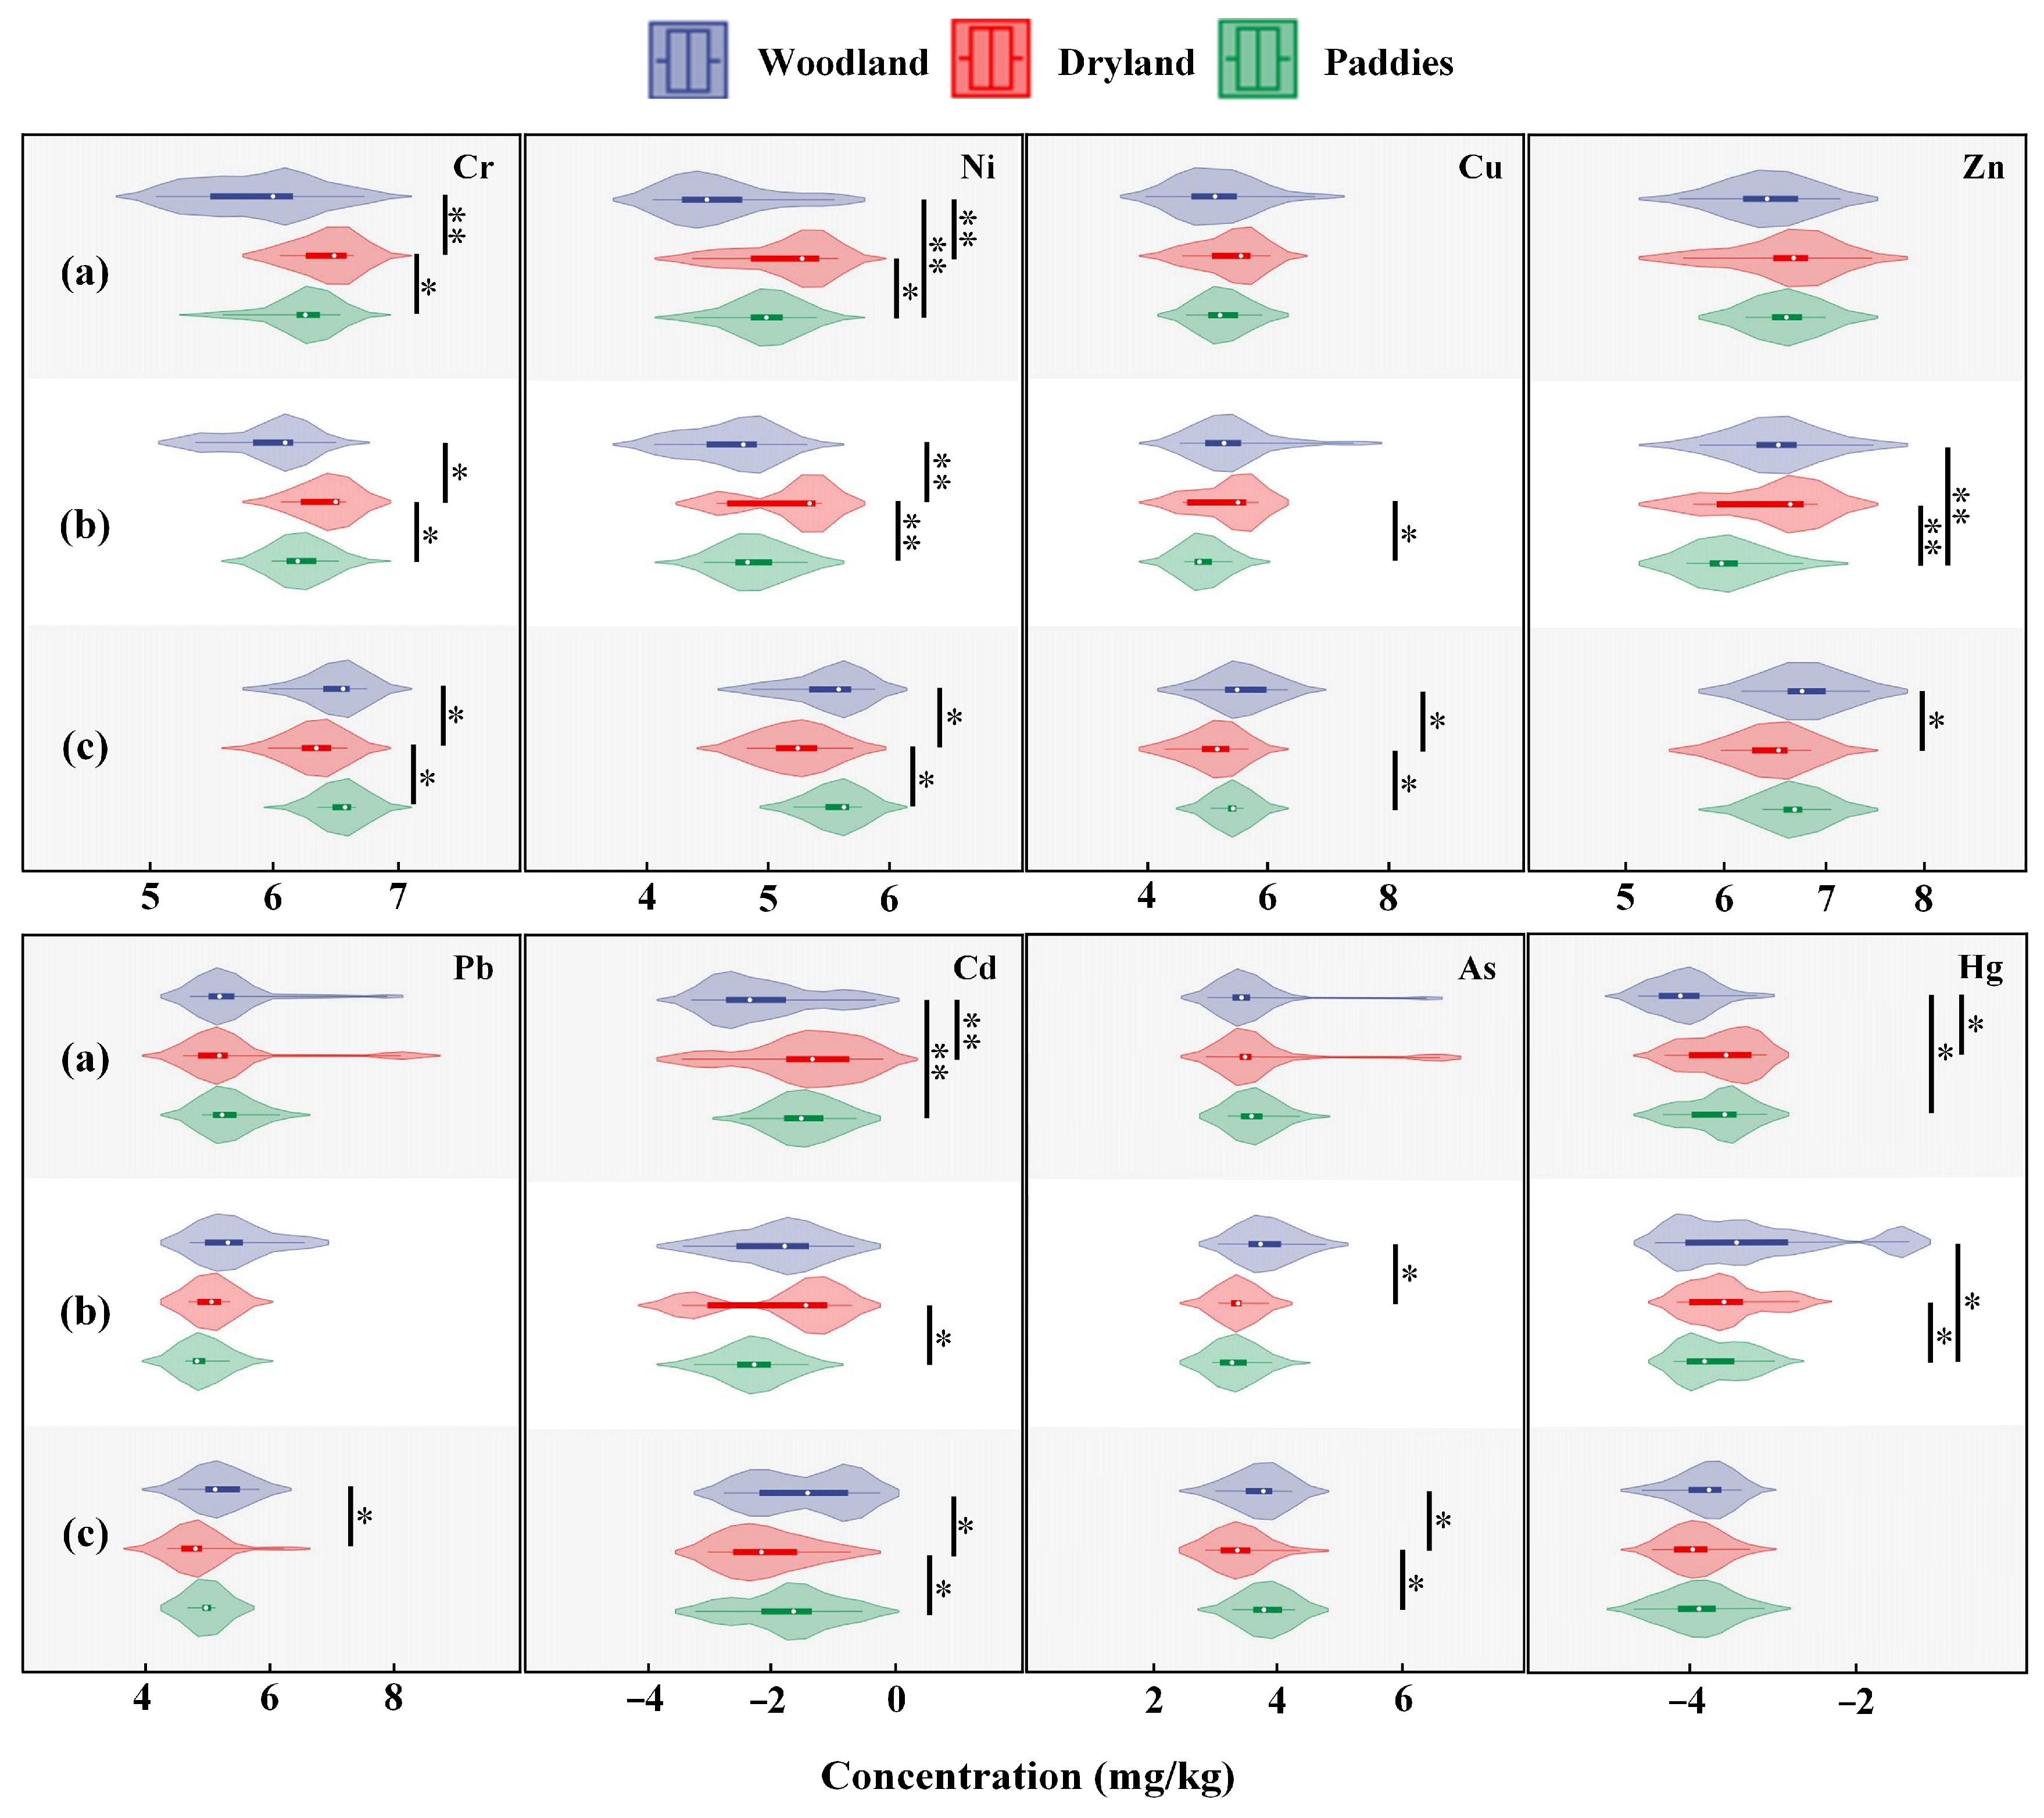
As illustrated in Figure 3, land use significantly influenced soil PTE concentrations across all sampling scales (p < 0.05). At the catchment scale, dryland exhibited significantly higher concentrations of Cr, Ni, Cd, and Hg (p < 0.05). Similarly, at the sub-catchment scale, dryland continued to show elevated concentrations of multiple PTEs, with significantly to extremely significantly increased concentrations of Cr, Ni, Cu, Zn, Cd, and Hg (p < 0.05 to p < 0.001). In contrast, a divergent and even contrasting pattern emerged at the regional scale, where dryland was associated with significantly lower concentrations of Cr, Ni, Cu, Zn, Pb, Cd, and As, indicating a clear scale-dependent reversal in its effect on PTEs’ accumulation.

3.4. Correlation Between Soil Potentially Toxic Elements and Other Soil Properties

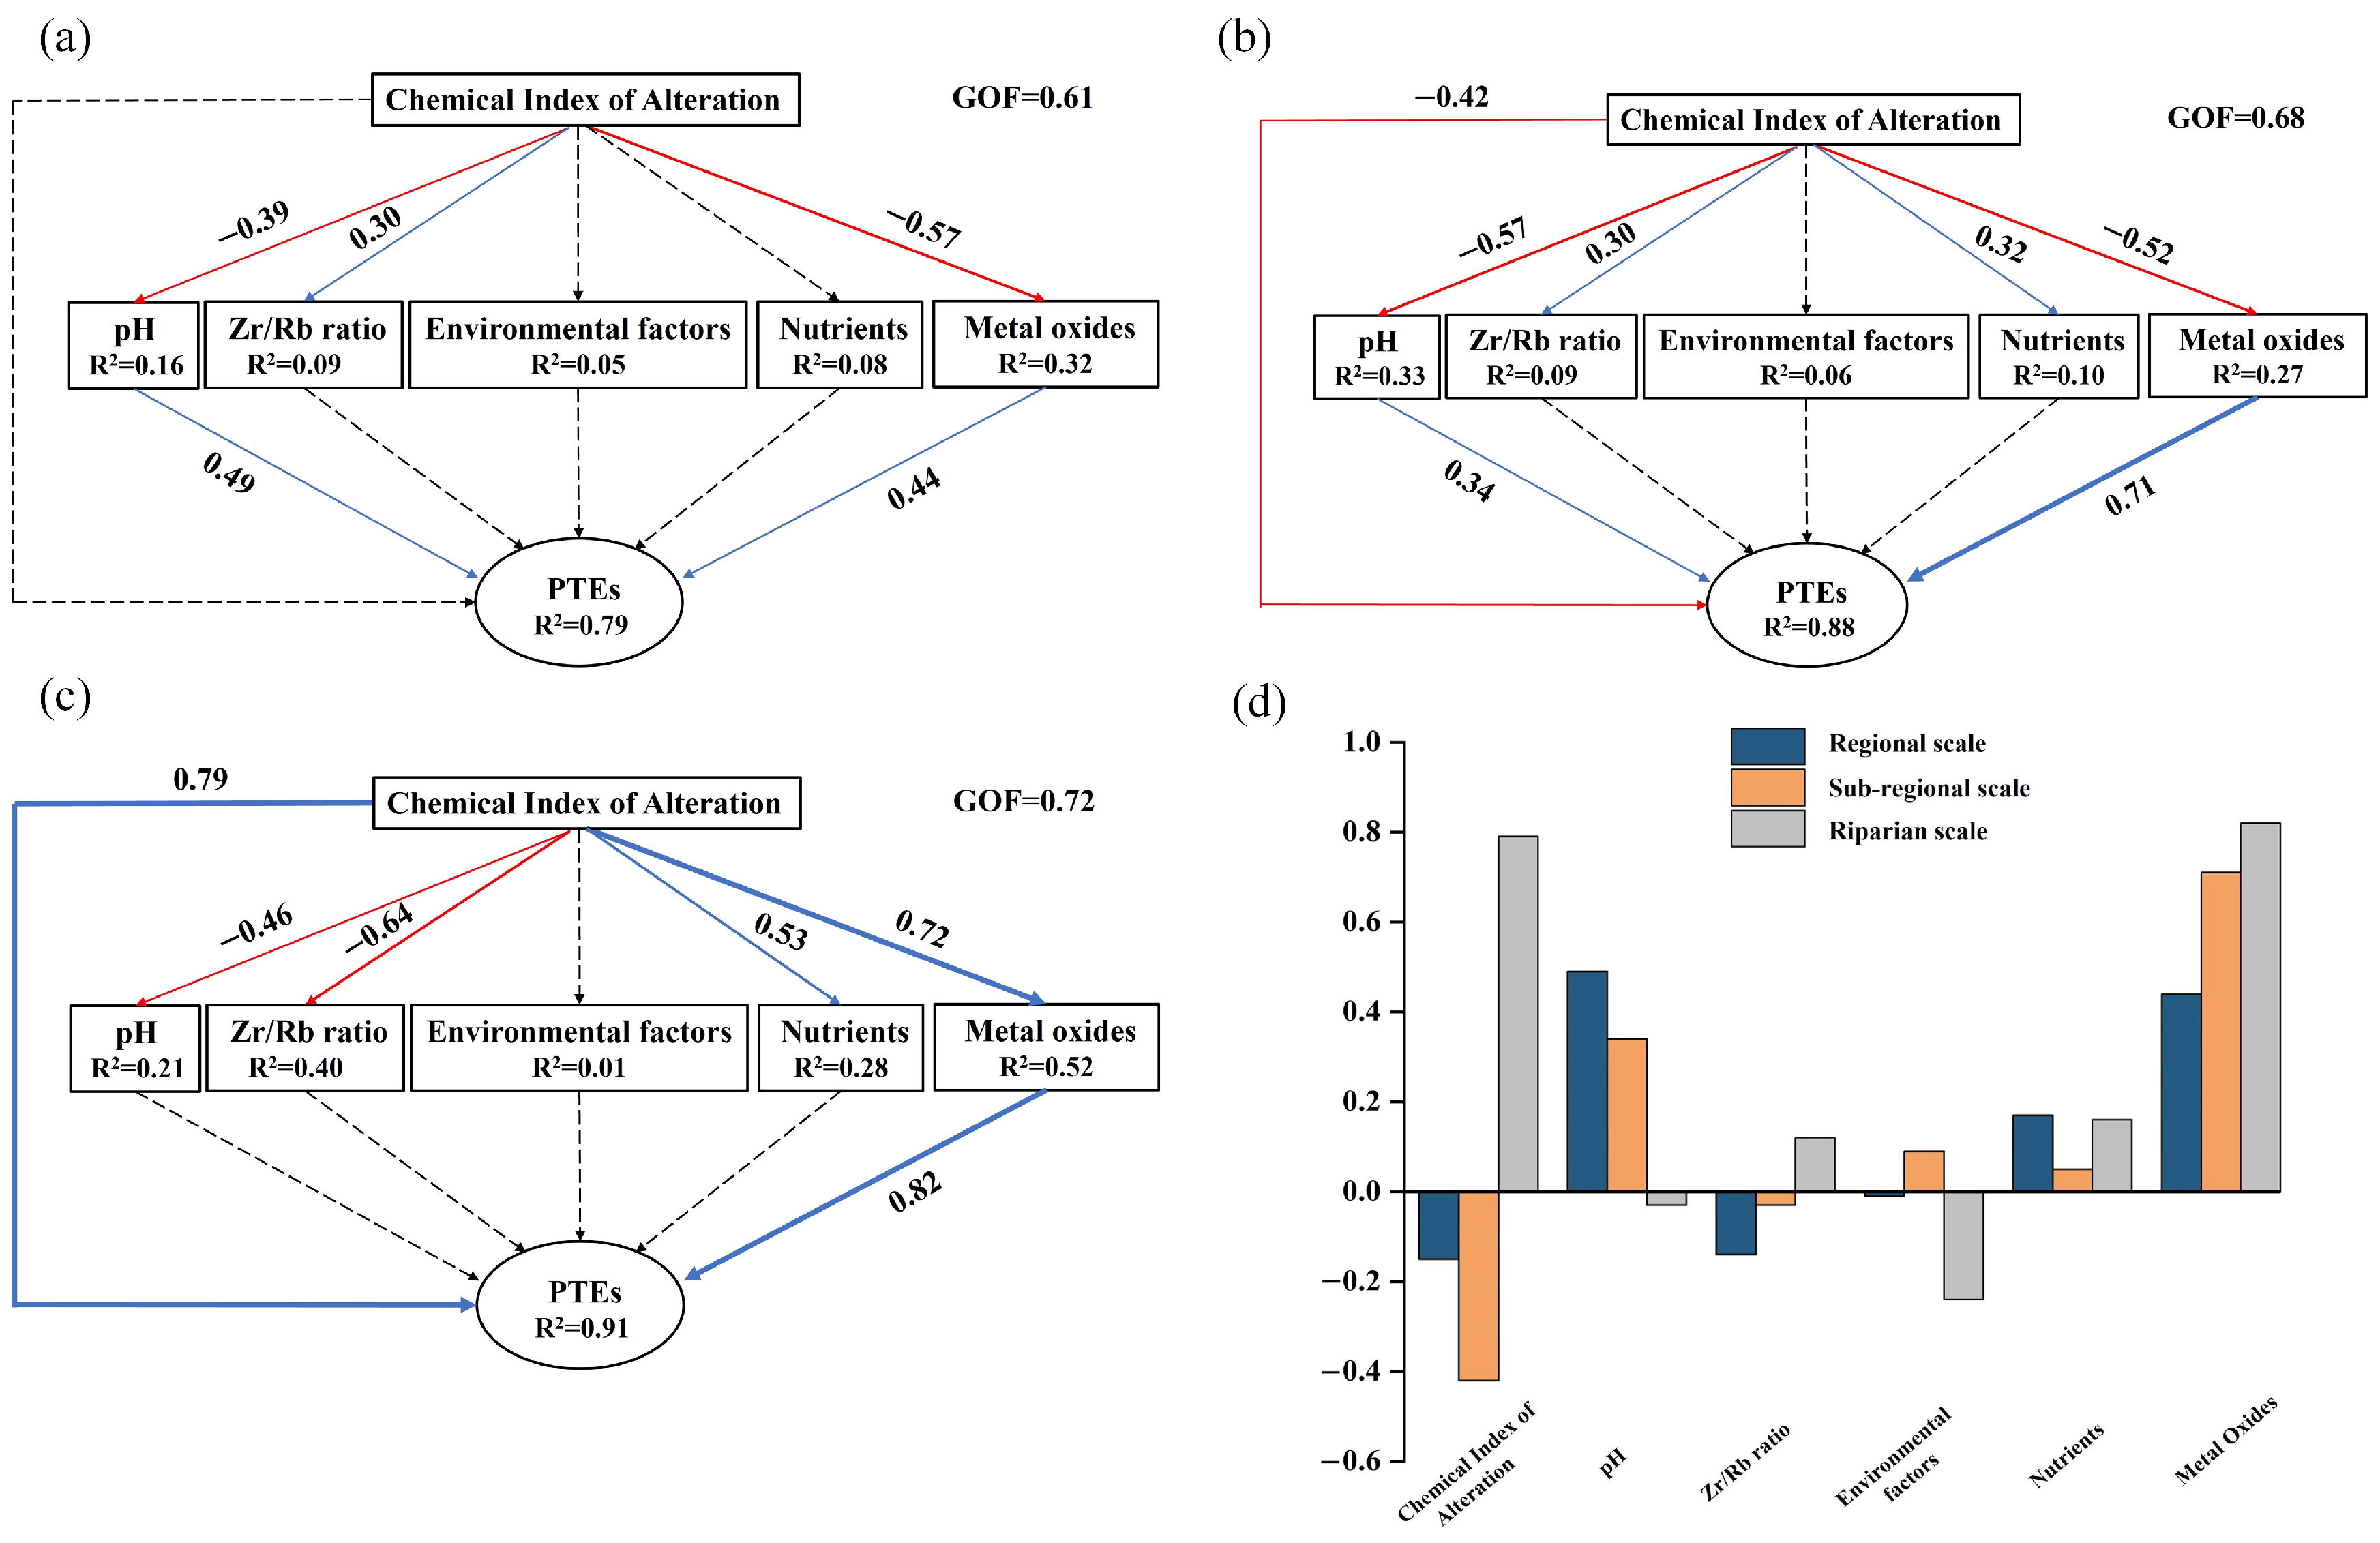
The PLS-PM was employed to examine the direct and indirect associations between the CIA and related factors and soil PTE concentrations across multiple sampling scales (Figure 4). The models accounted for 79%, 88%, and 91% of the variance in PTE concentrations at the catchment, sub-catchment, and regional scales, respectively. A key finding was the scale-dependent association of soil CIA with PTE concentrations: CIA was negatively associated with PTE concentrations at the sub-catchment scale but positively associated at the regional scale (p < 0.05). Soil weathering processes showed indirect associations with PTE concentrations through variations in soil-forming factors (p < 0.05). In particular, variations in metal oxides were consistently associated with higher PTE concentrations across all scales. Additionally, a decrease in soil pH was associated with elevated PTE concentrations at both the catchment and sub-catchment scales.
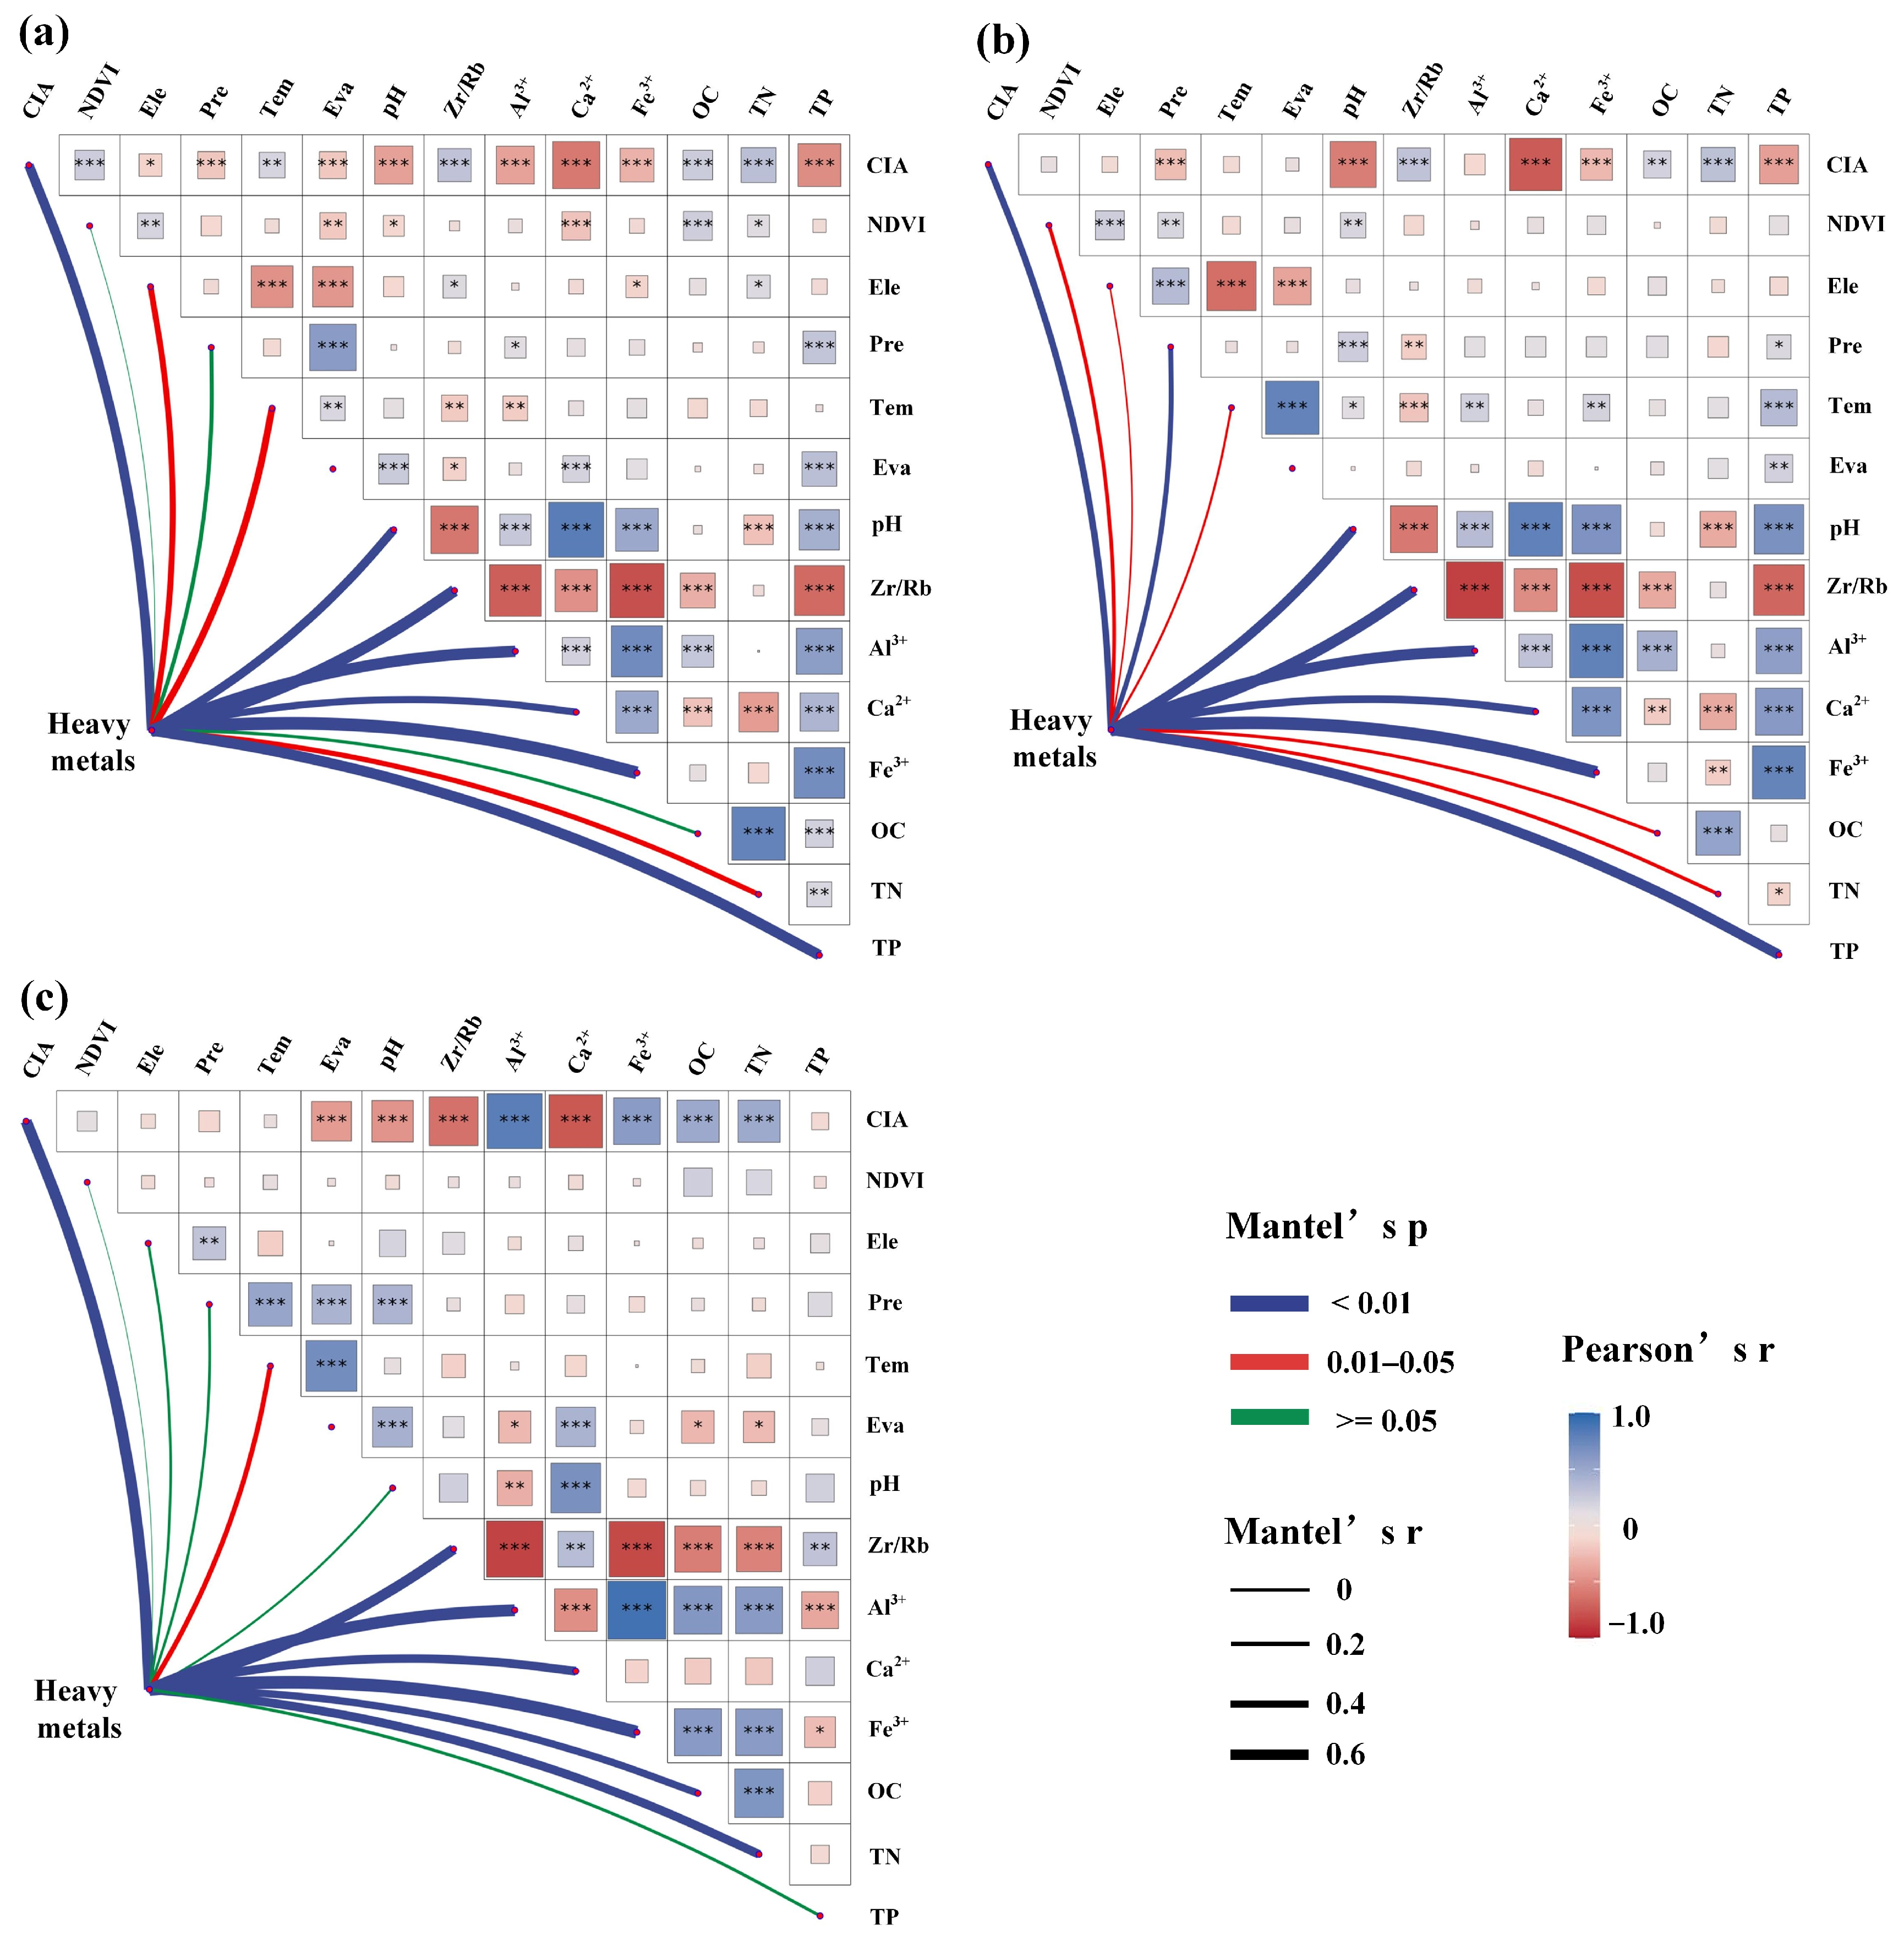
Mantel test results further elucidated the relationships between soil PTE concentrations and associated environmental factors across scales (Figure 5). The analysis revealed that soil CIA, the Zr/Rb ratio, and the contents of Al3+, Ca2+, and Fe3+ showed highly significant correlations with PTE concentrations at all three scales (p < 0.01). Moreover, soil pH and TP were identified as major factors associated with PTE levels at both the catchment and sub-catchment scales. In contrast, OC and TN exhibited highly significant correlations with PTE concentrations (p < 0.01), specifically at the regional scale.

4. Discussion

4.1. Changes in Soil Potentially Toxic Elements in Response to Pedogenic Stage over Different Scales

Multi-scale analysis revealed a scale-dependent transition in the dominant processes governing PTE concentrations and spatial structure. Systematic variations in PTE concentrations and spatial dependencies were observed across scales, reflecting a transition in the dominant environmental processes governing their distribution. Statistical analyses indicated significant enrichment of multiple PTEs, including Cr, Ni, Cu, Zn, Cd, and As, at the regional scale (p < 0.05), suggesting the presence of intensified, localized pollution inputs or geochemical accumulation processes operating at smaller scales [54]. Comparisons with the risk intervention values specified in the Soil Environmental Quality: Risk Control Standard for Soil Contamination of Agricultural Land showed that Cr, Ni, Cu, Zn, Pb, and Cd consistently exceeded regulatory thresholds across all scales, identifying these elements as priority targets for regional environmental risk management. The coefficients of variation for all elements indicated moderate variability (10% < CV < 100%). Notably, Cd exhibited the highest variability, approaching 100%, implying pronounced influences from anthropogenic point sources, such as agricultural fertilization or industrial emissions, on its spatial distribution.
Spatial structure analysis further corroborated the above findings. The well-fitted semivariogram models (R2 = 0.63–0.99) captured the spatial patterns of PTEs. As the sampling scale decreased from catchment and sub-catchment to regional scales, systematic changes in the spatial dependence of PTEs were observed. At both catchment and sub-catchment scales, most PTEs showed low nugget-to-sill ratios and large spatial ranges, indicating that their spatial variability was primarily controlled by structural factors, such as soil parent material, climate, and topography, with limited influence from stochastic anthropogenic activities. In contrast, at the regional scale, a pronounced increase in nugget-to-sill ratios was accompanied by a sharp decrease in spatial range. This transition reflects weakened spatial autocorrelation and a stronger influence of random factors, including discrete anthropogenic inputs such as industrial point-source emissions, fertilizer application, irrigation, and transportation [33]. These processes collectively contribute to a more fragmented and localized spatial distribution of PTEs at smaller scales. Consequently, natural factors dominate at broader scales, while anthropogenic disturbances prevail at finer scales, necessitating scale-specific management—precise source identification and remediation at local scales and background assessment and elucidation of natural mechanisms at larger scales.

4.2. Changes in Soil Potentially Toxic Elements in Response to Pedogenic Stage

The evolutionary trends of soil PTEs during pedogenesis are scale-dependent, with the same element displaying distinct behaviors across observational scales. At the catchment scale, the observed trends reflect the integrated net effect of large-scale natural weathering processes and regional anthropogenic inputs. The general decline in concentrations of Ni, Cu, Zn, Cd, and Hg is primarily governed by elemental mobilization and redistribution during pedogenic weathering. This includes the release of these elements through the decomposition of primary minerals within the soil solid phase, followed by the leaching of soluble ions by percolating water through the soil profile. Furthermore, as weathering progresses, soil physicochemical properties stabilize, rendering the land more suitable for agricultural reclamation. This, in turn, enhances the efficiency of plant uptake of PTEs [55,56]. Conversely, the consistent increase in As and the complex non-monotonic trend of Pb (decreasing initially, then increasing) suggest that large-scale, diffuse anthropogenic activities, such as historical atmospheric deposition and agricultural practices, likely exerted an influence that eventually surpassed the dilution effects of weathering, thereby dominating the overall accumulation trends of these elements at the catchment scale.
At the sub-catchment scale, the spatial heterogeneity of soil weathering intensity exerts a more refined control over elemental behavior. A greater number of elements, including Cr, exhibit significant decreasing trends, indicating that natural weathering and dilution processes dominate more consistently at this intermediate spatial scale. Importantly, the U-shaped evolutionary trajectories (initial decrease followed by increase) observed for Pb and As reveal a critical succession of geochemical processes. In early weathering stages, strong dilution effects prevail. As pedogenesis advances into mid- and late stages, alterations in soil physicochemical properties (e.g., pH and redox conditions) may enhance the soil’s affinity for pollutant adsorption [57,58]. Concurrently, localized anthropogenic inputs become increasingly influential, ultimately leading to a reversal in concentration trends for these elements.
At the regional scale, the distribution and trends of PTEs are governed by a combination of highly localized point-source pollution and site-specific weathering conditions. The numerous cable manufacturing plants in the study area are primary contributors to elevated concentrations of Cr, Ni, and As. Historical emissions from these plants, released through exhaust gases and wastewater leakage or runoff, have persistently influenced the surrounding soils [59]. The decreasing trend of Cd, despite significant anthropogenic influence, may be attributed to its high chemical mobility within intensely weathered soil environments, where pedogenic processes promote its leaching and translocation to deeper layers or downstream areas. At this scale, trend variability is most pronounced, highlighting the necessity of conducting pollution source identification and risk assessments at smaller-scale resolutions. These findings demonstrate that pedogenic and anthropogenic influences are scale-interactive; mechanisms identified at one scale cannot simply be extrapolated to another. Future studies should explicitly address such interactions to better support multi-level environmental management, from regional background establishment to site-specific remediation [60].

4.3. Mechanism of the Impact of Land Use on Soil Potentially Toxic Elements

The influence of land use on soil PTE concentrations was strongly scale-dependent. At both catchment and sub-catchment scales, dryland consistently demonstrated significantly higher concentrations of multiple PTEs (i.e., Cr, Ni, Cd, Hg; p < 0.05) compared to other land uses. This pattern can likely be attributed to three main mechanisms. First, dryland typically relies on intensive external inputs, including phosphate fertilizers, compound fertilizers, and organic amendments often containing PTE impurities, which constitute a continuous source of PTEs’ introduction [27,61]. Second, unlike the submerged, anaerobic conditions of paddy soils, the aerobic environment of dryland soils favors the presence of certain PTEs (i.e., Cr, Ni) in soluble, high-valence states, enhancing their mobility and bioavailability, thereby potentially reducing their migration and loss [62,63]. Finally, the relatively low continuity of vegetation cover in drylands increases their exposure to atmospheric deposition of PTEs [64,65]. Thus, at intermediate and larger scales, the combined effects of anthropogenic input and natural processes may render drylands an accumulation sink for PTEs.
However, when the analysis was refined to the regional scale, a divergent pattern emerged: PTE concentrations in dryland were significantly lower compared to those under other land uses (p < 0.05). This reversal likely reflects a combination of spatially correlated factors rather than a single dominant mechanism. Several possible explanations merit consideration. First, land-use maps indicate that woodland and paddy fields are situated closer to known industrial emission sources, including a high density of cable manufacturing plants that are recognized point sources of Cr, Ni, Cu, and Pb [66]. Historical emissions from these facilities may have caused severe contamination in adjacent soils. Second, the substantial irrigation demand of paddy ecosystems could introduce additional PTEs through contaminated water sources, although direct evidence for this pathway is currently unavailable. Third, differences in soil texture and organic matter content among land-use types may also partly account for the observed pattern by influencing metal retention. Given the observational nature of this study, the current dataset cannot definitively isolate a single cause, and targeted sampling combined with geochemical fingerprinting is recommended in future work to resolve these interacting factors. Consequently, the elevated PTEs in woodland and paddies may partly reflect proximity to industrial sources; this does not imply that dryland systems inherently lack the capacity to accumulate PTEs; rather, it highlights how extreme industrial point sources can dominate spatial statistics at micro-scales. For management, risk screening at larger scales should prioritize cumulative risks in agricultural drylands, whereas smaller-scale remediation must focus on exposure scenarios of land uses near industrial and transportation sources.

4.4. Evolution of Soil Properties and Their Regulation of Potentially Toxic Elements

The associations of pedogenic chemical weathering intensity and various environmental factors with soil PTE concentrations varied significantly across spatial scales. The high goodness-of-fit (GOF) values of the model (79–91%) indicate that the selected variables effectively explain the variance in PTE concentrations at each scale. The CIA exhibited a distinct scale-dependent association with PTE concentrations. At the sub-catchment scale, the CIA was significantly negatively associated with PTE concentrations (p < 0.05), suggesting that intensified weathering may be linked to reduced metal concentrations, likely due to dilution effects, adsorption by clay particles, and enhanced elemental mobility during pedogenesis. In contrast, at the regional scale, the CIA was significantly positively associated with PTE concentrations, indicating the re-accumulation of PTEs in highly weathered settings. This divergence may be attributed to the adsorption and fixation of metals by secondary minerals (e.g., Fe and Al oxides) and the release of metal elements through advanced dissolution of primary minerals [67,68]. Weathering processes also showed indirect associations with PTE concentrations through variations in soil-forming factors. Notably, variations in metal oxides were consistently associated with PTEs’ enrichment across all scales. This association may be explained by the formation of secondary Fe-, Mn-, and Al-(oxyhydr) oxides during weathering, which can act as effective sinks for PTEs through specific adsorption, coprecipitation, and surface complexation [22,69]. Such processes likely account for the consistent association between metal oxides and PTEs’ accumulation across spatial scales.
Mantel tests further examined, from a multivariate correlation perspective, the relationships between associated environmental factors and PTE concentrations. The CIA, Zr/Rb ratio, and cation concentrations (Al3+, Ca2+, Fe3+) showed extremely significant correlations with PTE concentrations (p < 0.01), indicating that weathering intensity, soil texture, and geochemical partitioning are closely correlated with PTEs’ behavior. Notably, soil pH was identified as a major factor associated with PTE concentrations at both the catchment and sub-catchment scales, where lower pH was significantly associated with higher PTE accumulation. This association is likely attributable to H+ ions competing for adsorption sites, facilitating metal desorption, and increasing solubility [70]. In contrast, at the regional scale, OC and TN showed highly significant correlations, suggesting that organic matter–metal complexation and inputs from agricultural amendments (e.g., organic fertilizers) are closely linked to PTEs’ accumulation [71]. This reflects a discernible association between anthropogenic organic management practices and PTEs’ cycling at smaller spatial resolutions. In summary, the distribution of soil PTEs is associated with weathering processes, pedogenesis, and anthropogenic inputs, and the factors most strongly correlated with PTEs’ shift substantially across sampling scales. Future regional environmental risk assessments and pollution remediation strategies should explicitly consider these scale-dependent associations, developing context-specific and scale-adapted management approaches.

5. Conclusions

This study employed a multi-scale analytical framework combined with a soil chronosequence to systematically investigate the distribution of PTEs in alluvial soils of the lower Yangtze River region, with emphasis on the roles of pedogenic processes and land use. The results demonstrate pronounced scale-dependent characteristics in PTE concentrations, with overall levels significantly elevated at the regional scale. Evolutionary trends during soil development also varied across scales: PTE concentrations generally decreased at the catchment and sub-catchment scales, while elements such as Cr, Ni, and As exhibited increasing trends at the regional scale. Compared to adjacent woodland and paddies, dryland soils showed elevated PTEs’ accumulation at catchment and sub-catchment scales but significantly lower concentrations at the regional scale. The CIA was associated with PTEs’ behavior primarily through metal oxides acting as common carriers. Soil pH and TP were identified as the factors most strongly correlated with PTEs at larger scales, whereas OC and TN played more substantial roles at the regional scale. These findings reveal how pedogenesis and land use jointly shape PTE distributions in a scale-dependent manner, highlighting the novelty of a chronosequence-based multi-scale approach for disentangling their effects. This framework provides a scientific basis for stratified soil management, and future studies can extend this framework to evaluate adaptive strategies under evolving land-use conditions, further advancing sustainability in alluvial agroecosystems.

Supplementary Materials

The following supporting information can be downloaded at https://www.mdpi.com/article/10.3390/agriculture16111195/s1. Figure S1: The linear correlation between soil age and the Chemical Index of Alteration (CIA). Table S1: Statistical characteristics of soil PTEs along the soil chronosequence at different scales. Table S2: Cross-validation results of the PLS-PM model.

Author Contributions

Conceptualization, B.S. and C.G.; methodology, B.S. and Y.S.; software, B.S.; validation, C.G.; formal analysis, B.S. and Y.S.; investigation, B.S., S.S., and Y.Z.; resources, C.G.; data curation, C.G.; writing—original draft preparation, B.S.; writing—review and editing, C.G.; visualization, B.S.; supervision, C.G.; project administration, C.G.; funding acquisition, C.G. All authors have read and agreed to the published version of the manuscript.

Funding

This research was funded by project No. ZR2024QD200 supported by Shandong Provincial Natural Science Foundation; project No. 41877002 supported by National Natural Science Foundation of China; project No. 24BGL139 supported by National Social Science Foundation of China; and project No. 242300420595 supported by Henan Provincial Natural Science Foundation.

Institutional Review Board Statement

Not applicable.

Informed Consent Statement

Not applicable.

Data Availability Statement

The data presented in this study are available on request from the corresponding author.

Conflicts of Interest

The authors declare no conflicts of interest.

References

  1. Chen, X.; Xia, X.; Zhao, Y.; Zhang, P. Heavy metal concentrations in roadside soils and correlation with urban traffic in Beijing, China. J. Hazard. Mater. 2010, 181, 640–646. [Google Scholar] [CrossRef]
  2. Bai, Y.; Wang, M.; Peng, C.; Alatalo, J.M. Impacts of urbanization on the distribution of heavy metals in soils along the Huangpu River, the drinking water source for Shanghai. Environ. Sci. Pollut. Res. 2016, 23, 5222–5231. [Google Scholar] [CrossRef] [PubMed]
  3. Doabi, S.A.; Karami, M.; Afyuni, M.; Yeganeh, M. Pollution and health risk assessment of heavy metals in agricultural soil, atmospheric dust and major food crops in Kermanshah province, Iran. Ecotoxicol. Environ. Saf. 2018, 163, 153–164. [Google Scholar] [CrossRef]
  4. Sodaeizadeh, S.; Karimian, A.; Jafari, S.; Arani, A. A preliminary study on heavy metal monitoring in soil and guar (Cyamopsis tetragonoloba) biomass amended with sewage sludge. Environ. Monit. Assess. 2024, 196, 201. [Google Scholar] [CrossRef] [PubMed]
  5. Horckmans, L.; Swennen, R.; Deckers, J.; Maquil, R. Local background concentrations of trace elements in soils: A case study in the Grand Duchy of Luxembourg. CATENA 2005, 59, 279–304. [Google Scholar] [CrossRef]
  6. Hu, W.; Wang, H.; Dong, L.; Huang, B.; Borggaard, O.K.; Bruun Hansen, H.C.; He, Y.; Holm, P.E. Source identification of heavy metals in peri-urban agricultural soils of southeast China: An integrated approach. Environ. Pollut. 2018, 237, 650–661. [Google Scholar] [CrossRef]
  7. Li, Q.; Wu, Z.; Chu, B.; Zhang, N.; Cai, S.; Fang, J. Heavy metals in coastal wetland sediments of the Pearl River Estuary, China. Environ. Pollut. 2007, 149, 158–164. [Google Scholar] [CrossRef]
  8. Lv, J.; Liu, Y.; Zhang, Z.; Dai, J.; Dai, B.; Zhu, Y. Identifying the origins and spatial distributions of heavy metals in soils of Ju country (Eastern China) using multivariate and geostatistical approach. J. Soil. Sediment. 2015, 15, 163–178. [Google Scholar] [CrossRef]
  9. Sohrabizadeh, Z.; Sodaeizadeh, H.; Hakimzadeh, M.; Mehrjardi, R.; Bafghi, M. A statistical approach to study the spatial heavy metal distribution in soils in the Kushk Mine, Iran. Geosci. Data J. 2022, 10, 315–327. [Google Scholar] [CrossRef]
  10. Xia, X.; Chen, X.; Liu, R.; Liu, H. Heavy metals in urban soils with various types of land use in Beijing, China. J. Hazard. Mater. 2011, 186, 2043–2050. [Google Scholar] [CrossRef]
  11. Ayoubi, S.; Karami, M. Pedotransfer functions for predicting heavy metals in natural soils using magnetic measures and soil properties. J. Geochem. Explor. 2019, 197, 212–219. [Google Scholar] [CrossRef]
  12. Brito, W.B.M.; Campos, M.C.C.; Mantovanelli, B.C.; da Cunha, J.M.; Franciscon, U.; Soares, M.D.R. Spatial variability of soil physical properties in Archeological Dark Earths under different uses in southern Amazon. Soil. Till. Res. 2018, 182, 103–111. [Google Scholar] [CrossRef]
  13. Hu, N.; Liu, J.; Huang, P.; Yan, S.; Shi, X.; Ma, D. Sources, geochemical speciation, and risk assessment of metals in coastal sediments: A case study in the Bohai Sea, China. Environ. Earth Sci. 2017, 76, 309. [Google Scholar] [CrossRef]
  14. Fritioff, A.; Kautsky, L.; Greger, M. Influence of temperature and salinity on heavy metal uptake by submersed plants. Environ. Pollut. 2005, 133, 265–274. [Google Scholar] [CrossRef] [PubMed]
  15. Lv, J.; Liu, Y. An integrated approach to identify quantitative sources and hazardous areas of heavy metals in soils. Sci. Total Environ. 2019, 646, 19–28. [Google Scholar] [CrossRef]
  16. Park, J.H.; Lamb, D.; Paneerselvam, P.; Choppala, G.; Bolan, N.; Chung, J.W. Role of organic amendments on enhanced bioremediation of heavy metal(loid) contaminated soils. J. Hazard. Mater. 2011, 185, 549–574. [Google Scholar] [CrossRef] [PubMed]
  17. Wei, B.; Yang, L. A review of heavy metal contaminations in urban soils, urban road dusts and agricultural soils from China. Microchem. J. 2010, 94, 99–107. [Google Scholar] [CrossRef]
  18. Wu, P.; Yin, A.; Yang, X.; Zhang, H.; Fan, M.; Gao, C. Distribution and source identification of heavy metals in the sediments of a river flowing an urbanization gradient, Eastern China. Environ. Earth Sci. 2017, 76, 745. [Google Scholar] [CrossRef]
  19. Wong, S.; Li, X.; Zhang, G.; Qi, S.; Min, Y. Heavy metals in agricultural soils of the pearl river delta, South China. Environ. Pollut. 2002, 119, 33–44. [Google Scholar] [CrossRef]
  20. Song, Y.; Ji, J.; Mao, C.; Yang, Z.; Yuan, X.; Ayoko, G.A.; Frost, R.L. Heavy metal contamination in suspended solids of Changjiang River-environmental implications. Geoderma 2010, 159, 286–295. [Google Scholar] [CrossRef]
  21. Zhang, H.; Yin, A.; Yang, X.; Fan, M.; Shao, S.; Wu, J.; Wu, P.; Zhang, M.; Gao, C. Use of machine-learning and receptor models for prediction and source apportionment of heavy metals in coastal reclaimed soils. Ecol. Indic. 2021, 122, 107233. [Google Scholar] [CrossRef]
  22. Dankoub, Z.; Ayoubi, S.; Khademi, H.; Lu, S. Spatial distribution of magnetic properties and selected heavy metals in calcareous soils as affected by land use in the Isfahan region, Central Iran. Pedosphere 2012, 22, 33–47. [Google Scholar] [CrossRef]
  23. Nziguheba, G.; Smolders, E. Inputs of trace elements in agricultural soils via phosphate fertilizers in European countries. Sci. Total Environ. 2008, 390, 53–57. [Google Scholar] [CrossRef] [PubMed]
  24. Liu, G.; Wang, J.; Zhang, E.; Hou, J.; Liu, X. Heavy metal speciation and risk assessment in dry land and paddy soils near mining areas at Southern China. Environ. Sci. Pollut. Res. Int. 2016, 23, 8709–8720. [Google Scholar] [CrossRef]
  25. Shao, D.; Zhan, Y.; Zhou, W.; Zhu, L. Current status and temporal trend of heavy metals in farmland soil of the Yangtze River Delta Region: Field survey and meta-analysis. Environ. Pollut. 2016, 219, 329–336. [Google Scholar] [CrossRef]
  26. Lu, A.; Li, B.; Li, J.; Chen, W.; Xu, L. Heavy metals in paddy soil-rice systems of industrial and township areas from subtropical China: Levels, transfer and health risks. J. Geochem. Explor. 2018, 194, 210–217. [Google Scholar] [CrossRef]
  27. Ran, J.; Wang, D.; Wang, C.; Zhang, G.; Zhang, H. Heavy metal contents, distribution, and prediction in a regional soil-wheat system. Sci. Total Environ. 2016, 544, 422–431. [Google Scholar] [CrossRef]
  28. Wang, Q.; Xie, Z.; Li, F. Using ensemble models to identify and apportion heavy metal pollution sources in agricultural soils on a local scale. Environ. Pollut. 2015, 206, 227–235. [Google Scholar] [CrossRef]
  29. Wang, M.; Chen, H.; Zhang, W.; Wang, K. Influencing factors on soil nutrients at different scales in a karst area. CATENA 2019, 175, 411–4120. [Google Scholar] [CrossRef]
  30. Li, D.; Gao, G.; Lv, Y.; Fu, B. Multi-scale variability of soil carbon and nitrogen in the middle reaches of the Heihe River basin, northwestern China. CATENA 2016, 137, 328–339. [Google Scholar] [CrossRef]
  31. Liu, Y.; Lv, J.; Zhang, B.; Bi, J. Spatial multi-scale variability of soil nutrients in relation to environmental factors in a typical agricultural region, Eastern China. Sci. Total Environ. 2013, 450–451, 108–119. [Google Scholar] [CrossRef]
  32. Hu, K.; Wang, S.; Li, H.; Huang, F.; Li, B. Spatial scaling effects on variability of soil organic matter and total nitrogen in suburban Beijing. Geoderma 2014, 226–227, 54–63. [Google Scholar] [CrossRef]
  33. Wu, S.; Chen, L.; Wang, N.; Zhang, J.; Wang, S.; Bagarello, V.; Ferro, V. Variable scale effects on hillslope soil erosion during rainfall-runoff processes. CATENA 2021, 207, 105606. [Google Scholar] [CrossRef]
  34. Lu, L.; Li, S.; Wu, R.; Shen, D. Study on the scale effect of spatial variation in soil salinity based on geostatistics: A case study of Yingdaya river irrigation area. Land 2022, 11, 1697. [Google Scholar] [CrossRef]
  35. Schiavo, B.; Valenzuela-Meza, J.; Valera-Fernández, D.; Inguaggiato, C.; Meza-Figueroa, D.; Morton-Bermea, O. Spatial distribution, contamination levels, and health risk of potentially toxic elements in surface soils of an industrial—Urban area in northwestern Mexico: A case study from La Paz, Baja California Sur. Environ. Geochem. Health 2026, 48, 36. [Google Scholar] [CrossRef]
  36. Goncharov, G.; Soktoev, B.; Farkhutdinov, I.; Matveenko, I. Heavy metals in urban soil: Contamination levels, spatial distribution and human health risk assessment (the case of Ufa city, Russia). Environ. Res. 2024, 257, 119216. [Google Scholar] [CrossRef]
  37. Guo, K.; Zhang, Z.; Li, G.; Liu, H.; Wang, Z.; Fu, Y.; Wang, W. Impact of Mining Methods and Mine Types on Heavy Metal (Loid) Contamination in Mine Soils: A Multi-Index Assessment. Minerals 2025, 15, 986. [Google Scholar] [CrossRef]
  38. Jiang, Y.; Chao, S.; Liu, J.; Yang, Y.; Chen, Y.; Zhang, A.; Cao, H. Source apportionment and health risk assessment of heavy metals in soil for a township in Jiangsu Province, China. Chemosphere 2017, 168, 1658–1668. [Google Scholar] [CrossRef] [PubMed]
  39. Wang, S.; Cai, L.; Wen, H.; Luo, J.; Wang, Q.; Liu, X. Spatial distribution and source apportionment of heavy metals in soil from a typical county-level city of Guangdong Province, China. Sci. Total Environ. 2019, 655, 92–101. [Google Scholar] [CrossRef] [PubMed]
  40. Nesbitt, H.W.; Young, G.M. Early proterozoic climates and plate motions inferred from major element chemistry of lutites. Nature 1982, 299, 715–717. [Google Scholar] [CrossRef]
  41. Zhang, G.; Pan, J.; Huang, C.; Gong, T. Geochemical features of a soil chronosequence developed on basalt in Hainan Island, China. Rev. Mex. Cienc. Geológicas 2007, 24, 261–269. [Google Scholar]
  42. Su, B.; Gao, C.; Zhang, H.; Abdul, M.M.; Shao, S.; Zhang, Y.; Jiao, H. Stoichiometry of carbon, nitrogen, and phosphorus in soil: Impacts of soil development and land use across the catchment scale. CATENA 2025, 252, 108862. [Google Scholar] [CrossRef]
  43. Liu, L.; Chen, J.; Ji, J.; Chen, Y.; Balsam, W. Variation of Zr/Rb ratios in the Chinese loess deposits during the past 1.8 Myr and its implication for the change of East Asian monsoon intensity. Geochem. Geophy Geosy 2006, 70, 1471–1482. [Google Scholar] [CrossRef]
  44. Wu, L.; Wilson, D.J.; Wang, R.; Yin, X.; Chen, Z.; Xiao, W.; Huang, M. Evaluating Zr/Rb Ratio from XRF Scanning as an Indicator of Grain-Size Variations of Glaciomarine Sediments in the Southern Ocean. Geochem. Geophy Geosy 2020, 21, e2020GC009350. [Google Scholar] [CrossRef]
  45. Kylander, M.E.; Ampel, L.; Wohlfarth, B.; Veres, D. High-resolution X-ray fluorescence core scanning analysis of Les Echets (France) sedimentary sequence: New insights from chemical proxies. J. Quat. Sci. 2011, 26, 109–117. [Google Scholar] [CrossRef]
  46. Nelson, D.W.; Sommers, L.E. Total carbon, organic carbon and organic matter. In Methods of Soil Analysis, Part 2, 2nd ed.; Page, A.L., Miller, R.H., Keeney, D.R., Eds.; American Society of Agronomy: Madison, WI, USA, 1982; pp. 539–577. [Google Scholar]
  47. Lu, R. Soil and Agricultural Chemistry Analysis Method; China Agriculture Science and Technique Press: Beijing, China, 2000. (In Chinese) [Google Scholar]
  48. Zhao, Z.; Wu, Y.; Chen, W.; Sun, W.; Wang, Z.; Liu, G.; Xue, S. Soil enzyme kinetics and thermodynamics in response to long-term vegetation succession. Sci. Total Environ. 2023, 882, 163542. [Google Scholar] [CrossRef]
  49. Wang, Y.; Li, C.; Tu, B.; Kou, Y.; Li, X. Species pool and local ecological assembly processes shape the β-diversity of diazotrophs in grassland soils. Soil. Biol. Biochem. 2021, 160, 108338. [Google Scholar] [CrossRef]
  50. Sanchez, G. PLS Path Modeling with R, Trowchez Editions. Berkeley. 2013. Available online: http://www.gastonsanchez.com/PLSPathModelingwithR.pdf (accessed on 7 October 2025).
  51. GB15618-2018; Soil Environmental Quality-Risk Control Standard for Soil Contamination of Agricultural Land. China National Environmental Protection Agency: Beijing, China, 2018. (In Chinese)
  52. Su, B.; Zhao, G.; Dong, C. Spatiotemporal variability of soil nutrients and the responses of growth during growth stages of winter wheat in northern China. PLoS ONE 2018, 13, e0203509. [Google Scholar] [CrossRef]
  53. Wei, F.; Zheng, C.; Wu, Y. Study on the background contents on 61 elements of soils in China. China J. Environ. Sci. 1991, 12, 12–19. (In Chinese) [Google Scholar]
  54. Huang, S.; Liao, Q.; Hua, M.; Wu, X.; Bi, K.; Yan, C.; Chen, B.; Zhang, X. Survey of heavy metal pollution and assessment of agricultural soil in Yangzhong district, Jiangsu Province, China. Chemosphere 2007, 67, 2148–2155. [Google Scholar] [CrossRef]
  55. Xia, P.; Meng, X.; Yin, P.; Cao, Z.; Wang, X. Eighty-year sedimentary record of heavy metal inputs in the intertidal sediments from the Nanliu River estuary, Beibu Gulf of South China Sea. Environ. Pollut. 2011, 159, 92–99. [Google Scholar] [CrossRef]
  56. Guan, Q.; Zhao, R.; Pan, N.; Wang, F.; Yang, Y.; Luo, H. Source apportionment of heavy metals in farmland soil of Wuwei, China: Comparison of three receptor models. J. Clean. Prod. 2019, 237, 117792. [Google Scholar] [CrossRef]
  57. Luo, L.; Ma, Y.; Zhang, S.; Wei, D.; Zhu, Y. An inventory of trace element inputs to agricultural soils in China. J. Environ. Manag. 2009, 90, 2524–2530. [Google Scholar] [CrossRef]
  58. Lu, A.; Wang, J.; Qin, X.; Wang, K.; Han, P.; Zhang, S. Multivariate and geostatistical analyses of the spatial distribution and origin of heavy metals in the agricultural soils in Shunyi, Beijing, China. Sci. Total Environ. 2012, 425, 66–74. [Google Scholar] [CrossRef] [PubMed]
  59. Mcilwaine, R.; Doherty, R.; Cox, S.F.; Cave, M. The relationship between historical development and potentially toxic element concentrations in urban soils. Environ. Pollut. 2017, 220, 1036–1049. [Google Scholar] [CrossRef] [PubMed]
  60. Nanos, N.; Martín, J.A.R. Multiscale analysis of heavy metal contents in soils: Spatial variability in the Duero river basin (Spain). Geoderma 2012, 189–190, 554–562. [Google Scholar] [CrossRef]
  61. Wu, J.; Lu, J.; Li, L.; Min, X.; Luo, Y. Pollution, ecological-health risks, and sources of heavy metals in soil of the northeastern Qinghai-Tibet Plateau. Chemosphere 2018, 201, 234–242. [Google Scholar] [CrossRef]
  62. Zhao, K.; Liu, X.; Xu, J.; Selim, H.M. Heavy metal contaminations in a soil-rice system: Identification of spatial dependence in relation to soil properties of paddy fields. J. Hazard. Mater. 2010, 181, 778–787. [Google Scholar] [CrossRef]
  63. Shi, Z.; Di Toro, D.M.; Allen, H.E.; Sparks, D.L. A general model for kinetics of heavy metal adsorption and desorption on soils. Environ. Sci. Technol. 2013, 47, 3761–3767. [Google Scholar] [CrossRef]
  64. Bolan, N.S.; Duraisamy, V.P. Role of inorganic and organic soil amendments on immobilisation and phytoavailability of heavy metals: A review involving specific case studies. Soil. Res. 2003, 41, 533–555. [Google Scholar] [CrossRef]
  65. Micó, C.; Recatalá, L.; Peris, M.; Sánchez, J. Assessing heavy metal sources in agricultural soils of an European Mediterranean area by multivariate analysis. Chemosphere 2006, 65, 863–872. [Google Scholar] [CrossRef]
  66. Sun, Y.; Zhou, Q.; Xie, X.; Liu, R. Spatial, sources and risk assessment of heavy metal contamination of urban soils in typical regions of Shenyang, China. J. Hazard. Mater. 2010, 174, 455–462. [Google Scholar] [CrossRef]
  67. Wang, C.; Yang, Z.; Zhong, C.; Ji, J. Temporal-spatial variation and source apportionment of soil heavy metals in the representative river-alluviation depositional system. Environ. Pollut. 2016, 216, 18–26. [Google Scholar] [CrossRef]
  68. Zhang, P.; Qin, C.; Hong, X.; Kang, G.; Qin, M.; Yang, D.; Pang, B.; Li, Y.; He, J.; Dick, R.P. Risk assessment and source analysis of soil heavy metal pollution from lower reaches of Yellow River irrigation in China. Sci. Total Environ. 2018, 633, 1136–1147. [Google Scholar] [CrossRef]
  69. Chen, X.; Lu, X. Contamination characteristics and source apportionment of heavy metals in topsoil from an area in Xi’an city, China. Ecotoxicol. Environ. Saf. 2018, 151, 153–160. [Google Scholar] [CrossRef]
  70. Guan, Q.; Wang, F.; Xu, C.; Pan, N.; Lin, J.; Zhao, R.; Yang, Y.; Luo, H. Source apportionment of heavy metals in agricultural soil based on PMF: A case study in Hexi Corridor, northwest China. Chemosphere 2018, 193, 189–197. [Google Scholar] [CrossRef]
  71. Weng, L.; Temminghoff, E.J.M.; Lofts, S.; Tipping, E.; Van Riemsdijk, W.H. Complexation with dissolved organic matter and solubility control of heavy metals in a sandy soil. Environ. Sci. Technol. 2002, 36, 4804–4810. [Google Scholar] [CrossRef]
Figure 1. Geographic location of the study area and sampling sites. (a) Catchment scale; (b) sub-catchment scale; (c) regional scale.
Agriculture 16 01195 g001
Figure 2. Dynamics of potentially toxic soil elements across sampling scales along the soil developmental gradient. The concentrations of potentially toxic soil elements were log-transformed. (a) Catchment scale; (b) sub-catchment scale; (c) regional scale. Different lowercase letters indicate that the means are different at p < 0.05 across different soil developmental stages. C70, C73, C76, C79, C82, and C85 denote the Chemical Index of Alteration of 70, 73, 76, 79, 82, and 85, respectively.
Agriculture 16 01195 g002
Figure 3. Soil heavy metal concentrations under different land uses across sampling scales. * and ** denote significant differences at the p < 0.05 and p < 0.01 levels, respectively, among values across different land uses at the identical sampling scale. (a) catchment scale; (b) sub-catchment scale; (c) regional scale.
Agriculture 16 01195 g003
Figure 4. Partial least squares path modeling (PLS-PM) showing the cascade relationships among the Chemical Index of Alteration (CIA), soil environmental properties, and soil potentially toxic elements across different scales. (a) Catchment scale, (b) sub-catchment scale, and (c) regional scale. Blue and red solid arrows indicate positive and negative flows of causality, respectively (p < 0.05), while gray dashed arrows indicate non-significant relationships. R2 denotes the proportion of variance explained by the model. Numbers on the arrowed lines indicate path coefficients. (d) Standardized total effects (direct and indirect effects combined) derived from the PLS-PM model. PTEs, potentially toxic elements.
Agriculture 16 01195 g004
Figure 5. Correlation analysis among soil impacting factors and soil potentially toxic elements was conducted based on the Mantel test. The line color indicates the significance level of differences (p-values), while the line size represents the correlation coefficients (Mantel’s r), and the squares represent the correlation coefficients among environmental factors. Asterisks (*) denote significance levels: * p < 0.05, ** p < 0.01, *** p < 0.001. (a) Catchment scale; (b) sub-catchment scale; (c) regional scale. CIA, Chemical Index of Alteration; NDVI, normalized difference vegetation index; Al3+, aluminum ion; Ca2+, calcium ion; Fe3+, Iron ion; OC, organic carbon; TN, total nitrogen; TP, total phosphorus; PTEs, potentially toxic elements.
Agriculture 16 01195 g005
Table 1. Percentile composition of potentially toxic elements in surface soils across different sampling scales.
Catchment ScaleSub-Catchment ScaleRegional ScaleNational
Background
Index (mg/kg)MeanSDCVK-S
Test
MeanSDCVK-S TestMeanSDCVK-S Test
Cr73.8 b13.318.10.1476.6 b12.316.00.0689.2 a10.211.40.1361.0
Ni29.0 b7.1324.60.0731.7 b6.4320.30.0643.5 a7.2616.70.1226.9
Cu36.0 b17.448.20.1536.2 b11.230.90.1341.9 a9.9324.90.1922.6
Zn82.6 b26.031.40.0787.1 b21.124.20.06104 a20.619.70.1374.2
Pb34.5 a18.754.10.2834.1 a11.032.10.2132.8 a8.7526.70.2426.0
Cd0.27 a0.2487.60.230.27 a0.1299.50.090.33 a0.1750.80.120.10
As11.6 b7.3563.30.2710.5 b2.9127.70.1713.6 a3.3624.80.0711.2
Hg0.08 a0.0450.00.140.10 a0.0552.90.230.07 a0.0233.90.060.07
Note: SD, standard deviation; CV, coefficient of variation; K-S test, Kolmogorov–Smirnov test. Different lowercase letters indicate significant differences (p < 0.05) in the mean values of PTEs in surface soils among the different sampling scales. National background—the national background value of China [53].
Disclaimer/Publisher’s Note: The statements, opinions and data contained in all publications are solely those of the individual author(s) and contributor(s) and not of MDPI and/or the editor(s). MDPI and/or the editor(s) disclaim responsibility for any injury to people or property resulting from any ideas, methods, instructions or products referred to in the content.