Article

EAGLES Framework—Environmental Impact of Agriculture Using Life Cycle Assessment and Expert System


1
FAMU-FSU College of Engineering, Florida State University, 2525 Pottsdamer St, Tallahassee, FL 32310, USA
2
College of Agricultural and Life Sciences, University of Florida, 971 SW 16th Ave, Gainesville, FL 32601, USA
3
School of the Environment, Florida A&M University, 1740 S Martin Luther King Jr Blvd, Tallahassee, FL 32307, USA
4
International Baccalaureate (IB) Program, Rickards High School, 3013 Jim Lee Rd, Tallahassee, FL 32301, USA
5
Biological Systems Engineering, Florida A&M University, 1740 S Martin Luther King Jr Blvd, Tallahassee, FL 32307, USA
*
Author to whom correspondence should be addressed.
Agriculture 2026, 16(11), 1192; https://doi.org/10.3390/agriculture16111192 (registering DOI)
Submission received: 2 April 2026 / Revised: 29 April 2026 / Accepted: 30 April 2026 / Published: 28 May 2026
(This article belongs to the Section Ecosystem, Environment and Climate Change in Agriculture)

Abstract

Agriculture faces increasing pressure to meet global food demands while minimizing environmental harm, yet many current practices remain unsustainable. This study develops the EAGLES framework (Environmental Impact of Agriculture using Life Cycle Assessment and Expert System) to address limitations in current sustainability assessment approaches. Life Cycle Assessment (LCA) evaluates environmental impacts but is limited by data availability and usability, especially for new users in agriculture. The objective of this study is to address this gap by developing the EAGLES framework, which organizes agricultural LCA data within an expert system (knowledge-based, rule-based) structure to guide the application of LCA phases. The knowledge base is developed from Phase 1 datasets reported in previous work and additional datasets developed as part of this study. The rule base uses if–then logic to check if the required data are available and to guide movement across the LCA phases. The framework is designed to support multiple scope types, impact categories, and assessment methods within a single structure. The framework was applied to rice production in Mississippi (2021) to assess marine eutrophication and acidification. The case study results show that the framework enables consistent progression across all LCA phases and produces impact results that can be interpreted using normalization and weighting. A second pathway was applied to assess acidification, demonstrating that the framework can handle multiple impact categories within the same system. By organizing data and linking inventory, impact assessment, and interpretation into a single process, the framework provides a structured and transparent approach for conducting agricultural LCA.

1. Introduction

Global food demand is projected to rise by 70% by 2050, yet over 800 million people remain food insecure. Expanding agricultural systems increase land, water, and energy use, leading to environmental challenges [1,2,3]. Meeting the dual challenge of increasing productivity while reducing environmental impacts requires tools that support sustainable agricultural practices [4,5].
Life Cycle Assessment (LCA) is widely used to evaluate environmental impacts in agriculture [6,7]. However, its application is limited by data availability and usability for non-expert users. Many existing LCA tools require users to manually enter activity data and calculate emissions based on information from different studies. Some tools require paid databases. Most tools also provide little guidance on navigating the four LCA phases, making them difficult to use, especially for non-expert users. In addition, some tools focus only on specific impact categories and do not fully represent agricultural emissions.
A review of 184 agricultural LCA studies published between 1999 and 2025, including 13 review papers, shows clear needs in agricultural LCA: decision-support tools with multi-objective analysis [8,9,10,11,12], standardized LCIA methods [10,11,12,13], comparison across crops and regions [10,11,12,14,15], soil health assessment [10,11,16], greenhouse system evaluation [17], and integration of environmental, economic, and social factors [10,11,12]. For example, combining environmental indicators with energy-use and economic analysis can reveal differences across production systems, where plain regions were more energy-efficient and profitable but had higher emissions compared to hill systems [18]. However, existing approaches do not provide a unified structure that combines standardized data with rule-based guidance across all LCA phases.
These gaps indicate the need for a structured framework to organize published agricultural LCA data, standardize emission calculations, and provide step-by-step guidance across all four LCA phases. To address these gaps, this study develops the EAGLES framework (Environmental Assessment of Agriculture using Life Cycle and Expert System). EAGLES integrates an expert system, consisting of a knowledge base and a rule base, with the LCA methodology to support the assessment of agricultural systems.
The objective of this study is to organize available agricultural LCA data within an expert system (knowledge-based and rule-based) structure that guides users through goal and scope definition, inventory development, impact assessment, and interpretation in a consistent and transparent way. The EAGLES knowledge base is built from datasets reported in [19] for Phase 1 and from additional datasets developed as part of this study for Phases 2–4. These datasets are organized by assigning each goal, product, scope, input, output, emission factor, impact category, and LCIA method a unique ID. The framework includes equations based on mass and emission factors to standardize emission calculations and reduce reliance on other sources. The rule base uses if–then logic not only to check data availability but also to guide the sequence of the LCA process by linking inputs to emissions, emissions to impact categories, and impacts to interpretation. This structure ensures that each step depends on the results of previous steps and that the process follows a consistent order across phases.
EAGLES provides a structured approach to conducting agricultural LCA by bringing together data, equations, and rules into a single framework. It reduces the need to collect data from different sources and makes the process easier to follow. The framework includes predefined options such as 41 goals, 65 products, and 7 agricultural scopes, and combines commonly used impact categories with multiple LCIA methods to calculate environmental impacts. It also includes both essential steps (classification and characterization) and optional steps (normalization and weighting) within the LCIA phase. The framework supports interpretation by identifying key issues, providing recommendations, and linking results to actions within the same process. By combining a knowledge base with a rule base, the framework structures how data, equations, and results are connected across phases.
The main novelty of EAGLES is the integration of a knowledge base with rule-based logic to guide users through all LCA phases within a single structured framework. Unlike existing tools that require users to define each step and collect data from multiple sources, EAGLES integrates inventory, impact assessment, and interpretation into a single process. The rule base also ensures that required inputs, parameters, and methods are defined before proceeding to the next steps. That structure is designed to improve usability and support users with limited LCA experience, while maintaining a consistent workflow across all phases.

2. Materials and Methods

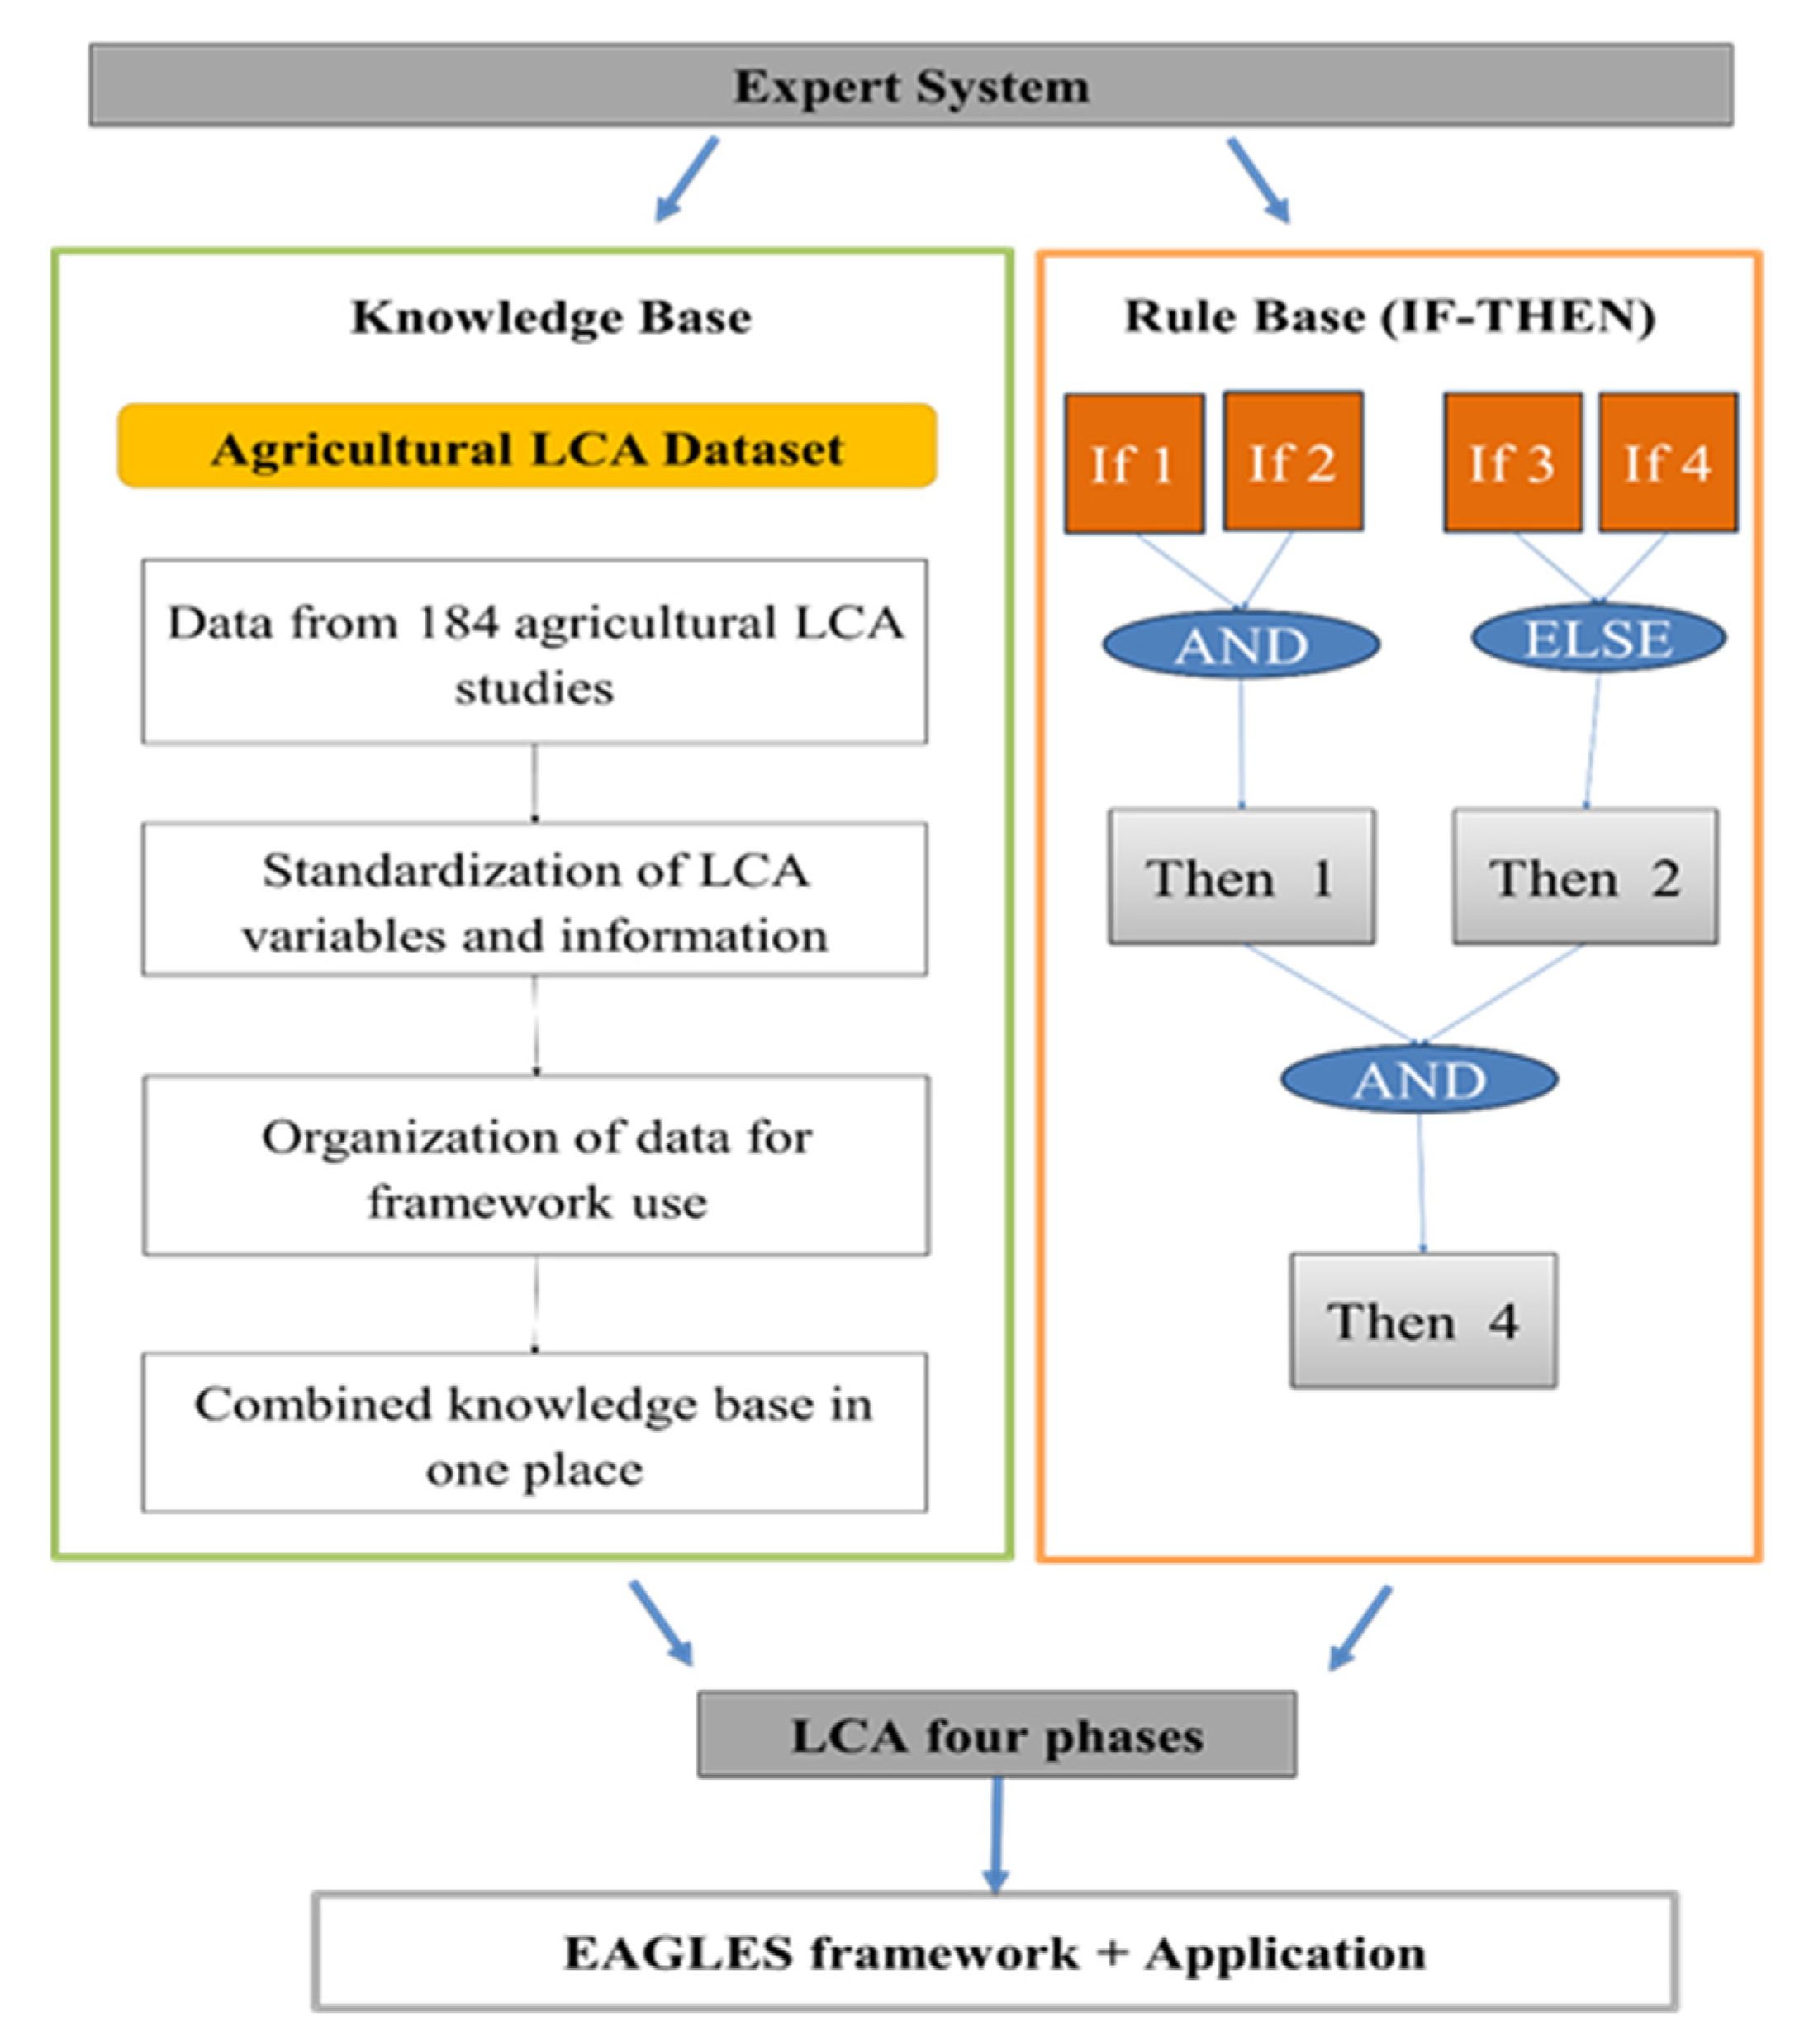
The EAGLES framework was developed by integrating an expert system with the Life Cycle Assessment (LCA) methodology (Figure 1). The expert system consists of a knowledge base and a rule base, which together support the application of the framework across the LCA phases. The knowledge base provides the data, and the rule base uses if–then logic to guide the sequence of the LCA process by linking inputs to emissions, emissions to impact categories, and impacts to interpretation, while also checking data availability. The knowledge base is organized in Excel 365 sheets and was developed from datasets reported in [19] for Phase 1 and from additional datasets developed as part of this study for Phases 2–4. The construction of the knowledge base followed a structured process. Relevant agricultural LCA studies were first identified through a literature review, and key information was extracted, including goals, products, scopes, inputs, outputs, emission factors, and impact categories. The extracted data were then standardized by assigning consistent names and units to variables. Each variable was assigned a unique identifier (ID) to enable linking across phases. Finally, the data was organized into phase-based Excel sheets for the four LCA phases, enabling consistent use of the data and integration with the rule base. All key elements required to apply the framework, including how the knowledge base was constructed and organized, are presented in this study and Supplementary Materials. Additional details on the dataset structure will be provided in separate data description papers.
For the framework design, the four LCA phases’ structure was used. Separate Excel sheets were defined for each phase. The Phase 1 (Goal and Scope) sheet was organized to include information on the study aim, product or service type, and scope. The Phase 2 (Life Cycle Inventory) sheet was developed to record inputs and outputs, emission factors, and data sources. The Phase 3 (Life Cycle Impact Assessment) sheet was designed to include impact categories, characterization, normalization, and weighting factors and methods. The Phase 4 (Life Cycle Interpretation) sheet was prepared to help identify key issues and to suggest possible recommendations. The rule base defines how data is selected from the knowledge base and how the process moves across the LCA phases. The rules are implemented as condition–action (if–then) statements that are applied sequentially, where each step depends on the results of previous steps. At each step, the rule checks whether the required data are available before proceeding to the next phase. If the data is not available, the process returns to the previous step. These rule-based progressions ensure that required inputs, equations, and parameters are defined before calculations proceed and maintain consistency across phases. That ensures the framework follows a clear, consistent sequence, with datasets linked using consistent identifiers to support traceability and reproducibility of the analysis. All steps, variables, and equations required to apply the framework are described in this study, with supporting datasets provided in Supplementary Materials.
The framework was reviewed to ensure that rule conditions and phase transitions worked correctly. The framework was then applied through a case study on rice production in Mississippi to confirm proper movement across the four LCA phases and to ensure that the required information was defined before moving forward. That application also served to evaluate the rule sequence, data linkage across phases, and the framework’s ability to generate consistent results across multiple impact pathways.

3. Results

3.1. EAGLES Framework

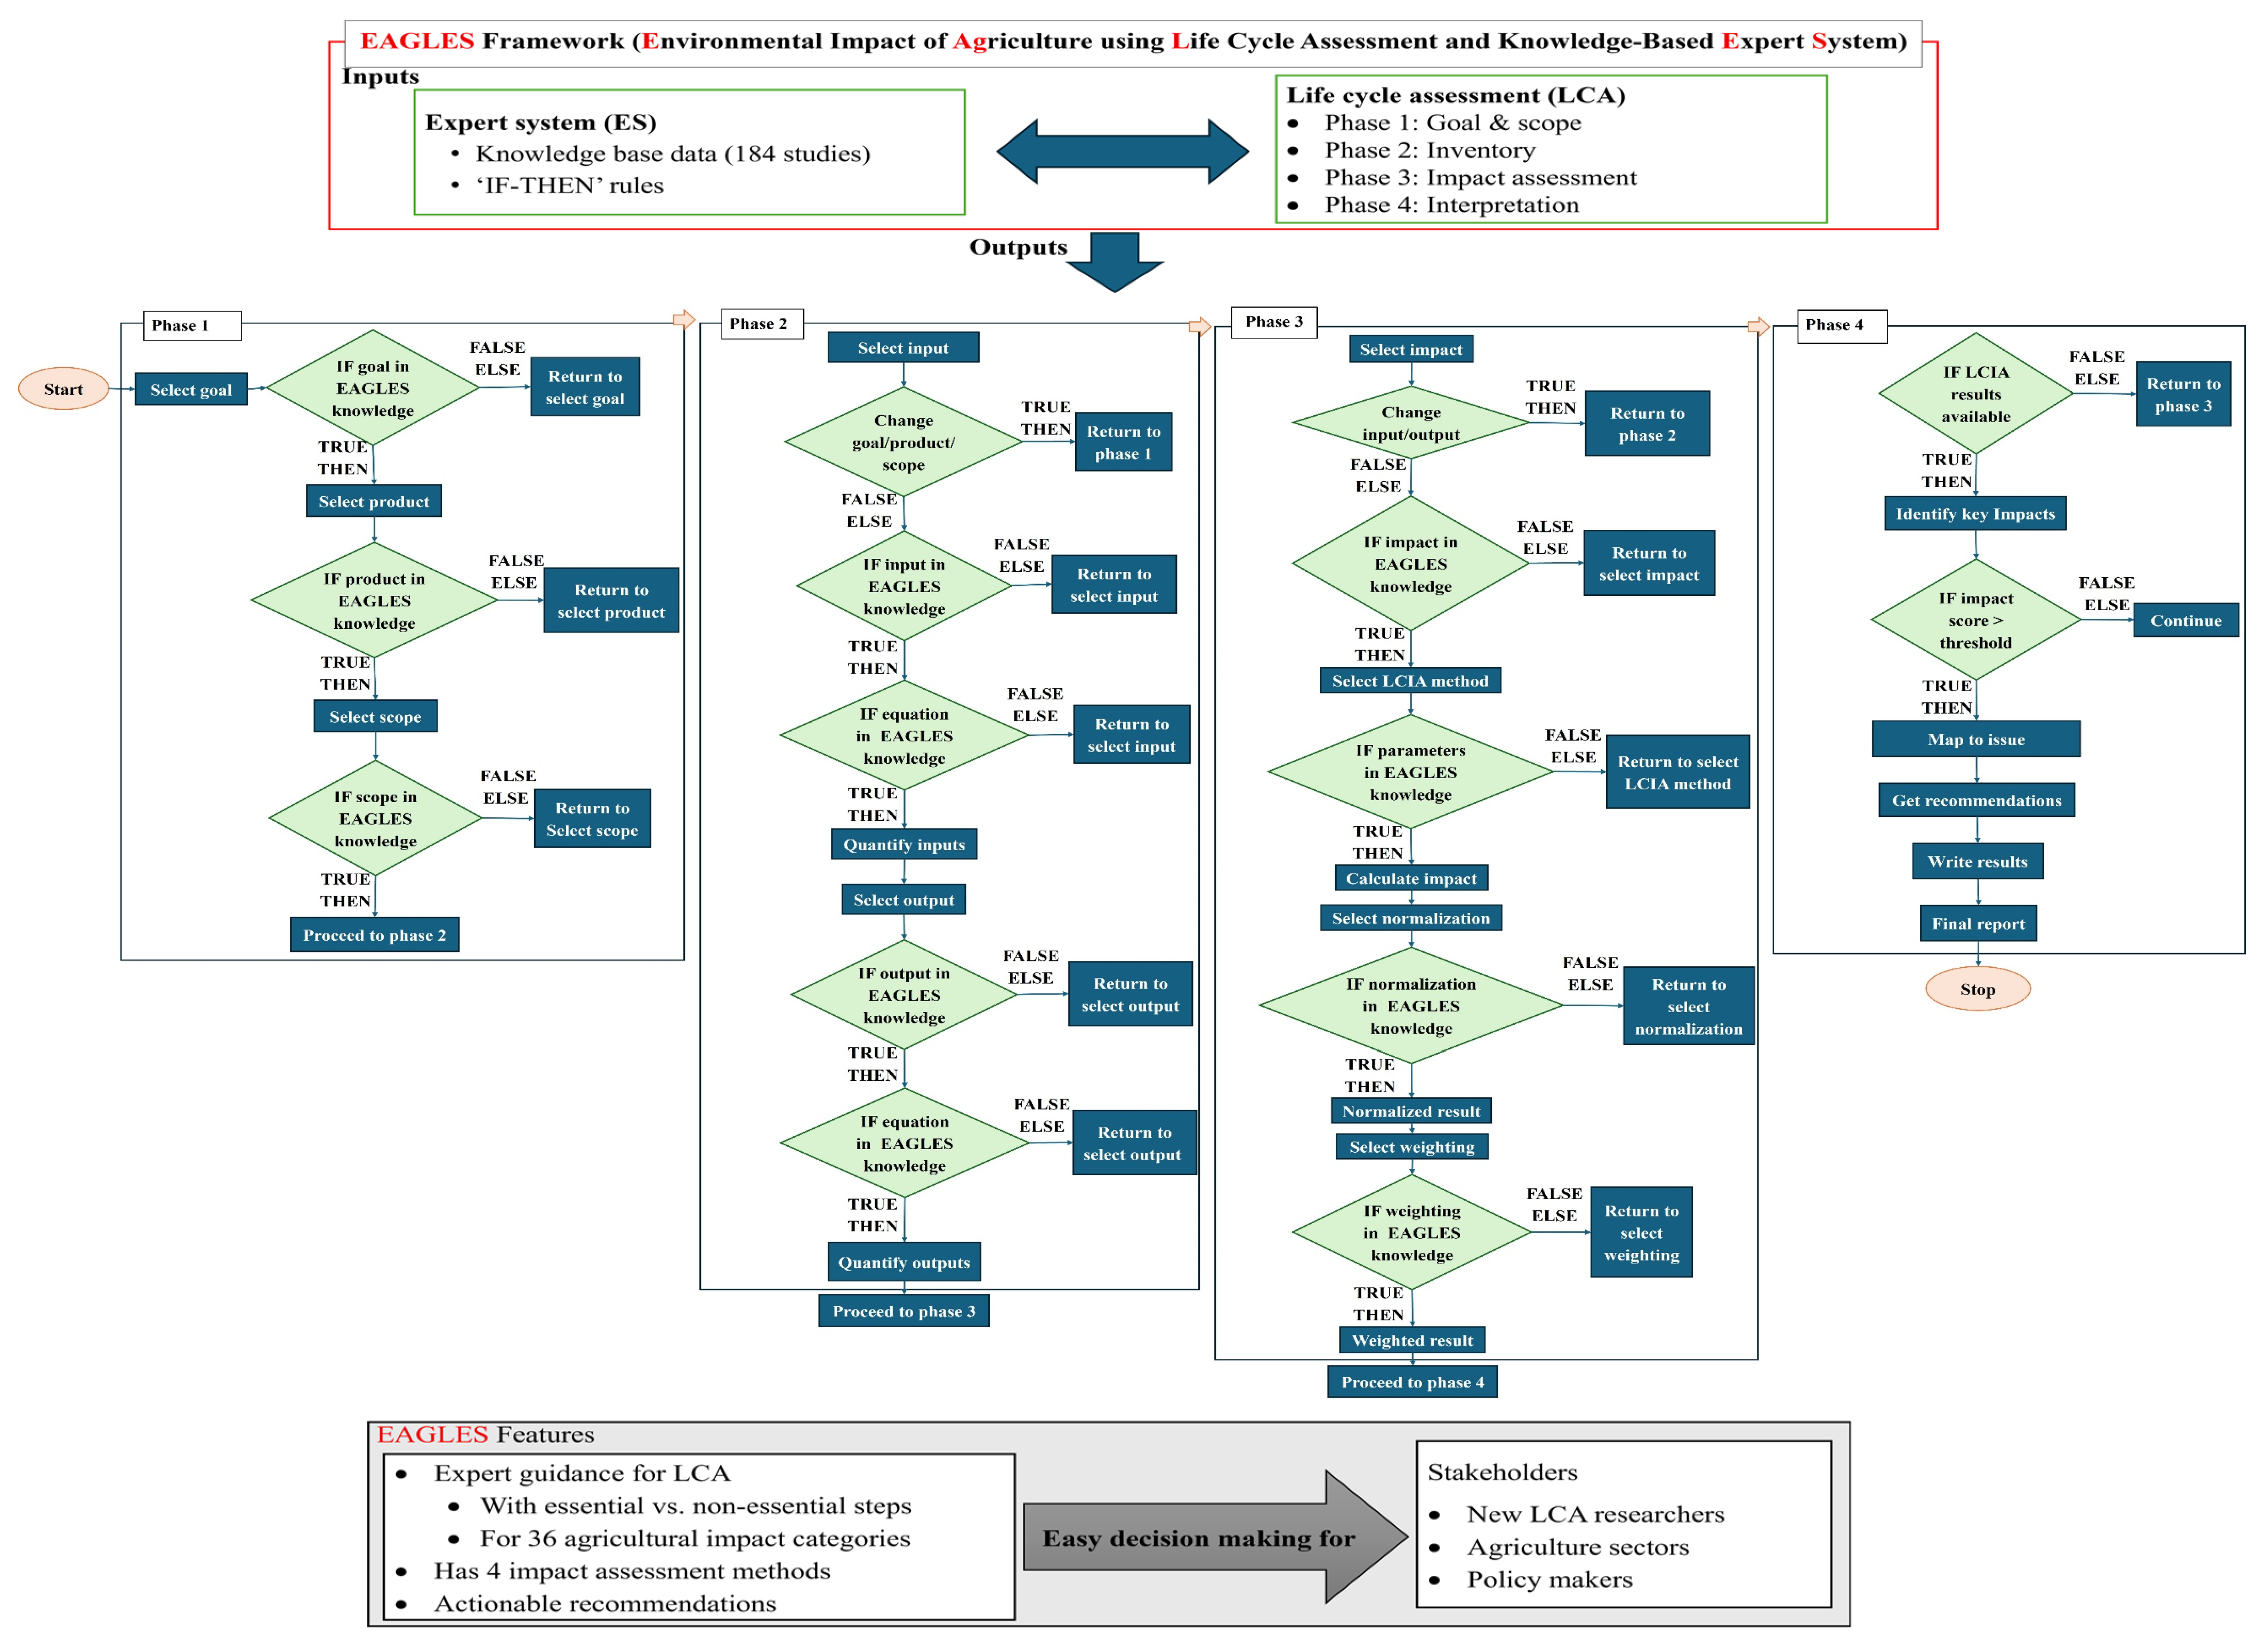
Figure 2 presents the structure of the EAGLES framework. The framework was applied in this study to evaluate how inputs, emissions, and impacts are linked across the LCA phases. The results show that the framework supports consistent progression from goal and scope definition to interpretation. The framework links the expert system with the four phases of the LCA method. The expert system organizes the available data and applies rules that control movement across phases. As shown in Figure 2, the framework begins with goal, product, and scope selection in Phase 1 and proceeds through inventory development, impact assessment, and interpretation. The application of the rule-based conditions determines whether the required information is available in the EAGLES knowledge base before moving to the next phase. At each phase, the output is used in the next phase. For example, inventory results are used in impact assessment, and impact results are used in interpretation, creating a clear flow across the LCA phases. That application demonstrates that the framework can be used to complete all LCA phases within a single structured process.

3.1.1. Knowledge Base

The knowledge base used in the EAGLES framework was developed from datasets reported in [19] for Phase 1 and from additional datasets developed as part of this study for Phases 2–4, with the key elements of all phases presented in this study. In contrast, additional details will be described in separate data papers. These datasets were developed to address the lack of available and consistent data in agricultural LCA. These datasets organize goals, products, scopes, inputs, outputs, emission factors, impact categories, and LCIA methods by assigning a unique ID to each variable. This structure allows the data to be used directly within the EAGLES framework and supports its integration with the rule base.
The knowledge base is provided in Supplementary Materials as phase-based Excel files (Phase 1–Phase 4). Phase 1 includes 41 goals, 65 products, and 7 scopes. It also includes more than 2000 inputs, 1000 outputs, and 200 emission factors used to calculate inventory results in Phase 2, as well as more than 600 data sources. In Phase 3, the knowledge base includes 36 distinct names for impact categories and their characterization factors, along with normalization and weighting methods. The framework supports four impact assessment methods and links impact results to key issues and recommendations in Phase 4. Each phase has its own set of variables, and all data are linked using the same IDs. These identifiers allow data to be tracked across phases from inputs to emissions, from emissions to impact results, and from impacts to interpretation. The knowledge base provides the structured data used by the rule base, including inputs, outputs, equations, and parameters for each analysis step. All data, variables, and equations required to apply the framework in this study are provided in the manuscript and Supplementary Materials, allowing independent application. The data used in this study are mainly taken from published studies, so the need for additional assumptions is limited. Key choices, such as system boundary, functional unit, and selection of emission factors, are based on the available literature. That structured organization supports consistent data use across phases and ensures the rule base can apply the required steps in a defined sequence. The datasets are provided as Supplementary Materials to support the use of the framework.

3.1.2. Rule Base

The rule base provides the reasoning in the EAGLES framework, where it translates the knowledge stored in the knowledge base into IF–THEN rules [20]. The rule base is implemented as a set of condition–action (if–then) statements that control how the LCA process progresses across phases. These rules link user selections to the available data in the EAGLES knowledge base. They are used not only to check data availability but also to guide the sequence of calculations by linking inputs to emissions, emissions to impact categories, and impacts to interpretation. The rules are also used to select relevant stages based on the chosen scope, retrieve applicable equations and emission factors, classify outputs into impact categories, and connect results to key issues and recommendations.
Each rule consists of an antecedent (a condition that must be satisfied) and a consequent (the action or output generated once those conditions are met). Conditions are defined based on the availability of required data, equations, and parameters in the knowledge base. For example, if the selected scope is gate-to-gate, the rule retrieves only the stages included in that scope. If nitrogen fertilizer is selected as an input, the rule retrieves the related emission factors and equations needed to calculate nitrate and ammonia emissions. If nitrate emissions are calculated, the rule assigns them to marine eutrophication, while ammonia emissions are assigned to acidification. At the same time, actions determine whether calculations proceed, results are generated, or the process returns to a previous step. When impact results are generated, additional rules can retrieve related key issues and recommendations stored in the knowledge base.
That allows the framework to guide users through the LCA phases in a clear, easy-to-follow way and ensures that each step depends on the results of previous steps, maintaining a consistent sequence across the analysis in which outputs from one phase are used to determine actions in the next. The use of standardized identifiers across the knowledge base supports this process by ensuring that inputs, outputs, and results are consistently linked across phases. The rule base is structured to support the sequence of the LCA process. Additional features, such as rule conflict resolution or uncertainty handling, are outside the scope of the current framework.

3.2. EAGLES Application to Case Study: Rice Production in Mississippi for 2021

This section presents the results of applying EAGLES to a rice production case study in Mississippi for 2021 and explains how the knowledge base and rule base work together to guide users through each LCA phase. The rice case study was used as a practical validation method to evaluate the framework’s key functions under real production conditions. Because the knowledge base contains a large number of products, scope types, impact categories, inputs, outputs, and supporting data, validating every individual dataset within a single study would be difficult. Therefore, this case study focuses on validating the main framework functions, including rule progression across the LCA phases, data linkage, calculations, impact assessment, and interpretation. Two pathways were applied; the first pathway uses a single impact category: marine eutrophication. The second pathway adds another impact category, acidification, within the same system. That allows testing whether the framework can handle multiple outputs and link them to different impact categories. This case study demonstrates selected pathways within a single system to show how the framework operates. At the same time, the full set of scope types, impact categories, and LCIA methods is defined in the knowledge base and provided in Supplementary Materials. The same framework structure can be applied to additional crops, regions, and systems using the datasets already included in the knowledge base. Future applications will include additional case studies across different crops, scope types, and impact categories to evaluate the broader rule base further.

3.2.1. Phase 1—Goal and Scope Definition (Aim, Product, and Scope)

The goal of the analysis was selected from the Phase 1 Excel sheet in the EAGLES knowledge base, where goals are organized and linked to a unique Goal_ID. The selected goal concerns a quantitative environmental impact assessment of agricultural production systems. Since the goals are available in the knowledge base, the framework proceeds to the product definition. The product, harvested rice, was identified from the knowledge base and defined as a good with a functional unit of 1 tonne at the farm gate. Inventory and impact calculations are first performed per tonne of rice at the functional unit level, before any scaling or normalization is applied. As the product data are available, the framework proceeds to the system scope. The scope was selected as gate-to-gate, including crop production stages such as field preparation, crop growth, harvesting, and post-harvest processing, as defined in the EAGLES knowledge base (S4: ST5–ST8). In this case study, the analysis focuses on the crop growth and harvesting stages based on data availability and the selected impact pathways. The system represents rice production in Mississippi, and results are later scaled to total production based on cultivated area (1.04 × 10⁵ acres) and yield data. Since the scope and associated stages are available in the knowledge base, the system boundary is defined, and the framework proceeds to the inventory phase. This phase validates that the rule base can use user selections to retrieve the required goal, product, and scope data and define the system boundary before calculations begin. The rules guiding this phase are summarized in Table 1.

3.2.2. Phase 2—Inventory (Inputs, Outputs, and Data Sources)

The inventory phase uses data from the Phase 2 Excel sheet in the EAGLES knowledge base, which includes inputs, outputs, emission factors, equations, and data sources. These data were developed to address the lack of available and consistent inventory data in agricultural LCA and are provided in a ready-to-use format. The user follows the rules to select the required data based on the defined goal, product, and scope. The knowledge base provides data and equations, and the rule checks whether the required data are available and, using the selected conditions, retrieves the required inputs, equations, and emission factors before calculations proceed. In this case study, Nitrogen fertilizer application was identified as the main input within the crop growth stage. The nitrogen fertilizer application rate (78.0179 kg N/acre) was obtained from data sources included in the EAGLES knowledge base, primarily USDA datasets and supporting agricultural LCA studies. The nitrogen application rate and rice yield (3.77 t/acre) both correspond to the 2021 production year, ensuring consistency in the calculation.
Total rice production is calculated as:
T o t a l   R i c e   P r o d u c t i o n t = R i c e   y i e l d × p l a n t e d   a r e a = 3.77   t   a c r e 1 × 1.04 × 10 5   a c r e s = 3.921 × 10 5   t   r i c e
To express nitrogen input at the functional unit level, fertilizer application is converted from per acre to per tonne of rice:
F r e t i l i z e r   A p p l i c a t i o n   R a t e = N i t r o g e n   F e r t i l i z e r   A p p l i e d k g   a c r e 1 Y i e l d t   a c r e 1 = 78.0179   k g   N   a c r e 1 3.77   t   a c r e 1 = 20.694   k g   N   t 1
To estimate total nitrogen input at the system level, the following scaling step is applied:
T o t a l   N   A p p l i e d k g     = S t u d y   a r e a   N   f e r t i l i z e r   a p p l i c a t i o n   r a t e k g   N   t 1 × c r o p   p r o d u c t i o n t = 20.694   k g   t 1 × 3.921 × 10 5   t   r i c e = 8.114 × 10 6   k g   N   F e r t i l i z e r
Nitrate ( NO 3 ) emissions to water are analyzed as outputs linked to fertilizer application. If the required emission factor is available in the knowledge base, the rule base retrieves it. It applies it to estimate emissions, ensuring that calculations proceed only when the required data are available. The emission factor reported by [21] is 1.33 kg NO 3 per kg N applied. That value is converted to an N-based leaching factor:
f l e a c h = 1.330 × 14 62 = 0.3003 ( k g   N   l o s t   k g 1   a p p l i e d )
The total amount of nitrogen lost to water was then calculated as:
N t o   w a t e r = N a p p l i e d , t o t a l × f l e a c h = 8.114 × 10 6 × 0.3003 = 2.437 × 10 6   k g   N
That value represents total nitrogen loss at the system level; the value was then converted to nitrate emissions:
k g   N O 3 = N t o   w a t e r × 62 14 = 2.437 × 10 6 × 4.43 1.079 × 10 7   k g   N O 3
To express emissions at the functional unit level (1 tonne of rice), total nitrate emissions were divided by total rice production:
N O 3 p e r   t o n n e   = N O 3   t o t a l T o t a l   p r o d u c t i o n = 1.079 × 10 7 3.921 × 10 5   27.52   k g   N O 3   t 1
That represents the first pathway used to validate the framework, where one output is linked to one impact category. Fertilizer applications also result in air emissions. In this case study, ammonia (NH3) emissions were added as a second output. That was done to test whether the framework can handle multiple outputs from the same input. If the emission factor is available, the rule base retrieves it and applies it as for nitrate. Since the data are available in the knowledge base, NH3 emissions were calculated and added to the inventory results. That represents the second pathway for validating the framework. The emission factor reported by [18] is 0.14 kg NH3 per kg N fertilizer applied.
The total NH3 emissions were then calculated as:
N H 3   e m i s s i o n = N a p p l i e d , t o t a l × E F N H 3 = 8.114 × 10 6 × 0.14 = 1.136 × 10 6   k g   N H 3
To express NH3 emissions at the functional unit level, total emissions were divided by total rice production:
N H 3 p e r   t o n n e = N H 3   t o t a l T o t a l   p r o d u c t i o n = 1.136 × 10 6 3.921 × 10 5   2.90   k g   N H 3   t 1
The results show that nitrate emissions reached 1.079 × 10⁷ kg NO 3 at the system level (27.52 kg NO 3 per tonne), while NH3 emissions reached 1.136 × 10⁶ kg NH3 at the system level (2.90 kg NH3 per tonne). These results confirm that the framework can handle multiple outputs from a single input within the same system. That phase also validates that the rule base can use selected inputs to retrieve the corresponding emission factors, equations, and inventory pathways from the knowledge base and generate the required outputs. In the present case study, nitrogen fertilizer was used to demonstrate this function through nitrate and ammonia emissions.
Activity data for this calculation, including planted area, rice yield, and total production, were taken from government sources, mainly USDA datasets, as listed in the data source sheet in the knowledge base. Emission factors and related values were taken from agricultural LCA studies included in the knowledge base, including [21]. The data source sheet also includes references for other inputs and parameters, which can be used to find additional data when needed. By organizing all required data in one place, the framework reduces data gaps and supports consistent inventory development. Since phase 2 data are available in the knowledge base, and the rule base applies them, the calculations are completed, and the framework proceeds to the impact assessment phase only after confirming that all required data and equations are available. The rules guiding this phase are summarized in Table 2.

3.2.3. Phase 3—Impact Assessment (Classification, Characterization, Normalization, Weighting)

The impact assessment phase uses data from the Phase 3 Excel sheet in the EAGLES knowledge base, which includes impact categories, characterization factors, normalization data, weighting factors, and the mapping between emissions and impact categories. The data used in this phase are selected using rules that link the outputs from the inventory phase to the impact assessment steps (classification, characterization, normalization, and weighting). The knowledge base provides the data and equations, and the rule base controls the progression between steps based on the availability of the required data. Within the EAGLES framework, calculations are first performed at the functional unit level (per tonne of rice), then scaled to total production and normalized at the population level, ensuring that these reference systems remain conceptually separate through a rule-based progression across phases.
In this phase, the user follows the EAGLES framework rules to progress through the impact assessment steps. At each step, the rule checks whether the required data are available in the knowledge base. If the data are available, then the user proceeds to the next step; if not, then the user returns to the previous step, as shown in Figure 2. Nitrate ( NO 3 ) emissions from the inventory phase are used as input for impact assessment. The rule first checks whether emissions from the inventory phase are available and then uses them as input for the impact assessment. For classification, the rule checks whether the impact category linked to NO 3 is available in the knowledge base. Since the data are available, nitrate emissions are linked to the marine eutrophication category. That step validates that outputs generated in the inventory phase can be assigned to the relevant impact category by the rule base using the stored mapping in the knowledge base.
For characterization, the rule checks whether the characterization factor is available. The value of 0.158 kg N-eq per kg NO 3 [21] is available in the knowledge base. The equation used for this calculation is also stored in the knowledge base and is applied once the required data are available:
At the system level:
M E P t o t a l = 1.079 × 10 7   k g   N O 3 × 0.158   k g   N - e q / k g   N O 3 = 1.7048 × 10 6   k g   N - e q
To express the impact at the functional unit level (per tonne of rice):
M E P p e r   t o n n e = M E P t o t a l t o t a l   p r o d u c t i o n = 1.7048 × 10 6 3.921 × 10 5 4.35   k g   N - e q   t 1
That converts total impact into per-tonne impact, ensuring consistency with the defined functional unit.
For normalization, the rule checks whether normalization data is available. Population data for Mississippi (2.95 × 10⁶) were obtained from sources listed in the data source sheet within the EAGLES knowledge base and used for normalization. The population-based approach was identified in agricultural LCA studies included in the EAGLES knowledge base and is applied here to support the interpretation of results at the regional scale. In this study, the Mississippi population is used as a reference to estimate total impact at the regional level, consistent with the approaches reported in the reviewed studies. Since the required data are available, the population-scaling normalization equation stored in the knowledge base is applied to calculate the normalized impact:
N = T o t a l i   m p a c t p o p u l a t i o n = 1.7048 × 10 6   k g   N - e q 2.95   m i l l i o n = 0.578   k g   N - e q   p e r s o n 1
These results show that marine eutrophication reached 1.7048 × 10⁶ kg N-eq at the system level (4.35 kg N-eq t−1), and 0.578 kg N-eq per person after normalization. For weighting, the rule checks whether a weighting factor is available. A weighting factor of 10 is available in the EAGLES knowledge base, and it is derived from values reported in the reviewed studies, where similar weighting approaches are used to compare impact categories. The weighting step is applied to enable comparison across impact categories within the framework. Weighted results are expressed as dimensionless values and serve as relative indicators for comparing impact categories. The weighting equation stored in the knowledge base is then applied to calculate the weighted marine eutrophication impact:
W e i g h t e d M E P = N o r m a l i z e d   v a l u e × W e i g h t i n g   f a c t o r = 0.578 × 10 = 5.78
That represents the first pathway, where one output is linked to one impact category and processed across all steps. NH3 emissions from the inventory phase are then used as input for impact assessment. The rule checks whether NH3 emissions are available and links them to the acidification category based on the mapping in the knowledge base. For characterization, the rule checks whether the characterization factor is available. The value of 1.88 kg SO2-eq/kg NH3 is available in the knowledge base. The equation used for this calculation is applied as:
At the system level:
A c i d i f i c a t i o n t o t a l   =   1.136 × 10 6   k g   N H 3 ×   1.88   k g   S O 2 - e q / k g   N H 3 =   2.136 × 10 6   k g   S O 2 - e q      
To express the impact per tonne of rice:
A c i d i f i c a t i o n p e r   t o n n e = A c i d i f i c a t i o n t o t a l T o t a l   p r o d u c t i o n = 2.136 × 10 6 3.921 × 10 5   5.45   k g   S O 2 - e q   t 1
For normalization, the rule checks whether normalization data is available. Population data for Mississippi (2.95 × 10⁶) were used to calculate:
N = T o t a l   i m p a c t p o p u l a t i o n = 2.136 × 10 6   k g   S O 2 - e q 2.95   m i l l i o n = 0.724   k g   S O 2 - e q   p e r s o n 1
For the second pathway, acidification reached 2.136 × 10⁶ kg SO2-eq at the system level (5.45 kg SO2-eq t−1), and 0.724 kg SO2-eq per person after normalization. For weighting, the rule checks whether a weighting factor is available. The weighting equation is applied as:
W e i g h t e d A c i d i f i c a t i o n = N o r m a l i z e d   v a l u e × W e i g h t i n g   f a c t o r =   0.724 × 10 = 7.24
That represents the second pathway, where a second output is linked to a different impact category and processed using the same steps. That validates that the same rule structure can be applied across multiple emissions and impact categories available in the knowledge base. That step was used to test whether the framework can apply the same calculation steps across multiple impact pathways. By organizing impact assessment data, equations, and methods in one place, the framework reduces data gaps and supports consistent impact calculations. Since the required data and equations for all steps are available in the knowledge base, the user proceeds through all impact assessment steps, and the framework moves to the interpretation phase. The rules guiding this phase are summarized in Table 3.

3.2.4. Phase 4—Interpretation (Key Issues and Recommendations)

The interpretation phase uses key issues and recommendations stored in the EAGLES knowledge base. The rules in the framework were followed to move from impact results to interpretation, where the rules check whether the required data are available and determine whether to proceed or return to the previous step. Impact results from Phase 3 are matched with key issues stored in the knowledge base, and the rule checks whether the corresponding issues and recommendations are available. That phase validates that the rule base can use calculated impact results from previous phases to retrieve decision-support outputs stored in the knowledge base. The EAGLES knowledge base was checked to see whether there was a key issue related to nitrate ( NO 3 ) emissions to water. High levels of nitrate emissions to water are identified as a key issue, indicating a risk of marine eutrophication. That is based on key issues reported in agricultural LCA studies included in the EAGLES knowledge base, such as nutrient runoff, eutrophication, and nitrogen emissions in crop production [22,23,24,25,26]. The EAGLES knowledge base was also reviewed for key issues related to atmospheric ammonia (NH3) emissions. High levels of NH3 emissions are associated with acidification and air pollution. That is consistent with findings from agricultural LCA studies on nitrogen emissions and fertilizer use [23,27,28].
The rule then checks whether recommendations linked to this key issue are available in the knowledge base. Since the required data are available, recommendations are retrieved based on the identified issues. The recommendations are grouped into two main categories. The first category focuses on improving fertilizer application, including precision nutrient management, controlled-release fertilizers, cover crops, nitrification inhibitors, and improved irrigation practices. These recommendations are supported by studies in the knowledge base on nitrogen management and nutrient losses [24,25,28]. The second group focuses on using organic nutrient sources to improve nutrient-use efficiency, reduce nitrate losses, and protect water quality, as reported in studies on sustainable nutrient management and soil health [29,30]. Recommendations related to NH3 emissions focus on reducing losses to air, including improving fertilizer application methods, reducing volatilization, and optimizing nutrient management practices, as reported in studies on fertilizer efficiency and nitrogen losses [24,28,31]. These steps show that once a specific impact category is identified, the rule base can retrieve the corresponding recommendations linked to that issue.
The results from Phase 3 show that both marine eutrophication and acidification were identified within the same system. The normalized acidification impact (0.724 kg SO2-eq person−1) is higher than the normalized marine eutrophication impact (0.578 kg N-eq person−1). The same trend is observed in the weighted results, where acidification (7.24 weighted units) is higher than marine eutrophication (5.78 weighted units). These results show that the framework can handle multiple impact pathways within the same system and allow comparison between them within the same analysis. That demonstrates that the same interpretation structure can be applied when multiple impact pathways are evaluated.
Since the required data for key issues and recommendations are available in the knowledge base, the interpretation step is completed, and the results, key issues, and recommendations are linked through the framework. That demonstrates that the framework can connect impact results to their corresponding issues and actionable recommendations in a consistent and structured way. The rules guiding this phase are summarized in Table 4.

3.3. Comparison with Existing LCA Tools Using Marine Eutrophication for Rice Production in Mississippi for 2021

3.3.1. OpenLCA Through ReCiPe

ReCiPe provides a structured impact assessment method that links midpoint and endpoint indicators and is widely used to assess multiple environmental impact categories. In this study, openLCA version 2.5 was used to calculate marine eutrophication impacts associated with rice production in Mississippi in 2021. First, a new project was created and linked to a database that includes the ReCiPe 2016 impact assessment method. The product was defined as rice, the functional unit was set to 1 tonne, and the system boundary was gate-to-gate.
Nitrogen fertilizer was defined as the input, rice production as the output, and nitrate emissions from fertilizer application as the environmental emission. The nitrate emissions were entered manually after checking that all units matched the functional unit. In this study, the inventory was calculated using emission factors from published studies and then entered into openLCA. The same inventory data and emission calculations were used in both EAGLES and openLCA to ensure consistency between the two approaches. While openLCA can run calculations when linked to full databases, this depends on the availability and choice of datasets. After building the inventory, the impact assessment was run using the ReCiPe 2016 midpoint method and the marine eutrophication category. openLCA applied the characterization factor to the nitrate emissions and produced results for marine eutrophication in kilograms of nitrogen equivalents.
However, openLCA does not guide the user step-by-step through the LCA phases, and the user must define the goal, product, system boundary, inventory, and impact assessment steps manually and must be familiar with LCA methodology and how the process should progress across phases. In addition, the required data are not provided in a single place, and the user may need to collect input data, emission factors, and parameters from different sources, which can make the process less direct and more dependent on user experience.
In contrast, the EAGLES framework is organized into phase-based Excel knowledge base files (Phase 1–Phase 4), where all required data are stored in a structured format in a single location. That includes Excel data sheets of aims, products, and system scopes, as well as inputs, outputs, emission factors, equations, impact categories, and interpretation data. The user follows the framework and retrieves the required data directly from the knowledge base, while the rule checks whether the required data are available and guides the progression from one phase to the next. In Phase 1, each scope is linked to its corresponding production stages, allowing the user to consistently define the goal, product, and system boundary. In the inventory phase (Phase 2), the user selected inputs, outputs, emission factors, and equations from the knowledge base file rather than collecting the inventory from different sources. In the impact assessment phase (Phase 3), the knowledge base provides the mapping between emissions and impact categories, along with characterization factors, normalization data, and weighting factors.
Marine eutrophication potential (MEP) results obtained with EAGLES were compared with those generated with the ReCiPe 2016 Midpoint (H) method in openLCA. Both approaches quantified eutrophication impacts from nitrate ( NO 3 ) emissions into water using the same activity data and literature-based parameters. However, the results differed in magnitude: EAGLES estimated 0.00435 kg N-eq/kg rice, and ReCiPe estimated 0.00185 kg N-eq/kg rice, representing a difference of about 2.3–2.4 times. This difference is influenced by the characterization factors used in each approach (0.158 kg N-eq/kg NO 3 in EAGLES and about 0.0672 kg N-eq/kg NO 3 in ReCiPe). In contrast, the same inventory data and emission values were used in both cases. This comparison focuses on how the same inventory is processed within each approach and on how users apply the LCA steps, rather than evaluating differences in tool performance. It highlights differences in how LCA steps are applied across approaches and the need for clear guidance for users.
ReCiPe applies only the characterization step. In contrast, the EAGLES framework follows all LCA phases within the same structure. The EAGLES framework also provides normalization (0.578 kg N-eq/person/year) and weighting (5.78 weighted units), which are not included in the ReCiPe results. Normalization changes how results are expressed relative to a reference, and weighting adjusts the final results by giving greater weight to some impact categories. These steps can affect how results are compared. Another difference is that the EAGLES framework links the inventory results to interpretation. Nitrate emissions are connected to key issues and recommendations using the data stored in the knowledge base. ReCiPe does not include this step and ends at the characterization result. These differences show how each approach supports the user in moving through the LCA phases, with EAGLES extending the analysis beyond impact calculation by guiding the user through all phases.
Another difference is how data is handled. In openLCA, the user is responsible for defining inputs and making sure emissions are calculated correctly. In EAGLES, inputs, emission factors, and equations are already provided in the knowledge base. The user can use them directly without searching for data from other sources. That simplifies the process and supports a more consistent application. In this study, emission values were prepared before being entered into openLCA, whereas EAGLES includes these steps within the same framework, which changes how the user conducts the analysis. Overall, the difference between EAGLES and ReCiPe is not solely due to characterization factors, but also to system setup, normalization, weighting, and data handling. These differences reflect how each approach is used in practice and how users interact with the workflow across the LCA phases, and should be considered when comparing results from different LCA approaches.

3.3.2. Usetox

USEtox specializes in human toxicity and ecotoxicity assessment but offers limited coverage for agriculturally relevant nutrient-driven impacts, such as nitrate leaching and eutrophication. For this reason, it could not be used to calculate marine eutrophication in this case study. It does not include the data or structure needed to link nitrogen fertilizer use to nitrate emissions and eutrophication within the same process. As a result, it was not possible to compare USEtox results with the EAGLES framework, which includes eutrophication-related data and emission–impact links in the Phase 3 knowledge base file.

3.3.3. Advantages and Disadvantages of openLCA Compared to EAGLES (Case Study)

openLCA includes a wide range of LCIA methods, with more than 40 available for analysis across multiple impact categories. However, it does not provide a clear framework to guide users through the LCA phases. Impact categories are not linked to specific emissions, which makes their selection less clear. Users are required to identify relevant substances, perform unit conversions, and ensure consistency with the defined system boundary. Emissions must be calculated outside the software and entered into the model; results are limited to the characterization step, without normalization, weighting, or interpretation. In addition, the required data are not stored in a single location, and users must collect input data, emission factors, and parameters from multiple sources. As a result, using openLCA requires prior knowledge of LCA methodology and an understanding of how the analysis should progress across phases, which increases the effort required and depends on the user’s experience.
In contrast, EAGLES is structured as a framework using phase-based Excel knowledge base files (Phase 1–Phase 4), where all required data are stored in one place in a consistent format. The framework provides inputs, outputs, emission factors, equations, and interpretation data within the same structure. The user follows the framework, and the rule checks whether the required data are available in the knowledge base and decides whether to move to the next phase or return to the previous step. That supports a clear workflow and reduces the need for manual data collection. In addition, the framework links inventory data, impact results, and interpretation within the same process. Interpretation is supported by key issues and recommendations stored in the Phase 4 knowledge base file, enabling results to be linked to actions within the same analysis.
Overall, this comparison shows that the difference between EAGLES and existing tools lies not only in the results but also in how the LCA process is conducted. While tools such as openLCA and methods such as ReCiPe focus mainly on calculations, EAGLES organizes data, equations, and interpretation within the same workflow. The use of a knowledge base and rule-based structure allows the process to be followed step by step, as shown in this case study, and supports consistent application across phases. That makes the framework easier to use and helps connect results to interpretation within the same analysis.

3.4. How EAGLES Is Connected to the Nexus Concept

The water–energy–food nexus describes how water, energy, and food production are interconnected in agricultural systems. These components are closely linked, especially in crop production. For example, studies [8,14] underscore the importance of sustainable resource allocation between energy and food systems. Study [32] examines agricultural practices, water usage, and energy flow, employing LCA principles to understand associated environmental impacts. Whenever these analyses delve into crop production’s environmental footprint, they assess energy, water, and food consumption. For example, energy considerations encompass irrigation water pumping and resource production, as demonstrated by [33,34]. Similarly, study [35] explores the intersection of water and energy in agricultural operations, highlighting water usage in energy and food production. As noted in bioenergy studies, the nexus is further complicated when food crops are diverted to energy production.
Life Cycle Assessment (LCA) inherently captures these connections by linking resource use and emissions to environmental impacts across the life cycle. In this way, LCA provides a structured basis for understanding how water, energy, and food systems interact within agricultural production. The EAGLES framework connects to the nexus by organizing data across LCA phases using phase-based knowledge base files. Inputs, such as water, fertilizer, and energy use, are stored in the knowledge base and linked to outputs, such as emissions and resource flows. These outputs are then linked to impact categories in the impact assessment phase. By following the framework, the user can trace how inputs affect outputs and impacts across phases. For example, fertilizer use affects water quality through nitrate emissions, and energy use is linked to irrigation and production. That allows water, energy, and food to be studied together within the same structure. This structure allows the framework to show how water, energy, and food are connected using the same data and processes, rather than studying each one separately. By organizing these relationships within a single framework, EAGLES makes these connections more explicit and easier to follow across phases. That provides a structured way to represent nexus interactions within the same analysis, even though a full quantitative comparison across water, energy, and food components is beyond the scope of this study. The knowledge base and the rules help identify links and relationships between these components within the same LCA framework.

4. Discussion

This study introduces the EAGLES framework, which combines an expert system (knowledge base and rule base) with the Life Cycle Assessment (LCA) phases. The framework was developed together with structured datasets to address the lack of available, consistent data in agricultural LCA and to provide guidance across the LCA phases. Traditional LCA models such as IMPACT 2002, CML, IPCC, Eco-Indicator 99, and ReCiPe 2016 are widely used but are often complex and difficult to apply without prior experience. In the EAGLES framework, the knowledge base stores data in phase-based Excel files, while the rule base checks data availability and guides progression through the LCA phases. This structure provides data, equations, and links between variables, allowing users to follow a clear process from goal definition to interpretation without the need to collect data from multiple sources. The framework builds on existing LCA methods by integrating them within an expert system structure, where inputs, outputs, impact categories, and interpretation data are organized in the knowledge base. Normalization and weighting are included within the same structure, allowing results to be interpreted at different levels [36].
Several studies, such as [11,12,13,37], emphasize the widespread use of LCA frameworks but also highlight methodological inconsistencies, fragmented inventory data, and limited integration of social and economic metrics. The EAGLES framework addresses these issues by organizing data within the knowledge base and applying rule-based progression across the LCA phases. That supports consistent data use and reduces fragmentation by consolidating all required data into a single place.
The use of LCA in resource-efficiency studies also reveals gaps in structure and consistency. Studies such as [9,15] show that energy use models often lack standard structure and full coverage. The EAGLES framework links inputs, outputs, and impacts within the same process through the knowledge base, while the rule base ensures that each step follows the required sequence. That allows relationships between energy use, emissions, and environmental impacts to be followed across phases.
Standardization remains a challenge in LCA. The EAGLES framework supports standardization by organizing data and terms within the knowledge base and applying rule-based progression across phases, while still allowing for the inclusion of different systems. That improves consistency and makes results easier to compare.

Limitations of the Study and Future Work

While the EAGLES framework provides a structured approach, it still has limitations. First, the framework depends on data stored in the knowledge base. That may limit its use in regions with limited data or that need updating, which means the knowledge base must be updated over time. This concern has also been noted in studies such as [14,17]. A structured process is used to update the knowledge base. New sources are first added to a central registry and assigned a unique identifier (Stable_ID). The required information is then extracted and linked across phases using consistent IDs, including Goal_ID, Product_ID, Scope_ID, as well as input_ID, output_ID, and emission factors used across phases. If new categories are identified, new IDs are created following the same structure, and all entries are checked against the original source to maintain traceability. This structure supports consistent data updating and allows integration of data from published studies and open databases. That indicates that the framework performance is directly linked to the availability and coverage of the data included in the knowledge base.
Second, the framework focuses mainly on environmental impacts, with limited coverage of social and economic aspects. This reflects a common gap in LCA studies, as noted by [11,12], and suggests the inclusion of Social LCA and Life Cycle Costing. Other studies, such as [38,39], also highlight the need to include socio-economic factors. The structure of the EAGLES framework allows this extension because the knowledge base already organizes data by inputs, outputs, stages, and phases. Some social-related data are already included, such as labor hours associated with different production stages (see Phase 2 inventory dataset). These data can serve as a starting point for representing social indicators, such as labor input and workforce requirements. For example, in the rice case study, labor hours are available for the defined stages and can be linked to the system within the framework. In the same way, economic data, such as input costs and production costs, can be linked to the inputs used in the inventory phase. The rule base can then be used to check data availability and guide the use of these indicators across phases, using the same process applied for environmental impacts. That shows that the framework can support multiple dimensions of sustainability using the same structure. This extension is part of the framework design but was not applied in detail in the current case study.
Third, although the framework is designed to guide users, its use by people with limited LCA experience has not yet been tested in real applications. Similar concerns were raised by [40], who noted that many tools lack practical usability. In this study, the framework was demonstrated through a rice production case study, providing initial validation of its structure and application. Future work will include usability testing with non-expert users, such as graduate students in environmental engineering and early-stage researchers with limited LCA experience, through simple case-based tasks (e.g., applying the framework to a small example system) and feedback surveys to evaluate ease of use, learning process, and decision support. Future applications will also include additional case studies to further examine the framework across different agricultural systems and impact categories. Finally, although the knowledge base was developed from 184 studies and updated with recent work up to May 2025, regular updates are needed to include new data, technologies, and regional information and to expand the dataset across different systems. The datasets developed for Phases 2–4 are prepared for separate data papers to provide detailed descriptions and support future use of the framework. That allows the framework to be extended and updated over time as new data becomes available.

5. Conclusions

The EAGLES framework combines an expert system (knowledge base and rule base) with the Life Cycle Assessment (LCA) phases and was developed from 12 review papers and 184 studies, including recent publications up to May 2025. The knowledge base includes 13 life cycle stages, 36 impact categories, and updated data on inputs, outputs, and emissions. By organizing this information into phase-based knowledge base files and controlling progression using a rule base, the framework is designed to address issues such as fragmented data, inconsistent impact categories, limited regional coverage, and limited integration across LCA phases [39,41,42,43].
The framework was applied to a rice production case study in Mississippi, and the results were compared with those obtained using openLCA through the ReCiPe method. The comparison highlighted that differences in results are not only due to characterization factors, but also due to how the system is defined, how data are handled, and how the LCA phases are connected. The results also showed that EAGLES supports the full LCA process within one structure, including inventory, impact assessment, normalization, weighting, and interpretation. That allows results to be linked to key issues and recommendations within the same analysis.
While some limitations remain, especially in social and economic aspects and the need for real-world validation, the integration of the expert system with LCA provides, in this case study, a structured way to guide users through each phase. The knowledge base stores the required data, and the rule base controls the progression by checking data availability. That application suggests that the framework can help reduce the need for prior LCA experience and support more consistent, transparent analysis. However, this has not yet been tested in real applications and will be evaluated in future work. Overall, the EAGLES framework provides, through this case study, a clear and structured approach for conducting agricultural LCA and supports better use of available data across all phases. With further development, the framework can be extended into a software platform while keeping the same expert system structure (knowledge base and rule base). Future applications across different systems will be needed to confirm the framework’s broader use. That would support researchers, practitioners, and policymakers in applying LCA consistently and help improve environmental decision-making in agriculture.

Supplementary Materials

The following supporting information can be downloaded at: https://www.mdpi.com/article/10.3390/agriculture16111192/s1, Supplementary File S1: Phase 1 knowledge base (goals, products, and scopes); Supplementary File S2: Phase 2 knowledge base (inputs, outputs, emission factors, and data sources); Supplementary File S3: Phase 3 knowledge base (impact categories, characterization, normalization, and weighting); Supplementary File S4: Phase 4 knowledge base (key issues and recommendations). Additional source records used for knowledge base organization are provided within the Supplementary Files and correspond to References [44,45,46,47,48,49,50,51,52,53,54,55,56,57,58,59,60,61,62,63,64,65,66,67,68,69,70,71,72,73,74,75,76,77,78,79,80,81,82,83].

Author Contributions

R.A. contributed to conceptualization, data curation, formal analysis, investigation, methodology, visualization, writing—original draft, and writing—review & editing. A.A. contributed to conceptualization, funding acquisition, methodology, project administration, resources, supervision, and visualization. V.T. contributed to data curation and writing—review & editing. D.M.S. contributed to data curation, methodology, writing—original draft, and writing—review & editing. I.A. contributed to data curation, formal analysis, and writing—review & editing. All authors have read and agreed to the published version of the manuscript.

Funding

This research was partially funded by the USDA-NIFA capacity-building grant 2022-38821-37522, USDA-NIFA Evans-Allen Project, Grant 11979180/2016-01711, USDA NIFA Centers of Excellence Award 2022-38427-37379, and the USDA-ARS to Florida A&M University through Non-Assistance Cooperative Agreement grant no. 58-6066-1-044.

Institutional Review Board Statement

Not applicable. This study is based solely on published literature and did not involve human participants or animals.

Data Availability Statement

The original contributions presented in this study are included in the Supplementary Materials. Further inquiries can be directed to the corresponding author.

Acknowledgments

The authors would like to thank Eman Elkholy, Ernesta Hunter, Ernsuze Declama, and Karunya Baburaj for their support and assistance during this study. The authors also acknowledge the financial support of the Saudi Arabian Cultural Mission (SACM) under grant No. KSA10009393.

Conflicts of Interest

The authors declare no conflicts of interest.

Abbreviations

The following abbreviations are used in this manuscript:
EAGLESEnvironmental Impact of Agriculture using Life Cycle Assessment and Expert System
LCALife Cycle Assessment
LCIALife Cycle Impact Assessment
ESExpert System
KBKnowledge Base
RBRule Base
FUFunctional Unit
EFEmission Factor
CFCharacterization Factor
NO 3 Nitrate
NNitrogen
MEPMarine Eutrophication Potential
USDAUnited States Department of Agriculture
GHGGreenhouse Gas
S-LCASocial Life Cycle Assessment
LCCLife Cycle Costing
R1–R14Rule identifiers used in the framework
Phase 1–4LCA phases (Goal & Scope, Inventory, Impact Assessment, Interpretation)

References

  1. Alhashim, R.; Deepa, R.; Anandhi, A. Environmental Impact Assessment of Agricultural Production Using LCA: A Review. Climate 2021, 9, 164. [Google Scholar] [CrossRef]
  2. Wood, C. Environmental Impact Assessment: A Comparative Review, 2nd ed.; Routledge: London, UK, 2013; p. 432. [Google Scholar]
  3. Zain, M.; Si, Z.; Li, S.; Gao, Y.; Mehmood, F.; Rahman, S.-U.; Mounkaila Hamani, A.K.; Duan, A. The Coupled Effects of Irrigation Scheduling and Nitrogen Fertilization Mode on Growth, Yield and Water Use Efficiency in Drip-Irrigated Winter Wheat. Sustainability 2021, 13, 2742. [Google Scholar] [CrossRef]
  4. Fan, W.; Zhang, P.; Xu, Z.; Wei, H.; Lu, N.; Wang, X.; Weng, B.; Chen, Z.; Wu, F.; Dong, X. Life Cycle Environmental Impact Assessment of Circular Agriculture: A Case Study in Fuqing, China. Sustainability 2018, 10, 1810. [Google Scholar] [CrossRef]
  5. Nedd, R.; Anandhi, A. A synthesis on land degradation in the context of sustainable development goals. Land Degrad. Dev. 2024, 35, 3937–3964. [Google Scholar] [CrossRef]
  6. von Blottnitz, H.; Curran, M.A. A review of assessments conducted on bio-ethanol as a transportation fuel from a net energy, greenhouse gas, and environmental life cycle perspective. J. Clean. Prod. 2007, 15, 607–619. [Google Scholar] [CrossRef]
  7. Brown, P.; Consortium, R.; Zhou, Y. Large expert-curated database for benchmarking document similarity detection in biomedical literature search. Database 2019, 2019, baz085. [Google Scholar] [CrossRef]
  8. Siegmeier, T.; Blumenstein, B.; Möller, D. The alliance of agricultural bioenergy and organic farming topics in scientific literature. Org. Agric. 2014, 4, 243–268. [Google Scholar] [CrossRef]
  9. Banaeian, N.; Zangeneh, M.; Clark, S. Trends and Future Directions in Crop Energy Analyses: A Focus on Iran. Sustainability 2020, 12, 10002. [Google Scholar] [CrossRef]
  10. Senthilvalavan, P.; Sriramachandrasekharan, M.V.; Manivannan, R.; Ravikumar, C.; Lalitha, M.; Surendran, U.; Singh, P. Carbon Sequestration in Low Land Paddy Soils: Effect of Certain Cultural and Nutrient Management Practices: A Review. Int. J. Environ. Clim. Change 2023, 13, 3170–3190. [Google Scholar] [CrossRef]
  11. Bahmutsky, S.; Grassauer, F.; Arulnathan, V.; Pelletier, N. A review of life cycle impacts and costs of precision agriculture for cultivation of field crops. Sustain. Prod. Consum. 2024, 52, 347–362. [Google Scholar] [CrossRef]
  12. Kheiralipour, K.; Brandão, M.; Holka, M.; Choryński, A. A Review of Environmental Impacts of Wheat Production in Different Agrotechnical Systems. Resources 2024, 13, 93. [Google Scholar] [CrossRef]
  13. Brockmann, D.; Pradel, M.; Hélias, A. Agricultural use of organic residues in life cycle assessment: Current practices and proposal for the computation of field emissions and of the nitrogen mineral fertilizer equivalent. Resour. Conserv. Recycl. 2018, 133, 50–62. [Google Scholar] [CrossRef]
  14. Mordini, M.; Nemecek, T.; Gaillard, G. Carbon & Water Footprint of Oranges and Strawberries: A Literature Review; Agroscope Reckenholz-Tänikon Research Station ART: Zurich, Switzerland, 2009. [Google Scholar]
  15. Lund, C.; Biswas, W. A Review of the Application of Lifecycle Analysis to Renewable Energy Systems. Bull. Sci. Technol. Soc. 2008, 28, 200–209. [Google Scholar] [CrossRef]
  16. Parajuli, R.; Thoma, G.; Matlock, M.D. Environmental sustainability of fruit and vegetable production supply chains in the face of climate change: A review. Sci. Total Environ. 2019, 650, 2863–2879. [Google Scholar] [CrossRef]
  17. Decano-Valentin, C.; Lee, I.-B.; Yeo, U.-H.; Lee, S.-Y.; Kim, J.-G.; Park, S.-J.; Choi, Y.-B.; Cho, J.-H.; Jeong, H.-H. Integrated Building Energy Simulation–Life Cycle Assessment (BES–LCA) Approach for Environmental Assessment of Agricultural Building: A Review and Application to Greenhouse Heating Systems. Agronomy 2021, 11, 1230. [Google Scholar] [CrossRef]
  18. Bashyal, S.; Paudyal, B.; Pandey, D.; Paudel, P.P.; Bhatta, A.; Kim, D.H.; Kafle, S. Comparative assessment of energy, economics, and emission (3E) of rice production in plain and hilly areas in Nepal. J. Biosyst. Eng. 2024, 49, 313–325. [Google Scholar] [CrossRef]
  19. Alhashim, R.; Anandhi, A. Agricultural Life Cycle Assessment Dataset of Phase 1 Goals, Products, and Scope Definitions. Data 2026, 11, 121. [Google Scholar] [CrossRef]
  20. Caley, M.J.; O’Leary, R.A.; Fisher, R.; Low-Choy, S.; Johnson, S.; Mengersen, K. What is an expert? A systems perspective on expertise. Ecol. Evol. 2014, 4, 231–242. [Google Scholar] [CrossRef] [PubMed]
  21. Balasuriya, B.T.G.; Ghose, A.; Gheewala, S.H.; Prapaspongsa, T. Assessment of eutrophication potential from fertiliser application in agricultural systems in Thailand. Sci. Total Environ. 2022, 833, 154993. [Google Scholar] [CrossRef]
  22. Liang, L.; Lal, R.; Ridoutt, B.G.; Zhao, G.; Du, Z.; Li, L.; Feng, D.; Wang, L.; Peng, P.; Hang, S.; et al. Multi-indicator assessment of a water-saving agricultural engineering project in North Beijing, China. Agric. Water Manag. 2018, 200, 34–46. [Google Scholar] [CrossRef]
  23. Mousavi-Avval, S.H.; Rafiee, S.; Sharifi, M.; Hosseinpour, S.; Notarnicola, B.; Tassielli, G.; Renzulli, P.A.; Khanali, M. Use of LCA indicators to assess Iranian rapeseed production systems with different residue management practices. Ecol. Indic. 2017, 80, 31–39. [Google Scholar] [CrossRef]
  24. Prechsl, U.E.; Wittwer, R.; van der Heijden, M.G.A.; Lüscher, G.; Jeanneret, P.; Nemecek, T. Assessing the environmental impacts of cropping systems and cover crops: Life cycle assessment of FAST, a long-term arable farming field experiment. Agric. Syst. 2017, 157, 39–50. [Google Scholar] [CrossRef]
  25. Liang, L.; Lal, R.; Ridoutt, B.G.; Du, Z.; Wang, D.; Wang, L.; Wu, W.; Zhao, G. Life Cycle Assessment of China’s agroecosystems. Ecol. Indic. 2018, 88, 341–350. [Google Scholar] [CrossRef]
  26. González, S.S. The Swelling Pressure of Bentonite and Sand Mixtures. Master’s Thesis, KTH Royal Institute of Technology, Stockholm, Sweden, 2013. [Google Scholar]
  27. Parajuli, R.; Kristensen, I.S.; Knudsen, M.T.; Mogensen, L.; Corona, A.; Birkved, M.; Peña, N.; Graversgaard, M.; Dalgaard, T. Environmental life cycle assessments of producing maize, grass-clover, ryegrass and winter wheat straw for biorefinery. J. Clean. Prod. 2017, 142, 3859–3871. [Google Scholar] [CrossRef]
  28. Wang, J.; Zhang, L.; He, X.; Zhang, Y.; Wan, Y.; Duan, S.; Xu, C.; Mao, X.; Chen, X.; Shi, X. Environmental mitigation potential by improved nutrient managements in pear (Pyrus pyrifolia L.) orchards based on life cycle assessment: A case study in the North China Plain. J. Clean. Prod. 2020, 262, 121273. [Google Scholar] [CrossRef]
  29. Alföldi, T.; Fliessbach, A.; Geier, U.; Kilcher, L.; Niggli, U.; Pfiffner, L.; Stolze, M.; Willer, H. Organic Agriculture and the Environment; Environment and Natural Resources Series No. 4; Food and Agriculture Organization (FAO) of the United Nations: Rome, Italy, 2002. [Google Scholar]
  30. Parajuli, R. Environmental Sustainability Assessment of Biomass and Biorefinery Production Chains: Using a Life Cycle Assessment Approach. Ph.D. Thesis, Aarhus University, Aarhus, Denmark, 2016. [Google Scholar]
  31. Spinelli, D.; Bardi, L.; Fierro, A.; Jez, S.; Basosi, R. Environmental analysis of sunflower production with different forms of mineral nitrogen fertilizers. J. Environ. Manag. 2013, 129, 302–308. [Google Scholar] [CrossRef] [PubMed]
  32. Alocilja, E.C. Principles of Biosystems Engineering; Department of Biosystems and Agricultural Engineering, Michigan State University: East Lansing, MI, USA, 2002. [Google Scholar]
  33. Bartzas, G.; Zaharaki, D.; Komnitsas, K. Life cycle assessment of open field and greenhouse cultivation of lettuce and barley. Inf. Process. Agric. 2015, 2, 191–207. [Google Scholar] [CrossRef]
  34. Azizpanah, A.; Fathi, R.; Taki, M. Eco-energy and environmental evaluation of cantaloupe production by life cycle assessment method. Environ. Sci. Pollut. Res. 2022, 30, 1854–1870. [Google Scholar] [CrossRef] [PubMed]
  35. Ali, M.; Geng, Y.; Robins, D.; Cooper, D.; Roberts, W. Impact assessment of energy utilization in agriculture for India and Pakistan. Sci. Total Environ. 2019, 648, 1520–1526. [Google Scholar] [CrossRef]
  36. Mackenzie, S.G. Modelling the Environmental Impacts of Pig Farming Systems and the Potential of Nutritional Solutions to Mitigate Them. Ph.D. Thesis, Newcastle University, Newcastle, UK, 2016. [Google Scholar]
  37. Gasso, V.; Sørensen, C.A.G.; Oudshoorn, F.W.; Green, O. Controlled traffic farming: A review of the environmental impacts. Environ. Sci. Technol. 2013, 48, 66–73. [Google Scholar] [CrossRef]
  38. Vinci, G.; Prencipe, S.A.; Ruggeri, M.; Gobbi, L.; Arcese, G. Sustainability performance evaluation in the organic durum wheat production: Evidence from Italy. Int. J. Life Cycle Assess. 2024, 30, 1115–1133. [Google Scholar] [CrossRef]
  39. Barghash, H.; AlRashdi, Z.; Okedu, K.; Desmond, P. Life-Cycle Assessment Study for Bio-Hydrogen Gas Production from Sewage Treatment Plants Using Solar PVs. Energies 2022, 15, 8056. [Google Scholar] [CrossRef]
  40. Banyal, S.; Aggarwal, R.K.; Bhardwaj, S.K. A review on methodologies adopted during environmental impact assessment of development projects. J. Pharmacogn. Phytochem. 2019, 8, 2108–2119. [Google Scholar] [CrossRef]
  41. Abbas, F.; Al-Otoom, A.; Al-Naemi, S.; Ashraf, A.; Mahasneh, H. Experimental and life cycle assessments of tomato (Solanum lycopersicum) cultivation under controlled environment agriculture. J. Agric. Food Res. 2024, 18, 101266. [Google Scholar] [CrossRef]
  42. Quevedo-Cascante, M.; Mogensen, L.; Kongsted, A.G.; Knudsen, M.T. How does Life Cycle Assessment capture the environmental impacts of agroforestry? A systematic review. Sci. Total Environ. 2023, 890, 164094. [Google Scholar] [CrossRef]
  43. Zhen, H.; Quevedo-Cascante, M.; Mogensen, L.; Dorca-Preda, T.; Waqas, M.A.; Kongsted, A.G.; Knudsen, M.T. Climate and Environmental Impact of Products from Mixed and Agroforestry Systems; D4.1; Aarhus University: Aarhus, Denmark, 2025; p. 118. [Google Scholar]
  44. Masuda, K. Combined Application of a Multi-Objective Genetic Algorithm and Life Cycle Assessment for Evaluating Environmentally Friendly Farming Practices in Japanese Rice Farms. Sustainability 2023, 15, 59. [Google Scholar] [CrossRef]
  45. Medel-Jiménez, F.; Krexner, T.; Gronauer, A.; Kral, I. Life cycle assessment of four different precision agriculture technologies and comparison with a conventional scheme. J. Clean. Prod. 2024, 434, 140198. [Google Scholar] [CrossRef]
  46. Michiels, F.; Hubo, L.; Geeraerd, A. Why mass allocation with representative allocation factor is preferential in LCA when using residual livestock products as organic fertilizers. J. Environ. Manag. 2021, 297, 113337. [Google Scholar] [CrossRef]
  47. Miksa, O.; Chen, X.; Baležentienė, L.; Streimikiene, D.; Balezentis, T. Ecological challenges in life cycle assessment and carbon budget of organic and conventional agroecosystems: A case from Lithuania. Sci. Total Environ. 2020, 714, 136850. [Google Scholar] [CrossRef]
  48. Mohammadi, A.; Rafiee, S.; Jafari, A.; Dalgaard, T.; Knudsen, M.T.; Keyhani, A.; Mousavi-Avval, S.H.; Hermansen, J.E. Potential greenhouse gas emission reductions in soybean farming: A combined use of Life Cycle Assessment and Data Envelopment Analysis. J. Clean. Prod. 2013, 54, 89–100. [Google Scholar] [CrossRef]
  49. Moreschi, L. Process Optimization in the Agri-Food Industry Chain from an Eco-Design and Product Stewardship Perspective Doctor of Philosophy. Ph.D. Thesis, University of Genoa, Genoa, Italy, 2022. [Google Scholar]
  50. Mukosha, C.E.; Moudrý, J.; Lacko-Bartošová, M.; Lacko-Bartošová, L.; Eze, F.O.; Neugschwandtner, R.W.; Amirahmadi, E.; Lehejček, J.; Bernas, J. The effect of cropping systems on environmental impact associated with winter wheat production—An LCA “cradle to farm gate” approach. Agriculture 2023, 13, 2068. [Google Scholar] [CrossRef]
  51. Nabavi-Pelesaraei, A.; Rafiee, S.; Mohtasebi, S.S.; Hosseinzadeh-Bandbafha, H.; Chau, K.-w. Integration of artificial intelligence methods and life cycle assessment to predict energy output and environmental impacts of paddy production. Sci. Total Environ. 2018, 631–632, 1279–1294. [Google Scholar] [CrossRef]
  52. Nemecek, T.; Schnetzer, J.; Reinhard, J. Updated and harmonised greenhouse gas emissions for crop inventories. Int. J. Life Cycle Assess. 2016, 21, 1361–1378. [Google Scholar] [CrossRef]
  53. Nguyen, T.T.H.; Werf, H.M.G.V.D.; Doreau, M. Life cycle assessment of three bull-fattening systems: Effect of impact categories on ranking. J. Agric. Sci. 2012, 150, 755–763. [Google Scholar] [CrossRef][Green Version]
  54. Parajuli, R.; Løkke, S.; Østergaard, P.A.; Knudsen, M.T.; Schmidt, J.H.; Dalgaard, T. Life Cycle Assessment of district heat production in a straw fired CHP plant. Biomass Bioenergy 2014, 68, 115–134. [Google Scholar] [CrossRef]
  55. Pradeleix, L.; Bouarfa, S.; Bellon-Maurel, V.; Roux, P. Assessing Environmental Impacts of Groundwater Irrigation Using the Life Cycle Assessment Method: Application to a Tunisian Arid Region. Irrig. Drain. 2020, 69, 117–125. [Google Scholar] [CrossRef]
  56. Rajaeifar, M.A.; Akram, A.; Ghobadian, B.; Rafiee, S.; Heijungs, R.; Tabatabaei, M. Environmental impact assessment of olive pomace oil biodiesel production and consumption: A comparative lifecycle assessment. Energy 2016, 106, 87–102. [Google Scholar] [CrossRef]
  57. Rosenbaum, R.K.; Anton, A.; Bengoa, X.; Bjørn, A.; Brain, R.; Bulle, C.; Cosme, N.; Dijkman, T.J.; Fantke, P.; Felix, M.; et al. The Glasgow consensus on the delineation between pesticide emission inventory and impact assessment for LCA. Int. J. Life Cycle Assess. 2015, 20, 765–776. [Google Scholar] [CrossRef]
  58. Sahoo, K.; Khatri, P.; Kanwar, A.; Singh, H.P.; Mani, S.; Bergman, R.; Runge, T.; Kumar, D. Integrated environmental and economic assessments of producing energy crops with cover crops for simultaneous use as biofuel feedstocks and animal fodder. Ind. Crops Prod. 2022, 179, 114681. [Google Scholar] [CrossRef]
  59. Salim, I.; González-García, S.; Feijoo, G.; Moreira, M.T. Assessing the environmental sustainability of glucose from wheat as a fermentation feedstock. J. Environ. Manag. 2019, 247, 323–332. [Google Scholar] [CrossRef] [PubMed]
  60. Schmidt, J.H.; Christensen, P.; Christensen, T.S. Assessing the land use implications of biodiesel use from an LCA perspective. J. Land Use Sci. 2009, 4, 35–52. [Google Scholar] [CrossRef]
  61. Singh, A.K.; Aboo, S.; Goswami, T.; Kar, G. Jute and kenaf carrier bags: An eco-friendly alternative to plastic bags in India. Environ. Sci. Pollut. Res. Int. 2023, 30, 61904–61912. [Google Scholar] [CrossRef]
  62. Solinas, S.; Tiloca, M.T.; Deligios, P.A.; Cossu, M.; Ledda, L. Carbon footprints and social carbon cost assessments in a perennial energy crop system: A comparison of fertilizer management practices in a Mediterranean area. Agric. Syst. 2021, 186, 102989. [Google Scholar] [CrossRef]
  63. Sonesson, U.G.; Lorentzon, K.; Andersson, A.; Barr, U.-K.; Bertilsson, J.; Borch, E.; Brunius, C.; Emanuelsson, M.; Göransson, L.; Gunnarsson, S.; et al. Paths to a sustainable food sector: Integrated design and LCA of future food supply chains: The case of pork production in Sweden. Int. J. Life Cycle Assess. 2016, 21, 664–676. [Google Scholar] [CrossRef]
  64. Sun, R.; Kulshreshtha, S.N.; Crézé, C.M.; Madramootoo, C.A. Enhancing environmental sustainability in eastern Canada’s corn agroecosystem with controlled drainage and subsurface irrigation. J. Water Clim. Change 2023, 14, 1900–1911. [Google Scholar] [CrossRef]
  65. Supasri, T.; Itsubo, N.; Gheewala, S.H.; Sampattagul, S. Life cycle assessment of maize cultivation and biomass utilization in northern Thailand. Sci. Rep. 2020, 10, 3516. [Google Scholar] [CrossRef]
  66. Taherzadeh-Shalmaei, N.; Sharifi, M.; Armashi, R.; Mobli, H. Comparative analysis for energy technique and life cycle assessment approach of triticale production with phosphorus solubilizing bacteria. Environ. Resour. Res. 2023, 11, 209–224. [Google Scholar]
  67. Van Mierlo, K.; Baert, L.; Bracquené, E.; De Tavernier, J.; Geeraerd, A. The Influence of Farm Characteristics and Feed Compositions on the Environmental Impact of Pig Production in Flanders: Productivity, Energy Use and Protein Choices Are Key. Sustainability 2021, 13, 11623. [Google Scholar] [CrossRef]
  68. Verdi, L.; Dalla Marta, A.; Falconi, F.; Orlandini, S.; Mancini, M. Comparison between organic and conventional farming systems using Life Cycle Assessment (LCA): A case study with an ancient wheat variety. Eur. J. Agron. 2022, 141, 126638. [Google Scholar] [CrossRef]
  69. Wang, Y.; He, W.; Yan, C.; Gao, H.; Cui, J.; Liu, Q. Environmental impact of various rice cultivation methods in northeast China through life cycle assessment. Agronomy 2024, 14, 267. [Google Scholar] [CrossRef]
  70. Wowra, K.; Zeller, V.; Schebek, L. Regional nitrogen resilience as distance-to-target approach in LCA of crop production systems. Environ. Impact Assess. Rev. 2022, 97, 106869. [Google Scholar] [CrossRef]
  71. Wowra, K.; Zeller, V.; Schebek, L. Evaluation of the Environmental Performance of Cropping Systems under Different Nitrogen Management Scenarios Considering Regional Nitrogen Resilience. Sustainability 2022, 14, 5286. [Google Scholar] [CrossRef]
  72. Wu, H.; Gao, L.; Yuan, Z.; Wang, S. Life cycle assessment of phosphorus use efficiency in crop production system of three crops in Chaohu Watershed, China. J. Clean. Prod. 2016, 139, 1298–1307. [Google Scholar] [CrossRef]
  73. Wu, H.; Liu, Y.; Dai, C.; Ye, Y.; Zhu, H.; Fang, W. Life-cycle comparisons of economic and environmental consequences for pig production with four different models in China. Environ. Sci. Pollut. Res. Int. 2024, 31, 21668–21686. [Google Scholar] [CrossRef] [PubMed]
  74. Xing, J.; Song, J.; Liu, C.; Yang, W.; Duan, H.; Yabar, H.; Ren, J. Integrated crop-livestock-bioenergy system brings co-benefits and trade-offs in mitigating the environmental impacts of Chinese agriculture. Nat. Food 2022, 3, 1052–1064. [Google Scholar] [CrossRef] [PubMed]
  75. Xiong, L.; Shah, F.; Zhao, Y.; Li, Z.; Zha, X.; Ye, M.; Wu, W. Sustainability analysis of irrigated and rainfed wheat production systems under varying levels of nitrogen fertilizer through coupling of emergy accounting and life cycle assessment. J. Clean. Prod. 2024, 447, 141423. [Google Scholar] [CrossRef]
  76. Yang, K.; Yoon, J.I.; Ryu, H.; Chung, D.; Nam, T.; Nam, K. Potential Health Risk of Reused Creosote-Treated Old Railway Ties at Recreational Sites in Korea. Hum. Ecol. Risk Assess. Int. J. 2013, 19, 778–791. [Google Scholar] [CrossRef]
  77. Zhang, Z.; Zhao, J.; Hou, L.; Xu, X.; Zhu, Y.; Zhai, B.; Liu, Z. Comparative assessment of environmental impacts, mitigation potentials, and economic benefits of rain-fed and irrigated apple production systems on China’s Loess Plateau. Sci. Total Environ. 2023, 869, 161791. [Google Scholar] [CrossRef] [PubMed]
  78. Karamian, F.; Mirakzadeh, A.A.; Azari, A. Application of multi-objective genetic algorithm for optimal combination of resources to achieve sustainable agriculture based on the water-energy-food nexus framework. Sci. Total Environ. 2023, 860, 160419. [Google Scholar] [CrossRef]
  79. Fan, Y.; Wang, X.; Funk, T.; Rashid, I.; Herman, B.; Bompoti, N.; Mahmud, M.S.; Chrysochoou, M.; Yang, M.; Vadas, T.M.; et al. A Critical Review for Real-Time Continuous Soil Monitoring: Advantages, Challenges, and Perspectives. Environ. Sci. Technol. 2022, 56, 13546–13564. [Google Scholar] [CrossRef]
  80. Fan, Y.; Wang, X.; Qian, X.; Dixit, A.; Herman, B.; Lei, Y.; McCutcheon, J.; Li, B. Enhancing the Understanding of Soil Nitrogen Fate Using a 3D-Electrospray Sensor Roll Casted with a Thin-Layer Hydrogel. Environ. Sci. Technol. 2022, 56, 4905–4914. [Google Scholar] [CrossRef] [PubMed]
  81. Gong, H.; Wu, J.; Feng, G.; Jiao, X. Phosphorus supply chain for sustainable food production will have mitigated environmental pressure with region-specific phosphorus management. Resour. Conserv. Recycl. 2023, 188, 106686. [Google Scholar] [CrossRef]
  82. Heidarisoltanabadi, M. Environmental Effects of Agricultural Products, 1st ed.; IntechOpen: London, UK, 2024; p. 19. [Google Scholar]
  83. Herron, J.; O’Brien, D.; Shalloo, L. Life cycle assessment of pasture-based dairy production systems: Current and future performance. J. Dairy Sci. 2022, 105, 5849–5869. [Google Scholar] [CrossRef]
Figure 1. Integrating the expert system with the LAC methodology.
Agriculture 16 01192 g001
Figure 2. The EAGLES framework showing rule-based progression across the four LCA phases. Data availability in the knowledge base determines movement between steps.
Agriculture 16 01192 g002
Table 1. Phase 1 Rules.
Rule No.IF ConditionTHEN ActionResult
R1If the selected goal is availableProceed to product selectionQuantitative environmental impact assessment selected
R2If the selected product is availableProceed to scope selectionProduct = harvested rice (FU = 1 t)
R3If the selected scope is availableRetrieve stagesScope = gate-to-gate (crop growth + harvesting), area = 1.04 × 10⁵ acres
Table 2. Phase 2 Rules.
Rule No.IF ConditionTHEN ActionResult
R4If input data are availableProceed to calculationsTotal production = 3.921 × 10⁵ t rice
R5If the emission factor for NO 3 is availableRetrieve EFEF = 1.33 kg NO 3 /kg N
R6If equations for NO 3 are availableApply equations NO 3 emissions = 1.079 × 10⁷ kg
R7If the emission factor for NH3 is availableRetrieve EFEF = 0.14 kg NH3/kg N
R8If equations for NH3 are availableApply equationsNH3 emissions = 1.136 × 10⁶ kg
R9If the data source is availableUse dataUSDA + literature sources identified
Table 3. Phase 3 Rules.
Rule No.IF ConditionTHEN ActionResult
R10If NO 3 emission is availableAssign categoryMarine eutrophication
R11If CF for NO 3 is availableApply CFImpact = 1.7048 × 10⁶ kg N-eq
R12If population data for NO 3 are availableApply normalization0.578 kg N-eq person−1
R13If a weighting factor for NO 3 is availableApply weighting5.78
R14If NH3 emission is availableAssign categoryAcidification potential
R15If CF for NH3 is availableApply CFImpact = 2.136 × 10⁶ kg SO2-eq
R16If population data for NH3 are availableApply normalization0.724 kg SO2-eq person−1
R17If a weighting factor for NH3 is availableApply weighting7.24
Table 4. Phase 4 Rules.
Rule No.IF ConditionTHEN ActionResult
R12If the key for the NO 3 issue is availableRetrieve the key issueHigh NO 3 emissions → marine eutrophication risk
R13If recommendations for NO 3 are availableRetrieve recommendationsFertilizer optimization + organic nutrient use
R14If the key issue for NH3 is availableRetrieve the key issueHigh NH3 emissions → acidification risk
R15If the key issue for NH3 is availableRetrieve recommendationsReduce volatilization + improve fertilizer application
R16If data are missingReturn to the previous stepWorkflow controlled
Disclaimer/Publisher’s Note: The statements, opinions and data contained in all publications are solely those of the individual author(s) and contributor(s) and not of MDPI and/or the editor(s). MDPI and/or the editor(s) disclaim responsibility for any injury to people or property resulting from any ideas, methods, instructions or products referred to in the content.