Article

Spatiotemporal Distribution of Highland Barley Yield Potential and Its Response to Climate Change in the Yarlung Zangbo River and Its Two Tributaries, Tibet


1
School of Land Science and Space Planning, Hebei GEO University, Shijiazhuang 052161, China
2
Hebei International Joint Research Center for Remote Sensing of Agricultural Drought Monitoring, Hebei GEO University, Shijiazhuang 052161, China
3
Institute of Geographical Sciences and Natural Resources Research, Chinese Academy of Sciences, Beijing 100101, China
4
College of Resources and Environment, University of Chinese Academy of Sciences, Beijing 100049, China
5
Faculty of Geographical Science, Beijing Normal University, Beijing 100875, China
6
Key Laboratory of Carrying Capacity Assessment for Resource and Environment, Ministry of Natural Resources, Beijing 100101, China
*
Author to whom correspondence should be addressed.
Agriculture 2026, 16(10), 1125; https://doi.org/10.3390/agriculture16101125
Submission received: 4 April 2026 / Revised: 26 April 2026 / Accepted: 18 May 2026 / Published: 21 May 2026
(This article belongs to the Section Ecosystem, Environment and Climate Change in Agriculture)

Abstract

The yield of highland barley is not only related to the food security of Tibet but also to the social stability and development in the frontier region. This study revealed the spatiotemporal distribution of highland barley yield potential using the DSSAT model and GIS technology in the Yarlung Zangbo River and its two tributaries (YZTT) of Tibet from 1981 to 2020, and analyzed its response relationship to climate factors. The results show that the highland barley yield potential ranged from 4284.75 to 7341.15 kg/ha in the YZTT region during 1981 to 2020, with an average of 6719.87 kg/ha. Under the climate change, the highland barley yield potential was on a downward trend of −14.49 kg/ha·a over the past 40 years. In terms of the response of highland barley yield potential to climate change, the highland barley yield potential decreased by 2.90 kg/ha for every 1 MJ/m2 decrease in solar radiation. For every 1 °C increase in the maximum temperature, the highland barley yield potential increased by 219.68 kg/ha. Meanwhile, for every 1 °C increase in the minimum temperature, the highland barley yield potential increased by 91.40 kg/ha. These findings aim to provide reference for decision-making in agricultural policy and spatial allocation of agricultural resources.

1. Introduction

As the main food of Tibetans, highland barley plays a pivotal role in the lives of the local people, not only relating to the economic development but also to the stability and tranquility of the region [1]. Highland barley constitutes over 75% of the crop in planting area and yield according to statistical data of Tibet from 2020 to 2024. Its unique adaptability to the cold environment makes the status of highland barley as a grain crop unshakable [2,3]. And residents’ consumption of highland barley also occupies a primary position, although the food consumption structure tends to be diversified [4]. The higher status and consumption demand have led to a yield increase for highland barley [5]. However, the increased rate of highland barley yield has declined from the start of the 21st century. Concurrently, global warming has led to shortened growth days and an accelerated grain-filling rate for highland barley, which has proven favorable for harvest yield of highland barley [6,7]. However, under future climate scenarios, the growth period is projected to shorten further, presenting significant challenges to achieving yield increases in highland barley [8,9]. In order to cope with the increasing demand for highland barley, the yield potential of highland barley and changing patterns under climate change urgently need to be addressed.
Yield potential of crops generally refers to the production capacity of crops when there are no limits of water and nitrogen fertilizer, there is no stress from pests and diseases, weeds are completely controlled, and cultivation techniques and management levels are at their optimal state [10]. The quantitative methods for yield potential include process-based and statistical crop models [11]. The statistical (or often-called ‘empirical’) method aims to relate grain yield to agronomic and environmental factors (e.g., climate, soil, crop management information, etc.), lacking a description of crop growth processes [12]. Based on crop mechanism models, yield potential assessment takes into account factors such as crop variety, environment, and management, considering crop growth dynamics and achieving high accuracy in regional crop simulation [13]. The DSSAT model is one of the most commonly employed process-based crop models in agriculture [14,15,16]. It enables a quantitative and dynamic description of crop growth, development, and yield formation, with a focus on uncovering the process mechanisms linking input and output variables [17,18]. This demonstrates its superiority to traditional empirical formulas [19,20]. Alongside other established models, such as the WOFOST model [21] and APSIM model [22], the DSSAT model focuses more on agricultural management. Clarifying the spatiotemporal yield potential of highland barley under climate change is fundamental for yield improvement scientifically. However, current quantitative assessments mainly focus on data from experimental fields in limited areas [23,24]. The evaluation results could not represent the yield potential in the regional level. Coupling with Geographic Information System (GIS) technology, the spatial yield potential in grid cell can be assessed [25,26]. Based on this, coupling the GIS technology with the DSSAT crop model can elucidate the spatiotemporal yield potential of highland barley.
The Yarlung Zangbo River and its two tributaries (Lhasa River and Nianchu River, YZTT) are the main crop production base sites in Tibet, located in the valley, with favorable solar radiation, temperature, and water conditions [27]. However, located in the hinterland of the plateau, crop production is highly sensitive to climate change. In the future, climate warming will also lead to the expansion of the suitable planting areas for highland barley to higher altitudes, and the yield potential of highland barley in this area will change to varying degrees [28]. To this end, it is necessary to combine relevant theoretical knowledge of geography to evaluate the regional differences in highland barley yield potential under climate change. Generally, the yield potential is limited by solar radiation, temperature, precipitation, irrigation water, soil, pests, and diseases [29]. To reveal the maximum biological yield, the solar radiation and temperature are considered as the two main climate factors on yield potential of highland barley [30,31,32]. In the DSSAT model, the solar radiation and temperature are adopted to access the spatial–temporal distribution of the highland barley yield potential.
In this study, our objectives were to study the spatiotemporal distribution of highland barley yield potential in the YZTT area from 1981 to 2020, using the DSSAT model based on meteorological data, soil data, and field trial data. In addition, we assessed the response of highland barley yield potential to climate change and analyzed the impact of climate factors on it. In concrete terms, the cultivar parameters were calibrated and validated in the DSSAT model based on field data to improve the accuracy of the simulation. Secondly, we revealed the trend of highland barley yield potential in the past 40 years by using the Mann–Kendall trend test. Finally, we quantified the correlation coefficient between the yield potential and climate factors. It can provide data reference for highland barley variety optimization and agricultural planting layout under climate change.

2. Materials and Methods

2.1. Study Area

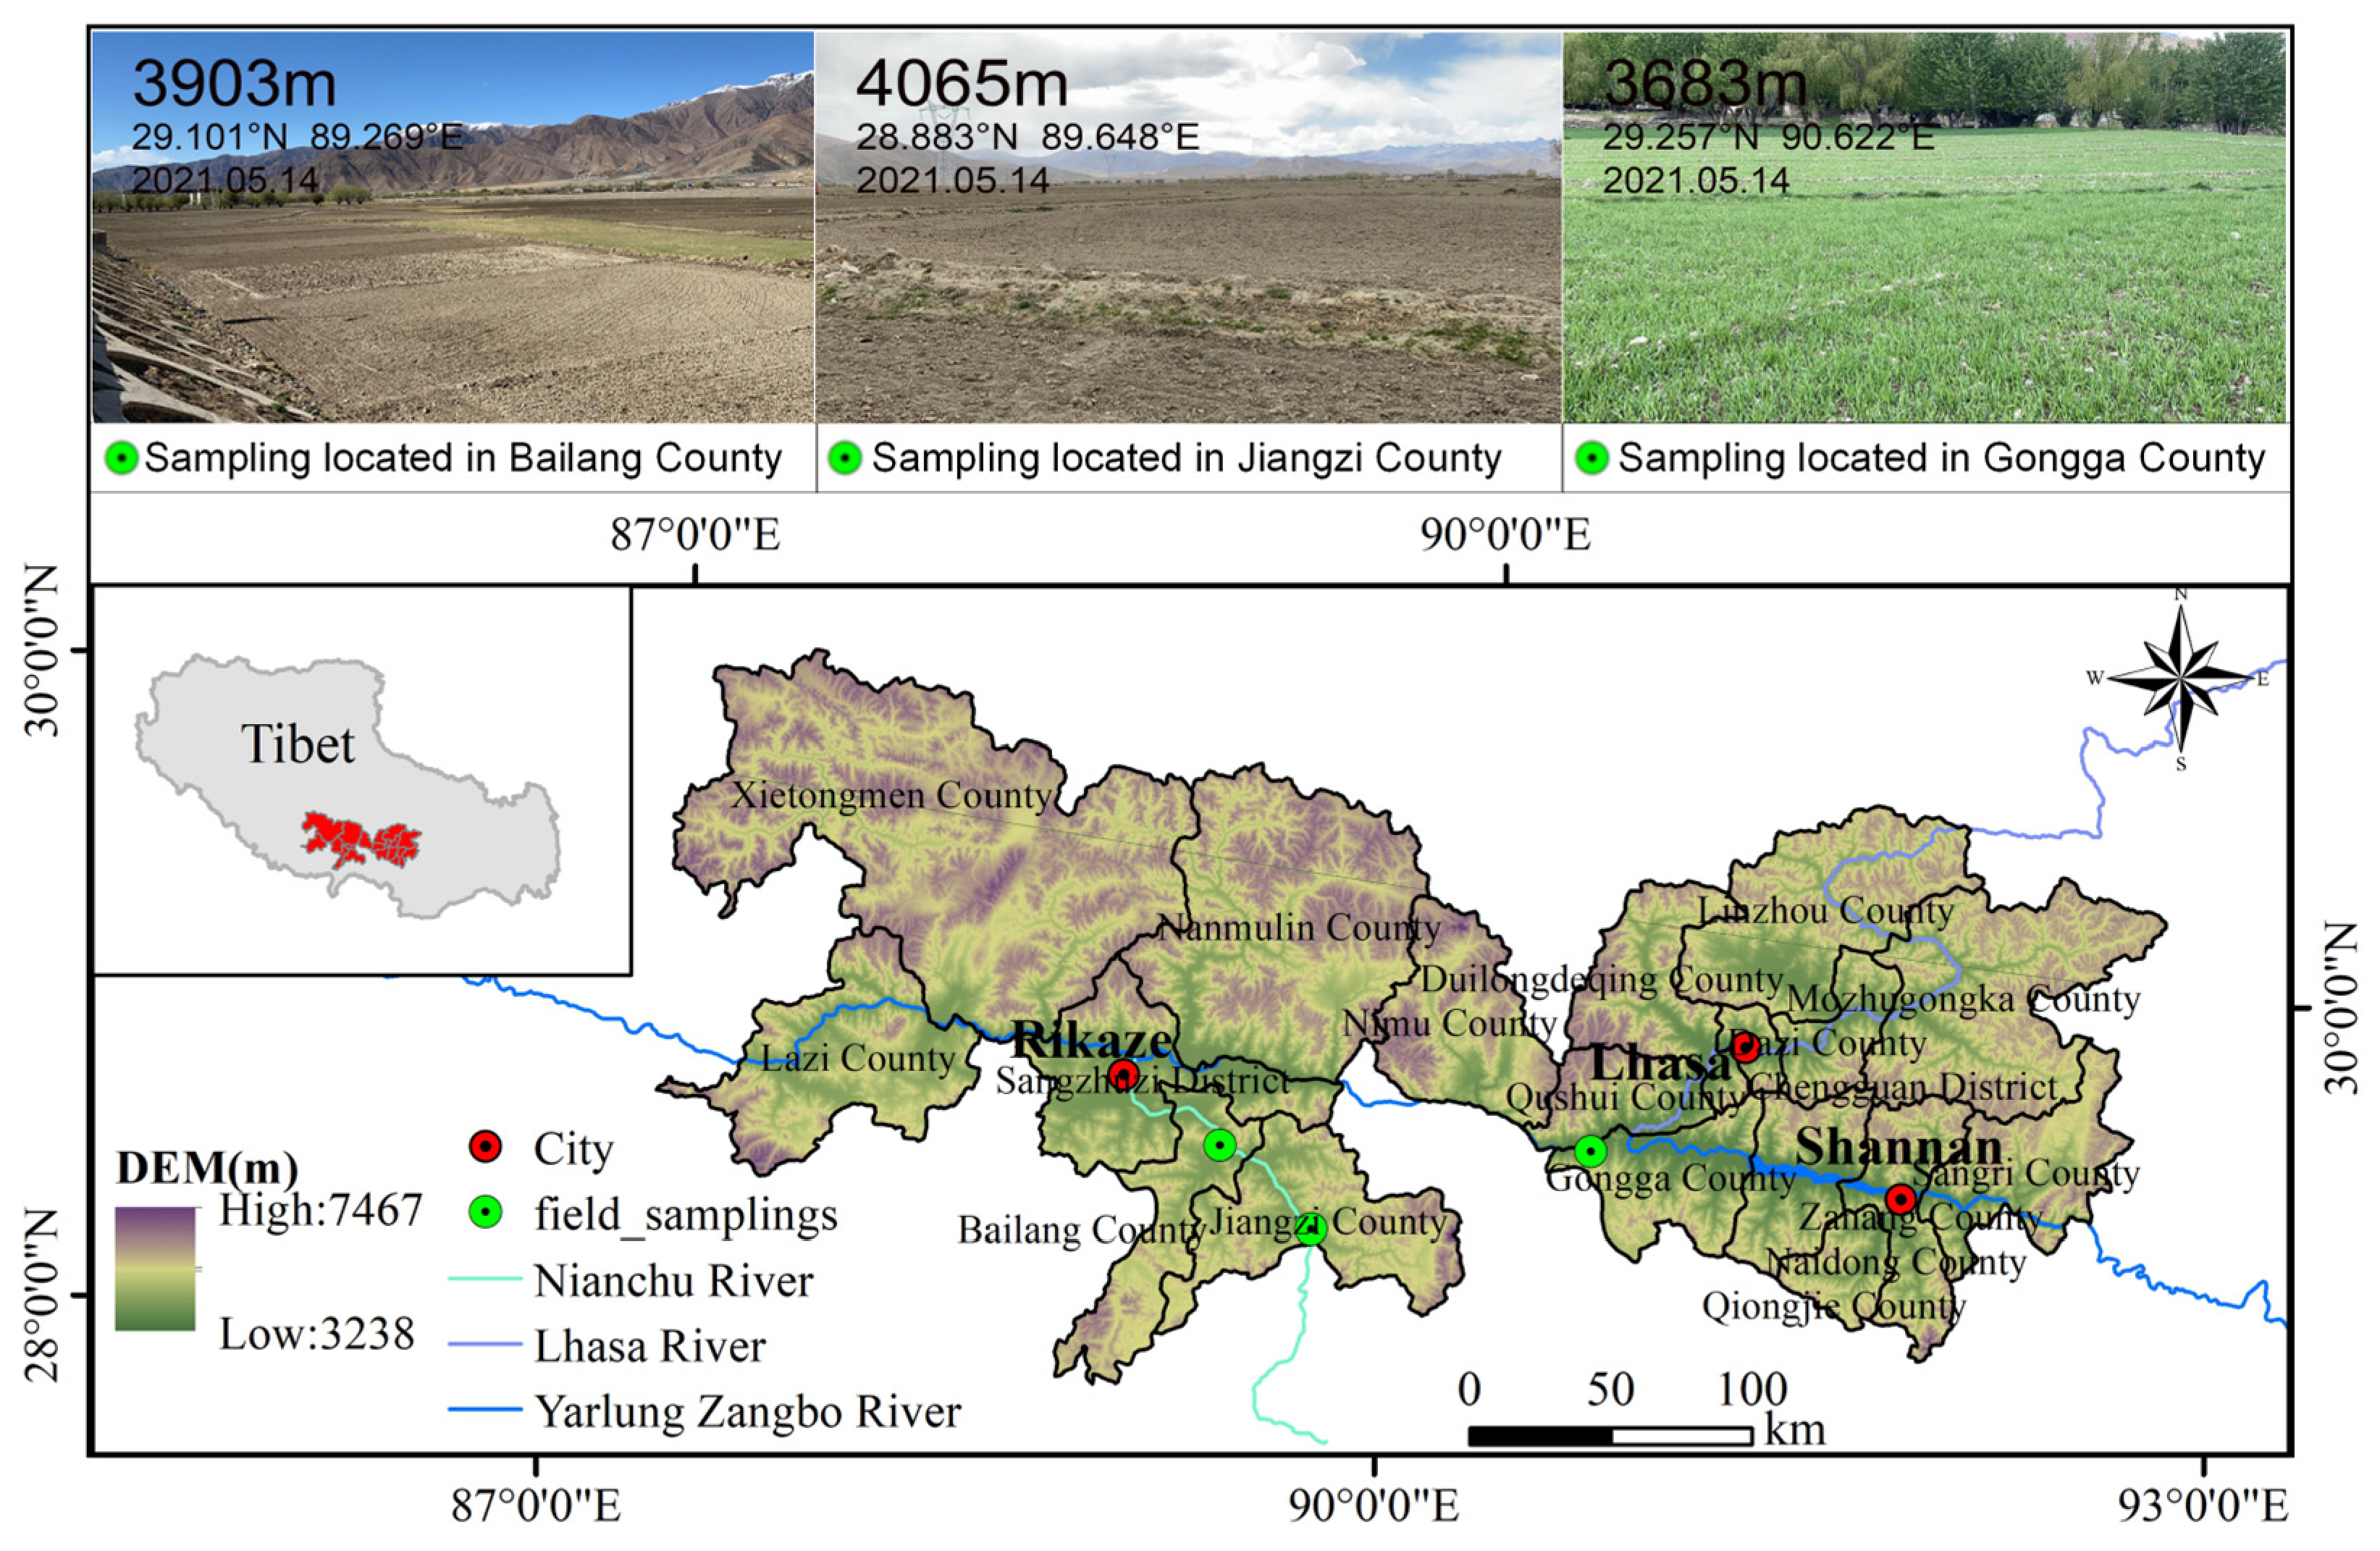
The YZTT area is located in South–Central Tibet and lies in 28°20′~31°20′N, 89°00′~92°35′E (Figure 1). As one of the main crop production base sites, the altitude for human survival and crop growth is generally in the range of 2700~4200 m [33]. This region has a typical plateau temperate monsoon semi-arid climate, with an average annual temperature in middle-elevation of 5~9 °C, and the monthly average highest and lowest temperature of the downstream watershed are 10~17 °C and −2~−17 °C, respectively [34]. This area has an average annual precipitation of 200~550 mm and an annual sunshine duration of 2800~3250 h [33,34,35]. The YZTT area is bounded by the counties and cities through which the watershed passes, including 18 districts/counties under the jurisdiction of Lhasa, Rikaze, and Shannan cities. They include four districts (namely, Chengguan, Duilongdeqing, Naidong, and Sanjuiz) and 14 counties, i.e., Linzhou, Nimu, Qushui, Dazi, Mozhugongka, Zhanang, Gonga, Sangri, Qiongjie, Namling, Gyantse, Lhazhi, Xietongmen, and Bailang. The land area is 66,500 km2, accounting for 5.41% of the land area of Tibet.
The YZTT area is located in the river valley basin; with convenient water diversion and irrigation, and favorable solar radiation and heat conditions, it is one of the main grain-producing areas and key agricultural development zones in Tibet. Highland barley is one of the main crops, and its production constitutes over 77% in grain crops. In this study, the YZTT area was divided into four zones, namely the Rikaze section of the Yarlung Zangbo River (Rikaze-YZR), the Shannan section of the Yarlung Zangbo River (Shannan-YZR), the Nianchu River (NR) basin, and the Lhasa River (LR) basin.

2.2. Data Sources and Preprocessing

The data used in this study mainly contain meteorological data, soil data, experimental management information, and field measurement data of highland barley. The daily meteorological data from 1981 to 2020 were purchased from the National Meteorological Information Centre, including precipitation, sunshine hours, maximum temperature, minimum temperature, average temperature, relative humidity, and other elements. The meteorological data were interpolated into raster data with a resolution of 1 km using Aunsplin 4.0 software, as detailed in Appendix A. The soil data (Appendix B) were derived from the Global Soil Data Set for Earth System Modeling (GSDE) database provided by the Cold and Dry Zone Scientific Data Centre, which was based on the Harmonized World Soil Database (HWSD) soil database and was developed at a spatial resolution of 10 km for DSSAT soil module computing. In addition, the spatial location of highland barley with a resolution of 10 m was extracted through remote-sensing classification technology.
The field management information in Table 1 and field measurement data in Table 2 for the test cultivar named Zangqing 2000, used to calibrate and validate the variety parameters in CERES-Barley model, were recorded by the Tibetan Academy of Agricultural and Animal Husbandry Sciences during 2014 to 2016. The cultivar Zangqing 2000 was recognized as a predominant highland barley variety in Tibet in 2013. It is characterized by its resistance to pests and lodging, and is well-suited for cultivation in valley areas at altitudes below 4300 m under moderate fertilizer and water conditions [36].
The field management information included sowing and planting date, sowing density, row spacing, sowing depth, and irrigation and fertilization information. The field measurement data included yield (Y), seed weight (SW), length of spike (SL), number of grains per spike (GNS), ear number (EN), and plant height (PH). In addition, the phenological phases used to characterize the growth status of highland barley were evaluated based on records in the literature [37] and the experience of trial field experimenters (Table 3).

2.3. DSSAT Model Calibration and Validation

Field measurement records (Table 2) and phenological period data (Table 3) were used to calibrate and validate the variety parameters of highland barley in CERES-Barley model with Glue tools in DSSAT v4.7.5 software. Mean Bias Error (MBE) and standardized root mean square error (nRMSE) served as the accuracy metrics for accessing the reliability of the DSSAT model simulations [38]. The formulas are as follows:
M B E = i = 1 n S i M i n
n R M S E = i = 1 n S i M i 2 n × 100 M ¯
where S i is the simulated value, M i is the measured value, M ¯ is the average measured value, and n is the total number of samples.
MBE was used to describe the difference between the simulated results and the measured values, and to evaluate the simulated values above/below the measured values. nRMSE was used to evaluate model errors. The smaller the value was, the more reliable the simulation results were. The values <10%, 10–20%, 20–30%, and >30% represent excellent, good, medium, and poor, respectively.
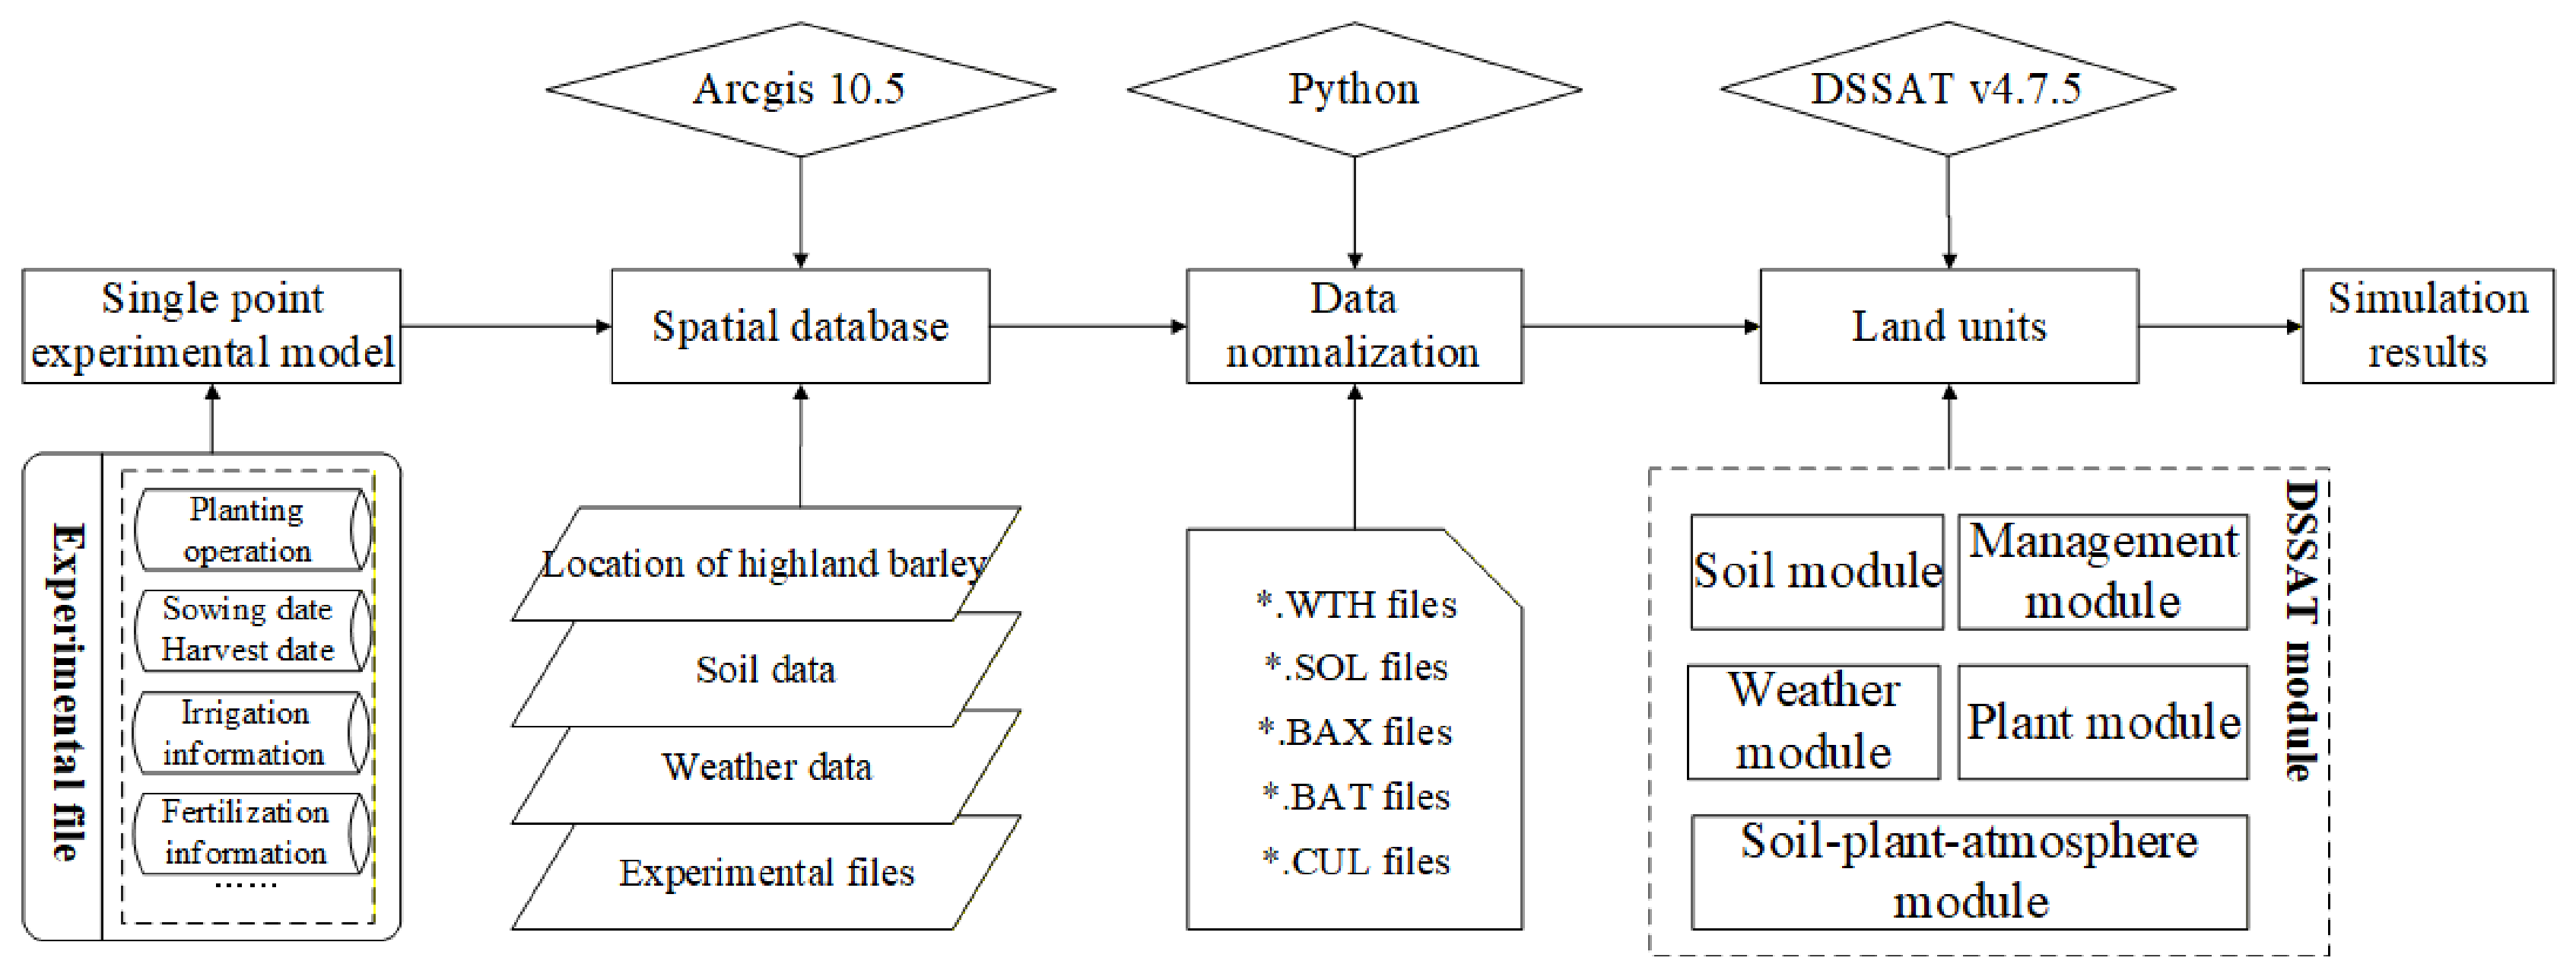
The DSSAT model v4.7.5 software uses a human–computer interaction interface to run single-site files. For multi-point files at a spatial grid scale in this study, the Arcgis 10.5 software was coupled to expand to a spatial simulation. The specific steps were divided into three steps. First, we established a single-point experiment file (FileX) through a human–computer interaction interface in DSSAT v4.7.5 software, which was used to record crop management information, select crop varieties, and set simulation requirements in advance. Second, we established a spatial input database processed by Arcgis 10.5 software with geographical coding identification based on the planting location of highland barley, including weather files (*. WHT), soil files (*. SOL), and highland barley experiment files (*. BLX). The irrigation, fertilization, cordyceps measures, and other management information in experiment files for highland barley planting were spatially consistent, as shown in Table 1, but the sowing times were not consistent. According to a survey based on 3 sampling points (Figure 1), the sowing dates of highland barley in the DSSAT v4.7.5 software were set as 4.1, 4.15, 4.30, and 5.10, corresponding to altitudes of <3500 m, 3500–3900 m, 3900–4500 m, and >4500 m. Altitude data were obtained from the Shuttle Radar Topography Mission (SRTM) global 1 arc-second (30 m) digital elevation model (DEM), provided by NASA and the National Geospatial-Intelligence Agency (NGA). Third, combining with Python 3.8 language, we inputted the data from the second step into the DSSAT v4.7.5 software site by site. During the model operation, the initial simulation time was set earlier than the planting time of highland barley. In addition, the water and nutrient modules were turned off during the yield potential simulation process to ensure that the growth was not affected by external environmental stress. Finally, we obtained the yield data from the model results in units of kg/ha. The spatial simulation process for highland barley is shown in detail in Figure 2.

2.4. Trend and Change Rate Analysis

In this study, slope analysis was used to explore the spatial and temporal trends and change rate of highland barley yield potential [39].
θ s l o p e = n i = 1 n i × C i i = 1 n i i = 1 n C i n × i = 1 n i 2 i = 1 n i 2
where θ s l o p e is the slope of the regression trend, and if θ > 0, it means that each dimension index tends to increase during the study period, and the opposite tends to decrease; n is the total number of years; and C i is the yield potential of highland barley in year i . In addition, the Mann–Kendall (MK) test was also used for comparative analysis, a commonly adopt methods to access the significance of trends within time-series data.
Let the time-series data be x 1 , x 2 , x 3 ,   ,   x n , and construct an order column for time series x with n sample sizes [40,41]:
r i = + 1 ,       x i > x j 0 ,     x i = x j 1 ,     x i < x j           j = ( 1 ,   2 ,   3 ,   4 ,   ,   i )
In the case of random independence of the time series, define the statistic:
S = i = j + 1 n j = 1 n 1 r i
Calculate the variance of the statistic, S:
V a r S = n n 1 2 n + 5 j = 1 p ( t j 1 ) ( 2 t j + 5 ) 18
After normalization of the statistic, S, the new statistic is defined as Z:
Z = s 1 V a r ( S ) ,   S > 0 0 ,                 S = 0 S + 1 V a r ( S ) ,   S < 0
where x i and x j are the i-th and j-th observations ( i > j ) ; S stands for upward (downward) trend; and t j represents the number of phase equivalents of observations.
Bidirectional detection was performed on the observed values, and the MK test value located in the Z 1 α 2 Z Z 1 α 2 interval was taken as the trend value that did not pass significance level, α, and Z > Z 1 α 2 was taken as the trend value that passed significance level, α. In this paper, 95% was used as the confidence level to evaluate the significance of the trend, and the corresponding statistical test value was Z > 1.96 , indicating that the climate tendency rate passes the significance test with 95% confidence [42].

2.5. Correlation Analysis

In this study, partial correlation and multiple linear regression were adopted to analyze the relationship between yield potential and climate data in the YZTT area. Partial correlation analysis is a statistical method used to determine the net correlation between two variables by controlling for the effects of other variables. The formula is calculated as follows [43]:
r x y · z w = r x y · z r x w · z r y w · z ( 1 r x w · z 2 ) ( 1 r y w · z 2 )
where r x y · z is the bias correlation coefficient between x and y when z is held constant; r x w · z is the bias correlation coefficient between x and w when z is held constant; r y w · z is the bias correlation coefficient between y and w when z is held constant; r x y · z w is the bias correlation coefficient between x and y when z and w are held constant; and a larger r x y · z w coefficient indicates a stronger correlation between x and y.
Multiple linear regression is a statistical method to express the response of highland barley yield potential to climate factors. The formula for multiple linear regression is as follows [44]:
x = a + b 1 y + b 2 z + b 3 w + c
where x represents the highland barley yield potential; y, z, and w are the average daily maximum temperature, average daily minimum temperature, and total solar radiation during the reproductive period, respectively; and b1, b2, and b3 are the regression coefficients between highland barley yield potential and each climate factor.

3. Results

3.1. Model Calibration and Validation

The genetic parameters for the highland barley cultivar ZangQing 2000 were calibrated within the CERES-Barley model framework. The details of variety parameter types, value ranges, initial values, and the calibrated parameters are summarized in Table 4. The simulated and measured values are shown in Table 5. According to accuracy metrics, the results showed a negative MBE (simulated yield lower than measured) and an nRMSE of 17.49%, corresponding to a good simulation accuracy.

3.2. Spatiotemporal Distribution of Highland Barley Yield Potential

3.2.1. Spatial Distribution of Highland Barley Yield Potential

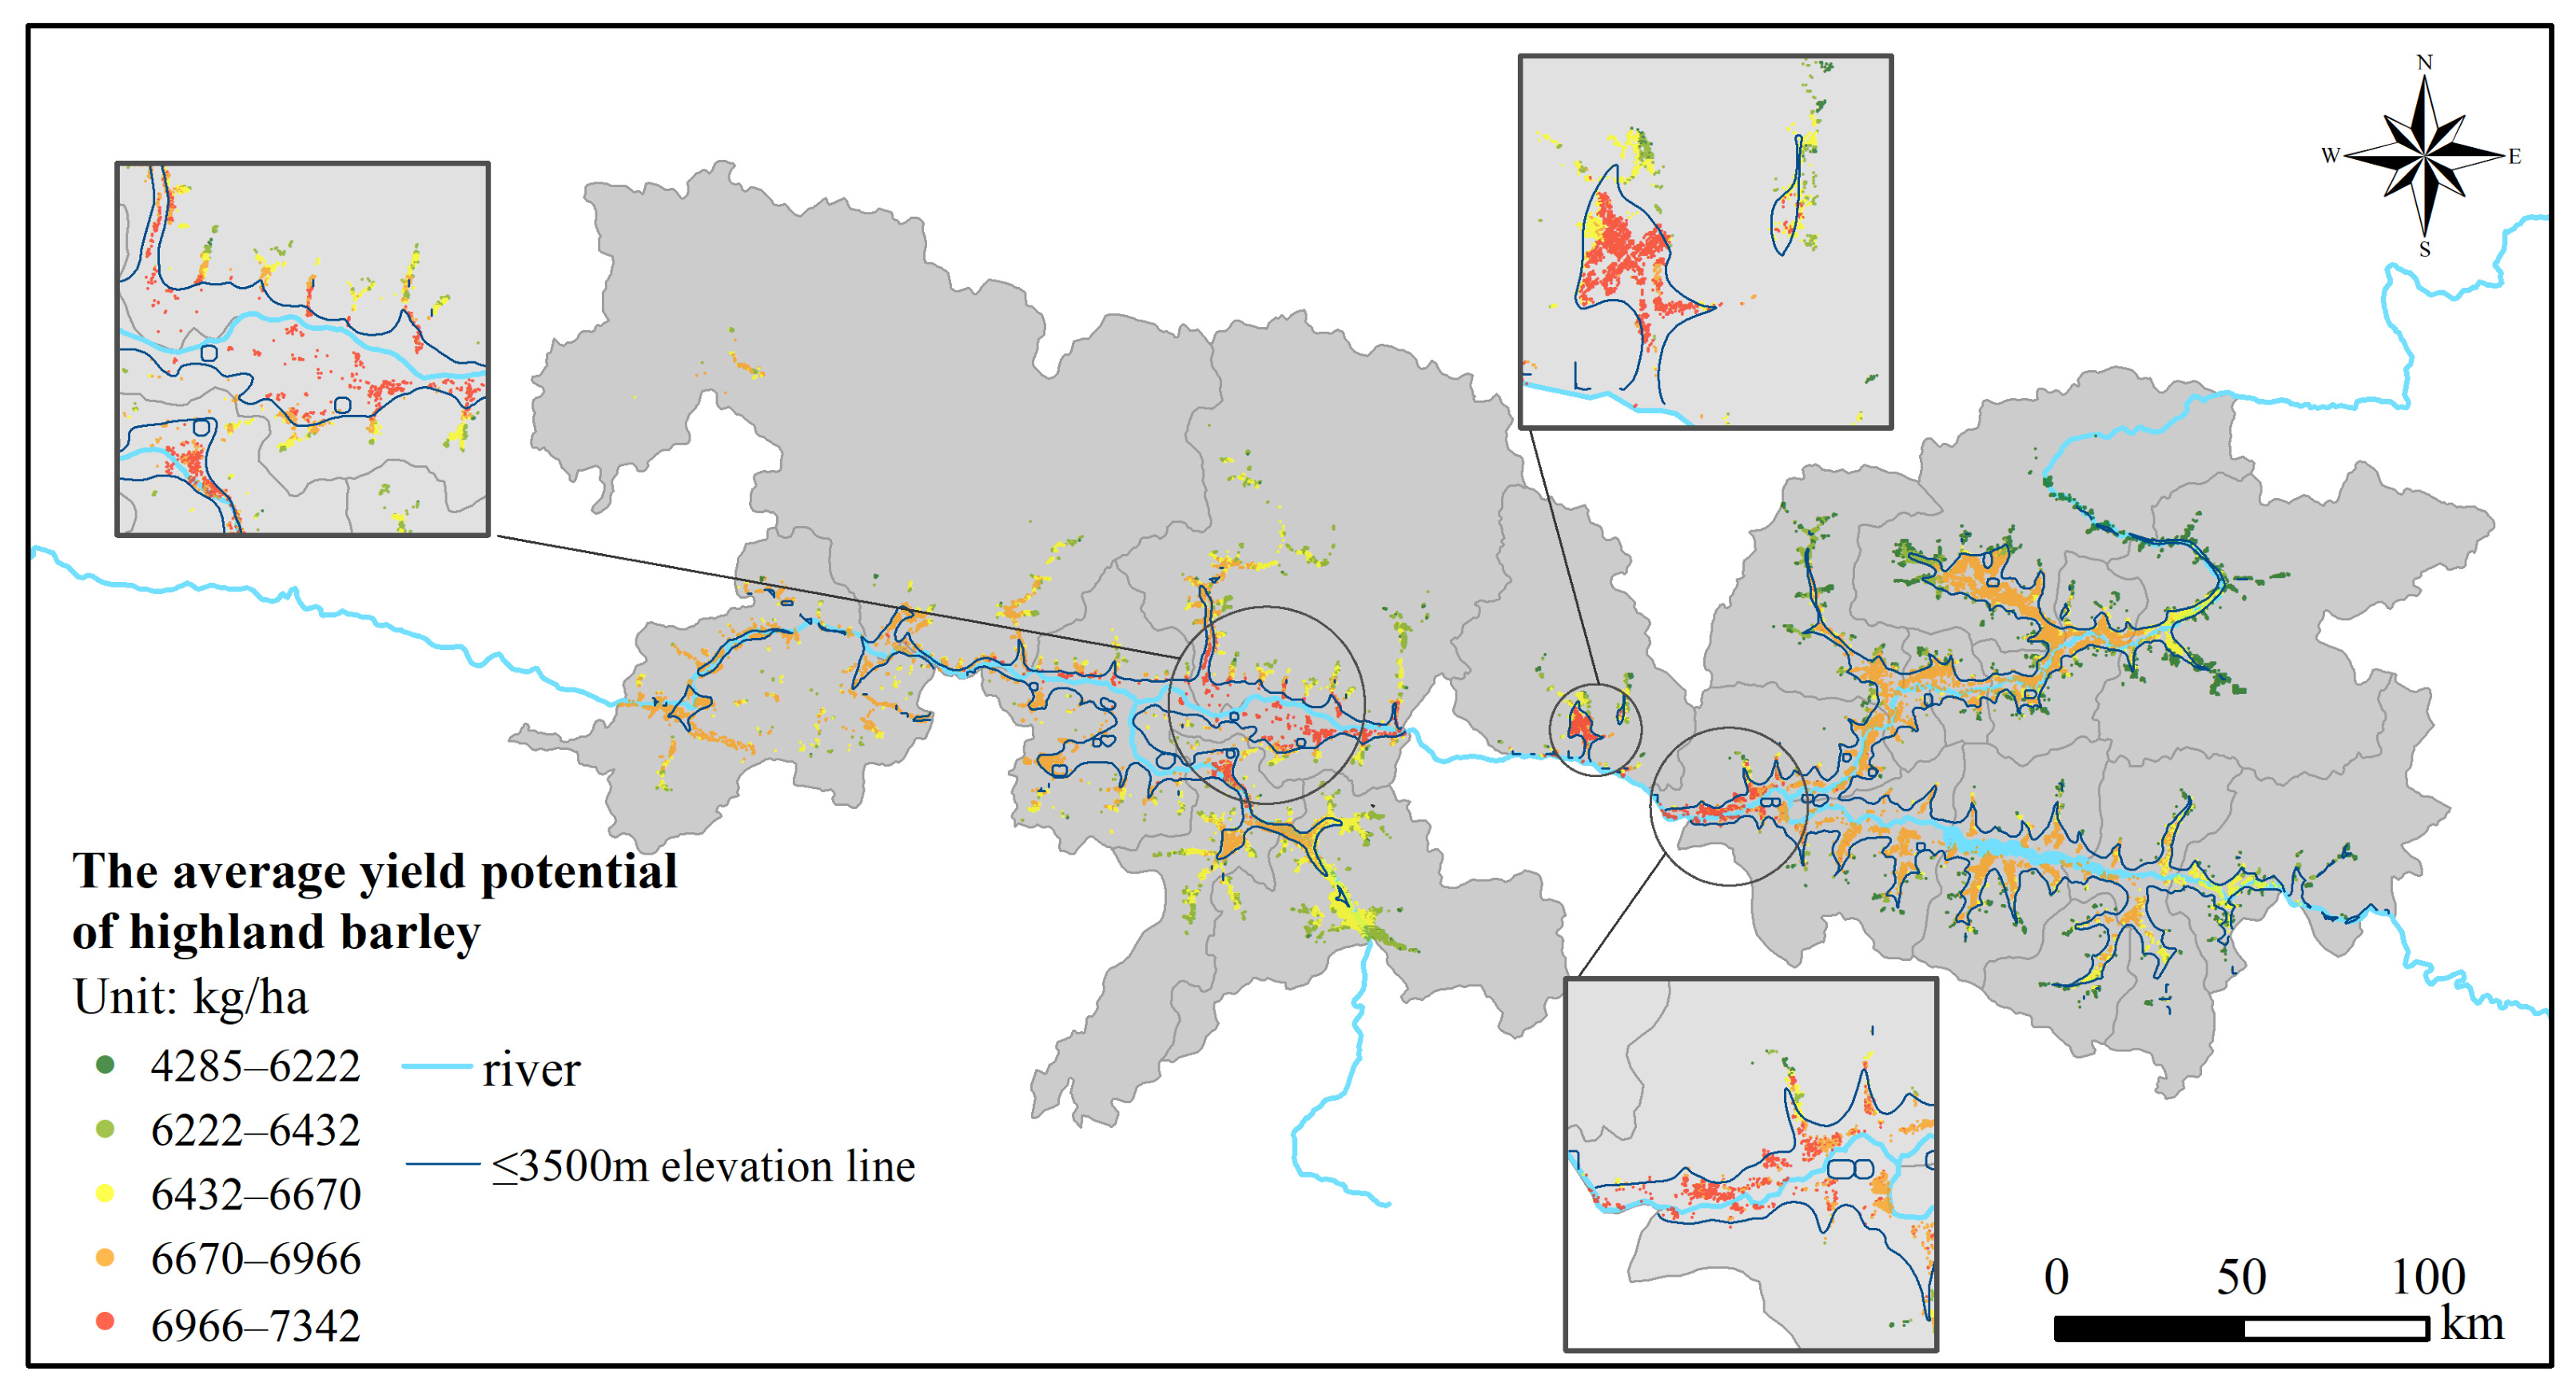
The spatial distribution of average highland barley yield potential in the YZTT area from 1981 to 2020 is shown in Figure 3. During 1981–2020, the average value of highland barley yield potential was between 4284.75 and 7341.15 kg/ha. In terms of spatial distribution, the higher-level area was located in the valley area (i.e., the Rikaze-YZR), and the lower-level area was located in the tributary areas of the NR and LR Basins. Moreover, the higher values were primarily located in areas below an altitude of 3500 m. The above indicated that the light and heat conditions in the low-altitude areas of the valley were more suitable for the growth of highland barley.
As reflected by the statistics in Table 6, the average level of highland barley yield potential was 6719.87 kg/ha in the YZTT area. Zonal by four basins (the Rikaze-YZR, the Shannan-YZR, NR, and LR), the highest level of highland barley yield potential was 6904.29 kg/ha in the Rikaze-YZR, and the lowest level was 6554.70 kg/ha in the LR basin. In vertical distribution, highland barley yield potential decreased as altitude increased, with an overall difference of −390.17 kg/ha between high- and low-altitude areas (using an altitude of 3500 m as the differentiation between high and low altitude). This was likely due to the decrease in temperature as altitude increased. The maximum difference (−575.51 kg/ha) of highland barley yield potential at altitude was located in the LR basin.

3.2.2. Temporal Variation in Highland Barley Yield Potential

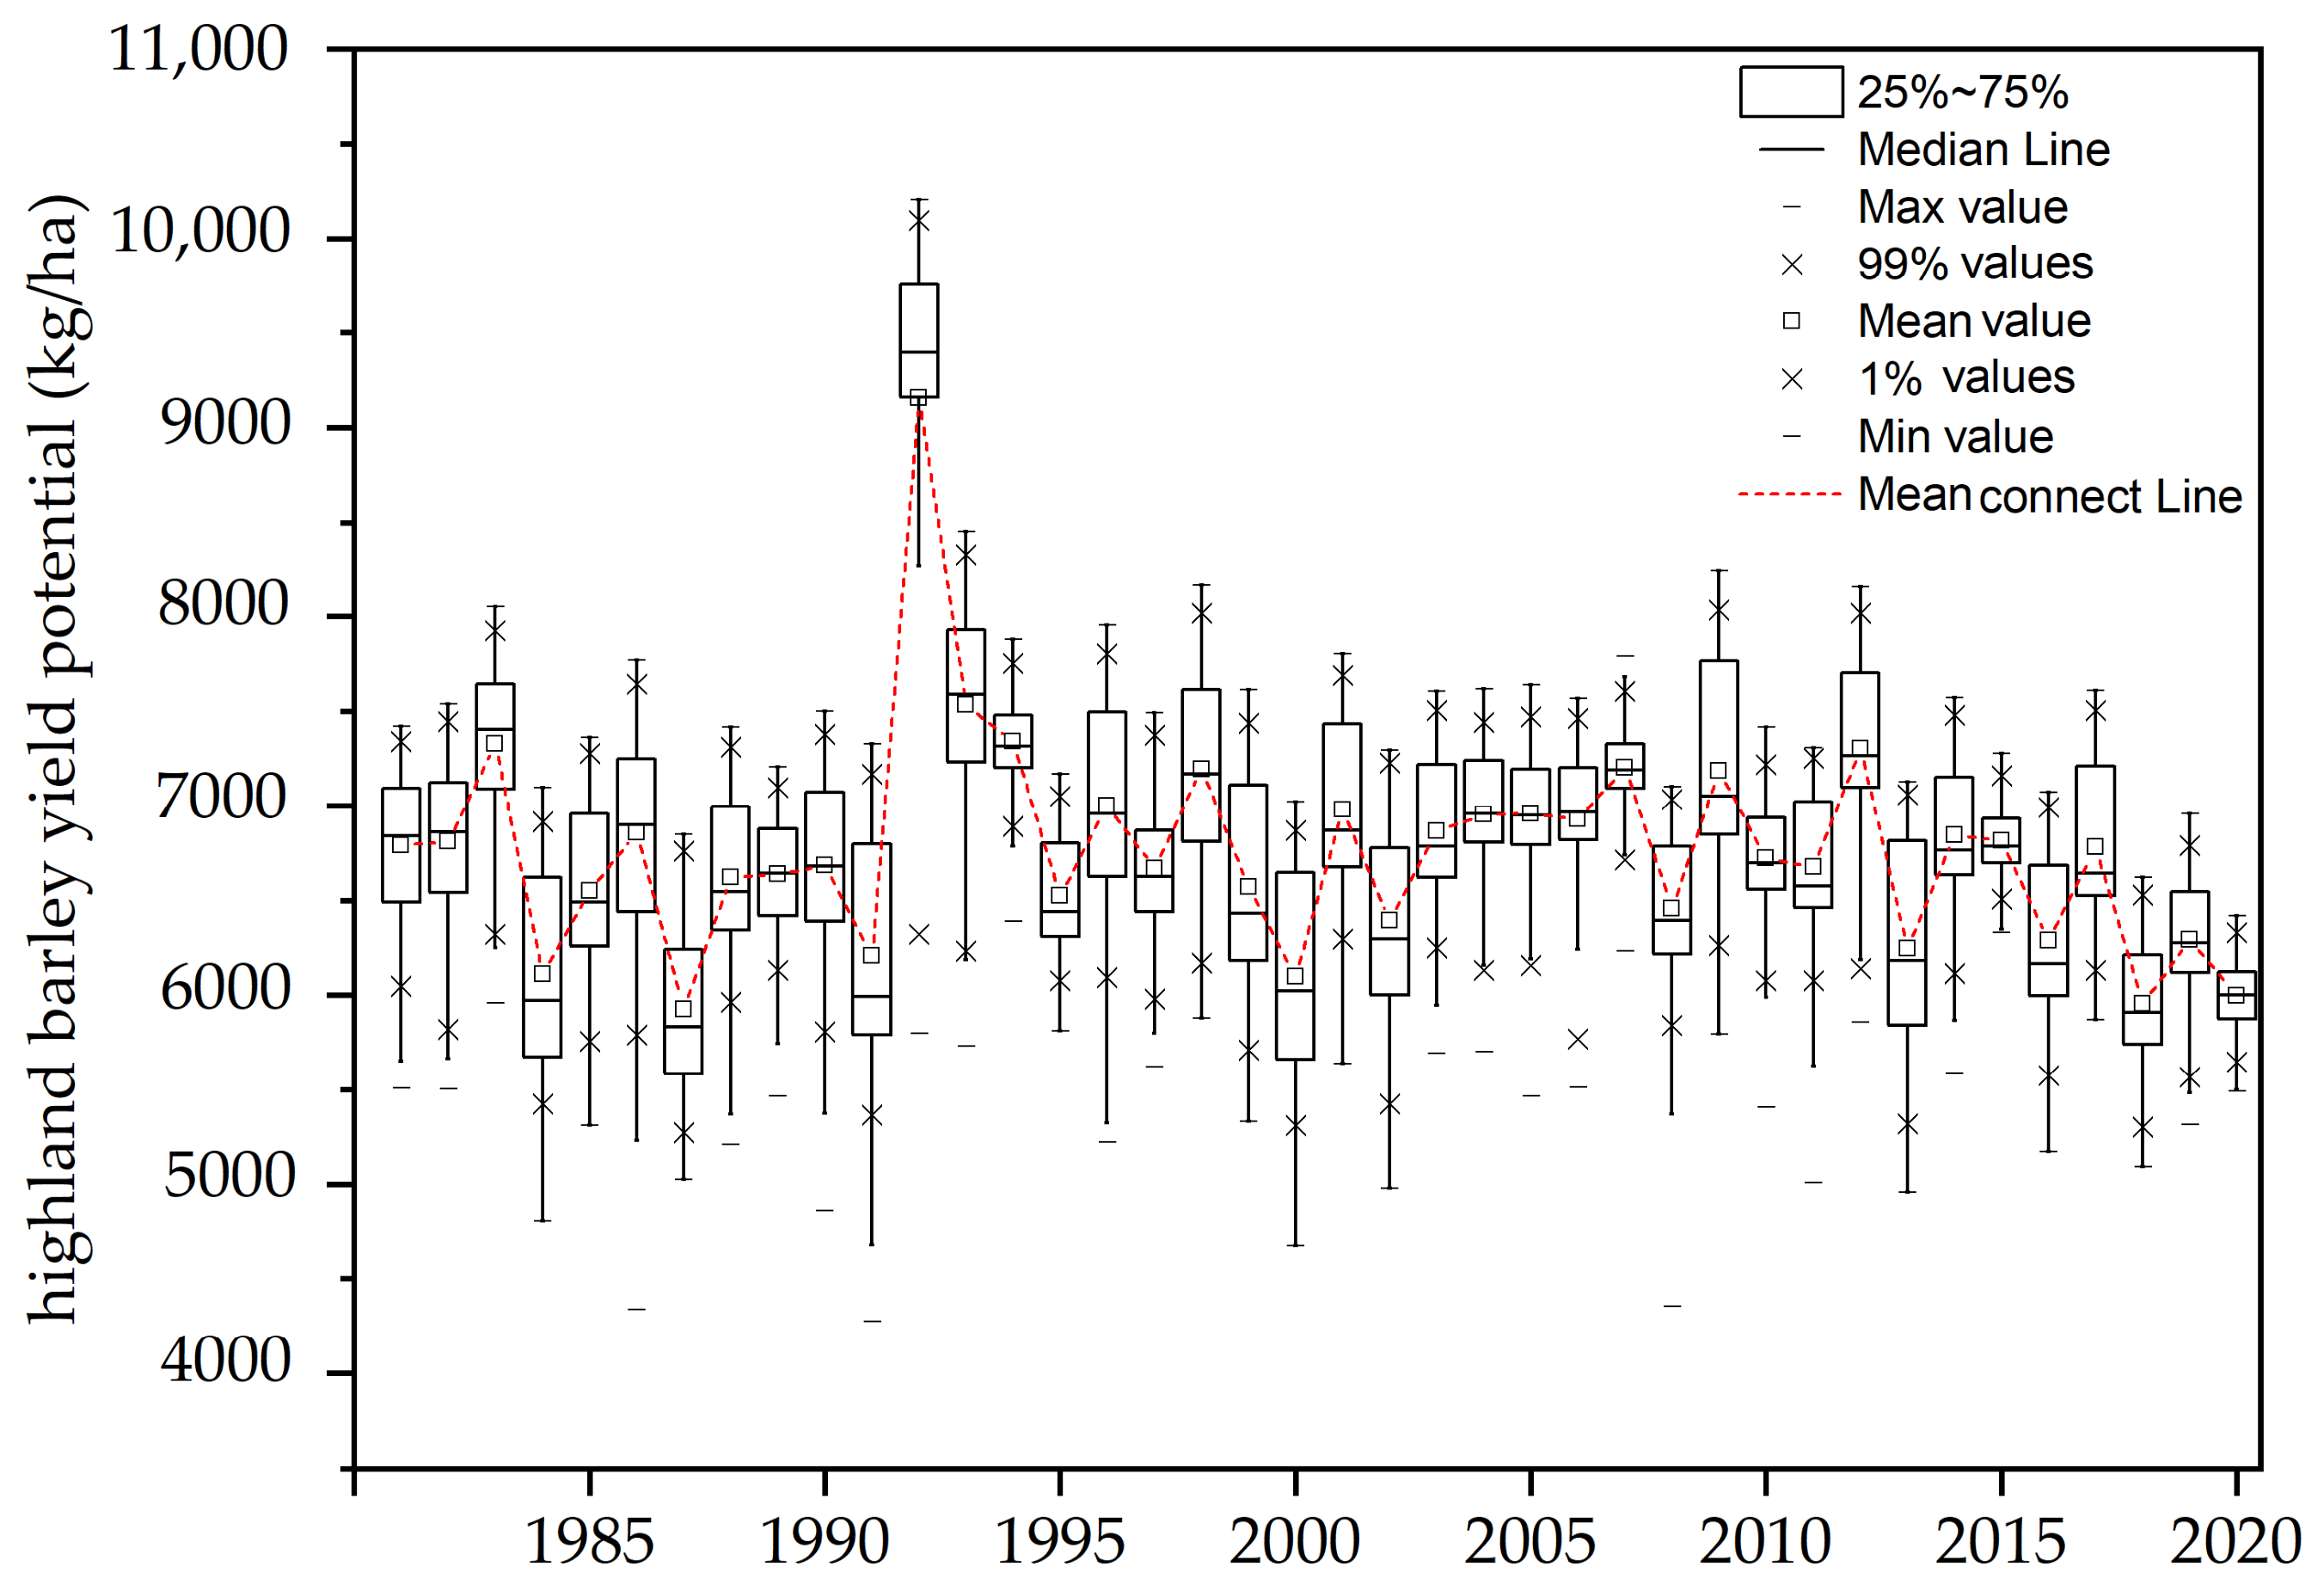
The temporal variation in annual highland barley yield potential fluctuated during 1981–2020 (Figure 4). The highland barley yield potential in grid ranged from 3007.60 to 10,203.00 kg/ha. Over the past 40 years, the median level of annual highland barley yield potential ranged from 5832.00 to 9396.00 kg/ha, with the lowest level in 1987 and the highest level in 1992. Overall, highland barley yield potential presented a downward tendency of −14.49 kg/ha·a over the past 40 years under climate change, as shown in Table 7.
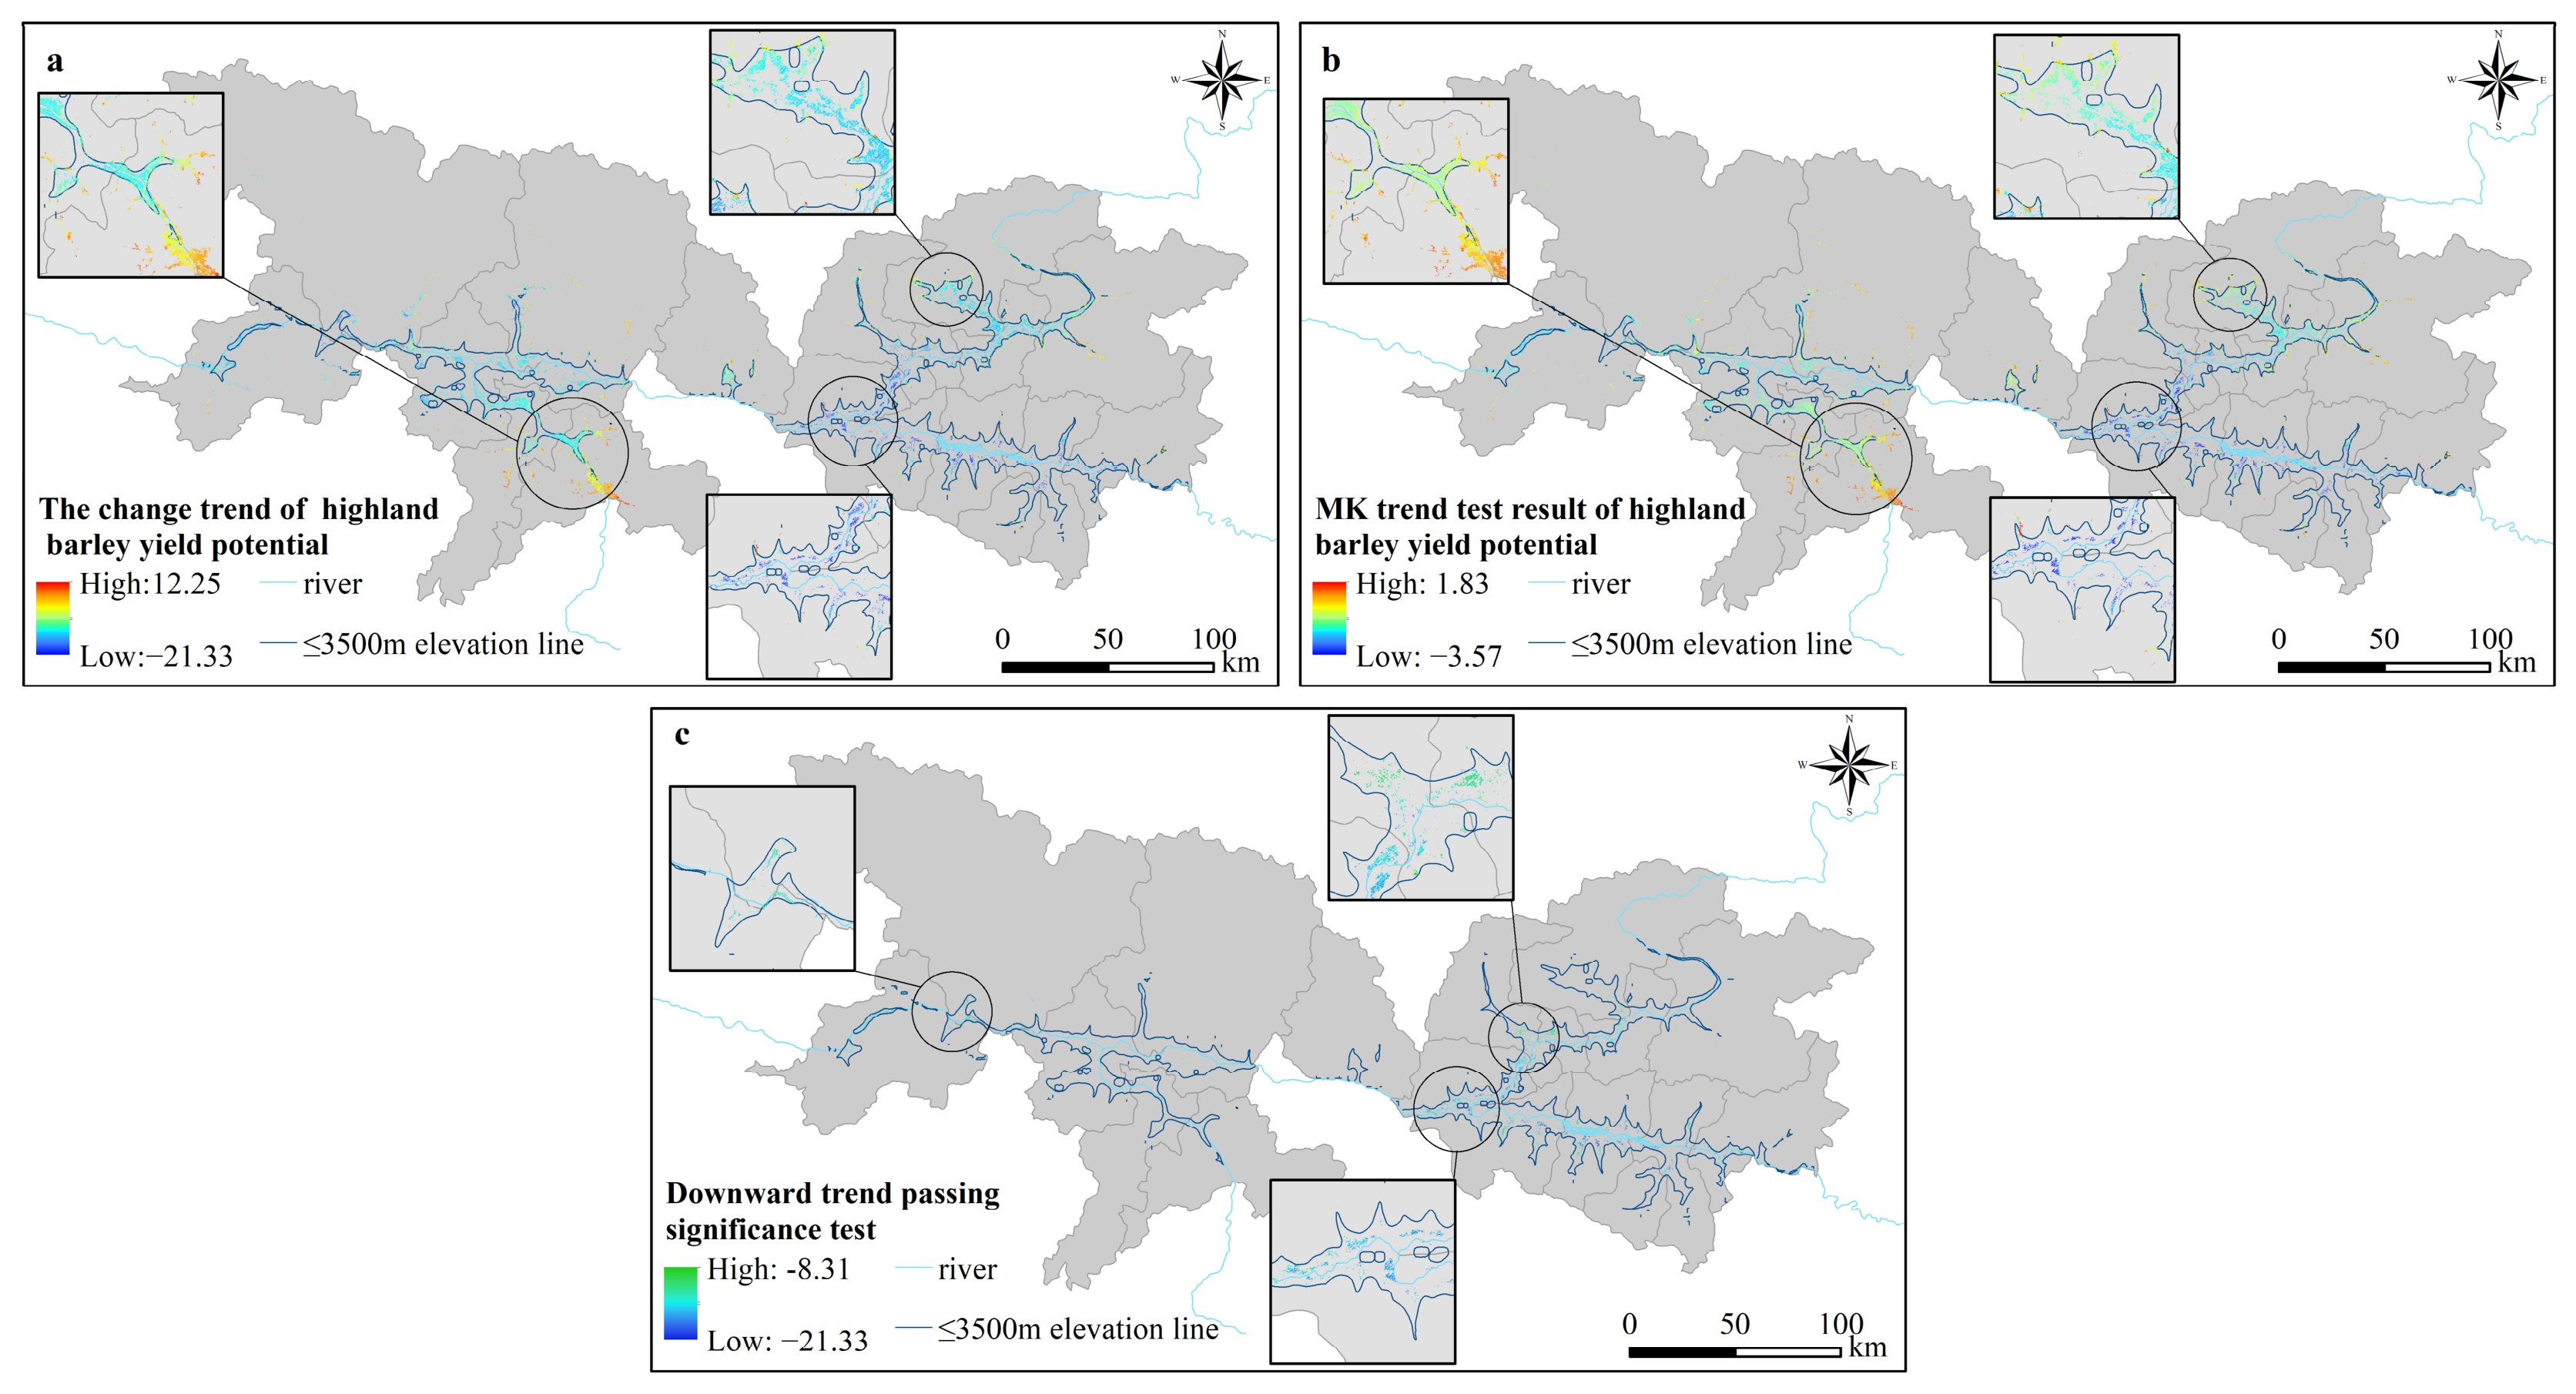
The spatial variation in tendency ranged from −21.33 to −8.31 kg/ha·a in spatial distribution (Figure 5c). An upward trend was observed in the NR basin (Figure 5a). However, the MK trend test indicated that it was not significant (Figure 5b). As shown by the statistics in Table 7, the significant highest decline of highland barley yield potential was −15.32 kg/ha·a in Shannan-YZR, while the decline in the LR basin was relatively the lowest, with an average decline of −12.72 kg/ha·a. In terms of vertical distribution, using altitude of 3500 m as the differentiation between high and low altitude, the decline of the yield potential of highland barley decreased as altitude increased, as shown in Table 4. Specifically, the decline at altitude below 3500 m areas was −14.50 kg/ha·a, while the decline at altitude above 3500 m areas was −13.46 kg/ha·a. The phenomenon of decreasing amplitude with increasing altitude may be attributed to the combined effect of lower temperatures and enhanced solar radiation.

3.3. The Response of Highland Barley Yield Potential to Climate Factors

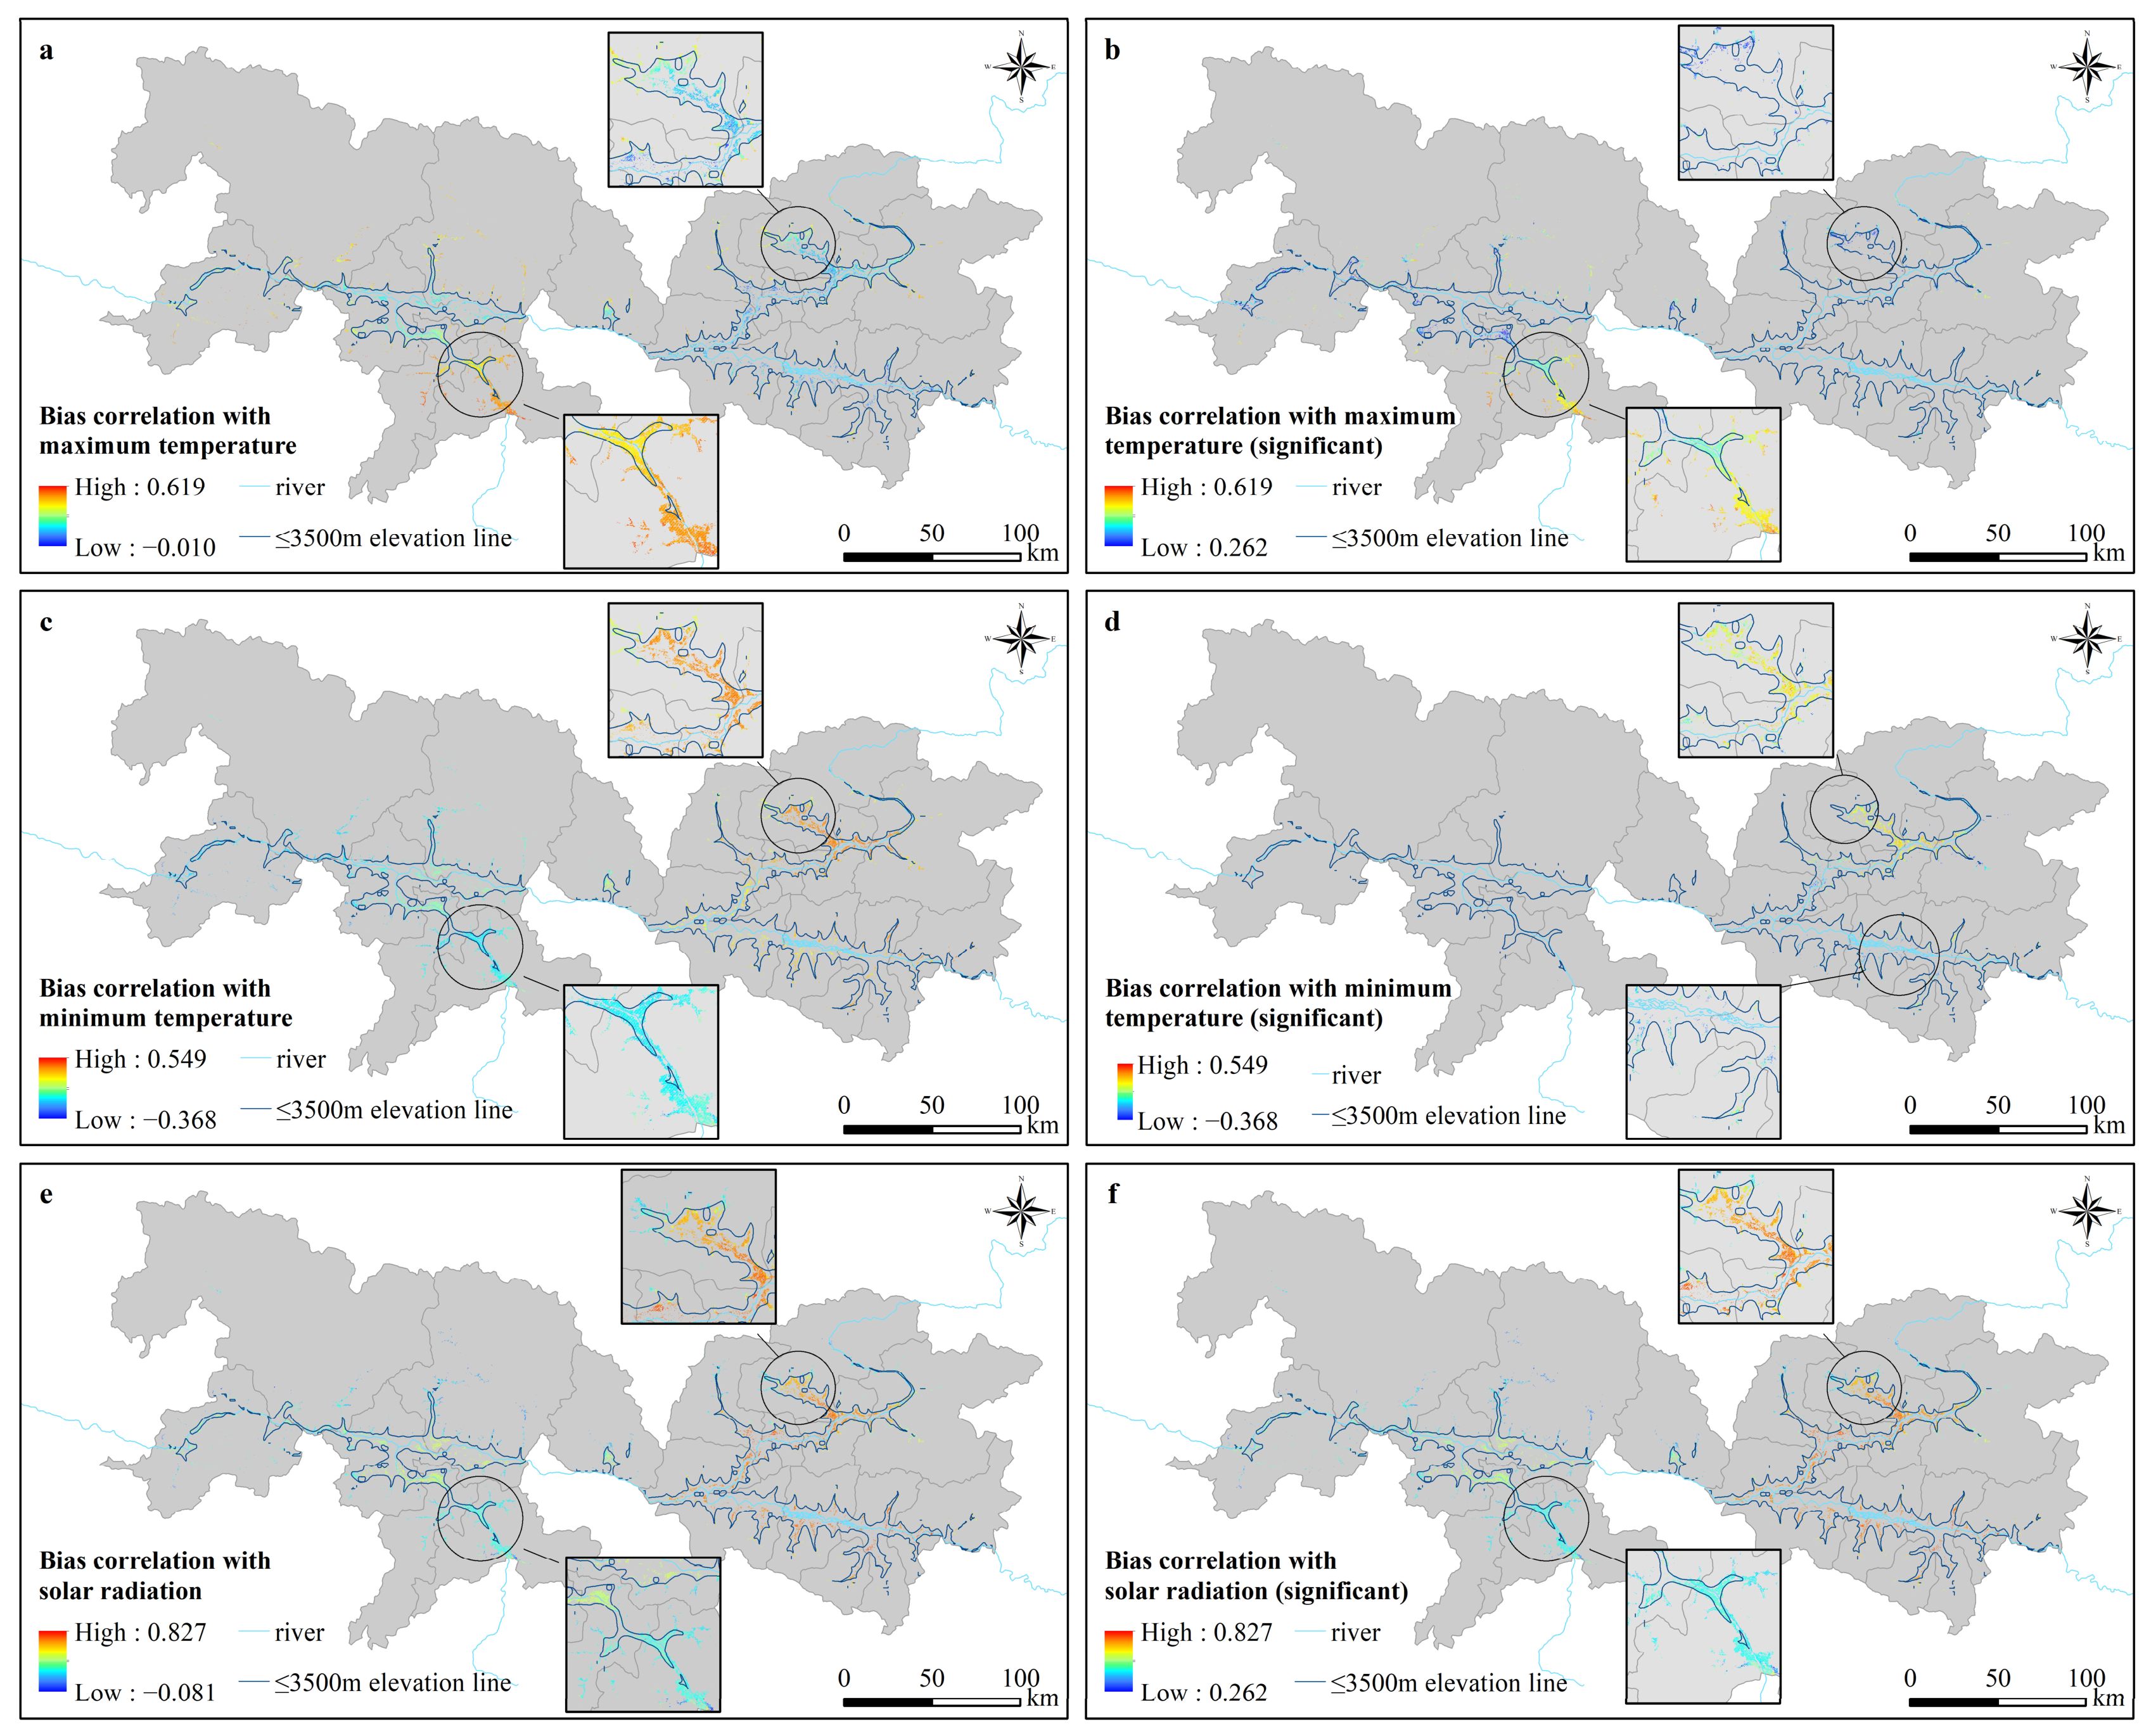
To reveal the mechanism of how climate change affected the highland barley yield potential, the correlationships between highland barley yield potential and maximum temperature, minimum temperature, and solar radiation were calculated (as shown in Figure 6) in the YZTT area. The results showed coexistence of positive and negative effects in spatial distribution. The positive correlationships between highland barley yield potential and the maximum temperature and solar radiation were significant (Figure 6b,f). The positive and negative correlationships with the minimum temperature were both significant, especially in the LR basin (Figure 6d).
As shown in Table 8, the yield potential of highland barley had a strongest correlationship with solar radiation in the YZTT area, with the coefficient being 0.56. The correlation coefficients with the maximum and minimum temperatures were relatively lower, being 0.41 and 0.37, respectively. This indicated that the decline of solar radiation was the primary factor causing a downward tendency in highland barley yield potential over the past 40 years. Zonal by four basins, the bias correlation between highland barley yield potential and solar radiation was still the strongest in each basin, followed by maximum and minimum temperatures.
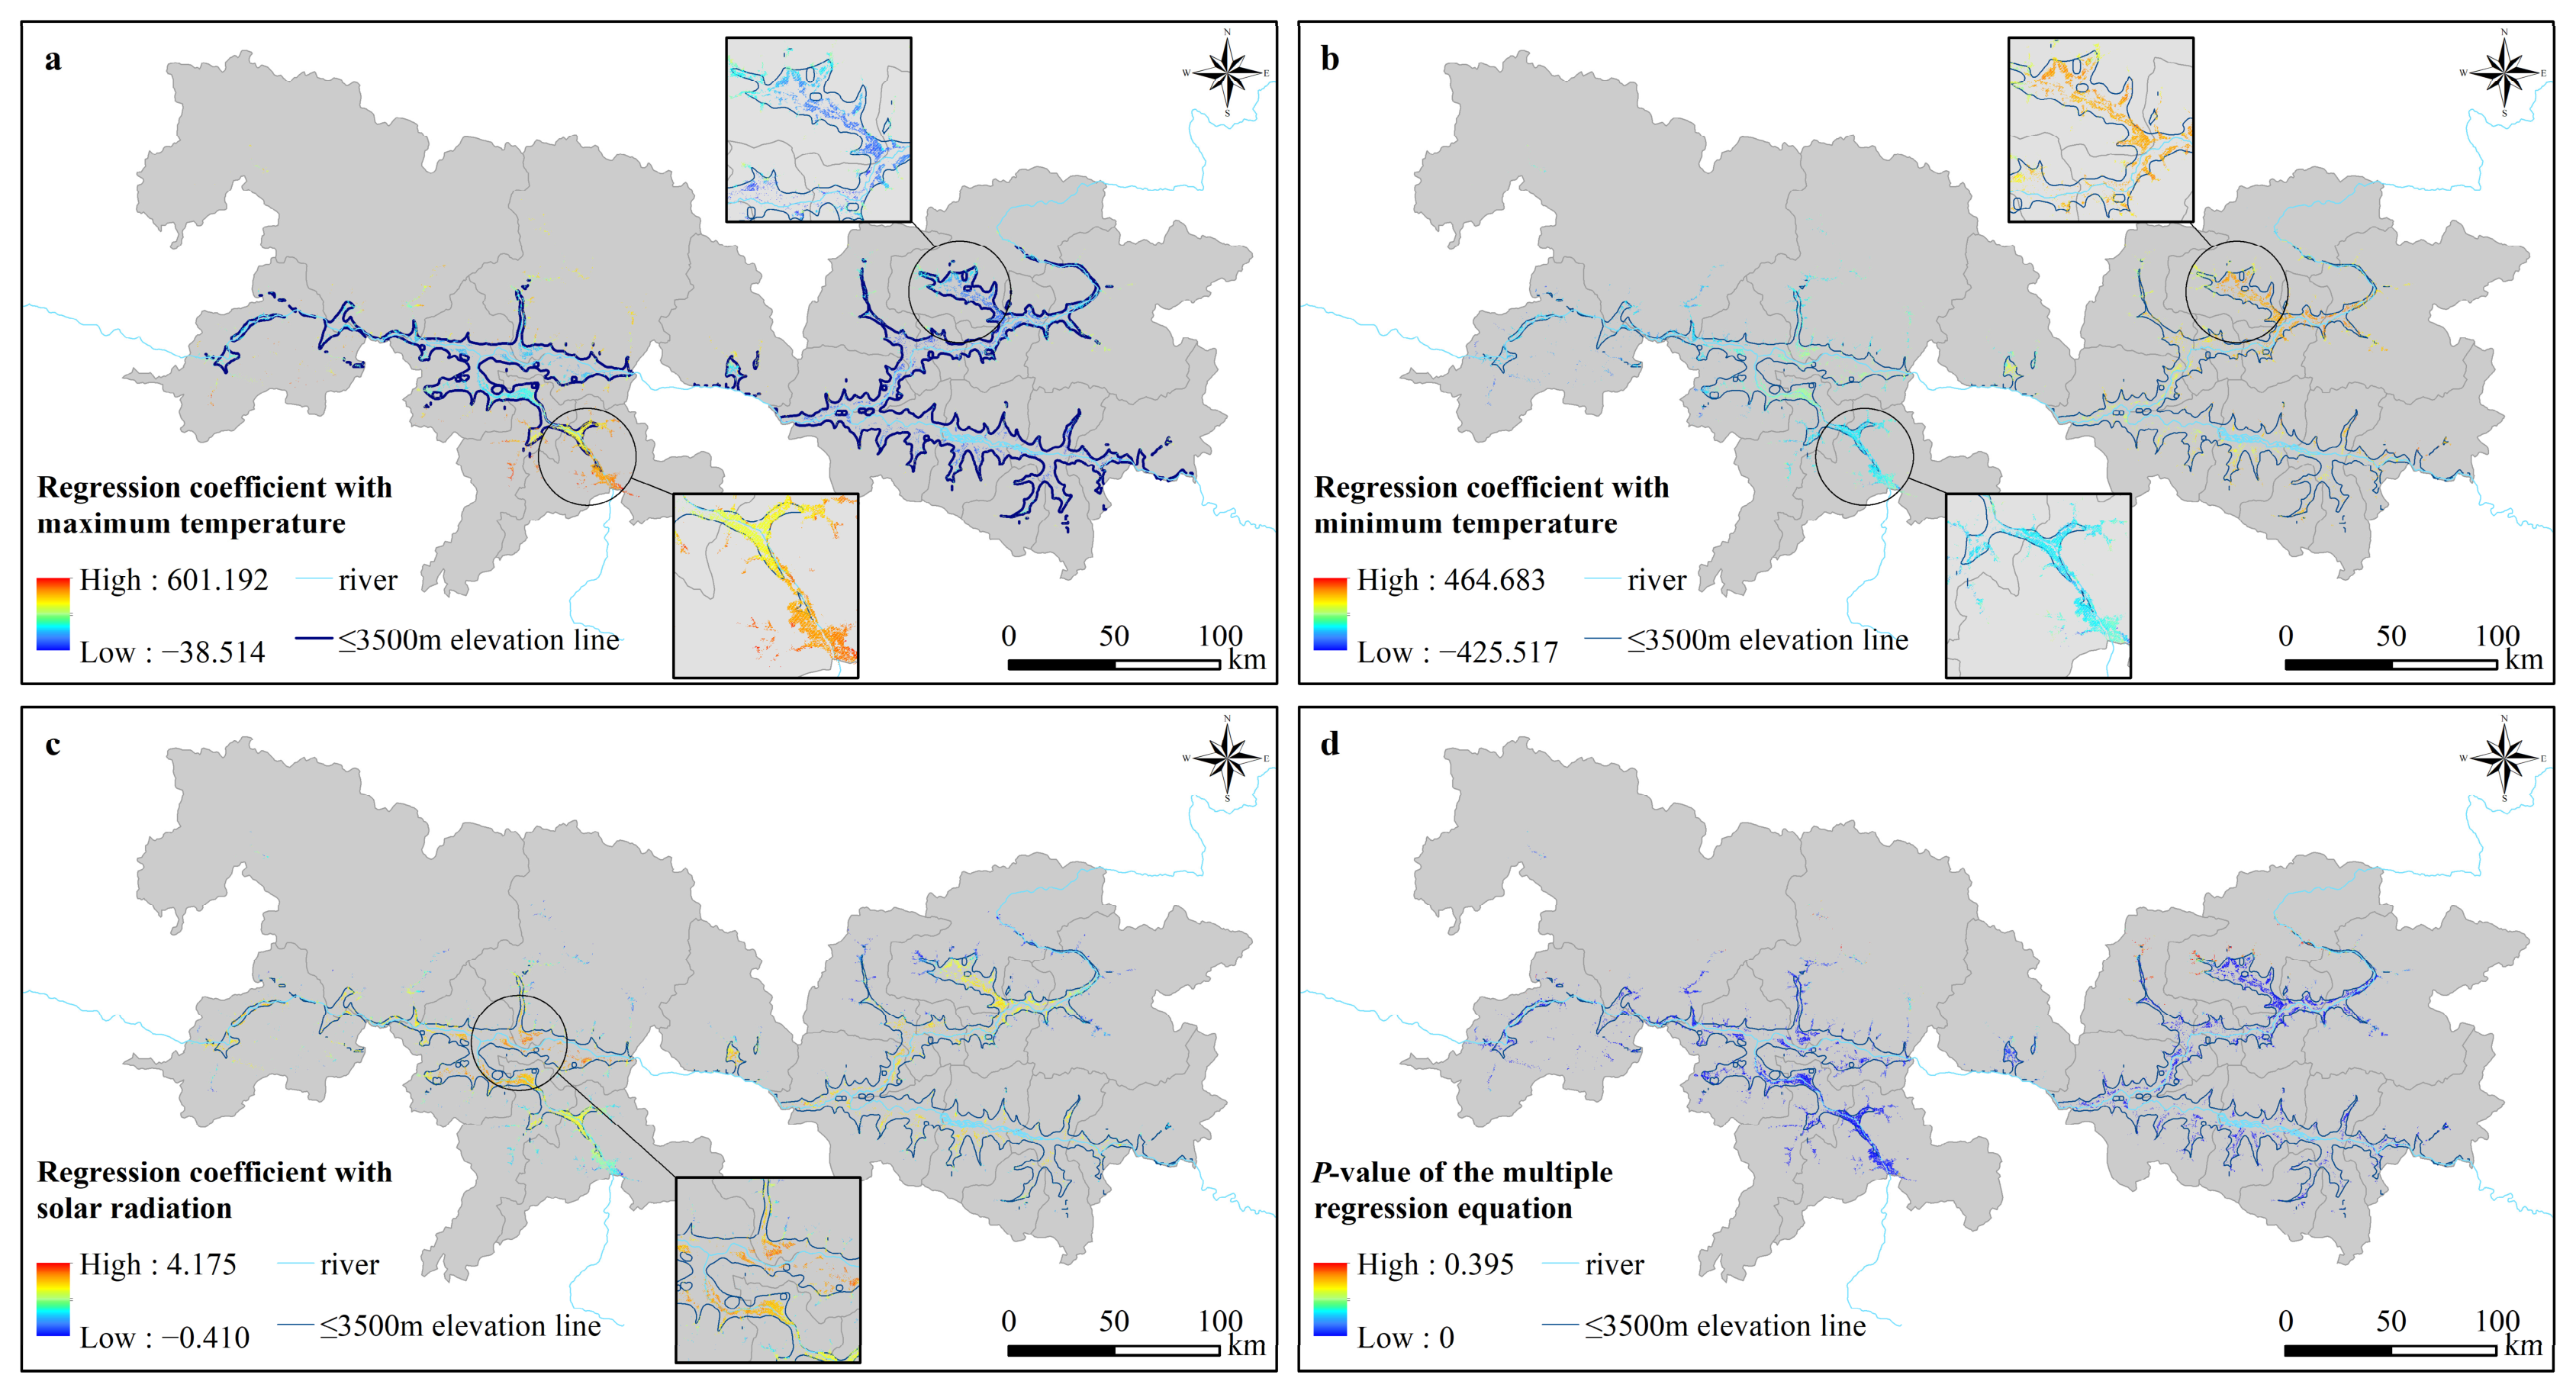
According to the results shown in Figure 7, the responses of highland barley yield potential to climate change differed greatly. For the maximum temperature (Figure 7a), the significant and positive responses were mainly located in the NR basin, while the weaker and negative responses were located in the LR basin. For the minimum temperature (Figure 7b), the spatial distribution pattern was opposite. The significant and positive responses were located in the LR basin, while the weaker and negative responses were mainly located in the NR basin. For the solar radiation (Figure 7c), the positive response was mainly located in the Rikaze-YZR.
According to statistical analysis (Table 9), for every 1 °C increase in maximum temperature, the increase in highland barley yield potential ranged from −38.51~601.19 kg/ha. Some areas presented a decrease trend, but the overall highland barley yield potential showed an increase trend with the value being 219.68 kg/ha, and this increase had passed the significance test. For every 1 °C increase in minimum temperature, the increase in highland barley yield potential was in the range of −425.52~464.68 kg/ha, and the average level was 91.40 kg/ha. The response to the minimum temperature in the Rikaze-YZR and the NR basin, located in the western YZTT area, showed a decreasing trend, with the values being −35.73 kg/ha and −28.23 kg/ha, respectively. For solar radiation, the highland barley yield potential was in the range of −0.41~4.18 kg/ha for every 1 MJ/m2 increase, and the overall average level was 2.90 kg/ha in the YZTT area.
In vertical distribution (Table 10), the positive effect of maximum temperature on highland barley yield potential increased with the rise in altitude (160.99 kg/ha at <3500 m, compared with 370.80 kg/ha at >3500 m) in the YZTT area, indicating that an increase in maximum temperature can significantly enhance the highland barley yield potential in higher-altitude areas. For the minimum temperature, the positive effect on highland barley yield potential decreased with the increase in altitude (124.35 kg/ha at <3500 m, compared with 5.95 kg/ha at >3500 m), especially in the Shannan-YZR and the LR basin. In the Rikaze-YZR and the NR basin, the highland barley yield potential exhibited a negative response to an increase in minimum temperature, and the negative effect intensified with altitude increasing. For the solar radiation, the positive effect on highland barley yield potential decreased with the rise in altitude (3.12 kg/ha at <3500 m, compared with 2.33 kg/ha at >3500 m) in the YZTT area.

4. Discussion

4.1. Climate-Induced Growth Process Change and Implications for Highland Barley Yield Potential

The observed decline in the yield potential of highland barley (Section 3.2) can be mechanistically linked to climate-driven changes in its growth process. Crop yield is a function of the accumulation of photosynthetic products, and the duration of the key growth period is a critical determinant of yield [45].
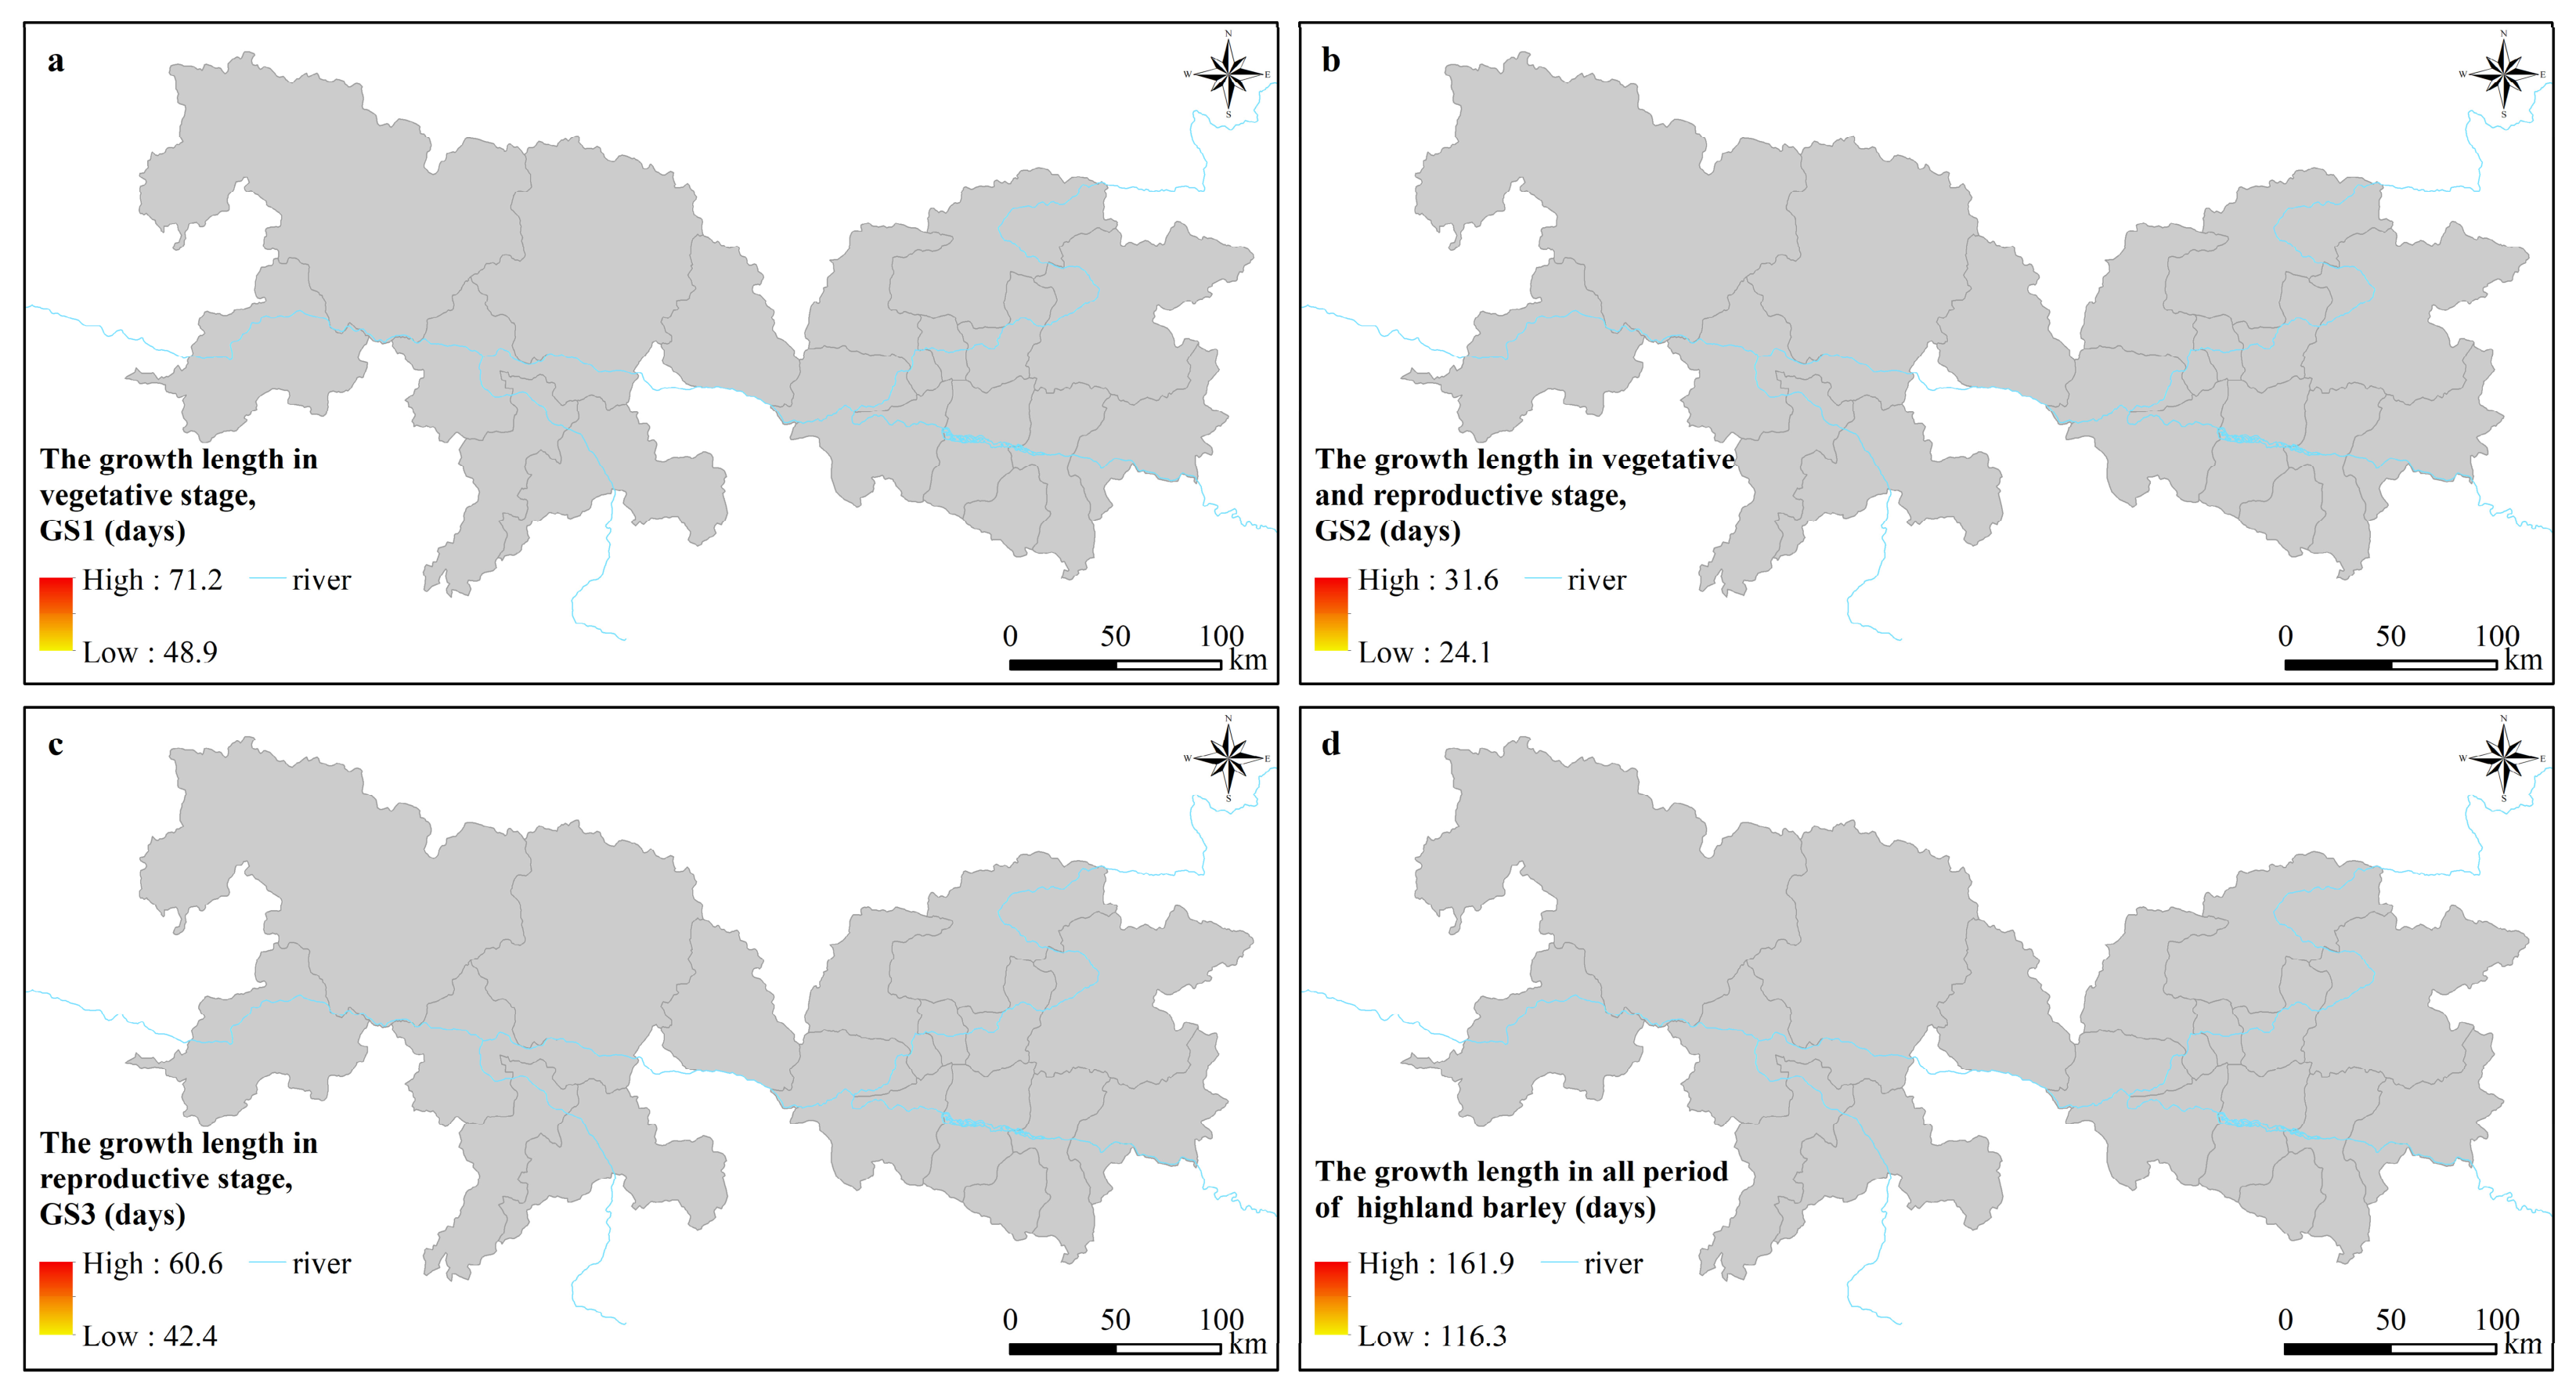
The growth period of highland barley, derived from the DSSAT model, was revealed by spatial patterns. As shown in Figure 8d, the total growth period ranged from 116.3 to 161.9 days, with shorter growth days in valley areas and longer growth days in the high-altitude tributary basins (NR basin and LR basin). This reflected that highland barley had a longer growth period in areas with lower temperatures. Combined with the spatial distribution of yield potential of highland barley (Figure 3), it can be seen that areas with shorter growth periods of highland barley have higher production potential. This may be due to the suitable temperature in the river valley area, which resulted in shorter maturation time and better yield potential of highland barley.
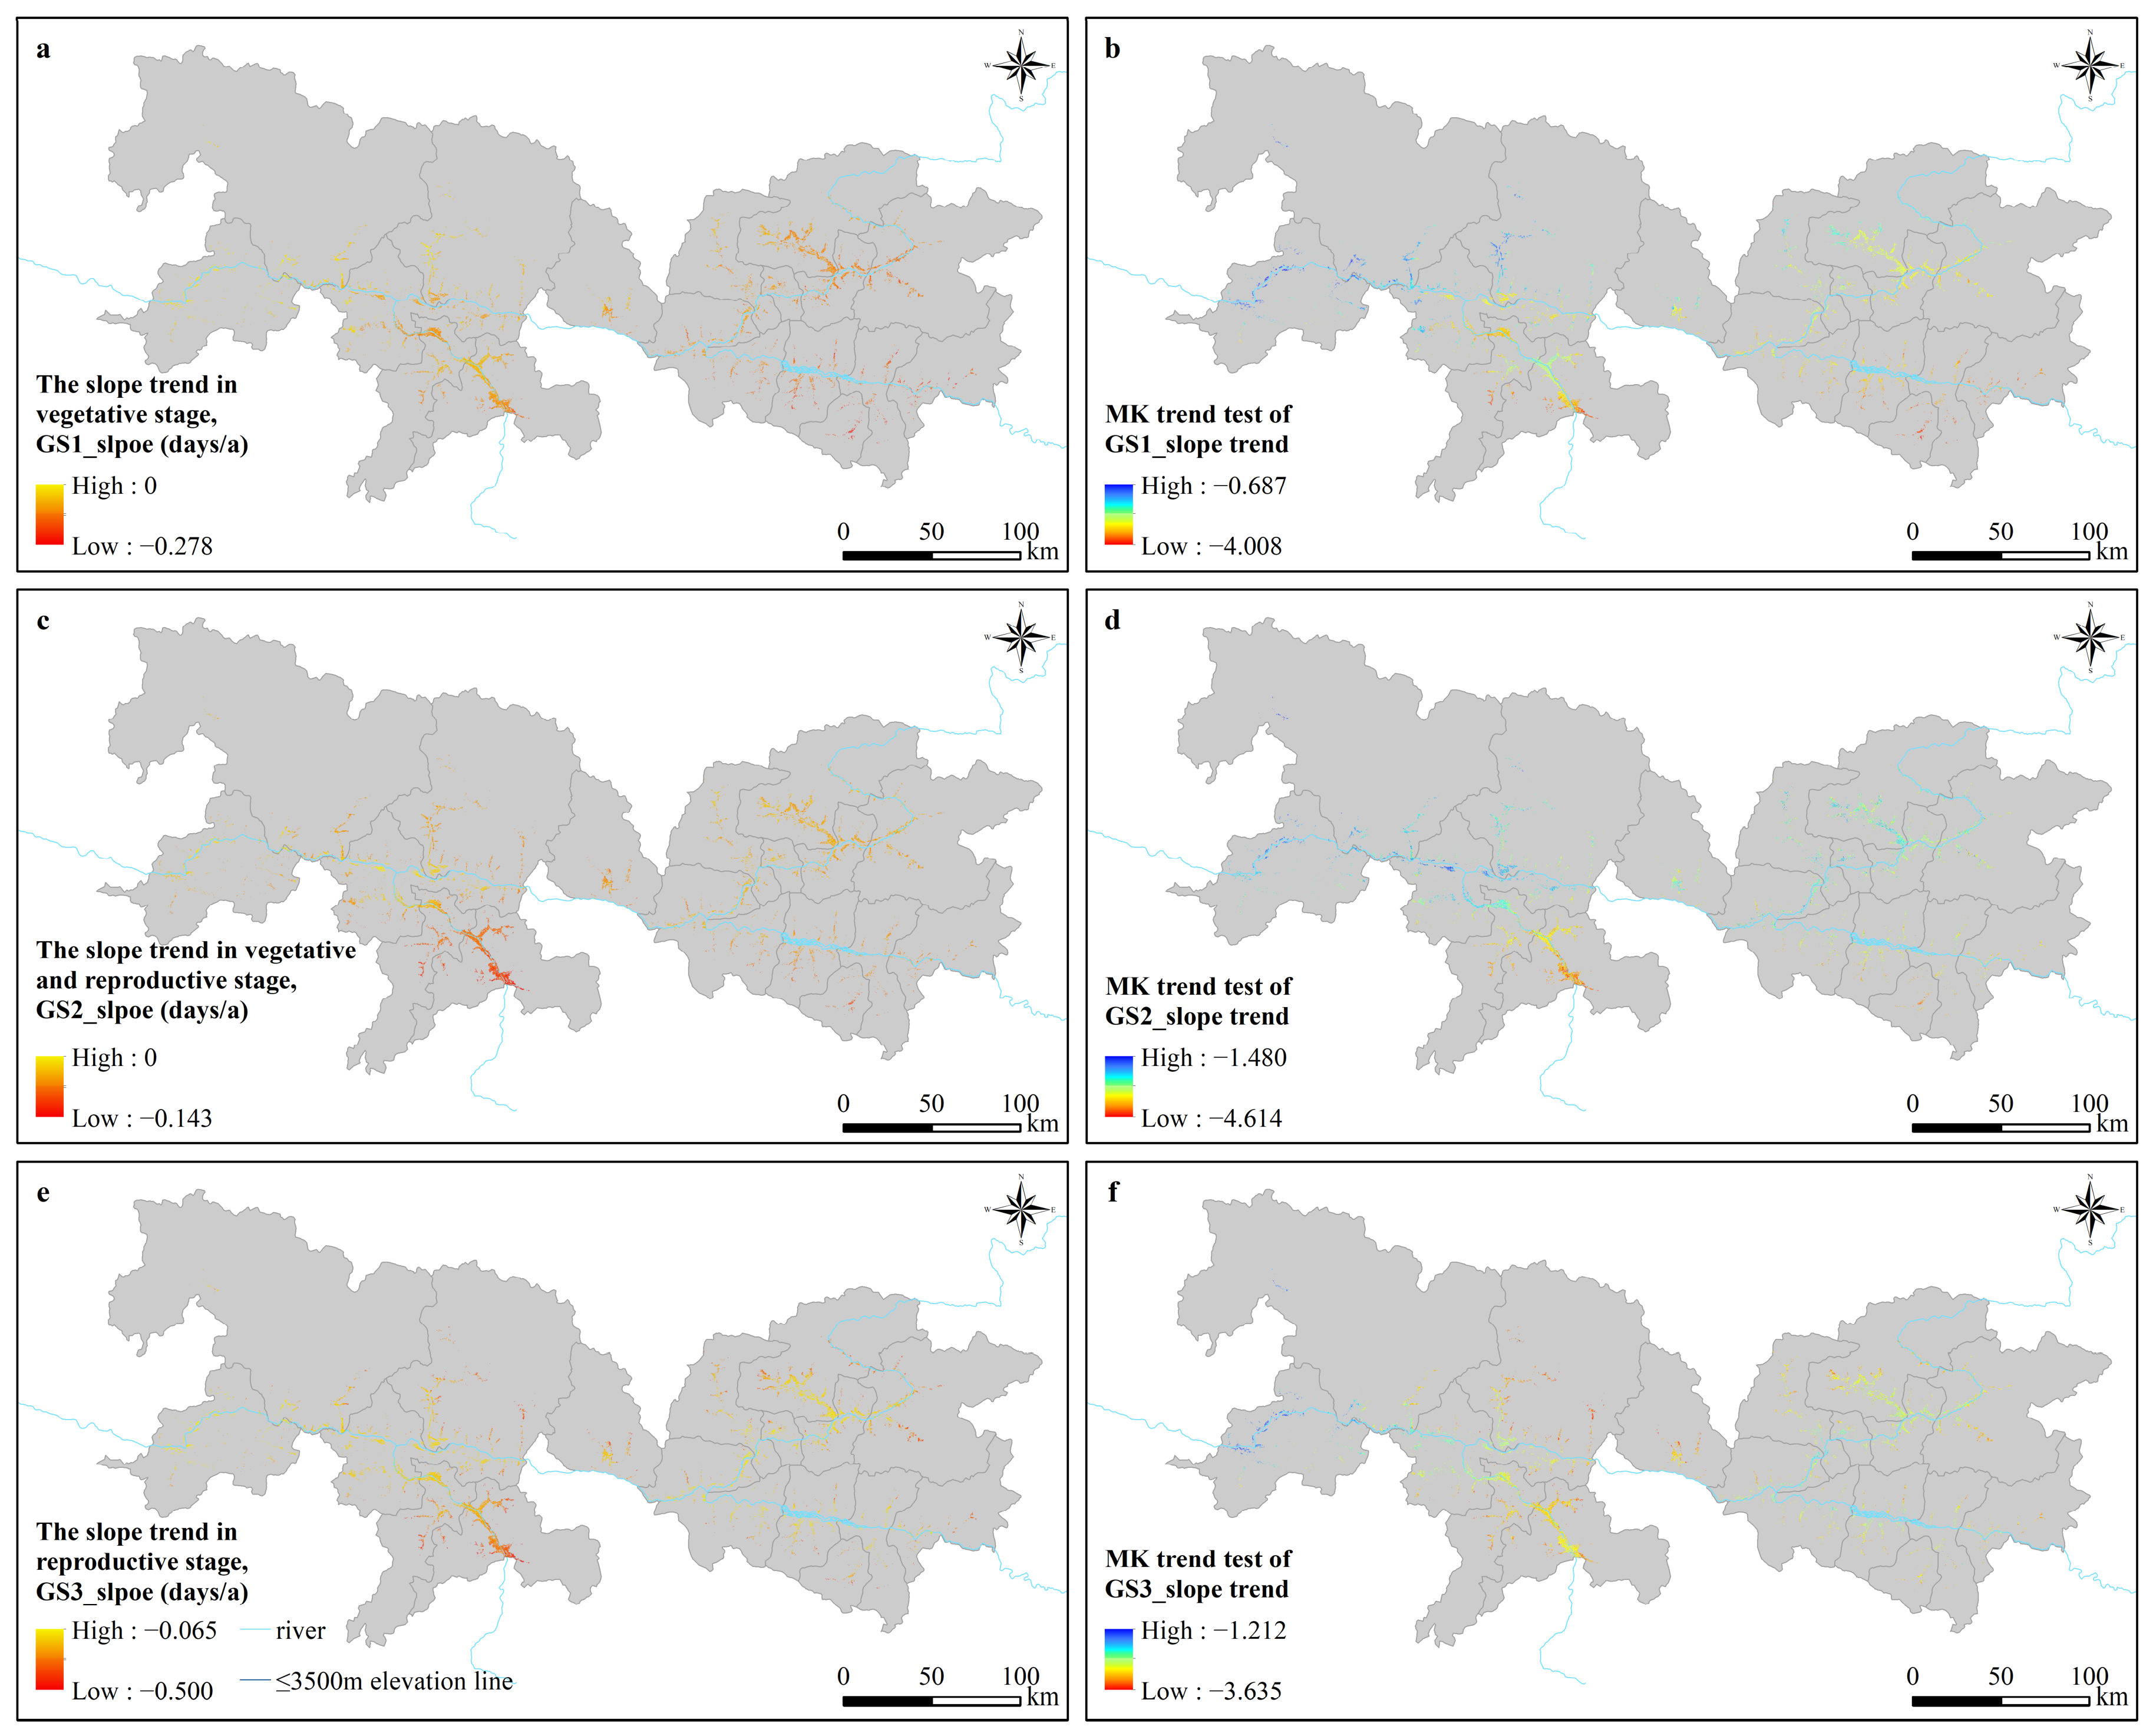
More critically, under climate warming, a significant decrease in the growth period had occurred in the YZTT area over the past 40 years (Figure 9). This shortening was evident across all three growth stages—vegetative (GS1), vegetative–reproductive (GS2), and reproductive (GS3)—with the most pronounced reduction in the vegetative stage (GS3). This phenomenon is a well-documented response of growth stage to increased temperatures. Moreover, combined with Figure 3, the spatial distribution patterns of the growth period in GS2 and GS3 were similar to that of highland barley yield potential. This suggested that photothermal conditions in the GS2 and GS3 stages played a key role in sustaining the yield potential of highland barley.

4.2. The Analysis of Climate Warming on Highland Barley Yield Potential

Under the background of global warming, the rising maximum temperature exerted a positive effect on the yield potential of highland barley in the YZTT area (Table 9). However, from the spatial distribution in Figure 7a, some areas in the Shannan-YZR and the LR basin presented a slightly negative effect on highland barley yield potential with the maximum temperature increasing. That indicated that the maximum temperature in some areas had reached or exceeded the suitable temperature required for highland barley, and a further increase in maximum temperature will reduce the highland barley yield potential. The reason for this could be that the maximum temperature negatively impacts the production by shortening the crop growth period and affecting the dry matter accumulation rate [46,47]. According to our study on the growth period of highland barley, climate change has indeed reduced the growth days at three stages, especially in the GS1 stage, where the reduction days were more prominent (Figure 9).
The increase in minimum temperature took a negative effect on highland barley yield potential in the Rikaze-YZR and the NR basin, located in the western YZTT area (Figure 7b). The elevated minimum temperatures, particularly at night, intensify plant respiration, consuming photosynthate that would reduce the grain filling [48]. More critically, crop phenology in high-altitude regions is exceptionally responsive to temperature changes [49]. A rise in minimum temperature accelerates development rates across growth stages (Figure 9). This is consistent with the phenomenon of yield potential reduction by maximum temperature increasing that is mentioned above [46,47]. To cope with the change in climate warming, sowing early could be an effective approach to reduce the negative effect on highland barley yield potential referring to cereal crops [50]. Nonetheless, the positive effect of minimum temperature increasing on highland barley yield potential occurred in the Shannan-YZR and the LR basin. It could be that the moderate increase in minimum temperature can slow down nighttime respiratory consumption and increase net photosynthetic product accumulation to increase grain weight.

4.3. Analysis of Model Simulation Results

The simulated results of highland barley yield potential in this study were slightly lower compared to the results of the study by Gong et al. [23]. The results calculated by Gong et al. [23] ranged from 5662.44 to 11,338.98 kg/ha at seven research stations in the Tibetan Plateau region. The average highland barley yield potential of our study ranged from 4284.75 to 7341.15 kg/ha in the YZTT area, and the results were the same level as Gong’s results in five research stations but lower than the other two remaining research stations.
The reason for the lower results could be that the crop variety parameters in DSSAT model were calibrated by different agricultural observation data. In Gong’s study, the crop growth status data were sourced from the National Meteorological Information Centre [23], while the data in our study were evaluated from the literature and experience of trial field experimenters. In addition, the cultivars of highland barley in two studies were different, leading to inconsistent yields. The yield data in Gong’s were sourced from statistical yearbooks, and ours’ were recorded by trail field data. Obviously, the yield recorded in the trial field was lower than that in the statistical yearbook. From the above, it is apparent that the different data resources of agricultural observation data, cultivar, and yield used to calibrate the variety parameters in DSSAT model led to different results in the two studies. Next, we will consider the yield potential variability of highland barley based on different data sources and cultivars.
In addition, the DSSAT-CERES-Barley model simulated yields that were slightly lower than the observed field measurements for the calibration period (Table 5). While the model’s typical tendency is to overestimate yield due to the exclusion of biotic stresses (e.g., pests and diseases), the observed underestimation in our study can be explained by the modeled biophysical processes. A critical factor identified is the simulation of the soil water balance on the soil–plant–atmosphere module and its primary output, evapotranspiration (ET). Accurate ET estimation is fundamental for reliable crop yield prediction, as it directly governs plant water use, stress development, and biomass accumulation [51,52]. For instance, Kipkulei et al. [52] demonstrated that minimal deviation of ET between simulated and remotely sensed ET data corresponded to high-fidelity yield predictions, whereas larger ET errors led to poor yield simulation. In the present study, ET was not used as explicit calibration data. It is plausible that the default parameterization of the soil–plant–atmosphere module in DSSAT, while generally applicable, may not fully capture the specific soil hydraulic properties and the unique evaporative demand under the high solar radiation and diurnal temperature range of the YZTT area. This could introduce a systematic bias in simulated water availability during key growth stages, leading to a lower estimate of highland barley yield potential.
Considering the impact of ET errors on yield simulation, our next work will aim to integrate ET data—either from field measurements or validated satellite products (e.g., MOD16A2 and WaPOR)—into the model calibration and validation workflow to improve the accuracy of yield potential simulations for highland barley in this region.

5. Conclusions

In this study, the spatiotemporal distribution of highland barley yield potential was evaluated from 1981 to 2020 by the DSSAT model coupled with GIS technology in the YZTT area, one of the major grain-planting areas in Tibet. The results showed that the highland barley yield potential ranged from 4284.75 to 7341.15 kg/ha during 1981 to 2020, with an average of 6719.87 kg/ha. Under the climate change, the highland barley yield potential presented a downward trend of −14.49 kg/ha·a over the past 40 years in the YZTT area. The decline of solar radiation was the primary factor leading to a downward tendency in highland barley yield potential. In terms of the response of highland barley yield potential to climate change, the highland barley yield potential decreased by 2.90 kg/ha for every 1 MJ/m2 decrease in solar radiation. The significant decreased zone was mainly located in the Rikaze-YZR. For every 1 °C increase in maximum and minimum temperature, the highland barley yield potential in the entire region increased by 219.68 kg/ha and 91.40 kg/ha, respectively. But, in the Rikaze-YZR and the NR basin, for every 1 °C increase in minimum temperature, the yield potential of highland barley decreased by −35.73 kg/ha and −28.23 kg/ha, respectively. Based on the quantified responses, this study provides a basis for decision-making in agricultural policy. This includes optimizing sowing dates in sensitive western basins, prioritizing solar radiation-efficient management in declining zones, or variety deployment for efficient utilization of solar radiation.

Author Contributions

Writing—review and editing, writing—original draft, visualization, software, investigation, formal analysis, and data curation, T.L.; writing—original draft, investigation, and data curation, Y.W.; investigation, methodology, and validation, T.L., Y.L. and X.S.; supervision, Y.W., Y.L. and Y.Y.; writing—review and editing, conceptualization, project administration, methodology, and funding acquisition, Y.Y. and T.L. All authors have read and agreed to the published version of the manuscript.

Funding

This research was supported by the Second Tibetan Plateau Scientific Expedition and Research Program (Grant No. 2019QZKK1006) and the Research Project Funded by Basic Scientific Research Funds for Provincial Higher Education Institutions of Hebei GEO University in 2025 (Grant No. QN25005).

Institutional Review Board Statement

Not applicable.

Data Availability Statement

The original contributions presented in this study are included in the article. Further inquiries can be directed to the corresponding author.

Acknowledgments

We acknowledge the China Meteorological Administration for providing us with meteorological data, and the Institute of Agricultural Resources and Environment of the Tibet Autonomous Region Academy of Agricultural and Animal Husbandry Sciences for providing us with data on variety parameters, soil data, and field data.

Conflicts of Interest

The authors declare no conflicts of interest.

Appendix A

Meteorological Data

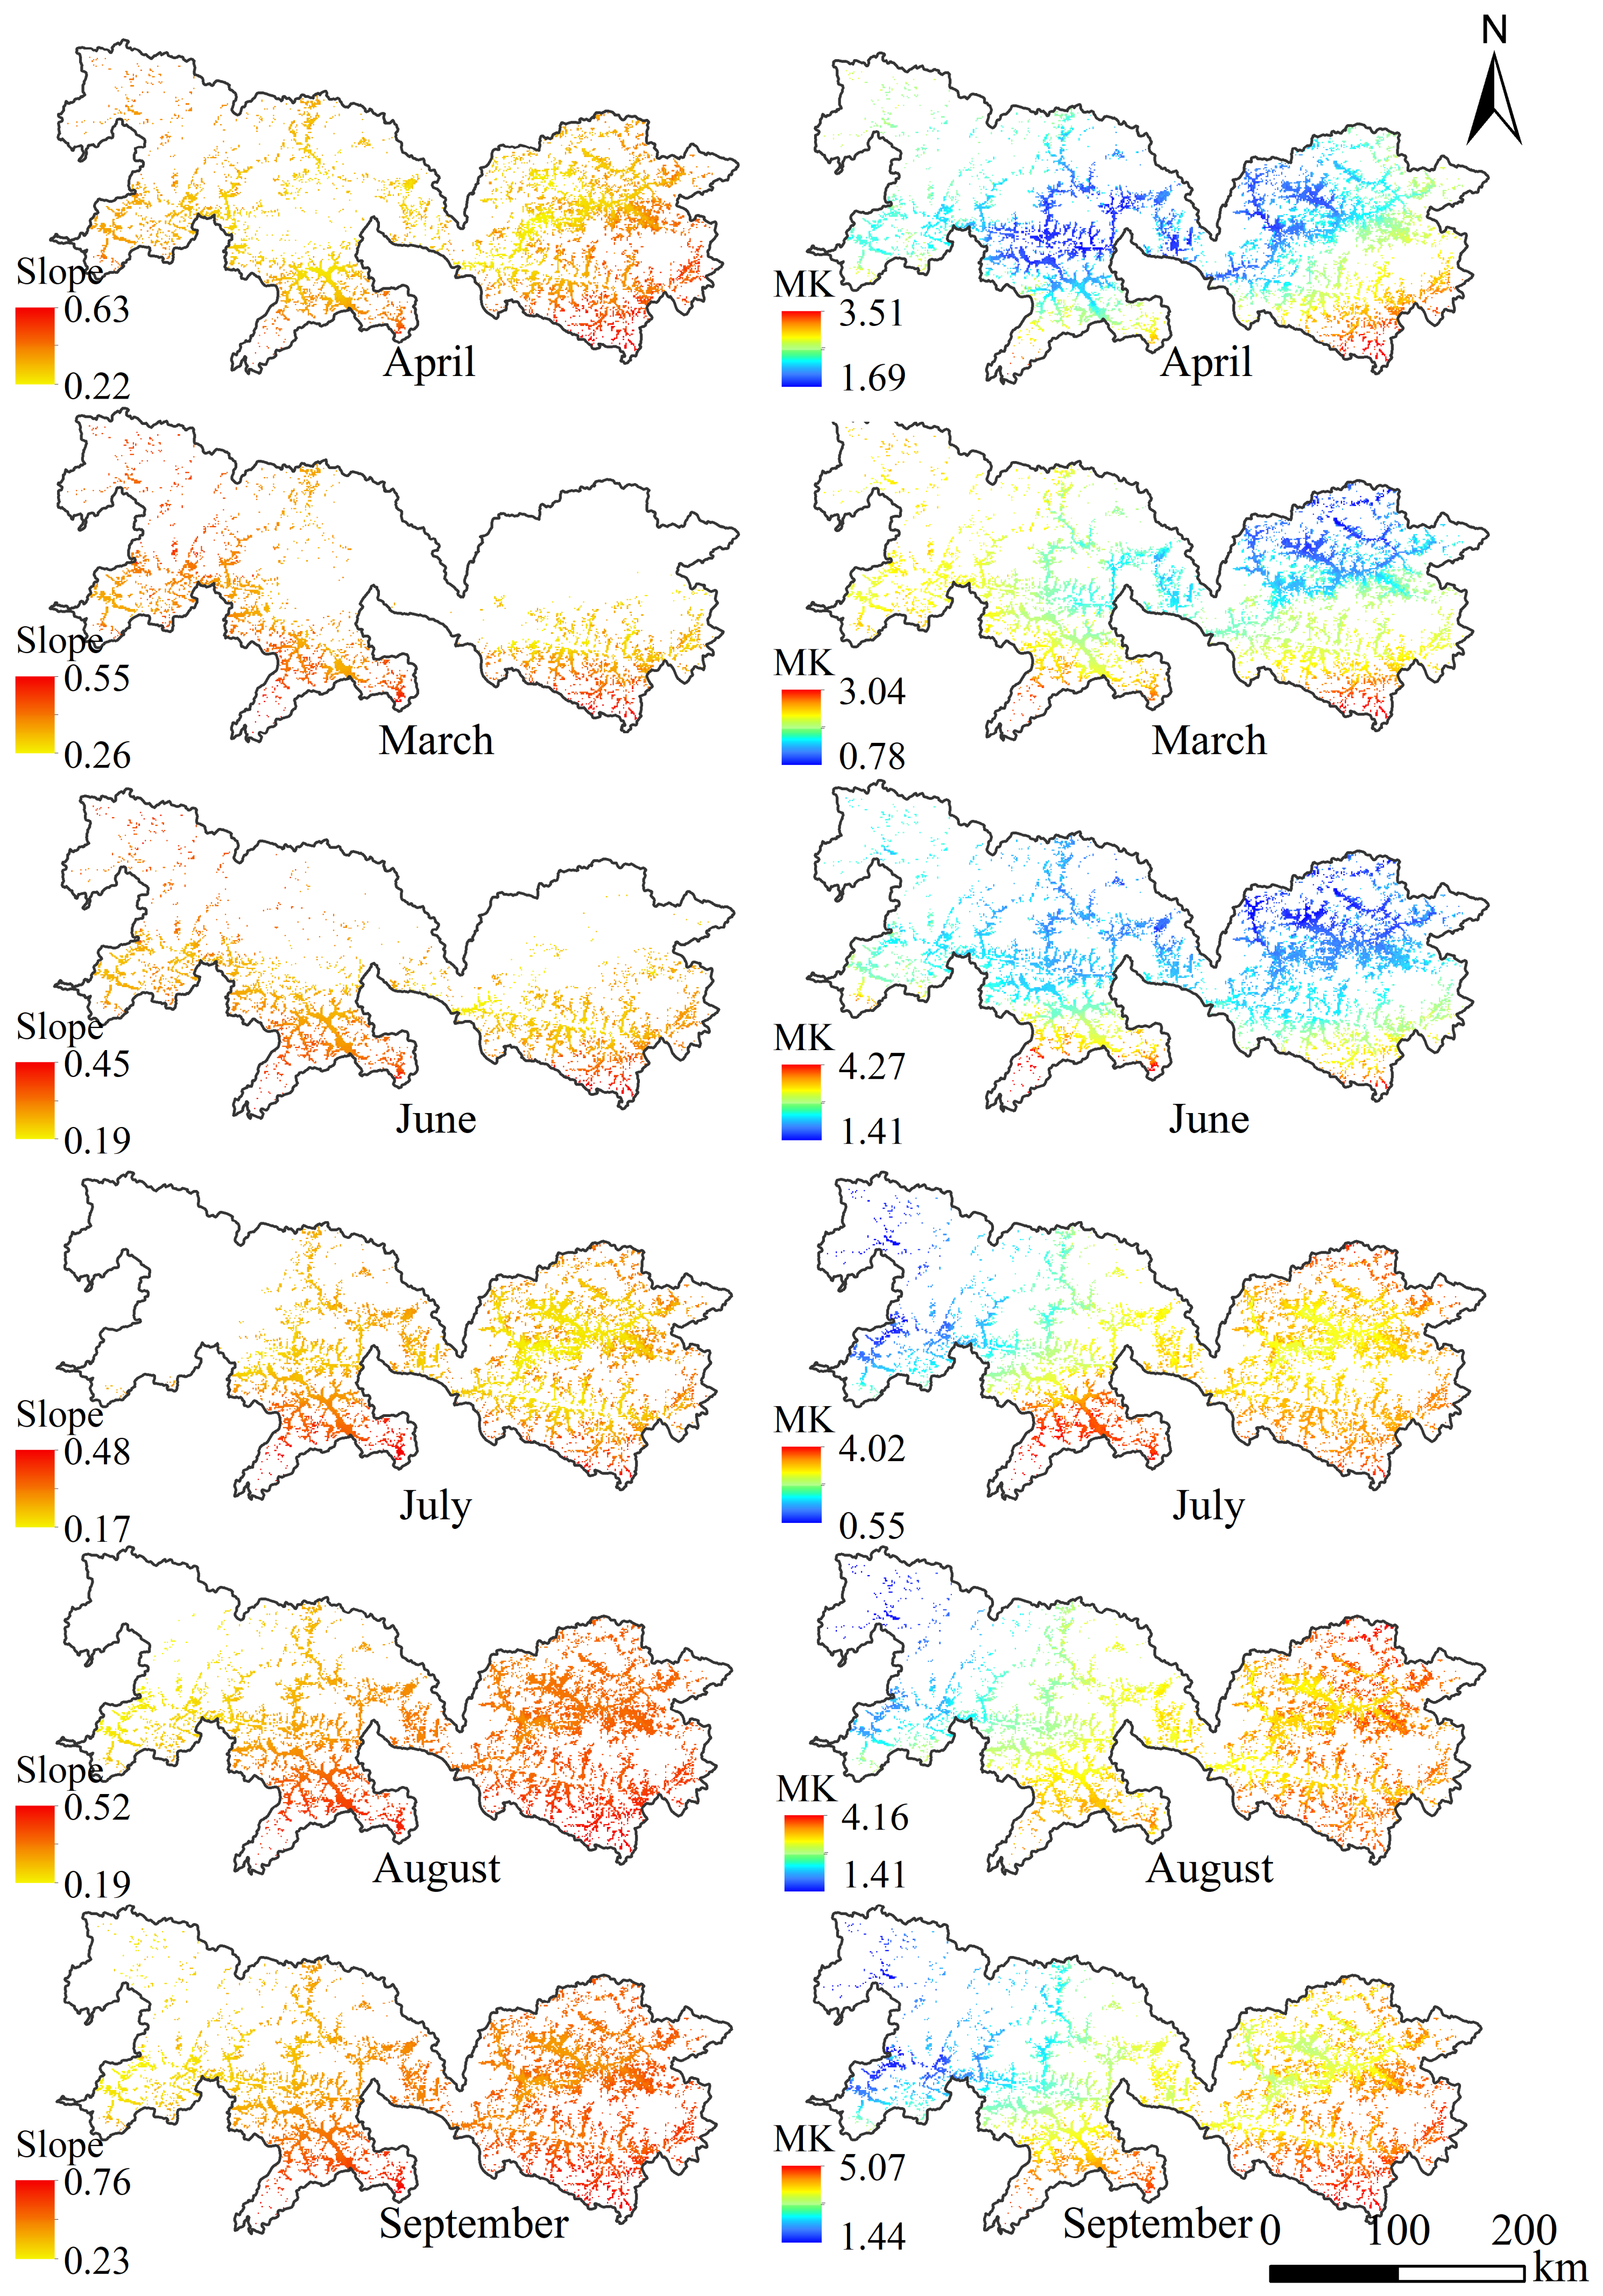
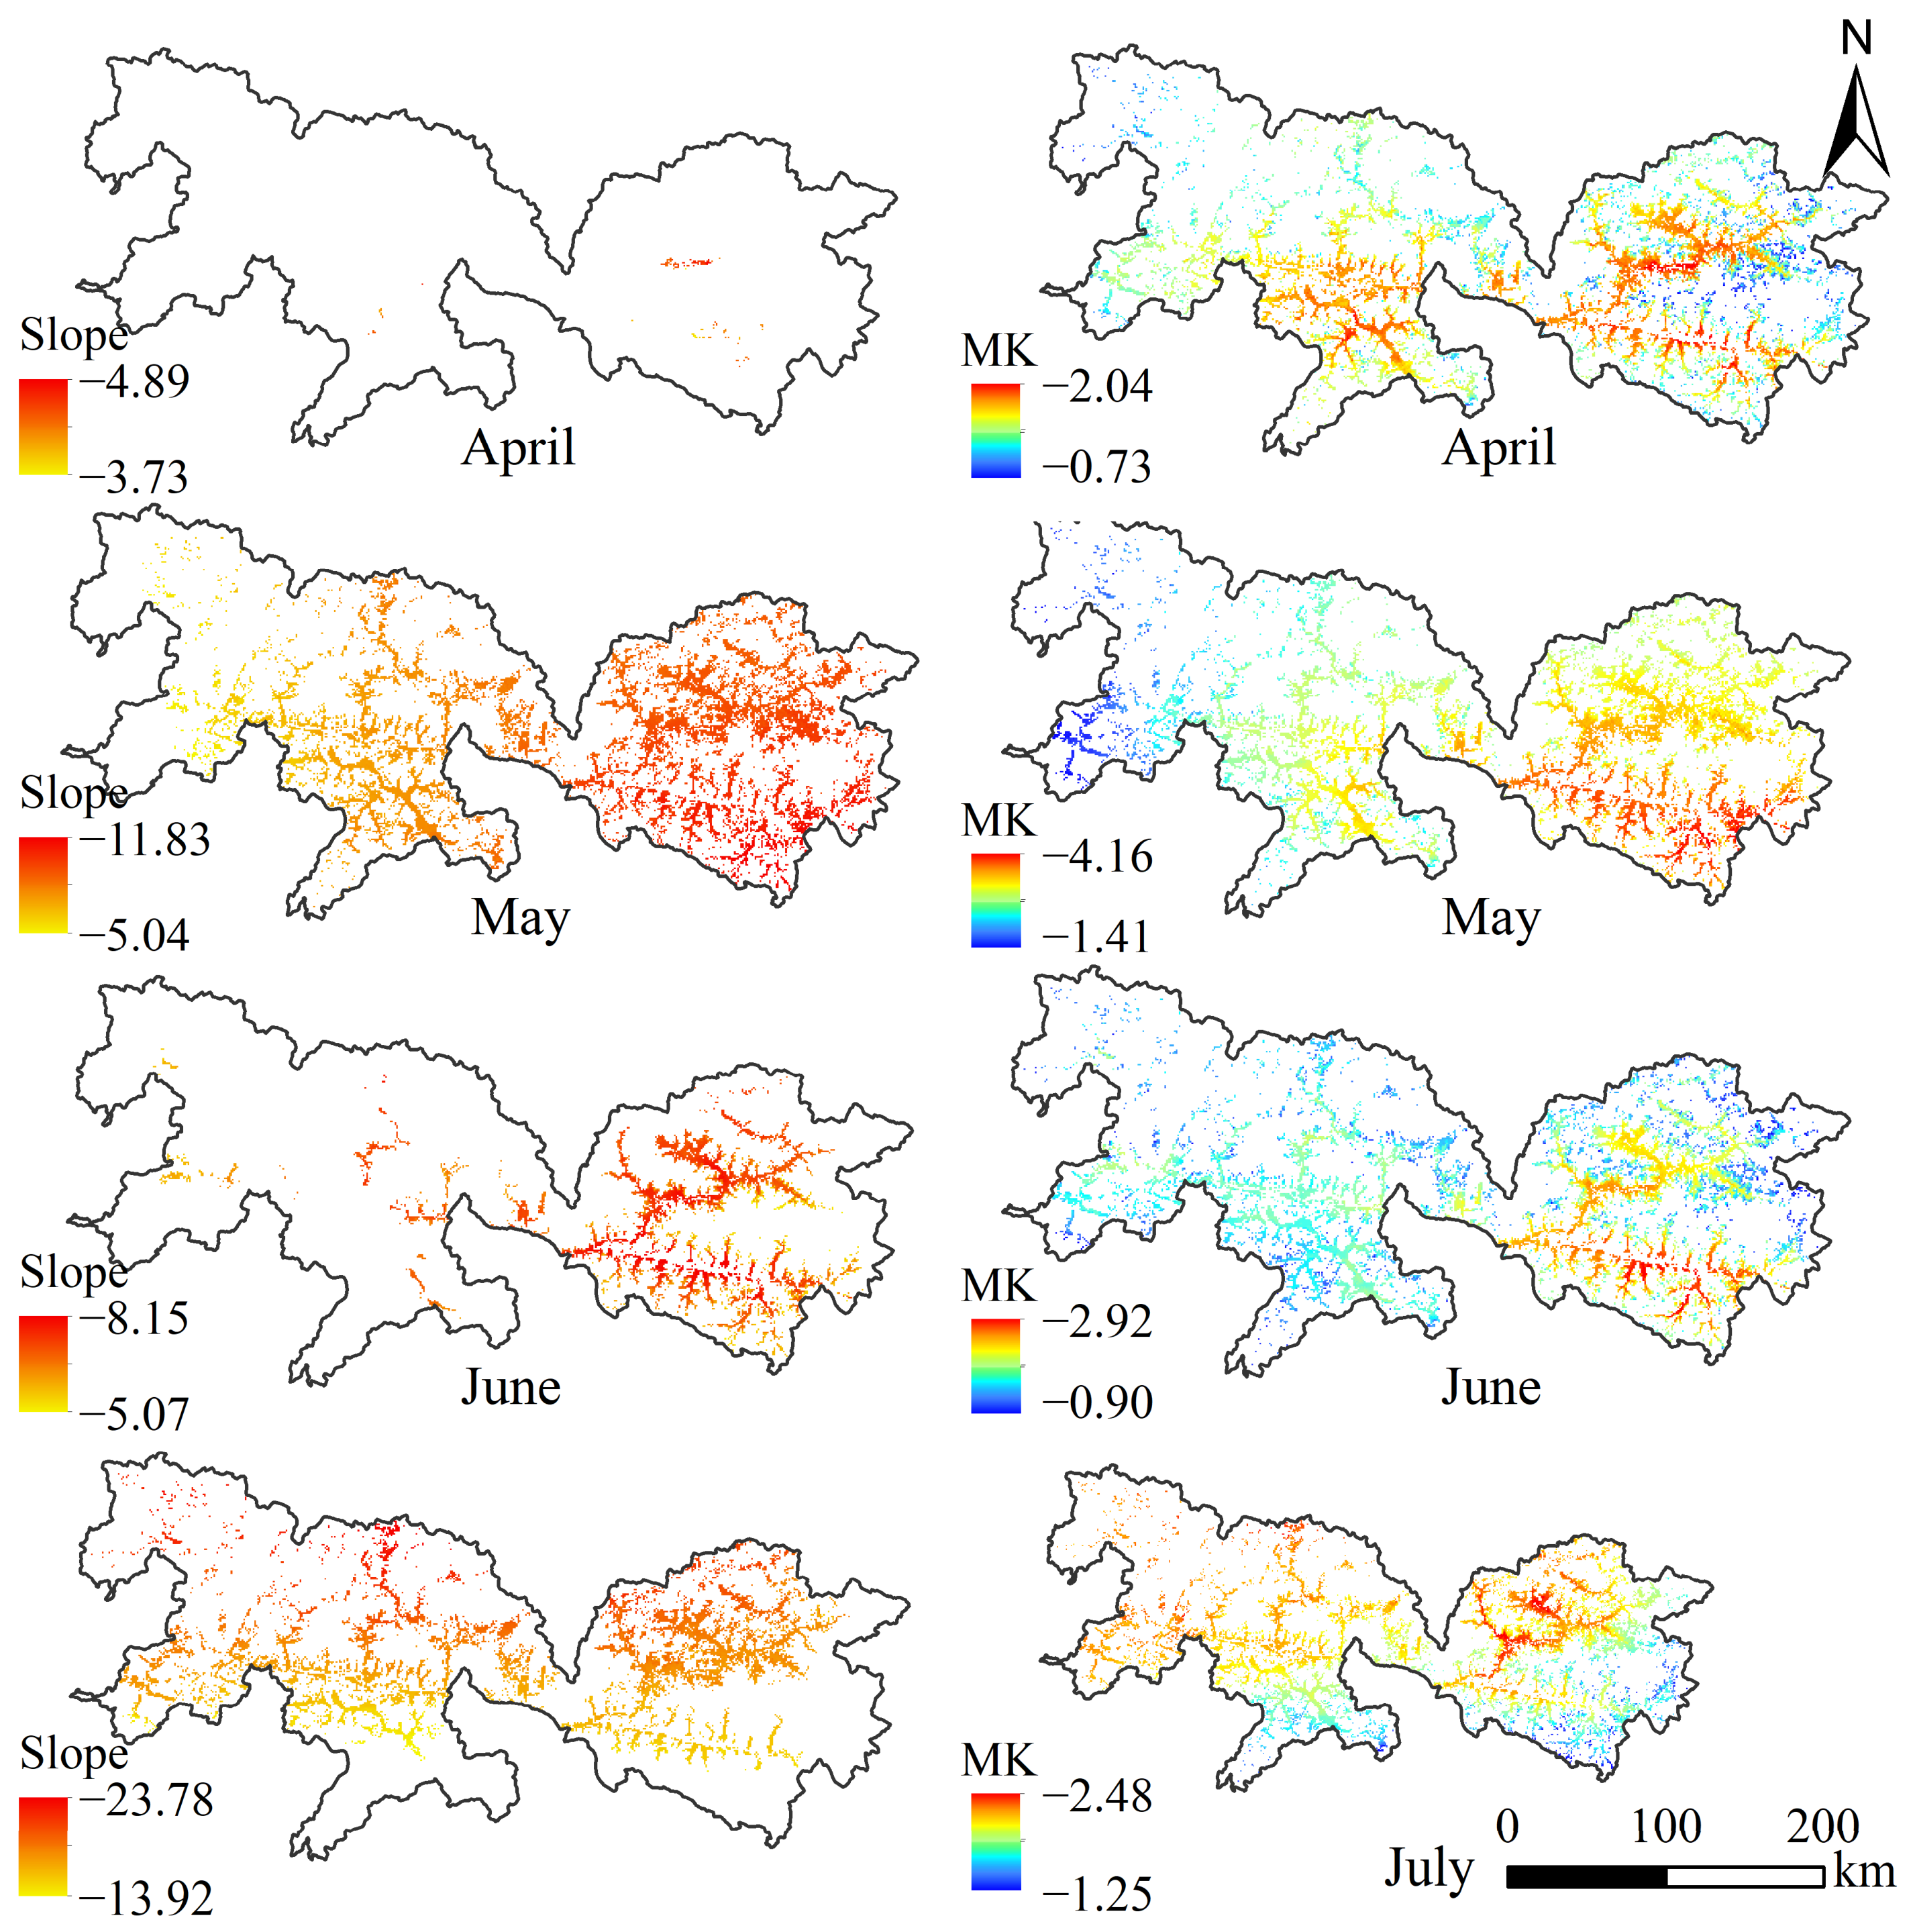
The meteorological data from 1981 to 2020 were purchased from the National Meteorological Information Centre, including precipitation, sunshine hours, maximum temperature, minimum temperature, average temperature, and other elements. The meteorological data were interpolated into raster data with a resolution of 1 km using Aunsplin 4.0 software. The monthly slope trend of average temperature and solar radiation in highland barley growing seasons (From April to September) were calculated according to methods in “Section 2.4. Trend and change rate analysis” (Figure A1 and Figure A2).
According to Figure A1, the average monthly temperature during the growing season of highland barley showed an upward trend, with a warming rate between 0.17~0.76 °C/10a. The warming trend of the average temperature in each month are 0.26~0.55 °C/10a, 0.19~0.45 °C/10a, 0.17~0.48 °C/10a, 0.19~0.52 °C/10a and 0.23~0.76 °C/10a, respectively.
According to Figure A2, the average monthly solar radiation during the growing season of highland barley showed a download trend, with a down rate between −3.73~−23.78 MJ/m2·10a. The warming trend of the average temperature in each month are −3.73~−4.89 MJ/m2·10a, −5.04~−11.83 MJ/m2·10a, −5.07~−8.15 MJ/m2·10a, and −13.92~−23.78 MJ/m2·10a, respectively. Noting that the lack of confidence level of 95%, there were no analysis on the solar radiation changes in August and September.
Figure A1. The slope rates and MK values of monthly average temperature from 1981 to 2020 in highland barley growing seasons in YZTT area.
Agriculture 16 01125 g0a1
Figure A2. The slope rates and MK values of monthly average total solar radiation from 1981 to 2020 in highland barley growing seasons in YZTT area.
Agriculture 16 01125 g0a2

Appendix B

Soil Data

The soil data was derived from the Global Soil Data Set for Earth System Modeling (GSDE) database provided by the Cold and Dry Zone Scientific Data Centre, which was based on the Harmonized World Soil Database (HWSD) soil database and was developed at a spatial resolution of 10 km for DSSAT soil module computing. This dataset provides 34 soil attribute data, including soil thickness, number of soil layers, soil sand content, soil clay content, conductivity, organic carbon content, pH, etc. (Table A1). In addition, values for soil albedo, soil runoff, and drainage rate were defined according to the HWSD classification standard for soil environment. Soil color data was obtained from the “1:1,000,000 Soil Map of the People’s Republic of China” compiled and published in 1995 by the Office of National Soil Survey Leading Group, and downloaded from the Resource Science Data Center (https://www.resdc.cn/data.aspx?DATAID=145 (accessed on 4 April 2026)).
Table A1. Lists of input soil profile data in DSSAT model.
Soil PropertiesValuesUnitsScale Factors
Total carbon0% of weight0.01
Organic carbon0% of weight0.01
Total N0% of weight0.01
Total S0% of weight0.01
CaCO30% of weight0.01
Gypsum0% of weight0.01
pH (H2O)700.1
pH (KCl)700.1
pH (CaCl2)700.1
Electrical conductivity600ds/m0.01
Exchangeable calcium0cmol/kg0.01
Exchangeable magnesium0cmol/kg0.01
Exchangeable sodium0cmol/kg0.01
Exchangeable potassium0cmol/kg0.01
Exchangeable aluminum0cmol/kg0.01
Exchangeable acidity0cmol/kg0.01
Cation exchange capacity0cmol/kg0.01
Base saturation0%
Sand content50% of weight
Silt content30% of weight
Clay content20% of weight
Gravel content0% of volume
Bulk density120g/cm30.01
Volumetric water content at −10 kPa35% of volume
Volumetric water content at −33 kPa30% of volume
Volumetric water content at −1500 kPa10% of volume
The amount of phosphorous using the Bray1 method0ppm of weight0.01
The amount of phosphorous by Olsen method0ppm of weight0.01

References

  1. Wang, C.Y.; Song, Y.L.; Linderholm, H.W.; Li, Y.; Zhang, B.T.; Du, J.; Li, F.X.; Wang, M.T.; Wang, R.Y.; Zhu, Y.; et al. The influence of increasing temperatures on highland barley yields and on the maximum cultivation altitude on the Tibetan Plateau. Adv. Clim. Change Res. 2023, 14, 573–579. [Google Scholar] [CrossRef]
  2. Liu, Z.F.; Yao, Z.J.; Yu, C.Q.; Zhong, Z.M. Assessing crop water demand and deficit for the growth of spring highland barley in Tibet, China. J. Integr. Agric. 2013, 12, 541–551. [Google Scholar] [CrossRef]
  3. Zhong, Z.M.; Zhang, G.Y.; Fu, G. Experimental warming causes large yield reduction of spring highland barley, and the changes of the phyllosphere microbial community represents the extrinsic manifestation of the underlying mechanism. PLoS ONE 2025, 20, e0319612. [Google Scholar] [CrossRef]
  4. Wang, L.E.; Guo, J.X.; Feng, L.; Luo, Y.H.; Zhang, X.Z.; Fan, Y.Z.; Cheng, S.K. The structure and characteristics of resident food consumption in rural areas of the Tibetan Plateau: Taking Three-Rivers Region in Tibet as an example. Acta Geogr. Sin. 2021, 76, 2104–2117. [Google Scholar] [CrossRef]
  5. Liu, G.Y.; Pubu, G.; Gan, Y.W.; Zhaxi, L.; Tang, Y.W. Factors contributing to increased grain yield from 2010 to 2019 in Tibet, China. Chin. J. Appl. Environ. 2022, 28, 931–934. [Google Scholar] [CrossRef]
  6. Duoji, P.; Sangzhu, D.; Zhou, K.S.; Zhang, D.D.; Duoji, D. Characteristics of climate change in Xizang Plateau from 1980 to 2023 and its impact on agriculture. Acta Agric. Jiangxi 2025, 37, 99–108. [Google Scholar] [CrossRef]
  7. Zhou, K.S.; Deng, W.; Cui, Y.L.; Hong, J.C.; Cuo, M. Highland barley production area of Tibetan Plateau from 1961 to 2018: Spatiotemporal variation characteristics of climatic potential productivity. Chin. Agric. Sci. Bull. 2020, 36, 88–98. [Google Scholar] [CrossRef]
  8. Liu, G.Y.; Xie, Y.C.; Hou, Y.H.; Li, X.; Zhang, G.H. Effects of elevated temperature and carbon dioxide concentration on the growth of highland barley. Chin. J. Agrometeorol. 2018, 39, 567–574. [Google Scholar] [CrossRef]
  9. Hao, S.; Song, Y.L.; Sun, S.; Wang, C.Y. Review on the impacts of climate change on highland barley production in Tibet Plateau. Chin. J. Agrometeorol. 2023, 44, 398–409. [Google Scholar] [CrossRef]
  10. Pu, L.; Jiang, J.; Ma, M.; Huang, D. Gaps between rice actual and potential yields based on the VPM and GAEZ Models in Heilongjiang Province, China. Agriculture 2024, 14, 277. [Google Scholar] [CrossRef]
  11. Lobell, D.B.; Asseng, S. Comparing estimates of climate change impacts from process-based and statistical crop models. Environ. Res. Lett. 2017, 12, 015001. [Google Scholar] [CrossRef]
  12. Mamassi, A.; Lang, M.; Tychon, B.; Lahlou, M.; Wellens, J.; El Gharous, M.; Marrou, H. A comparison of empirical and mechanistic models for wheat yield prediction at field level in Moroccan rainfed areas. Silico Plants 2024, 6, diad020. [Google Scholar] [CrossRef]
  13. Jones, J.W.; Antle, J.M.; Basso, B.; Boote, K.J.; Wheeler, T.R. Toward a new generation of agricultural system data, models, and knowledge products: State of agricultural systems science. Agric. Syst. 2017, 155, 269–288. [Google Scholar] [CrossRef]
  14. Nargund, R.; Rautela, K.S.; Goyal, M.K.; Sinha, N.K.; Mohanty, M.; Bhatia, V.S. Assessing soybean yield in Madhya Pradesh by using a multi-model approach. Field Crops Res. 2025, 322, 109716. [Google Scholar] [CrossRef]
  15. Wajid, A.; Hussain, K.; Ilyas, A.; Habib-ur-Rahman, M.; Shakil, Q.; Hoogenboom, G. Crop models: Important tools in decision support system to manage wheat production under vulnerable environments. Agriculture 2021, 11, 1166. [Google Scholar] [CrossRef]
  16. Shawon, A.R.; Memic, E.; Kottmann, L.; Uptmoor, R.; Hackauf, B.; Feike, T. Comprehensive evaluation of the DSSAT-CSM-CERES-Wheat for simulating winter rye against multi-environment data in Germany. Agron. J. 2024, 116, 1844–1868. [Google Scholar] [CrossRef]
  17. Manivasagam, V.S.; Rozenstein, O. Practices for upscaling crop simulation models from field scale to large regions. Comput. Electron. Agric. 2020, 175, 105554. [Google Scholar] [CrossRef]
  18. Jones, J.W.; Hoogenboom, G.; Porter, C.H.; Boote, K.J.; Batchelor, W.D.; Hunt, L.A.; Wilkens, P.W.; Singh, U.; Gijsman, A.J.; Ritchie, J.T. The DSSAT cropping system model. Eur. J. Agron. 2003, 18, 235–265. [Google Scholar] [CrossRef]
  19. Pu, L.M.; Xiang, M.J. Effects of future climate and cropland use changes on rice potential yields in Hainan Island, China. Chin. Geogr. Sci. 2025, 35, 438–453. [Google Scholar] [CrossRef]
  20. Lang, T.T.; Yang, Y.Z.; Jia, K.; Zhang, C.; You, Z.; Liang, Y. Estimation of winter wheat production potential based on remotely-sensed imagery and process-based model simulations. Remote Sens. 2020, 12, 2857. [Google Scholar] [CrossRef]
  21. Hijmans, R.J.; Lens, I.; Diepen, C.A.V. WOFOST 6.0: User’s Guide for the WOFOST 6.0 Crop Growth Simulation Model; Winand Staring Centre: Wageningen, The Netherlands, 1994. [Google Scholar]
  22. Cheng, C.; Yan, J.; Lyu, Y.; Tang, S.; Chen, S.; Chen, X.; Wu, L.; Gong, Z. Simulation study on the yield reduction risk of late sowing winter wheat and the compensation effect of soil moisture in the North China Plain. Agriculture 2026, 16, 183. [Google Scholar] [CrossRef]
  23. Gong, K.Y.; He, L.; Wu, D.R.; Lv, C.H.; Li, J. Spatial-temporal variations of photo-temperature potential productivity and yield gap of highland barley and its response to climate change in the cold regions of the Tibetan Plateau. Sci. Agric. Sin. 2020, 53, 720–733. [Google Scholar] [CrossRef]
  24. Zhao, X.Y.; Wang, W.Y.; Wang, W.J. Impact of climate change on potential productivity and phenological phase of forage in the Qinghai-Tibet plateau in the past 50 years. Chin. J. Eco-Agric. 2016, 24, 532–543. [Google Scholar] [CrossRef]
  25. Mereu, V.; Gallo, A.; Trabucco, A.; Carboni, G.; Spano, D. Modeling high-resolution climate change impacts on wheat and maize in Italy. Clim. Risk Manag. 2021, 33, 100339. [Google Scholar] [CrossRef]
  26. Li, M.; Wang, L.; Singh, V.P.; Chen, Y.; Li, H.; Li, T.; Zhou, Z.; Fu, Q. Green and efficient fine control of regional irrigation water use coupled with crop growth-carbon emission processes. Eur. J. Agron. 2025, 164, 127442. [Google Scholar] [CrossRef]
  27. Xia, X.S.; Lv, S.H.; Liu, M.J.; Yan, M.; Chen, Q.; Pan, Y.Z. Spatial distribution dataset of 30-m resolution cropland in agricultural regions, Qinghai-Tibet Plateau. Sci. Data 2025, 12, 1472. [Google Scholar] [CrossRef] [PubMed]
  28. Zhao, J.; Lancuo, Z.; Wang, W.; Wang, H.; Wang, W.; Shen, J. Response of suitable area of highland barley in the Qinghai-Xizang Plateau to climate change based on Maximum Entropy Model analysis. Chin. J. Eco-Agric. 2024, 32, 1626–1638. [Google Scholar]
  29. Hatfield, J.L.; Beres, B.L. Yield Gaps in Wheat: Path to Enhancing Productivity. Front. Plant Sci. 2019, 10, 1603. [Google Scholar] [CrossRef] [PubMed]
  30. Liu, G.Z.; Liu, W.M.; Hou, P.; Ming, B.; Yang, Y.S.; Guo, X.X.; Xie, R.Z.; Wang, K.R.; Li, S.K. Reducing maize yield gap by matching plant density and solar radiation. J. Integr. Agric. 2021, 20, 363–370. [Google Scholar] [CrossRef]
  31. van Oort, P.A.J.; Saito, K.; Dieng, I.; Grassini, P.; Cassman, K.G.; van Ittersum, M.K. Can yield gap analysis be used to inform R&D prioritisation? Glob. Food Secur. 2017, 12, 109–118. [Google Scholar] [CrossRef]
  32. Pu, L.M.; Lu, Q.Y.; Zhu, Y. Actual and potential yield gaps of double cropping rice in Hainan Island, China during 2000–2020. Chin. Geogr. Sci. 2026, 36, 509–523. [Google Scholar] [CrossRef]
  33. Zhang, G.L.; Ou, Y.H.; Zhou, C.P.; Xu, X.L.; Zhang, X.Z. Response of agricultural thermal resources to climate change in the region of the Brahmaputra River and Its Two Tributaries in Tibet during past 50 years. Resour. Sci. 2010, 32, 1943–1954. [Google Scholar]
  34. Zhang, R.; Xu, Z.; Zuo, D.; Ban, C. Hydro-Meteorological trends in the Yarlung Zangbo River Basin and possible associations with Large-Scale circulation. Water 2020, 12, 144. [Google Scholar] [CrossRef]
  35. Hao, W.; Li, S.; Geng, M.; Qu, X.; Xu, J.; Xing, Z. Simulation and attribution analysis of terrestrial ecosystem carbon storage in the Yarlung Zangbo River and the Two Tributaries of the Qinghai-Tibet Plateau. Pol. J. Environ. Stud. 2026, 35, 2639–2653. [Google Scholar] [CrossRef] [PubMed]
  36. Ma, W.; Wang, J. The Evolution and spatial pattern of highland barley varieties on the Qinghai—Tibetan Plateau. Sci. Technol. Qinghai Agric. 2021, 50–55. [Google Scholar] [CrossRef]
  37. Liu, W.; Xu, B.; Tang, P.C.; Li, Z.K. The effect of irrigation with cool water on soil temperature and growth of spring highland barley in high-altitude regions. J. Irrig. Drain. 2020, 39, 51–57. [Google Scholar] [CrossRef]
  38. Malik, W.; Dechmi, F. DSSAT modelling for best irrigation management practices assessment under Mediterranean conditions. Agric. Water Manag. 2019, 216, 27–43. [Google Scholar] [CrossRef]
  39. Stow, D.A.; Daeschner, S.; Hope, A.; Douglas, D.C.; Petersen, A.; Myneni, R.B.; Zhou, L.; Oechel, W.C. Variability of the Seasonally Integrated Normalized Difference Vegetation Index Across the North Slope of Alaska in the 1990s. Int. J. Remote Sens. 2003, 24, 1111–1117. [Google Scholar] [CrossRef]
  40. Zhou, Z.G.; Wang, L.C.; Lin, A.W.; Zhang, M.; Niu, Z.G. Innovative trend analysis of solar radiation in China during 1962–2015. Renew. Energy 2018, 119, 675–689. [Google Scholar] [CrossRef]
  41. Guo, M.; Li, J.; He, H.S.; Xu, J.W.; Jin, Y.H. Detecting global vegetation changes using Mann-Kendal (MK) trend test for 1982–2015 time period. Chin. Geogr. Sci. 2018, 28, 907–919. [Google Scholar] [CrossRef]
  42. Yang, X.F.; Qin, W.M.; Wang, L.C.; Zhang, M.; Niu, Z.G. Long-term variations of surface solar radiation in China from routine meteorological observations. Atmos. Res. 2021, 260, 105715. [Google Scholar] [CrossRef]
  43. Cai, J.; Zhou, B.; Chen, S.; Wang, X.; Yang, S.; Cheng, Z.; Wang, F.; Mei, X.; Wu, D. Spatial and temporal variability of soil moisture and its driving factors in the Northern Agricultural Regions of China. Water 2024, 16, 556. [Google Scholar] [CrossRef]
  44. Mekanik, F.; Imteaz, M.A.; Gato-Trinidad, S.; Elmahdi, A. Multiple regression and Artificial Neural Network for long-term rainfall forecasting using large scale climate modes. J. Hydrol. 2013, 503, 11–21. [Google Scholar] [CrossRef]
  45. Amthor, J.S. After photosynthesis, what then: Importance of respiration to crop growth and yield. Field Crops Res. 2025, 321, 109638. [Google Scholar] [CrossRef]
  46. Zhang, Z.; Lu, C. Assessing influences of climate change on highland barley productivity in the Qinghai-Tibet Plateau during 1978–2017. Sci. Rep. 2022, 12, 7625. [Google Scholar] [CrossRef]
  47. Gardi, M.W.; Memic, E.; Zewdu, E.; Graeff-Hnninger, S. Simulating the effect of climate change on barley yield in Ethiopia with the DSSAT-CERES-Barley model. Agron. J. 2022, 114, 1128–1145. [Google Scholar] [CrossRef]
  48. Dodig, D.; Kandić, V.; Zorić, M.; Nikolić-Ðorić, E.; Živanov, S.T.; Perović, D. Response of kernel growth of barley genotypes with different row type to climatic factors before and after inflection point of grain filling. Field Crops Res. 2020, 255, 107864. [Google Scholar] [CrossRef]
  49. Yang, C.; Tian, F.; Jin, H.; Fensholt, R.; Feng, L.; Tagesson, T. Assessing the elevational synchronization in vegetation phenology across Northern Hemisphere mountain ecosystems under global warming. Glob. Planet. Change 2025, 252, 104903. [Google Scholar] [CrossRef]
  50. Liu, B.H.; Li, G.Q.; Zhang, Y.E.; Zhang, L.; Lu, D.J.; Yan, P.; Yue, S.C.; Hoogenboom, G.; Meng, Q.F.; Chen, X.P. Optimizing management strategies to enhance wheat productivity in the North China Plain under climate change. J. Integr. Agric. 2025, 24, 2989–3003. [Google Scholar] [CrossRef]
  51. Ran, H.; Kang, S.; Hu, X.; Li, S.; Wang, W.; Liu, F. Capability of a solar energy-driven crop model for simulating water consumption and yield of maize and its comparison with a water-driven crop model. Agric. For. Meteorol. 2020, 287, 107955. [Google Scholar] [CrossRef]
  52. Kipkulei, H.K.; Bellingrath-Kimura, S.D.; Lana, M.; Ghazaryan, G.; Baatz, R.; Matavel, C.; Boitt, M.K.; Chisanga, C.B.; Rotich, B.; Moreira, R.M.; et al. Maize yield prediction and condition monitoring at the sub-county scale in Kenya: Synthesis of remote sensing information and crop modeling. Sci. Rep. 2024, 14, 14227. [Google Scholar] [CrossRef]
Figure 1. Location of the YZTT area and the field sampling location of highland barley growth.
Agriculture 16 01125 g001
Figure 2. The spatial simulation process for highland barley coupled with DSSAT model with GIS technology; * means the file name.
Agriculture 16 01125 g002
Figure 3. Spatial distribution of average yield potential of highland barley from 1981 to 2020 in the YZTT region.
Agriculture 16 01125 g003
Figure 4. Yearly changes in the yield potential of highland barley in the YZTT region from 1981 to 2020.
Agriculture 16 01125 g004
Figure 5. The change tendency of the yield potential of highland barley in the YZTT region from 1981 to 2020: (a) the change trend of highland barley yield potential; (b) the MK trend test result of highland barley yield potential; and (c) the downward trend that passed significance test.
Agriculture 16 01125 g005
Figure 6. Partial correlationship between the yield potential of highland barley and climate factors in the YZTT region: (a) bias correlation with maximum temperature; (b) bias correlation with maximum temperature (significant); (c) bias correlation with minimum temperature; (d) bias correlation with minimum temperature (significant); (e) bias correlation with solar radiation; and (f) bias correlation with solar radiation (significant).
Agriculture 16 01125 g006
Figure 7. Regression results of highland barley potential production and meteorological factors in the YZTT region: (a) regression coefficient with maximum temperature; (b) regression coefficient with minimum temperature; (c) regression coefficient with solar radiation; and (d) p-value of the multiple linear regression equation.
Agriculture 16 01125 g007
Figure 8. The growth length of highland barley in each period, from 1981 to 2020, in the YZTT region: (a) the growth length in vegetative stage; (b) the growth length in vegetative and reproductive stage; (c) the growth length in reproductive stage; and (d) the growth length in all period of highland barley.
Agriculture 16 01125 g008
Figure 9. The slope trend and MK values of growth length in three growth stages from 1981 to 2020 in the YZTT region: (a) the slope trend in vegetative stage; (b) the MK test result in vegetative stage; (c) the slope trend in vegetative and reproductive stage; (d) the MK test result in vegetative and reproductive stage; (e) the slope trend in reproductive stage; and (f) the MK test result in reproductive stage.
Agriculture 16 01125 g009
Table 1. Field management information of highland barley.
Management in FieldOperation TimeDetails
Sowing and planting18 April 2016Machine tillage and drilling, row spacing of 25 cm, planting depth of 5 cm, sowing rate for seeds 225 kg/ha
Soil treatment25 March 2016Pest control: Granular insecticide (3% phoxim) of 30 kg/ha, with sand soil of 75 kg/ha mixed, underground plowing
Grass control: Tri-allate of 3.75 kg/ha, with water of 45 kg/ha and sand soil of 20 kg/ha mixed, underground plowing
Irrigation28 May 2016Furrow irrigation, 60 mm
13 June 2016Furrow irrigation, 80 mm
29 June 2016Furrow irrigation, 80 mm
16 July 2016Furrow irrigation, 80 mm
Fertilization17 April 2016Base fertilizer: Diammonium Phosphate (DPA) of 112.5 kg/ha, urea of 90 kg/ha, potassium chloride of 30 kg/ha
Organic fertilizer: Farmyard manure of 30,000 kg/ha
28 May 2016Topdressing: Urea of 135 kg/ha
Table 2. Field measurement data of highland barley cultivar named ZangQing 2000 from 2014 to 2016.
YearPH (cm)EN (Number)SL (cm)GNS (Number)SW (g/1000 s)Y (kg/ha)
201498.75142.275.5244.8743.342294.45
2015-167.675.4041.1342.692441.83
2016-195.00--45.283123.54
Abbreviation notes: Plant height (PH), ear number (EN), length of spike (SL), number of grains per spike (GNS), seed weight (SW), and yield (Y). Note that the ear number is counted based on a 2 m length per row.
Table 3. The phenological period of highland barley.
Phenological PeriodPlant DateEmergence DateTillering DateJointing DateBooting DateHeading DateFlowering DateGrouting DateMilk Maturation DateMaturation Date
Literature date4.254.25~5.95.10~5.305.31~
7.9
7.10~8.97.10~8.9-8.10~
8.25
8.26~9.258.26~9.25
Evaluated date4.185.025.165.316.146.267.047.128.048.11
Note: Dates are in month.day format. The symbol “~” denotes a range between two dates, and symbol “-” represents no records.
Table 4. The calibration results of cultivar coefficients.
AbbreviationDefinitionUnitRangeInitial ValueCalibrated Value
P1VNumber of days required to pass through the vernalization stage under optimum temperature conditionsdays0~6054.7
P1DPhotoperiodic parameter%0~2007524.86
P5Accumulated temperature of grain during filling period°C·day100~999450500.1
G1The number of seeds per plant at flowering timeNo.·g−110~503017.68
G2Standard grain quality under optimal conditionsmg10~803551.95
G3Standard single-ear quality without stress condition at maturityg0.5~810.584
PHINTThe accumulated temperature required for growth between two consecutive leaves°C·day30~1506060
Table 5. The validation results of DSSAT model.
ItemSimulated ValueMeasured ValueMBEnRMSE
Yield in 2014 (kg/ha)1918.002295.60−412.8317.49%
Yield in 2015 (kg/ha)1995.002443.05
Yield in 2016 (kg/ha)3010.003125.10−115.1-
Emergence day after sowing1064-
Flowering day after sowing73730-
Maturation day after sowing1151150-
Note: “-” represents no records.
Table 6. Average yield potential of highland barley in four basins from 1981 to 2020 in the YZTT region.
BasinsAverage Highland Barley Yield Potential (kg/ha)Altitude (m)Difference Between High and Low Altitude Zone (kg/ha)Average Highland Barley Yield Potential (kg/ha)
Rikaze-YZR6904.29<3500−458.257066.25
>35006608.00
Shannan-YZR6720.72<3500−520.476775.99
>35006255.52
NR6674.68<3500−386.556852.56
>35006466.01
LR6554.70<3500−575.516657.31
>35006081.80
YZTT6719.87<3500−390.176830.15
>35006439.98
Table 7. The change tendency of yield potential of highland barley in four basins from 1981 to 2020 in the YZTT region.
BasinsTendency of Highland Barley Yield Potential (kg/ha·a)Altitude (m)Tendency of Highland Barley Yield Potential (kg/ha·a)
Rikaze-YZR−13.82~11.00
(−13.20 *)
<3500−17.00~8.96 (−13.18 *)
>3500−15.89~9.57 (−13.53 *)
Shannan-YZR−17.00~9.57
(−15.32 *)
<3500−21.33~12.25 (−15.32 *)
>3500−17.00~12.24 (−15.63 *)
NR−21.33~12.25
(−12.95 *)
<3500−13.82~10.06 (−12.95 *)
>3500−10.65~11.00 (—)
LR−18.64~8.90
(−12.72 *)
<3500−18.64~8.67 (−12.72 *)
>3500−14.25~8.90 (−12.60 *)
YZTT−21.33~12.25
(−14.49 *)
<3500−21.33~12.25 (−14.50 *)
>3500−17.00~12.24 (−13.46 *)
Note: * indicates the result of significant trend at a confidence level of 95%; “—” indicates no significant trend.
Table 8. Statistical results of the partial correlation coefficients between yield potential of highland barley and climate factors in different basins in the YZTT region.
BasinsMaximum TemperatureMinimum TemperatureSolar Radiation
Rikaze-YZR0.087~0.670 (0.380 *)−0.368~0.153
(−0.303 *)
−0.081~0.619 (0.485 *)
Shannan-YZR−0.094~0.594 (0.404 *)−0.103~0.549
(0.347 *)
0.267~0.827 (0.680 *)
LR0.194~0.619 (0.464 *)−0.305~0.163
(−0.287 *)
−0.043~0.622 (0.476 *)
NR−0.099~0.535 (0.361 *)−0.223~0.508
(0.387 *)
0.279~0.819 (0.637 *)
YZTT−0.099~0.619 (0.407 *)−0.368~0.549
(0.374 *)
−0.081~0.827 (0.562 *)
Note: * indicates the result of significant trend at a confidence level of 95%.
Table 9. Statistical results of regression coefficients between yield potential of highland barley and climate factors in different basins in the YZTT region.
BasinsMaximum TemperatureMinimum TemperatureSolar Radiation
Rikaze-YZR51.413~572.330
(228.459 *)
−397.970~172.620
(−35.734 *)
−0.410~4.070
(3.092 *)
Shannan-YZR−38.398~521.495
(134.200 *)
−124.076~464.683
(193.604 *)
0.698~4.175
(3.040 *)
LR134.007~601.192
(386.359 *)
−425.517~150.810
(−28.230 *)
−0.206~3.823
(2.845 *)
NR−38.514~359.337
(135.959 *)
−146.027~419.395
(256.941 *)
0.663~3.720
(2.647 *)
YZTT−38.514~601.192
(219.678 *)
−425.517~464.683
(91.401 *)
−0.410~4.175
(2.900 *)
Note: * indicates the result of significant trend at a confidence level of 95%.
Table 10. Statistical results of regression coefficient between yield potential of highland barley and climate factors in different altitude in the YZTT region.
BasinsAltitude (m)Maximum TemperatureMinimum TemperatureSolar Radiation
Rikaze-YZR<350051.413~550.943
(168.004 *)
−247.243~172.620
(−16.695 *)
1.439~4.070
(3.405 *)
>3500107.696~572.330
(337.784 *)
−397.971~154.52
(−69.904 *)
−0.410~3.929
(2.531 *)
Shannan-YZR<3500−38.398~519.211
(111.807 *)
−124.076~464.683
(194.291 *)
0.698~4.175
(3.137 *)
>3500−3.350~491.097
(320.613 *)
−113.408~450.117
(186.924 *)
0.988~3.714
(2.221 *)
LR<3500134.007~568.737
(311.292 *)
−162.751~140.007
(−25.157 *)
1.772~3.823
(3.182 *)
>3500175.554~601.192
(473.562 *)
−425.517~150.810
(−31.776 *)
−0.206~3.683
(2.453 *)
NR<3500−38.514~358.616
(111.283 *)
−26.369~419.395
(271.778 *)
1.348~3.720
(2.856 *)
>350027.819~359.337
(247.597 *)
−146.027~403.000
(191.785 *)
0.663~3.465
(1.701 *)
YZTT<3500−38.514~568.737
(160.989 *)
−247.243~464.683
(124.352 *)
0.698~4.175
(3.124 *)
>3500−3.350~601.192
(370.795 *)
−425.517~450.117
(5.954 *)
−0.410~3.929
(2.336 *)
Note: * indicates the result of significant trend at a confidence level of 95%.
Disclaimer/Publisher’s Note: The statements, opinions and data contained in all publications are solely those of the individual author(s) and contributor(s) and not of MDPI and/or the editor(s). MDPI and/or the editor(s) disclaim responsibility for any injury to people or property resulting from any ideas, methods, instructions or products referred to in the content.