Article

CBL Gene Family in Brassica napus: Genome-Wide and Expression Profiling in Response to Phytohormones Under Diverse Stress Conditions

Institute of Vegetable Science, Zhejiang University, Hangzhou 310058, China
*
Authors to whom correspondence should be addressed.
These authors contributed equally to this work.
Agriculture 2026, 16(10), 1088; https://doi.org/10.3390/agriculture16101088
Submission received: 27 March 2026 / Revised: 4 May 2026 / Accepted: 13 May 2026 / Published: 15 May 2026

Abstract

Brassica napus L. is a globally important crop and its productivity is constrained by multiple abiotic stresses (salinity, drought, and heat). Calcineurin B-like proteins (CBLs) act as calcium sensors and play key roles in regulating ion homeostasis and stress-responsive signaling pathways, thereby contributing to plant adaptation under unfavorable environmental conditions. Here, through detailed bioinformatics analyses, the BnCBL gene family has been identified along with its role in tolerance to multiple abiotic stresses. The identified 17 BnCBLs comprised four groups, as in Arabidopsis thaliana. The predicted molecular weights of the CBL proteins ranged from approximately 24.35 kDa (BnCBL3 and -9) to 29.7 kDa (BnCBL5), with protein lengths spanning 213 (BnCBL3, -9, -10, -12 and -15) to 260 amino acids (BnCBL5). Sequence, promoter, and structural analyses showed that BnCBL proteins harbor palmitoylation and myristoylation motifs in their EF-hand domains, contain hormone- and stress-responsive cis-elements, and exhibit characteristic post-translational modification sites and tertiary structures. RNA-seq and RT-qPCR expression analyses showed that several BnCBL genes (BnCBL2, -6, -9, -10, and -15) exhibit differential expression (3~6-fold) under NaCl, drought, and heat stresses, as well as in response to phytohormones (IAA, GA3, ABA, and JA). In addition, BnCBL2, -3, -6, -8, -9, -11, -12 and -16 showed significant expression (around 7-fold) against biotic stresses (Sclerotinia sclerotiorum (Lib.) de Bary and Plasmodiophora brassicae (Woronin, 1877), indicating their roles in both biotic and abiotic stress tolerance and potential utility in biotechnological breeding of stress-enduring B. napus cultivars.

1. Introduction

Many physiological processes in plants including growth, development and their response to various biotic and abiotic stresses are regulated by Calcium ions (Ca2+) [1,2]. The Ca2+ signals are primarily perceived by some Ca2+ sensors including Ca2+ dependent protein kinases, calmodulins and calcineurin B-like proteins (CBLs), and then are transmitted by these sensors to downstream targets to initiate diverse cellular responses [3]. CBLs, as proteins, share sequence similarities with the B subunit of calcineurin B in yeast and neuronal calcium sensors in animals [4]. A minimum of three EF-domains and Ca2+-binding pockets is an essential criterion for CBLs [5].
Moreover, CBLs relay Ca2+ signals through interaction with and activation of CBL-interacting protein kinases (CIPKs). Additionally, the CBL-CIPK interaction network has been considered a compulsory signaling network involved in regulating plant responses to several biotic and abiotic stresses like salinity, drought, excess (Mg2+) or deficiency (K+) of nutrients [6,7]. A total of ten CBL genes have been identified in A. thaliana [8]. Two CBLs, CBL1 and CBL9, were reported to positively regulate the uptake and transport of K+, NO3−, NH4+, aluminum and iron, and the promotion of stomatal opening [5,9,10]. CBLs including CBL1 and CBL9 are found in regulating ROS signaling and stomatal closure via ABA induction [9]. CBL2 plays a negative role in the activation of plasma membrane (PM) H+-ATPase [11]. Moreover, CBLs are also involved in pollen tube germination and its growth by seizing Mg2+ ions in plants [12,13]. Additionally, CBL3 is also considered to be involved in translocation and K+ distribution in plants [14]. CBL4 was proven to be a crucial regulator for excluding Na+ and translocation of AKT2 (Arabidopsis K+ transporter 2) from endoplasmic reticulum to PM [15]. CBL10 has been considered as a regulator of both Na+ and Ca2+ homeostasis under salt stress, regulating Ca2+ fluxes in plasma membrane and vacuoles, and it is also involved in the regulation of AHA (H+-ATPase) [16,17,18]. In cotton (Gossypium hirsutum), GhCBL2 and GhCBL3 have a key role in improving fiber elongation [19]. Many CBLs in other plant species also play important parts in regulating the responses to various abiotic stresses as well as growth and development [20,21].
In recent years, multiple CBL gene families have been identified at genome-wide levels in sunflower [22], N. tangutorum [23], rice [24], maize [25], wheat [26], cotton [19], eggplant [27] and many other plant species. Some conserved domains such as EF-hands, myristoylation and palmitoylation sites were discovered in CBLs [28]. There are several studies elaborating the regulation of CBL genes in distinct plant tissues and which also explore their role in multiple stresses [13,25,27].
However, scientific knowledge about the genomics of BnCBL and its evolutionary information is limited. In this report, genome-wide and comprehensive analyses of the CBL gene family in B. napus were conducted. A total of 17 BnCBL genes were predicted and finalized in the genome of oilseed rape cultivar ZS11. Several bioinformatic analyses examined the phylogenic relationship among three Brassicaceae plant species, including B. napus L., A. thaliana and B. rapa L, focusing on CBLs, including conserved domain (EF-hand_7) and motifs, intron-rich structural similarities (6–7 introns/CBLs), and a sequence alignment analysis indicated myristoylation/palmitoylation sites and chromosomal distribution. Moreover, many other functional related prediction analyses, including promoter analysis regarding cis-acting regulatory elements related to plant stresses, phytohormones and development, as well as a tertiary structure analysis, revealed their functional conservation, post-translational modification sites (phosphorylation, glycosylation, SUMOylation), and some other group-specific characteristics of the BnCBL family. Moreover, interaction network analysis showed that BnCBL proteins may contribute to multiple biotic and abiotic stresses by interacting with other stress-related proteins. Transcriptional profiling highlighting the regulatory role of BnCBL genes in plant tissues, abiotic stresses, phytohormonal treatment and biotic stresses though underlying mechanisms remains to be fully elucidated. Comprehensively, these analyses will provide a basis for further investigation into the functions of CBLs in B. napus.

2. Results

2.1. Comparative Analysis of CBL Gene Family in Oilseed Rape

To identify CBL (Calcineurin B-like) proteins in B. napus, ten known A. thaliana CBL protein sequences were obtained using the TAIR database and used as queries for BLASTP searches against the B. napus genome assembly (Brana_ZS_PB_V1.0). This analysis led to the identification of 17 putative BnCBL proteins. These retrieved BnCBLs were given names according to their sequence similarity with A. thaliana CBLs (AtCBLs), as summarized in Table 1. The molecular weights of the CBL proteins fluctuated from approximately 24.35 kDa (BnCBL3 and BnCBL9) to 29.7 kDa (BnCBL5), with protein lengths spanning 213 (BnCBL3, -9, -10, -12 and -15) to 260 amino acids (BnCBL5). All of the identified proteins harbored three conserved EF-hand motifs, showing their calcium-binding protein characteristics. The pI (isoelectric points) of BnCBLs varied from 4.62 (BnCBL3, -9 and -12) to 5.91 (BnCBL11), indicating an overall acidic nature. Genomic mapping revealed that the majority of BnCBL genes are distributed on both the A and C sub-genomes, including nine BnCBLs on the A sub-genome and eight BnCBLs on the C sub-genome (Table 1; Figure S1). Two chromosomes including A02 and A09 contained three BnCBLs each, BnCBL2, -3, -4 and BnCBL7, -8, -9, respectively, while A01 contained only one BnCBL (BnCBL1). C03 harbored BnCBL14 and C07 harbored BnCBL15. The results showed a diversified distribution of BnCBLs across both sub-genomes (A and C) of the B. napus plant species.
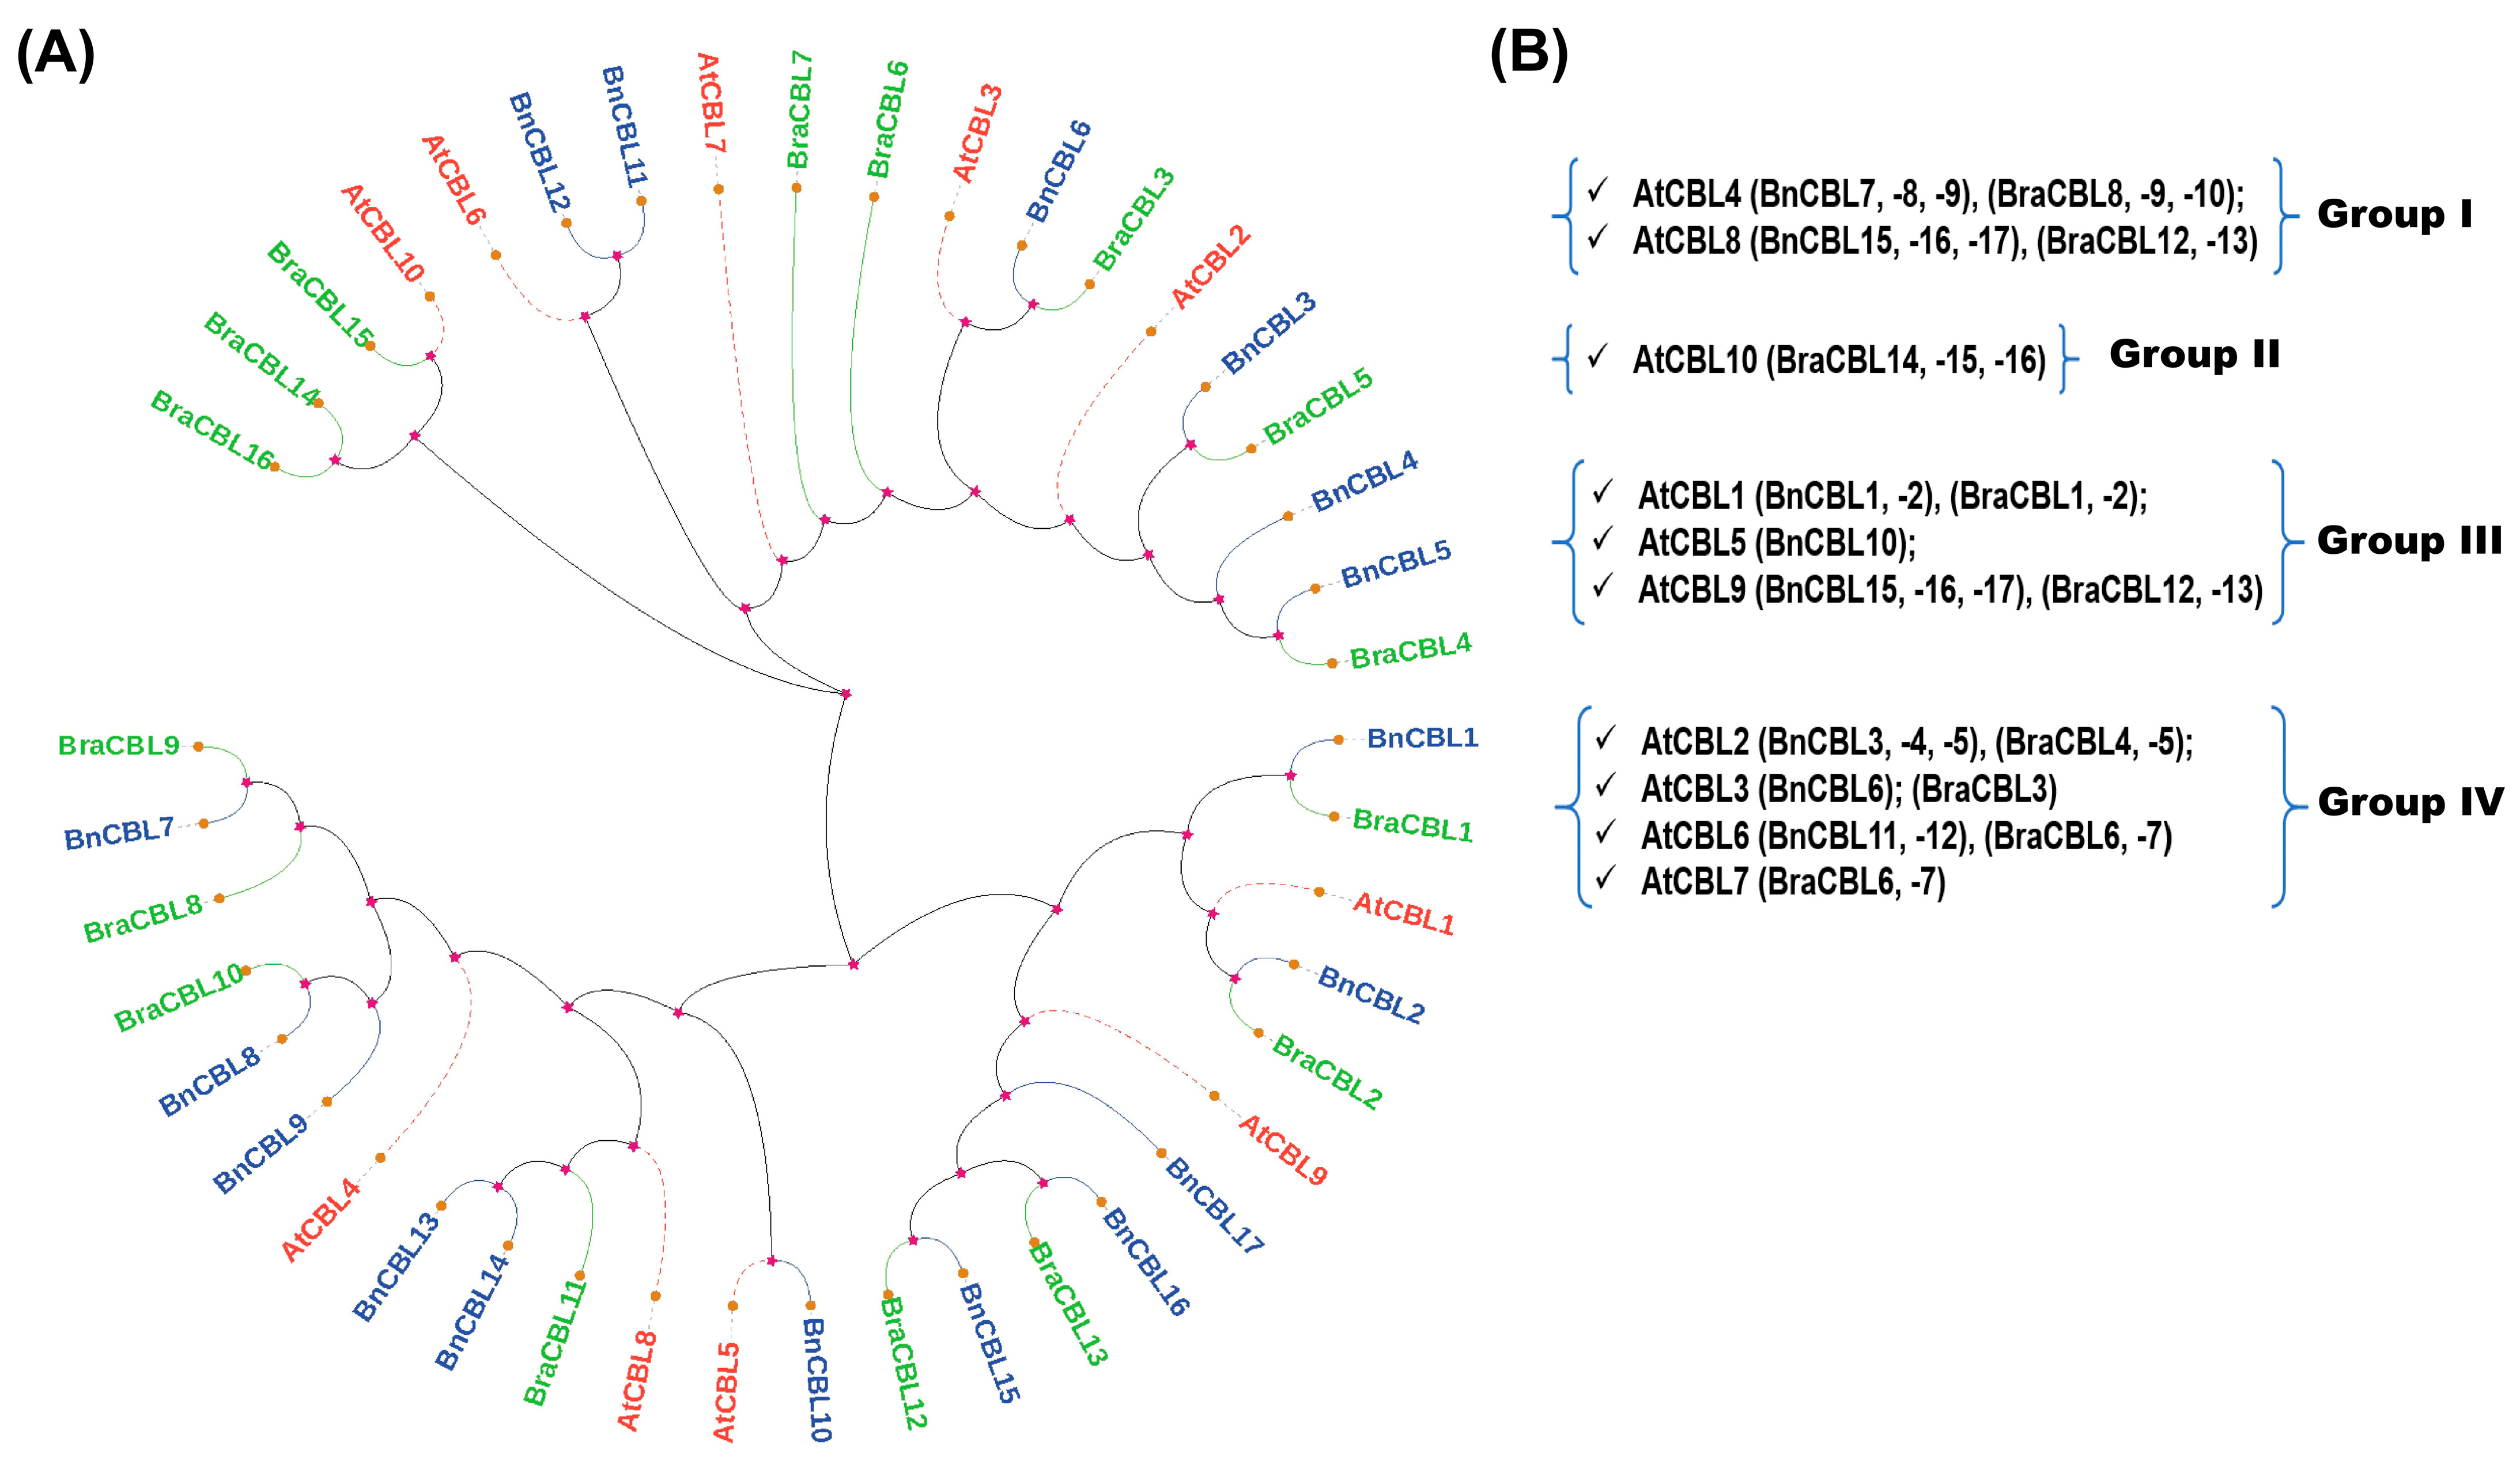
To explore the evolutionary dynamics of the BnCBL gene family, a maximum likelihood (ML) phylogenetic tree was constructed using 10 A. thaliana, 17 B. napus, and 16 B. rapa CBL proteins (Figure 1). The phylogenic analysis revealed that BnCBL proteins formed distinct clusters alongside their orthologs from A. thaliana and B. rapa, suggesting conserved evolutionary relationships. However, the number and distribution of CBL genes varied among the three species, indicating species–specific gene family expansion. Interestingly, the clade corresponding to AtCBL5 included BnCBL10 but lacked a B. rapa counterpart, implying possible gene loss or divergence in B. rapa. Conversely, no BnCBL was phylogenetically grouped with AtCBL7 and AtCBL10, pointing to the significant divergence of that lineage in B. napus. These findings suggest that the BnCBL family has undergone notable expansion and diversification distinct from both A. thaliana and B. rapa, likely due to genome duplication events and adaptation processes following polyploidization in B. napus.

2.2. Prediction of EFH-Domain, Motifs and Gene Structure of BnCBLs

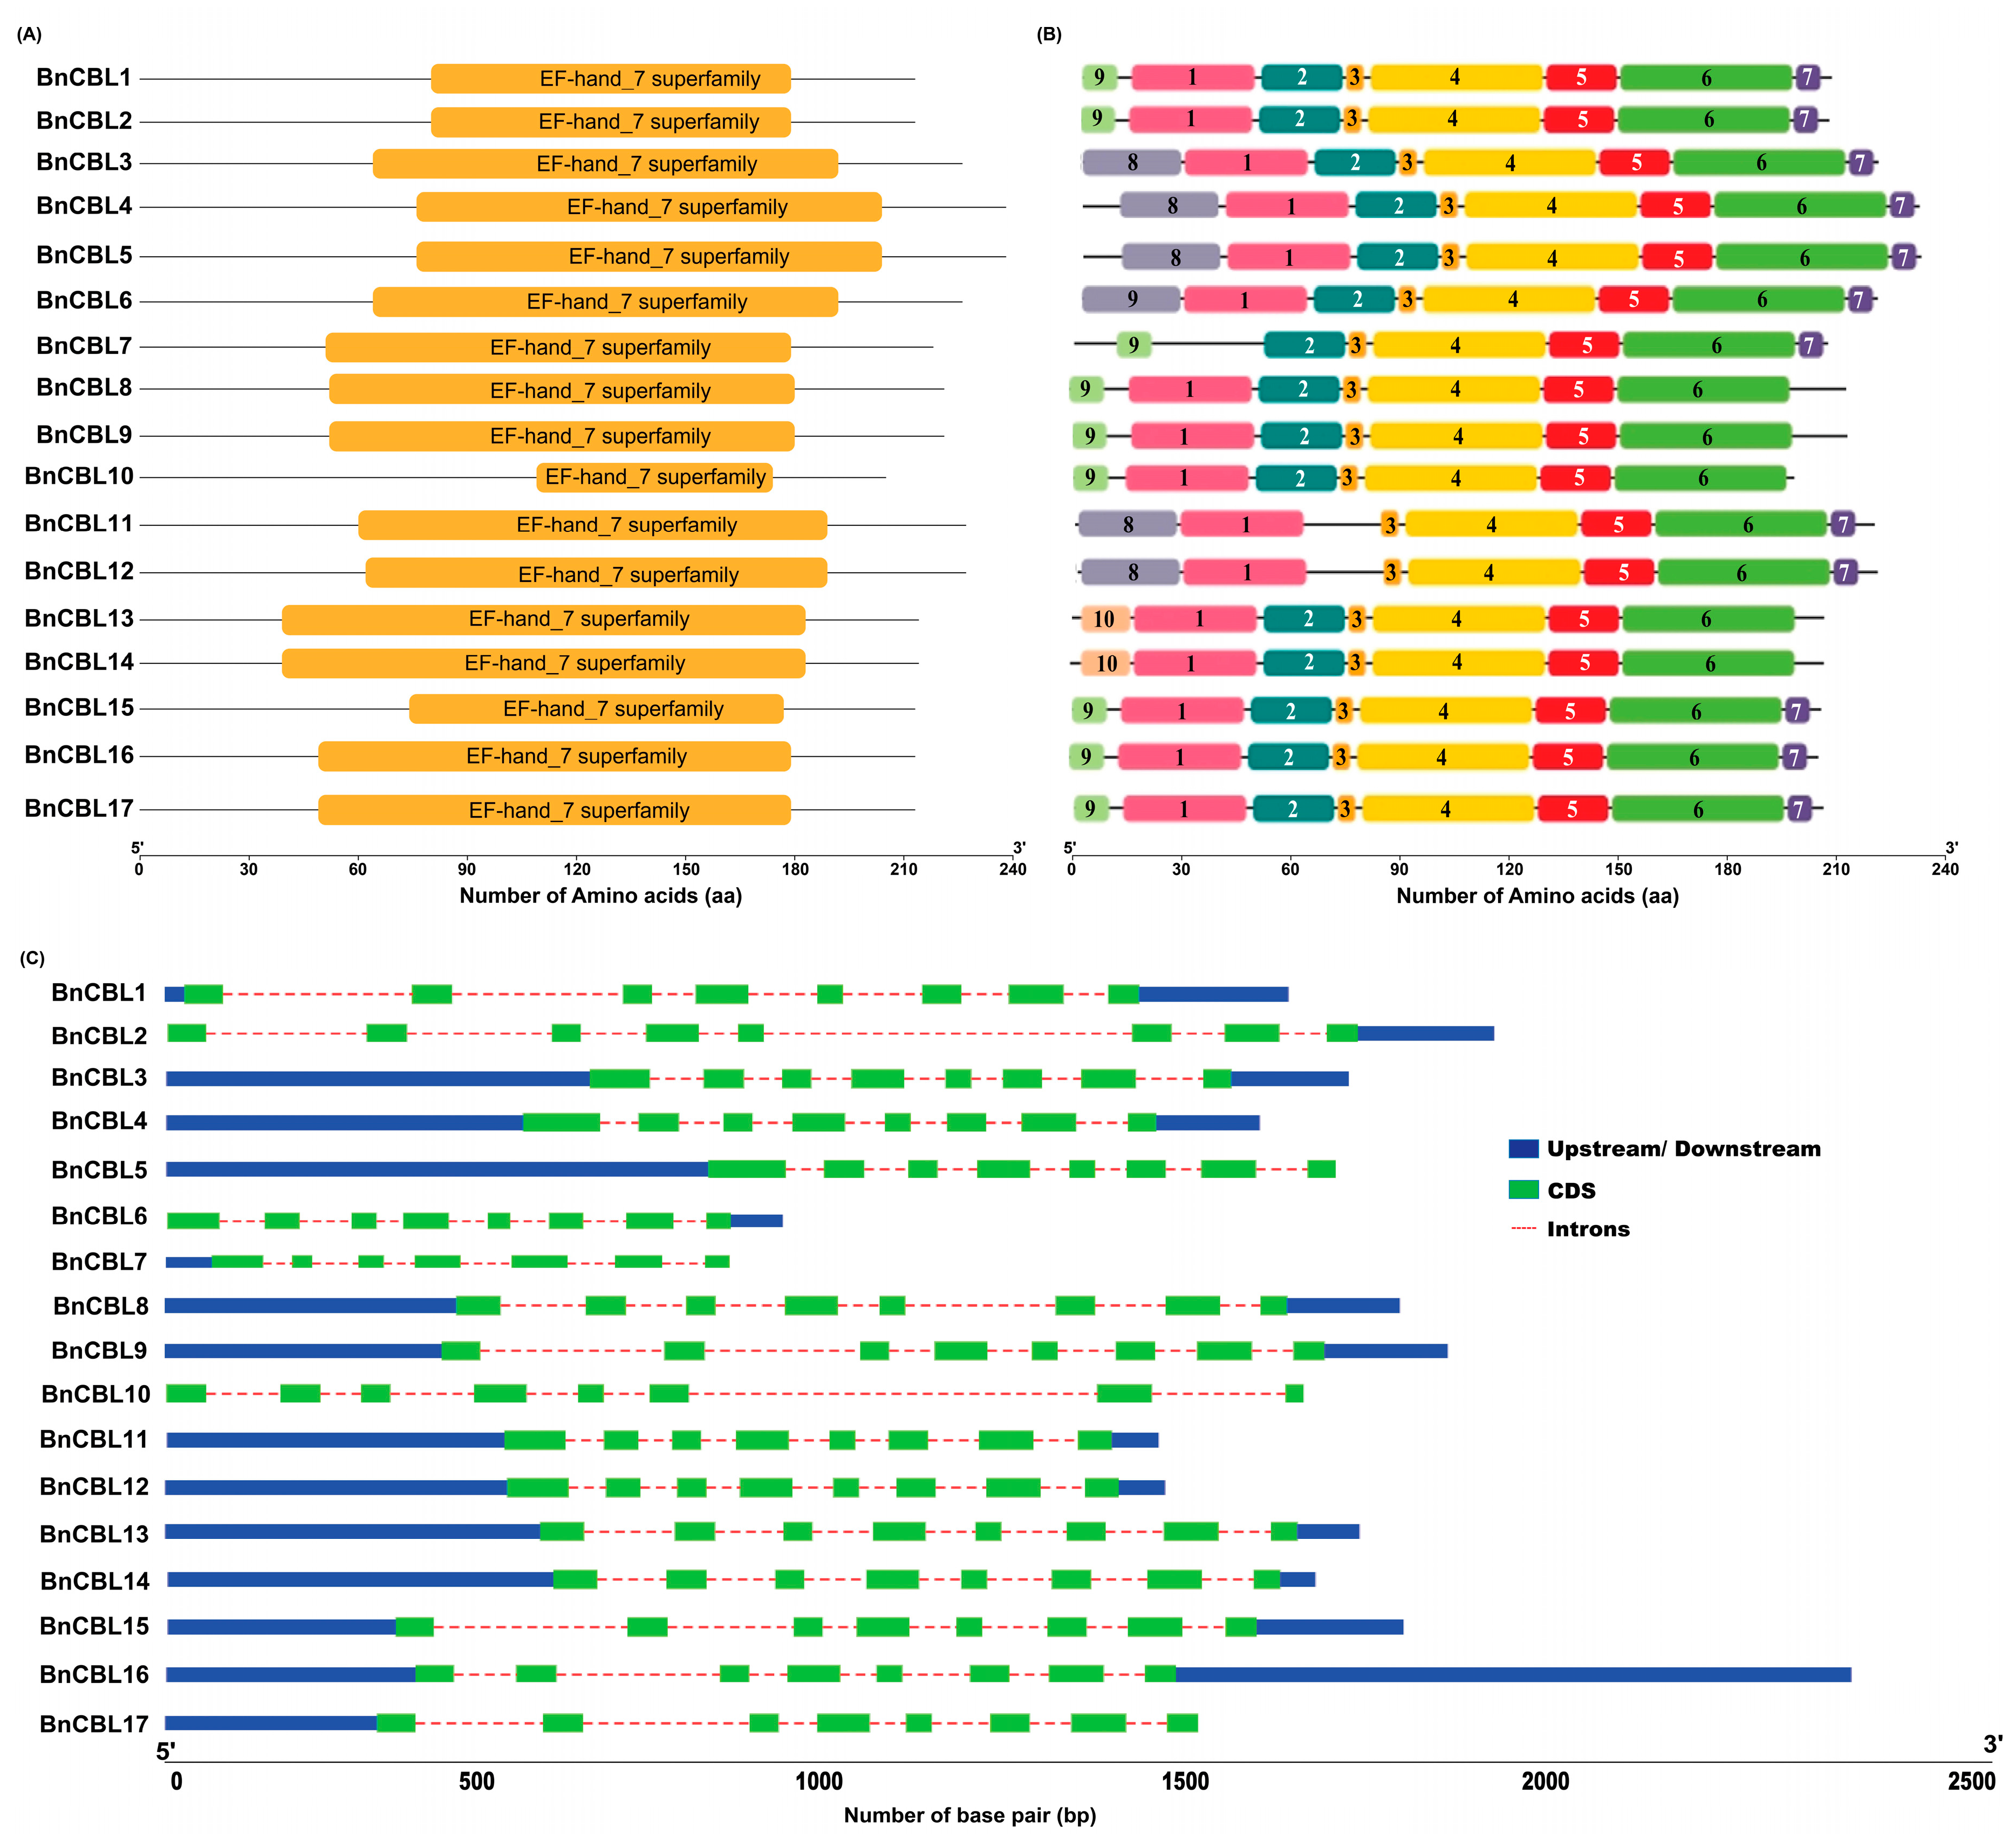
To find the functional domains in BnCBLs, domain prediction analysis was performed using the SMART database. Domain composition analyses revealed that all BnCBLs contained three EFH-domains (accession: SM000054) deciphering their functional potential in plant cell membranes (Table 1; Figure 2A). Whether the predicted EFH-domain is involved in the regulation of target genes needs to be verified experimentally.
To investigate the functions of BnCBLs, the Meme online tool was used to predict motifs in BnCBLs. Subsequently, 10 highly conserved motifs were generated ranging from 6 to 50 amino acids (Figure 2B). The predicted structures of BnCBLs had quite similar motif profiles throughout all BnCBLs with some exceptions, including motif ‘2’ which was exhibited among all BnCBLs except for BnCBL11 and BnCBL12. Similarly, there were six BnCBLs (BnCBL3, -4, -5, -6, -11 and -12) that contained motif ‘9’ in contrast with other BnCBLs. Interestingly, motif ‘10’ was predicted only in two BnCBLs (BnCBL13 and BnCBL14), and was absent in all identified BnCBLs. Likewise, motif ‘1’ was present in all of the BnCBLs (BnCBLs) except one protein (BnCBL7), which lacked this specific motif (motif 1) (Figure 2B). The motif logos and consensus sequences of these motifs were also predicted and are shown in Figure S2A,B.
We also examined the intron–exon architecture of BnCBLs to understand their structural organization. Most BnCBLs (except BnCBL7) exhibited six to seven introns and were considered as intron-rich CBLs, assuming that they descended from a common ancestral gene (Figure 2C). Together, these results indicated highly conserved gene structures among all BnCBLs. BnCBL proteins localized in the plasma membrane (BnCBL3, -9, -10, -12, -13, -15), chloroplast (BnCBL1, -4, -6, -7, -11, -16 and -17), cytoplasm (BnCBL2, -5, -14) and nucleus (BnCBL8) showed diversified localization in the plant cell (Table 1).

2.3. Sequence Alignment Analysis for BnCBLs

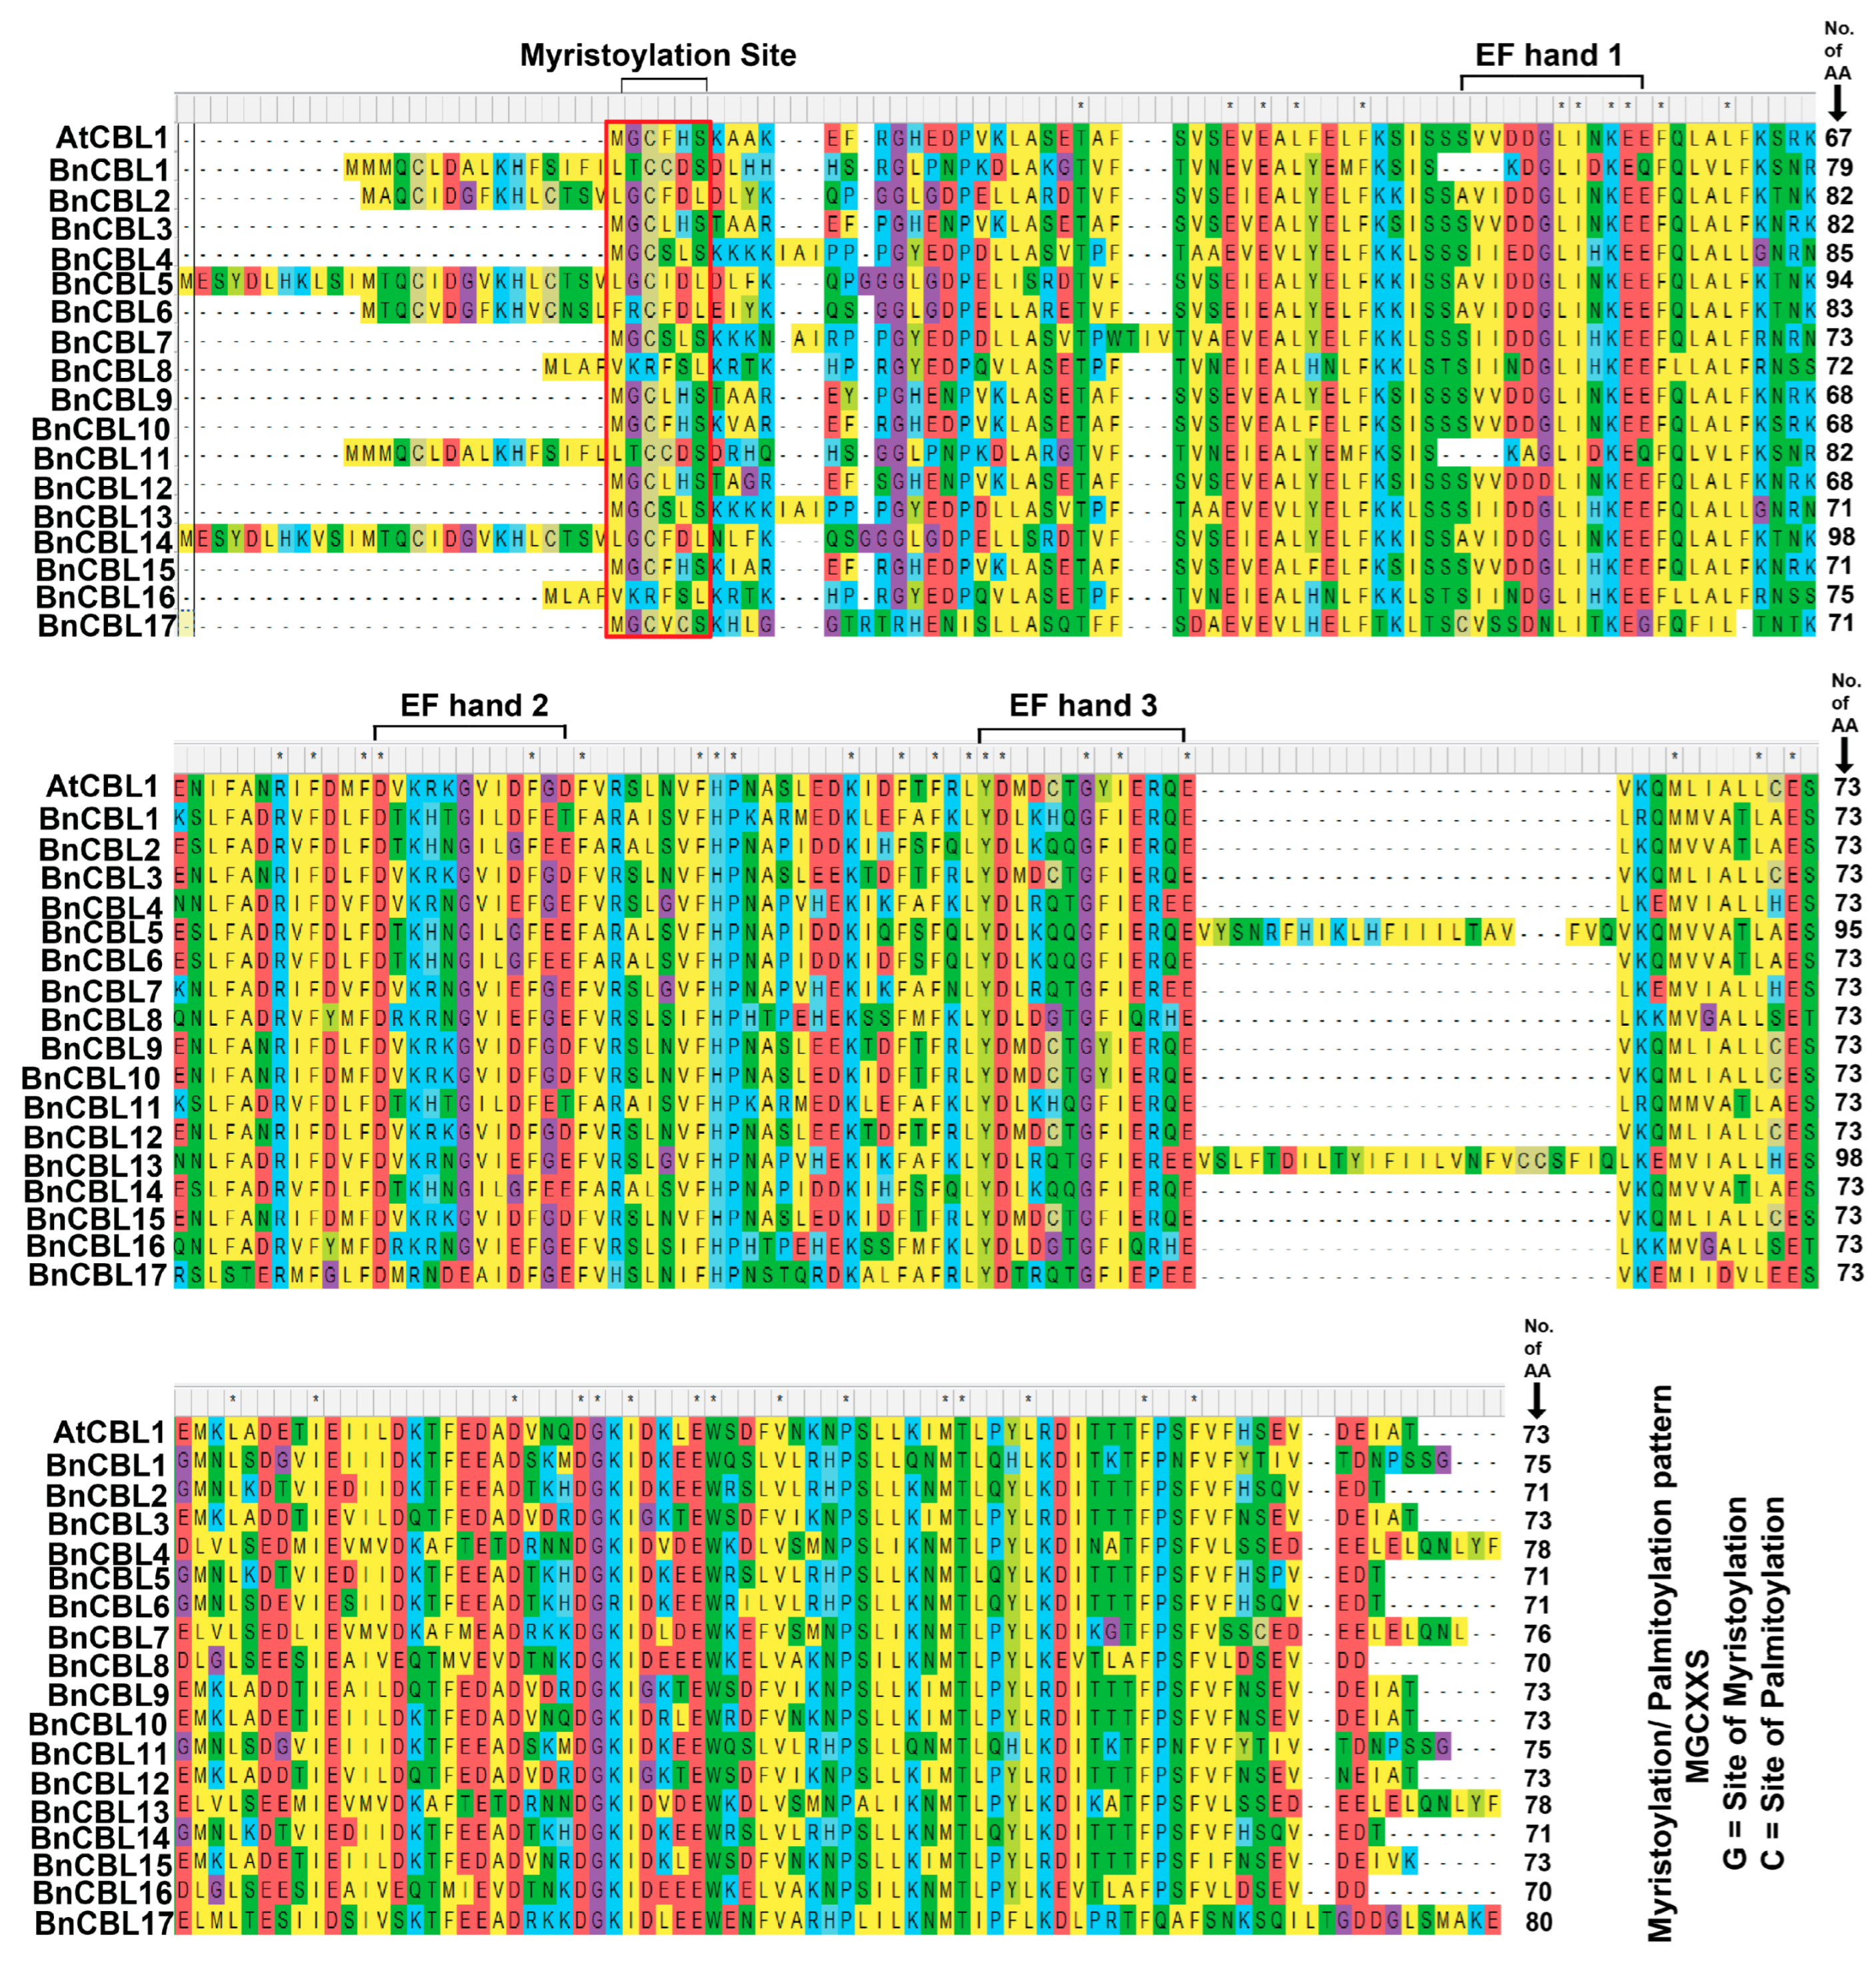
To identify the conserved regions and evolutionary relationship among BnCBL proteins, sequence alignment analysis was performed. For the reference sequence, AtCBL was used and aligned with all identified BnCBLs. The sequence analysis of BnCBLs’ amino acid residues indicated that they were highly conserved among each other and most of them (BnCBL3, -4, -7, -9, -10, -12, -13, -15 and -17) contained N-myristoylation/palmitoylation sites (MGCXXS). In this motif, ‘G’ was known as the ‘myristoylation site’ and ‘C’ was considered as the ‘palmitoylation site’. Moreover, the presence of myristoylation/palmitoylation sites suggests their membrane targeting and involvement in calcium-mediated stress signaling through CIPK recruitment. Furthermore, nine BnCBLs (BnCBL3, -4, -7, -9, -10, -12, -13, -15 and -17) with myristoylation motifs also contained predicted palmitoylation signals (MGCXXS/T), supporting their membrane association and potential functional specialization. Notably, the most conserved amino acid sites were located at positions 52, 53, 55 and 56; 80 and 89; and 116, 117, 122, 124 and 128 in the EF-hand 1, EF-hand 2 and EF-hand 3 domains, respectively (Figure 3). Overall, there were also several highly conserved amino acids found in all the BnCBL proteins, showing strong evolutionary relationships and similar functioning in plant cells. Nevertheless, whether these BnCBLs function as calcium channels awaits further experimental confirmation.

2.4. Promoter Analysis in BnCBLs

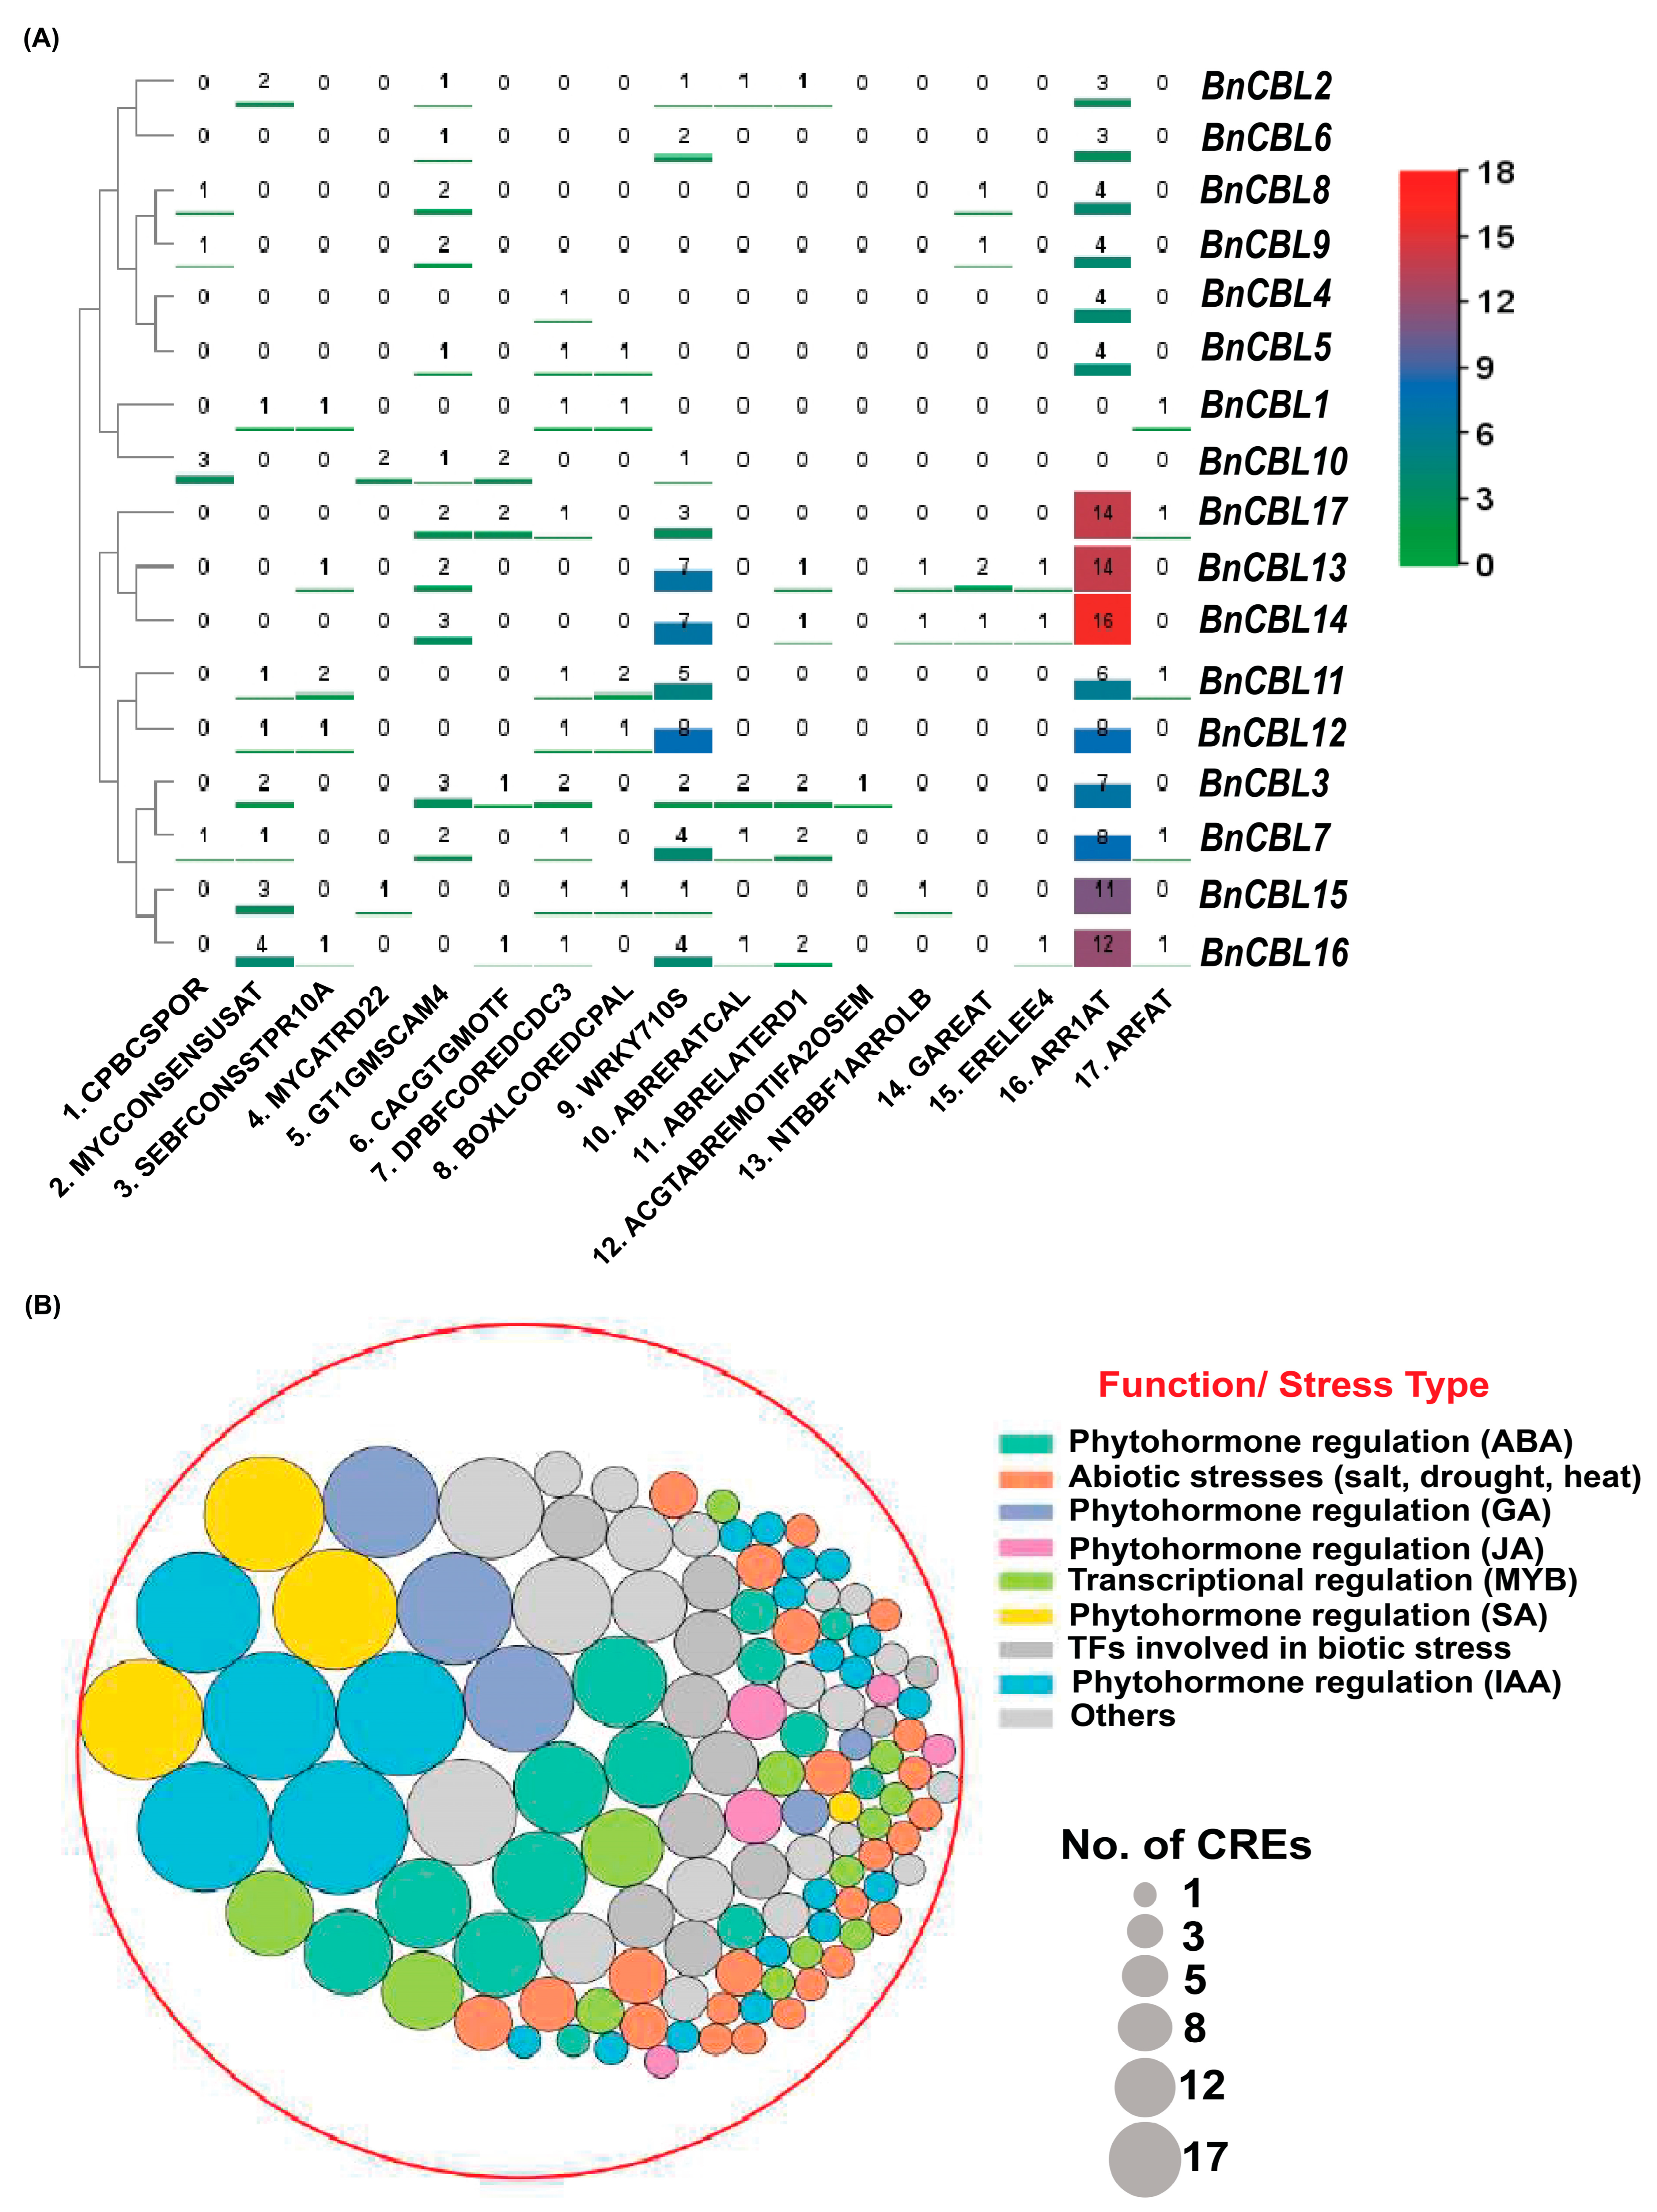
To infer the putative functions of BnCBL genes, cis-acting regulatory elements (CREs) in the maximum 2 kb-upstream sequence of BnCBL genes were examined using the PLACE database. Most of the B. napus were enriched with stress-related CREs predicting their functions in biotic or abiotic stresses in plants. BnCBLs contained several stress-responsive elements such as CPBCSPOR, MYCCONSENSUS, SEBFCONSSTPR10, MYCATRD2, GT1GMSCAM and CACGTGMOTIF. Some of the CREs were predicted to be restricted to specific BnCBLs, i.e., “MYCATRD22” was predicted only in BnCBL10 and BnCBL15; “SEBFCONSSTPR10” only in BnCBL1, -11, -12, -13 and -16. Two plant development-related CREs, DPBFCOREDCDC3 and BOXLCOREDCPAL, were also predicted in some of the BnCBLs (BnCBL1, -3, -4, -5, -7, -11, -12, -15, -16 and -17) and BnCBL1, -5, -11, -12, and -15, respectively. Additionally, most BnCBLs except five BnCBLs (BnCBL1, -4, -5, -8 and -9) contained WRKY-binding sites in their upstream region, indicating their importance in plant growth regulation. At last, some of the phytohormone responsive CREs were also predicted abundantly in BnCBLs’ promoters, comprising ABRERATCAL, ABRELATERD1, ACGTABREMOTIFA2OSEM, NTBBF1ARROLB, GAREAT, ERELEE4, ARR1AT and ARFAT. Out of them, one cytokinin-responsive CRE, named ARR1AT, was found abundantly in all BnCBLs except two BnCBLs (BnCBL1 and BnCBL10), while ABA, JA, IAA, SA and GA acid-responsive CREs were also found richly in BnCBLs (Figure 4A). From this CRE analysis, potential functions of BnCBLs can be predicted in several plant phenomena including biotic/abiotic stresses, phytohormone regulation and TFs, with each category represented by distinct colors, involved in biotic stress tolerance, clarifying their significant role in plant stress management (Figure 4B). Moreover, the signal sequences for each specific CRE are also identified in Figure S3. These results specified that the BnCBL family is likely to be involved in a variety of biotic and abiotic stress responses, albeit in distinct and specific ways.

2.5. Prediction of Phosphorylation, Glycosylation and SUMOylation Sites

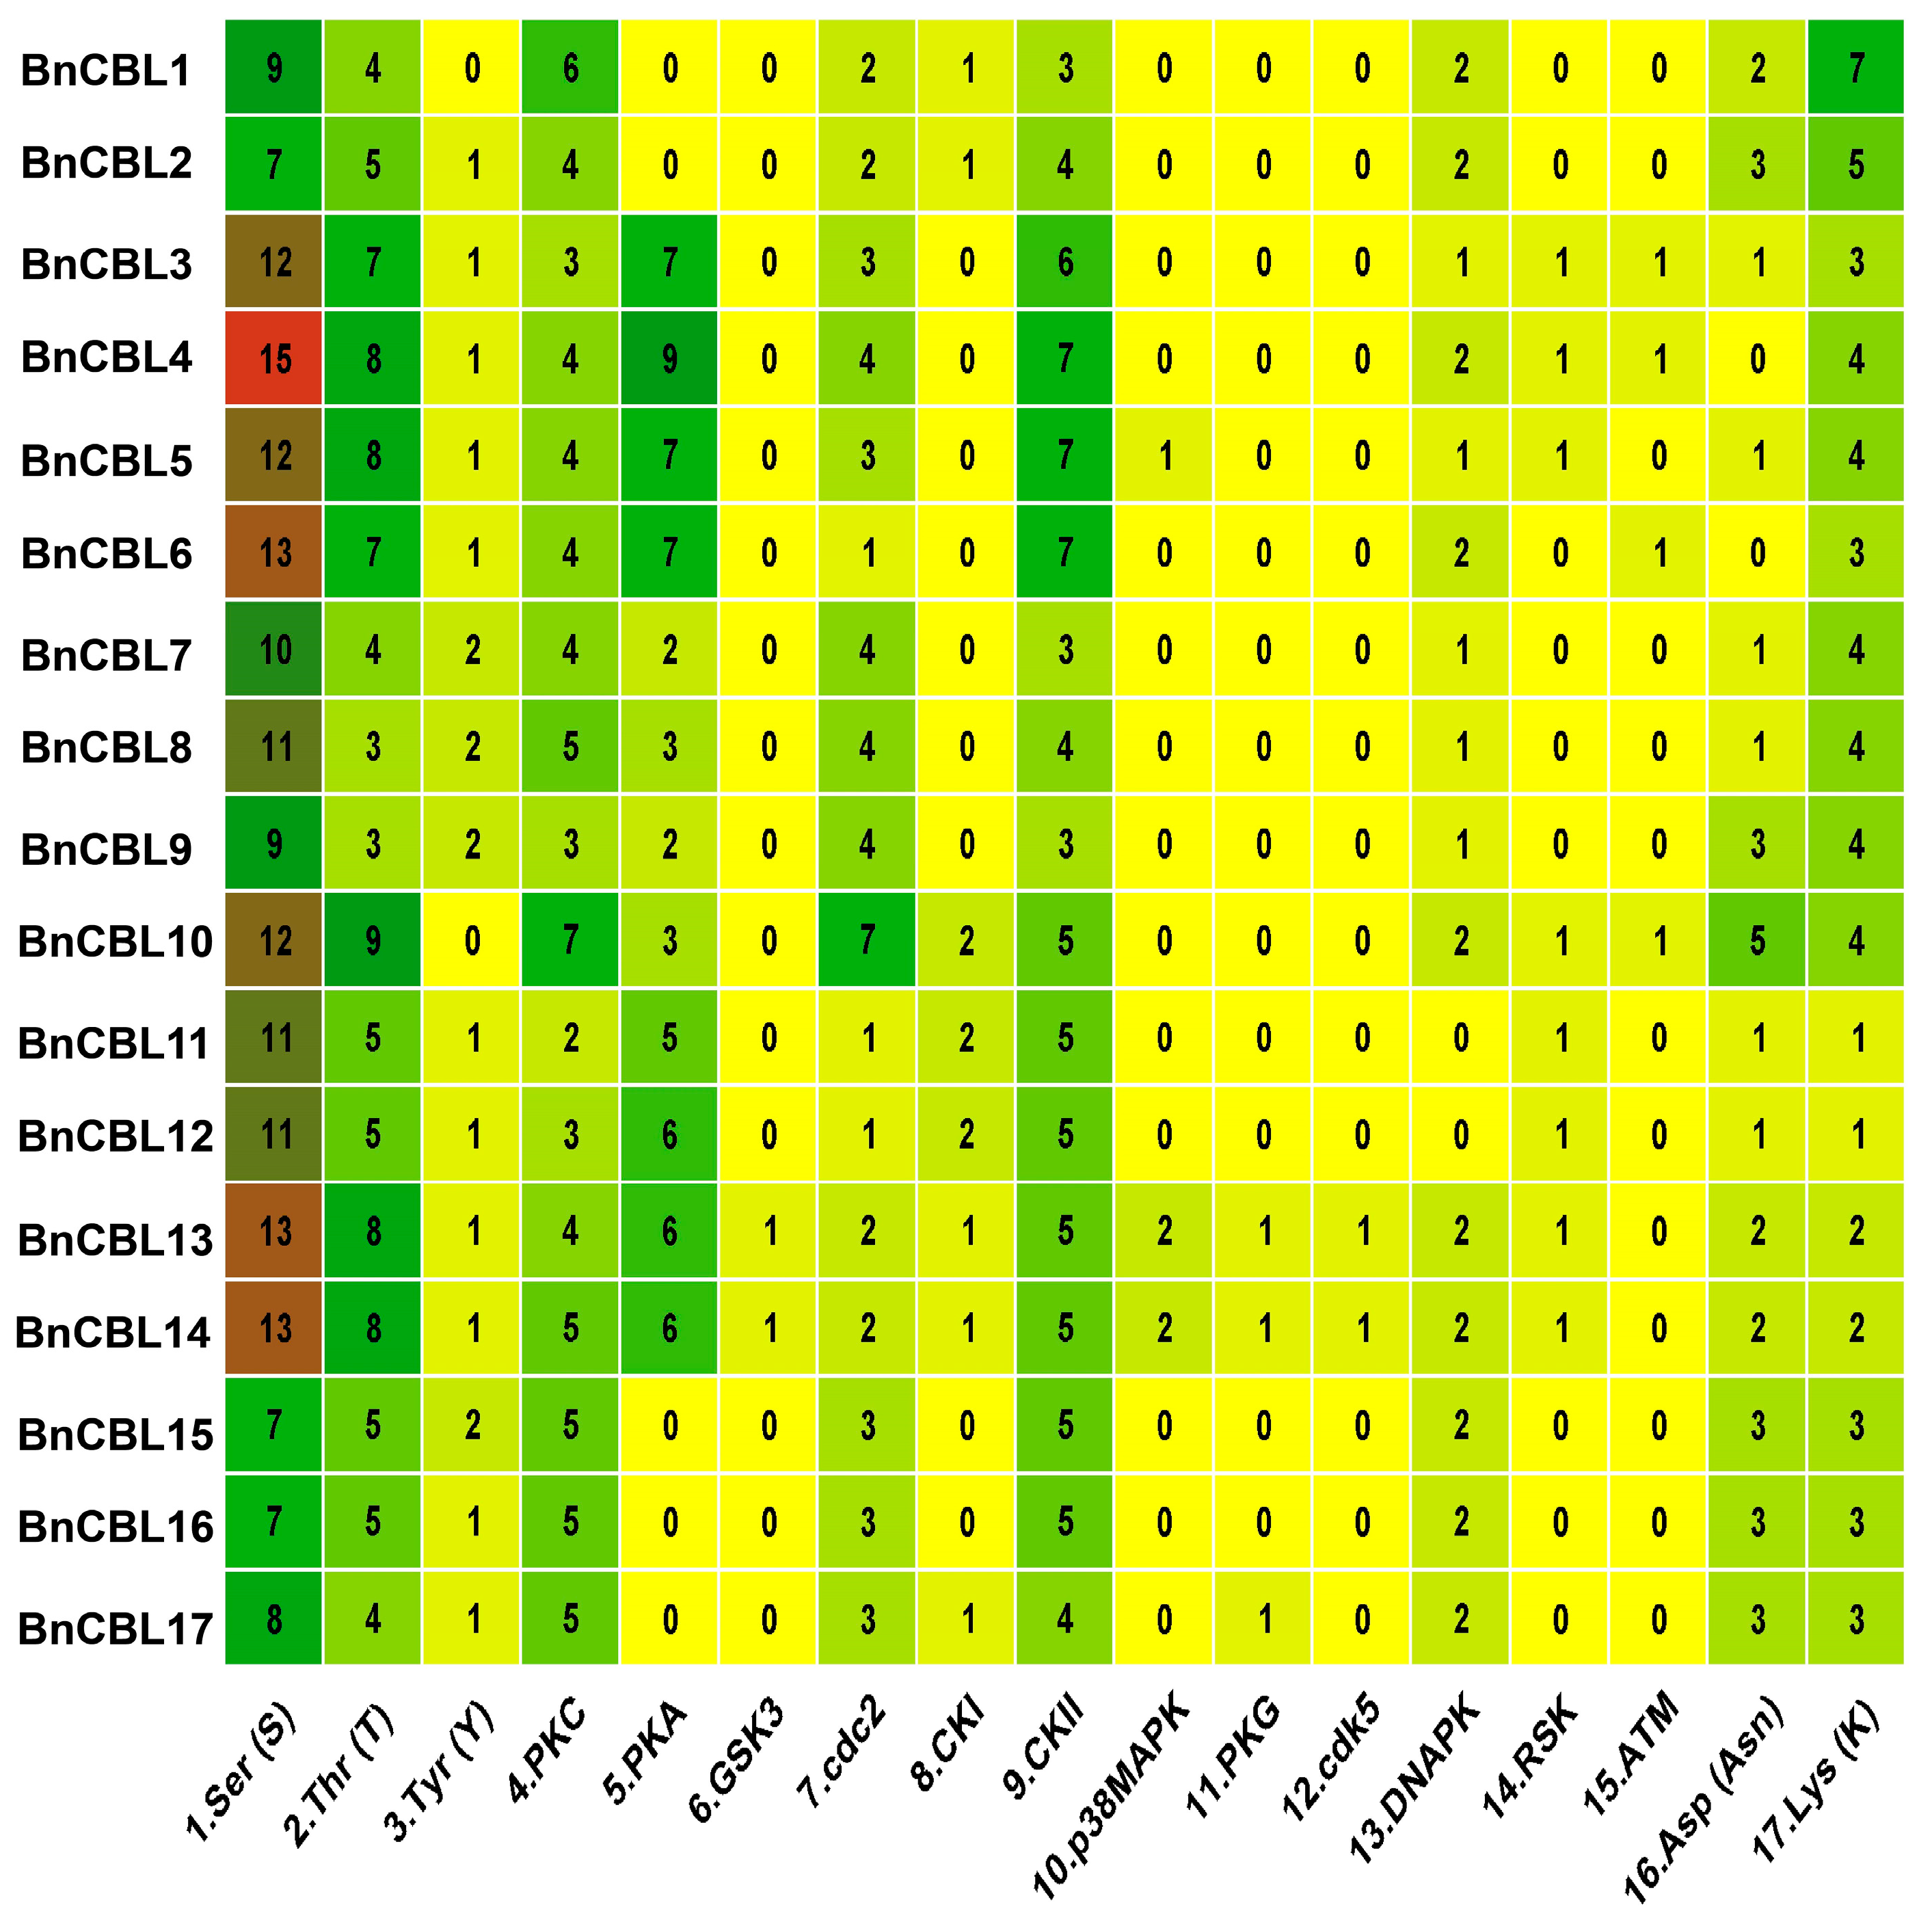
Phosphorylation sites were examined in BnCBLs at three amino acid residues, including Serine (ser), threonine (Thr) and tyrosine (Tyr). In general, all BnCBL proteins exhibited phosphorylation sites and their kinases. BnCBL4 had the highest number of potential serine phosphorylation sites (15), BnCBL10 contained nine potential threonine sites, and lastly, four BnCBLs (BnCBL7, -8, -9 and -15) had maximal tyrosine sites (2) (Figure 5). Additionally, the phosphorylation levels of protein kinase C (PKC) and protein kinase A (PKA) were noted to be the highest at about 73 and 63, respectively, among all BnCBLs. Among them, BnCBL10 contained seven PKCs and BnCBL4 had nine PKAs in their proteins. BnCBL13 and BnCBL14 each contained one GSK3 and one CDK5 site, representing the minimum number observed among all BnPSKs. These findings suggest that CBL proteins are likely to be regulated by phosphorylation.
Additionally, the glycosylation site on lysine residue (Asn) was predicted. Among all BnCBL proteins, BnCBL10 exhibited the maximum number of glycosylation sites (5), while BnCBL4 and BnCBL6 did not contain any glycosylation sites (asparagine) (Figure 5). As a result, most of the predicted CBLs contained ‘Asn’ residue, implying that CBL proteins can also be glycosylated.
SUMOylation sites on lysine residue (k) were found in all of the BnCBLs. A maximum of seven SUMOylation sites (K) were predicted in BnCBL1. The numbers of predicted SUMOylation sites in each BnCBL are clearly highlighted in the respective columns (Figure 5). The results obtained suggest that all BnCBLs might be potentially SUMOylated. The abundance of phosphorylation, glycosylation and SUMOylation sites indicated that they are potential BnCBLs, but this conclusion remains elusive and needs further experimental verification.

2.6. Homology Modelling of CBL Proteins in B. napus

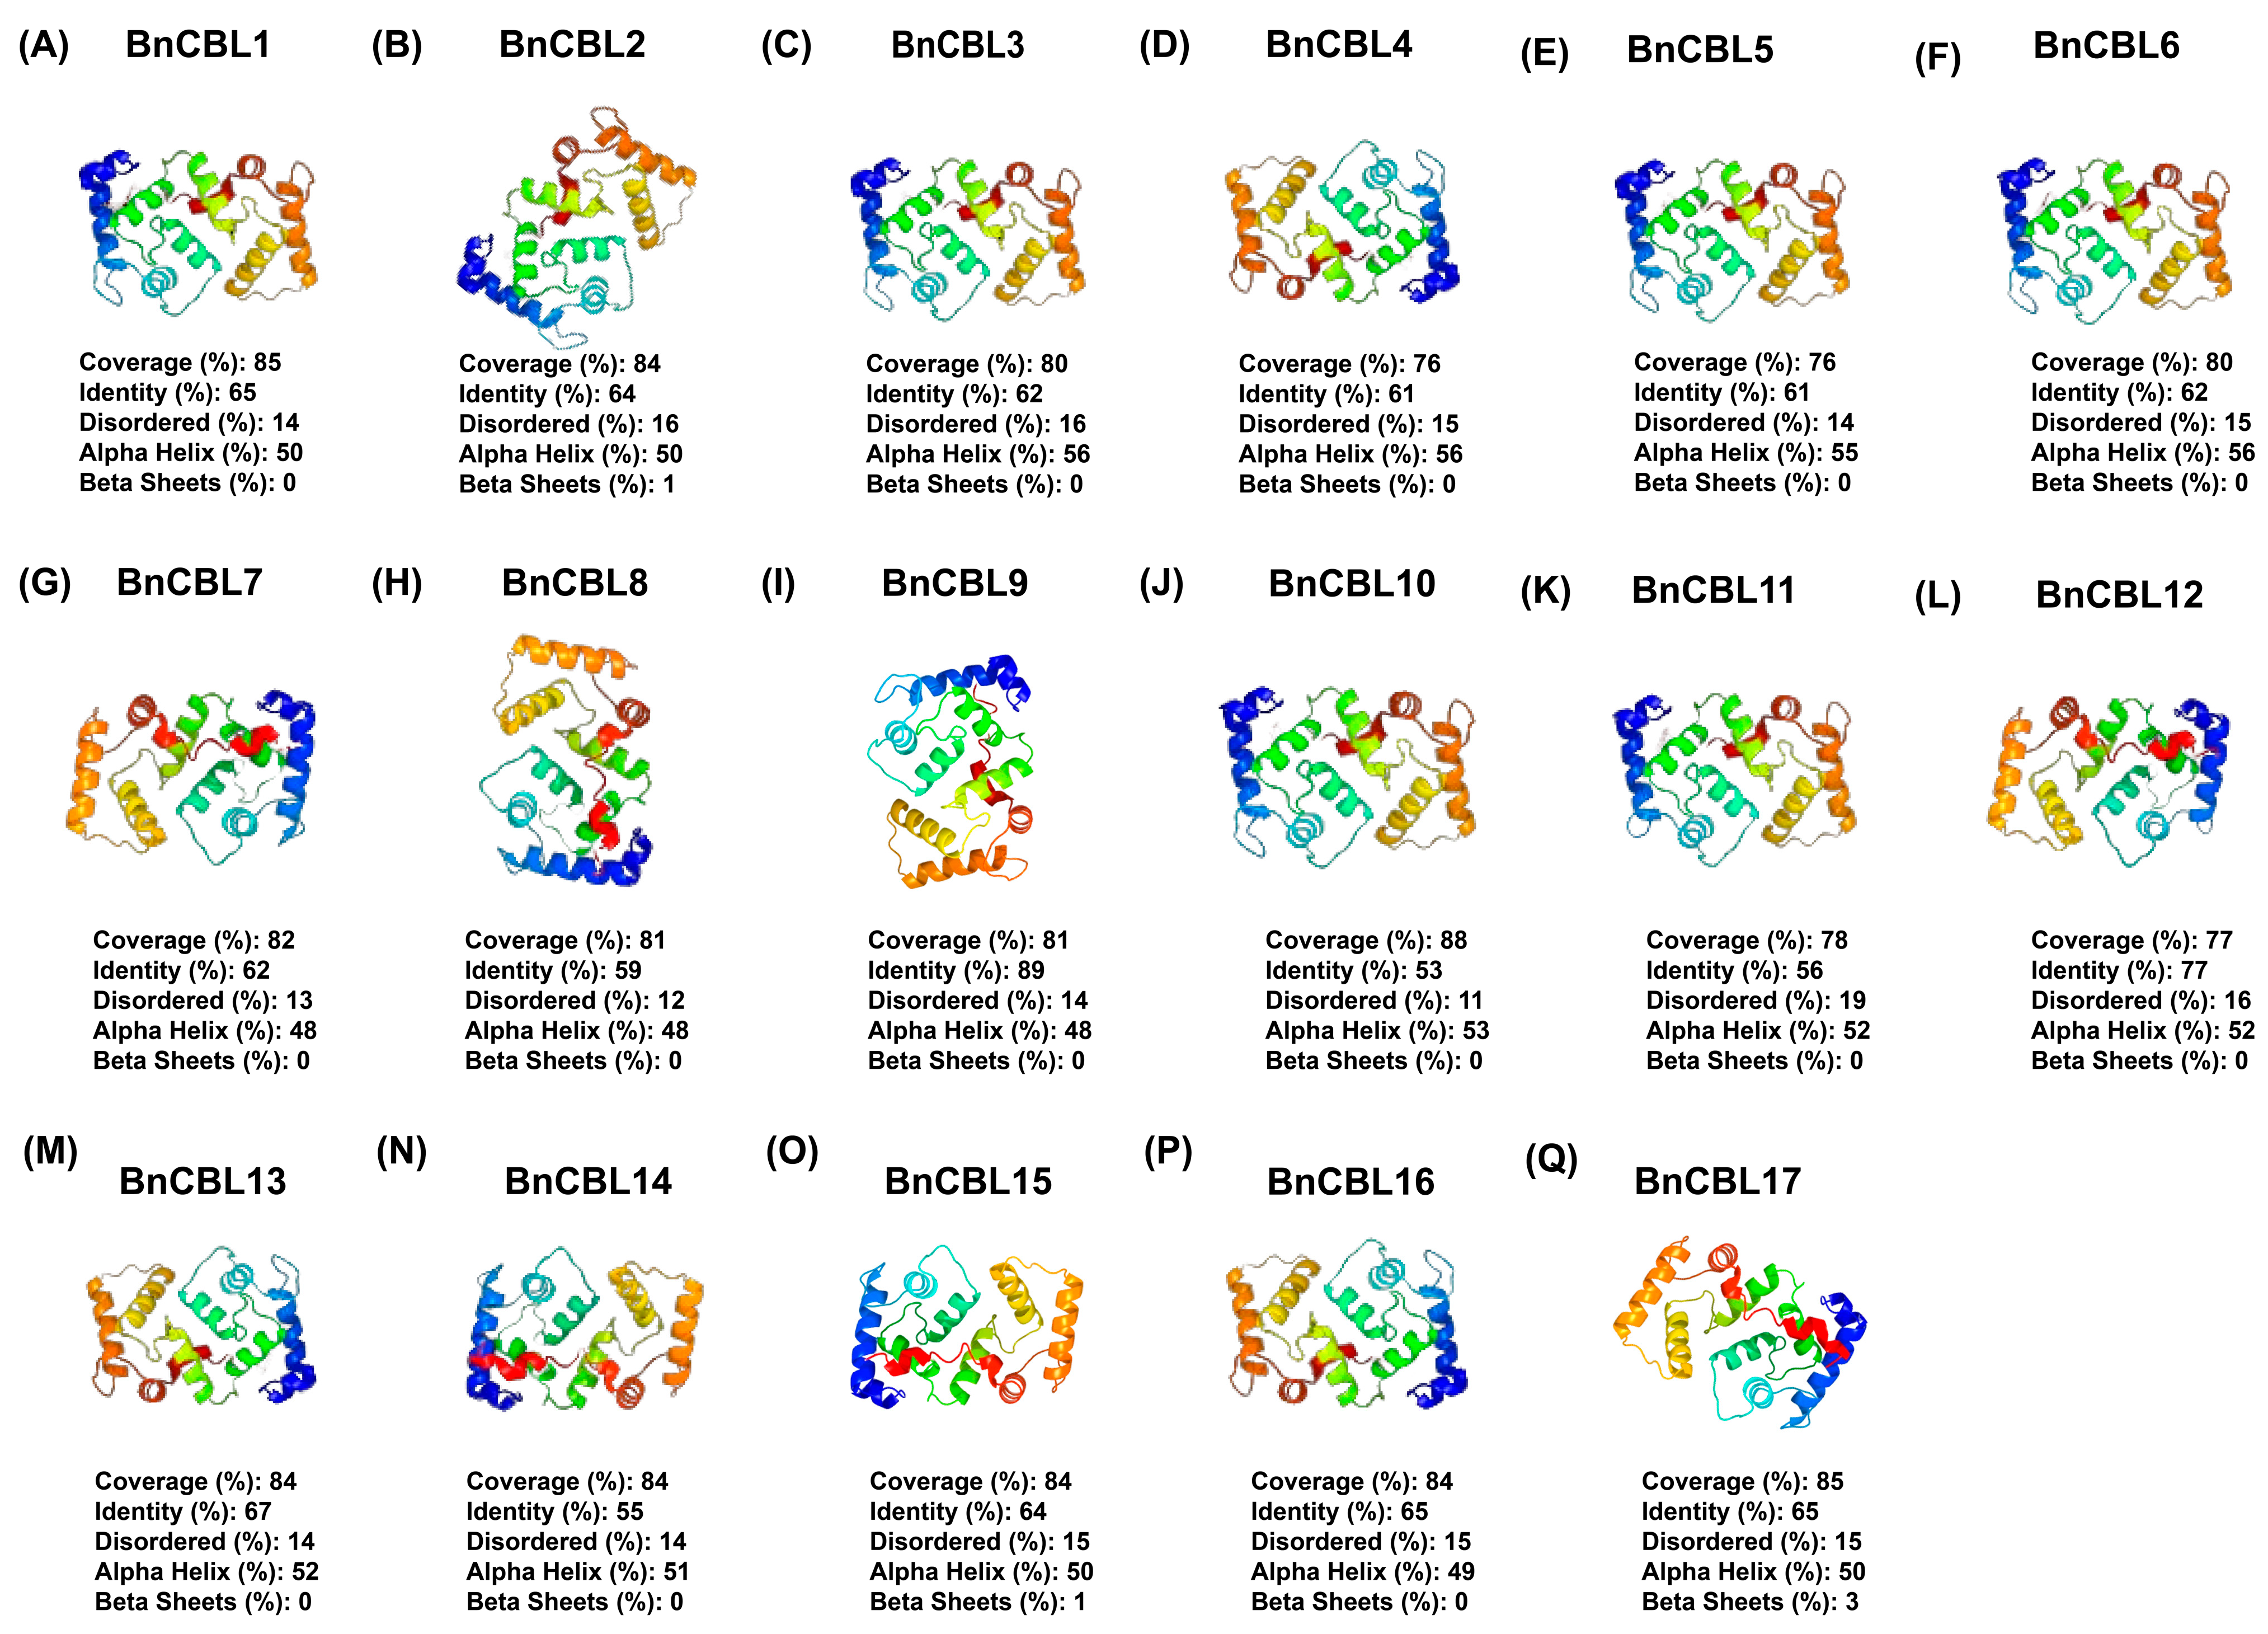
All B. napus CBL family members were three-dimensionally modeled using Phyre2 (Figure 5). The predicted models were based on the reported template (c2ehbA) to heuristically maximize the alignment coverage, percentage identity, and confidence score for the tested sequences. About 87–93% of the residues (with 74–86% coverage score) of the BnCBLs were matched with their respective corresponding model sequences, indicating that the BnCBL structural predictions are highly consistent. Secondary structures including α-helix (48–56%) and β-strands (1–3%) were examined: 48–56% and 1–3%, respectively. Additionally, superposition structures were utilized to measure the structural coverage percentages to verify the similarities and differences among generated models. In the current study, the AtCBL model template, c4z62A, was used to predict the tertiary BnCBLs’ structures with a highest confidence score of 99.9% (Figure 6). 3D modeling results revealed that these BnCBLs showed tertiary structure similarity, implying that BnCBLs may have evolved from the same ancestor sequence and/or under purification selection force to keep stabilization during long-term acclimation after the initial divergence.

2.7. In Silico Prediction Among BnCBLs and Their Interacting Partners

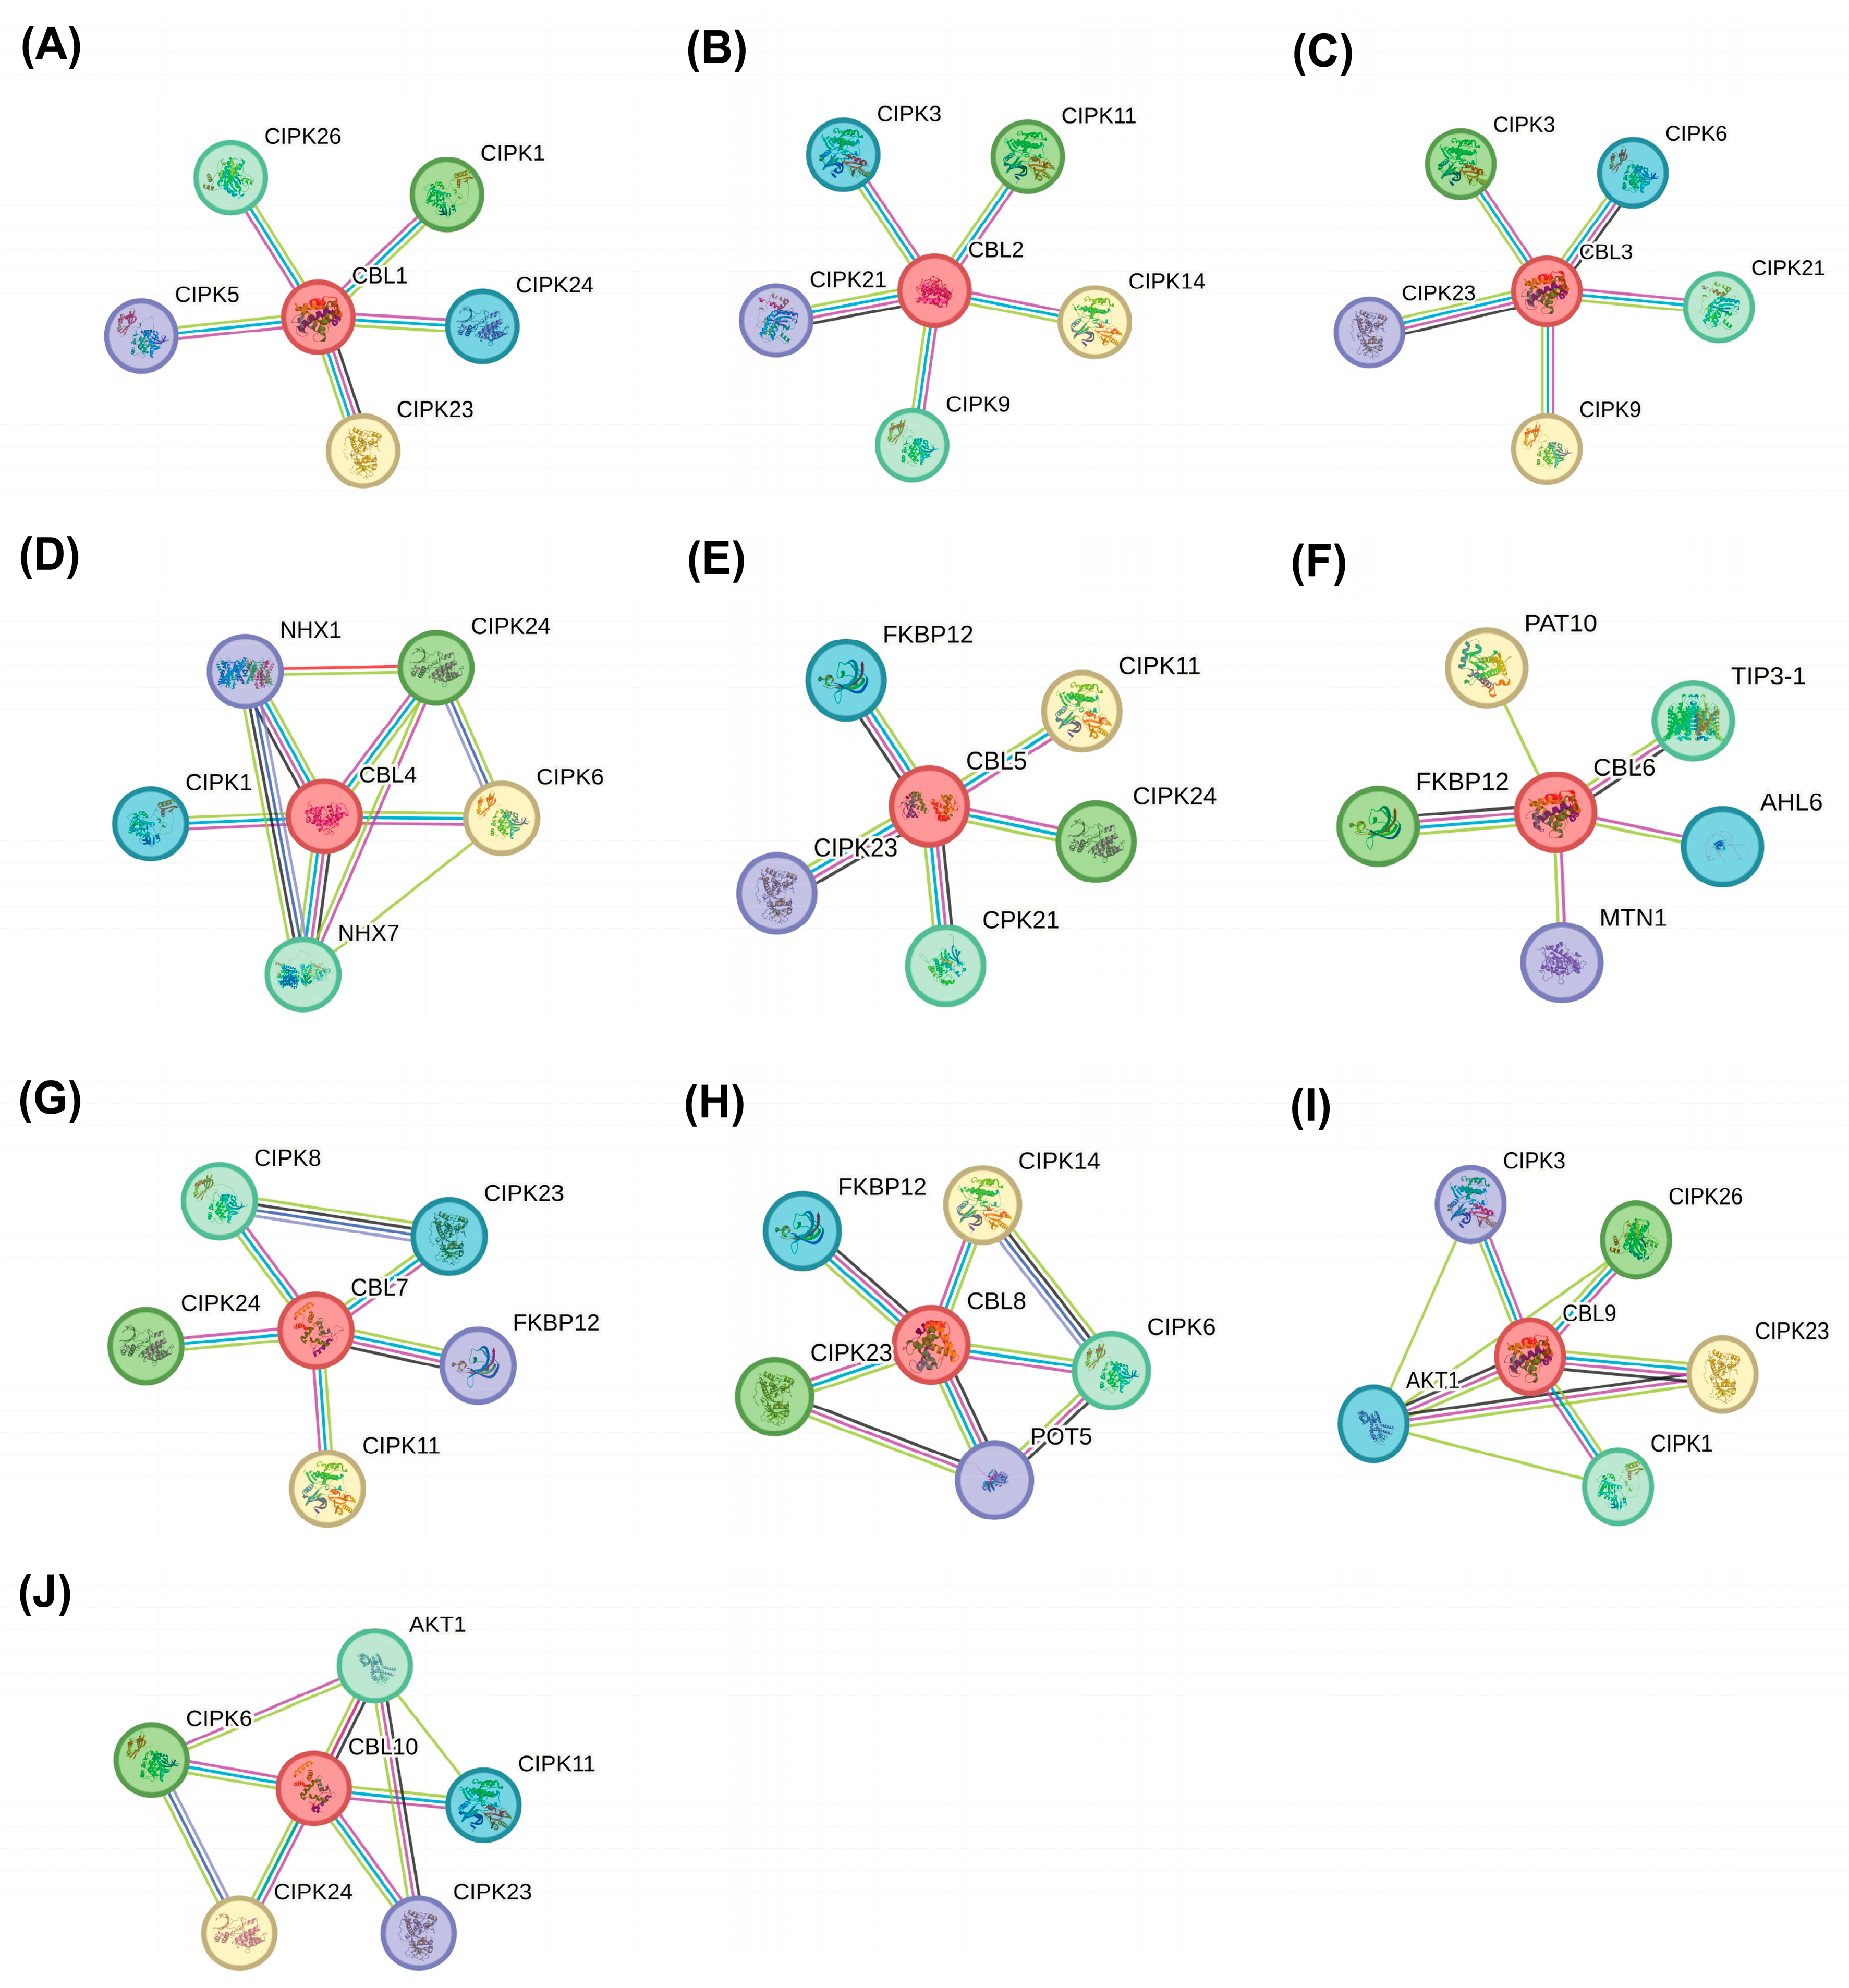
A protein interaction network (PPI) was visualized utilizing the STRING database to explore the functional roles of BnCBLs via their interaction with other proteins, integrating computationally predicted associations. To construct the Brassica CBL interaction network, homologs from A. thaliana were employed as references. As illustrated in (Figure 7), multiple AtCBL homologs displayed shared potential interactions with proteins, such as CLPK1, -3, -5, -6, -8, -9, -11, -14, -21, -23, -24, -26—a family of chloroplast-localized Casein Kinase 1-like proteins known to phosphorylate plastid RNA-binding proteins (pRBPs). This post-translational modification regulates mRNA stability, splicing, and translation, which are critical for sustaining photosynthetic activity under salt stress. Other notable interactions included NHX1 and NHX7, two sodium/hydrogen exchangers that contribute to Na+ sequestration into vacuoles, thus enhancing salt tolerance. Further interacting proteins included FKBP12 (FK506-binding protein 12), which improves salt tolerance via its peptidyl-prolyl isomerase activity, potentially stabilizing proteins under stress conditions [29]. The Protein S-Acyl Transferase 10 (PAT10) was also identified, which facilitates palmitoylation of CBL–CIPK signaling components, targeting them to the plasma membrane and tonoplast, thereby playing a crucial role in stress signaling [30]. Additionally, AKT1 (Arabidopsis K+ Transporter 1), a plasma membrane-localized K+ channel, was predicted to interact with CBLs, likely contributing to K+/Na+ balance under saline conditions, supporting ionic homeostasis [17]. Finally, AHL6 (AT-hook motif nuclear localized protein 6) was also among the predicted interactors, potentially involved in regulating ABA and auxin-responsive pathways, which are essential under osmotic and salt stress [31]. Collectively, these predicted interactions suggest that BnCBL proteins may be involved in stress adaptation mechanisms via interacting with other stress-related proteins, but their interaction results need to be validated by further experimental verification.

2.8. Expression Profiling of BnCBLs Using RNA-Seq Data

2.8.1. Expression Patterns in Different Plant Parts

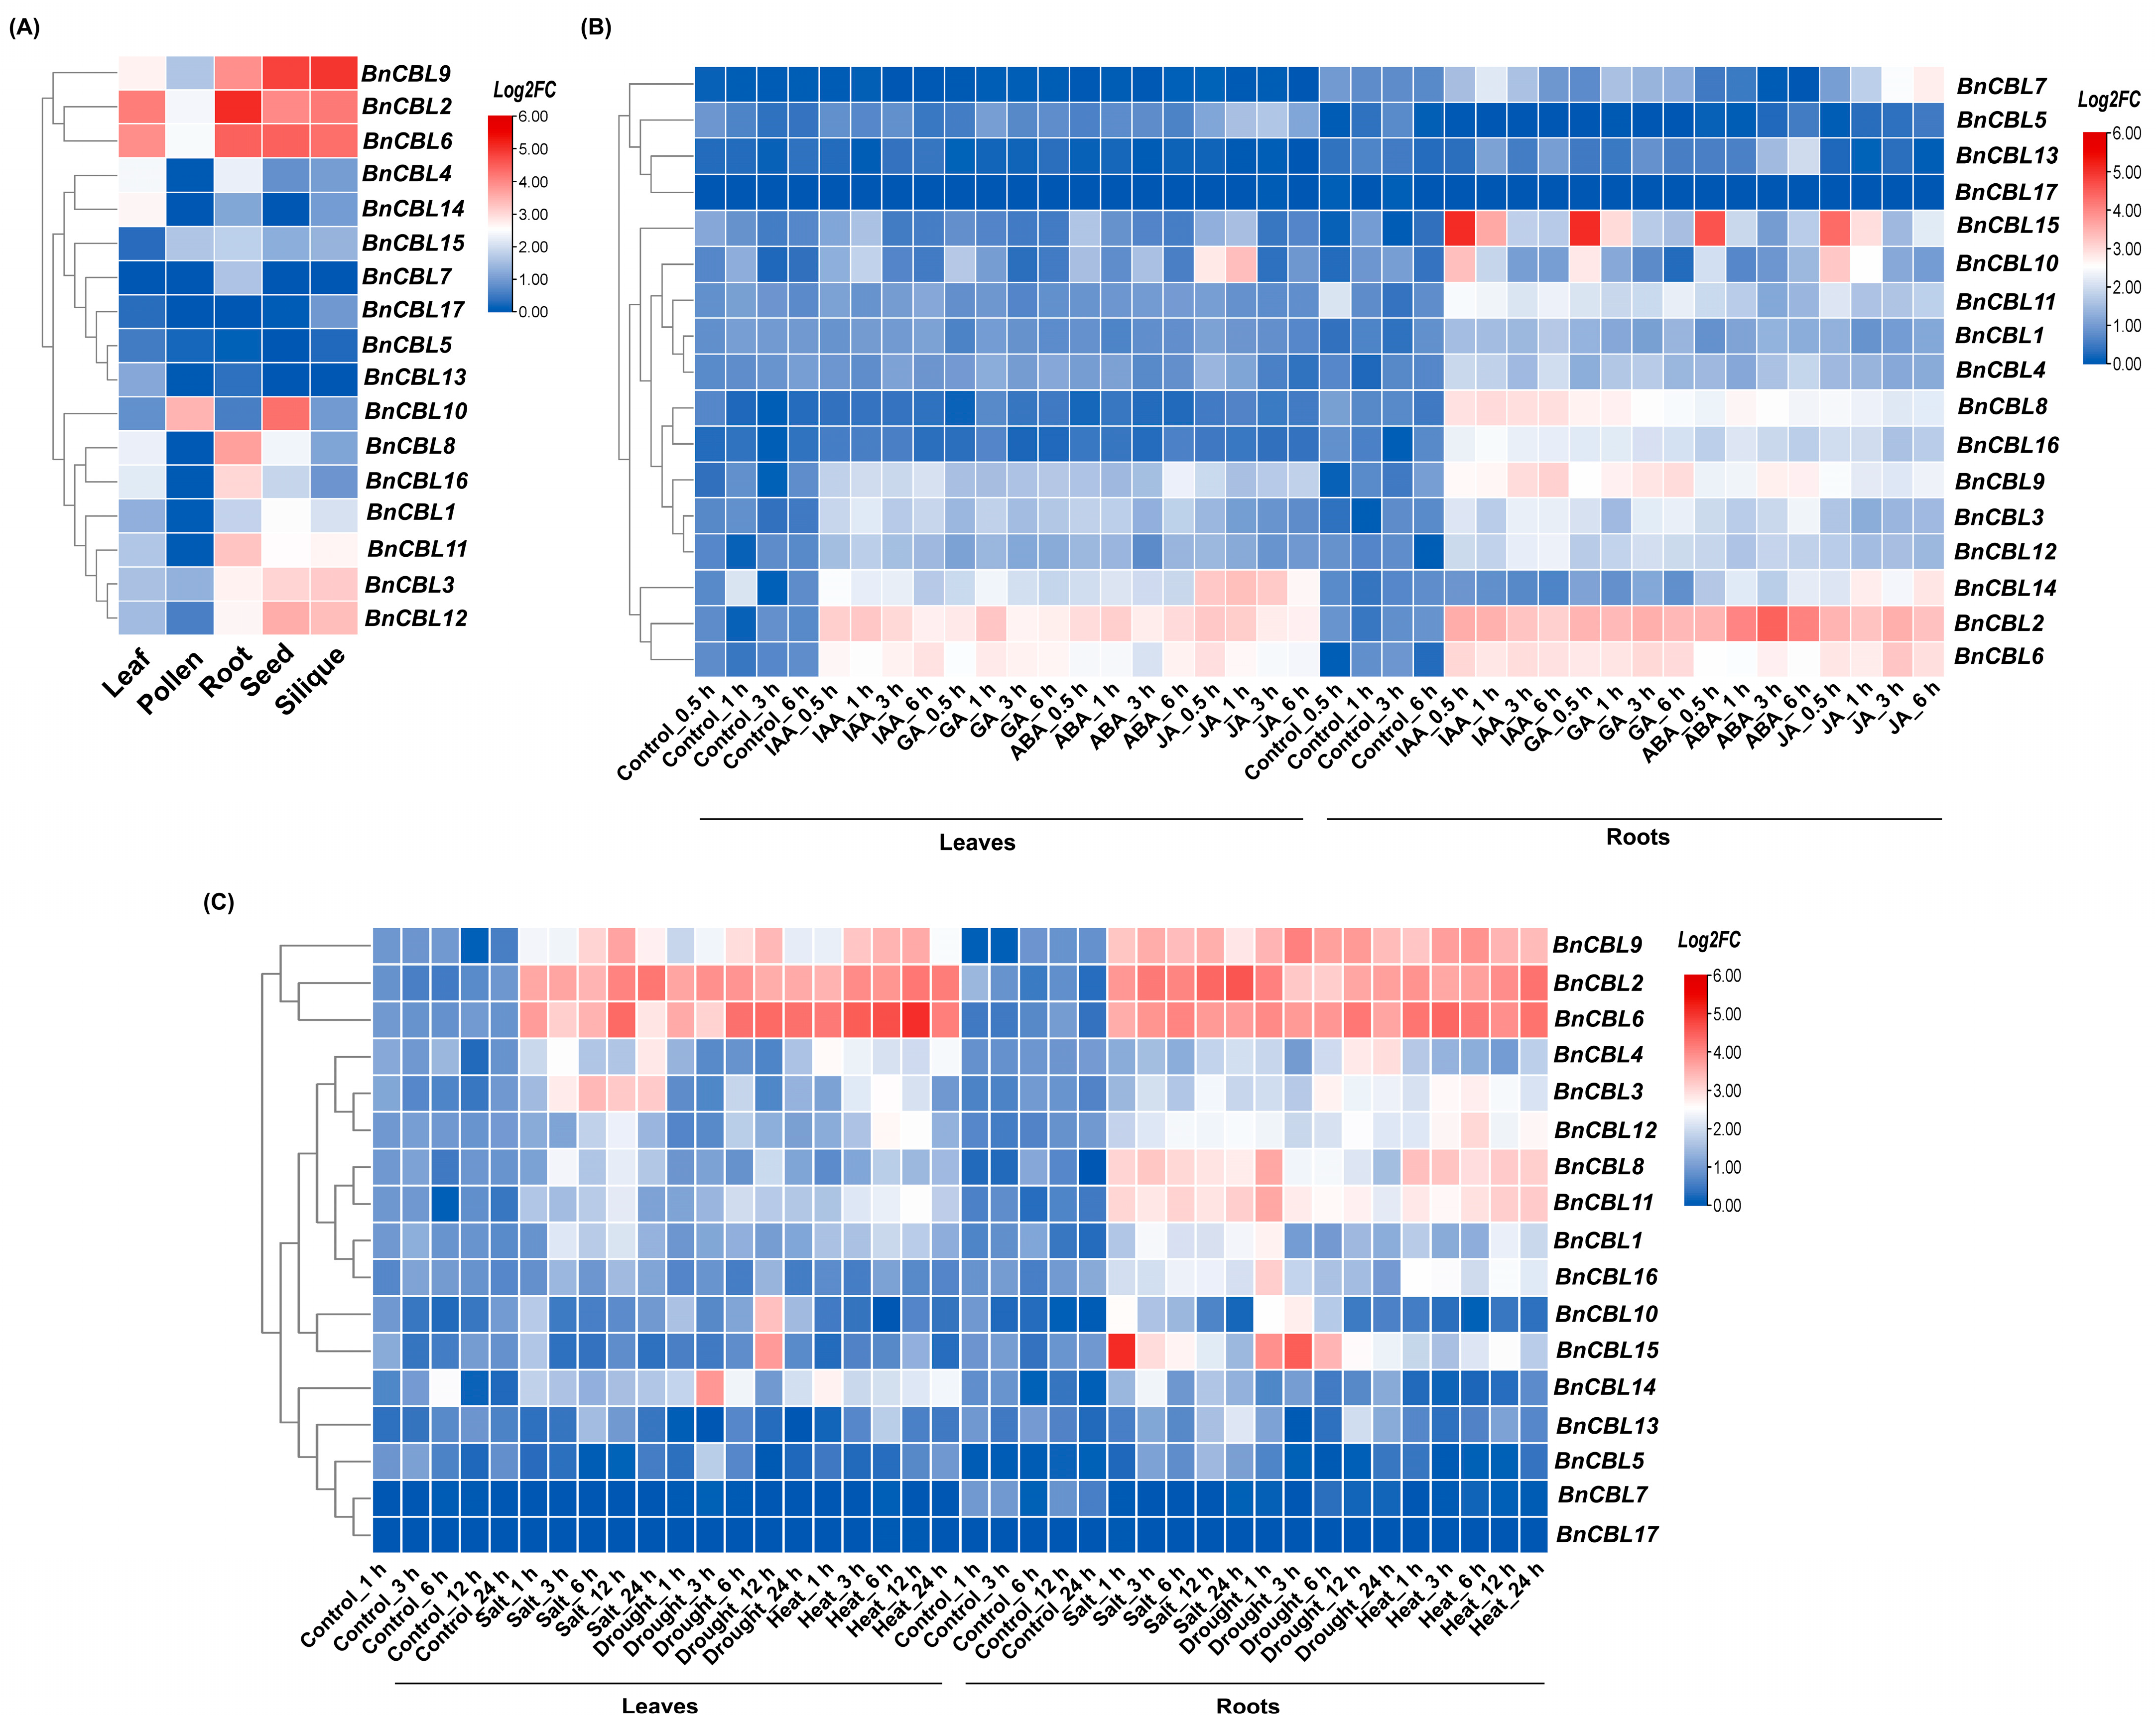
Expression profiling for BnCBLs was quantified using data (RNA-Seq) available on the BnIR database. The expression values (Transcripts Per Kilobase per Million mapped reads, TPM value converted into log2 FC) were obtained from five different plant tissues including leaf, pollen, root, seed and silique. All identified BnCBLs have tissue-specific expression patterns. For example, BnCBL2 and BnCBL6 were expressed significantly in plant leaves, roots, seed and silique (except in pollen), while BnCBL9 showed significant transcriptional expression in roots, seed and pollen. Two BnCBLs, BnCBL10 and BnCBL12, showed enhanced transcript levels in plant seeds as compared to the other plant parts. Most of the BnCBLs were expressed (either significantly or not) in all plant parts. The expression of the above-mentioned genes in specific tissues could predict their prominent role in these distinct tissues involving the growth and development of B. napus plants (Figure 8A).

2.8.2. Expression Profiling of BnCBLs Following Phytohormone Treatments

To obtain certain clues about regulatory functions of BnCBLs in phytohormone (IAA, GA, ABA and JA) signaling pathways, RNA-Seq data was quantified in plant roots and leaves. The data was analyzed at different time frames (0.5 h, 1 h, 3 h and 6 h). Two BnCBLs, BnCBL2 and BnCBL6, were significantly induced in both of the respective plant parts, leaves and roots. The expression dynamics for BnCBL2 and BnCBL6 indicated higher expressions after 3 h of ABA application and after 1 h of JA application in plant roots and leaves, respectively, with ~5- and ~3-fold increases. One gene, BnCBL15, expressed significantly just after 0.5 h of application of all respective phytohormones in plant roots (~4–5-fold), indicating its importance in plant-hormone mechanisms, while in plant leaves, its expression was induced but at a relatively lower (~2-fold), quite similar to that of BnCBL10 (~2–3-fold). For BnCBL9, the expression pattern had reached the maximum (approximately ~1–2-fold) after 3 h and 6 h post-application of IAA, GA and ABA in the plant roots. On the contrary, in plant leaves, its expression was also noticed to be significant but relatively reduced (~1–2-fold). These results possibly suggest that not all but some of the BnCBLs might have crucial roles in phytohormone-responsive tolerance mechanisms (Figure 8B).

2.8.3. Transcriptional Regulation of BnCBLs Under Multiple Abiotic Stresses

The expression profiling for BnCBLs were conducted to explicate the abiotic stress response mechanisms in oilseed rape utilizing RNA-Seq data in both leaves and roots at specific time intervals (1 h, 3 h, 6 h, 12 h, and 24 h). Three BnCBL genes including BnCBL2, BnCBL6 and BnCBL9 were induced significantly under abiotic stresses (salt, drought and heat), showing ~3–5-fold increases in both plant parts (leaves and roots). BnCBL15 experienced maximum transcriptional regulation after just 1 h of salt stress (~5-fold) and 3 h of drought stress (~4.5–5-fold) in plant roots, but its expression in plant leaves was significantly reduced at 12 h post drought stress treatment (~2.5–3-fold). The expression of BnCBL10 was quantified relatively higher (~2.5-folds) in plant leaves as compared to plant roots (~1.5-folds) under drought stress treatment (12 hpt). Two BnCBLs (BnCBL8 and BnCBL11) exhibited significant expression patterns in plant roots (~2–3.5-fold), and surprisingly, its expression reduced in plant leaves drastically (~1–1.5-fold), indicating their possible functions in plant stress tolerance.

2.9. Transcriptional Profiling of BnCBLs Using RT-qPCR

2.9.1. Transcriptional Regulation of BnCBLs in Plant Parts via RT-qPCR

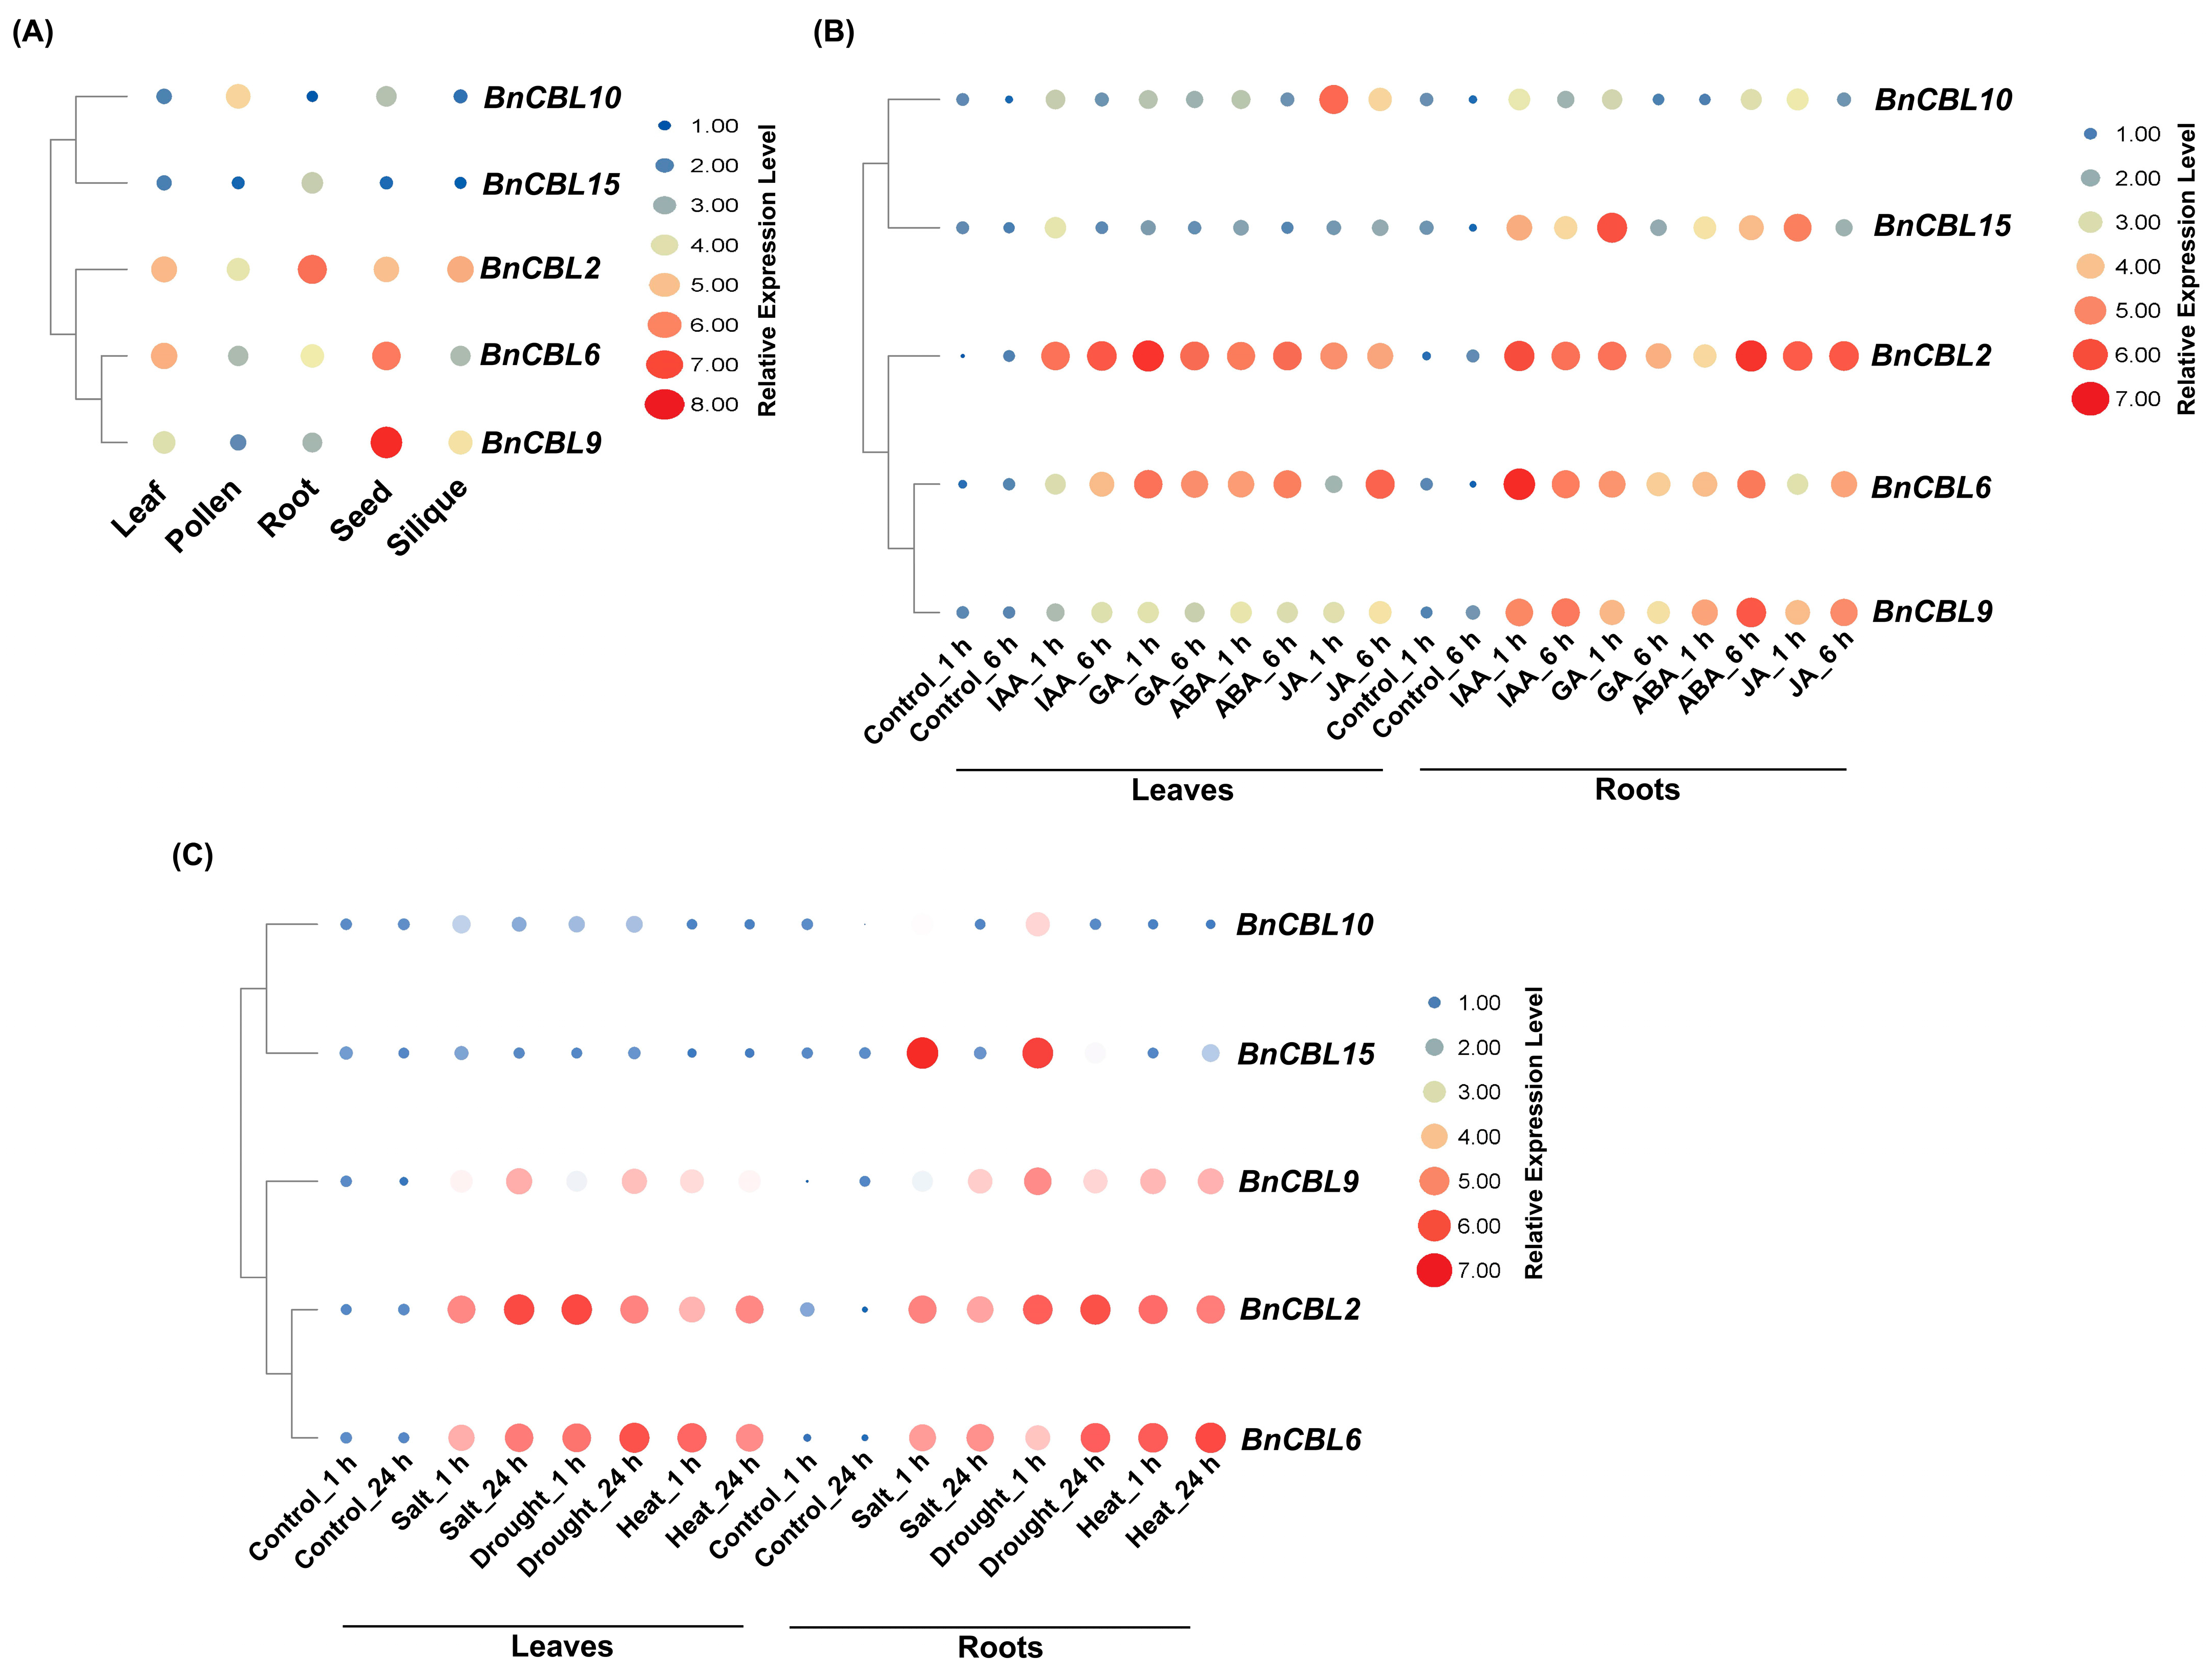
To validate the reliability of RNA-sequencing data, we analyzed the expression of BnCBLs via RT-qPCR (Figure 9A). BnCBL2, BnCBL6 and BnCBL9 were expressed higher in all of the tested plant parts (3~7-fold) except for pollen, in which BnCBL9 was not quantified significantly. The expressions of BnCBL10 and BnCBL15 were quantified differentially as their expression was considered tissue-specific, as BnCBL10 was significantly expressed (2~4-fold) in plant pollen and plant seeds, while BnCBL15 induced significantly in plant roots (3~fold). These findings indicated the tissue-specific expression of BnCBLs.

2.9.2. Relative Expression Levels of BnCBLs, Post-Phytohormone Application, via RT-qPCR

RT-qPCR analyses were performed to examine the expression of some of the BnCBLs after hormone application (at 1 h and 6 hpt) (Figure 9B). The relative expression was quantified as per the RNA-seq data, but with few modifications after phytohormone applications. The expression levels of BnCBL2 and BnCBL6 were recorded to be relatively high in both plant parts, and each of them showed around 6~7-fold increases at 1 hpt and 6 hpt as compared to non-treated control plants. BnCBL9 and BnCBL15 were enormously expressed in plant leaves as compared to plant roots with 3~5-fold and 4~6-fold increases, respectively. Subsequently, the relative expression of BnCBL10 was relatively lower as compared to other respective BnCBLs, although it was significantly induced following JA-treatment at 1 hpt (~6-fold). Nonetheless, the other phytohormones did not express BnCBL10 magnificently; thus, it is not involved in other phytohormone-related pathways except JA (Figure 9B). The RT-qPCR expression analysis suggests probable functions of BnCBLs in plant-hormone signaling pathways.

2.9.3. Transcriptional Induction of BnCBLs Under Abiotic Stresses via RT-qPCR

This expression analysis for BnCBLs after multiple abiotic stress treatments verified that three BnCBLs (BnCBL2, BnCBL6 and BnCBL9) were expressed significantly after 1 hpt or 24 hpt of abiotic stresses both in plant leaves and/or roots, and their noticed relative expression increases were about 4~7-fold. BnCBL15 was transcriptionally quantified to be about ~7-fold higher after salt and drought stresses at 1 hpt in plant roots, while its expression in plant leaves was not significantly regulated. Finally, the expression of BnCBL10 was quantified significantly only at 1 hpt under drought stress (~3-fold) in plant roots but not in plant leaves. These results suggest the function of BnCBLs in abiotic stress tolerance in B. napus plants (Figure 9C).

2.10. Transcriptional Profiling of BnCBLs via RT-qPCR Under Devastating Pathogenic Infection

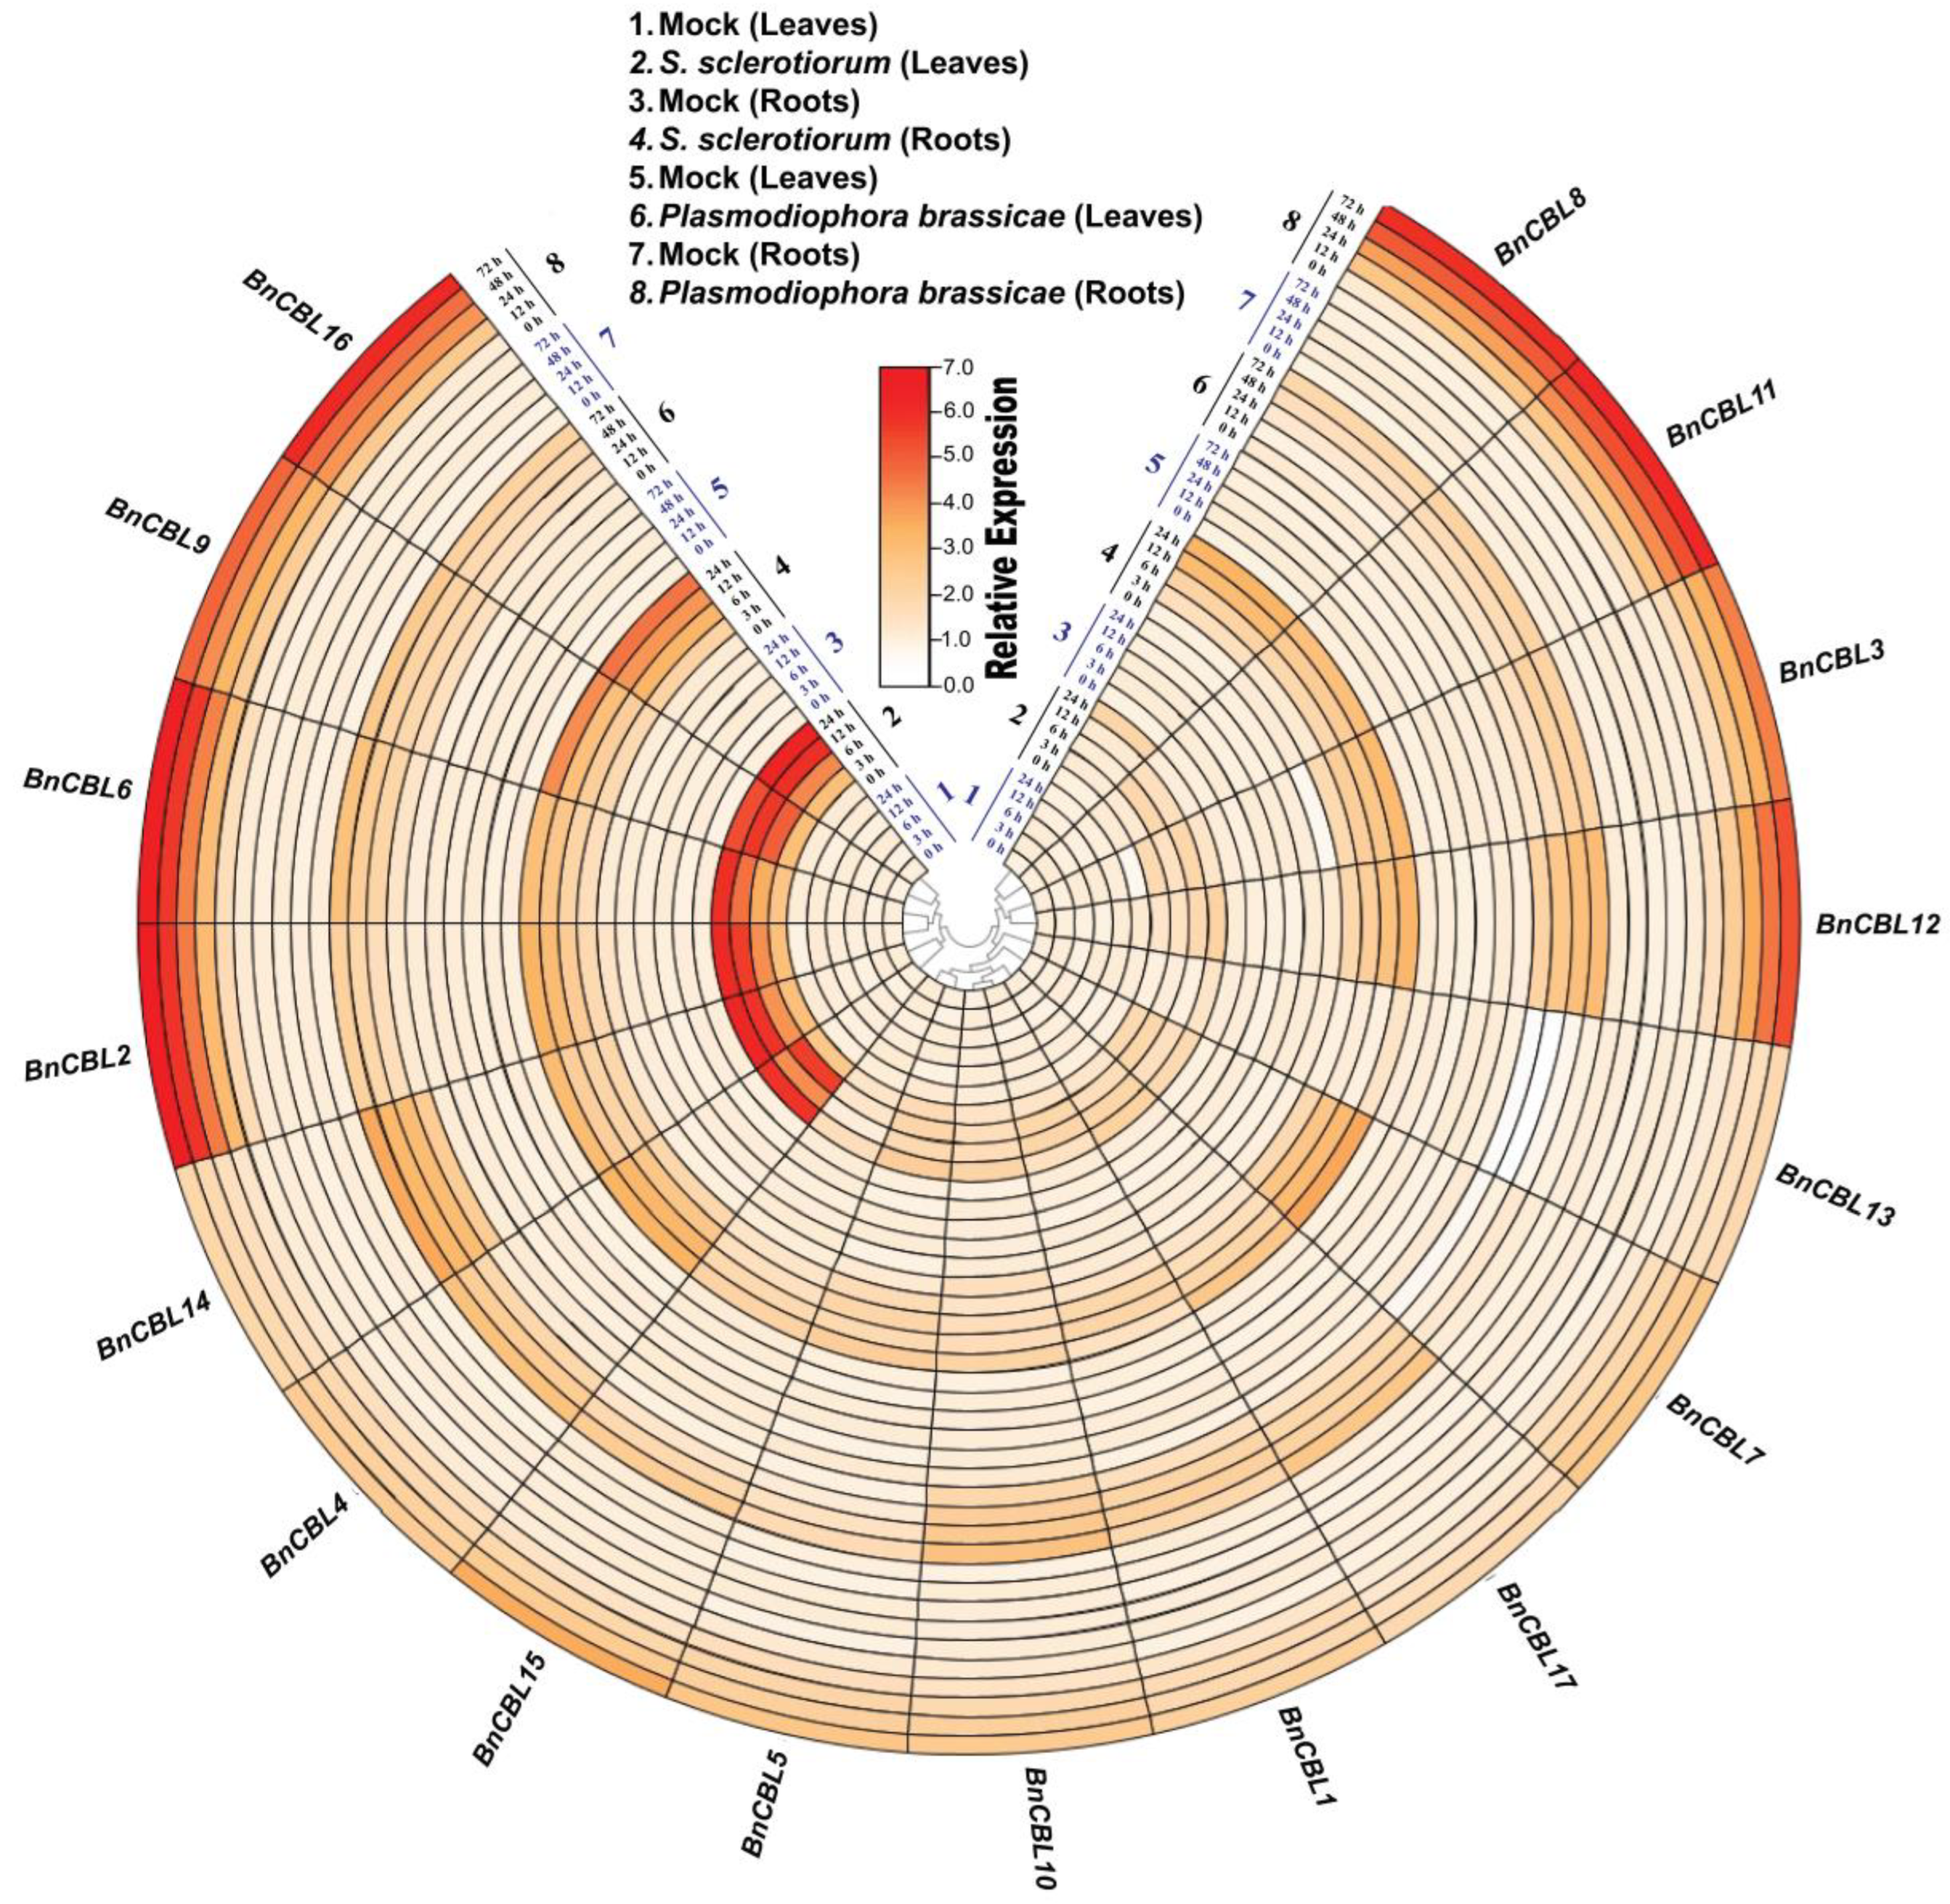
Expression profiling of BnCBLs was conducted under two pathogen attacks, S. sclerotiorum (Lib.) de Bary and Plasmodiophora brassicae (Woronin, 1877), at different time ranges, 0 h, 3 h, 6 h, 12 h, 24 h and 0 h, 12 h, 24 h, 48 h and 72 h, respectively (Figure 10). Four BnCBLs (BnCBL2, -6, -9 and -16) showed significantly high expressions (~6.5-fold increase) in plant leaves and roots after the inoculation of S. sclerotiorum (at 24 h) and P. brassicae (at 72 h), respectively. Two genes (BnCBL4 and BnCBL14) surprisingly expressed after the inoculation of S. sclerotiorum in plant leaves (6~7-fold), with only 3~4-fold increases in plant roots. The expression of two former genes (BnCBL4 and BnCBL14) exhibited comparatively lower expression (~3-fold) under P. brassicae attack in both plant parts (leaves and roots at 72 h). Four BnCBLs (BnCBL3, -8, -11 and -12) exhibited significantly higher transcriptional regulation after P. brassicae at 72 h (5~7-fold) in plant roots, while this expression was relatively lower in plant leaves (~3-fold). The expression profiling of formerly described four genes (BnCBL3, -8, -11 and -12) showed ~3-fold increases in both plant parts (leaves and roots). These results implied the pathogen-specific expression of BnCBLs in biotic stress tolerance in B. napus plants.

3. Discussion

In this study, we analyzed 17 CBL genes in B. napus and identified their evolutionary relation with other Brassicaceae crops including A. thaliana and B. rapa (Figure 1, Table 1). Among the 17 BnCBL genes, 9 and 8 were assigned to the A and C sub-genomes distributed on A01, A02, A03, and A09 and C01, C02, C03, C07 and C09, respectively, from cv. ZS11 (Table 1). Obtaining a series of computational evidence indicated that BnCBLs could serve as functional proteins. Moreover, all of the BnCBLs contained three EF-hands in their protein structures (Figure 2A). All identified BnCBLs exhibited an EF-hand domain that is responsible for binding with calcium ions. CBL genes have been categorized into several plant species, 10 in Arabidopsis [8], 22 in cotton [19], 8 in grapes [32], 10 in rice [33] and 7 in wheat [34], with four, three, four, three and four EF-hands, respectively. Our results are quite similar to some of the previous findings in which CBLs from different crop species contained three or four EF-hand motifs, which can bind at most with three to four Ca2+ ions [35]. The BnCBL gene family members present quite similar genomic features (Figure 2). Generally, BnCBLs contained eight to nine exons and their exon/intron junctions were well aligned with the GT/AT rule [36] (Figure 2C). Furthermore, nine out of seventeen BnCBLs contained myristoylation/palmitoylation motifs (MGCXXS). Protein myristoylation and palmitoylation are two important events for membrane binding of certain proteins [37]. N-terminal Gly and Cys amino acids are required for protein myristoylation and palmitoylation in most BnCBLs, proving that they are potentially functional CBLs (Figure 3).
Interestingly, most of the BnCBLs contained stress-related, growth- and development-related, and phytohormone-responsive cis-elements, indicating their key roles in regulating important plant growth and defense mechanisms in rapeseed plants (Figure 4). These results are well aligned with those of several previous studies, including those on GhCBLs [19], rice [24] and wheat [34], which were predicted to be highly responsive to abiotic stresses and phytohormones application. Additionally, post-translational modifications have been considered an important tool to evaluate protein functions. Three different PTM sites were identified in BnCBLs (phosphorylation, glycosylation and SUMOylation). Consequently, we found that all BnCBLs carry plenty of former PTM sites (Figure 5). Remarkably, a conserved serine residue within the C terminus of CBLs was identified as being phosphorylated by their interacting CIPKs, which elevated activity of CBL-CIPK complexes toward their target proteins [38]. The BnCBLs could be further studied experimentally to prove that either they have potential to be glycosylated or SUMOylated following the evidence from this study.
Protein tertiary structure predictions revealed high structural similarity within clades (Figure 6), indicating conserved evolutionary features, as similarly reported in several plant species [39,40]. The interaction prediction analysis suggested that all of the CBLs had very strong interactions with numerous CLPKs including CLPK1, -3, -5, -6, -8, -9, -11, -13, -21, -23, -24, -26 and some other abiotic stress-related proteins like NHXs and AKT1, indicating potential coordination among distinct calcium- and sodium-permeable channel families in B. napus (Figure 7). Such cross-family interactions could facilitate the fine-tuning of calcium influx and downstream signaling under multiple abiotic stress conditions [27,34,41].
Our expression analysis results analyzed from RNA-seq data showed significantly expressed BnCBL genes, except for BnCBL5, -7, -13, -17 (less than ~1-fold) in some of the respective plant parts (leaf, pollen, root, seed and silique) (Figure 8A and Figure 9A). Among the others, three BnCBLs (BnCBL2, -6 and -9) were induced significantly in all of the respective plant parts with ~3–5-fold increases, while BnCBLs, BnCBL10 and BnCBL15 had tissue-specific expressions (1~4-fold), indicating their functions in specific plant parts. Moreover, highly significant expressions of BnCBL2, -6 and -9 were noticed. The tissue-specific expression patterns of BnCBLs were closely related to some of the previous studies [23,42,43] in which NHX, CBL and ABCDE genes showed tissue-specific expressions. According to RNA sequence data analyses, two BnCBLs (BnCBL2 and BnCBL6) displayed significant expression patterns (2~4-fold) in both of the respective plant parts (leaves and roots) after phytohormones application (1–6 hpt). Several phytohormones including SA and ABA had positive regulatory roles in several biotic and abiotic stresses [44,45]. A similar trend in the two formerly mentioned genes was observed via RT-qPCR, but the intensity of their expression was relatively higher than that observed in the RNA-seq data analysis (Figure 8B and Figure 9B).
Three genes (BnCBL9, -10 and -15) also showed significant increases in their expressions in both RNA seq analysis and RT-qPCR analyses, but their relative expression was distinct in plant roots (2~5-fold) than in leaves (~2-fold or less) in all of the respective phytohormones treatments at all time points. Consequently, in this study, the expression of BnCBLs was also examined under abiotic stresses to investigate their possible roles in abiotic stress tolerance. Three abiotic stresses (salt, drought, heat) were applied and some of the BnCBLs (BnCBL2, -6, -9, -10, -15) were found to be highly responsive to these stresses (2~6-fold increase) and might have possible functions related to these abiotic stresses. It is also noteworthy that three genes (BnCBL2, -6 and -9) exhibited significant expressions in both plant leaves and roots, while two genes, BnCBL10 (~5-fold) and BnCBL15 (~1.5-fold), were significantly expressed only in plant roots but not in plant leaves (Figure 8C and Figure 9C). The pathogen-specific expression of BnCBLs (BnCBL2, -6, -9 and -16) was noticed after necrotrophic pathogen (Ss) infection in plant leaves (24 h) and post P. brassicae infection in plant roots (72 h). The pathogens S. sclerotiorum and P. brassicae were selected to examine biotic stress responses because they cause serious diseases in rapeseed and differ in their infection behavior, providing two distinct biotic stress systems for BnCBL expression analysis. Moreover, two specific genes (BnCBL4, -14) were expressed at 24 hpt of Ss, which aligns this study with our previous study [2,45] in which some of the calcium channel genes (BnGLR12, -35 and -53) were expressed significantly in plant leaves. The predicted computational results and transcriptional regulation of BnCBLs signified the importance of BnCBLs in plant stress, and their functional verification will provide new insights into stress tolerance mechanisms in oilseed rape.

4. Materials and Methods

4.1. Plant Growth, Stress and Phytohormone Treatments

The plants of Zhongshuang11, a cultivar of oilseed rape, were grown under controlled conditions at 22–23 °C (10 h dark and 14 h light photoperiod) in 250 mL plastic pots in the Institute of Vegetable Science, Zhejiang University, Hangzhou, China (2 December 2025). The plants were grown under controlled conditions for four weeks. When the plants were 30 days old, they were subjected to abiotic stresses. Stresses included NaCl (200 mM), heat (35 °C for 24 h) and finally drought stress (25% PEG-6000 for 1 h and 24 h) [46]. Additionally, phytohormones were also supplied to 30-day-old plants, including 1 μM IAA [47], 100 μM GA3, 50 μM MeJA [48], and ABA 150 μM [49] for 1 h and 6 h (3 January 2026). After treating plants with the above-mentioned treatments, samples were taken and frozen in a −80 °C refrigerator for experimental purposes.

4.2. Characterization of CBL Proteins and Evolutionary Relationship Analysis

To identify CBL homologs, protein sequences of A. thaliana CBLs were used as queries in BLASTP searches against fully sequenced green plant genomes available in the NCBI database (accessed on 1 May 2025). The homologous sequences retrieved were aligned with AtCBL proteins using ClustalW2 (default parameters; accessed on 4 May 2025), and further visualized using GeneDoc (v2.7). Physicochemical characteristics, including isoelectric points (pI) and amino acid compositions, were computed using the ExPASy ProtParam tool (https://web.expasy.org/protparam/, accessed on 14 May 2025) [42]. Additionally, the ClustalW module within MEGA X (v10.2.2) software was employed to align AtCBL and BnCBL sequences. MEGA X (v10.2.2) software was used to construct a phylogenic tree, applying 1000 bootstrap replications and a site coverage threshold of 95% to manage alignment gaps [2] in the Maximum Likelihood method. The B. napus CBL family members were subsequently annotated based on their sequence similarity and clustering patterns relative to AtCBL proteins in the phylogenetic analysis.

4.3. Domain Architecture, Motif Composition, Gene Structure and Subcellular Localization Analysis

To elucidate the structural characteristics of B. napus CBL proteins, conserved domains were annotated using the SMART database, (https://smart.embl-heidelberg.de/; accessed on 15 May 2025) with a significance threshold of an E-value cutoff of 1 × 10⁵. Conserved sequence motifs were identified via the MEME Suite [50] (https://meme-suite.org/meme/, accessed on 16 May 2025), applying parameters that included a maximum of 10 motifs, motif widths ranging from 6 to 50 amino acids, and one motif occurrence per sequence [43]. Gene structure analysis, including exon–intron architecture, was performed by aligning coding sequences with their corresponding genomic regions using the Gene Structure Display Server (GSDS; https://gsds.gao-lab.org/Gsds_help.php, accessed on 20 May 2025) [51]. To predict potential functional localization, subcellular distribution of CBL proteins was assessed using DeepLoc 2.0 (https://services.healthtech.dtu.dk/services/DeepLoc-2.0/, accessed on 23 May 2025 ), enabling insights into their compartment-specific roles within the cell [52].

4.4. Promoter Profiling and Architecture Analysis

To elaborate promoter sequences, up to 2000 bp upstream sequences from BnCBL genes were utilized from the NCBI database and evaluated for putative CREs using the New PLACE database (https://rapdb.dna.naro.go.jp/PLACE/?action=newplace, accessed on 29 May 2025), with a focus on elements involved in hormonal and stress-related regulation [53].

4.5. Post-Translational Modification (PTM) Site Prediction

To explore potential post-translational regulatory mechanisms, several PTMs were predicted in BnCBL proteins. Glycosylation sites were predicted using the online webserver NetOGlyc (http://www.cbs.dtu.dk/services/NetOGlyc/, accessed on 18 May 2025). Myristoylation sites were assessed utilizing Myristoylator (https://web.expasy.org/myristoylator/, 2 June 2025) and S-palmitoylation sites by using SwissPalm (https://swisspalm.org, accessed on 3 June 2025) tools. Predicted SUMOylation sites at lysine residues were analyzed using DeepSUMO (https://deepsumo.renlab.org/server.html, accessed on 22 May 2025), and potential phosphorylation sites on Ser (S), Thr (T), and Tyr (Y) tyrosine residues were determined by NetPhos (http://www.cbs.dtu.dk/services/NetPhos/, accessed on 24 May 2025) [42]. These PTMs provide insights into the functional dynamics and potential regulatory roles of BnCBLs under diverse stress conditions.

4.6. Protein Tertiary Structure Prediction for BnCBLs

An online modeling server, Phyre2, was used to predict BnCBL proteins’ tertiary structures (www.sbg.bio.ic.ac.uk/phyre2, accessed on 4 June 2025). The PDB protein database (PDB) obtained images by choosing the suitable method for respective proteins on the basis of their coverage and confidence score [54].

4.7. Protein–Protein Interaction Analyses

Protein–protein interactions were predicted among AtCBLs and other stress-related proteins (specially CLPK) using the STRING database (https://string-db.org/, accessed on 29 June 2025) [55].

4.8. Pathogen Inoculation Materials and Disease Assessment Analysis

Mycelial plugs of S. sclerotiorum (Lib.) de Bary were inoculated onto the leaves of B. napus plants and a liquid mycelial suspension was prepared by growing the fungus in broth, blending it, and adjusting concentration (OD600 of ~1.0–2.0) [56], then used in the soil drench method. Fresh sclerotia of S. sclerotiorum (strain UF1) were cultured on PDA medium at 23 °C, transferred to newly prepared PDA plates, and further grown for two more days. The experiments were conducted three times independently [2] (5 January 2026).
Resting spores of P. brassicae (Woronin, 1877) were prepared from galled roots collected from a clubroot-infected Chinese cabbage field in Zhejiang Province, China, and the isolate was identified as pathotype P4 (ECD 20/31/12) using the Williams and European Clubroot Differential systems [57]. These resting spores were isolated by homogenization and filtration, quantified with a hemocytometer, and adjusted to 1 × 10⁷ spores mL−1. Five-day-old seedlings were inoculated at the root zone and grown under controlled greenhouse conditions [58] (9 January 2026). Infected plants were then sampled at 0, 12-, 24-, 48- and 72-h post-inoculation to quantify CBL gene expression for early pathogenesis analysis.

4.9. Analysis of BnCBL Gene Expression

The RNA-seq data were obtained from the B. napus multi-omics information resource (BnIR; https://yanglab.hzau.edu.cn/BnIR/expression_zs11, accessed on 28 November 2025). The expression data for BnCBL genes in different plant tissues (leaf, pollen, root, seed and silique), hormonal application (IAA, GA, ABA and JA) and abiotic stresses (salt, drought and heat) was described using transcript per million (TPM) values, and TBtools (v2.084) was used to create heatmaps by normalizing log2FC (values) [59].

4.10. RNA Extraction and cDNA Synthesis for RT-qPCR

RNA extraction for B. napus plant samples was done using an isolation kit (Takara, Shiga, Japan) [60]. Afterward, the quality and quantity of extracted RNA were measured using a Nano Drop-1000 spectrophotometer (Thermo Scientific, Waltham, MA, USA). Then, the RNA was reverse-transcriptionally converted into cDNA using PrimeScriptTM RT reagent kit (Takara, Shiga, Japan) [61]. Finally, a SYBR® Premix Ex Taq II kit was used on the CFX96® PCR system (Bio Rad, Hercules, CA, USA). The relative expression was quantified by the commonly used Ct method [62]. The primers used for qRT-PCR analysis are listed in Table S1.

4.11. Statistical Analysis

Three biological replicates were used for each experiment. Statistically significant difference was calculated using Student’s t-test, and all data are expressed as mean ± standard error (SE). Graphical representations were prepared using graphpad prism software (v10.0) [63].

5. Conclusions

In this study, a genome-wide analysis of B. napus cultivar ZS11 identified 17 CBL genes, which were phylogenetically classified into four groups consistent with their homologs in A. thaliana. These BnCBL genes exhibited group-dependent characteristics in chromosomal distribution, conserved motifs, gene structure, and predicted post-translational modification sites, supporting their functional annotation as CBL-related calcium signaling. Expression profiling revealed that a subset of BnCBL genes was responsive to multiple abiotic stresses, including salt, drought and heat, following exogenous phytohormones applications, as well as biotic stresses (Ss and P. brassicae). Overall, this study provides basic bioinformatic and expression analyses which indicate their association with stress-response mechanisms; however, it also offers a foundation for future studies on their calcium-dependent functions in stress tolerance.

Supplementary Materials

The following supporting information can be downloaded at: https://www.mdpi.com/article/10.3390/agriculture16101088/s1, Figure S1: Chromosomal localization of BnCBL genes; Figure S2: Motif logos and consensus sequences; Figure S3: cis-regulatory elements with their respective signal sequences identified in BnCBL promoters. Table S1: Primers used in this study.

Author Contributions

Conceptualization, J.H. and R.M.A.G.; methodology, R.Z., K.L. and Z.Q.; software, I.H., D.S. and S.H.; validation, G.Z., B.X., R.Z. and K.L.; formal analysis, R.Z., K.L., I.H. and D.S.; investigation, R.Z., K.L. and G.Z.; resources, J.H.; data curation, R.M.A.G.; writing—original draft preparation, R.Z., K.L. and R.M.A.G.; writing—review and editing, R.M.A.G.; visualization, S.H.; supervision, J.H.; project administration, J.H.; funding acquisition, J.H. All authors have read and agreed to the published version of the manuscript.

Funding

The work was supported by the National Natural Science Foundation of China (Grant No. 32272745) and Innovative Development of Horticulture Discipline of Zhejiang University (Grant No. B231220.0005-26).

Institutional Review Board Statement

Not applicable.

Data Availability Statement

The original contributions presented in this study are included in the article/Supplementary Materials. Further inquiries can be directed to the corresponding authors.

Acknowledgments

We are sincerely thankful to the College of Agriculture and Biotechnology for providing the seeds of the experimental cultivar. We are also thankful to Xiaolin Yu for providing the pathogen cultures for experimental purposes.

Conflicts of Interest

The authors declare no conflicts of interest.

Abbreviations

The following abbreviations are used in this manuscript:
CREsCis-acting Regulatory Elements
PTMsPost-Translational Modifications
AsnAsparagine
CBLCalcineurin B-like Proteins
PKCProtein Kinase C
PKAProtein Kinase A
PEGPolyethylene Glycol
ZS11Zhongshuang11
TPMTranscripts Per Million
SUMOSmall Ubiquitin-Like Modifier
PDAPotato Dextrose Agar
MeJAMethyl Jasmonate

References

  1. Tian, W.; Wang, C.; Gao, Q.; Li, L.; Luan, S. Calcium spikes, waves and oscillations in plant development and biotic interactions. Nat. Plants 2020, 6, 750–759. [Google Scholar] [CrossRef]
  2. Gulzar, R.M.A.; Ren, C.X.; Fang, X.; Xu, Y.P.; Saand, M.A.; Cai, X.Z. Glutamate receptor-like (GLR) family in Brassica napus: Genome-wide identification and functional analysis in resistance to Sclerotinia sclerotiorum. Int. J. Mol. Sci. 2024, 25, 5670. [Google Scholar] [CrossRef]
  3. Köster, P.; DeFalco, T.A.; Zipfel, C. Ca2+ signals in plant immunity. EMBO J. 2022, 41, EMBJ2022110741. [Google Scholar] [CrossRef] [PubMed]
  4. Kudla, J.; Xu, Q.; Harter, K.; Gruissem, W.; Luan, S. Genes for calcineurin B-like proteins in Arabidopsis are differentially regulated by stress signals. Proc. Natl. Acad. Sci. USA 1999, 96, 4718–4723. [Google Scholar] [CrossRef] [PubMed]
  5. Mao, J.; Manik, S.M.; Shi, S.; Chao, J.; Jin, Y.; Wang, Q.; Liu, H. Mechanisms and physiological roles of the CBL-CIPK networking system in Arabidopsis thaliana. Genes 2016, 7, 62. [Google Scholar] [CrossRef] [PubMed]
  6. Verma, P.; Sanyal, S.K.; Pandey, G.K. Ca2+-CBL-CIPK: A modulator system for efficient nutrient acquisition. Plant Cell Rep. 2021, 40, 2111–2122. [Google Scholar] [CrossRef]
  7. Ravi, B.; Sanyal, S.K.; Pandey, G.K. Calcium decoders and their targets: The holy alliance that regulate cellular responses in stress signaling. Adv. Protein Chem. Struct. Biol. 2023, 134, 371–439. [Google Scholar] [CrossRef]
  8. Kolukisaoglu, Ü.; Weinl, S.; Blazevic, D.; Batistic, O.; Kudla, J. Calcium sensors and their interacting protein kinases: Genomics of the Arabidopsis and rice CBL-CIPK signaling networks. Plant Physiol. 2004, 134, 43–58. [Google Scholar] [CrossRef]
  9. Drerup, M.M.; Schlücking, K.; Hashimoto, K.; Manishankar, P.; Steinhorst, L.; Kuchitsu, K.; Kudla, J. The Calcineurin B-like calcium sensors CBL1 and CBL9 together with their interacting protein kinase CIPK26 regulate the Arabidopsis NADPH oxidase RBOHF. Mol. Plant 2013, 6, 559–569. [Google Scholar] [CrossRef]
  10. Dong, Q.; Bai, B.; Almutairi, B.O.; Kudla, J. Emerging roles of the CBL-CIPK calcium signaling network as key regulatory hub in plant nutrition. J. Plant Physiol. 2021, 257, 153335. [Google Scholar] [CrossRef]
  11. You, Z.; Guo, S.; Li, Q.; Fang, Y.; Huang, P.; Ju, C.; Wang, C. The CBL1/9-CIPK1 calcium sensor negatively regulates drought stress by phosphorylating the PYLs ABA receptor. Nat. Commun. 2023, 14, 5886. [Google Scholar] [CrossRef]
  12. Tang, R.-J.; Liu, H.; Yang, Y.; Yang, L.; Gao, X.-S.; Garcia, V.J.; Luan, S.; Zhang, H.-X. Tonoplast calcium sensors CBL2 and CBL3 control plant growth and ion homeostasis through regulating V-ATPase activity in Arabidopsis. Cell Res. 2012, 22, 1650–1665. [Google Scholar] [CrossRef]
  13. Deng, J.; Yang, X.; Sun, W.; Miao, Y.; He, L.; Zhang, X. The Calcium sensor CBL2 and its interacting kinase CIPK6 are involved in plant sugar homeostasis via interacting with tonoplast sugar transporter TST2. Plant Physiol. 2020, 183, 236–249. [Google Scholar] [CrossRef]
  14. Tang, R.-J.; Wang, C.; Li, K.; Luan, S. The CBL–CIPK calcium signaling network: Unified paradigm from 20 years of discoveries. Trends Plant Sci. 2020, 25, 604–617. [Google Scholar] [CrossRef]
  15. Yang, Y.; Zhang, C.; Tang, R.J.; Xu, H.X.; Lan, W.Z.; Zhao, F.; Luan, S. Calcineurin B-Like proteins CBL4 and CBL10 mediate two independent salt tolerance pathways in Arabidopsis. Int. J. Mol. Sci. 2019, 20, 2421. [Google Scholar] [CrossRef] [PubMed]
  16. Plasencia, F.A.; Estrada, Y.; Flores, F.B.; Ortíz-Atienza, A.; Lozano, R.; Egea, I. The Ca2+ Sensor Calcineurin B-Like protein10 in plants: Emerging new crucial roles for plant abiotic stress tolerance. Front. Plant Sci. 2020, 11, 599944. [Google Scholar] [CrossRef]
  17. Hunpatin, O.S.; Yuan, G.; Nong, T.; Shi, C.; Wu, X.; Liu, H.; Ning, Y.; Wang, Q. The roles of calcineurin B-like proteins in plants under salt stress. Int. J. Mol. Sci. 2023, 24, 16958. [Google Scholar] [CrossRef] [PubMed]
  18. Xie, Q.; Yang, Y.; Wang, Y.; Pan, C.; Hong, S.; Wu, Z.; Song, J.; Zhou, Y.; Jiang, X. The calcium sensor CBL10 negatively regulates plasma membrane H+-ATPase activity and alkaline stress response in Arabidopsis. Environ. Exp. Bot. 2022, 194, 104752. [Google Scholar] [CrossRef]
  19. Lu, T.; Zhang, G.; Sun, L.; Wang, J.; Hao, F. Genome-wide identification of CBL family and expression analysis of CBLs in response to potassium deficiency in cotton. PeerJ 2017, 5, e3653. [Google Scholar] [CrossRef]
  20. Su, W.; Huang, L.; Ling, H.; Mao, H.; Huang, N.; Su, Y.; Ren, Y.; Wang, D.; Xu, L.; Muhammad, K. Sugarcane calcineurin B-like (CBL) genes play important but versatile roles in regulation of responses to biotic and abiotic stresses. Sci. Rep. 2020, 10, 167. [Google Scholar] [CrossRef]
  21. Chen, J.S.; Wang, S.T.; Mei, Q.; Sun, T.; Hu, J.T.; Xiao, G.S.; Chen, H.; Xuan, Y.H. The role of CBL-CIPK signaling in plant responses to biotic and abiotic stresses. Plant Mol. Biol. 2024, 114, 53. [Google Scholar] [CrossRef] [PubMed]
  22. Wang, C.; Huang, Q.; Gu, J.; Cai, M.; Lei, Z.; Liang, L.; Chen, T. Genome-wide identification of the CIPK family in sunflower (Helianthus annuus L.) and functional analysis of HaCIPK18 in salt tolerance. Plant Sci. 2026, 362, 112846. [Google Scholar] [CrossRef]
  23. Zhu, L.; Wu, J.; Li, M.; Fang, H.; Zhang, J.; Chen, Y.; Chen, J.; Cheng, T. Genome-wide discovery of CBL genes in Nitraria tangutorum Bobr. and functional analysis of NtCBL1-1 under drought and salt stress. For. Res. 2023, 3, 28. [Google Scholar] [CrossRef]
  24. Jiang, M.; Zhao, C.; Zhao, M.; Li, Y.; Wen, G. Phylogeny and evolution of calcineurin B-Like (CBL) gene family in grass and functional analyses of Rice CBLs. J. Plant Biol. 2020, 63, 117–130. [Google Scholar] [CrossRef]
  25. Zhang, F.; Li, L.; Jiao, Z.; Chen, Y.; Liu, H.; Chen, X.; Fu, J.; Wang, G.; Zheng, J. Characterization of the calcineurin B-Like (CBL) gene family in maize and functional analysis of ZmCBL9 under abscisic acid and abiotic stress treatments. Plant Sci. 2016, 253, 118–129. [Google Scholar] [CrossRef]
  26. Liu, X.; Wang, X.; Yang, C.; Wang, G.; Fan, B.; Shang, Y.; Dang, C.; Xie, C.; Wang, Z. Genome-wide identification of TaCIPK gene family members in wheat and their roles in host response to Blumeria graminis f. sp. tritici infection. Int. J. Biol. Macromol. 2023, 248, 125691. [Google Scholar] [CrossRef]
  27. Li, J.; Jiang, M.M.; Ren, L.; Liu, Y.; Chen, H.Y. Identification and characterization of CBL and CIPK gene families in eggplant (Solanum melongena L.). Mol. Genet Genom. 2016, 291, 1769–1781. [Google Scholar] [CrossRef] [PubMed]
  28. Bihani, S.C.; Tarushi; Srivastava, A.K. Decoding the calcium signal: Structural insights into CBL-CIPK pathway in plants. Biochim. Biophys. Acta (BBA)—Gen. Subj. 2025, 1869, 130819. [Google Scholar] [CrossRef]
  29. Alavilli, H.; Lee, H.; Park, M.; Yun, D.J.; Lee, B.H. Enhanced multiple stress tolerance in Arabidopsis by overexpression of the polar moss peptidyl prolyl isomerase FKBP12 gene. Plant Cell Rep. 2018, 37, 453–465. [Google Scholar] [CrossRef] [PubMed]
  30. Ma, X.; Li, Q.H.; Yu, Y.N.; Qiao, Y.M.; Haq, S.U.; Gong, Z.H. The CBL-CIPK Pathway in Plant Response to Stress Signals. Int. J. Mol. Sci. 2020, 21, 5668. [Google Scholar] [CrossRef]
  31. Martinčová, M.; Soukup, A. Twenty years of AT-HOOK MOTIF NUCLEAR LOCALIZED (AHL) gene family research–Their potential in crop improvement. Curr. Plant Biol. 2025, 42, 100460. [Google Scholar] [CrossRef]
  32. Xi, Y.; Liu, J.; Dong, C.; Cheng, Z.-M. The CBL and CIPK Gene Family in Grapevine (Vitis vinifera): Genome-wide analysis and expression profiles in response to various abiotic stresses. Front. Plant Sci. 2017, 8, 978. [Google Scholar] [CrossRef]
  33. Gu, Z.; Ma, B.; Jiang, Y.; Chen, Z.; Su, X.; Zhang, H. Expression analysis of the calcineurin B-like gene family in rice (Oryza sativa L.) under environmental stresses. Gene 2008, 415, 1–12. [Google Scholar] [CrossRef]
  34. Sun, T.; Wang, Y.; Wang, M.; Li, T.; Zhou, Y.; Wang, X.; Wei, S.; He, G.; Yang, G. Identification and comprehensive analyses of the CBL and CIPK gene families in wheat (Triticum aestivum L.). BMC Plant Biol. 2015, 15, 269. [Google Scholar] [CrossRef]
  35. Nagae, M.; Nozawa, A.; Koizumi, N.; Sano, H.; Hashimoto, H.; Sato, M.; Shimizu, T. The crystal structure of the novel calcium-binding protein AtCBL2 from Arabidopsis thaliana. J. Biol. Chem. 2003, 278, 42240–42246. [Google Scholar] [CrossRef]
  36. Kitamura–Abe, S.; Itoh, H.; Washio, T.; Tsutsumi, A.; Tomita, M. Characterization of the splice sites in GT–AG and GC–AG introns in higher eukaryotes using full-length cDNAs. J. Bioinform. Comput. Biol. 2004, 2, 309–331. [Google Scholar] [CrossRef] [PubMed]
  37. Sorek, N.; Bloch, D.; Yalovsky, S. Protein lipid modifications in signaling and subcellular targeting. Curr. Opin. Plant Biol. 2009, 12, 714–720. [Google Scholar] [CrossRef]
  38. Hashimoto, K.; Eckert, C.; Anschütz, U.; Scholz, M.; Held, K.; Waadt, R.; Reyer, A.; Hippler, M.; Becker, D.; Kudla, J. Phosphorylation of calcineurin B-like (CBL) calcium sensor proteins by their CBL-interacting protein kinases (CIPKs) is required for full activity of CBL-CIPK complexes toward their target proteins. J. Biol. Chem. 2012, 287, 7956–7968. [Google Scholar] [CrossRef] [PubMed]
  39. Jiang, M.; Chu, Z. Comparative analysis of plant MKK gene family reveals novel expansion mechanism of the members and sheds new light on functional conservation. BMC Genom. 2018, 19, 407. [Google Scholar] [CrossRef] [PubMed]
  40. Choi, I.-G.; Kim, S.-H. Evolution of protein structural classes and protein sequence families. Proc. Natl. Acad. Sci. USA 2006, 103, 14056–14061. [Google Scholar] [CrossRef]
  41. Gu, W.-T.; Zhou, L.-B.; Liu, R.-Y.; Jin, W.-J.; Qu, Y.; Dong, X.-C.; Li, W.-J. Synergistic responses of NHX, AKT1, and SOS1 in the control of Na+ homeostasis in sweet Sorghum mutants induced by 12C6+-ion irradiation. Nucl. Sci. Tech. 2017, 29, 10. [Google Scholar] [CrossRef]
  42. Gulzar, R.M.A.; Munir, R.; Yi, Z.R.; Jan, N.; Rauf, A.; Kaleem, Z.; Javaid, M.H.; Saand, M.A.; El-Keblawy, A.; Sheteiwy; et al. Genome-wide identification of NHX gene family and effects of salicylic acid in regulating antioxidant activity as well as nutrients deposition under salt stress in three Brassica species. BMC Plant Biol. 2025, 25, 740. [Google Scholar] [CrossRef] [PubMed]
  43. Zhang, Y.; Zhao, T.; Wang, Y.; Yang, R.; Li, W.; Liu, K.; Sun, N.; Hussain, I.; Ma, X.; Yu, H.; et al. Expression characterization of ABCDE Class MADS-Box genes in Brassica rapa with different pistil types. Plants 2023, 12, 2218. [Google Scholar] [CrossRef] [PubMed]
  44. Gulzar, R.M.A.; Rehman, A.U.; Umar, U.U.D.; Shahid, M.; Khan, M.F. Evaluation of genetic and induced resistance phenomena in cucumbers against the root-knot nematode (Meloidogyne incognita). Plant Prot. Sci. 2022, 58, 338–350. [Google Scholar] [CrossRef]
  45. Piao, Y.; Li, S.; Chen, Y.; Zhao, S.; Piao, Z.; Wang, H. A Ca2+ sensor BraCBL1.2 involves in BraCRa-mediated clubroot resistance in Chinese cabbage. Hortic. Res. 2024, 11, 261. [Google Scholar] [CrossRef]
  46. Xie, M.; Zhang, X.; Liu, K.; Qiao, Z.; Cheng, X. Identification and expression analysis of TALE superfamily genes explore their key roles in response to abiotic stress in Brassica napus. BMC Plant Biol. 2024, 24, 1238. [Google Scholar] [CrossRef]
  47. Gao, Y.; Chen, J.; Zhao, Y.; Li, T.; Wang, M. Molecular cloning and expression analysis of RGA-like gene responsive to plant hormones in Brassica napus. Mol. Biol. Rep. 2012, 39, 1957–1962. [Google Scholar] [CrossRef]
  48. Jiang, H.; Zhang, Y.; Li, J.; Tang, R.; Liang, F.; Tang, R.; Zhou, Y.; Zhang, C. Genome-wide identification of SIMILAR to RCD ONE (SRO) gene family in rapeseed (Brassica napus L.) reveals their role in drought stress response. Plant Signal. Behav. 2024, 19, 2379128. [Google Scholar] [CrossRef]
  49. Luo, D.; Huang, Q.; Chen, M.; Li, H.; Lu, G.; Feng, H.; Lv, Y. ABA enhances drought resistance during rapeseed (Brassica napus L.) seed germination through the gene regulatory network mediated by ABA insensitive5. Plants 2025, 14, 1276. [Google Scholar] [CrossRef]
  50. Ahmad, F.; Abdullah, M.; Khan, Z.; Stępień, P.; Rehman, S.U.; Akram, U.; Rahman, M.H.U.; Ali, Z.; Ahmad, D.; Gulzar, R.M.A. Genome-wide analysis and prediction of chloroplast and mitochondrial RNA editing sites of AGC gene family in cotton (Gossypium hirsutum L.) for abiotic stress tolerance. BMC Plant Biol. 2024, 24, 888. [Google Scholar] [CrossRef]
  51. Saand, M.A.; Xu, Y.-P.; Munyampundu, J.-P.; Li, W.; Zhang, X.-R.; Cai, X.-Z. Phylogeny and evolution of plant cyclic nucleotide-gated ion channel (CNGC) gene family and functional analyses of tomato CNGCs. DNA Res. 2015, 22, 471–483. [Google Scholar] [CrossRef]
  52. Thumuluri, V.; Almagro Armenteros, J.J.; Johansen, A.R.; Nielsen, H.; Winther, O. DeepLoc 2.0: Multi-label subcellular localization prediction using protein language models. Nucleic Acids Res. 2022, 50, W228–W234. [Google Scholar] [CrossRef] [PubMed]
  53. Li, W.; Ping, F.; Jiang, H.; Zhang, S.; Zhao, T.; Liu, K.; Yu, H.; Hussian, I.; Ren, X.; Yu, X. Genome-wide identification of the NAC gene family in Brassica rapa (L.) and expression pattern analysis of BrNAC2s. Plants 2025, 14, 834. [Google Scholar] [CrossRef]
  54. Khan, M.F.; Hasan Naqvi, S.A.; Iqbal, A.; Steichen, S.A.; Ali, A.; Gulzar, R.M.A.; Brown, J.K.; Din Umar, U.U. Quantitative analysis of pathogenesis-related protein expression in Gossypium hirsutum L. to elicitor-induced resistance against cotton leaf curl disease and predicted in-silico protein-protein interactions. Physiol. Mol. Plant Pathol. 2025, 137, 102611. [Google Scholar] [CrossRef]
  55. Szklarczyk, D.; Nastou, K.; Koutrouli, M.; Kirsch, R.; Mehryary, F.; Hachilif, R.; Hu, D.; Peluso, M.E.; Huang, Q.; Fang, T. The STRING database in 2025: Protein networks with directionality of regulation. Nucleic Acids Res. 2025, 53, D730–D737. [Google Scholar] [CrossRef]
  56. Zang, X.P.; Xu, Y.P.; Cai, X.Z. Establishment of an inoculation technique system for Sclerotinia sclerotiorum based on mycelial suspensions. J. Zhejiang Univ. Agric. Life Sci. 2010, 36, 381–386. [Google Scholar] [CrossRef]
  57. Zhang, Y.; Yu, H.; Zhao, T.; Hussain, I.; Ma, X.; Wang, Y.; Liu, K.; Sun, N.; Yu, X. Integrated management of clubroot in Zhejiang province, China. Agronomy 2024, 14, 377. [Google Scholar] [CrossRef]
  58. Hussain, I.; Zhao, T.; Wang, Y.; Lei, N.; Liu, K.; Yu, H.; Zhang, Y.; Muhammad, U.; Ullah, H.; Yu, X. Melatonin and copper oxide nanoparticles synergistically mitigate clubroot disease and enhance growth dynamics in Brassica rapa. Plant Physiol. Biochem. 2024, 215, 109020. [Google Scholar] [CrossRef]
  59. Hu, Z.; Xie, F.; Cai, L.; Qian, R. Identification and expression pattern analysis of the OsCBL gene family in rice. Front. Plant Sci. 2025, 16, 1625014. [Google Scholar] [CrossRef]
  60. Kaleem, Z.; Shahbaz, H.; Ali, S.; Albert, A.; He, D.; Gulzar, R.M.A.; Asad, M.A.U.; Zhou, W.; Zhang, K.; Ulhassan, Z. Melatonin and nanocopper synergistically regulate cadmium toxicity in Brassica napus: Evidences from photosynthesis phenomics, oxidative metabolism, and multiple defense responses. Environ. Sci. Nano 2025, 12, 3714–3730. [Google Scholar] [CrossRef]
  61. Ali, B.; Javaid, M.H.; Rehman, M.; Munir, R.; Yasin, M.U.; Haider, Z.; Ahmad, I.; Yang, C.; Ali, A.; Ali, Q.S. Indium-induced toxicity disrupts redox balance, impairs photosynthesis, and induces cell wall lignification in Brassica napus. Environ. Sci. Technol. 2025, 59, 15623–15636. [Google Scholar] [CrossRef]
  62. Javaid, M.H.; Ali, B.; Neelam, A.; Bukhari, S.A.H.; Munir, R.; Haider, Z.; Rehman, M.; Razzaq, H.A.; Majeed, A.; Gan, Y. Green-engineered calcium-doped carbon nanospheres enhance salt tolerance and growth in maize by modulating gene expressions and antioxidant defense mechanisms. J. Environ. Chem. Eng. 2025, 13, 117061. [Google Scholar] [CrossRef]
  63. Zhang, X.; Ghishkori, Z.G.N.; Hussain, I.; Javaid, M.H.; Zhu, G.; Huang, J.; Gulzar, R.M.A. Genome-wide identification of PSK gene family and effects of abscisic acid (ABA) in regulating antioxidant activity and ROS signaling under drought stress in Brassica napus. Int. J. Mol. Sci. 2026, 27, 1064. [Google Scholar] [CrossRef]
Figure 1. Phylogenic analysis between A. thaliana, B. napus and B. rapa CBL proteins. (A) Phylogenetic tree constructed using AtCBL, BnCBL and BraCBL proteins. Tree was constructed using the MEGA X (v10.2.2) software with 1000 bootstrap replicates and was optimized with the iTOL online tool. Distinct colors indicate different plant species. AtCBLs is in red (dotted lines), BnCBLs in blue, BraCBLs in green. Leaf nodes are represented as orange circles, while internal nodes are represented as red stars. (B) AtCBLs with their corresponding orthologs presented groupwise. Group I contained 2 AtCBLs, 6 BnCBLs and 5 BraCBLs; Group II had 1 AtCBL, 3 BraCBLs; Group III exhibited 3 AtCBLs, 5 BnCBLs and BraCBL4; Group IV contained 4 AtCBLs, 6 BnCBLs and 7 BraCBLs.
Agriculture 16 01088 g001
Figure 2. Prediction of conserved domains, conserved motifs and the structural architectures of 17 BnCBLs. (A) Domain prediction analysis in the genome of B. napus through NCBI-CDD database. (B) Motif profile of BnCBLs indicating their position in the protein sequences. The conserved motifs identified by TBtools (v2.084) are indicated by different colors with numbers. (C) The constituents of BnCBL genes are shown in differentially colored shapes. CDS: green boxes; upstream/downstream regions: blue box; introns: dotted red lines.
Agriculture 16 01088 g002
Figure 3. The amino acid sequence alignment of BnCBL proteins showing myristoylation/palmitoylation sites as well as EF-hand 1, EF-hand 2 and EF-hand 3 motifs identified in this study. A total of 44 amino acids were highly conserved (100%) and showed by an asterisk (*). Myristoylation/palmitoylation sites (MGCXXS) and EF-hand motifs are shown. The myristoylation and palmitoylation sites are depicted in the red rectangle. The length of the protein sequences is indicated to the right corner corresponding to the respective protein.
Agriculture 16 01088 g003
Figure 4. The analysis of cis-regulatory elements within the 2000 bp region upstream of the transcription start site of BnCBL genes was conducted, accompanied by an illustration depicting their distribution along the promoter sequence. (A) Major stress-responsive, growth- and development-related, T.F binding-related, and phytohormone-responsive CREs. No. of CREs mentioned in the rectangle. 1–6—Stress-related CREs, 7–8—growth and development-related CREs, 9—transcriptional factor binding site-related CRE, and 10–17—phytohormone-responsive CREs. The color scale denotes abundance, with red indicating a high number and blue to green representing a low or absent motif in the heatmap. (B) The cis-regulatory elements were categorized by functional significance, including associations with abscisic acid (ABA) responsiveness (green), abiotic stress (orange), gibberellic acid (GA) responsiveness (light blue), jasmonic acid (JA) responsiveness (pink), Myeloblastosis (MYB) (light green), salicylic acid (SA) responsiveness (Yellow), transcription factors (TFs) responsiveness in biotic stress (dark grey), indole acetic acid (IAA) responsiveness (dark blue), and some other motifs (light grey).
Agriculture 16 01088 g004
Figure 5. PTM site prediction in BnCBLs. The heat map illustrated the PTM sites in B. napus CBLs prepared using TBtools (v2.084). The number of PTM sites, including phosphorylation (1–3), phosphorylation-related kinases (4–15), glycosylation sites on ‘Asparagine-Asn’ residue (16), and SUMOylation at ‘Lysine (Lys)-K (17)’, predicted in AtCBLs and BnCBLs. The heatmap represents predicted PTM sites, with values increasing from yellow and green to burgundy and red, where lighter colors indicate lower levels and darker colors indicate higher levels. PKC, protein kinase C; PKA, protein kinase A; GSK3, glycogen synthase kinase 3; Cdc2, cell division cycle protein 2; CKI, casein kinase 1; CKII, casein kinase 2; P38MAPK, P38 mitogen activated protein kinase; PKG, protein kinase G; CDK5, cyclin dependent kinase 5; DNAPK, DNA-dependent protein kinase; RSK, ribosomal S6 kinase; and ATM, ataxia telangiectasia mutated.
Agriculture 16 01088 g005
Figure 6. Predicted 3D models of BnCBL proteins. Models were generated using the Phyre2 server. (AQ) Models were visualized with rainbow colors from the N to C termini. c2zfdA of CBL1 (from A. thaliana) was used as a template in the modeling of the ectodomain of BnCBLs. The alignment coverage, disorder, alpha helix, beta sheets (%) and identity of the predicted model with the template is shown below each model.
Agriculture 16 01088 g006
Figure 7. Prediction of protein–protein interactions (PPIs) between AtCBLs and other stress-related proteins. (AJ) PPI network among AtCBL1 (homolog of BnCBL1 and BnCBL2), AtCBL2 (BnCBL3, -4 and -5), AtCBL3 (BnCBL6), AtCBL4 (BnCBL7, -8 and -9), AtCBL5 (BnCBL10), AtCBL6 (BnCBL11 and BnCBL12), AtCBL7, AtCBL8 (BnCBL13 and BnCBL14), AtCBL9 (BnCBL15, -16 and -17), AtCBL10, and other stress-responsive proteins.
Agriculture 16 01088 g007
Figure 8. Heatmap of B. napus CBL gene expressions in different plant tissues and following phytohormones as well as abiotic stresses based on RNA-seq data. (A) Heatmap shows expression patterns of BnCBLs in five plant tissues (leaf, pollen, root, seed and silique). (B) Expression profile of BnCBL genes at 0.5, 1, 3 and 6 hpt following phytohormones treatments (IAA, GA3, ABA, and JA). (C) Expression profiling of BnCBL genes under abiotic stresses (salt, drought and heat) at 1, 6, 12, and 24 hpt. Data was recorded after 1, 6, 12 and 24 hpt. Expression values were derived from TPM (transcripts per million) data obtained from the BnIR database and converted into log2 fold-change (log2FC) relative to untreated control samples (0 h or mock-treated plants). Heatmap color scale represents relative expression levels (blue and red colors indicate lower expression and higher expression, respectively). The RNA-seq dataset used was publicly available and normalized; additional statistical analyses were not performed separately.
Agriculture 16 01088 g008
Figure 9. RT-qPCR expression analysis of BnCBL genes in different tissues and under phytohormone and abiotic stress treatments in B. napus. (A) Tissue-specific expression profiles in leaf, pollen, root, seed, and silique. (B) Expression patterns following IAA, GA3, ABA, and JA treatments at 1 and 6 hpt. (C) Expression profiles under salt, drought, and heat stresses at 1 and 24 hpt. Relative expression levels were calculated using the 2−ΔΔCt method with Actin as the reference gene and normalized against untreated controls. Heatmaps were generated using TBtools (v2.084), where blue-grey and red indicate lower-medium and higher transcript accumulation, respectively. As well as size of circles indicate the expression values, i.e., lower circle meant lower expression value and big circle indicate higher expression values. Data represent mean ± SE from three biological replicates with three technical replicates each. Statistical differences were analyzed using Student’s t-test at p ≤ 0.05.
Agriculture 16 01088 g009
Figure 10. RT-qPCR analysis of BnCBL gene expression under biotic stress conditions in B. napus. Expression patterns were examined after S. sclerotiorum infection at 1, 3, 6, 12, and 24 hpt and P. brassicae infection at 0, 12, 24, 48, and 72 hpt in leaves and roots. Relative expression levels were determined using the 2−ΔΔCt method with Actin as the reference gene and normalized to untreated controls. Heatmaps were generated using TBtools (v2.084), where white and red indicate lower and higher expression levels, respectively. Data represent mean ± SE of three biological replicates with three technical replicates each. Statistical significance was evaluated using Student’s t-test (p ≤ 0.05).
Agriculture 16 01088 g010
Table 1. BnCBLs identified in this study.
Gene IDsGiven NameChrSTARTENDSTRANDLocalizationNo. of AApIMW (KDa)GRAVY
BnaA01G0188800ZSBnCBL1A0111,316,1891,1317,450+Chl2275.8526.236−0.234
BnaA02G0125100ZSBnCBL2A026,799,5386,800,868-Cyt2264.8925.865−0.22
BnaA02G0305400ZSBnCBL3A0227,585,35527,586,998-PM2134.6224.35−0.17
BnaA02G0387100ZSBnCBL4A0233,801,74433,803,915+Chl2214.7125.341−0.178
BnaA03G0118500ZSBnCBL5A035,921,3845,922,685-Cyt2605.1229.775−0.094
BnaA03G0493300ZSBnCBL6A0327,343,28727,344,636-Chl2264.826.022−0.226
BnaA09G0068200ZSBnCBL7A094,097,3434,098,839+Chl2214.925.482−0.212
BnaA09G0140200ZSBnCBL8A098,438,3688,439,968-Nuc2145.2324.724−0.296
BnaA09G0212000ZSBnCBL9A0914,938,94114,940,727-PM2134.6224.354−0.22
BnaC01G0106100ZSBnCBL10C016,974,1906,976,198+PM2134.7424.684−0.21
BnaC01G0239500ZSBnCBL11C0118,278,81618,280,084+Chl2275.9126.169−0.235
BnaC02G0415400ZSBnCBL12C0251,403,64751,405,350-PM2134.6224.383−0.191
BnaC02G0518100ZSBnCBL13C0262,193,21762,194,686+PM2464.7328.2470.043
BnaC03G0137100ZSBnCBL14C037,335,5347,336,847-Cyt2384.9727.182−0.215
BnaC07G0416200ZSBnCBL15C0752,536,79952,538,779+PM2134.8624.704−0.188
BnaC09G0149800ZSBnCBL16C0911,353,61711,355,125-Chl2145.2324.738−0.294
BnaC09G0461000ZSBnCBL17C0957,368,52157,370,935-Chl2205.0625.272−0.319
The Gene IDs and their respective names. Codes C01–C09 represent the chromosomes of the C sub-genome of Brassica napus, while A01–A09 correspond to the chromosomes of the A sub-genome. Gene start and end position is also labeled. Protein localization, No. of amino acids (AA), theoretical isoelectric point (pI), molecular weight (KDa) and GRAVY (grand average of hydropathy) scores are demonstrated in the table. Cyt—cytoplasm; PM—plasma membrane; Nuc—nucleus.
Disclaimer/Publisher’s Note: The statements, opinions and data contained in all publications are solely those of the individual author(s) and contributor(s) and not of MDPI and/or the editor(s). MDPI and/or the editor(s) disclaim responsibility for any injury to people or property resulting from any ideas, methods, instructions or products referred to in the content.