1. Introduction
Agriculture is essential for human survival—over 27% of the world’s population depends on it directly [
1]. In the near future, it will remain vital for economic development and poverty reduction. However, it faces significant challenges, including anthropogenic impacts, climate change, a shortage of agricultural workers in highly developed countries, global population growth, and dietary changes affecting food availability and quality [
2,
3]. These agricultural challenges are prompting greater attention to advanced precision agriculture (PA) technologies, which can help manage farming processes more effectively. PA involves integrating advanced data collection methods into farming to use fewer resources, maximize the potential of natural, human, and mechanical resources, adapt to different soils, and minimize disruption to the agricultural ecosystem [
4]. Precision agriculture incorporates smart technologies such as automated soil sampling, global positioning systems (GPS), proximal and remote sensing, decision-making systems, variable speed and variable rate technologies, the Internet of Things, real-time crop condition monitoring, and autonomous tractor and implement control systems [
5,
6]. The continuous monitoring and analysis of the obtained data help farmers make better, more informed decisions regarding tillage, sowing, plant care, and harvesting [
7]. One of the most important goals of PA is to respond as quickly and accurately as possible to changes in farm activities in terms of both space and time [
8]. This enables improved decision-making, helping to implement effective management practices that increase crop productivity, improve soil and plant health, and reduce environmental impact [
9].
Bulk density is one of the most important parameters for understanding the physical, chemical, and biological properties of soil [
10]. Compacted soil can affect water retention and infiltration rates, as well as the availability of nutrients to plant roots and root penetration [
11,
12]. For optimal plant growth, soil bulk density should generally be less than 1.6 g cm
−3, as exceeding this limit can result in poor rooting. However, the critical bulk density can vary depending on soil type and conditions [
13,
14,
15]. Heavily compacted soil layers limit root penetration, reduce soil porosity and water permeability, and increase the risk of soil erosion, which negatively affects plant health and productivity [
16,
17].
Soil bulk density is closely related to soil porosity and may also be influenced by soil moisture conditions through their effects on soil structure and compaction [
18]. The main factors influencing changes in soil moisture are meteorological conditions, topography, soil properties, crops, types of land use, and, of course, the intensity of the tillage methods employed [
19,
20,
21]. Prolonged wet soil conditions can increase the risk of erosion and compaction, which may lead to greater variability in bulk density measurements and an increased bulk density [
22]. These changes in soil physical conditions can affect plant water uptake, which is important for plant growth, productivity, and sustainable farming [
23,
24].
Soil porosity is an important physical property that influences the movement, storage, and availability of water and air in soil, thereby affecting conditions for plant growth and productivity [
25]. Soil porosity is influenced by several factors, including the content of organic matter, biological activity, the stability of aggregates, soil compaction and the method of tillage. These factors are considered to be important under the conditions of the present study region [
26].
Intensive conventional tillage significantly impacts soil health by affecting soil physical, chemical, and biological properties, as well as the interactions among these properties. It also affects humification processes and their distribution. Equally importantly, when comparing the energy intensity of all agricultural technological operations, tillage is the most energy-intensive process [
27]. He et al. [
28] argue that, when using the conventional tillage method, the excessive intensity of tillage and the use of a constant tillage depth may increase soil compaction and the formation of a plough pan. They also point out that, if the tillage depth is not properly selected, a layer that limits root development may form due to the mechanical smearing of wet and plastic soil. Therefore, precision agriculture, which takes soil variability into account, may be one of the desirable solutions. Tillage depth monitoring and control systems are used for variable-depth tillage, which is often referred to as site-specific tillage (SST) [
21]. This method enables tillage depth to be adapted to spatial variability in soil properties, thereby improving soil physical conditions, increasing crop productivity, and enhancing environmental sustainability [
21,
29,
30].
Variable-depth tillage requires maps of soil property variability. The most commonly used maps are those showing the chemical properties of the soil, such as pH and organic carbon content, as well as the physical properties of the soil, including bulk density, plough pan formation, soil compaction and apparent electrical conductivity (ECa) [
29,
31,
32]. The suitability of ECa for dividing a field into separate zones has been reported by Pentos et al. [
33], Lund et al. [
34], Abbaspour-Gilandeh et al. [
35], and Šarauskis et al. [
21]. ECa is widely used as an indicator of soil heterogeneity and spatial variability in soil properties. Its value is influenced by soil texture and soil moisture conditions. Different soils have different ECa values [
34,
36,
37,
38,
39]: clay-rich soils tend to have a higher ECa at most moisture levels due to the stronger surface conductivity of clay minerals and bound water layers, as well as higher microporosity, which provides additional conductivity. Sandier soils have larger pores and a lower surface area. They generally have a lower ECa at the same water content because conductivity is more dominated by bulk pore water than by surface conductivity. Their conductivity mainly increases with water content and salinity. Silty textures exhibit intermediate behaviour between sand and clay. Their ECa response lies between the extremes of sand and clay, reflecting a combination of conductivity and a pore structure that depends on texture [
36,
37,
38,
39]. Abbaspour-Gilandeh et al. [
35] conducted studies on three soil types (Faceville loamy sand, Fuquay sandy loam and Lakeland sand) and found that ECa increased with increasing clay content in the soil. They also found a strong linear relationship between ECa, soil texture and tillage force requirement. Given the relationship between ECa patterns and soil compaction, this method could be effective in an SST system based on soil compaction maps [
33]. ECa is one of the simplest and most cost-effective indicators of soil variability widely used in precision agriculture [
39]. ECa measurements can be taken more quickly than traditional grid sampling and laboratory analysis. Grisso et al. [
39] state that ECa varies according to the amount of moisture stored within soil particles. Therefore, ECa is strongly correlated with soil particle size and texture. Other authors [
34,
35] confirm this correlation, making ECa a suitable property for determining field soil variability.
The SST method requires real-time systems to maintain and adjust the tillage depth. Depending on the type of machine, which can be mounted or trailed, and the method of attachment to the tractor, the tillage depth can be changed. The working depth of mounted and trailed tillage machines is most often changed according to control variables via the tractor’s hydraulic suspension systems [
40]. These systems use a variety of sensors to determine tillage depth. The most commonly used sensors are angle sensors, which measure the working angle and convert it into tillage depth; ultrasonic sensors, which measure the time it takes for sound waves to travel from the sensor to the ground and back [
41,
42]; and load sensors, which measure the forces exerted during tillage [
43].
Previous studies on site-specific tillage have primarily focused on deep tillage aimed at alleviating subsoil compaction [
44,
45,
46]. However, in many agricultural systems, tillage is performed at shallower depths, where the effectiveness of site-specific approaches remains less studied. In addition, the combined effects of SST on soil physical properties, fuel use, and CO
2 emissions under such conditions have not been sufficiently investigated.
Therefore, this study investigates the effects of site-specific tillage, based on apparent electrical conductivity (ECa), on soil physical properties, fuel consumption, and environmental impact under field conditions. The variable tillage depth was used because a single minimum depth was not considered suitable for the entire field under spatially variable soil conditions: while shallow tillage may be sufficient in zones with lower expected soil resistance, it may be insufficient in zones where soil properties indicate greater resistance or compaction. Conversely, applying a greater uniform depth across the whole field may result in unnecessary soil disturbance and higher fuel consumption in areas where shallower tillage is adequate. In this study, ECa was used not as a direct or sole measure of compaction, but as a practical indicator of spatial soil variability related to particle-size distribution, moisture conditions, and other soil physical characteristics that may affect the required tillage depth. Higher ECa zones were therefore interpreted as areas with a greater probability of finer-textured or more resistant soil conditions, whereas lower ECa zones were considered more suitable for reduced tillage depth. The study compares SST (at depths of 10, 14 and 18 cm) with conventional uniform-depth tillage (15 cm), focusing on the short-term effects of adapting tillage depth to spatial variability in soil properties on soil bulk density, moisture and porosity dynamics, and changes in fuel consumption and CO2 emissions.
2. Materials and Methods
2.1. Site Description and Experimental Design
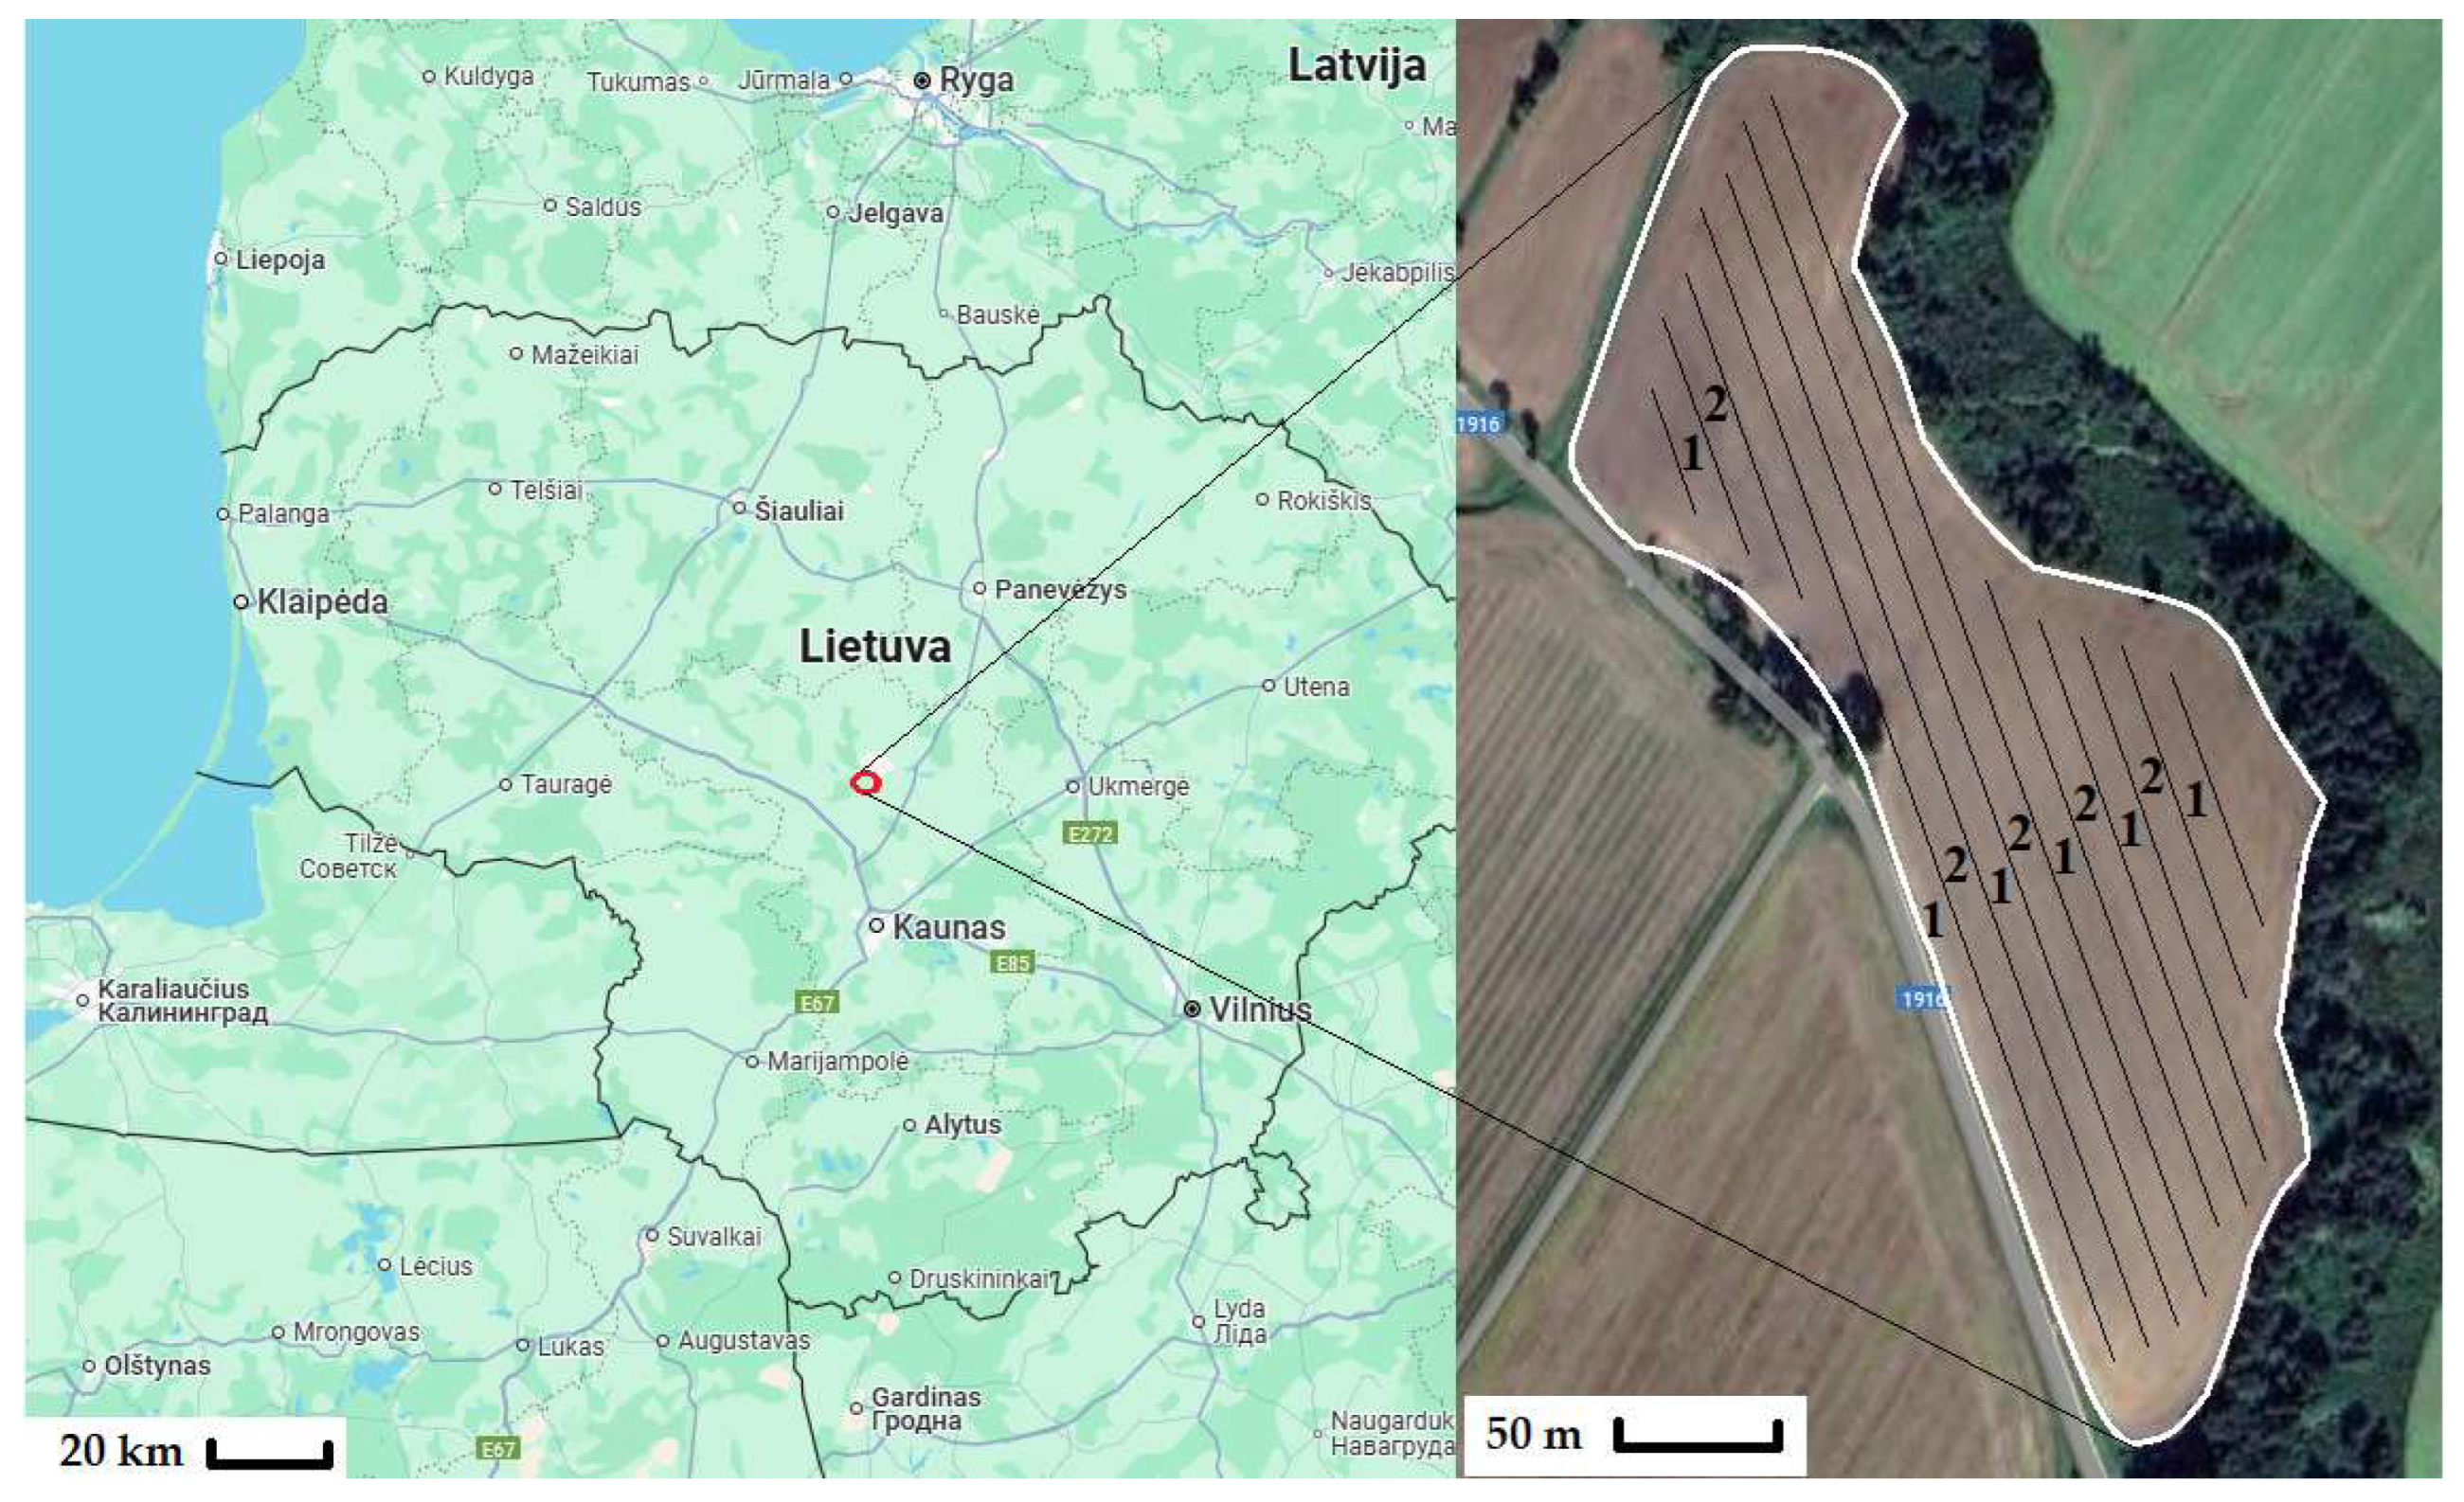
Experimental tillage field studies were conducted in autumn 2024 in a 7.5 ha farmer’s field located in the Kaunas district, Lithuania (55°09′20.0″ N, 23°53′32.4″ E) (
Figure 1). The experimental field was characterized by soils ranging from loamy sand to sandy silty clay, with a clay content of 12–25% and a fine fraction of 16–35%. The soil was slightly alkaline, with variable nutrient content: pH (CaCl
2) from 7.3 to 7.4; phosphorus (P
2O
5) from 12.8 to >58.2 mg 100 g
−1; potassium (K
2O) from 21.3 to >31.6 mg 100 g
−1; and magnesium (MgO) from >27.2 to >43.6 mg 100 g
−1. These soils are representative of central Lithuanian agricultural soils.
2.2. Field History
Prior to the experiment, the field was managed using strip tillage. Winter rapeseed was grown in 2022. After harvest, the soil was loosened to a depth of 5 cm using a disc harrow. In the autumn of the same year, winter wheat was sown using strip tillage technology, with the soil cultivated to a depth of 15 cm using tines spaced at 36.4 cm. After harvesting winter wheat in 2023, the field was left fallow. In spring 2024, beans were sown using the same strip tillage system, maintaining the same working depth and row spacing.
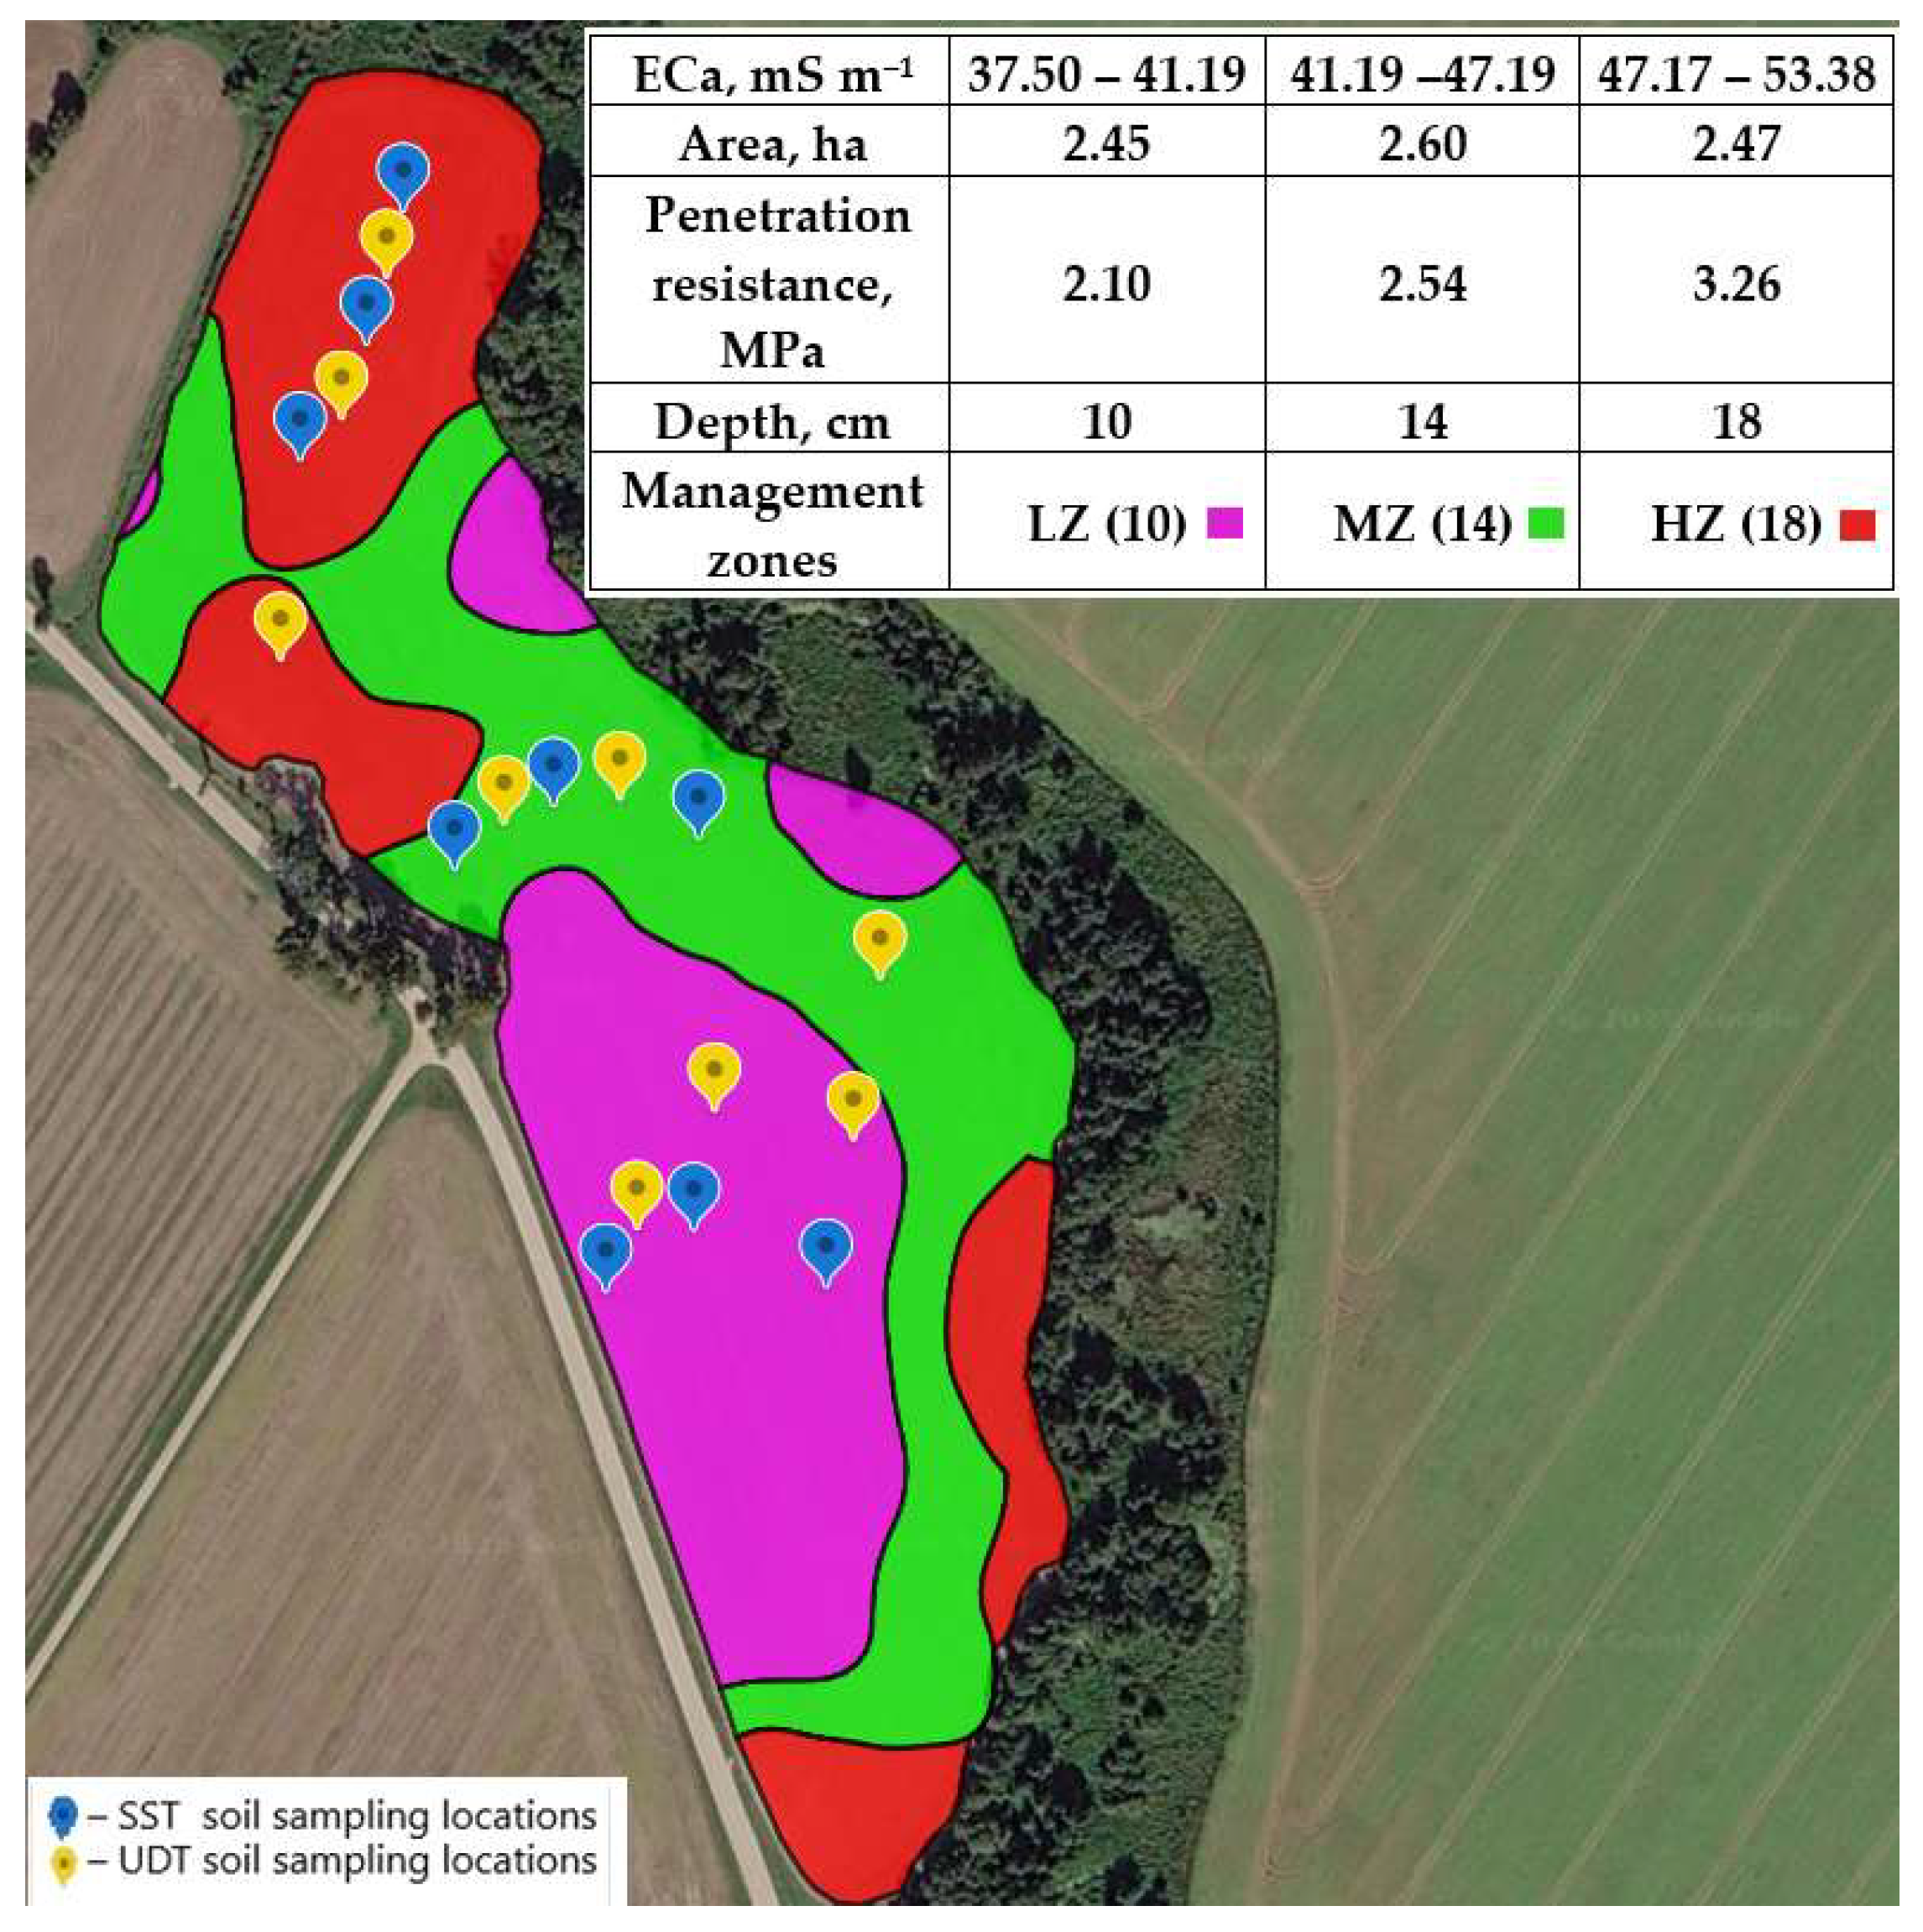
Soil hardness measurements conducted before the experiment indicated that, after several years of strip tillage, increased soil resistance occurred at depths of 15–18 cm. Therefore, tillage depths within this range were considered critical for soil loosening, and this informed the selection of experimental tillage depths. As shown in
Figure 2, the penetration resistance data indicate significant differences in soil hardness across the ECa-defined zones, with values of 2.10 MPa at 10 cm, 2.54 MPa at 14 cm, and 3.26 MPa at 18 cm.
2.3. Experimental Layout and Treatments
The experiment was established on 2 September 2024 after bean harvest. Two tillage methods were evaluated: site-specific tillage (SST) with variable depths (10, 14, and 18 cm) and conventional uniform-depth tillage (UDT), applied at a constant depth of 15 cm as a control treatment. This depth was selected based on long-term tillage practice on the farm.
To define management zones for SST, a full-field survey of soil apparent electrical conductivity (ECa) was conducted prior to tillage using an EM38-MK2 electromagnetic induction sensor (Geonics Ltd., Mississauga, ON, Canada) [
47] integrated with a GPS receiver (Trimble Navigation Ltd., Alpharetta, GA, USA). The collected data were processed using SMS v21.5 software (Soil Management System, Ag Leader Technology, Ames, IA, USA), and the field was divided into three management zones based on ECa values.
Based on the commonly reported relationship between ECa, soil texture, and compaction, three tillage depths were assigned to the ECa-defined management zones: LZ (10)—10 cm in low-ECa tillage zones, MZ (14)—14 cm in medium-ECa tillage zones, and HZ (18)—18 cm in high-ECa tillage zones. This assignment was supported by pre-tillage penetration resistance measurements, which increased from LZ to HZ, indicating greater mechanical resistance in higher ECa zones. Thus, in the SST treatment, tillage depth was not applied uniformly but was adapted to spatial variability in soil properties represented by ECa. A variable-depth tillage map was then generated (
Figure 2).
The experimental field was divided into 15 m wide experimental strips following the direction of technological tracks. Each strip consisted of three passes of the 5 m wide cultivator. These strips served as experimental units representing different tillage treatments across the field. Within SST strips, tillage depth was adjusted in real-time according to the predefined ECa-based management zones.
This design allowed comparison between uniform-depth and site-specific tillage under the same field conditions while accounting for spatial variability in soil properties.
2.4. Machines Used for Experiments
Experimental tillage operations were carried out using a 380 kW tractor (Fendt 1050 Vario, Fendt GmbH, Marktoberdorf, Bavaria, Germany) equipped with a multifunctional cultivator (Väderstad TopDown 500, Väderstad AB, Väderstad, Sweden). The main technical specifications of the cultivator are presented in
Table 1.
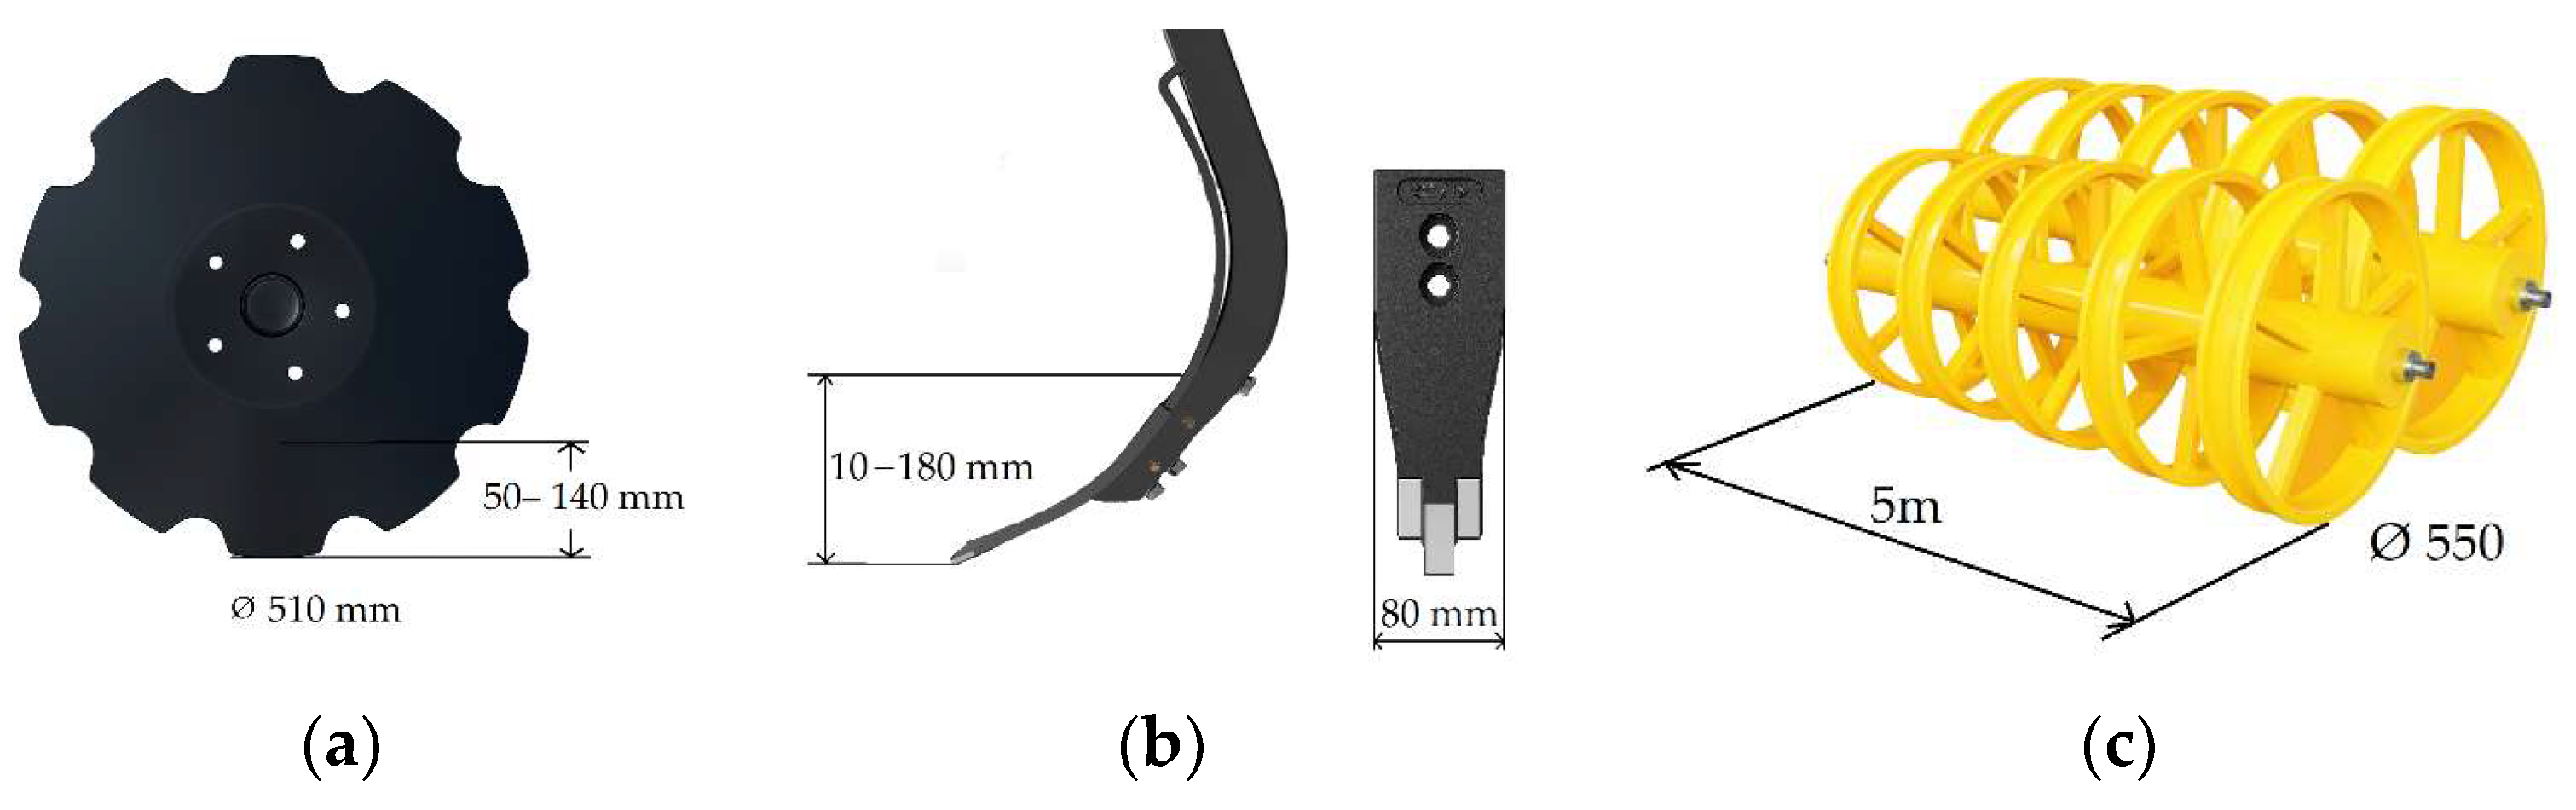
The cultivator consists of notched concave discs, tines, and double U-profile packers (
Figure 3). The discs (510 mm diameter) cut and incorporate crop residues into the soil, while the tines perform intensive soil loosening to the target working depth. The packer system was used to level the soil surface and ensure soil reconsolidation after tillage.
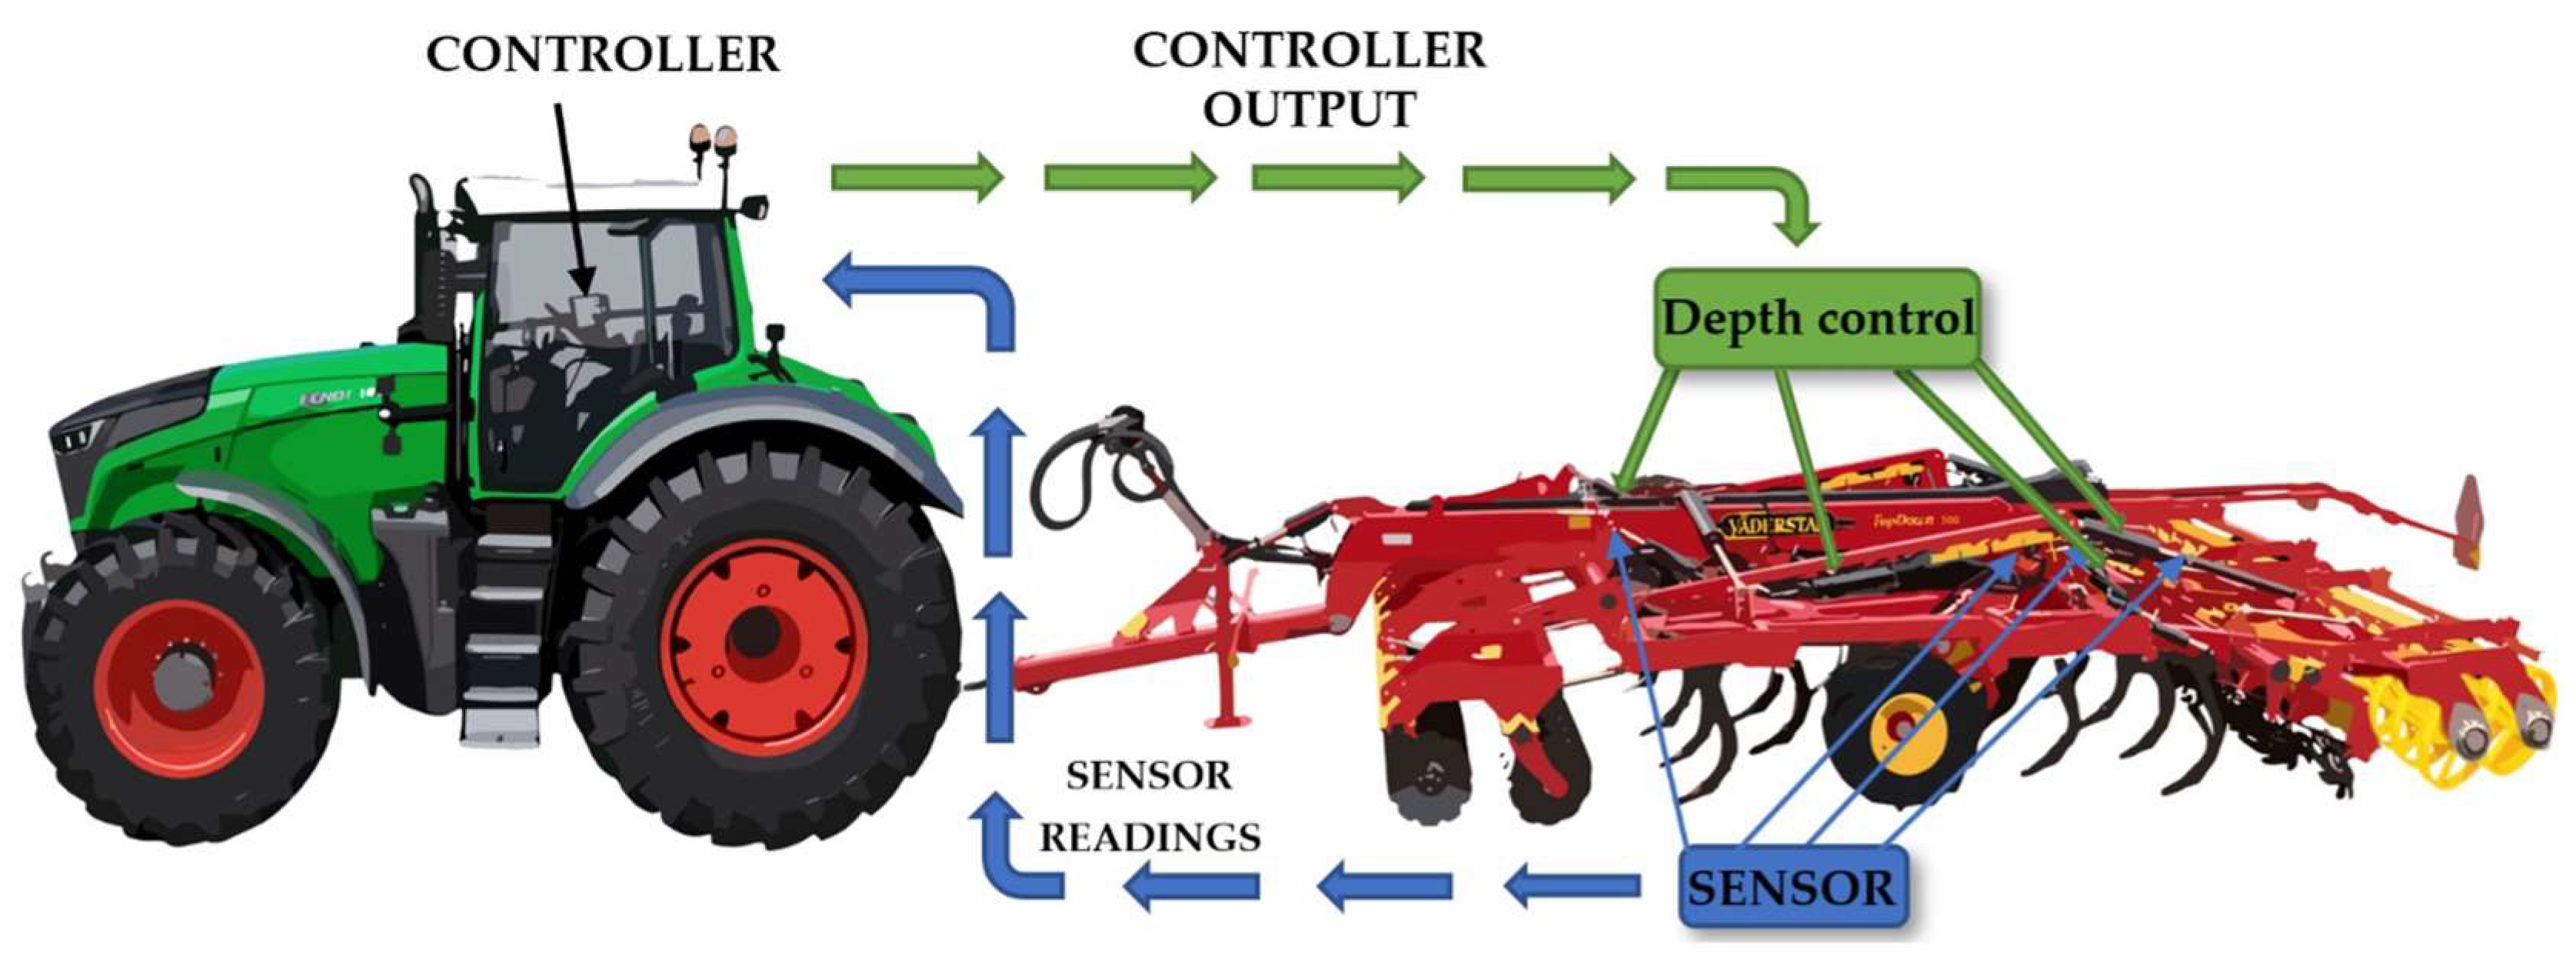
The working depth of the cultivator was controlled using the Väderstad E-Services system with E-Control via the ISOBUS interface (ISO 11783-1:2017) [
48]. This system enabled real-time adjustment of tillage depth based on the predefined ECa-based SST map. Depth control was achieved using sensor data, including disc angle, tine position, and load sensor data, which were processed by the onboard controller to regulate hydraulic cylinders and adjust the position of the working elements relative to the frame (
Figure 4).
During field operations, GPS positioning was used to track the location of the machinery and synchronize tillage depth with the management zones. Fuel consumption per hectare and working depth were recorded in real time using the tractor onboard system. Data were collected separately for each management zone under site-specific tillage conditions. The tillage operations were performed at a consistent forward speed of approximately 10–12 km h−1 to ensure uniform working conditions across treatments.
2.5. Fuel Consumption
Fuel consumption was measured across ten strips (five SST and five UDT), providing five replicates for each tillage method. Fuel consumption data were only recorded and analysed during the active tillage operation. Non-tillage activities such as headland turns, maneuvering, travelling without implement engagement, acceleration and deceleration phases, idling and overlaps between passes were not included in the analysis. Therefore, the reported fuel consumption values represent the fuel used for the soil-engaging tillage process itself, rather than the total fuel required for the entire field operation.
2.6. Calculation of CO2 Emissions
The environmental impact was assessed based on diesel fuel consumption. CO
2 emissions were estimated using a conversion factor derived from the carbon content of diesel fuel. According to Wang and Mouazen [
49], one litre of diesel has a density of approximately 0.85 kg L
−1 and contains 86.2% carbon. Based on this, the combustion of 1 litre of diesel results in approximately 2.68 kg of CO
2 emissions. This conversion factor was applied to calculate CO
2 emissions per hectare from the measured fuel consumption. CO
2 emissions were calculated using the following equation:
where FC is the fuel consumption (L ha
−1) and 2.68 is the emission factor representing the amount of CO
2 produced per litre of diesel fuel.
2.7. Determination of Physical Soil Properties
To investigate the effects of different tillage methods (SST and UDT) on soil physical properties, measurements were conducted for soil bulk density (g cm−3), moisture content (% by weight), aeration porosity (% by volume), and total porosity (% by volume). Three SST tillage zones (LZ (10), MZ (14), and HZ (18)) were compared with UDT applied at a constant depth of 15 cm.
Soil samples were collected from each tillage zone within the experimental strips, including both SST management zones and UDT control strips. In the SST treatment, sampling locations corresponded to ECa-defined management zones where different tillage depths were applied. Within each SST strip, one soil sample was collected from each ECa-defined tillage zone. The same sampling principle was repeated across different SST and UDT strips until three replicates were obtained for each zone and soil layer. Since soil varies even within the same field, samples were collected from corresponding sampling areas within the same ECa-defined zones and experimental strips before and after tillage to ensure comparability of measurements. In total, 72 soil samples were collected, including 36 samples before tillage and 36 samples after tillage.
Samples were taken from two soil layers (0–10 cm and 10–20 cm) to assess the effects of tillage at different soil depths. The soil layers were selected as commonly used depth intervals that allow the effects of different tillage depths to be compared within the same soil layers. The aim of the study was to evaluate how the 10, 14, and 18 cm tillage depths affected the upper 0–10 cm layer and the underlying 10–20 cm layer. Due to the size of the tillage field area, the arrangement of tillage strips, the application of different tillage methods, and the limitations of the measurement equipment, for each treatment and soil layer, three replicate samples were collected within each strip. Although a larger number of replications may provide greater statistical reliability, three replications are often used by researchers in tillage field studies and allow the results to be statistically evaluated appropriately [
50,
51,
52].
To ensure comparable soil conditions, both pre-tillage and post-tillage sampling were conducted on the same day (2 September 2024). Research into the short-term effects of tillage helps to properly assess its impact and avoid the influence of time-dependent factors, such as meteorological conditions, natural soil reconsolidation and biological processes [
53].
Samples were dried in a forced-air oven (Memmert GmbH & Co. KG, Schwabach, Bavaria, Germany) at 105 °C until constant weight. Soil bulk density (
ρ) was calculated as [
54,
55]:
where
m is the dry soil mass (g) and
V is the dry soil volume (cm
3).
Total porosity and aeration porosity were determined using a vacuum air pycnometer (Eijkelkamp Soil & Water B.V., Giesbeek, The Netherlands) for each zone, depth, and replicate and calculated as [
56,
57]:
where
Pt is total soil porosity (%),
ρ is bulk density (g cm
−3), and
ρs.p is particle density (g cm
−3).
Aeration porosity was calculated as:
where
Paer. is aeration porosity (%) and
w is soil moisture content (%).
2.8. Statistical Data Analysis
Soil physical properties were analyzed considering tillage method (UDT and SST) and soil depth (0–10 cm and 10–20 cm) as fixed factors. Measurements were performed in three replicates within each experimental strip and tillage zone.
To assess the effect of tillage, measurements taken before and after tillage were compared using a paired approach, ensuring that samples collected from the same locations were evaluated together. In the SST treatment, statistical comparisons reflect the combined effect of tillage depth and underlying soil variability represented by ECa-defined zones.
Fuel consumption and CO2 emissions were calculated for each treatment and tillage depth based on field measurements.
Statistical analysis was performed using analysis of variance (ANOVA). Differences between treatments were evaluated using the least significant difference (LSD05) test at a 95% confidence level.
The LSD05 values and results of ANOVA, including degrees of freedom (df), F-statistics, Mean Square (MS), and p-values are presented separately for three types of comparisons: (A) comparison was used to describe initial differences between treatments/zones and was therefore interpreted as an indicator of pre-existing field heterogeneity rather than a tillage effect; (B) comparison described post-tillage differences between treatments/zones; and (AB) comparison represented paired before–after changes within the same treatment/zone and was used to evaluate the short-term effect of tillage.
3. Results
3.1. Soil Bulk Density
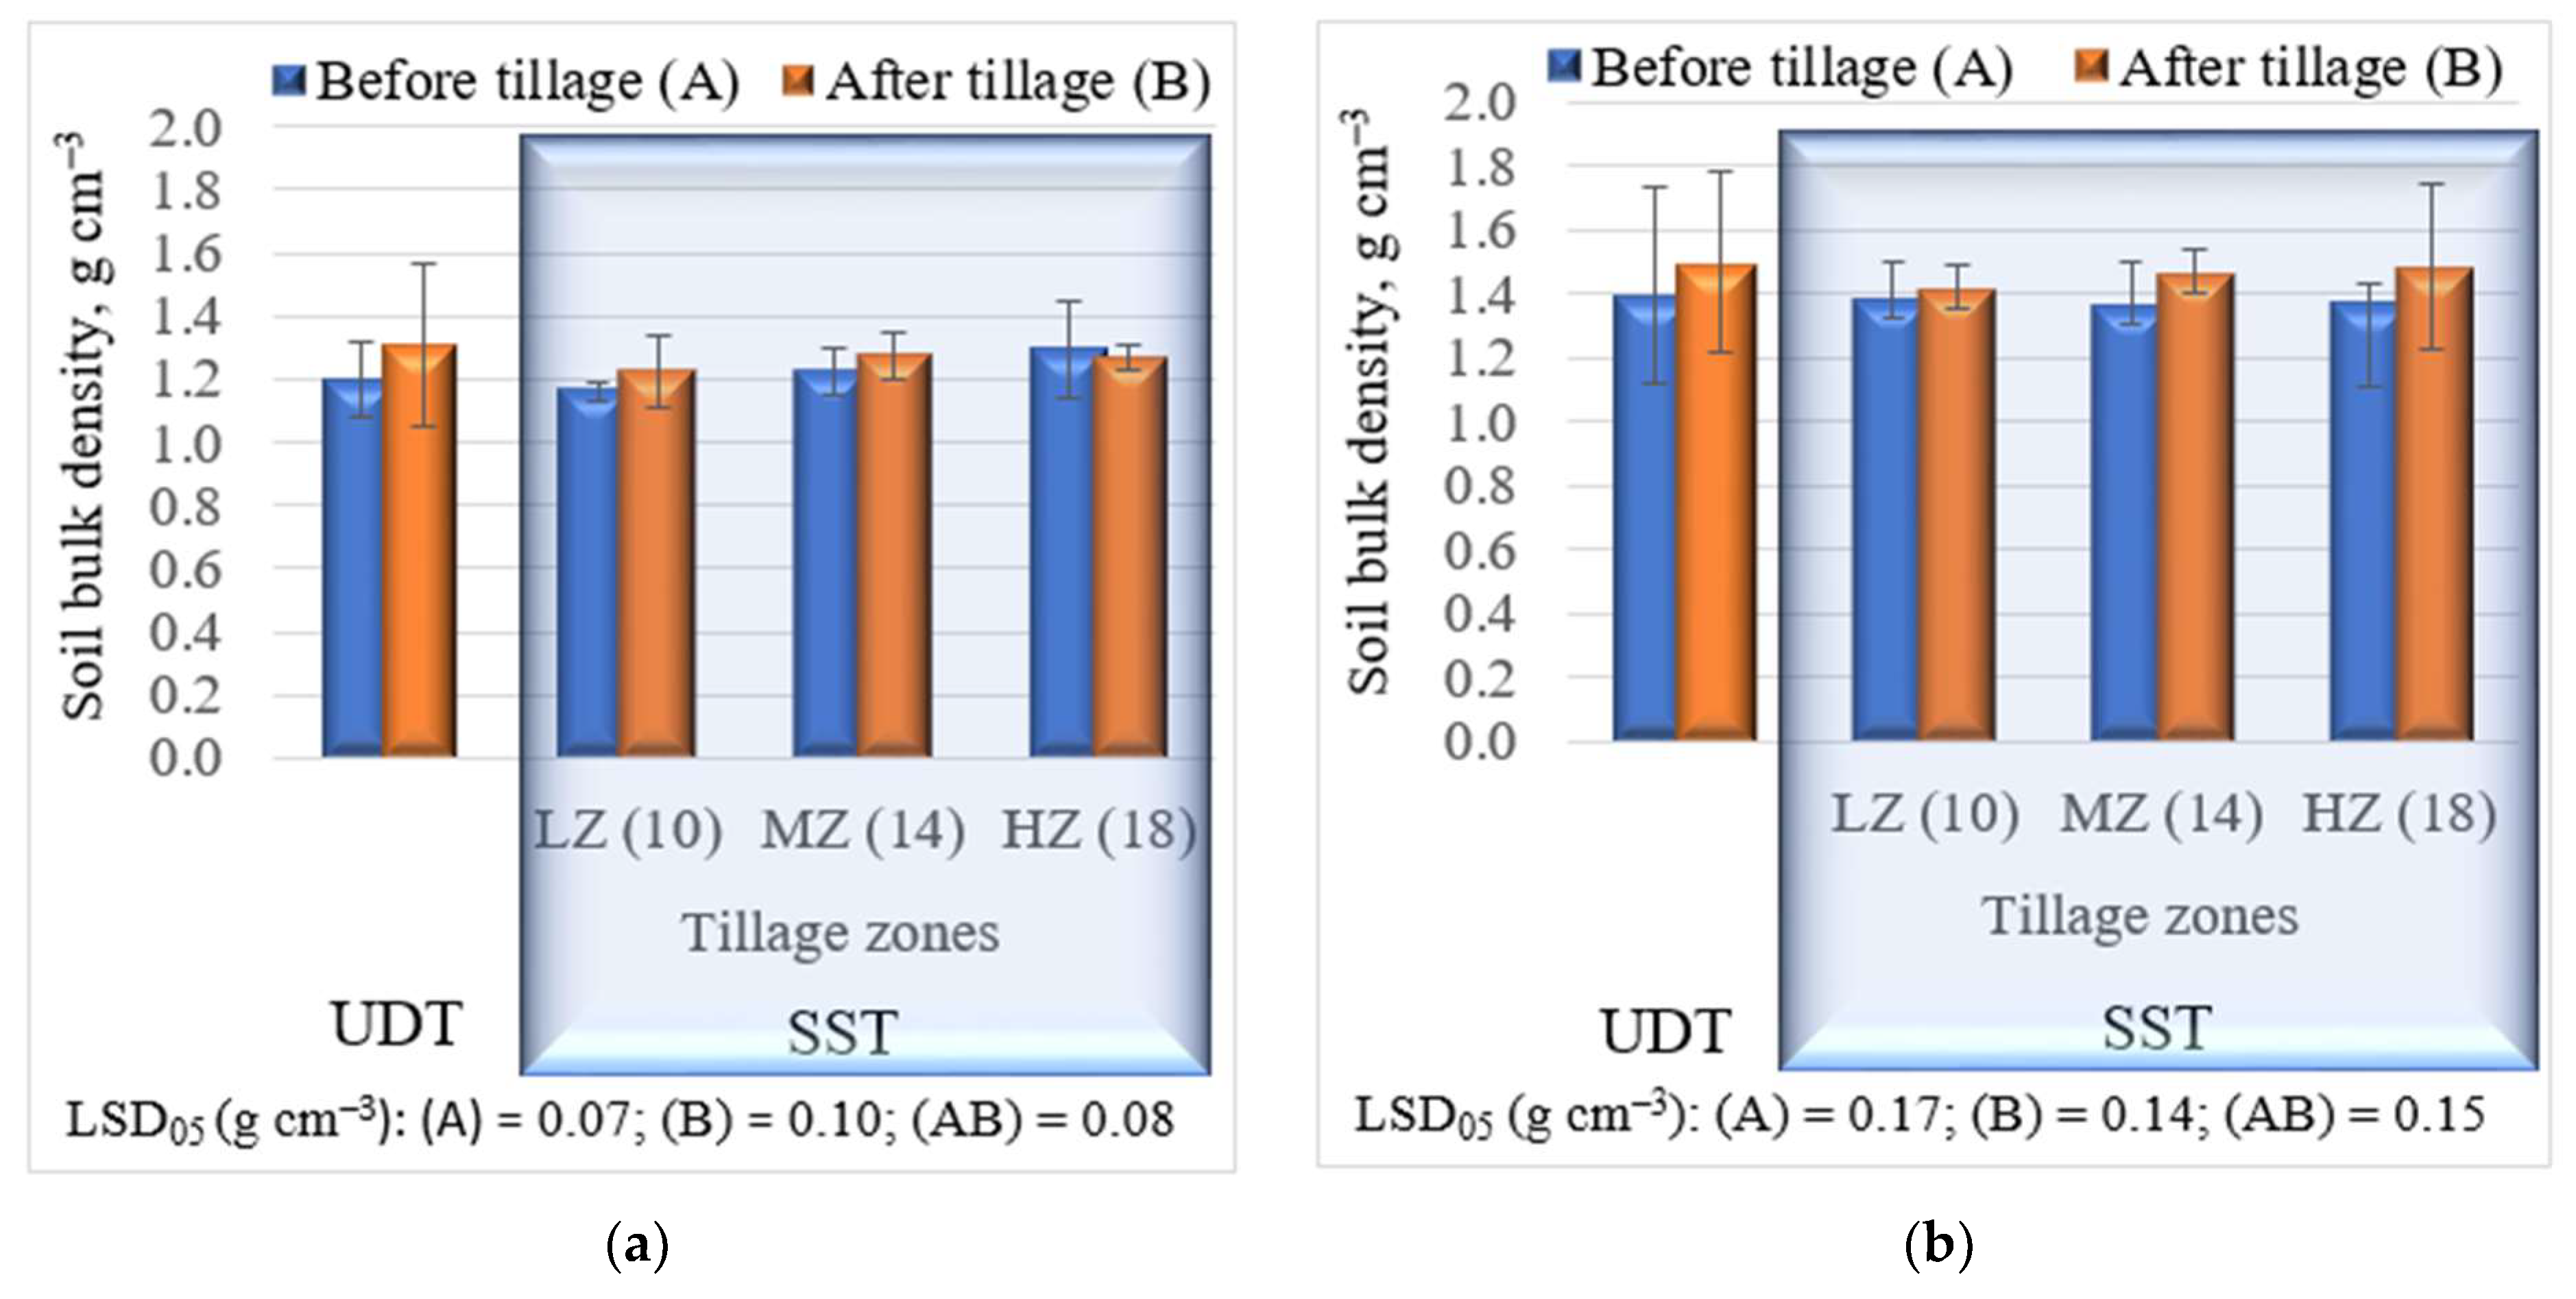
Changes in soil bulk density before and after tillage under UDT and SST are presented in
Figure 5. Under UDT, soil bulk density increased after tillage in both soil layers. In the 0–10 cm layer, bulk density increased from 1.20 ± 0.12 to 1.31 ± 0.26 g cm
−3 (9.17%), while in the 10–20 cm layer, it increased from 1.40 ± 0.34 to 1.50 ± 0.28 g cm
−3 (7.14%).
In the SST treatment, the observed responses should be interpreted in relation to the ECa-defined management zones to which the tillage depths were assigned. In the upper 0–10 cm layer, soil bulk density increased in the LZ (10) and MZ (14) tillage zones, where tillage depths of 10 and 14 cm were applied, by approximately 5% (from 1.16 ± 0.03 to 1.22 ± 0.11 g cm−3) and 4% (from 1.22 ± 0.18 to 1.27 ± 0.07 g cm−3), respectively. In contrast, in the HZ (18) tillage zone, where tillage was performed at 18 cm, soil bulk density changed only slightly, decreasing by about 1%.
In the deeper 10–20 cm layer, soil bulk density increased after tillage in all treatments. Under SST, bulk density reached 1.42 ± 0.07 g cm−3 in the LZ (10) tillage zone, 1.47 ± 0.06 g cm−3 in the MZ (14) tillage zone, and 1.49 ± 0.26 g cm−3 in the HZ (18) tillage zone, corresponding to increases of about 2%, 7%, and 8%, respectively.
The ANOVA results for soil bulk density are summarised in
Table 2. These results indicate a significant change in the 0–10 cm layer before and after the experiment (
p < 0.05), whereas differences between treatments/zones in either soil layer were not significant after tillage (
p > 0.05).
Changes in soil bulk density across SST zones may be related to tillage depth and initial soil conditions. In the LZ (10) and MZ (14) zones, the shallower tillage depth may have resulted in the surface layer re-compacting more rapidly, leading to increased soil bulk density in the 0–10 cm layer. Conversely, greater tillage depth in the HZ (18) zone may have loosened the top layer more effectively, resulting in more stable soil density. In the deeper 10–20 cm soil layer, an increase in density was observed, which could have been influenced by general soil disturbance, mechanical loads and short-term reconsolidation. However, the results were not statistically significant.
Overall, compared with UDT, SST tended to maintain more stable soil bulk density in the upper soil layer, particularly in the zone where the deepest site-specific tillage depth was applied.
3.2. Soil Moisture
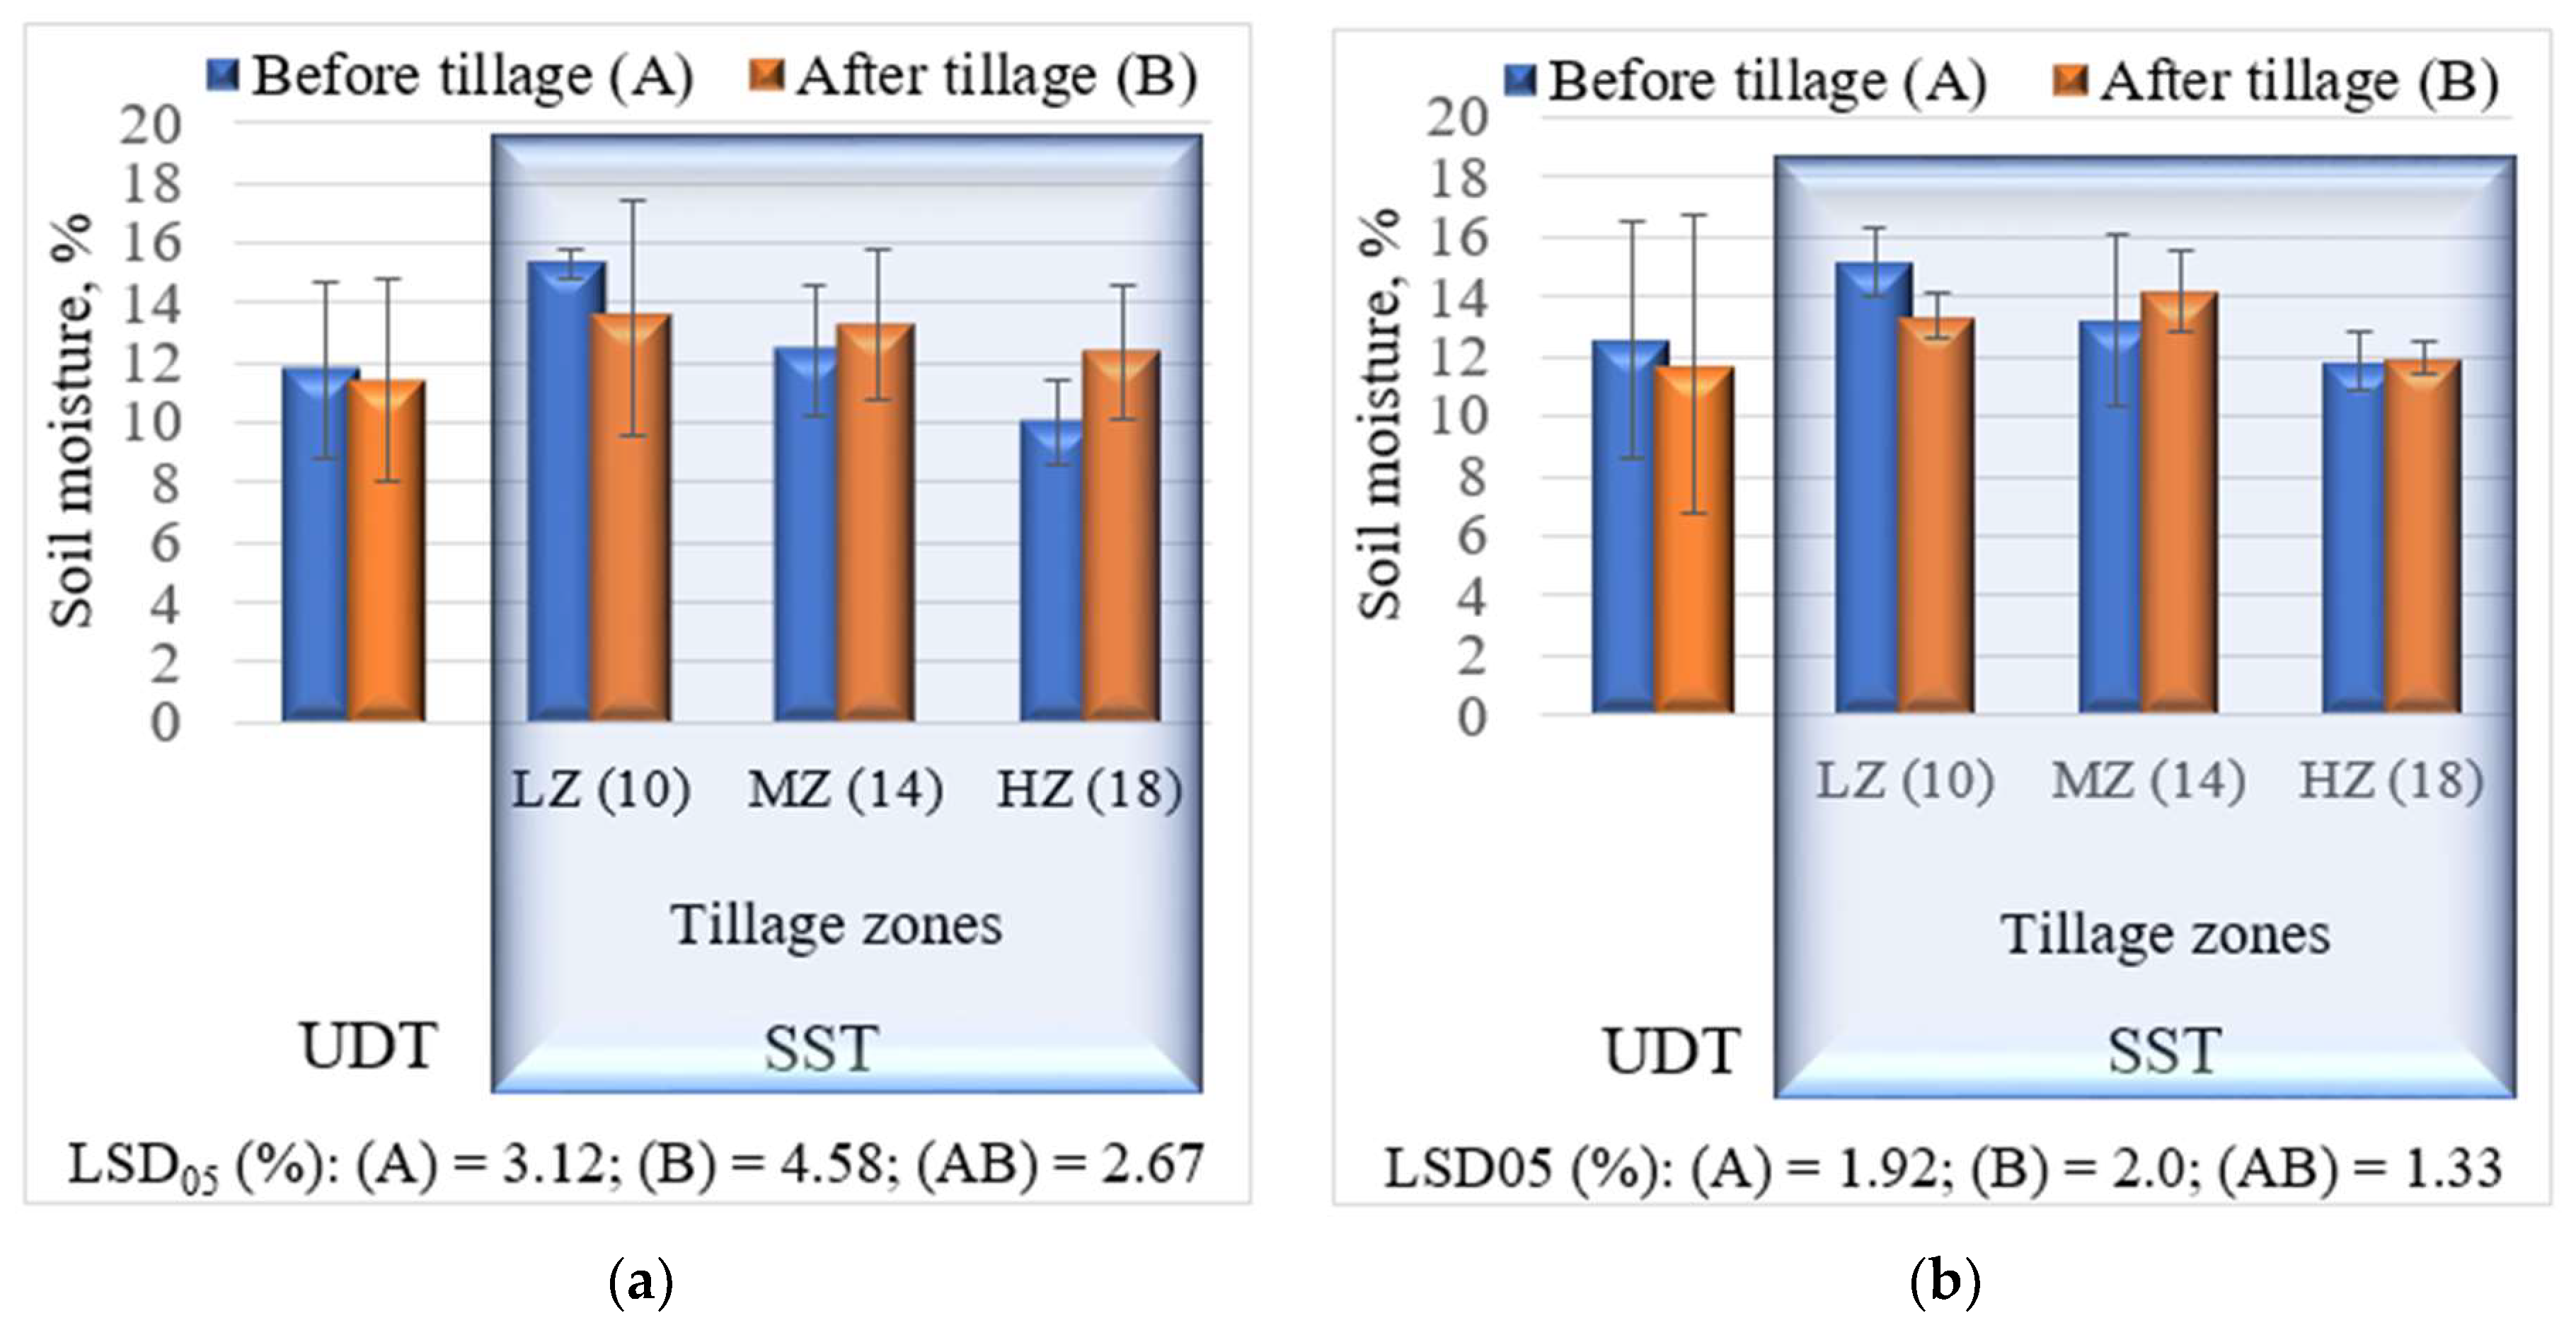
Figure 6 presents soil moisture values measured before and after tillage under UDT and SST. Under UDT, soil moisture showed only minor changes after tillage. In the upper 0–10 cm layer, moisture content decreased slightly from 11.77 ± 2.92% to 11.41 ± 3.39%.
In the SST treatment, soil moisture responses varied depending on the ECa-defined management zones associated with different tillage depths. In the upper 0–10 cm layer, moisture content decreased in the LZ (10) tillage zone from 15.26 ± 0.47% to 13.50 ± 3.93%. In contrast, moisture content increased in the MZ (14) and HZ (18) tillage zones, where greater tillage depths were applied. In the MZ (14) tillage zone, moisture increased from 12.40 ± 2.22% to 13.25 ± 2.52%, while in the HZ (18) tillage zone, it increased from 10.00 ± 1.43% to 12.30 ± 2.23%. The differences in soil moisture response between SST zones suggest that ECa-defined tillage zones reflect differences in both tillage depth and initial soil water content. The decrease in moisture in the LZ (10) zone may be related to shallower disturbance and greater exposure of the upper soil layer to aeration and evaporation immediately after tillage. Conversely, the increase in moisture in the MZ (14) and HZ (18) zones may indicate greater mixing or redistribution of moisture within the tilled layer. This could be associated with finer-textured or initially wetter soil conditions in the higher ECa tillage zones.
A similar pattern was observed in the deeper 10–20 cm layer. Under UDT, soil moisture decreased from 12.55 ± 3.94% to 11.72 ± 3.01%. Under SST, moisture content decreased in the LZ (10) tillage zone from 15.17 ± 1.12% to 13.36 ± 0.76%, increased in the MZ (14) tillage zone from 13.20 ± 2.82% to 14.21 ± 1.36%, and remained nearly unchanged in the HZ (18) tillage zone.
The ANOVA results for soil moisture are summarised in
Table 3. Significant differences in soil moisture were observed before tillage in both the 0–10 cm and 10–20 cm layers. However, before–after comparisons were not significant in either soil layer (
p > 0.05), suggesting that the observed changes in soil moisture after tillage were not statistically significant.
Although the observed moisture changes were not statistically significant, the numerical trends differed among the SST zones, suggesting that the ECa-defined tillage zones reflected not only differences in tillage depth but also in initial soil water content. The decrease in moisture in the upper layer in the LZ (10) zones may be related to shallower disturbance and greater exposure of the upper soil layer to aeration and evaporation immediately after tillage. Conversely, the increase in moisture in the MZ (14) and HZ (18) zones may indicate greater mixing or redistribution of moisture within the tilled layer. This could be associated with finer-textured or initially wetter soil conditions in the higher ECa tillage zones.
These results indicate that SST led to a more differentiated soil moisture response across the field, reflecting the adaptation of tillage depth to spatial variability in soil properties.
3.3. Soil Total Porosity
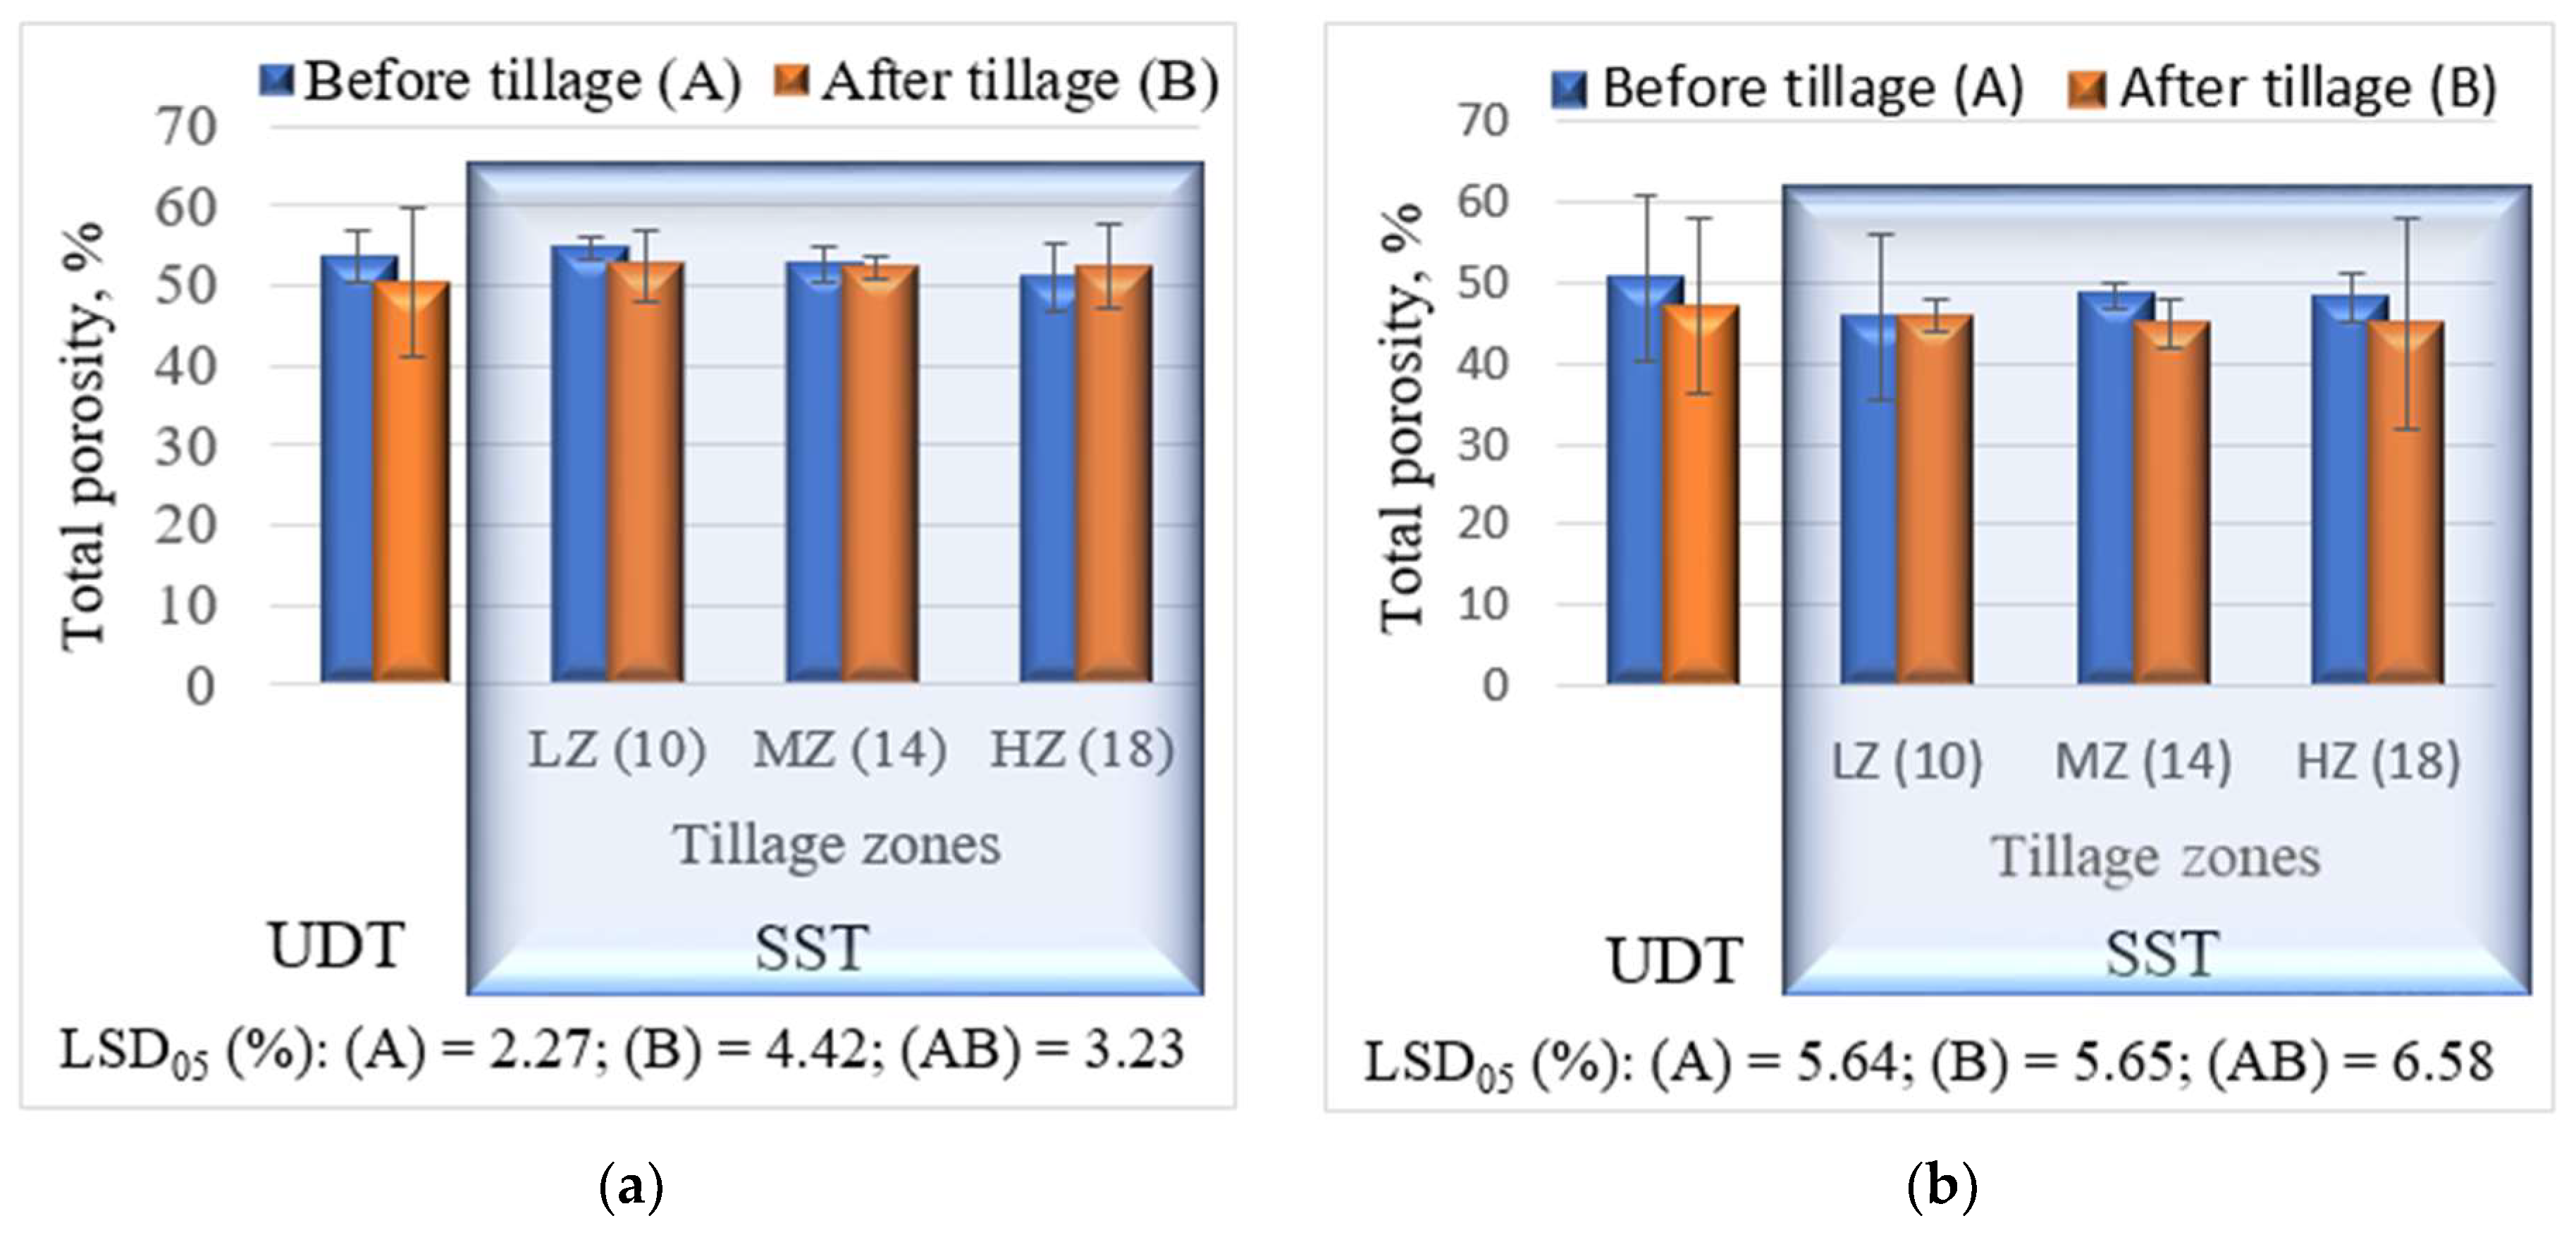
Total soil porosity before and after tillage under UDT and SST is presented in
Figure 7. In the upper 0–10 cm layer, total porosity before tillage ranged from 51.0% to 54.7%. Under UDT, total porosity in this layer decreased after tillage by 3.17%. In the SST treatment, changes in total porosity varied depending on the ECa-defined management zones associated with different tillage depths. In the LZ (10) tillage zone, total porosity decreased slightly from 54.67 ± 1.43% to 52.50 ± 2.48%. In the MZ (14) tillage zone, total porosity remained nearly unchanged, while in the HZ (18) tillage zone, it increased slightly from 51.00 ± 2.15% to 52.33 ± 1.43%.
In the deeper 10–20 cm layer, total porosity before tillage ranged from 45.67% to 50.50%. Under UDT, total porosity decreased from 50.5 ± 5.17% to 47.0 ± 5.83%. Under SST, a decrease in total porosity was observed in both the MZ (14) and HZ (18) tillage zones, from 48.33 ± 1.43% to 44.83 ± 3.13% and from 48.17 ± 3.13% to 45.00 ± 5.09%, respectively.
A more spatially differentiated response of soil porosity was observed under SST compared with UDT, with effects varying across ECa-defined tillage zones.
The total porosity values of most treatments remained close to or above 50%, which is generally considered favourable for maintaining a balanced soil water and air regime. Such porosity conditions support water storage, gas exchange and root development. Although a short-term decrease in total porosity was observed, it was not statistically significant (
Table 4). This suggests that tillage did not cause a significant short-term change in total porosity; however, some reduction tendencies, particularly under UDT, may indicate localised reconsolidation after tillage.
3.4. Aeration Soil Porosity
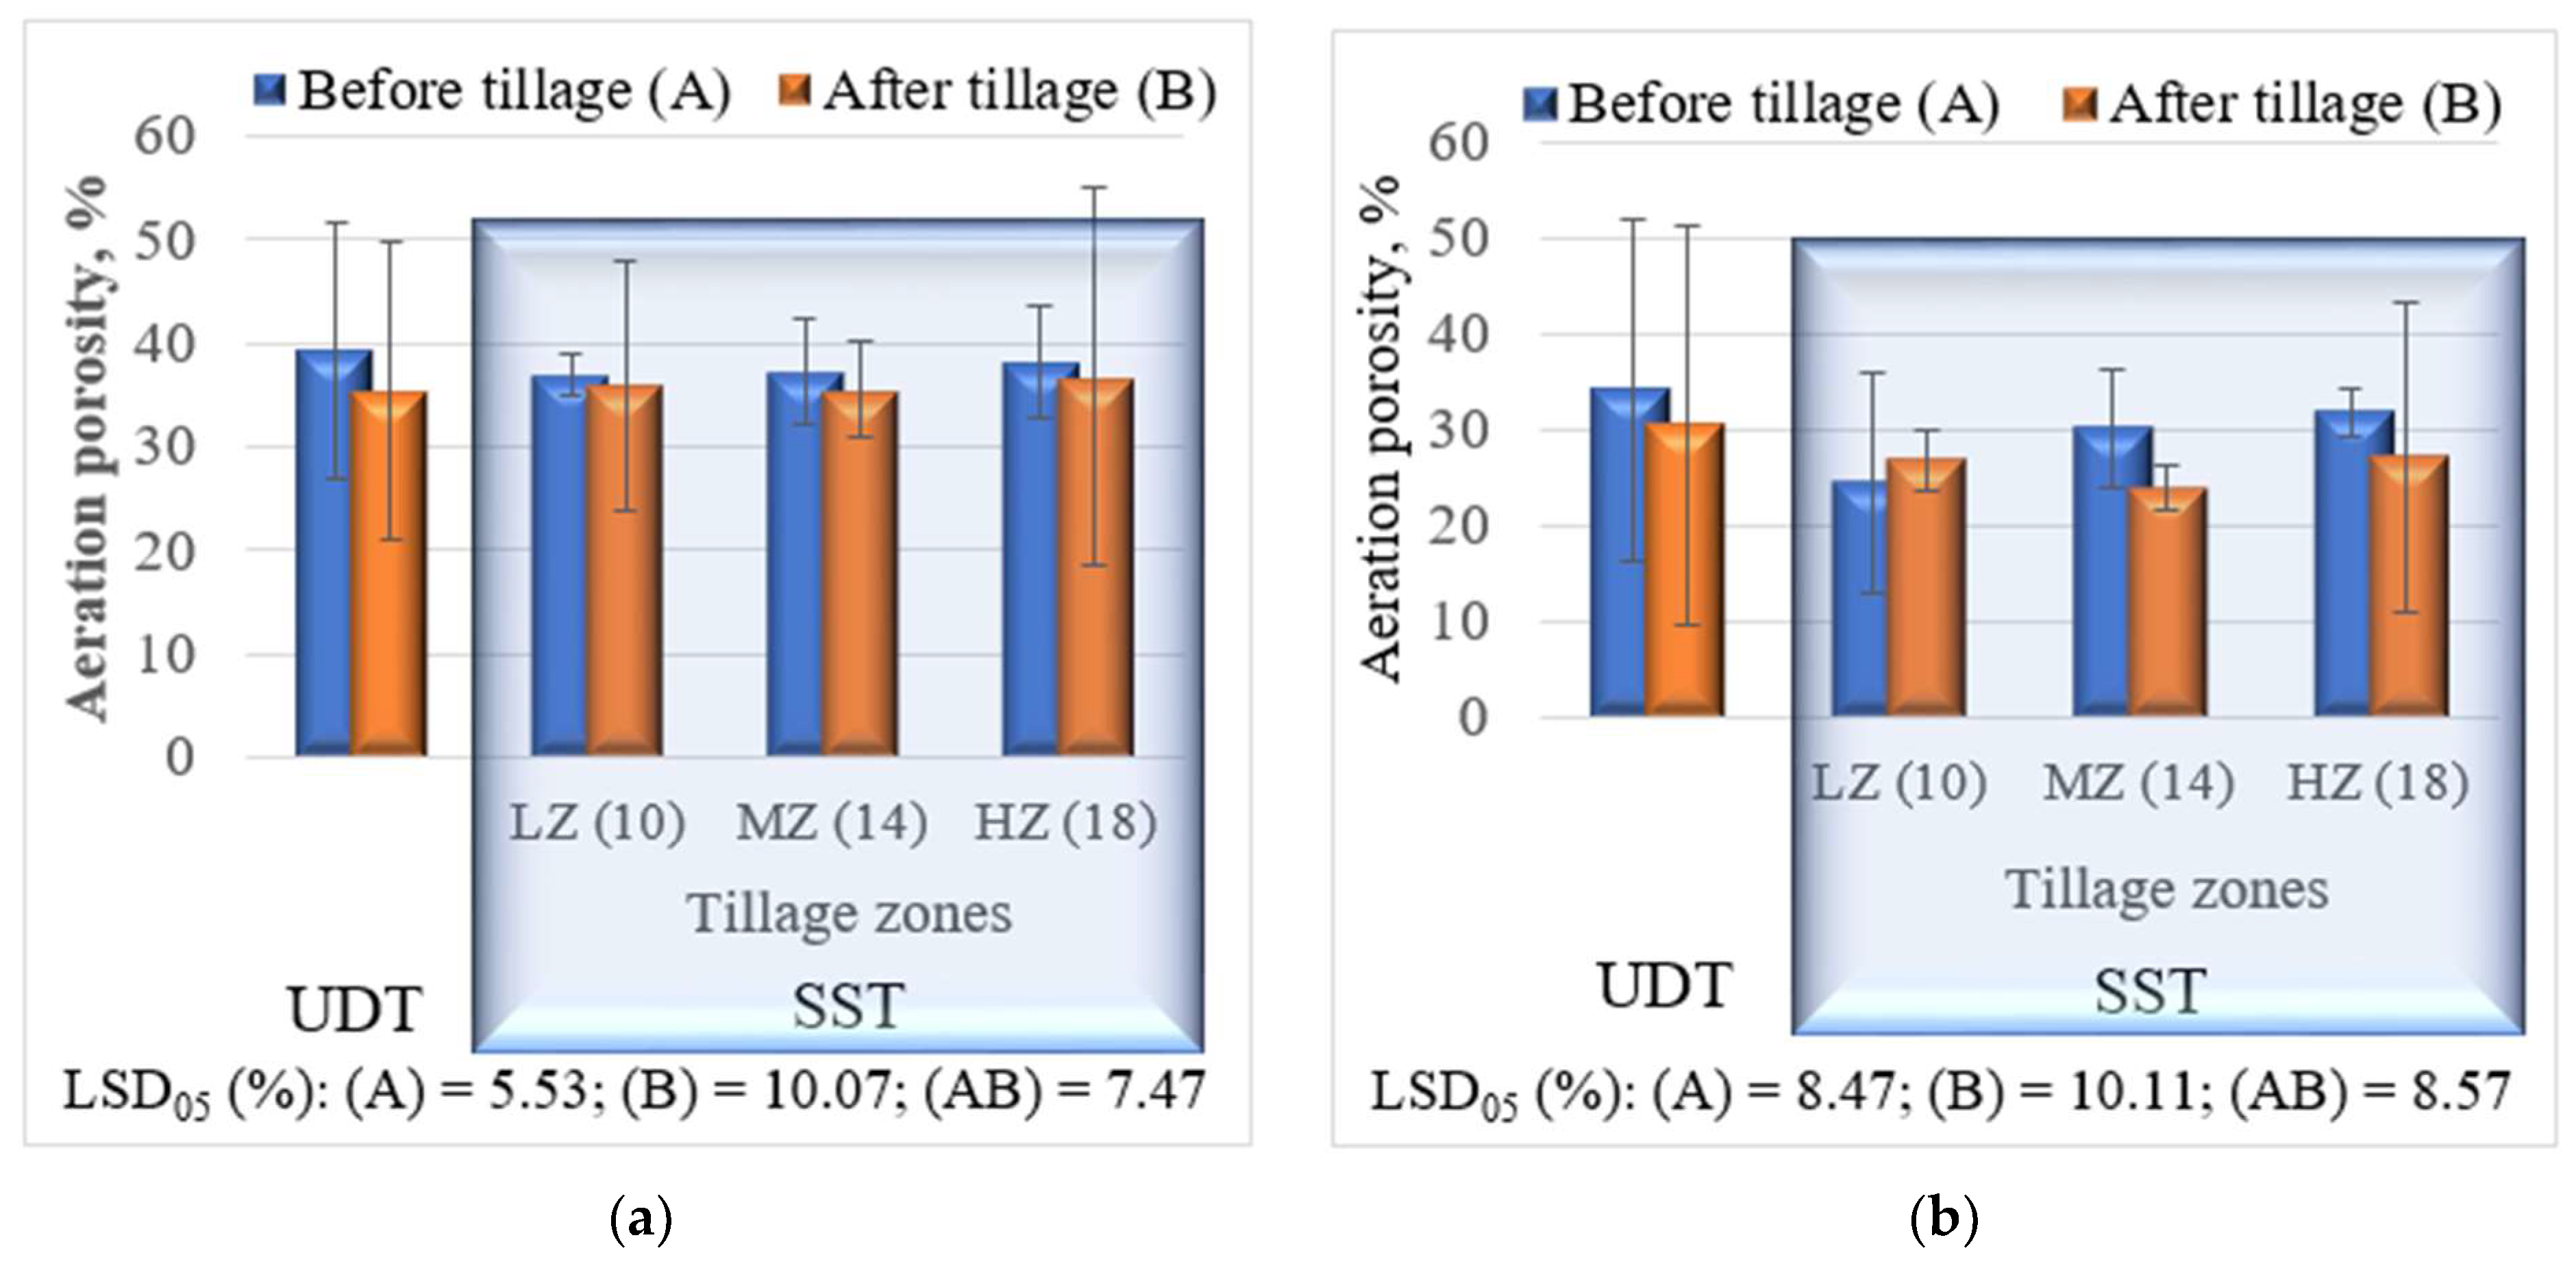
Aeration porosity before and after tillage under UDT and SST is presented in
Figure 8. In the upper 0–10 cm layer, changes in aeration porosity after tillage were relatively small for both treatments. Under UDT, aeration porosity decreased by approximately 3.91%, while under SST, the decrease was smaller, averaging about 1.37%.
In the deeper 10–20 cm layer, more pronounced differences were observed between treatments. Under UDT, aeration porosity before tillage reached 34.11 ± 8.89% and decreased after tillage. In the SST treatment, responses varied across ECa-defined tillage zones. In the LZ (10) tillage zone, aeration porosity increased slightly (by about 2.30%), whereas in the MZ (14) and HZ (18) tillage zones, aeration porosity decreased by 6.32% in the MZ (14) tillage zone and by 4.65% in the HZ (18) tillage zone.
This pattern suggests that the response of aeration porosity under SST depends on local soil conditions, with contrasting effects observed across ECa-defined tillage zones.
Table 5 presents statistical data on aeration soil porosity in different layers.
Aeration porosity values of around 25% are generally considered favourable as they indicate sufficient aeration while allowing some pore space to retain water. If the porosity is too low, however, oxygen deficiency may occur, which can restrict root respiration, reduce microbial activity and limit nutrient uptake. Conversely, excessively high aeration porosity may suggest a smaller proportion of water-filled pores, reducing soil water retention and increasing the risk of rapid drying.
3.5. Fuel Consumption and CO2 Emissions
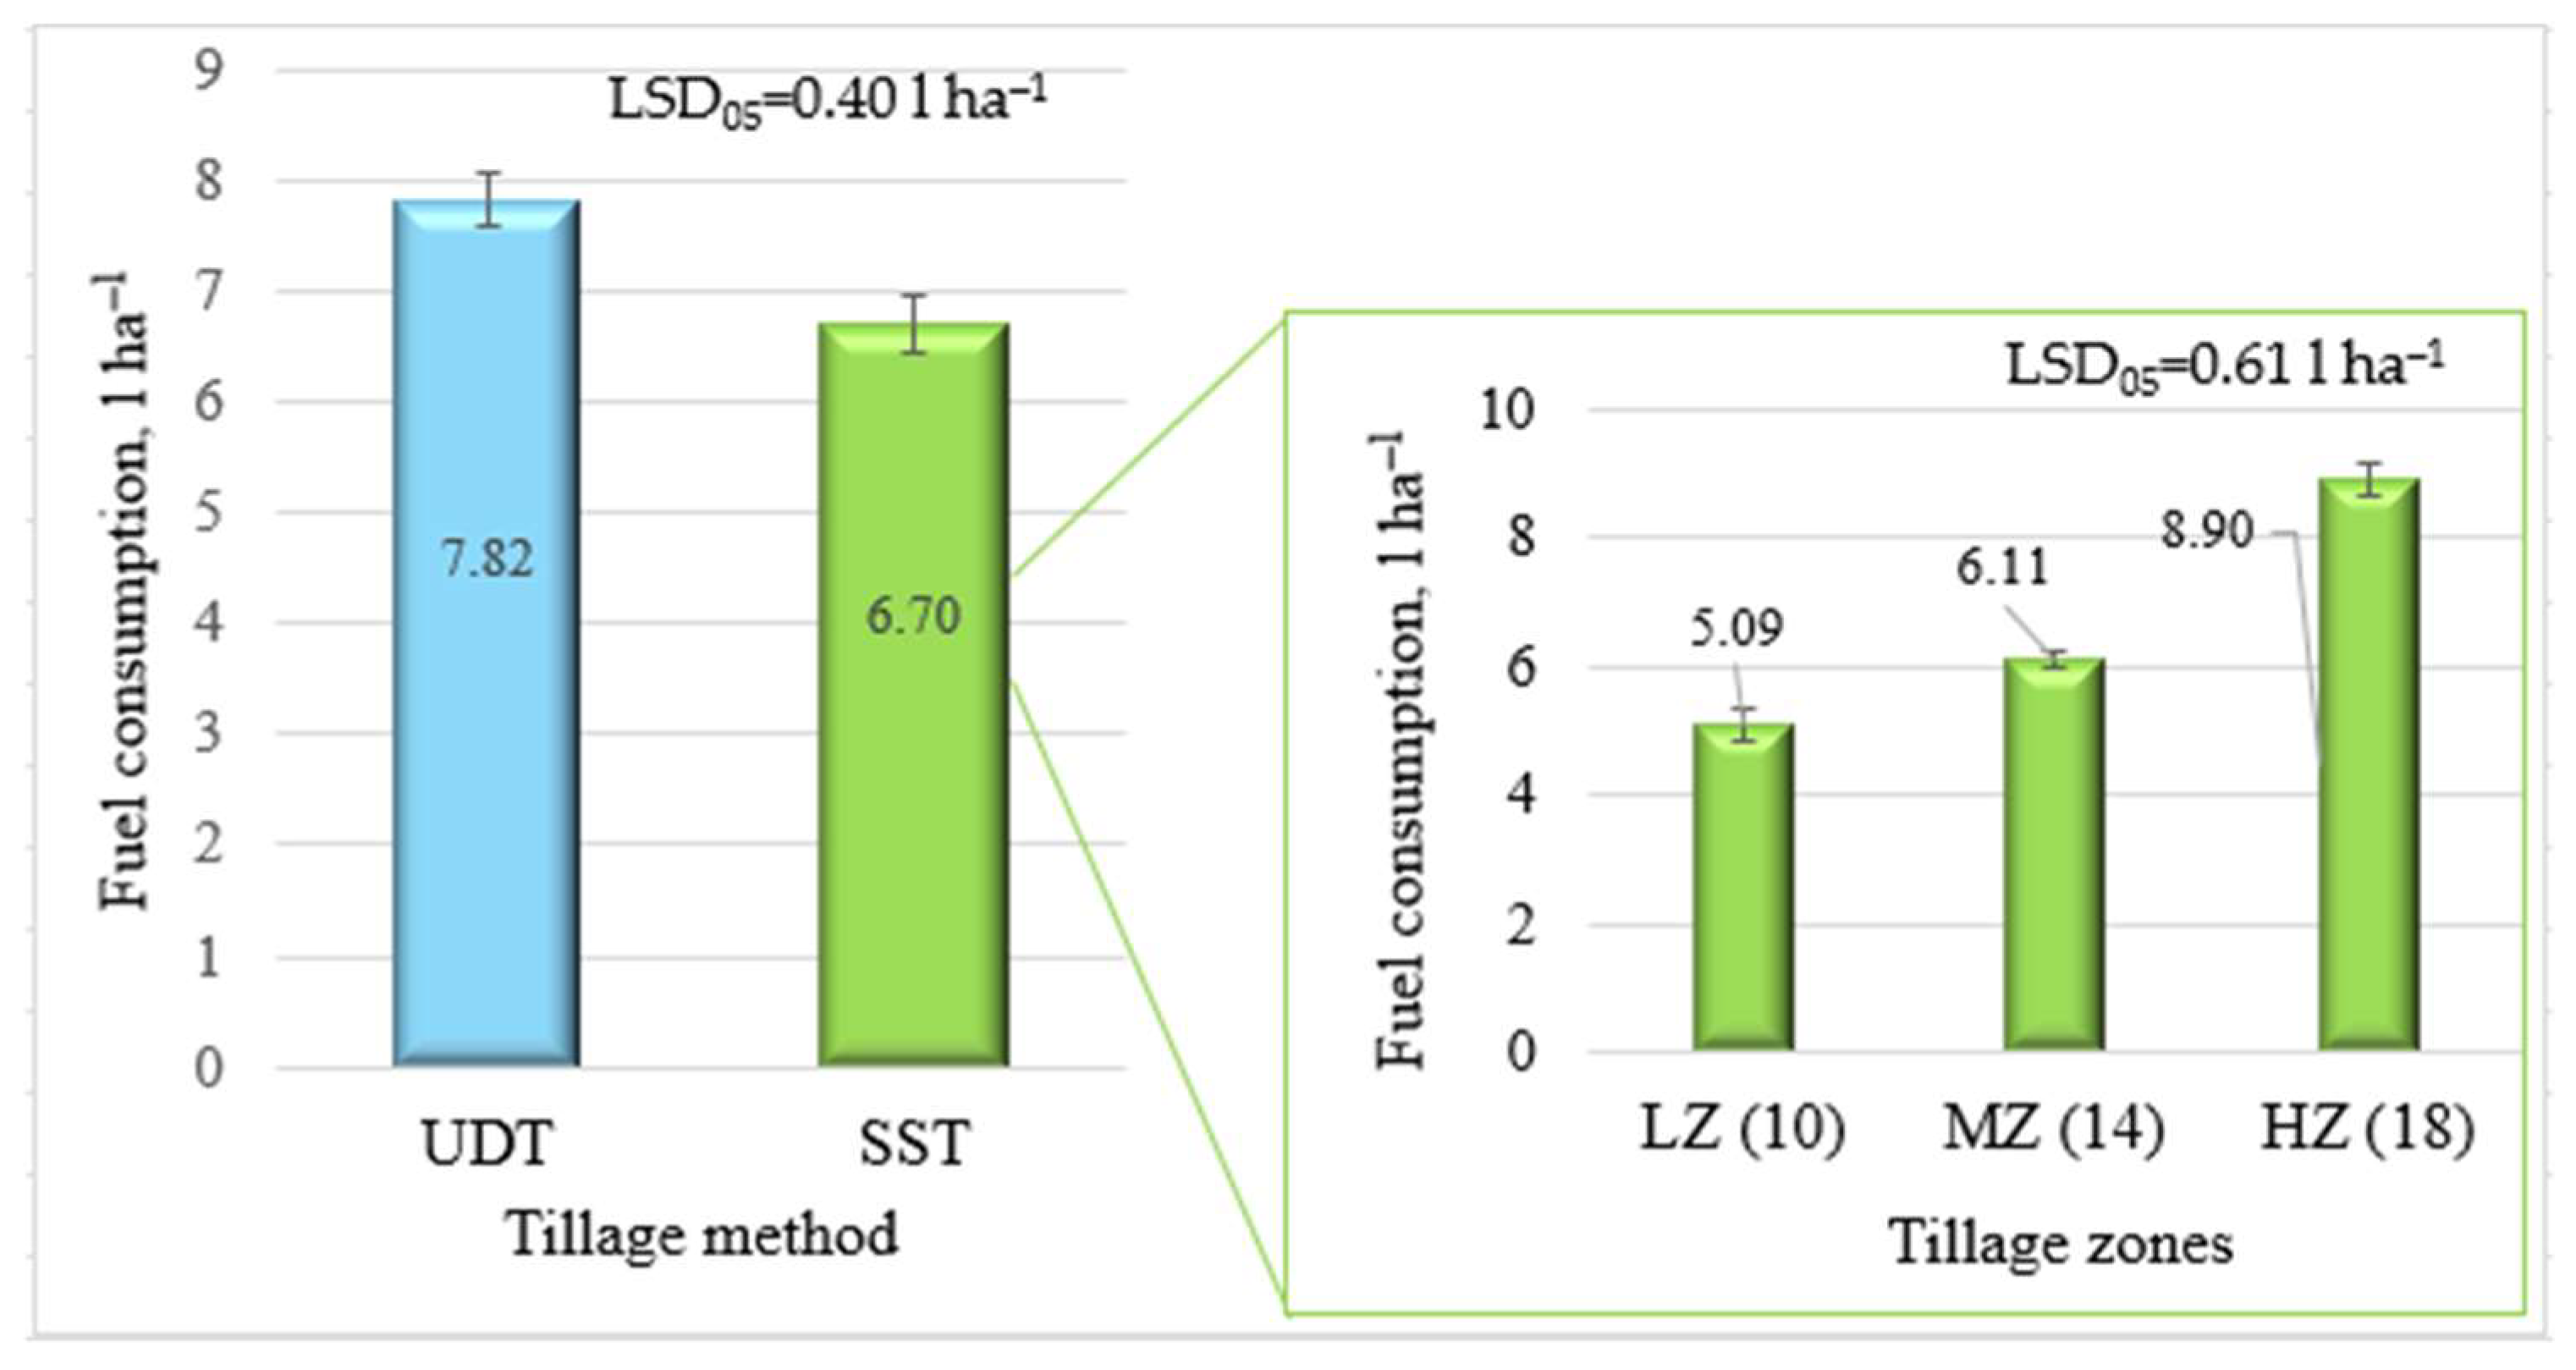
Fuel consumption per hectare under UDT and SST is presented in
Figure 9. The UDT method consumed 7.82 L ha
−1 of diesel fuel, whereas SST reduced fuel consumption to 6.70 L ha
−1, corresponding to a reduction of 14.32%.
Within the SST treatment, fuel consumption varied across ECa-defined management zones. The lowest fuel consumption was observed in the LZ (10) tillage zone, at 5.09 ± 0.15 L ha−1, followed by 6.11 ± 0.23 L ha−1 in the MZ (14) tillage zone, while the highest fuel consumption was recorded in the HZ (18) tillage zone, reaching 8.90 ± 0.40 L ha−1.
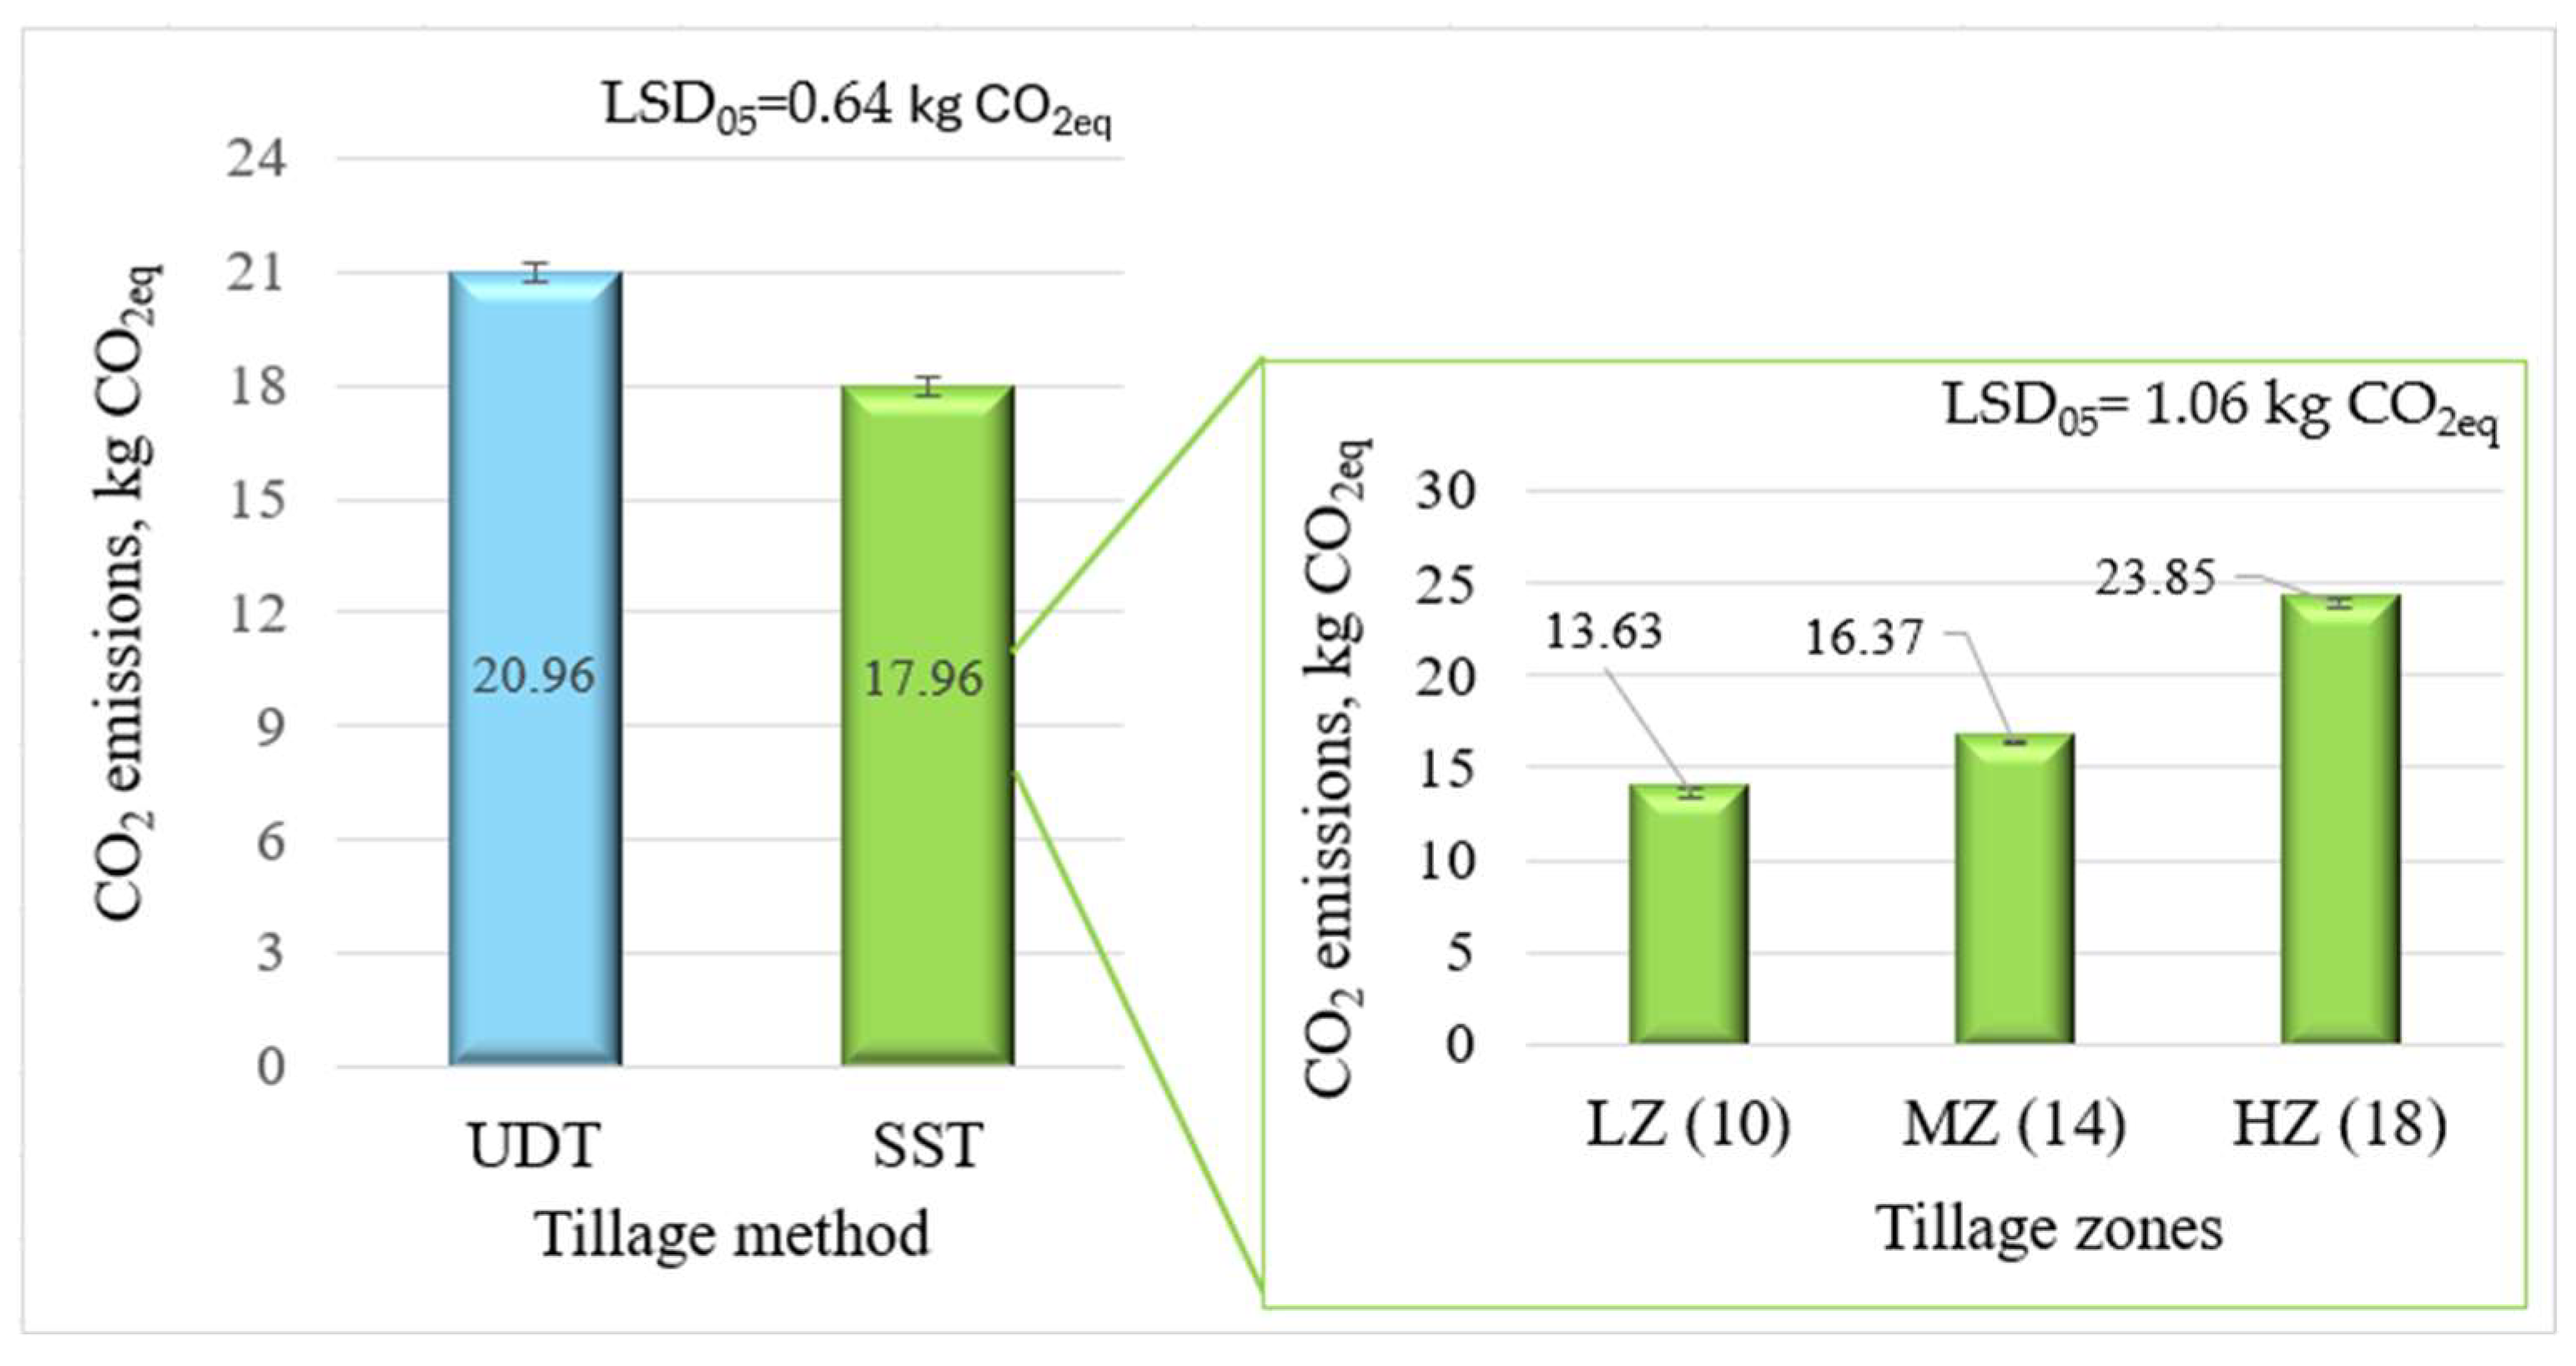
The corresponding CO
2 emissions are shown in
Figure 10. Under UDT, CO
2 emissions reached 20.96 kg CO
2 eq ha
−1. The SST method reduced emissions to 17.96 kg CO
2 eq ha
−1, reflecting the lower fuel consumption.
Across ECa-defined zones, CO2 emissions followed the same pattern as fuel consumption, ranging from 13.63 ± 1.10 kg CO2 eq ha−1 in the LZ (10) tillage zone to 16.37 ± 0.60 kg CO2 eq ha−1 in the MZ (14) tillage zone and 23.85 ± 0.39 kg CO2 eq ha−1 in the HZ (18) tillage zone.
These results show that SST can reduce fuel consumption and associated CO2 emissions compared with UDT while also revealing substantial variability across ECa-defined tillage zones.
The results of the ANOVA for fuel consumption and fuel-related CO
2 emissions are summarised in
Table 6. Significant differences were found between UDT and SST, as well as among SST tillage zones (
p < 0.05). As fuel-related CO
2 emissions were calculated directly from fuel consumption, their statistical significance followed the same pattern.
4. Discussion
4.1. Soil Structural Changes Under Site-Specific Tillage
An increase in the density of the topsoil layer following tillage may be due to the design of the cultivator’s working parts, moisture-induced re-compaction, or reduced stability of the soil aggregates and limited biotic soil restructuring immediately after disturbance. These factors may be influenced by soil texture, moisture conditions, residue management and farming practices such as traffic intensity and tillage depth in previous years. According to the literature, the net effect on the bulk density of the topsoil layer depends on the context, and long-term tillage strategies that incorporate residue management, variable tillage depths and controlled traffic can modulate these density dynamics over time [
56,
57]. The effect depends heavily on the soil type. Soils with a higher clay content, higher initial bulk density or poor structure may respond differently to tillage than sandy or loamy soils. Therefore, it is risky to make generalisations across different systems [
58,
59,
60].
The higher bulk density observed in the deeper 10–20 cm layer compared to the upper 0–10 cm layer, regardless of tillage method, indicates that soil compaction remained more pronounced below the primary cultivation zone. Similar observations were reported by Panagos et al. [
10], who also found higher bulk density values in deeper soil layers than near the soil surface. These results suggest that the short-term effects of tillage were largely confined to the cultivated layer and did not substantially modify deeper soil horizons.
Soil bulk density responses differed among ECa-defined management zones under site-specific tillage conditions, emphasising the importance of adapting tillage depth to local soil conditions. In zones characterised by higher soil compaction, deeper tillage appeared to reduce soil resistance to some extent, whereas in less compacted zones, comparable soil physical conditions were achieved with shallower tillage depths. Wang [
61] described similar relationships between tillage depth and soil compaction, although the magnitude of these effects depends strongly on initial soil conditions.
Changes in total soil porosity followed trends opposite to those observed for bulk density, reflecting the close relationship between these parameters. Lower porosity values in the deeper soil layer were associated with greater soil compaction and reduced pore volume. Under SST conditions, changes in soil porosity varied between ECa-defined management zones, demonstrating that the effects of tillage were not consistent across the entire field, but rather depended on local soil conditions. These observations are consistent with the general understanding that deeper tillage may improve soil aeration by increasing pore connectivity and facilitating air movement into deeper soil layers, although the magnitude of this response depends on soil conditions and the degree of soil disturbance.
Aeration porosity further supports this interpretation. In zones where soil compaction remained relatively high, aeration porosity decreased, suggesting limited air exchange and reduced macropore connectivity. By contrast, the slight increase in aeration porosity observed in the less compacted zones suggests that air can move more easily through the soil. Previous studies have shown that deeper tillage can increase soil porosity by creating larger pores and improving aeration and water retention [
62,
63,
64]. Such effects are particularly evident in clay and loamy soils, where improved soil physical conditions may promote root growth [
64]. However, the present study revealed contrasting results in certain zones, where aeration porosity decreased with increasing tillage depth. This may be attributed to the influence of machinery design, particularly the roller system used to maintain working depth, which could have contributed to partial soil reconsolidation in deeper layers.
The studied field had been managed under strip tillage for several years and showed no evidence of a pronounced plough pan. Under such conditions, intensive deep tillage may not be necessary, particularly in areas where soil compaction is low or moderate. These observations support the idea that adapting tillage depth to local soil conditions could help to maintain comparable soil physical conditions while also reducing unnecessary energy use and soil disturbance.
Overall, the results suggest that the effectiveness of SST depends not only on tillage depth itself but also on the spatial variability of soil conditions represented by ECa-defined management zones.
4.2. Soil Moisture Dynamics Under Site-Specific Tillage
In addition to changes in soil structure, the responses of soil moisture provided further insight into the effects of tillage specific to the site under different soil conditions. In the present study, SST produced more spatially differentiated soil moisture patterns than UDT.
In the upper 0–10 cm layer, soil moisture responses varied depending on tillage depth and local soil conditions. Soil moisture decreased after tillage in zones where shallower tillage was applied, whereas it slightly increased in the MZ (14) and HZ (18) zones, where deeper tillage depths were used. These differences may be due to variations in the intensity of soil disturbance and moisture redistribution within the tilled layer.
In the deeper 10–20 cm layer, the observed patterns suggest that subsoil conditions played an important role in soil moisture dynamics. Previous studies [
65,
66] have shown that deeper tillage can improve water infiltration and moisture storage by disrupting compacted layers and increasing macroporosity. However, the present results indicate that the response of soil moisture to tillage was not uniform across the field, but depended on local soil conditions.
The variability observed among ECa-defined management zones suggests that the effects of SST on soil moisture are influenced by the interaction between tillage depth, soil compaction and soil texture. In some zones, increasing tillage depth did not substantially change soil moisture levels, indicating that mechanical disturbance alone may not always be sufficient to modify soil water conditions in heterogeneous fields.
The observed differences in soil moisture levels between management zones suggest that the response of soil moisture to tillage is closely related to changes in soil structure within the cultivated layer. These findings suggest that the effects of SST on soil moisture were more evident in zones where tillage intensity substantially altered pore conditions and soil disturbance.
4.3. Fuel Consumption and Environmental Impact
The results of this study show that site-specific tillage (SST) can reduce fuel consumption compared with uniform-depth tillage (UDT), primarily by limiting unnecessary deep tillage in less compacted field zones. By avoiding unnecessary deep tillage in less compacted zones, SST reduces the overall energy demand of soil cultivation operations.
Based on the average retail price of marked diesel fuel intended for agricultural use in Lithuania during the study period (1.117 EUR L
−1), as provided by the Lithuanian Agricultural Data Centre [
67], a 14.32% reduction in fuel consumption when applying the SST method compared with UDT allows savings of approximately 1.25 EUR ha
−1 in fuel costs. As the tillage zones were almost equal in size, the savings per hectare were relatively small; however, over larger tillage areas and with further optimization of SST depth allocation, the economic benefits could increase.
The observed variation in fuel consumption across treatments is closely related to tillage depth and soil resistance. Greater tillage depths require higher traction forces, leading to increased fuel consumption, particularly in zones with higher soil compaction. This is consistent with previous studies, which have shown that fuel consumption increases with tillage depth and soil strength [
68,
69,
70,
71].
Within the SST treatment, fuel consumption varied substantially across ECa-defined tillage zones. The lowest fuel consumption was observed in zones where shallow tillage was sufficient, while the highest values were recorded in zones requiring deeper soil loosening. These differences illustrate how fuel demand under SST is closely related to the spatial distribution of tillage intensity within the field.
The overall economic and environmental benefits of SST are therefore strongly influenced by the proportional distribution of management zones within a field. In the present study, the ECa-defined zones occupied relatively similar areas, resulting in moderate overall fuel savings. However, substantially greater reductions in fuel consumption and associated CO2 emissions could be expected in fields where low-compaction zones requiring shallow tillage occupy a larger proportion of the total area.
Similar observations have been reported by other authors [
49], who demonstrated that the effectiveness of site-specific tillage depends on the spatial distribution of soil compaction within the field. Their results showed that adjusting ploughing depth (10, 20, or 30 cm) was most effective in fields with low to moderate compaction, resulting in substantial reductions in draught (33.7–57%), fuel consumption (29.6–50.1%), and CO
2 emissions. In contrast, in fields where a large proportion of the area was highly compacted, the potential savings were considerably smaller.
The reduction in fuel consumption under SST was directly reflected in lower CO
2 emissions, as these were calculated based on fuel use. This relationship highlights the environmental advantage of adapting tillage operations to site-specific conditions. It should also be noted that the environmental impact of tillage is not limited to fuel-related emissions. Soil CO
2 emissions may also vary depending on the intensity and depth of soil disturbance. Previous research conducted in the same region [
72] showed that CO
2 emissions were 23–62% lower immediately after shallow tillage (12–15 cm) compared with deep tillage (25–27 cm). These findings indicate that soil CO
2 emissions are influenced by factors such as soil temperature, penetration resistance, and porosity, which are directly affected by tillage practices. Similar findings have been reported by Bogužas [
73], who demonstrated that reduced tillage intensity leads to lower energy consumption and greenhouse gas emissions.
These findings suggest that the potential benefits of SST are closely related to field heterogeneity and the proportionate distribution of management zones, especially in areas where shallower tillage can be implemented on a larger scale.
4.4. Implications for Site-Specific Tillage Application
The results of this study suggest that the practical effectiveness of SST largely depends on the spatial distribution of soil compaction within a field. In the present experiment, reduced tillage depths were adequate in less compacted zones, whereas deeper loosening only provided benefits in areas where soil resistance remained high. This suggests that using the same tillage intensity across the entire field could result in unnecessary energy use in areas where intensive soil disturbance is not required.
The observed differences in fuel consumption between management zones demonstrate that the economic and environmental benefits of SST depend on the proportional distribution of tillage zones within a field. Therefore, greater savings can be expected in fields where larger areas can be managed using reduced tillage depths.
The present study was conducted in a field managed under strip tillage, where no pronounced plough pan was observed. Under such conditions, reduced tillage intensity did not result in substantial deterioration of the measured soil physical properties. This suggests that SST may be particularly suitable in fields already managed under reduced or strip tillage systems, where severe subsoil compaction is less pronounced and the need for intensive deep loosening is spatially limited. However, successful implementation of SST requires reliable field-scale information and the appropriate selection of tillage depth according to local soil conditions. In this context, ECa mapping can serve as a practical tool for identifying within-field variability and supporting differentiated tillage management. Under suitable conditions, this approach can help to reduce energy use and the environmental impact of unnecessary soil disturbance.





 ,
,