Article

DTNet: A Novel Infrared-Visible Fruit Object Detection Method Based on Dual-Modal Feature Interaction Fusion and Transformer Decoding


1
College of Smart Agriculture (College of Artificial Intelligence), Nanjing Agricultural University, Nanjing 211800, China
2
College of Engineering, Nanjing Agricultural University, Nanjing 210095, China
3
Jiangsu Province Engineering Lab for Modern Facility Agriculture Technology & Equipment, Nanjing 210031, China
*
Author to whom correspondence should be addressed.
Agriculture 2026, 16(10), 1044; https://doi.org/10.3390/agriculture16101044

Submission received: 6 April 2026 / Revised: 4 May 2026 / Accepted: 7 May 2026 / Published: 11 May 2026
(This article belongs to the Special Issue Advances in Precision Agriculture in Orchard)

Abstract

Fruit detection in orchard environments is often challenged by illumination variation, leaf occlusion, cluttered backgrounds, and dense distributions of small targets, which limit the robustness of visible-light detectors in practical applications. To address these issues, this study proposes DTNet, an end-to-end RGB-IR dual-modal detection framework for close-range fruit instance recognition. Rather than relying on single-modal appearance cues, DTNet improves detection robustness by jointly exploiting cross-modal complementary perception, fine-grained local detail enhancement, and global relational modeling, thereby strengthening the representation of small, partially occluded, and illumination-sensitive fruit targets. In addition, a multimodal balanced detection loss is introduced to improve optimization stability under class imbalance and hard-sample interference. Experiments on a grape RGB-IR object detection dataset show that DTNet achieves a Precision of 0.9132, a Recall of 0.8931, an mAP@0.5 of 0.9552, and an mAP@0.5:0.95 of 0.8001, outperforming competing methods overall. On an additional tomato RGB-IR dataset, DTNet also maintains stable detection accuracy, indicating favorable adaptability to another fruit RGB-IR detection task. The results indicate that DTNet is a promising approach for robust RGB-IR fruit detection in complex orchard environments.

1. Introduction

1.1. Background and Significance

Horticultural crops such as grapes and tomatoes play an important role in the global food supply chain and high-value fresh produce market. Accurate and timely monitoring of fruit growth status, health condition, and maturity is a key prerequisite for yield estimation, quality grading, and precision management in modern orchards and protected agriculture systems [1,2]. With the rapid development of smart agriculture, vision-based fruit object detection has become one of the core supporting technologies for applications such as automatic spraying, robotic harvesting, and yield mapping [3,4,5]. However, constructing reliable detection systems in real production environments still faces many challenges, including complex and varying illumination conditions, occlusion caused by dense foliage, similar colors between fruits and leaves, and the coexistence of different cultivars and maturity stages [6,7].

1.2. Related Work

1.2.1. Fruit Object Detection Based on RGB Images

At present, most fruit detection methods still mainly rely on RGB images and commonly adopt one-stage detection frameworks based on single-modal convolutional neural networks, particularly the YOLO family of models [8,9,10]. These methods can usually achieve satisfactory detection accuracy and real-time performance under controlled conditions [11,12]. However, their performance often degrades significantly in low-light, backlit, or overexposed scenarios, because the color and texture information in visible images tends to deteriorate or even become distorted under such conditions [8,13]. In contrast, infrared (IR) imaging can provide complementary information beyond the visible spectrum and generally exhibits stronger robustness to illumination changes and background interference. In recent years, some studies have started to apply multispectral or RGB-IR data to crop monitoring and disease detection [13,14], while others have further demonstrated the application potential of multimodal information in complex agricultural scenarios [15,16,17]. Nevertheless, systematic and in-depth research on dual-modal feature extraction and fusion architectures for fruit detection remains limited.
Early fruit detection methods mainly relied on handcrafted features such as color, texture, and shape, combined with threshold segmentation, clustering, or traditional machine learning classifiers for recognition. Although such methods are simple to implement and computationally inexpensive, they are highly sensitive to illumination variation, background changes, and occlusion, making them unsuitable for complex orchard environments. With the development of deep learning, convolutional neural networks (CNNs) and one-stage detectors have gradually become the mainstream. Guo et al. proposed YOLOv4+ based on YOLOv4 [8], which improves grape detection robustness in complex backgrounds by introducing an attention module and multi-scale feature fusion, achieving better performance than the original YOLOv4 under occlusion and illumination variation. Liu et al. proposed TomatoDet [9], which adopts an improved anchor-free structure and attention mechanism, significantly enhancing detection accuracy and speed for greenhouse tomato detection under multi-scale, small-target, and severe-overlap conditions. Pinheiro et al. used multiple pre-trained YOLO models for grape bunch detection and health status classification, and established a public dataset, demonstrating the application potential of YOLO-based methods in grape bunch quality evaluation [10]. These studies indicate that RGB-based single-modal detectors are already capable of achieving high-accuracy fruit detection in specific orchard scenarios [13,18,19,20]. Meanwhile, to meet deployment requirements in agricultural scenarios, some studies have further balanced detection speed and model complexity through lightweight network design [21,22]. In addition, recent research on lightweight fruit recognition and localization methods has further shown that improving detection stability in complex environments while maintaining real-time performance remains an important research direction in this field [23,24].
However, most of the above studies rely heavily on visible-light images and remain vulnerable under extreme imaging conditions such as low illumination, strong shadows, backlighting, and intense reflection. When fruits have colors similar to leaves or are heavily occluded, RGB color and texture features alone are often insufficient to distinguish targets from the background. Moreover, to improve detection performance in complex environments, some studies introduce deeper or wider backbones, multi-scale feature pyramids, and complex attention modules, which inevitably increase the number of parameters and computational cost, making deployment on resource-constrained agricultural robots and edge devices more difficult. Therefore, how to introduce more stable and complementary perceptual information to enhance fruit detection robustness while maintaining model lightweightness remains an open problem [25].

1.2.2. Applications of Multispectral and Multimodal Imaging in Agricultural Perception

To overcome the limitations of RGB images in complex environments, an increasing number of studies have introduced near-infrared (NIR), multispectral, or hyperspectral imaging for crop monitoring and disease diagnosis. Multispectral sensors can capture spectral information beyond the RGB bands that is related to plant physiological status, and can therefore be used to identify features such as leaf nitrogen content and early disease symptoms that are difficult to perceive in standard RGB channels. In vineyard scenarios, Barros et al. utilized a UAV equipped with a high-resolution RGB camera and a multispectral sensor to construct a multimodal vineyard dataset containing RGB images, multispectral images, and digital surface models, and systematically compared the semantic segmentation performance of grapevines under different spectral combinations and resolutions [17]. Their results showed that near-infrared bands are particularly important for distinguishing grapevines from the background, whereas high-resolution RGB images can also achieve accuracy comparable to multispectral combinations.
In plant disease detection, the combination of multispectral/hyperspectral imaging and deep learning has also shown promising prospects. Several studies have used visible and near-infrared reflectance spectra, together with methods such as principal component analysis for band dimensionality reduction, followed by BP neural networks or 3D CNNs for disease recognition, enabling early diagnosis of fungal diseases. De Silva and Brown collected multispectral tomato leaf images under different environments and climatic conditions, compared the performance of multiple traditional machine learning methods and deep learning models for disease recognition, and further evaluated the influence of illumination changes and imaging angles on model stability. They also identified key spectral channels that contributed most to disease discrimination through band importance analysis [26]. Seiche et al. compared the performance of high-end and low-cost multispectral sensors for UAV-based weed detection using deep learning models, providing guidance for sensor selection in agricultural applications [27].
Overall, these studies demonstrate the advantages of spectral and multimodal imaging in crop monitoring and disease identification. However, most of them focus on canopy-level semantic segmentation or leaf-level disease classification, with target categories such as “healthy/diseased” or “crop/weed,” which are relatively coarse-grained. For RGB-IR dual-modal detection of fine-grained fruit instances in close-range orchard scenarios, specially designed feature extraction and fusion frameworks are still lacking. Existing multimodal methods often simply stack additional spectral channels at the input level or perform concatenation and weighting at high-level features, with insufficient emphasis on fine-grained cross-modal alignment and interaction modeling.

1.2.3. Multimodal Detection Models

From the perspective of network architecture, a variety of multimodal fusion strategies have been proposed, including early fusion at the input level, late fusion at the decision level, and intermediate fusion at the feature level [28,29]. Early fusion is simple to implement, but it is difficult to preserve the modality-specific characteristics sufficiently. Late fusion, in contrast, cannot effectively correct errors that have already been produced by single-modal branches. Intermediate fusion is more flexible; however, many existing studies still rely on simple feature concatenation or addition, or are mainly designed for large-scale remote sensing scenarios rather than fine-grained fruit instances in close-range agricultural environments. At the same time, Transformer-based detectors such as DETR and RT-DETR have demonstrated strong global modeling capability and competitive performance in general object detection [30,31]. Yet, their potential in multimodal fruit detection has not been fully explored, especially in combination with lightweight local enhancement and attention modules specifically designed for small and occluded targets.
In the broader field of multimodal learning, Baltrušaitis et al. and Zhao et al. systematically reviewed multimodal machine learning and deep multimodal fusion methods, pointing out that common fusion strategies can be categorized into early fusion, intermediate fusion, and late fusion, and comparing them from the perspectives of representation learning, cross-modal alignment, and collaborative learning [28,29]. In the object detection field, some studies mainly focus on effective interaction and fusion mechanisms among multimodal features [32,33,34], while others further emphasize lightweight design and deployment efficiency in order to balance detection accuracy and real-time performance [35,36,37].
In agricultural scenarios, multimodal detection and segmentation have also received considerable attention [33,38,39]. Existing studies have introduced RGB, RGB-D, near-infrared (NIR), multispectral images, and DSM data into tasks such as weed detection, crop row recognition, and vineyard canopy semantic segmentation. They have designed early fusion strategies based on vegetation indices, intermediate fusion strategies based on feature concatenation, and late fusion strategies based on case reasoning or voting mechanisms. The results show that multimodal input can usually improve the discrimination between crops and weeds, as well as between canopies and backgrounds, to some extent. However, the fusion strategies in these methods are mostly based on fixed rules or simple operators, and their modeling of fine-grained alignment and deep interaction across modalities remains insufficient. At the same time, multispectral and multi-filter studies for plant disease recognition focus more on “which spectral channels to select” and “what network structure to use”. In multimodal detection scenarios, additional modalities are often still simply stacked or concatenated at high-level features, with limited attention paid to the fine-grained perception of fruit targets at different scales and with varying occlusion levels.
Overall, existing studies either focus on improving detection accuracy under single-modal RGB conditions or utilize multispectral/hyperspectral imaging in more macroscopic crop monitoring or disease recognition tasks. Based on the above analysis, the current close-range orchard fruit detection task still faces two main challenges.
(1) The influence of complex illumination and background environments on visible-light detection accuracy. Orchard scenes commonly involve strong direct sunlight, backlighting, shadows, leaf reflections, and partial fruit occlusion, all of which can cause significant changes or even degradation in the color and texture features of RGB images. Single-modal detection models relying solely on visible-light information are prone to missed detections and false detections under such extreme or non-uniform illumination conditions, making it difficult to maintain stable performance across all-day and multi-scene environments.
(2) Limitations of existing dual-modal fusion detection methods. Although recent studies have attempted to combine RGB with near-infrared or other multi-source data for crop monitoring or disease recognition, most methods still remain at the level of simple input stacking or high-level feature concatenation, paying insufficient attention to cross-modal alignment and deep interaction. Meanwhile, dedicated dual-modal network architectures for close-range fruit instance detection that balance both accuracy and real-time performance are still relatively scarce, making it difficult to fully exploit the complementary advantages of RGB-IR information.

1.3. Main Contributions

To address these issues, this paper develops DTNet, an end-to-end network for RGB-IR dual-modal fruit detection. DTNet adopts a dual-branch feature extraction backbone to decouple the encoding of RGB and IR images. A Dual-modal Fusion Block (DFB) is introduced at the intermediate layers to achieve multi-level feature fusion through cross-modal alignment, fine-grained information interaction, and adaptive weight allocation, thereby effectively mining the complementarity between visible and infrared information. Based on the fused features, a lightweight Transformer-based adaptive demodulation detection head is designed to explicitly model long-range dependencies among targets as well as between targets and the scene, thereby enhancing the representation capability for complex spatial layouts and densely distributed targets. Meanwhile, a Local Enhancement Module (LEM) and an Adaptive Spatial Attention module (ASA) are embedded into multi-scale feature maps. On the one hand, they strengthen fine-grained texture descriptions of small-scale and partially occluded fruits; on the other hand, they suppress background redundancy and highlight key spatial regions. Finally, considering the class imbalance and ambiguous fine-grained class boundaries in orchard data, an improved detection loss function for multimodal input is constructed to coordinate the optimization of the classification and localization branches at the loss level, thereby improving overall accuracy while alleviating bias toward dominant classes.
The main contributions of this paper are summarized as follows:
(1) To address the insufficient robustness of single-modal detection in complex orchard scenarios, an end-to-end RGB-IR dual-modal fruit detection network, DTNet, is proposed. The network constructs a decoupled dual-branch feature extraction backbone to encode RGB and IR images separately at multiple levels, and designs a lightweight detection head for global relational modeling on top of the fused features. By organically combining the local detail representation capability of convolutional networks with the long-range dependency modeling capability of attention mechanisms, the proposed method significantly improves detection stability for small targets, occluded targets, and complex illumination scenarios on grape and tomato dual-modal object detection datasets.
(2) To overcome the limitation that traditional multimodal fusion methods often rely on simple channel concatenation and cannot fully exploit cross-modal complementary information, DFB is designed in DTNet. By aligning, interacting with, and adaptively aggregating RGB and IR features at multiple stages of image feature extraction, DFB enables more effective utilization of dual-modal complementary information while maintaining network lightweightness, thereby improving the discriminability and robustness of feature representations.
(3) To address the problem of fruit targets being small, densely distributed, and easily occluded by leaves, LEM and ASA are introduced into the feature pyramid. Specifically, LEM focuses on enhancing fine-grained local texture, boundary, and weak-structure representations for small-scale and partially occluded fruits, whereas ASA focuses on cross-scale feature interaction and spatial saliency reweighting to suppress background redundancy and highlight key fruit regions. Through this complementary design, the proposed framework achieves finer perception of small-scale, overlapping, and partially occluded fruit targets, thus improving detection accuracy with low additional computational cost.
(4) To address the insufficient optimization caused by class imbalance and subtle appearance differences among classes in orchard data, an improved detection loss function for multimodal input, termed Multimodal Balanced Detection Loss (MBDL), is proposed. By introducing targeted weights and constraint terms into the classification and localization branches, the method enhances attention to minority classes and hard samples, while coordinating classification confidence and bounding-box regression quality. As a result, a more balanced optimization process is achieved in multi-class fruit detection tasks, effectively alleviating model bias toward dominant classes.
The remainder of this paper is organized as follows. Section 2 presents the materials and methods, including the proposed DTNet framework, key module designs, datasets, evaluation metrics, and implementation details. Section 3 reports the experimental results, including baseline selection, comparative experiments, ablation studies, evaluation on an additional fruit dataset, and qualitative comparisons. Section 4 discusses the findings, limitations, and future research directions of the study. Section 5 concludes the paper. The overall organization follows the revised manuscript structure required by the journal.

2. Materials and Methods

2.1. Experimental Materials and Dataset Description

This study used two publicly available registered RGB-IR fruit datasets to evaluate the proposed DTNet, including a grape multimodal object detection dataset and a tomato multimodal object detection dataset with different maturity stages. Since both datasets were obtained from public repositories rather than collected by the authors, the dataset source and image acquisition information reported in this study follow the corresponding public dataset descriptions in Refs. [40,41]. The grape dataset was publicly released in 2023, whereas the tomato dataset was publicly released in 2025.

2.1.1. Grape RGB-IR Dataset

The main experiments were conducted on a public grape RGB-IR multimodal object detection dataset [40]. The dataset contains registered RGB-IR image pairs acquired in natural vineyard environments and annotated for object detection. According to the public dataset description, the multimodal images were captured using an Azure Kinect sensor (Microsoft Corporation, Redmond, WA, USA) at a resolution of 1280 × 720 in Hefei, Anhui Province, China. In this study, a total of 3954 image pairs were used, including 3163 pairs for training and 791 pairs for validation, corresponding to a fixed train/validation split ratio of 8:2 (80% for training and 20% for validation). The object categories were green_grape and purple_grape.

2.1.2. Tomato RGB-IR Dataset

To further evaluate the applicability of DTNet on an additional fruit RGB-IR detection task, a public tomato RGB-IR multimodal dataset with different maturity stages was used for additional-dataset evaluation [41]. Public dataset descriptions indicate that the source dataset includes multimodal tomato samples acquired under four lighting conditions, namely natural light, artificial light, low light, and sodium yellow light. In the present study, 1000 registered RGB-IR image pairs were selected from the public dataset, among which 800 pairs were used for training and 200 pairs were used for validation, corresponding to a fixed train/validation split ratio of 8:2 (80% for training and 20% for validation). The object categories were immature, half-ripe, and ripe.

2.1.3. Annotation, Data Selection, and Split Strategy

All images used in this study were registered RGB-IR image pairs with object detection annotations. For both datasets, a fixed train/validation split ratio of 8:2 was adopted, that is, 80% of the samples were used for training and 20% for validation. Specifically, for the grape dataset, all 3954 image pairs provided in the selected object detection subset were used and split into 3163 training pairs and 791 validation pairs. For the tomato dataset, 1000 image pairs were selected from the public source dataset and divided into 800 training pairs and 200 validation pairs. During training and inference, the paired RGB and IR images were synchronously loaded and resized to 512 × 512.

2.2. Overall Network Architecture

This study focuses on multi-class fruit object detection in close-range orchard scenarios. Given a registered RGB-IR image pair, the objective is to predict the bounding boxes and category labels of all fruit instances in the scene, including green grapes and purple grapes in the grape dataset, as well as immature, half-ripe, and ripe tomatoes in the tomato dataset. The network is required to maintain high detection accuracy under conditions of complex illumination, severe occlusion, and cluttered backgrounds, while also taking into account inference efficiency on agricultural robots and edge devices.
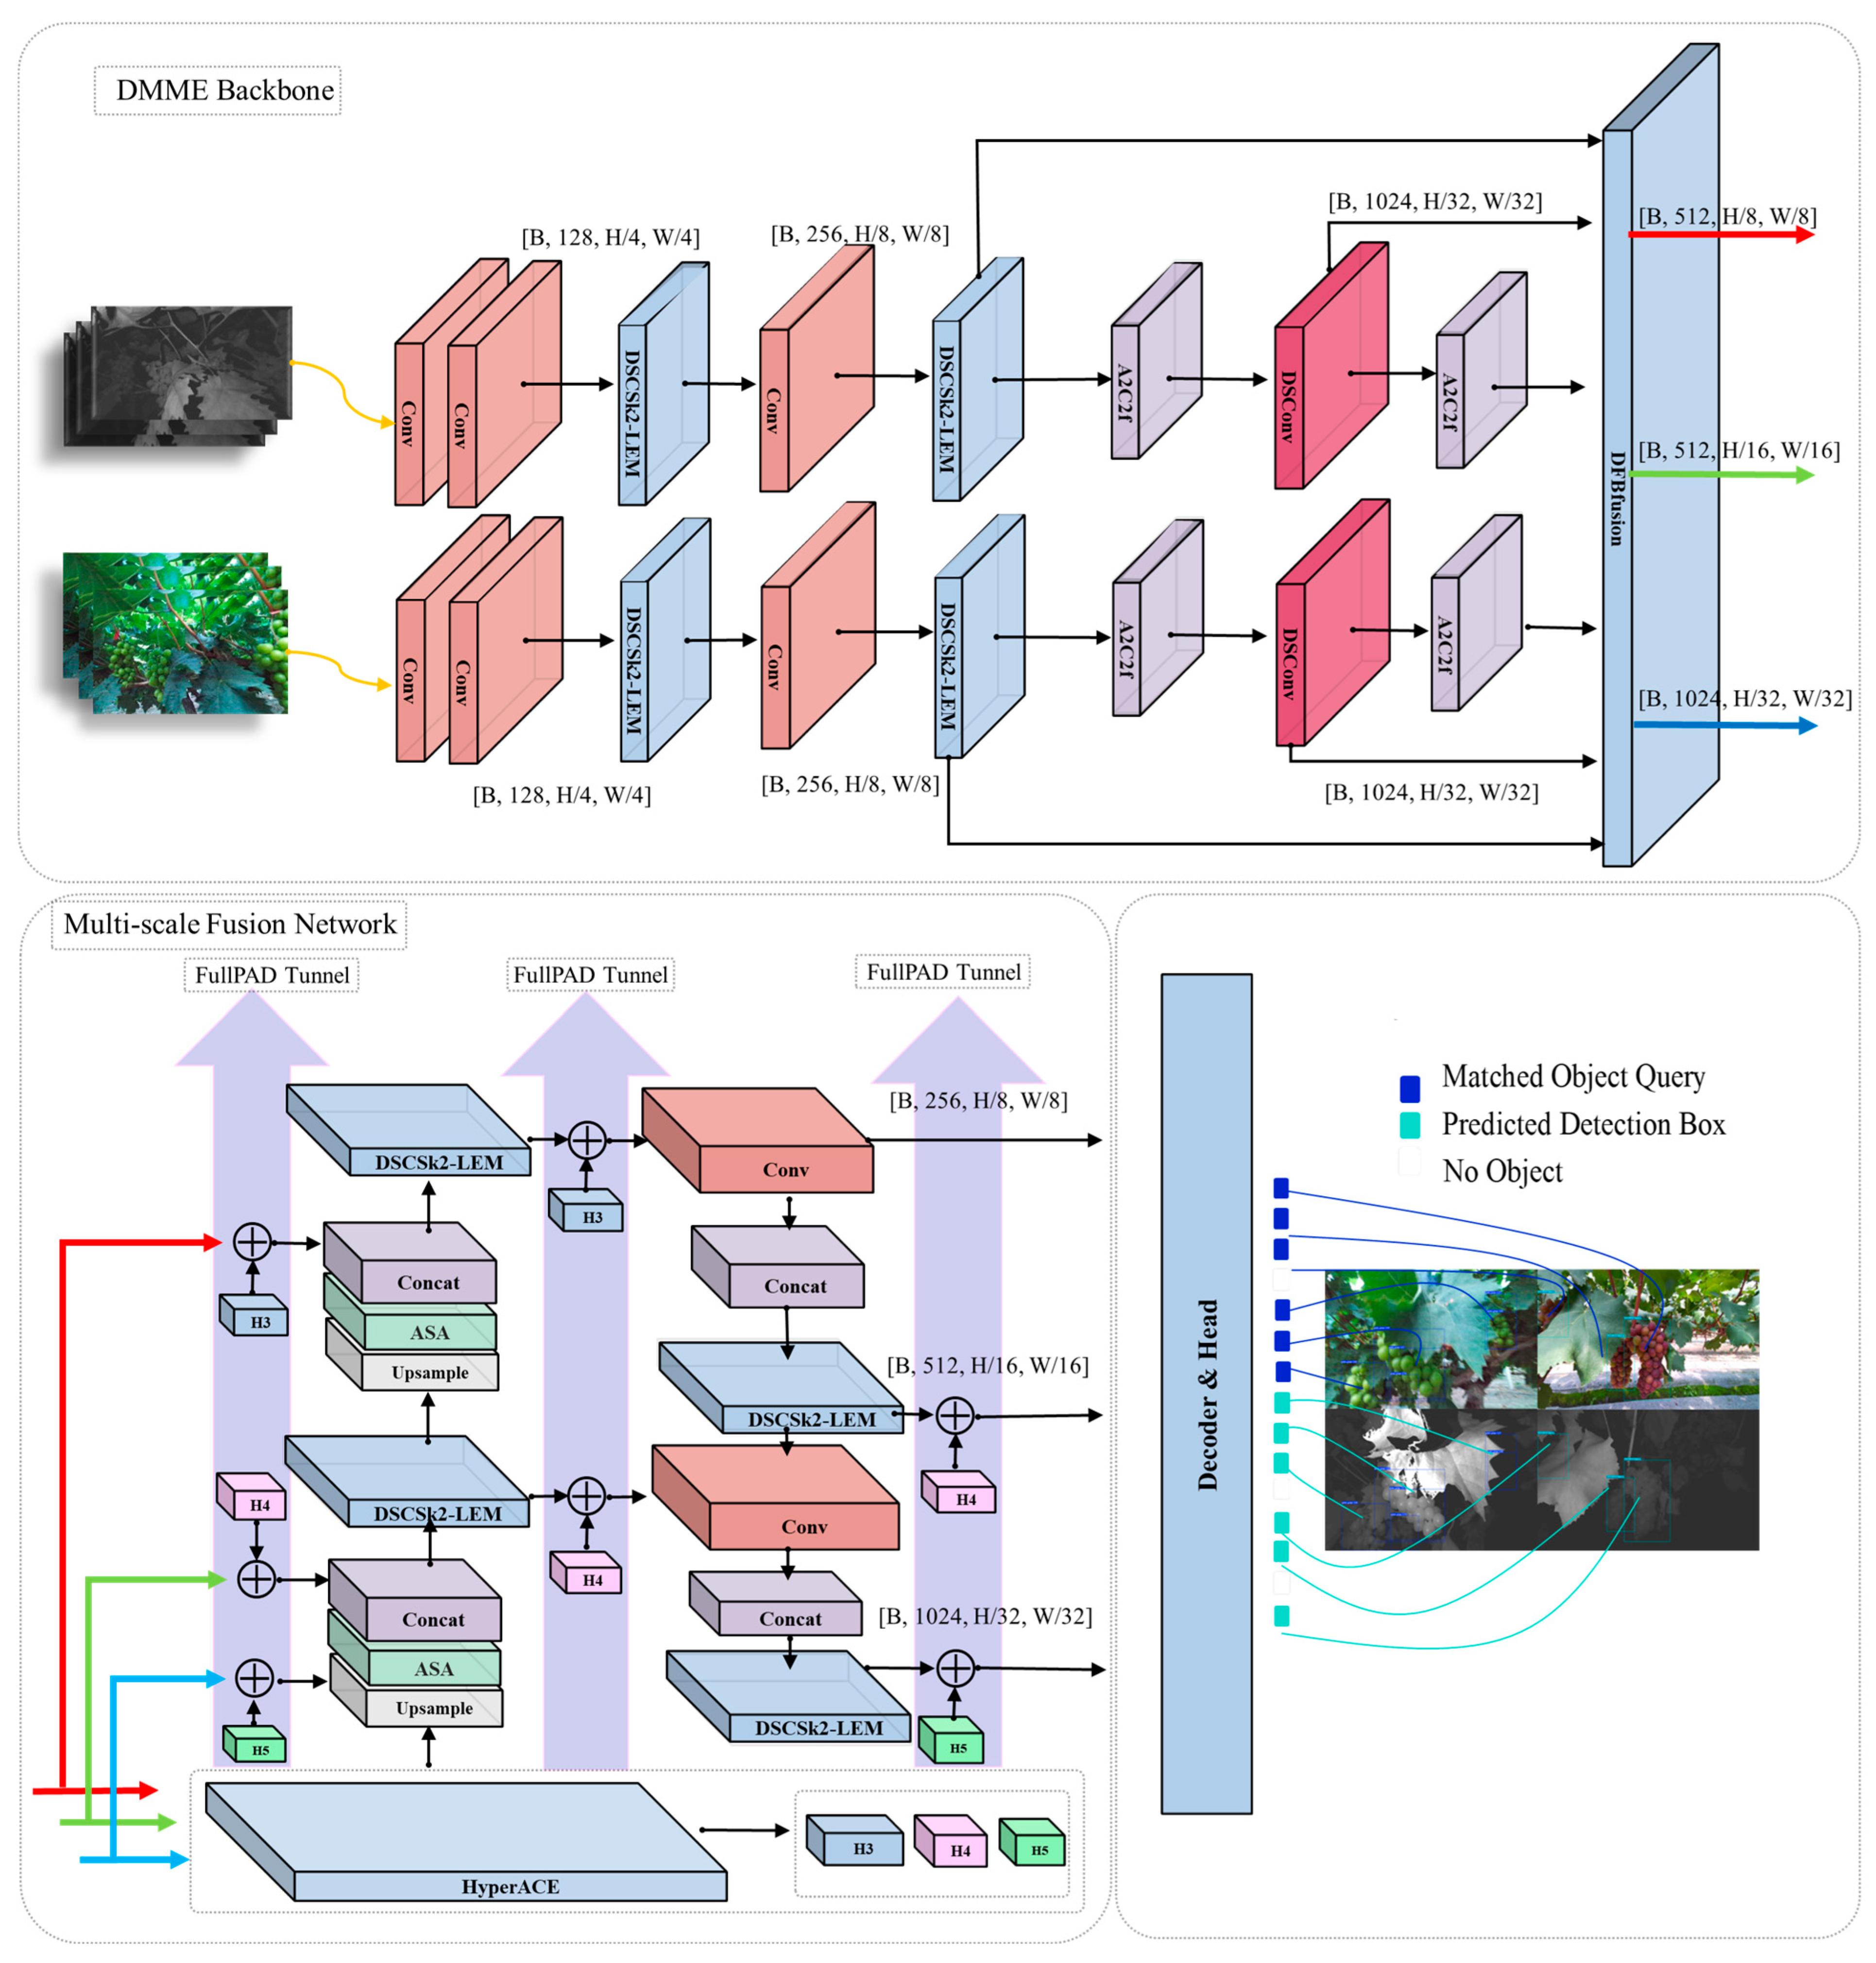
To this end, an end-to-end dual-modal detection network, DTNet, is constructed. DTNet consists of an RGB-IR dual-branch backbone, a Dual-modal Fusion Block (DFB), a Local Enhancement Module (LEM), an Adaptive Spatial Attention module (ASA), and a Transformer-based adaptive demodulation detection head. As shown in Figure 1, the overall architecture of DTNet is developed based on the published YOLOv13 framework [42] and its feature pyramid design, with several targeted modifications for RGB-IR fruit detection. In this study, YOLOv13 refers to the published version proposed by Lei et al. rather than a custom baseline defined by the authors:
(1) Lightweight feature extraction branches are separately constructed for RGB and IR in the backbone to preserve the modality-specific representation capability of each modality.
(2) At the medium- and high-level semantic feature scales, DFB is used to realize intermediate cross-modal alignment and fusion of RGB and IR features, yielding multi-scale joint representations.
(3) LEM and ASA are embedded into key nodes of the backbone and FPN/PAN, where LEM is used to enhance local detail and boundary representation, while ASA is used to strengthen cross-scale spatial interaction and salient-region emphasis.
(4) The fused multi-scale features are fed into a Transformer-based adaptive demodulation detection head to output the class probabilities and bounding-box parameters of fruit targets in a unified manner.
In the underlying published YOLOv13 architecture, HyperACE denotes the Hypergraph-based Adaptive Correlation Enhancement module, which is used to aggregate multi-scale features and capture high-order correlations across locations and scales. FullPAD denotes the Full-Pipeline Aggregation-and-Distribution paradigm, and the FullPAD Tunnel in Figure 1 refers to the feature propagation path that redistributes the correlation-enhanced features generated by HyperACE to different stages of the network pipeline. These components are inherited from the published YOLOv13 baseline and are retained in Figure 1 only to present the complete underlying architecture on which DTNet is built, rather than as newly proposed modules of this study.
During training, DTNet takes paired RGB-IR images and the corresponding annotated bounding boxes as input, and jointly optimizes the dual-branch backbone, DFB, LEM, ASA, and detection head in an end-to-end manner. During inference, the network requires only a single forward pass to complete detection and classification of all fruit objects in the image, which supports practical deployment-oriented inference in intelligent agricultural perception scenarios.
For convenience of description, the three detection feature maps in the feature pyramid, from high resolution to low resolution, are denoted as P3, P4, and P5, respectively.

2.3. RGB-IR Dual-Branch Backbone and Dual-Modal Fusion Block (DFB)

The detailed structure is shown in Figure 2.

2.3.1. Dual-Branch Feature Extraction Backbone

Considering the significant differences between RGB and IR in spectral response, texture information, and noise characteristics, DTNet adopts a decoupled dual-branch backbone to extract features from the two modalities separately. The two branches are structurally symmetric: shallow layers use standard convolution and depthwise separable convolution for spatial downsampling and channel expansion, while the middle and high layers employ improved residual structures and local enhancement units to progressively extract multi-scale features ranging from fine-grained textures to high-level semantics.
On the one hand, this design avoids the mutual interference caused by premature modality mixing in shallow layers, which helps preserve the advantages of RGB in color and texture as well as the stability of IR under illumination variation and occlusion. On the other hand, it provides structurally aligned and semantically corresponding feature inputs for the subsequent intermediate fusion performed by DFB, which is beneficial for cross-modal interaction at multiple scales.

2.3.2. Dual-Modal Fusion Block (DFB)

To fully exploit the complementary information between RGB and IR, DTNet introduces the DFB at multiple semantic scales. Let the feature maps from the RGB branch and the IR branch at a given scale be denoted as F r g b R C × H × W and F i r R C × H × W , respectively. The objective of DFB is to achieve cross-modal alignment and adaptive fusion at the feature level, thereby generating the fused feature F d f b . The core process of DFB can be summarized into three steps:
(1)
Initial Fusion and Context Modeling
The features from the two modalities are first combined through element-wise addition to obtain an initial fused feature, as expressed in Equation (1).
F i n i t = F r g b + F i r .
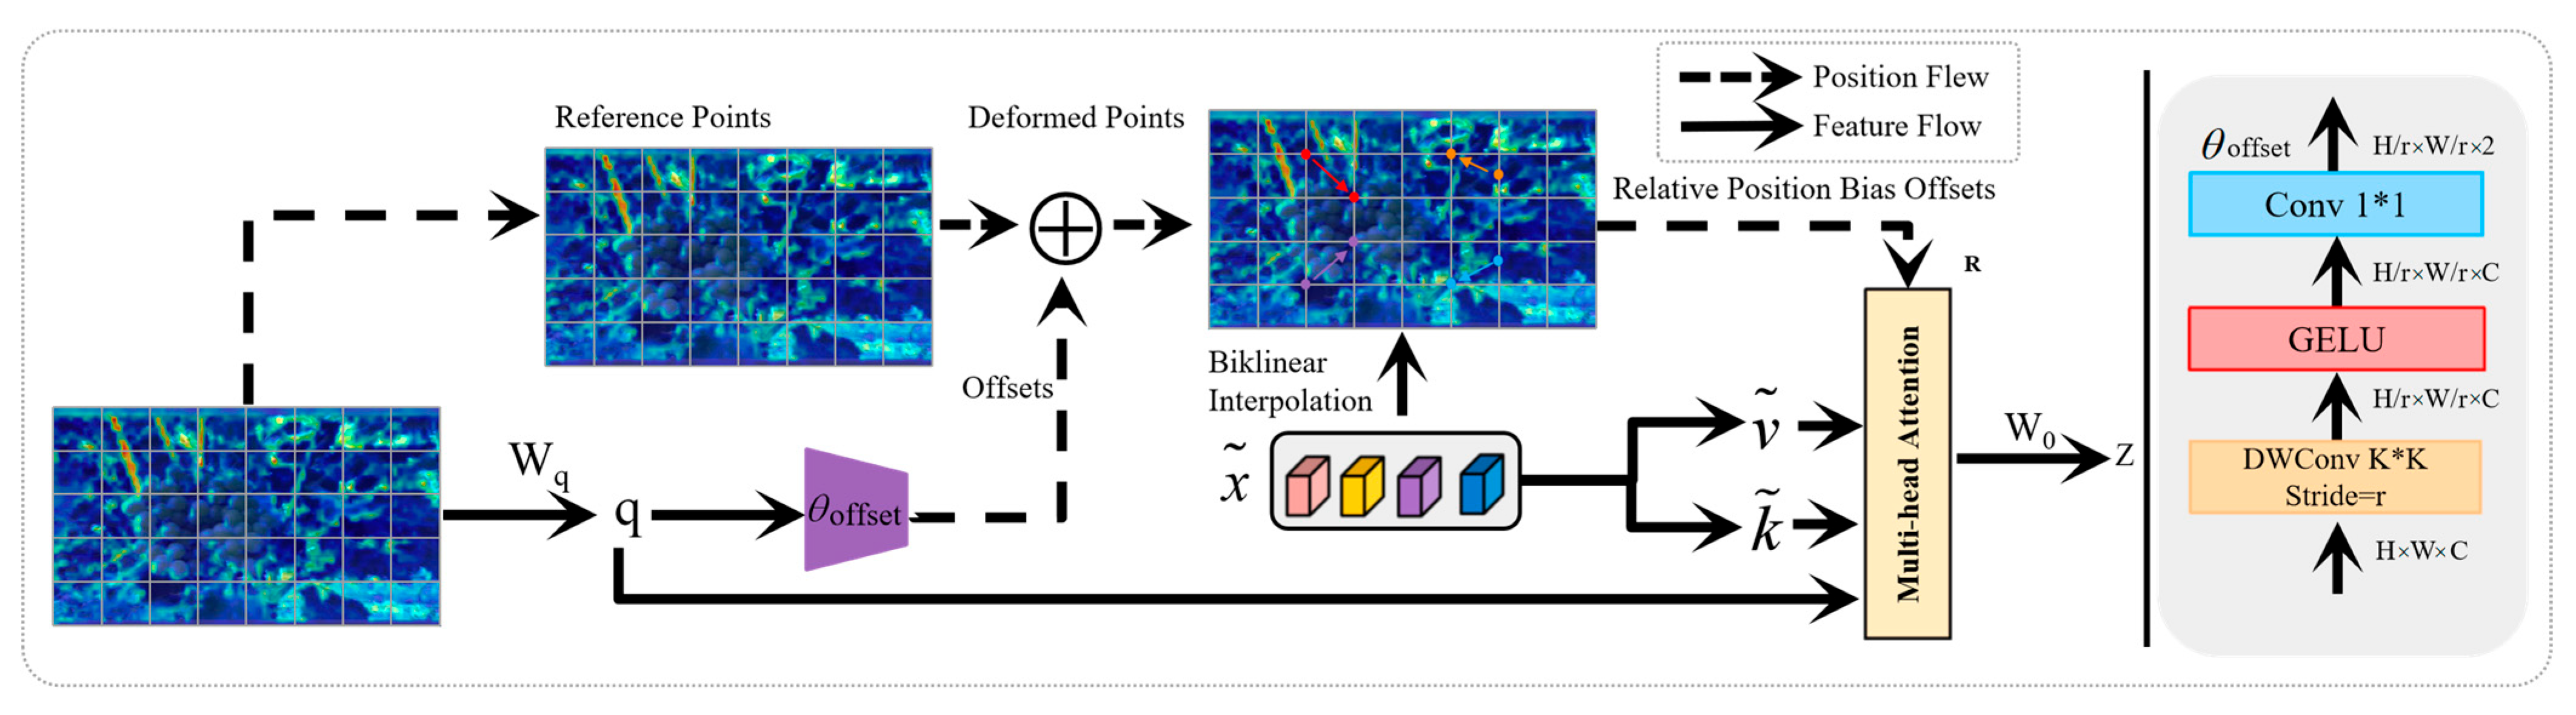
On this basis, an attention unit with deformable sampling and relative positional encoding is employed to perform contextual modeling on F i n i t , thereby producing an enhanced feature F a t t n that explicitly captures long-range dependencies and mines richer global information in both the spatial and semantic dimensions.
(2)
Pixel-Wise Adaptive Weight Estimation
Subsequently, F i n i t and F a t t n are concatenated and fed into a pixel-level attention submodule. Through spatial-domain convolution and nonlinear mapping, a pixel-wise weight map A ( 0 , 1 ) H × W is generated. The weight map A reflects which modality should be relied on more at each spatial location: at positions where texture is clear and color information is reliable, larger values of A tend to emphasize the RGB branch; at positions with complex illumination, severe shadows, or occlusion, the contribution of the IR branch is correspondingly strengthened.
(3)
Modality-Adaptive Fusion and Linear Remapping
Finally, the RGB and IR features are adaptively aggregated according to the weight map, combined with the initial fused feature, and then linearly remapped to obtain the final fused feature, as expressed in Equation (2).
F d f b = C o n v 1 × 1 ( F i n i t + A F r g b + ( 1 A ) F i r ) ,
where ⊙ denotes element-wise multiplication, and C o n v 1 × 1 ( · ) denotes linear remapping in the channel dimension. In this way, DFB achieves adaptive balancing of the contributions of RGB and IR at each spatial position and each channel while maintaining an overall lightweight structure.
By stacking DFB at multiple scales such as P3, P4, and P5, DTNet can progressively perform cross-modal interaction from shallow to deep semantic levels, generating a set of multi-scale fused features that jointly encode color-texture information and infrared structural cues. This provides a more robust feature basis for subsequent small-object detection and occlusion-aware perception.

2.4. Local Enhancement Module (LEM)

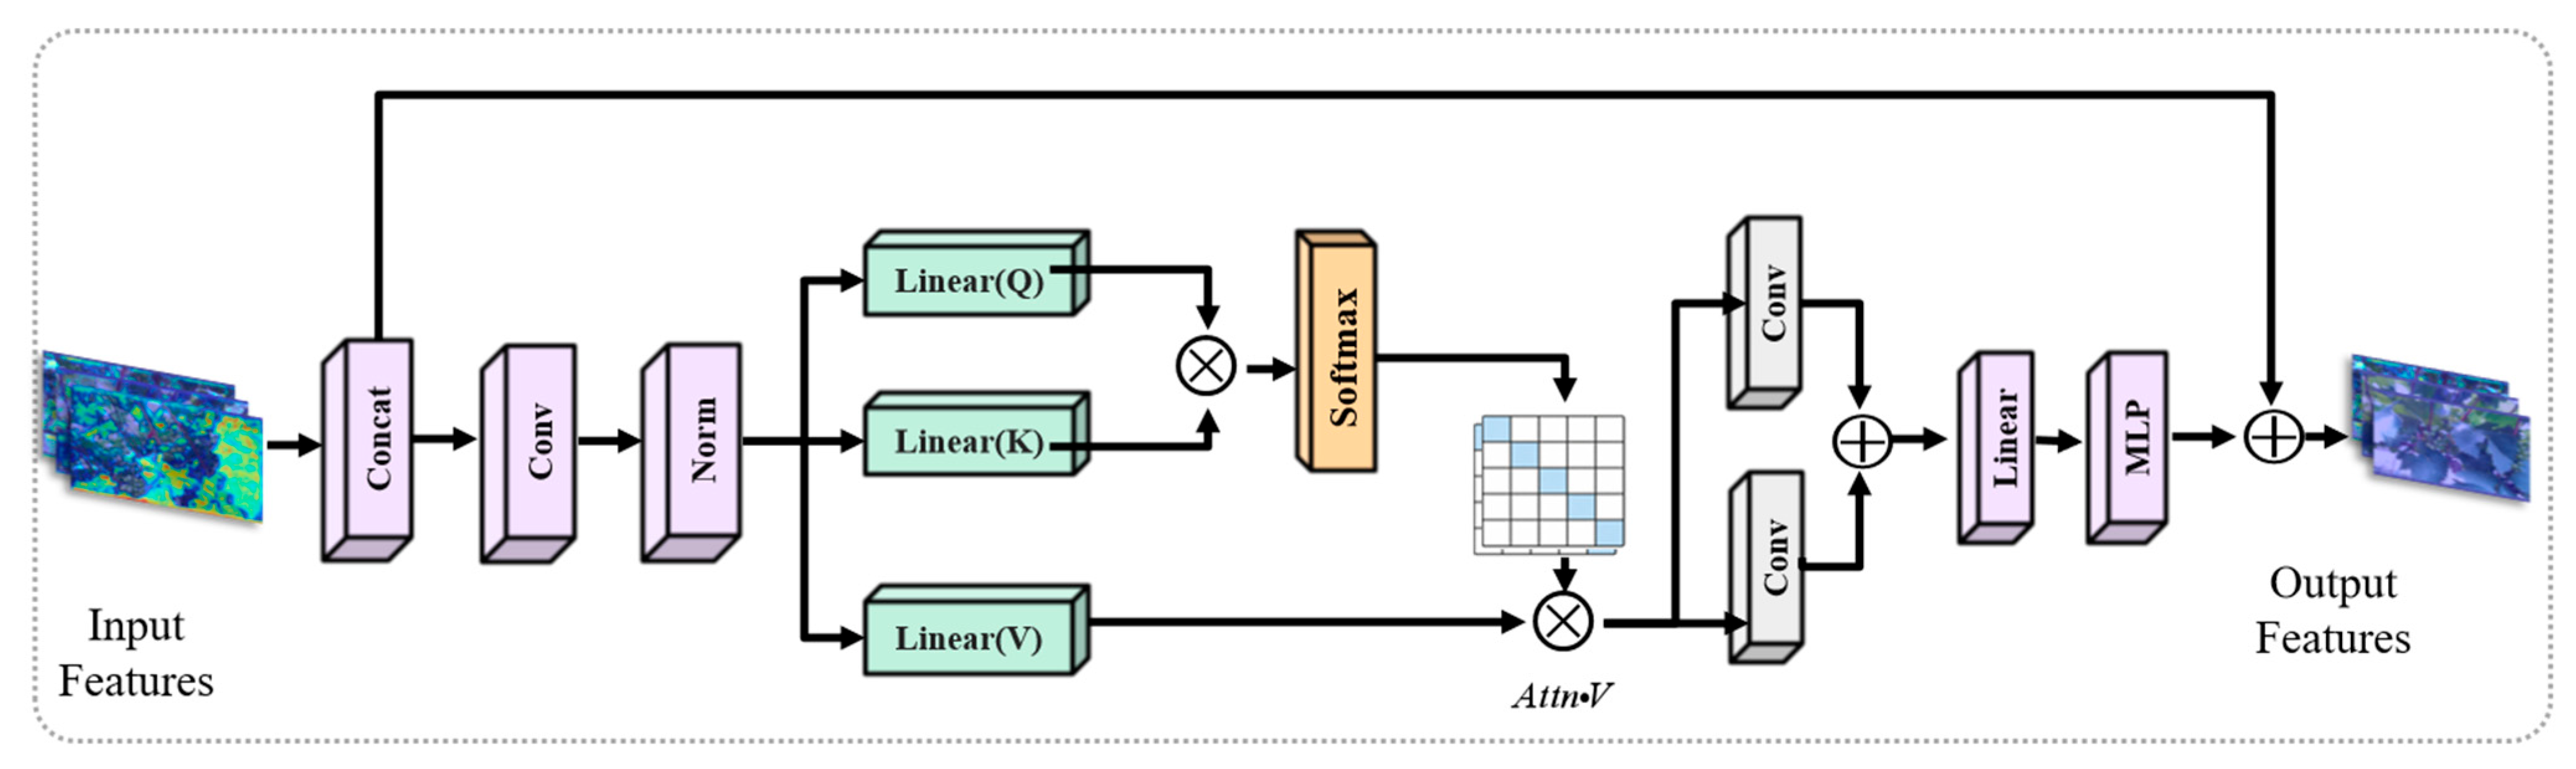
In orchard scenarios, fruit targets often exhibit characteristics such as small size, dense clustering, and weak boundary contrast. In particular, under occlusion, abrupt illumination variation, or sparse infrared texture conditions, conventional convolutional operations on medium- and high-level features tend to suffer from detail attenuation and boundary blurring, leading to difficulty in separating overlapping fruits and insufficient responses at fruit stem junctions and fine lesion areas. To address this issue, DTNet introduces LEM at key stages of the backbone to strengthen fine-grained structural representation while maintaining the spatial resolution of the feature maps unchanged. LEM uses local windows as the basic modeling unit and explicitly captures correlations among neighboring features within each window through self-attention, while incorporating relative positional bias to enhance spatial relationship modeling. In this way, effective contextual information can be aggregated locally, thereby improving structural consistency and boundary discriminability. Meanwhile, LEM adopts lightweight designs such as depthwise separable convolution, which enhances local detail representation while effectively reducing parameter count and computational cost. Under a controllable computational budget, LEM further improves the distinguishability and localization stability of densely clustered targets and provides more reliable detail cues for subsequent feature fusion and detection head regression. The detailed structure of LEM is shown in Figure 3.

2.4.1. Overall Structure and Residual Learning

Given an input feature x R B × C × H × W , LEM adopts a two-stage residual structure corresponding to attention enhancement and nonlinear mapping (MLP) enhancement, as formulated in Equation (3).
X ( 1 ) = X + A ( X ) , Y = X ( 1 ) + M ( X ( 1 ) ) ,
where A ( · ) denotes the attention enhancement branch, which is used to aggregate neighborhood context within local windows and strengthen responses to key details, and M ( · ) denotes the MLP branch composed of pointwise convolutions, which is responsible for nonlinear transformation and recalibration in the channel dimension.
On the one hand, the two residual connections ensure that the semantic information of the backbone features can be stably propagated, thereby preventing excessive disturbance of the original representation caused by detail enhancement. On the other hand, they allow the enhanced information to be injected into the main branch in an incremental manner, thereby improving training stability and facilitating module convergence.
Furthermore, LEM maintains the spatial resolution of the features unchanged before and after the two residual enhancement stages. Therefore, it can strengthen the representation of dense-cluster boundaries, local textures, and structural continuity in occluded regions while controlling computational overhead, thereby providing more reliable fine-grained feature support for subsequent multi-scale fusion and detection head decoding.

2.4.2. Adaptive Normalization Module (LayNorm) and Recalibration

To alleviate scale drift among features from different levels, LEM introduces an adaptive normalization module, termed LayNorm, before the attention branch. Unlike standard LayerNorm, LayNorm not only outputs normalized features but also predicts a set of input-statistics-related rescale and rebias parameters, which are used for recalibration after the attention/MLP operations.
The procedure can be divided into the following steps.
(1) Global mean and variance computation.
The global mean and variance of the input feature are first computed, as expressed in Equation (4).
μ = E [ X ] , σ = E [ ( X μ ) 2 ] + ε .
(2) Normalization with learnable affine transformation.
The input feature is then normalized and transformed by learnable affine parameters, as formulated in Equation (5).
X ^ = X μ σ , X n = X ^ γ + β .
(3) Generation of recalibration parameters.
Based on the feature statistics, the recalibration parameters are generated as shown in Equation (6).
s = ψ 1 ( σ ) , b = ψ 2 ( μ ) ,
where ψ 1 and ψ 2 denote 1 × 1 convolution mappings (corresponding to meta1 and meta2 in the implementation).
Subsequently, recalibration is performed on the attention output, as expressed in Equation (7).
Re c a l ( Z ) = Z s + b .
This enables the output of the enhancement branch to be adaptively restored to a numerical scale consistent with the original features, thereby improving cross-stage training stability.

2.4.3. Window Attention (WATT): Local Context Modeling and Relative Positional Bias

LEM models feature correlations at the local-window scale and aggregates neighborhood information through attention weighting to strengthen responses to key details. The feature map is first partitioned into non-overlapping windows, each containing N = M 2 tokens. For the features within each window, the query, key, and value are constructed as expressed in Equation (8).
Q = X W Q , K = X W K , V = X W V .
For the h-th attention head, the attention weights and output features are computed as formulated in Equation (9).
A = s o f t max ( Q K d + B ) , Z = A V ,
where B denotes the relative positional bias. Specifically, the relative displacement Δ p within each window is first computed, and logarithmic compression is then applied as shown in Equation (10).
Δ p log = s i g n ( Δ p ) · log ( 1 + | Δ p | ) .
The compressed relative displacement is then mapped to the bias term B of each attention head through a two-layer MLP. This design provides smoother modeling for displacements at different scales and enhances the representation of spatial consistency for boundaries and textures.
In addition, LEM supports shifted windows. When s h i f t _ s i z e 0 , the feature map is first circularly shifted, and reflect padding is applied at the window boundaries. After attention computation, inverse cropping is performed to restore the original size. In this way, information interaction across adjacent windows is introduced, thereby alleviating the boundary discontinuity caused by fixed window partitioning.

2.4.4. Attention Output Projection and Feature Fusion

After the window attention output Z a t t is obtained, LEM applies a 1 × 1 linear projection to perform channel mixing and alignment of the multi-head outputs, as expressed in Equation (11).
Z p = Pr o j ( Z a t t ) ,
where Pr o j ( · ) denotes a 1 × 1 convolution.
Subsequently, the recalibration parameters s and b described in Section 2.4.2 are used to restore the scale and correct the bias of the enhanced feature, as formulated in Equation (12).
Z r = Z p s + b .
Finally, the attention enhancement branch is injected into the backbone feature through a residual connection, as expressed in Equation (13).
X ( 1 ) = X + Z r .
In this way, the attention branch can enhance local detail representation while maintaining stable propagation of the original backbone semantics.

2.4.5. Channel-Wise Nonlinear Mapping and Second-Stage Residual Enhancement

To further improve the discriminability of fine-grained channel responses, LEM introduces an MLP branch based on pointwise convolution after attention enhancement. Let X ( 1 ) denote the output of the attention residual branch. The MLP output is then computed as expressed in Equation (14).
U = M L P ( X ( 1 ) ) = W 2 σ ( W 1 X ( 1 ) ) ,
where W 1 and W 2 denote the two 1 × 1 convolutions, respectively, and σ ( · ) denotes the nonlinear activation function.
Similarly, the MLP output can also be recalibrated, as formulated in Equation (15).
U r = U s + b .
Finally, the recalibrated MLP output is combined with the main branch through a second residual connection to obtain the final output, as expressed in Equation (16).
Y = X ( 1 ) + U r .
This second-stage residual structure enables the original semantic information to be continuously propagated while injecting detail enhancement into the feature representation in an incremental manner, thereby improving training stability and avoiding excessive disturbance to the backbone feature distribution.

2.5. Adaptive Spatial Attention Module (ASA)

During the top-down construction of the feature pyramid, high-level features contain stronger semantic information but coarser spatial details, whereas low-level features possess higher resolution but weaker semantic abstraction. To facilitate more effective information interaction across scales, DTNet introduces an Adaptive Spatial Attention module (ASA) into the feature pyramid, enabling bidirectional interaction and spatial reweighting of cross-level features.
Given a high-level feature F H and a low-level feature F L at a certain scale, ASA first performs channel alignment through linear transformation and then computes the spatial attention maps for both branches, as expressed in Equation (17).
G H = σ ( F H ) ,   G L = σ ( F L ) ,
where σ(⋅) denotes the element-wise Sigmoid function, and the values of G H and G L are constrained to the range (0, 1).
Subsequently, the features of the two branches are updated through self-enhancement and cross-level interaction, as formulated in Equations (18) and (19).
F ˜ = F L + G L F L + ( 1 G L ) U p ( F H ) ,
F ˜ = F H + G H F H + ( 1 G H ) D o w n ( F L ) ,
where ⊙ denotes element-wise multiplication, and Up(·) and Down(·) denote interpolation-based alignment operations that resize features to the spatial resolutions of the low-level and high-level branches, respectively. It can be seen that each branch consists of three components: the original feature, a self-enhancement term modulated by its own attention map, and a cross-level supplementary term injected from the other branch after attention-based selection.
Finally, the aligned features F ˜ H and F ˜ L are concatenated along the channel dimension and fused through convolution to obtain multi-scale features with rich local details and consistent high-level semantics. With the help of ASA, DTNet can explicitly highlight densely distributed fruit regions in the feature pyramid while suppressing interference from large leaf and branch areas, thereby improving the detection accuracy of small-scale, overlapping, and partially occluded fruit targets.

2.6. Transformer-Based Adaptive Demodulation Detection Head

After obtaining the fused multi-scale features, DTNet employs a Transformer-based Adaptive Demodulation Detection Head to decode features from scales such as P3, P4, and P5 in a unified manner. Centered on a set of learnable query vectors, this detection head formulates object detection as a set prediction task through cross-attention interaction with multi-scale feature maps. In this way, redundant candidate enumeration caused by dense anchor boxes can be avoided, and reliance on complex post-processing can be reduced.
Specifically, given the multi-scale features { F l } l { 3 , 4 , 5 } from the feature pyramid, the detection head first initializes a fixed number of query vectors Q R N × d . During decoding, cross-attention is used to aggregate contextual information relevant to each potential target from the multi-scale features, which can be formulated as Equation (20).
Q t + 1 = Q t + t A t t n ( Q t , K ( F l ) , V ( F l ) ) ,
where K ( · ) and V ( · ) denote the linear mappings applied to the feature maps, and A t t n ( · ) denotes the multi-head attention operation. Through this cross-scale information aggregation, each query can adaptively select the most suitable scale and region, which is particularly beneficial for densely clustered fruits and occluded overlapping targets.
To further improve the stability and discriminability of candidate predictions, an adaptive demodulation mechanism is introduced at the output stage to dynamically recalibrate each query representation, which is expressed in Equation (21).
q ˜ i = q i s i + b i , [ s i , b i ] = g ( q i ) ,
where q i denotes the i-th query vector, and g ( · ) denotes a lightweight mapping network that generates the adaptive scaling factor s i and bias term b i . After obtaining the demodulated query representation q i ˜ , the classification branch and regression branch are used to output the category distribution and bounding-box parameters, as formulated in Equation (22).
p i ^ = S o f t max ( f c l s ( q i ˜ ) ) , b i ^ = f b o x ( q i ˜ ) .
Compared with traditional one-stage detectors based on anchor boxes, the set prediction framework can significantly reduce redundant candidates and duplicate boxes, while maintaining more stable prediction behavior in densely clustered, heavily occluded, and overlapping target scenarios. At the same time, multi-scale cross-attention enables queries to adaptively select the most appropriate scale features for decoding, thereby improving localization quality for small targets and objects with ambiguous boundaries.

2.7. Multimodal Balanced Detection Loss (MBDL)

Close-range RGB-IR dual-modal fruit detection in orchards typically exhibits a long-tail class distribution and a high proportion of hard samples. The numbers of instances for different varieties or maturity levels differ significantly, while occlusion, strong illumination/shadow, and densely clustered distributions introduce considerable uncertainty in both localization and classification for some samples. When only standard detection losses such as BCE/FL and IoU-based regression are used, the optimization process is easily dominated by majority classes and easy samples, leading to insufficient gradient contribution from minority classes and hard samples.
To address this issue, this paper constructs a Multimodal Balanced Detection Loss (MBDL), which jointly optimizes classification reweighting, localization quality regression, and classification-localization consistency. The overall loss is defined as shown in Equation (23).
L M D B L = α L c l s b a l + β L b o x P I o U v 2 + γ L q c ,
where α, β, and γ are branch weighting coefficients; L c l s b a l denotes the balanced classification loss for long-tailed data; L b o x P I o U v 2 denotes the PioU v2 bounding-box regression loss adopted in this paper; and L q c denotes the consistency constraint between classification confidence and localization quality.

2.7.1. Balanced Classification Loss

To alleviate class imbalance and insufficient focus on hard examples, both class-frequency weights and sample-difficulty weights are introduced for each positive sample. Let the category of the i-th positive sample be c i , its predicted probability be p i , and its label be y i { 0 , 1 } . The class-frequency weight is defined as shown in Equation (24).
w c l s ( c ) = ( N N c + ε ) η ,
where N denotes the total number of training instances, N c denotes the number of instances in category c, η is the adjustment coefficient, and ε is a numerical stability term. Furthermore, to emphasize hard samples, such as those with severe occlusion, blurred boundaries, or obvious cross-modal discrepancies, a difficulty weight based on prediction confidence is introduced, as formulated in Equation (25).
w i d i f f = ( 1 p i ) δ ,
where δ controls the emphasis placed on hard samples. The final balanced classification loss is therefore written as Equation (26).
L c l s b a l = i Ω p o s w c l s ( c i ) w i · L B C E ( p i , y i ) ,
where Ω p o s denotes the set of positive samples, and L B C E denotes the binary cross-entropy loss.

2.7.2. PioU v2 Localization Loss L b o x P I o U v 2

In bounding-box regression, traditional IoU-series losses usually normalize penalty terms using the scale of the minimum enclosing box, which may induce anchor-box expansion and slow convergence. Powerful-IoU (PioU) constructs a scale-adaptive penalty factor based on the size of the ground-truth box and combines it with a gradient modulation function, guiding the predicted box to regress to the ground truth along a more direct path while avoiding unnecessary enlargement.
(1) Scale-adaptive penalty factor in PioU.
Let the predicted box be B = (x1, y1, x2, y2), and the ground-truth box be B g t = ( x 1 g t , y 1 g t , x 2 g t , y 2 g t ) . The width and height of the ground-truth box are first defined as shown in Equation (27).
w g t = x 2 g t x 1 g t ,   h g t = y 2 g t y 1 g t .
The distances between the four sides of the predicted box and the ground-truth box are then defined as in Equations (28) and (29).
d w 1 = | x 1 x 1 g t | , d w 2 = | x 2 x 2 g t | ,
d h 1 = | y 1 y 1 g t | , d h 2 = | y 2 y 2 g t | .
Accordingly, the scale-adaptive penalty factor in PioU is defined as Equation (30).
P = 1 4 ( d w 1 w g t , d w 2 w g t , d h 1 h g t , d h 2 h g t ) .
This design makes the penalty term depend on the scale of the ground-truth box, thereby avoiding undesirable gradient directions caused by variations in the size of the enclosing box and fundamentally alleviating the anchor-box expansion problem.
(2) Gradient modulation function and PioU v1 loss.
To further modulate the optimization dynamics, a gradient modulation function is introduced as expressed in Equation (31).
f ( P ) = 1 exp ( P 2 ) .
Based on the above penalty term, the PioU v1 loss is formulated as Equation (32).
L P I o U = L I o U + f ( P ) = ( 1 I o U ) + ( 1 exp ( P 2 ) ) , 0 L P I o U 2 ,
where IoU denotes the intersection-over-union between the predicted box and the ground-truth box.
(3) Non-monotonic attention layer and PioU v2 loss.
To enhance the emphasis on medium-quality samples, PioU v2 further introduces a non-monotonic attention layer controlled by the hyperparameter λ , as formulated in Equation (33).
L P I o U v 2 = u ( λ q ) · L P I o U = 3 ( λ q ) exp ( ( λ q ) 2 ) · L P I o U .
Here, λ controls the peak position and gradient distribution of the attention weighting. Accordingly, the localization branch in this work adopts the loss defined in Equation (34).
L c l s P I o U v 2 = L P L o U v 2 .

2.7.3. Classification-Localization Consistency Constraint

Under complex occlusion and background interference, detectors often produce predictions with high classification confidence but poor localization quality. To improve output reliability, MBDL introduces a consistency constraint between classification confidence and localization quality. For each positive sample, let p i denote the confidence score output by the classification branch, and let I o U i denote the localization quality. The consistency constraint is then defined as Equation (35).
L q c = i Ω p o s | | p i I o U i | | 2 2 .
This term encourages the classification confidence and geometric matching quality to improve synchronously, thereby suppressing overconfident predictions at the global loss level and helping reduce false detections and duplicate boxes in densely clustered fruit scenarios.

3. Results

3.1. Experimental Setup and Evaluation Metrics

The experiments were conducted on the public RGB-IR fruit datasets described in Section 2.1. Baseline selection, comparative experiments, and ablation studies were performed on the grape dataset, whereas an additional-dataset evaluation was conducted on the tomato dataset to assess the applicability of DTNet to another fruit RGB-IR detection task. The following results are evaluated using Precision, Recall, F1-score, mAP@0.5, mAP@0.5:0.95, parameter count (Params), and floating-point operations (FLOPs).

3.1.1. Evaluation Metrics

To comprehensively evaluate the detection performance and deployment efficiency of the model, this paper adopts common metrics used in object detection tasks, including Precision, Recall, F1-score, mAP@0.5, mAP@0.5:0.95, and the model complexity indicators Params and FLOPs.
(1) Precision, Recall, and F1-score
Let true positives, false positives, and false negatives be denoted by TP, FP, and FN, respectively. Precision, Recall, and F1-score are then defined as formulated in Equations (36)–(38), respectively.
P = T P T P + F P ,
R = T P T P + F N .
F 1 = 2 P R P + R = 2 T P 2 T P + F P + F N .
Here, P measures the proportion of correctly predicted positive samples among all predicted positive samples, whereas R measures the proportion of true targets that are successfully detected by the model. The F1-score is the harmonic mean of Precision and Recall and can reflect the balance between false positives and false negatives more comprehensively.
(2) AP and mAP
At different confidence thresholds, the model yields a set of Precision-Recall curves. The Average Precision (AP) of a category is defined as the area under its Precision-Recall curve, as formulated in Equation (39).
A P = 0 1 P ( R ) d R .
By averaging the AP values over all categories, the mean Average Precision (mAP) is formulated as Equation (40).
m A P = 1 C i = 1 C A P i .
Here, C denotes the total number of categories. In this paper, two forms of mAP are mainly reported. mAP@0.5 is calculated with a fixed IoU threshold of 0.5, whereas mAP@0.5:0.95 is defined as the average mAP over IoU thresholds ranging from 0.5 to 0.95 with a step size of 0.05, as formulated in Equation (41).
m A P @ 0.5 : 0.95 = 1 10 k = 0 9 m A P Γ = 0.5 + 0.05 k .
Compared with mAP@0.5, mAP@0.5:0.95 imposes stricter requirements on localization precision and can therefore reflect the overall detection quality more comprehensively.
(3) Model Complexity Metrics
In addition to accuracy-related metrics, model complexity is evaluated using the number of learnable parameters (Params) and floating-point operations (FLOPs). Params represents the total number of trainable parameters in the model, whereas FLOPs indicate the number of floating-point computations required during forward inference. These two metrics are used to measure the lightweightness and deployment potential of the model, thus providing a more comprehensive evaluation of the trade-off between accuracy and efficiency.

3.1.2. Implementation Details and Training Configuration

To ensure comparability among all experiments, all models are trained and evaluated under unified settings. The experiments are conducted on an NVIDIA GeForce RTX 4090 GPU (NVIDIA Corporation, Santa Clara, CA, USA) using PyTorch 2.3.0 (available online: https://pytorch.org/, accessed on 6 May 2026) with CUDA 12.1. The input image size is set to 512 × 512, the batch size is 8, and the number of training epochs is 200.
The optimizer is AdamW, with an initial learning rate of 0.001, an end-stage learning rate ratio of 0.01, and a weight decay coefficient of 0.01. To improve convergence stability in the early stage of training, a warmup strategy is adopted, with 3 warmup epochs, a warmup momentum of 0.8, and a warmup bias learning rate of 0.1. In addition, the momentum-related coefficient during training is set to 0.937. The random seed is set to 0, and the deterministic option is enabled to reduce the impact of randomness on experimental results.
During inference, the IoU threshold is set to 0.7, and the maximum number of detection boxes is set to 300. During training, Mosaic and MixUp are not enabled, while augmentation strategies such as random horizontal flipping, RandAugment, and random erasing are adopted to improve robustness against occlusion, local missing regions, and complex backgrounds. The early stopping patience is set to 100, and the best model weights are saved in real time based on validation set performance.

3.1.3. Edge-Side Deployment Evaluation on Raspberry Pi 5

To further address the reviewer’s concern regarding deployment efficiency on edge devices, an additional edge-side inference evaluation was carried out on a Raspberry Pi 5 platform (Raspberry Pi Ltd, Cambridge, UK; 8 GB RAM, official 64-bit operating system). The deployment test was implemented using a PyTorch-based inference script, and all models were executed in full precision (FP32) under the same software environment. The input image size was fixed at 512 × 512, consistent with the training and validation settings. The reported FPS and average latency per frame were measured under the same testing script after several warm-up iterations. The reported latency only reflects the runtime introduced by the object detection algorithm itself, i.e., the core model inference stage, and does not include image preprocessing, prediction postprocessing, one-time model loading, or program initialization.
On the Raspberry Pi 5 platform, YOLOv13 achieved 7.8 FPS, corresponding to an average latency of approximately 127 ms per frame. Under the same conditions, DTNet achieved 6.8 FPS, corresponding to an average latency of approximately 147 ms per frame. Compared with YOLOv13, DTNet introduces a moderate increase in inference time due to its dual-modal architecture, feature interaction mechanism, attention-based enhancement modules, and Transformer-based detection head. However, the observed decrease in speed is relatively limited, indicating that the proposed framework still maintains acceptable inference efficiency on a practical embedded platform.
It should be noted that the above latency values correspond to the runtime introduced by the object detection algorithm itself under the adopted inference pipeline, rather than end-to-end per-frame runtime. Therefore, the reported edge-side results are mainly intended to provide a controlled reference for the relative deployment efficiency of different models under a unified testing setting.
Considering that DTNet provides stronger detection accuracy and robustness in complex orchard environments, the above results demonstrate that the proposed model achieves a favorable balance between detection performance and deployment efficiency. Moreover, the model could run stably within the hardware resource constraints of the Raspberry Pi 5, suggesting that DTNet has practical potential for deployment in intelligent agricultural perception systems. Future work will further improve deployment efficiency through model compression, quantization, and hardware-oriented optimization.

3.2. Baseline Selection

To reasonably determine the backbone framework for the subsequent improved network, this study first compares several mainstream one-stage detectors as candidate baseline models. Considering that fruit detection in orchard scenarios requires not only high detection accuracy but also controllable model complexity and deployment feasibility, YOLOv8, YOLOv11, YOLOv12, and the published YOLOv13 model [42,43,44] were selected as candidate baseline models and compared under the same training settings. All models use identical data splits, input resolution, training epochs, and optimization strategies to ensure a fair comparison.
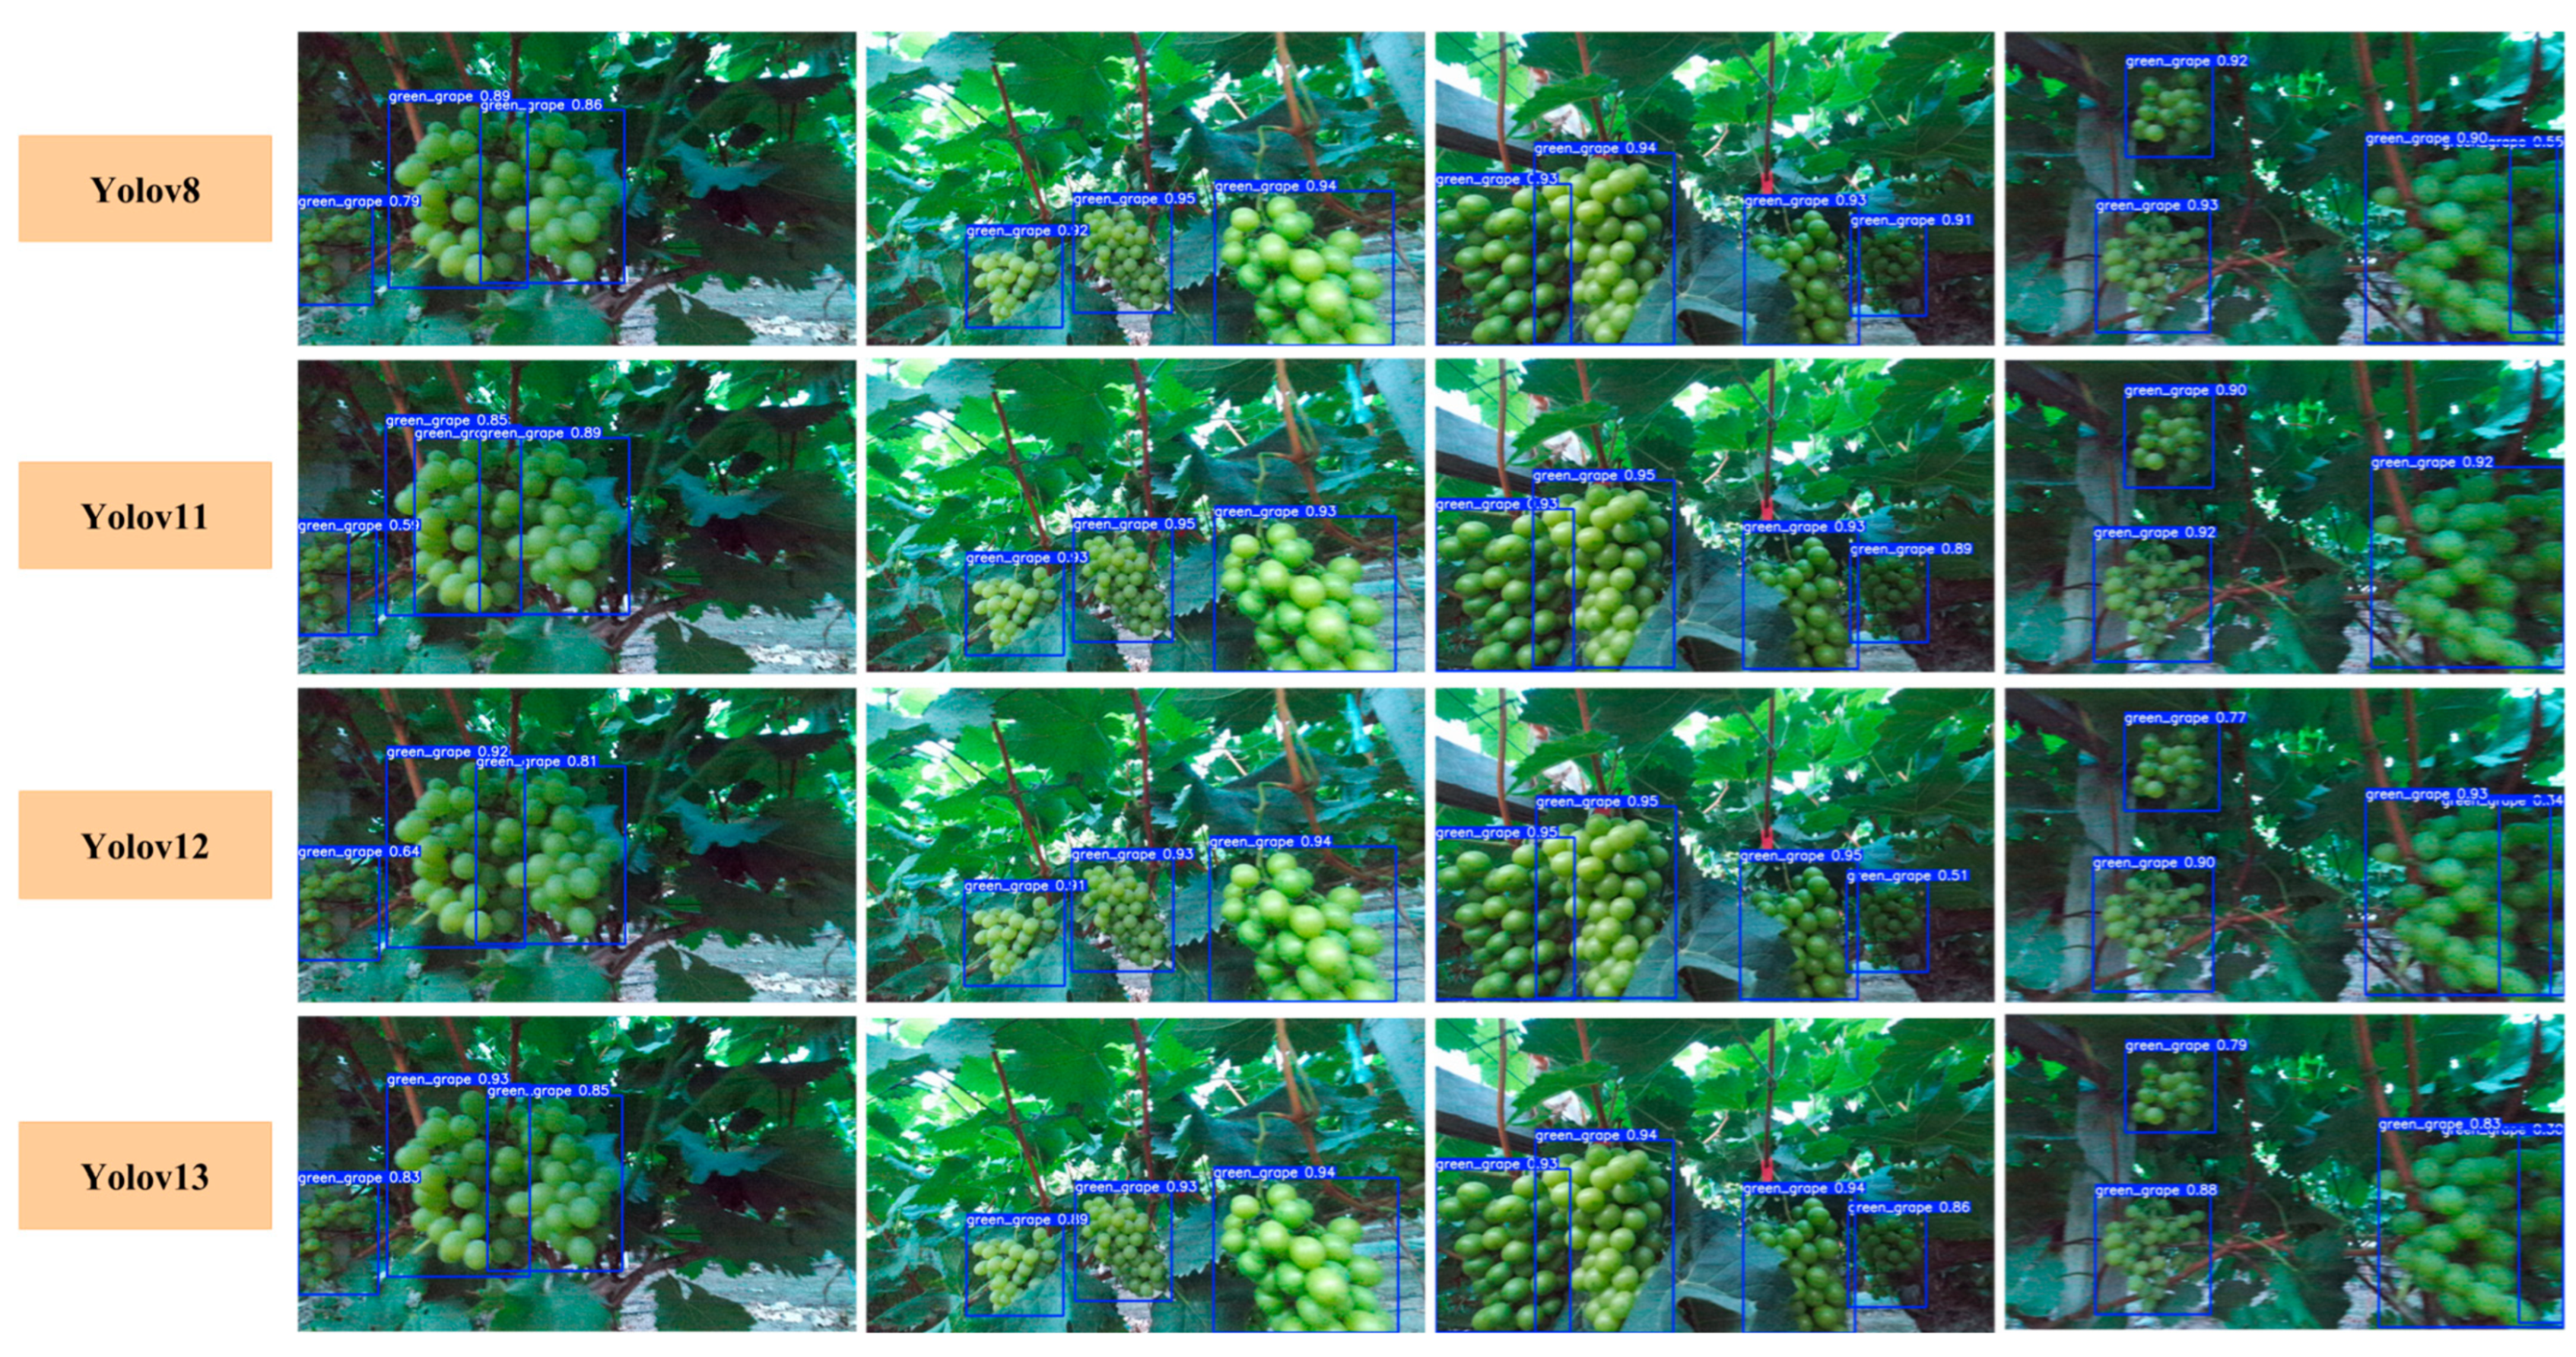
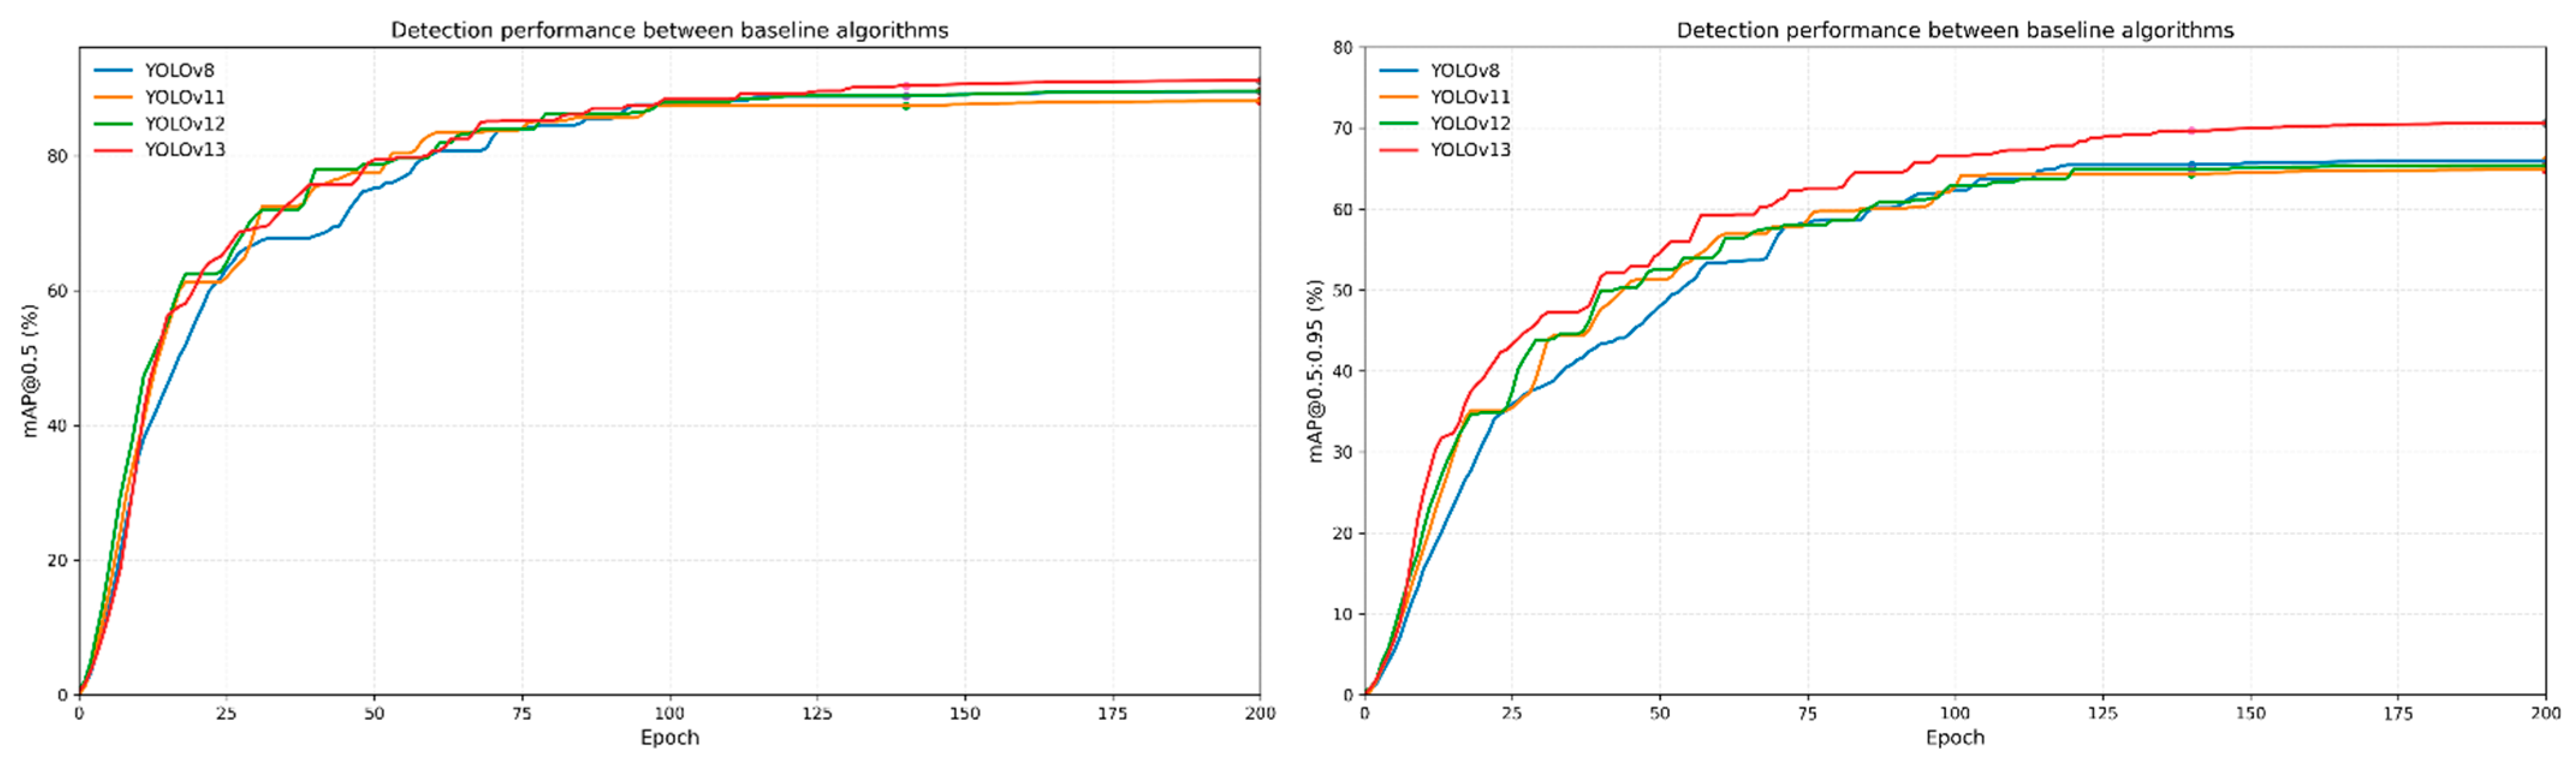
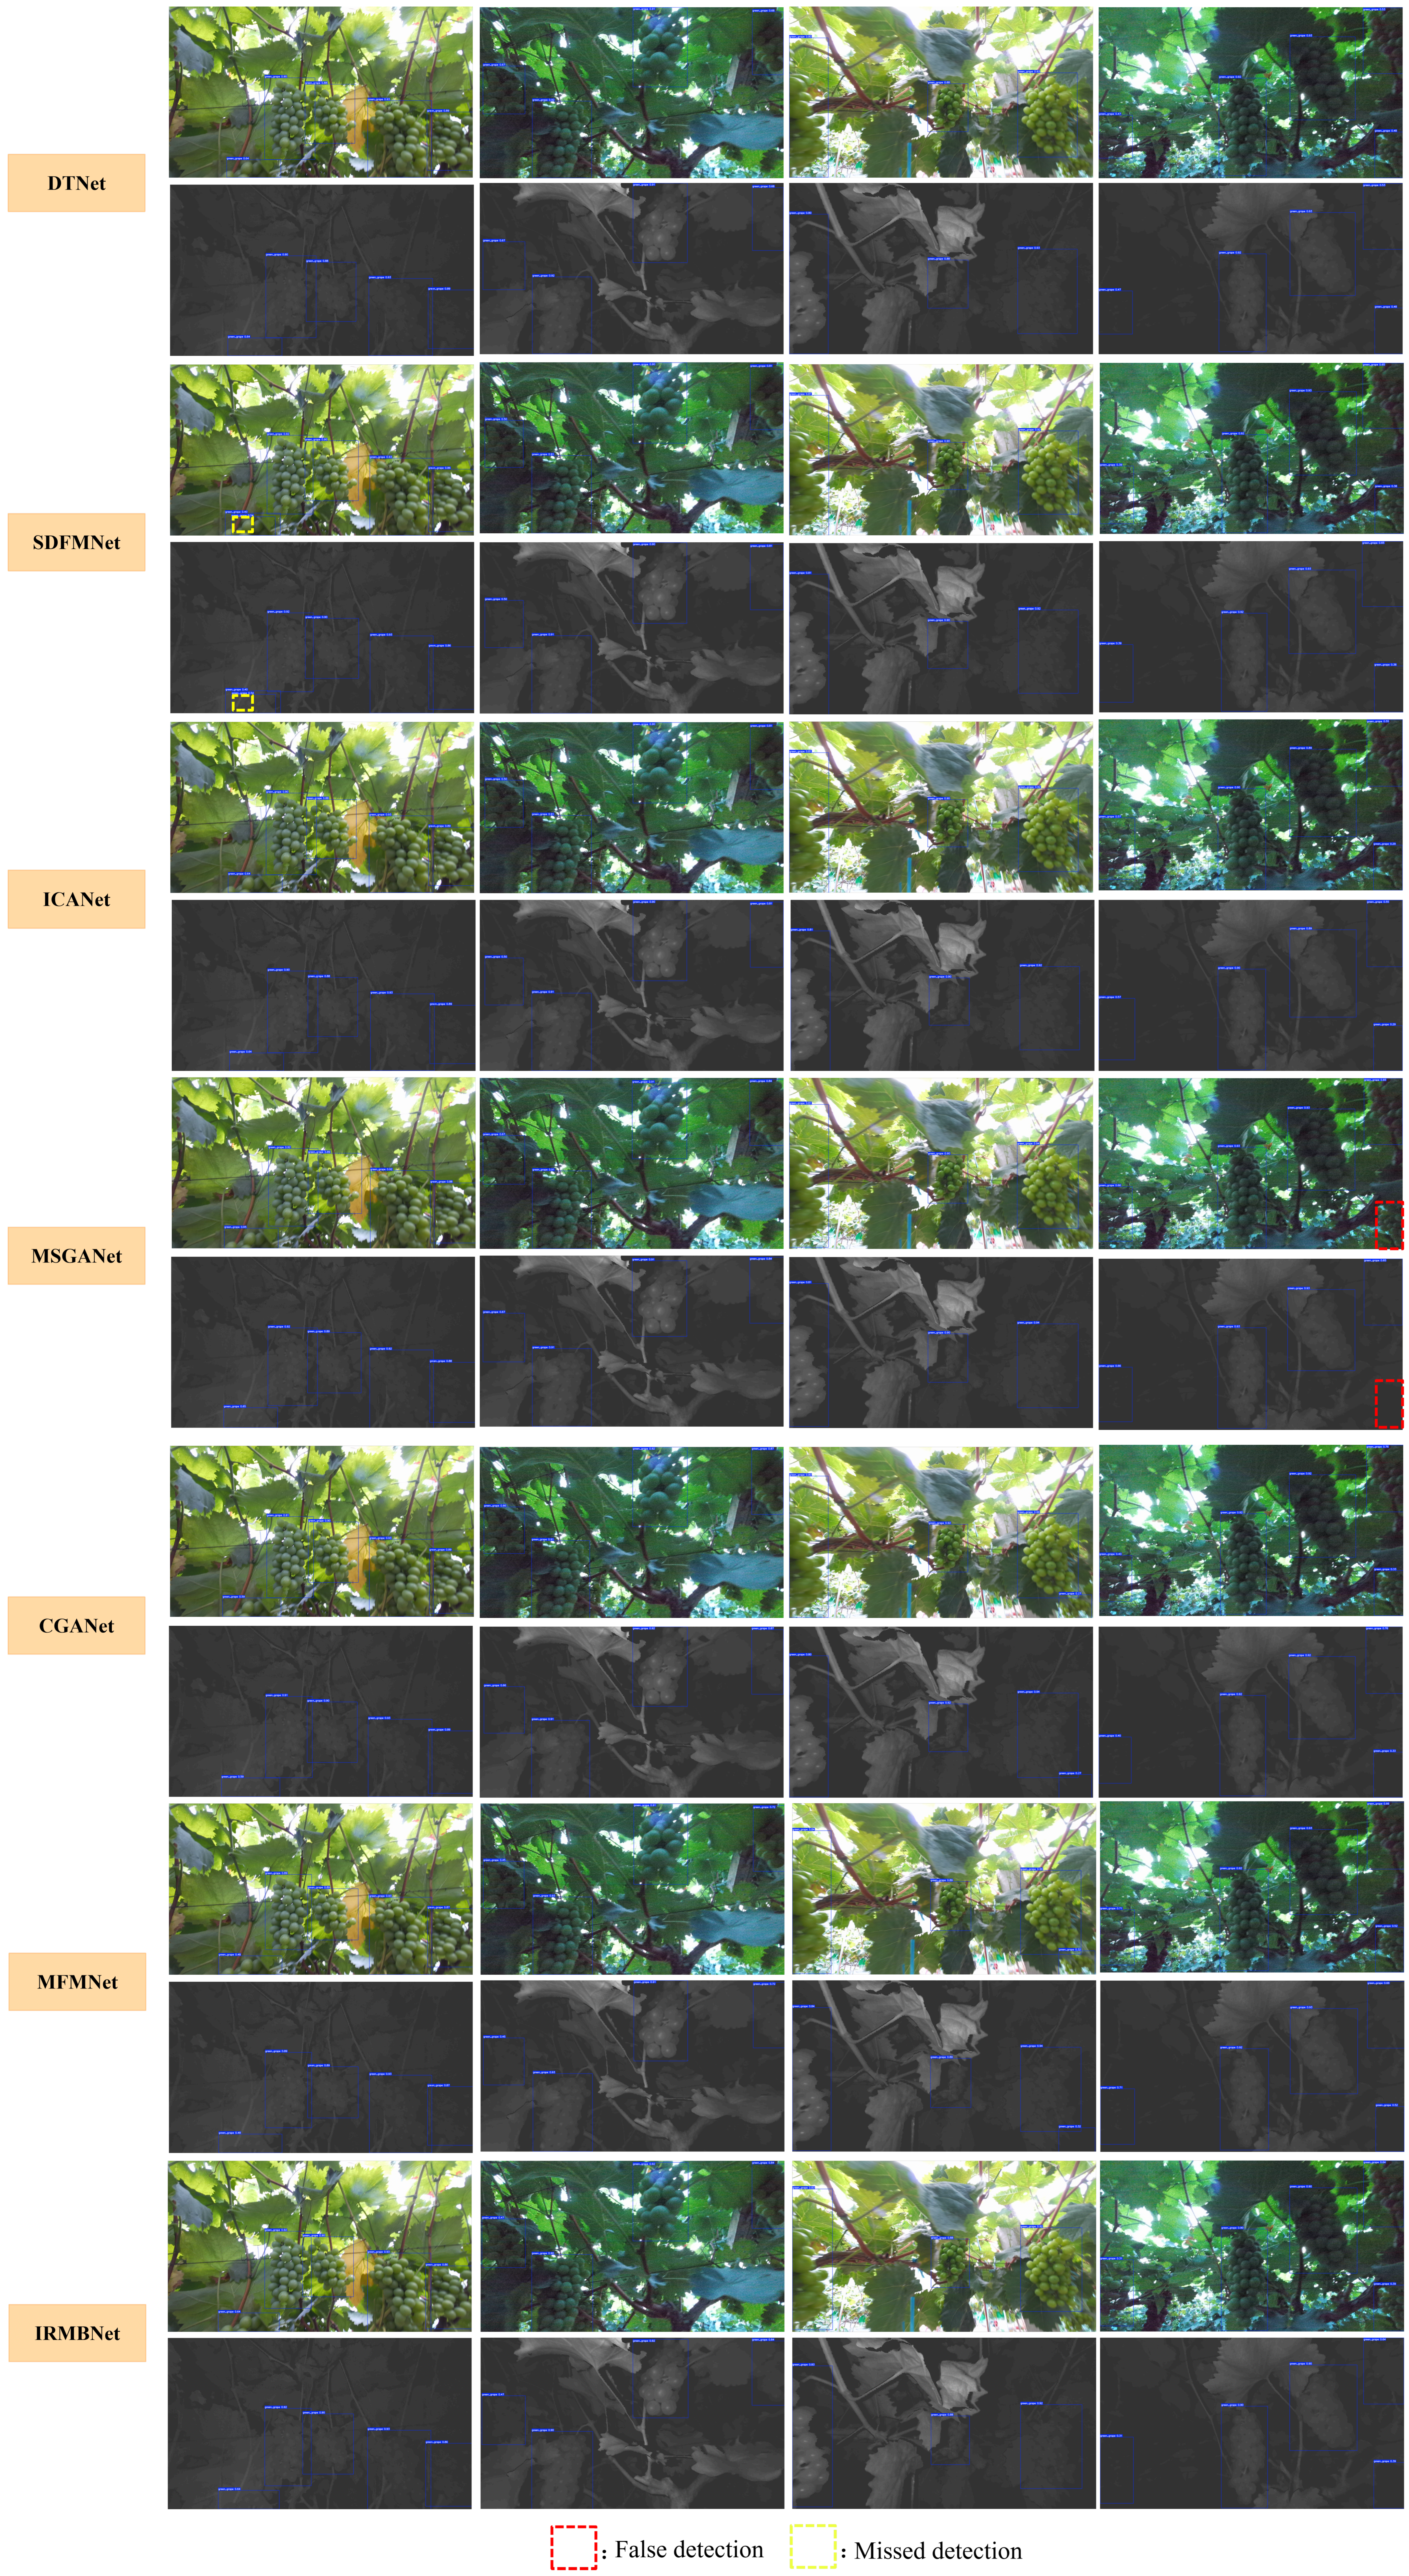
Table 1 presents the quantitative comparison results of different single-modal baseline models on the grape dataset, Figure 4 shows the qualitative comparison of their prediction results, and Figure 5 illustrates the training convergence curves of the different baseline models. As shown in Table 1, the four models exhibit clear differences in Precision, Recall, mAP@0.5, mAP@0.5:0.95, and complexity-related metrics, indicating that different network architectures present different trade-offs between detection accuracy and efficiency in orchard scenarios.
From the perspective of detection accuracy, YOLOv11 achieves the highest Precision of 0.8963 among the four models, while YOLOv8 obtains a Recall of 0.8024, slightly higher than the 0.8021 of YOLOv11. YOLOv13 achieves the highest mAP@0.5 of 0.9031 among the four models and also reaches 0.7058 on mAP@0.5:0.95, which is significantly better than YOLOv8, YOLOv11, and YOLOv12. These results indicate that YOLOv13 not only achieves strong detection performance under a relatively loose IoU threshold, but also maintains more stable localization quality under stricter IoU thresholds, enabling it to provide higher-quality detection boxes in complex orchard scenarios and making it more suitable as the baseline framework for the subsequent dual-modal improvement network.
In terms of model complexity, YOLOv8 has 2,690,598 parameters and 6.9 G FLOPs; YOLOv11 has 2,590,230 parameters and 6.4 G FLOPs; YOLOv12 has 2,538,486 parameters and 6.0 G FLOPs; and YOLOv13 has 2,460,301 parameters and 6.4 G FLOPs. Overall, YOLOv13 has a relatively low parameter count among the four models while maintaining a moderate computational cost. Taken together with the accuracy metrics, these results suggest that YOLOv13 achieves a favorable balance between detection performance and model complexity.
From the qualitative visualization results in Figure 4, YOLOv8, YOLOv11, and YOLOv12 are prone to problems such as missed detections, insufficient separation of overlapping targets, and less precise bounding-box localization in some complex samples. By contrast, YOLOv13 shows more stable detection performance under conditions involving dense fruit clusters, small objects, and partial occlusion, with more accurate bounding-box localization, indicating stronger modeling capability for target boundaries and structural information. Meanwhile, the training convergence curves in Figure 5 show that YOLOv13 maintains good convergence stability during training and performs particularly well on the mAP@0.5:0.95 curve, further validating its advantage under strict localization metrics.
Considering the results in Table 1, Figure 4 and Figure 5, although YOLOv8 and YOLOv12 exhibit certain competitiveness on some metrics, YOLOv13 performs best on mAP@0.5:0.95, which better reflects the quality of detection boxes, while also maintaining lower model complexity and more stable training behavior. Therefore, YOLOv13 is ultimately selected as the baseline for the subsequent dual-modal improvement network, providing the baseline architecture for the subsequent introduction of modules such as DFB, LEM, ASA, the Transformer-based adaptive demodulation detection head, and MBDL.

3.3. Comparative Experiments and Result Analysis

To further validate the detection performance of DTNet in complex orchard scenarios, the proposed method is compared on the grape multimodal object detection dataset with several representative multimodal detection networks, including SDFMNet [45], ICANet [46], MSGANet [47], CGANet [48], MFMNet [49], and iRMBNet [50]. All comparison experiments adopt the same training settings and evaluation protocol as described previously, and uniformly report metrics such as Precision, Recall, mAP@0.5, mAP@0.5:0.95, Params, and FLOPs.

Quantitative Comparison with Mainstream Methods

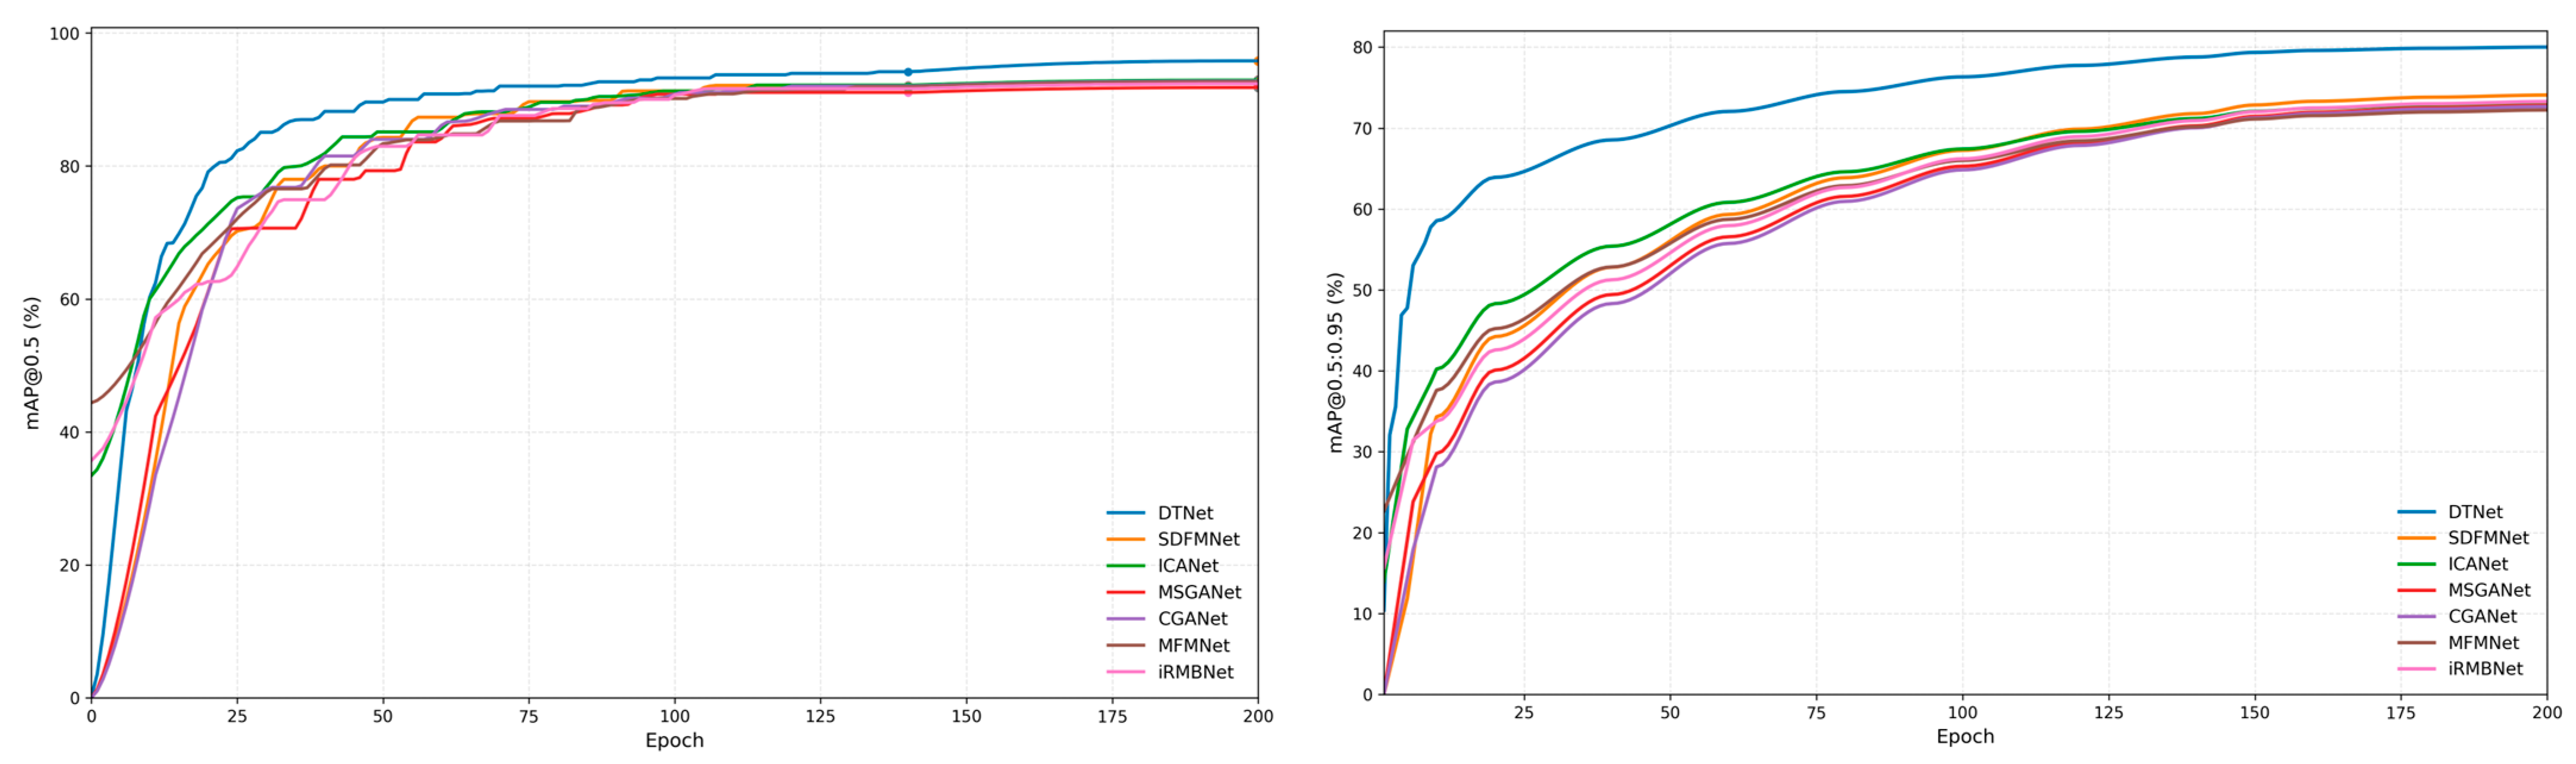
Table 2 presents the quantitative comparison results of different methods on the grape dataset. It can be seen that DTNet achieves 0.9132, 0.8931, 0.9552, and 0.8001 in Precision, Recall, mAP@0.5, and mAP@0.5:0.95, respectively, outperforming all comparison methods overall. In particular, DTNet achieves the highest mAP@0.5 among all methods, significantly surpassing SDFMNet, ICANet, MSGANet, CGANet, MFMNet, and iRMBNet. It also attains the highest Recall, indicating that DTNet can detect targets more completely in complex orchard scenarios and exhibits stronger robustness, especially for samples that are prone to missed detection.
Under the stricter metric of mAP@0.5:0.95, DTNet achieves a result of 0.8001, which is also higher than those of SDFMNet, ICANet, MSGANet, CGANet, MFMNet, and iRMBNet. This demonstrates the clear advantage of the proposed method in bounding-box localization accuracy. Although DTNet has 4,141,053 parameters and 11.9 G FLOPs, its overall complexity remains within an acceptable range and achieves a favorable balance between accuracy and complexity. In contrast, although MFMNet has lower parameter count and computational cost, its detection accuracy lags notably behind DTNet. MSGANet and iRMBNet have model complexity similar to or higher than DTNet, yet their Precision, Recall, and mAP metrics all fall short of the proposed method, indicating that DTNet achieves better overall performance while maintaining high detection accuracy.
The superior performance of DTNet can mainly be attributed to the following factors. First, DFB effectively promotes interaction and fusion between RGB and infrared features, allowing the model to obtain more stable discriminative information under complex illumination and background interference. Second, LEM strengthens local texture and boundary detail representation, helping improve the recognition of fruit contours and partially visible regions. Third, ASA enhances the aggregation of boundary and structural information during multi-scale fusion, thereby improving the distinguishability of targets at different scales. In addition, the Transformer-based adaptive demodulation detection head further improves the global relational modeling capability of candidate predictions, while MBDL enhances localization accuracy and training stability by improving the regression optimization process. Overall, DTNet demonstrates strong competitiveness in orchard multimodal object detection tasks. The qualitative prediction results and training convergence curves are shown in Figure 6 and Figure 7, respectively.

3.4. Ablation Study

To quantitatively analyze the contribution of each key module in DTNet to the overall performance improvement, ablation experiments are conducted on the grape multimodal object detection dataset. The ablation study uses the same training settings and evaluation protocol as the previous comparison experiments, namely an input resolution of 512 × 512, 200 training epochs, the AdamW optimizer, and unified evaluation metrics including Precision, Recall, mAP@0.5, mAP@0.5:0.95, Params, and FLOPs. Since the objective is to verify the performance gain brought by the stepwise introduction of each module, the ablation study takes single-modal YOLOv13 as the starting point and progressively analyzes the performance improvement from dual-modal fusion to the complete DTNet architecture. It should be noted that, because some later modules in DTNet also serve as lightweight structural substitutions rather than pure additive components, the model complexity in the progressive ablation is not necessarily monotonic with respect to module insertion.

Ablation Results

Table 3 reports the controlled settings and progressive module insertion results based on the YOLOv13 backbone. In addition to the progressive module insertion experiments, two supplementary control baselines, namely IR-only YOLOv13 and YOLOv13-MidFusion (simple addition-based), were included to better isolate the contribution of the dual-modal input itself and the effect of different fusion strategies. Here, YOLOv13-MidFusion denotes a simple non-adaptive RGB–IR mid-level fusion baseline, in which the paired modality features are fused by direct addition at the corresponding intermediate stage, without using the proposed DFB. Overall, the complete DTNet achieves the best overall performance, while the added control experiments further clarify that the performance gain comes not only from introducing an additional infrared modality, but also from the effectiveness of the proposed DFB and subsequent module designs.
As shown in the table, the RGB-only YOLOv13 baseline achieves Precision, Recall, mAP@0.5, and mAP@0.5:0.95 of 0.8760, 0.7891, 0.9030, and 0.7058, respectively. By contrast, the IR-only YOLOv13 baseline achieves 0.8531, 0.7642, 0.8812, and 0.6898 on the same metrics, indicating that infrared input alone can provide useful structural cues, but its overall discriminative ability remains weaker than that of RGB input alone for the current fruit detection task.
To further analyze the contribution of simple multimodal input, a YOLOv13-MidFusion (simple addition-based) baseline was constructed. This setting achieves Precision, Recall, mAP@0.5, and mAP@0.5:0.95 of 0.8833, 0.7911, 0.9117, and 0.7158, respectively, with 5,168,124 parameters and 12.9 G FLOPs. Compared with the RGB-only YOLOv13 baseline, this simple fusion setting shows consistent improvements on mAP@0.5 and mAP@0.5:0.95, suggesting that introducing an additional infrared modality is beneficial. However, the overall improvement remains limited, indicating that simple non-adaptive fusion cannot fully exploit the complementary information between RGB and IR modalities.
After introducing the proposed DFB, the model performance is further improved to 0.9147, 0.8567, 0.9318, and 0.7412 in Precision, Recall, mAP@0.5, and mAP@0.5:0.95, respectively. This demonstrates that, compared with the simple addition-based fusion baseline, DFB can more effectively enhance cross-modal interaction and representation learning. At the same time, the parameter count and computational cost increase substantially to 11,139,217 and 22.9 G, respectively, reflecting the additional overhead introduced by the dual-branch multimodal design and the more sophisticated fusion mechanism.
After further introducing LEM, the model’s Precision, Recall, mAP@0.5, and mAP@0.5:0.95 improve to 0.9181, 0.8715, 0.9439, and 0.7759, respectively. Meanwhile, the parameter count decreases to 3,782,645 and the FLOPs reduce to 10.7 G. This reduction does not contradict the cumulative ablation logic, because LEM is not merely an extra accuracy-oriented module; it also serves as a lightweight structural replacement at the corresponding feature-extraction stages. As described in Section 2.4, LEM adopts lightweight designs such as depthwise separable convolution, which enhance local detail representation while reducing parameter count and computational cost. Therefore, after LEM is introduced, the model complexity decreases even though the architecture becomes functionally richer. This indicates that LEM not only enhances local detail representation but also contributes to a more lightweight overall design.
On this basis, adding ASA further improves Precision, Recall, mAP@0.5, and mAP@0.5:0.95 to 0.9169, 0.8874, 0.9520, and 0.7944, respectively, demonstrating that ASA can effectively strengthen spatial information interaction among multi-scale features and improve the discriminability of dense targets and complex background regions. After replacing the original detection head with the Transformer-based adaptive demodulation detection head, Precision changes slightly, whereas Recall, mAP@0.5, and mAP@0.5:0.95 further improve to 0.8907, 0.9537, and 0.7974, respectively. This indicates that the proposed head enhances global modeling capability and localization accuracy without increasing overall model complexity.
Finally, after adding MBDL, the model achieves 0.9132, 0.8931, 0.9552, and 0.8001 in Precision, Recall, mAP@0.5, and mAP@0.5:0.95, respectively, yielding the best overall results in the ablation study. This demonstrates that MBDL can further coordinate the optimization process between the classification and localization branches, thereby improving the overall detection performance of the model in complex orchard scenarios. Overall, DFB, LEM, ASA, the Transformer-based adaptive demodulation detection head, and MBDL exhibit strong synergy and jointly promote the performance improvement of DTNet.
As shown in Table 3, the additional controlled experiments indicate that the performance gain of DTNet does not come solely from the introduction of an additional infrared modality, but also from the effectiveness of the proposed fusion strategy and subsequent architectural refinements. Compared with both the RGB-only baseline and the simple addition-based fusion baseline, the complete DTNet is significantly superior on both mAP@0.5 and mAP@0.5:0.95, demonstrating the effectiveness of the proposed dual-modal design in complex orchard scenarios.

3.5. Evaluation on an Additional Tomato RGB-IR Dataset

To further evaluate the applicability of DTNet on another fruit RGB-IR detection task, experiments were conducted on a public tomato RGB-IR dataset with different maturity stages under the same training and evaluation protocol used for the grape dataset. Although the tomato dataset was divided into training and validation subsets following an 8:2 split, it served as an additional dataset for assessing whether the proposed method could maintain stable performance on a fruit-detection task with different target morphology, maturity-related appearance variation, background texture, and occlusion patterns. The same evaluation metrics, including Precision, Recall, mAP@0.5, mAP@0.5:0.95, Params, and FLOPs, were adopted.

3.5.1. Results on the Tomato RGB-IR Dataset

Table 4 presents the results of DTNet on the grape and tomato RGB-IR datasets. On the tomato dataset, DTNet achieved a Precision of 0.9098, a Recall of 0.8843, an mAP@0.5 of 0.9463, and an mAP@0.5:0.95 of 0.7863. These results indicate that the proposed model maintains stable detection performance on another fruit RGB-IR dataset with different category definitions and scene characteristics, demonstrating favorable adaptability to an additional fruit detection task.
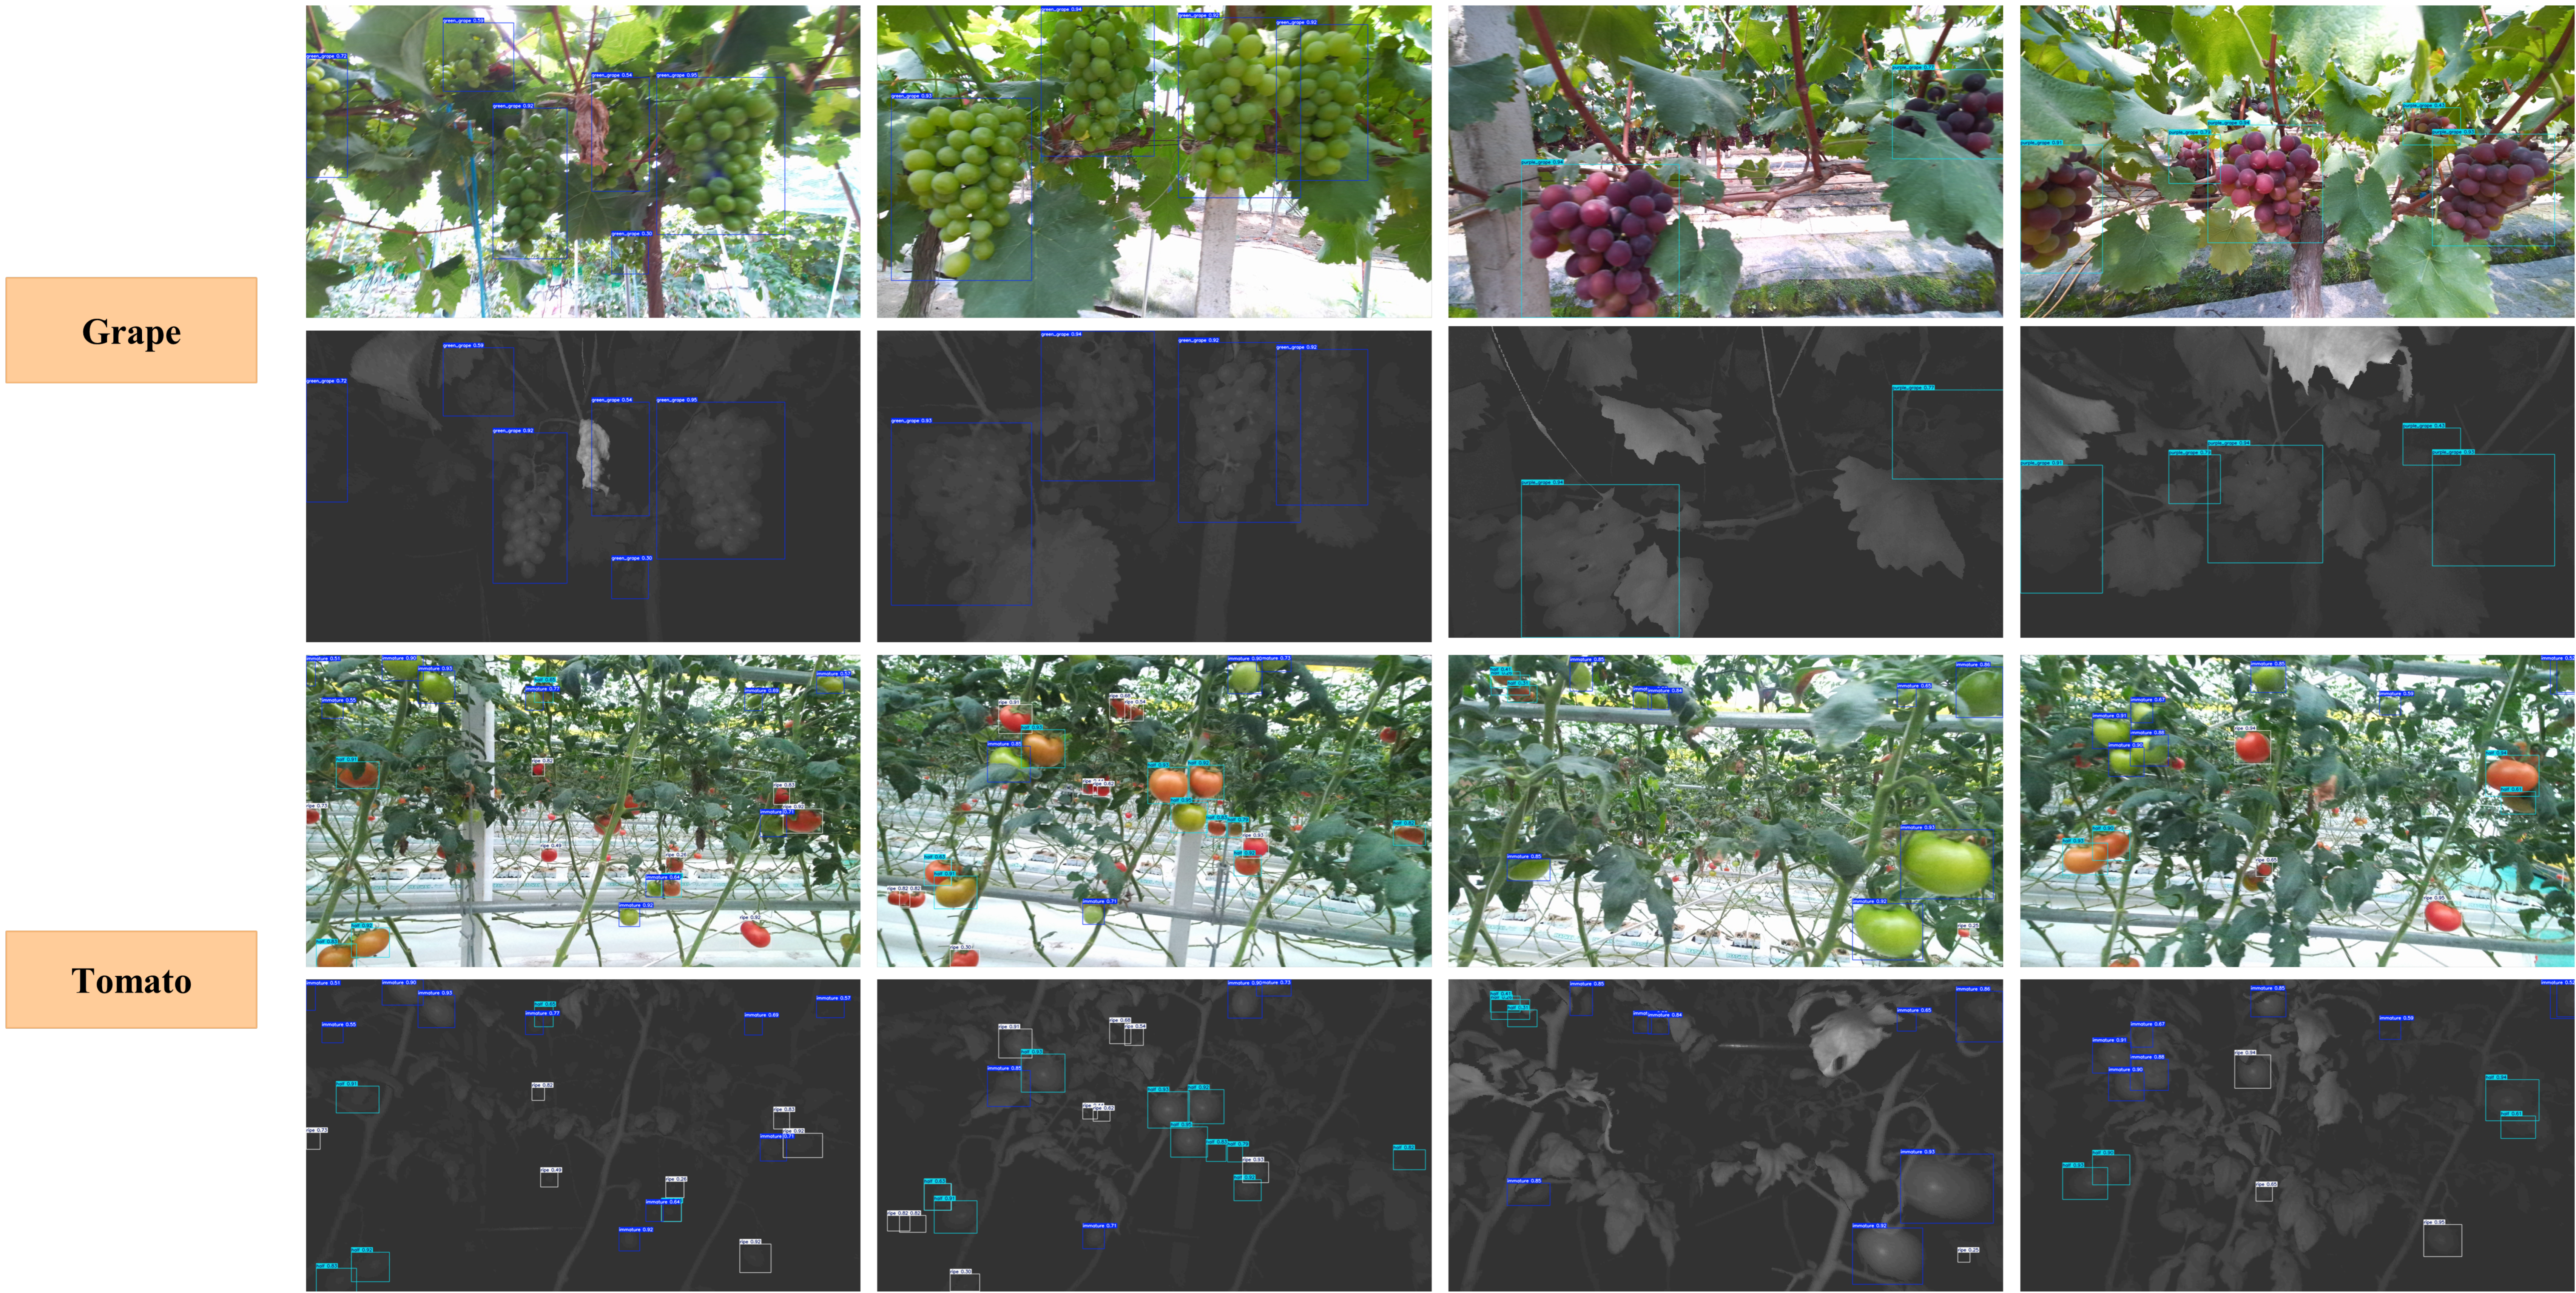
Compared with the grape dataset, the mAP@0.5 of DTNet on the tomato dataset decreases from 0.9552 to 0.9463, a drop of 0.88 percentage points; mAP@0.5:0.95 decreases from 0.8001 to 0.7863, a drop of 1.38 percentage points; and Recall decreases from 0.8931 to 0.8843, only 0.88 percentage points. Overall, the performance degradation is relatively small, indicating that the proposed network architecture remains effective on another fruit RGB-IR dataset with different target categories and scene characteristics. The qualitative prediction results are shown in Figure 8.

3.5.2. Analysis of Results on the Additional Dataset

Compared with the grape dataset, the tomato dataset differs significantly in multiple aspects. First, the category definitions are different: the grape dataset mainly distinguishes categories by color, whereas the tomato dataset divides fruits into immature, half-ripe, and ripe according to maturity. Significant differences exist among these maturity levels in terms of color, texture, and surface reflectance characteristics. Second, the two crops also differ greatly in appearance, fruit size, clustered distribution pattern, and background structure, which may lead to feature distribution shifts when the model is applied across datasets. In addition, the branch and leaf structures, occlusion patterns, and local illumination conditions in tomato scenes are not fully consistent with those in grape scenes, which may also affect detection stability [51].
Despite these differences, DTNet is still able to achieve high Precision, Recall, and mAP values on the tomato dataset, indicating that the proposed multimodal fusion and feature enhancement mechanisms possess good adaptability to another fruit RGB-IR detection task.
Overall, the results on the tomato dataset indicate that DTNet is not only effective on the grape dataset but also maintains favorable performance on an additional fruit RGB-IR dataset. This suggests that the proposed framework has promising applicability in multimodal agricultural perception tasks involving different fruit categories and scene conditions.

3.6. Qualitative Visualization Comparison in Complex Scenarios

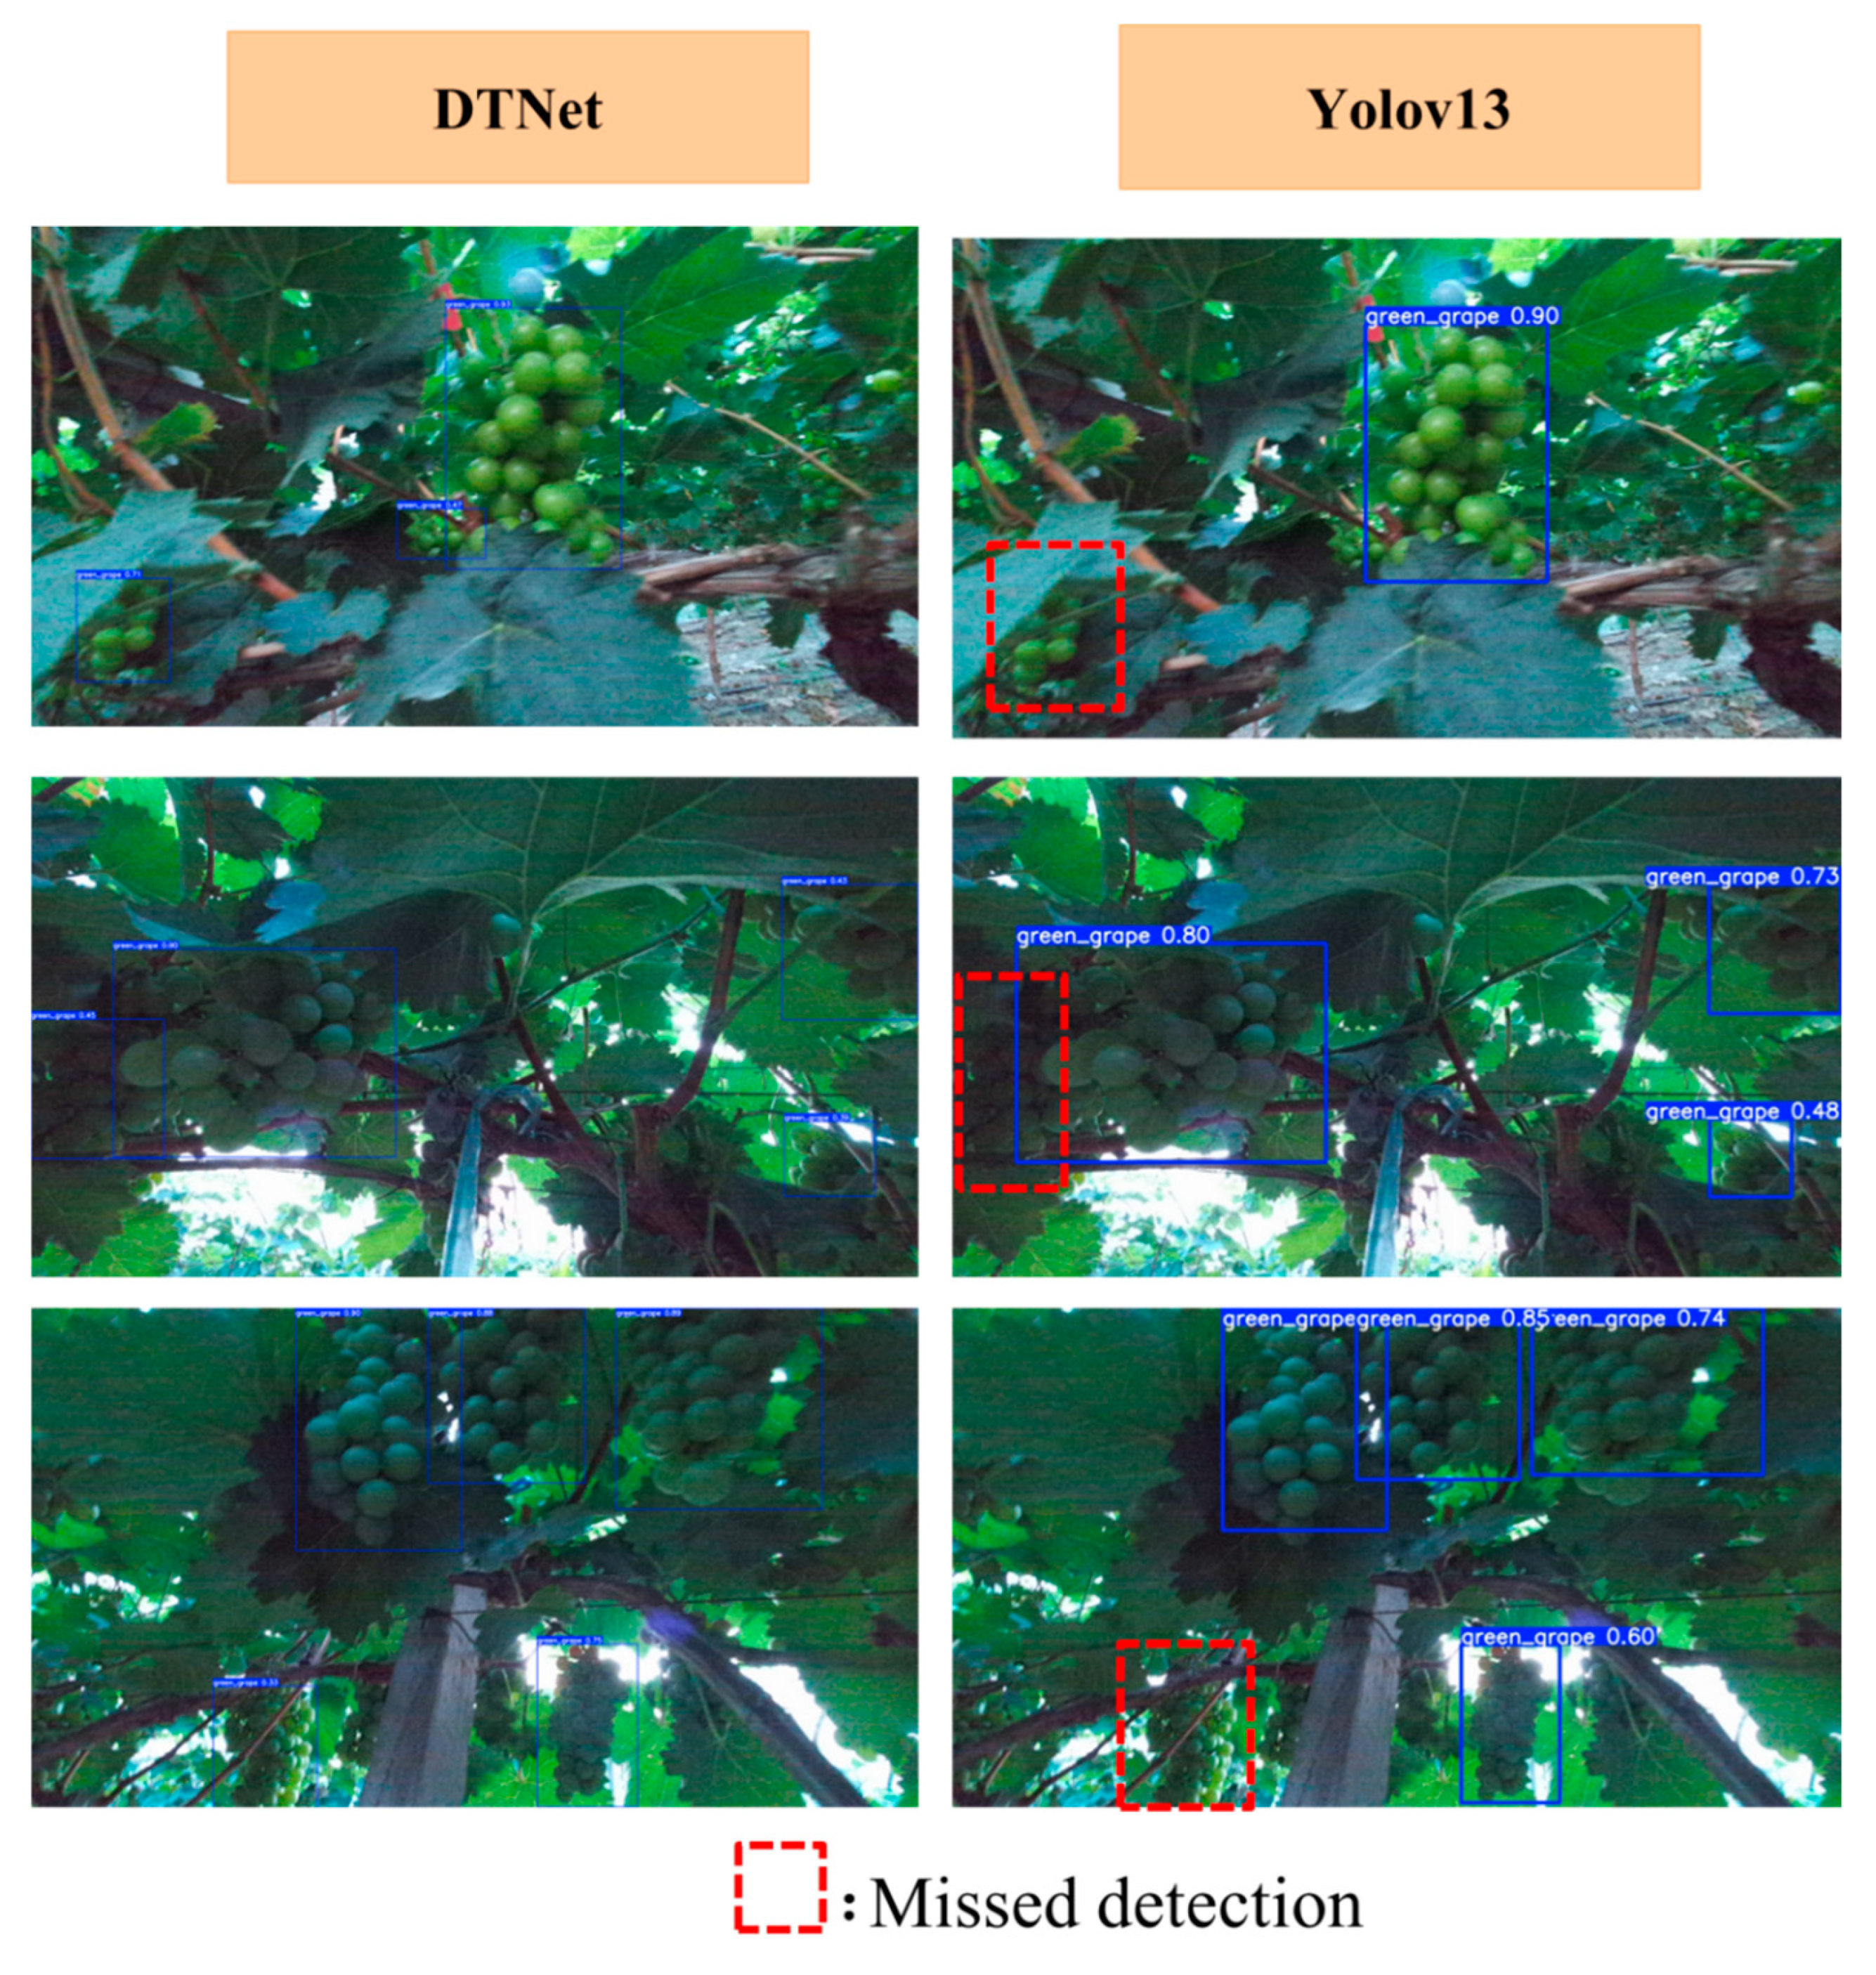
In orchard environments, fruit targets are often located in complex scenarios involving backlighting, occlusion, small-object scale, and strong background interference. These factors may weaken fruit surface texture information, distort brightness contrast, overexpose local regions, or cause blurred boundaries and missing features due to occlusion by leaves and branches, thereby significantly increasing the difficulty of object detection. To further verify the robustness of DTNet under such complex scenarios, three representative groups of samples are selected for qualitative visualization comparison, and DTNet is compared with the baseline single-modal YOLOv13.
As can be observed from the figure, single-modal YOLOv13 is easily affected by illumination variation, occlusion interference, and the scale limitation of small targets in complex scenarios. On the one hand, under backlighting or local strong illumination, fruit regions are prone to blurred boundaries and weakened textures, leading to shifted detection boxes or inaccurate localization. On the other hand, under leaf occlusion, densely clustered targets, and small fruit sizes, the response of the baseline method to some targets becomes weaker, making missed detections more likely. In particular, when the contrast between the fruit and background is low, or when the target is only partially visible, a single modality cannot provide sufficiently stable and complete discriminative information, resulting in less reliable detection results.
In contrast, DTNet exhibits more stable detection performance across all three groups of complex samples. For targets strongly affected by backlighting, fruits partially occluded by branches and leaves, and small-sized targets, DTNet can still localize fruit regions more accurately and effectively reduce missed detections and false detections. Its advantages are mainly reflected in the following aspects. First, the infrared modality can still preserve certain structural differences under complex illumination and occlusion, thus providing beneficial complementary information to the RGB modality. Second, DFB enhances the model’s discriminative capability in complex regions through cross-modal interaction and fusion. Third, LEM and ASA further improve the representation quality of boundaries and local details, enabling the model to maintain good target distinguishability even in scenarios involving backlighting, occlusion, and small objects. Therefore, the qualitative comparison under complex scenarios further verifies the robustness and detection stability of DTNet in real orchard environments. The qualitative comparison results are shown in Figure 9.

4. Discussion

The proposed DTNet demonstrates strong overall performance in dual-modal fruit object detection under complex orchard scenarios. Its core advantage lies in the coordinated optimization of dual-modal information complementarity, local detail enhancement, spatial saliency modeling, and a Transformer-based detection head, which collectively alleviate the insufficient robustness of traditional single-modal detection models under conditions of complex illumination, severe occlusion, and dense distributions of small targets. Compared with methods relying solely on RGB information, DTNet constructs a decoupled RGB-IR dual-branch backbone and introduces the DFB module at intermediate layers to achieve cross-modal feature interaction. Specifically, when visible-light images suffer from backlighting, local overexposure, deep shadows, or reduced chromatic contrast, the RGB branch may lose discriminative color and texture cues, causing fruit regions to become less salient against surrounding leaves and branches. In contrast, the infrared branch is less sensitive to these visible-light disturbances and can still preserve relatively stable intensity discontinuities and contour-level structural cues around the fruit body. For example, when a grape cluster appears visually merged with dark foliage or partially saturated background regions in the RGB image, the IR branch can still maintain clearer object-to-background separation and cluster-level contour information. By integrating these complementary cues, the DFB module enables the fused representation to retain fruit saliency even when the RGB branch becomes unreliable, thereby improving localization stability and reducing missed detections under complex illumination and occlusion conditions.
According to the ablation results, the introduction of DFB substantially improves detection performance over both the RGB-only baseline and the simple RGB-IR mid-level fusion baseline, confirming that the main gain does not come merely from adding an infrared modality, but from more effective cross-modal interaction. At the same time, DFB also introduces a clear efficiency cost: compared with the simple fusion setting, both Params and FLOPs increase substantially after DFB is introduced. This indicates that DFB is the main source of multimodal accuracy gain, but it is also the main source of additional computational overhead in the proposed framework. Therefore, the role of DFB should be understood as an explicit accuracy–efficiency trade-off: when stronger robustness and higher detection accuracy in complex orchard environments are prioritized, the use of DFB is justified; however, in extremely resource-constrained settings, simpler fusion schemes may still remain attractive if lower computational cost is the primary objective. After further introducing LEM, the model not only continues to improve in Precision, Recall, and mAP, but also shows a significant reduction in parameter count and FLOPs. This does not contradict the cumulative ablation logic, because LEM is not only an accuracy-oriented enhancement module but also a lightweight structural replacement that uses designs such as depthwise separable convolution. In this sense, the later modules partly compensate for the complexity increase introduced by DFB and help the final DTNet recover a more favorable balance between accuracy and efficiency.
In the quantitative comparison with mainstream methods, DTNet achieves high mAP@0.5 and Recall on the grape dataset, indicating strong overall competitiveness in complex orchard scenarios. In particular, the qualitative comparison in complex scenes shows that DTNet can still maintain stable detection performance under conditions such as backlighting, occlusion, and small-object targets, which indirectly confirms the importance of dual-modal fusion and local enhancement design for improving model robustness. In addition, the additional-dataset evaluation on the tomato dataset demonstrates that, although the target appearance, maturity distribution, and background characteristics differ significantly from those in the grape dataset, DTNet can still maintain high Precision, Recall, and mAP values. This suggests that the proposed method is applicable to another fruit RGB-IR detection task and has promising potential for multimodal agricultural perception under varying scene conditions.
At the same time, the likely sensitivity of DTNet to RGB-IR misalignment should be discussed more explicitly. The current framework, especially DFB, assumes that the paired RGB and IR inputs are reasonably well registered at the spatial level. In real agricultural environments, however, slight viewpoint deviation, camera vibration, sensor mounting error, rolling-shutter differences, or temporal desynchronization may introduce local cross-modal offsets. Under such conditions, pixel-wise adaptive weighting and cross-modal interaction may operate on partially mismatched regions, which can weaken object-to-background separation and reduce the reliability of fused contour cues, especially near fruit boundaries, occlusion regions, and densely clustered targets. Therefore, although the present results demonstrate the effectiveness of DTNet on registered RGB-IR datasets, the robustness of the current design to substantial modality misalignment should not be overstated. In practical deployment, DTNet is expected to perform best when the RGB and IR streams are carefully calibrated and synchronized, whereas noticeable registration errors may reduce part of the gain brought by DFB. Future work should therefore investigate more robust cross-modal alignment mechanisms, such as offset-aware fusion, feature-level registration compensation, or deformable cross-modal interaction strategies, to improve tolerance to registration errors in real orchard conditions.
Overall, DTNet achieves a relatively reasonable balance among detection accuracy, robustness, and deployment potential. The modules DFB, LEM, ASA, the Transformer-based adaptive demodulation detection head, and MBDL are highly complementary in function: DFB provides the basis for cross-modal information interaction, LEM balances detail enhancement and lightweight requirements, ASA strengthens multi-level feature fusion, the Transformer-based adaptive demodulation detection head enhances the global modeling capability of the detector, and MBDL further optimizes bounding-box regression and hard-sample learning. Nevertheless, several limitations remain. First, the current experimental validation is still based on relatively limited crop categories and dataset scales, which is insufficient to fully cover broader seasonal, varietal, and field-condition variability. Second, although edge-side tests on Raspberry Pi 5 indicate acceptable inference efficiency, the reported latency reflects the runtime introduced by the detection algorithm itself rather than full end-to-end pipeline cost, and further engineering optimization is still needed for practical field deployment. Third, although the final model complexity has been controlled to a reasonable level, the Transformer-based detection head may still introduce non-negligible overhead on more resource-constrained agricultural terminals. Future work may therefore focus on larger and more diverse RGB-IR agricultural datasets, more robust cross-modal alignment under real field perturbations, lighter global modeling units, model compression and quantized deployment, and tighter integration with downstream tasks such as maturity estimation, yield prediction, and robotic harvesting control.

5. Conclusions

To address common challenges in fruit detection in complex orchard environments, including severe occlusion, illumination variation, dense distributions of small targets, and the limited robustness of single-modal detectors, this paper proposes DTNet, an end-to-end RGB-IR dual-modal fruit detection network. Instead of depending on visible-light information alone, DTNet improves detection performance through a unified framework that combines cross-modal complementary perception, fine-grained feature enhancement, global relational modeling, and balanced optimization for hard samples. In this way, the proposed method strengthens target representation under complex illumination, occlusion, and dense-target conditions while maintaining a favorable balance between accuracy and model complexity.
Experimental results show that DTNet achieves a Precision of 0.9132, a Recall of 0.8931, an mAP@0.5 of 0.9552, and an mAP@0.5:0.95 of 0.8001 on the grape RGB-IR object detection dataset, outperforming multiple comparison methods overall. In the additional evaluation on the tomato RGB-IR dataset, the proposed model also maintains high detection accuracy, indicating favorable adaptability to another fruit RGB-IR detection task. The ablation study further confirms that the effectiveness of DTNet comes from the coordinated design of multimodal fusion, local detail enhancement, and robust optimization, while lightweight structural design helps control computational overhead.
Overall, DTNet provides an effective solution for RGB-IR dual-modal fruit object detection in orchard scenarios and shows promising potential for practical applications such as agricultural robot perception, automatic fruit harvesting, yield estimation, and intelligent orchard management. Future work will focus on improving robustness to cross-modal misalignment, enhancing lightweight deployment efficiency, extending validation to more crop categories and scenarios, and strengthening the integration between multimodal detection and downstream agronomic decision-making.

Author Contributions

Conceptualization, Z.D. and G.S.; methodology, Z.D. and G.S.; software, Z.D.; validation, Z.D. and G.S.; formal analysis, Z.D.; investigation, Z.D.; resources, G.S.; data curation, Z.D.; writing—original draft preparation, Z.D.; writing—review and editing, Z.D. and G.S.; visualization, Z.D.; supervision, G.S.; project administration, G.S.; funding acquisition, G.S. All authors have read and agreed to the published version of the manuscript.

Funding

This research was funded by the Key Research and Development Program of Jiangsu Province, China, grant number BE2022363.

Data Availability Statement

Publicly available datasets were analyzed in this study. These datasets can be accessed through Science Data Bank (ScienceDB) at: https://www.scidb.cn/detail?dataSetId=84fa458dfc854fba8ce578b6d826b9c8 (accessed on 6 May 2026) and https://www.scidb.cn/detail?dataSetId=c303b6269e3e43f087bec4e87735a42e (accessed on 6 May 2026).

Acknowledgments

During the preparation of this manuscript, the authors used ChatGPT (OpenAI, GPT-5.4 Thinking) to improve the language. After using this tool, the authors reviewed and edited the content as needed and took full responsibility for the content of the publication.

Conflicts of Interest

The authors declare no conflicts of interest.

References

  1. Koirala, A.; Walsh, K.B.; Wang, Z.; McCarthy, C. Deep learning for real-time fruit detection and orchard fruit load estimation: Benchmarking of “MangoYOLO”. Precis. Agric. 2019, 20, 1107–1135. [Google Scholar] [CrossRef]
  2. Xiao, B.J.; Nguyen, M.; Yan, W.Q. Fruit ripeness identification using YOLOv8 model. Multimed. Tools Appl. 2024, 83, 28039–28056. [Google Scholar] [CrossRef]
  3. Sun, H.; Wang, B.; Xue, J. YOLO-P: An efficient method for pear fast detection in complex orchard picking environment. Front. Plant Sci. 2023, 13, 1089454. [Google Scholar] [CrossRef]
  4. Lin, T.; Sun, F.; Li, X.; Guo, X.; Ying, J.; Wu, H.; Li, H. A review of key technologies and recent advances in intelligent fruit-picking robots. Horticulturae 2026, 12, 158. [Google Scholar] [CrossRef]
  5. Zhang, Y.; Li, N.; Zhang, L.; Lin, J.; Gao, X.; Chen, G. A review on the recent developments in vision-based apple-harvesting robots for recognizing fruit and picking pose. Comput. Electron. Agric. 2025, 231, 109968. [Google Scholar] [CrossRef]
  6. Shi, X.; Wang, S.; Zhang, B.; Ding, X.; Qi, P.; Qu, H.; Li, N.; Wu, J.; Yang, H. Advances in object detection and localization techniques for fruit harvesting robots. Agronomy 2025, 15, 145. [Google Scholar] [CrossRef]
  7. Onishi, Y.; Yoshida, T.; Kurita, H.; Fukao, T.; Arihara, H.; Iwai, A. An automated fruit harvesting robot by using deep learning. Robomech J. 2019, 6, 13. [Google Scholar] [CrossRef]
  8. Guo, C.; Zheng, S.; Cheng, G.; Zhang, Y.; Ding, J. An improved YOLOv4 used for grape detection in unstructured environment. Front. Plant Sci. 2023, 14, 1209910. [Google Scholar] [CrossRef]
  9. Liu, G.; Hou, Z.; Liu, H.; Liu, J.; Zhao, W.; Li, K. TomatoDet: Anchor-free detector for tomato detection. Front. Plant Sci. 2022, 13, 942875. [Google Scholar] [CrossRef]
  10. Pinheiro, I.; Moreira, G.; da Silva, D.Q.; Magalhães, S.; Valente, A.; Oliveira, P.M.; Cunha, M.; Santos, F. Deep learning YOLO-based solution for grape bunch detection and assessment of biophysical lesions. Agronomy 2023, 13, 1120. [Google Scholar] [CrossRef]
  11. Murat, A.A.; Kiran, M.S. A comprehensive review on YOLO versions for object detection. Eng. Sci. Technol. Int. J. 2025, 70, 102161. [Google Scholar] [CrossRef]
  12. Pagire, V.; Chavali, M.; Kale, A. A comprehensive review of object detection with traditional and deep learning methods. Signal Process. 2025, 237, 110250. [Google Scholar] [CrossRef]
  13. Mbouembe, P.L.T.; Liu, G.; Sikati, J.; Kim, S.C.; Kim, J.H. An efficient tomato-detection method based on improved YOLOv4-tiny model in complex environment. Front. Plant Sci. 2023, 14, 1150958. [Google Scholar] [CrossRef] [PubMed]
  14. De Silva, M.; Brown, D. Multispectral plant disease detection with vision transformer-convolutional neural network hybrid approaches. Sensors 2023, 23, 8531. [Google Scholar] [CrossRef]
  15. Nguyen, C.; Moghadam, P.; Ward, B.; Miller, J.; O’Halloran, K.; Hernandez, E.; Salisbury, J.; Able, A.J. Early detection of plant viral disease using hyperspectral imaging and deep learning. Sensors 2021, 21, 742. [Google Scholar] [CrossRef] [PubMed]
  16. Xiang, Y.; Chen, Q.; Su, Z.; Zhang, L.; Chen, Z.; Zhou, G.; Yao, Z.; Xuan, Q.; Cheng, Y. Deep learning and hyperspectral images based tomato soluble solids content and firmness estimation. Front. Plant Sci. 2022, 13, 860656. [Google Scholar] [CrossRef]
  17. Barros, T.; Conde, P.; Gonçalves, G.; Premebida, C.; Monteiro, M.; Ferreira, C.S.; Henriques, R. Multispectral vineyard segmentation: A deep learning comparison study. Comput. Electron. Agric. 2022, 195, 106782. [Google Scholar] [CrossRef]
  18. Su, S.; Chen, R.; Fang, X.; Zhu, Y.; Zhang, T.; Xu, Z. A novel lightweight grape detection method. Agriculture 2022, 12, 1364. [Google Scholar] [CrossRef]
  19. Yang, W.; Qiu, X. A lightweight and efficient model for grape bunch detection and biophysical anomaly assessment in complex environments based on YOLOv8s. Front. Plant Sci. 2024, 15, 1395796. [Google Scholar] [CrossRef]
  20. Wu, X.; Tang, R.; Mu, J.; Niu, Y.; Xu, Z.; Chen, Z. A lightweight grape detection model in natural environments based on an enhanced YOLOv8 framework. Front. Plant Sci. 2024, 15, 1407839. [Google Scholar] [CrossRef]
  21. Shuai, L.; Li, Z.; Chen, Z.; Luo, D.; Mu, J. A research review on deep learning combined with hyperspectral imaging in multiscale agricultural sensing. Comput. Electron. Agric. 2024, 217, 108577. [Google Scholar] [CrossRef]
  22. Zhu, X.; Yu, Z.; Li, C. GrapeUL-YOLO: Bidirectional cross-scale fusion with elliptical anchors for robust grape detection in orchards. Front. Plant Sci. 2025, 16, 1701817. [Google Scholar] [CrossRef] [PubMed]
  23. Gao, F.; Fang, W.; Sun, X.; Wu, Z.; Zhao, G.; Li, G.; Li, R.; Fu, L.; Zhang, Q. A novel apple fruit detection and counting methodology based on deep learning and trunk tracking in modern orchard. Comput. Electron. Agric. 2022, 197, 107000. [Google Scholar] [CrossRef]
  24. Ji, W.; Huang, X.; Wang, S.; He, X. A comprehensive review of the research of the “eye-brain-hand” harvesting system in smart agriculture. Agronomy 2023, 13, 2237. [Google Scholar] [CrossRef]
  25. Tu, S.; Huang, Y.; Huang, Q.; Liu, H.; Cai, Y.; Lei, H. Estimation of passion fruit yield based on YOLOv8n + OC-SORT + CRCM algorithm. Comput. Electron. Agric. 2025, 229, 109727. [Google Scholar] [CrossRef]
  26. De Silva, M.; Brown, D. Tomato disease detection using multispectral imaging with deep learning models. In Proceedings of the 7th International Conference on Artificial Intelligence, Big Data, Computing and Data Communication Systems (ICABCD 2024), Durban, South Africa, 16–18 May 2024. [Google Scholar]
  27. Seiche, A.T.; Wittstruck, L.; Jarmer, T. Weed detection from unmanned aerial vehicle imagery using deep learning—A comparison between high-end and low-cost multispectral sensors. Sensors 2024, 24, 1544. [Google Scholar] [CrossRef] [PubMed]
  28. Baltrusaitis, T.; Ahuja, C.; Morency, L.-P. Multimodal machine learning: A survey and taxonomy. IEEE Trans. Pattern Anal. Mach. Intell. 2019, 41, 423–443. [Google Scholar] [CrossRef]
  29. Zhao, F.; Zhang, C.; Geng, B. Deep multimodal data fusion. ACM Comput. Surv. 2024, 56, 216. [Google Scholar] [CrossRef]
  30. Carion, N.; Massa, F.; Synnaeve, G.; Usunier, N.; Kirillov, A.; Zagoruyko, S. End-to-end object detection with transformers. In Computer Vision—ECCV 2020, Part I; Vedaldi, A., Bischof, H., Brox, T., Frahm, J.-M., Eds.; Springer: Cham, Switzerland, 2020; pp. 213–229. [Google Scholar]
  31. Zhao, Y.; Wong, W.; Bénière, R.; Ye, J.; de Charette, R.; Chavdarova, T. DETRs beat YOLOs on real-time object detection. In Proceedings of the IEEE/CVF Conference on Computer Vision and Pattern Recognition (CVPR), Seattle, WA, USA, 17–21 June 2024; pp. 16965–16974. [Google Scholar]
  32. Chiu, M.T.; Xu, X.; Wang, Y.; Wei, J.; Huang, Z.; Schwing, A.G.; Brunner, R.; Khachatrian, H.; Karapetyan, H. Agriculture-Vision: A large aerial image database for agricultural pattern analysis. In Proceedings of the IEEE/CVF Conference on Computer Vision and Pattern Recognition (CVPR), Seattle, WA, USA, 13–19 June 2020; pp. 2828–2838. [Google Scholar]
  33. Xu, K.; Zhu, Y.; Cao, W.; Jiang, X.; Jiang, Z.; Li, S.; Ni, J. Multi-modal deep learning for weeds detection in wheat field based on RGB-D images. Front. Plant Sci. 2021, 12, 732968. [Google Scholar] [CrossRef]
  34. Wu, Y.; Zhao, C.; Hou, Y.; Li, Y.; Liu, H.; Yang, Y.; He, Y. An RGB-D object detection model with high-generalization ability applied to tea harvesting robot for outdoor cross-variety tea shoots detection. J. Field Robot. 2024, 41, 1167–1186. [Google Scholar] [CrossRef]
  35. Loghmani, M.R.; Khosravi, H.; Soryani, M.; Nezamabadi-pour, H. Recurrent convolutional fusion for RGB-D object recognition. IEEE Robot. Autom. Lett. 2019, 4, 2878–2885. [Google Scholar] [CrossRef]
  36. Villacrés, J.; Viscaíno, M.; Delpiano, J.; Vougioukas, S.; Auat Cheein, F. Apple orchard production estimation using deep learning strategies: A comparison of tracking-by-detection algorithms. Comput. Electron. Agric. 2023, 204, 107513. [Google Scholar] [CrossRef]
  37. Xu, H.; Li, H.; Zhao, J. A lightweight tri-modal few-shot detection framework for fruit diversity recognition toward digital orchard archiving. Front. Plant Sci. 2025, 16, 1696622. [Google Scholar] [CrossRef] [PubMed]
  38. Sahin, H.M.; Miftahushudur, T.; Grieve, B.; Yin, H. Segmentation of weeds and crops using multispectral imaging and CRF-enhanced U-Net. Comput. Electron. Agric. 2023, 211, 107956. [Google Scholar] [CrossRef]
  39. Li, K.; Wei, X.; Wang, Q.; Zhang, W. Research on strawberry visual recognition and 3D localization based on lightweight RAFS-YOLO and RGB-D camera. Agriculture 2025, 15, 2212. [Google Scholar] [CrossRef]
  40. Chen, W.; Rao, Y.; Wang, F.; Zhang, Y.; Yang, Y.; Luo, Q.; Zhang, T.; Wan, T.; Liu, X.; Zhang, M.; et al. A dataset of grape multimodal object detection and semantic segmentation. China Sci. Data 2023, 10, 89–104. [Google Scholar] [CrossRef]
  41. Zhang, Y.; Rao, Y.; Chen, W.; Hou, W.; Yan, S.; Li, Y.; Zhou, C.; Wang, F.; Chu, Y.; Shi, Y. A dataset of multimodal images of tomato fruits at different stages of maturity. China Sci. Data 2025, 10, 73–88. [Google Scholar] [CrossRef]
  42. Lei, M.; Li, S.; Wu, Y.; Hu, H.; Zhou, Y.; Zheng, X.; Ding, G.; Du, S.; Wu, Z.; Gao, Y. YOLOv13: Real-Time Object Detection with Hypergraph-Enhanced Adaptive Visual Perception. arXiv 2025, arXiv:2506.17733. [Google Scholar]
  43. Sapkota, R.; Meng, Z.; Churuvija, M.; Du, X.; Ma, Z.; Karkee, M. Comprehensive performance evaluation of YOLOv12, YOLO11, YOLOv10, YOLOv9 and YOLOv8 on detecting and counting fruitlet in complex orchard environments. Agric. Commun. 2026, 4, 100125. [Google Scholar] [CrossRef]
  44. Li, G.; Fang, J. LCW-YOLO: A lightweight multi-scale object detection method based on YOLOv11 and its performance evaluation in complex natural scenes. Sensors 2025, 25, 6209. [Google Scholar] [CrossRef]
  45. Tang, L.; Zhang, H.; Xu, H.; Ma, J. Rethinking the necessity of image fusion in high-level vision tasks: A practical infrared and visible image fusion network based on progressive semantic injection and scene fidelity. Inf. Fusion 2023, 99, 101870. [Google Scholar] [CrossRef]
  46. Shen, J.; Chen, Y.; Liu, Y.; Zuo, X.; Fan, H.; Yang, W. ICAFusion: Iterative cross-attention guided feature fusion for multispectral object detection. Pattern Recognit. 2024, 145, 109913. [Google Scholar] [CrossRef]
  47. Ghorbani Kolahi, S.; Chaharsooghi, S.K.; Khatibi, T.; Bozorgpour, A.; Azad, R.; Heidari, M.; Hacihaliloglu, I.; Merhof, D. MSA^2Net: Multi-scale Adaptive Attention-guided Network for Medical Image Segmentation. In Proceedings of the 35th British Machine Vision Conference (BMVC 2024), Glasgow, UK, 25–28 November 2024. [Google Scholar]
  48. Chen, Z.; He, Z.; Lu, Z.-M. DEA-Net: Single image dehazing based on detail-enhanced convolution and content-guided attention. IEEE Trans. Image Process. 2024, 33, 1002–1015. [Google Scholar] [CrossRef]
  49. Zhang, Y.; Zhou, S.; Li, H. Depth Information Assisted Collaborative Mutual Promotion Network for Single Image Dehazing. In Proceedings of the IEEE/CVF Conference on Computer Vision and Pattern Recognition (CVPR), Seattle, WA, USA, 17–21 June 2024; pp. 2846–2855. [Google Scholar]
  50. Zhang, J.; Li, X.; Li, J.; Liu, L.; Xue, Z.; Zhang, B.; Jiang, Z.; Huang, T.; Wang, Y.; Wang, C. Rethinking Mobile Block for Efficient Attention-based Models. In Proceedings of the IEEE/CVF International Conference on Computer Vision (ICCV), Paris, France, 2–6 October 2023; pp. 1389–1400. [Google Scholar]
  51. Wang, X.; Wen, X.; Li, Y.; Du, C.; Zhang, D.; Sun, C.; Chen, B. A precise detection method for tomato fruit ripeness and picking points in complex environments. Horticulturae 2025, 11, 585. [Google Scholar] [CrossRef]
Figure 1. Overall architecture of DTNet.
Agriculture 16 01044 g001
Figure 2. Structure of the dual-modal fusion block (DFB).
Agriculture 16 01044 g002
Figure 3. Structure of the local enhancement module (LEM). Arrows indicate the processing flow, and different colors denote different branches or operation stages.
Agriculture 16 01044 g003
Figure 4. Qualitative comparison of different baseline models.
Agriculture 16 01044 g004
Figure 5. Training convergence curves of different baseline models.
Agriculture 16 01044 g005
Figure 6. Qualitative comparison of different methods. Blue boxes denote predicted bounding boxes.
Agriculture 16 01044 g006
Figure 7. Training convergence curves of different methods.
Agriculture 16 01044 g007
Figure 8. Prediction results on different datasets. Colored boxes denote predictions of different fruit categories.
Agriculture 16 01044 g008
Figure 9. Comparison of prediction results in complex scenarios. Colored boxes denote predictions of different fruit categories.
Agriculture 16 01044 g009
Table 1. Performance comparison of different single-modal baseline models on the grape dataset.
ModelPrecisionRecallmAP@0.5mAP@0.5:0.95ParamsFLOPs
YOLOv80.87690.80240.89540.65982,690,5986.9 G
YOLOv110.89630.80210.88100.64852,590,2306.4 G
YOLOv120.88850.78370.89570.65402,538,4866.0 G
YOLOv130.87600.78910.90310.70582,460,3016.4 G
Table 2. Performance comparison of different methods on the grape dataset.
MethodsPrecisionRecallmAP@0.5mAP@0.5:0.95ParamsFLOPs
DTNet0.91320.89310.95520.80014,141,05311.9 G
SDFMNet [45]0.90850.84250.92860.74084,038,65310.7 G
ICANet [46]0.90550.83720.92910.73106,908,44911.4 G
MSGANet [47]0.87890.83030.91800.72794,741,13813.7 G
CGANet [48]0.89530.84130.92760.72663,722,08610.4 G
MFMNet [49]0.91070.83750.92650.72232,486,5258.5 G
iRMBNet [50]0.89020.84440.92370.73284,096,50911.8 G
Table 3. Ablation study results of different module combinations and simple RGB–IR fusion baselines in DTNet on the grape multimodal object detection dataset.
No.RGB InputIR Input+YOLOv13-MidFusion (Simple Addition-Based)+DFB+LEM+ASA+Transformer-Based Head+MBDLPrecisionRecallmAP@0.5mAP@0.5:0.95ParamsFLOPs
1 0.87600.78910.90300.70582,460,3016.4 G
2 0.85310.76420.88120.68982,460,3016.4 G
3 0.88330.79110.91170.71585,168,12412.9 G
4 0.91470.85670.93180.741211,139,21722.9 G
5 0.91810.87150.94390.77593,782,64510.7 G
6 0.91690.88740.95200.79444,141,05311.9 G
7 0.91400.89070.95370.79744,141,05311.9 G
8 0.91320.89310.95520.80014,141,05311.9 G
Note: A check mark (✔) indicates that the corresponding module is included in the model configuration, while a blank cell indicates that the module is not used. The row “YOLOv13-MidFusion (simple addition-based)” denotes a simple non-adaptive RGB–IR mid-level fusion baseline without the proposed DFB.
Table 4. Performance of DTNet on different RGB-IR fruit datasets.
DatasetPrecisionRecallmAP@0.5mAP@0.5:0.95ParamsFLOPs
Grape dataset0.91320.89310.95520.80014,141,05311.9 G
Tomato dataset0.90980.88430.94630.78634,141,05311.9 G
Disclaimer/Publisher’s Note: The statements, opinions and data contained in all publications are solely those of the individual author(s) and contributor(s) and not of MDPI and/or the editor(s). MDPI and/or the editor(s) disclaim responsibility for any injury to people or property resulting from any ideas, methods, instructions or products referred to in the content.