Article

Gypsum and Tillage Practices for Combating Soil Salinity and Enhancing Crop Productivity

1
Center for Complex Systems and Microbiome Innovations, Faculty of Agricultural and Food Sciences and Environmental Management, University of Debrecen, 4032 Debrecen, Hungary
2
Department of Food Technology with Biotechnology, Faculty of Agriculture and Veterinary, University of Prishtina “Hasan Prishtina”, 10 000 Prishtina, Kosovo
3
Institute of Agrochemistry and Soil Science, Faculty of Agricultural and Food Sciences and Environmental Management, University of Debrecen, 4032 Debrecen, Hungary
4
Institute of Food Technology, Faculty of Agricultural and Food Sciences and Environmental Management, University of Debrecen, 4032 Debrecen, Hungary
*
Author to whom correspondence should be addressed.
These authors contributed equally to this work.
Agriculture 2025, 15(6), 658; https://doi.org/10.3390/agriculture15060658
Submission received: 17 February 2025 / Revised: 15 March 2025 / Accepted: 17 March 2025 / Published: 20 March 2025
(This article belongs to the Section Agricultural Soils)

Abstract

:
Soil salinity is a major global challenge, reducing fertility and crop productivity. This study evaluated the effects of various soil management practices on the physical, chemical, and microbial properties of saline soils. Six treatments, combining loosening, ploughing, disking, and gypsum amendment, were applied to solonetzic meadow soil with high sodium levels. Soil penetration resistance was measured using a Penetronik penetrometer, while chemical analyses included pH, total salt content, calcium carbonate (CaCO3), humus, and exchangeable cations (Na+, K+, Ca2+, Mg2+). Microbial composition was determined through DNA extraction and nanopore sequencing. The results showed that level A had the lowest penetration resistance (333 ± 200 N/m2), indicating better conditions for plant growth. Gypsum and loosening treatment significantly improved penetration resistance (141 N/m2, p < 0.001), while gypsum amendment enhanced chemical properties (p < 0.05, p < 0.01, and p < 0.001). Gypsum application balanced soil parameters and influenced microbial communities. Reduced tillage favored functionally important microbial genera but did not support fungal diversity (p > 0.05). These findings highlight the effectiveness of gypsum amendment and tillage practices, like loosening and disking, in mitigating salinity stress and fostering beneficial microbial communities. Combining gypsum with these tillage methods proved most effective in enhancing soil health, offering insights for sustainable soil management in saline environments.

1. Introduction

The world’s population is increasing rapidly, and by 2050, global food demand is expected to rise by around 50% [1]. This dramatic increase in demand for food underlines the pressing need to find ways to produce more food safely, sustainably, and efficiently. Soils are the foundation of global food production, providing more than 95% of the food we consume [2,3]. However, one significant challenge to meeting this growing demand is the degradation of soil quality, particularly the spread of saline soils. According to GSASmap [4], more than 424 million hectares of topsoil and 833 million hectares of subsoil are affected by salinity, making it a significant threat to agricultural productivity in many regions. Soil salinity affects over one billion hectares in more than 100 countries [5]. A recent FAO report estimates salt-affected soils cover 17 million km2 globally, with 2 million km2 suitable for saline agriculture [6,7]. Around 10.7% of the world’s land, including 10% of irrigated and rainfed cropland, is impacted by salinity. Projections indicate this could rise to 24–32% due to climate change and poor land management [5,6]. Saline soils are primarily found in North and Central Asia, Africa, and South America, with their expansion driven by factors such as poor drainage, excessive irrigation, groundwater salinity, and climate change. Rising temperatures, reduced precipitation, and increasing sea intrusion further accelerate salinization, threatening agricultural sustainability [8].
Saline soils are typically characterized by high concentrations of soluble salts, including chlorides and sulfates of calcium (Ca2+), magnesium (Mg2+), sodium (Na+), and potassium (K), along with bicarbonates (HCO3), carbonates (CO32−), and nitrates (NO3) [9]. These salts interfere with the soil’s physical and chemical properties, contributing to the degradation of soil quality [10]. Such degradation has profound implications for crop growth, as high salinity levels inhibit the ability of plants to access water and essential nutrients, resulting in stunted growth and reduced crop yields. Studies show that more than 50% of agricultural lands planted with crops are facing salinity-related issues, making salinity a widespread problem in global agriculture [11]. The effects of salinity are varied and complex. Salinity causes osmotic stress, limiting water uptake by plants, and ionic stress, leading to the accumulation of harmful ions such as sodium (Na+) and chloride (Cl), which disrupt cellular functions and metabolic processes [12,13]. These stresses can impair seed germination and interfere with the synthesis of essential biomolecules, inhibiting overall plant growth [8,9].
In addition to its detrimental effects on plant growth, soil salinity also has a significant impact on soil microbial communities [14,15]. Soil microbes play a vital role in nutrient cycling and maintaining soil health. Microbial communities are responsible for the decomposition of organic matter, nitrogen fixation, and the cycling of essential nutrients such as potassium, phosphorus, and nitrogen, which are critical for plant growth and soil fertility [14]. Salinity disrupts these microbial processes by altering the composition and activity of soil microorganisms, making it more challenging to maintain soil health and fertility. In saline soils, microbial communities adapt by favoring salt-tolerant species like Firmicutes, Bacteroidetes, and Proteobacteria, while salt-sensitive microbes decrease, resulting in a reorganization of the community structure. To cope with stress, microbial interactions intensify, but the high energy costs of osmotic adaptation lead to reduced microbial activity and lower carbon sequestration [16]. As salinity increases, this shift is further emphasized by a decline in bacterial populations and a rise in archaea, gradually transforming the microbial community from bacteria-dominated to archaea-dominated [17]. Furthermore, it is documented that soil salinity not only exerts significant pressure on prokaryotic communities, but also reduces microbial diversity, richness, and phylogenetic diversity [18]. Zhang et al. [19] found that high salinity levels can reduce microbial diversity and hinder nutrient cycling. The disruption of microbial activities by soil salinity further increases soil degradation and negatively affects soil quality [20]. Thus, maintaining a balanced microbial community is essential for ensuring long-term soil health and agricultural productivity [21]. Improving soil biodiversity and overall health involves strategies like increasing organic matter, reducing how often and how intensively the soil is tilled, and implementing crop rotation. Effective management of microbial communities, along with efforts to limit harmful pathogens, is also essential, as is embracing sustainable agricultural methods [22].
Given the significant challenges posed by soil salinity, finding effective ways to mitigate its negative impacts is crucial. One promising approach to mitigating the negative effects of salinity on soil health is the use of gypsum (CaSO4·2H2O) as a soil amendment. Gypsum is widely considered to be one of the most effective and cost-efficient amendments for saline–sodic soils [23]. It is readily available and has a high calcium content, making it particularly effective in balancing the calcium (Ca2+) and sodium (Na+) ratios in the soil. This improves soil structure, facilitates water movement, and enhances plant nutrient uptake. Gypsum has been shown to significantly improve soil conditions, making it easier for plants to access water and essential nutrients, which is particularly important in salt-affected soils [23]. Additionally, gypsum provides sulfur, an essential nutrient that aids in the production of phytohormones, amino acids, and osmo-protectants, which help plants cope with salt-induced stress [24]. Calcium, supplied by gypsum, also helps regulate the balance of potassium (K+) and sodium (Na+) within plant cells, which is crucial for plants to tolerate salinity and grow effectively under salt stress [25]. Studies have also shown that gypsum amendments can significantly boost microbial biomass and activity in saline soils, improving nutrient cycling and soil health [26]. It has been found that gypsum application not only improved soil physical properties but also increased microbial populations, particularly in the rhizosphere, where nutrient availability is critical for plant growth [25,27]. Furthermore, Bossolani et al. [28] demonstrated that gypsum treatments led to a shift in the microbial community composition, fostering the growth of beneficial microbes such as nitrogen-fixing bacteria, which are vital for maintaining soil fertility in saline conditions. Gypsum supports a unique microbial ecosystem, with higher taxonomic diversity. The presence of gypsum also appears to enhance microbial activity influencing soil structure and nutrient availability [29]. These findings suggest that gypsum amendments may not only mitigate the negative impacts of salinity on microbial communities but also promote long-term soil sustainability through enhanced microbial processes [26,30]. As salinization continues to affect agricultural soils globally, the role of gypsum in supporting microbial communities becomes increasingly important in managing soil health and fertility [31]. Soil salinity management globally involves several key approaches, including physical, chemical, and biological methods. Physical methods encompass techniques such as scraping, ploughing, subsoiling, leveling, and mulching, which help to improve soil structure and facilitate salt leaching. Chemical methods, besides the application of amendments like gypsum, involve NPK fertilizers and other essential nutrients as well, which help to reduce the salt concentration and enhance soil fertility. Biological methods include phytoremediation, where plants are used to absorb or accumulate salts, and microbial remediation, which utilizes specific soil microorganisms to break down or transform salts and other contaminants, improving soil health and crop productivity [9]. All of these methods are effective in managing soil salinity; however, none of them is universally applicable across all regions due to variations in local soil conditions, climate, and agricultural practices. There remains a significant gap in research when it comes to combining physical and chemical methods in a way that reflects the real-world practices of farmers, who typically use both tillage and chemical treatments simultaneously. Integrating these methods more effectively could provide a more holistic and practical approach to soil salinity management, tailored to the specific needs of different farming systems.
There is still limited research on the combined impact of tillage practices and gypsum application on soil microbial communities, in saline areas. Soil microorganisms are crucial for nutrient cycling, soil health, and maintaining a stable ecosystem, but the effects of different soil management practices, such as gypsum amendments and tillage methods, on these microbial communities have not been extensively studied. Tillage methods, such as conventional tillage and reduced tillage, can alter soil structure, water infiltration, and microbial activity, influencing the composition of soil microbial communities [32]. Reduced tillage is often associated with improved soil health and microbial diversity, while conventional tillage can disrupt soil structure and negatively affect microbial populations [33,34]. Understanding how these different tillage practices, combined with gypsum amendments, influence microbial communities in saline soils is critical for optimizing soil management strategies. The primary objectives of this study are to evaluate the impact of different tillage methods and gypsum applications on the physico-chemical properties of saline soils, and to assess how these treatments influence soil microbial communities. By examining these factors at varying soil depths, this research aims to better understand how tillage practices and gypsum amendments can improve soil health and productivity. Specifically, this study will focus on soil microbial diversity, identify key community members that are more prevalent under different treatments, and analyze the methods that favor the presence of microbial members that have functional activities important for soil health. The results will provide valuable insights into sustainable soil management strategies that not only enhance soil quality but also increase crop yields and ensure the long-term sustainability of agricultural systems in saline-affected regions.

2. Materials and Methods

2.1. Experimental Design and Soil Characteristics

An experiment was conducted near Besenyőtelek, Hungary (47°40′20.1″ N, 20°25′06.8″ E), using six treatments applied to six 4 m × 4.5 m plots, with each treatment replicated three times. These treatments consisted of combinations of gypsum amendment and various tillage methods: M1 (soil ploughing and soil loosening), M2 (gypsum and soil loosening combined with soil ploughing), M3 (gypsum and soil loosening), M4 (soil loosening only), M5 (gypsum and soil disking), and M6 (control or soil disking) (Figure 1).
The selection of tillage methods was driven by their ability to address key factors such as soil compaction, structure, and fertility. Conventional tillage, such as ploughing (up to 35 cm depth [35]), was included for its effectiveness in breaking up compacted layers and incorporating organic matter, particularly in heavy clay soils. In contrast, reduced tillage methods, such as loosening (up to 40 cm depth [36]) and disking (up to 20 cm depth [36]), were chosen for their ability to improve soil aeration and root penetration while minimizing soil disturbance. Disking was selected as the control treatment due to its widespread use in the region for seedbed preparation and crop residue management [36]. It was chosen over the no-till option because it is a commonly applied tillage method that more accurately reflects typical soil conditions. The combination of these tillage methods, alongside gypsum amendment, was designed to evaluate their synergistic effects on both soil physical and chemical properties.
A total of 18 soil samples were collected from three different soil depths: A (0–35 cm), B (36–60 cm), and C (>60 cm depth). For each soil depth, six samples were collected, with three samples representing each of the treatments (M1–M6). The soil samples were analyzed for various physical and chemical properties, as well as the effects of the different treatment combinations. The details of these combinations are provided in the figure captions, where we describe gypsum-included treatments (M2, M3, M5) and non-gypsum treatments (M1, M4, M6), as well as the classification of conventional tillage (M1 and M2) and reduced tillage (M3, M4, M5, M6). For microbial analysis, 12 soil samples were collected from levels A and B (6 samples from each depth) to assess the microbial communities under the different treatments. The choice of not sampling level C for microbial analysis was based on the very low DNA concentrations detected at this depth, as further explained in the Section 3.1.
The experimental soil was classified as solonetzic meadow soil, characterized by sodium accumulation and high alkalinity, which influences its physical and chemical properties. These conditions typically affect soil structure, water infiltration, and nutrient availability [21]. The measured parameters, presented in Table 1, indicate variations in pH, exchangeable cations, and organic matter content across the different soil levels. According to international soil classification guidelines, optimal soil conditions for most crops include neutral to slightly acidic pH levels (6.0–7.5) and well-balanced exchangeable cations to support proper nutrient uptake [37,38]. In contrast, the observed pH values at the deeper levels exceeded this range, which can reduce phosphorus and micronutrient availability [39,40]. Additionally, the high exchangeable sodium content may impact soil structure and permeability. To address these conditions, gypsum was applied as a soil amendment to improve soil properties and mitigate potential constraints to crop growth.

2.2. Determination of Gypsum Amendment

The amount of gypsum amendment was calculated based on the exchangeable sodium ion content using Equation (1) [41].
x t / h a = N a k × M × δ × E 10
where Na(k) represents the exchangeable sodium ions [mgeq/100 g], M is the thickness of the soil layer to be treated [m], δ is the bulk density of the soil [g/cm3], and E is the equivalent value of the soil amendment.
The required value was determined as the weighted average of the exchangeable sodium ion content and bulk density data from the A and B soil horizons. Considering 5% contamination, the required amendment quantity was calculated to be 23.55 t/ha, or 42.39 kg per plot, as calculated in Equation (2).
x t / h a = 3.22 × 0.6 × 1.416 × 86.1 10 = 23.55 t / h a

2.3. Soil Sampling

Soil samples were collected from drilled soil profiles. Sampling was performed according to the specific soil conditions of the treatments, using clean tools and rubber gloves throughout the process. For each plot, three drillings were conducted, and separate samples were taken from each soil level (A, B, C). These samples were homogenized before physical and chemical analyses were conducted. For microbiological measurements, samples were only taken from the upper two soil levels (A and B). Collected soil samples were labeled, transported in coolers, and stored frozen to preserve their integrity.

2.4. Physical and Chemical Analyses

Soil resistance was measured using a Penetronik penetrometer (CREON HEROES Inc, Pápa, Hungary) set to clay mode. Plasticity was determined by adding water to 50 g of air-dried soil in a porcelain mortar until it formed drooping peaks, following the procedure of Filep [41]. For pH determination, 5 g of soil was mixed with 12.5 cm3 of distilled water and 1 mL KCl solution, and the pH was measured after 12 h, as described by Csubák [42]. Total salt content was determined by preparing a slurry at the moisture content corresponding to the Arany plasticity index and measured using a conductivity meter (model 105, Thermo Scientific™, Orion Research Inc, Franklin, MA, USA) [43]. Sodium carbonate content was assessed via titration, mixing 20 g of soil with 200 cm3 of distilled water and 1 cm3 of 1% phenolphthalein indicator. The suspension was titrated with 0.1 m HCl until the faint red color disappeared. During titration, 1 cm3 of 0.1 m HCl corresponded to 0.0106 g (~10 mg) of sodium carbonate. The sodium content in the 20 g soil sample was then calculated using Equation (3) [41].
N a 2 C O 3 % = m L   H C l × 0.0106 20 × 100
Total carbonate content (as CaCO3) was measured using a Scheiber calcimeter (Gabbrielli Technology, Calenzano (FI) Italy) [44]. Humus content was determined by treating 0.5 g of air-dried soil with 10 cm3 of 5% K2Cr2O7 solution and 20 cm3 of concentrated H2SO4. After cooling, the mixture was diluted with distilled water and left overnight. The supernatant was decanted, and color intensity was measured photometrically at 550 nm using a spectophotometer (Model PU 8610 UV/VIS, Pye Unicam, Cambridge, GB) [45]. Exchangeable cations (K+, Na+, Ca2+, Mg2+) were determined using the Mehlich method, with a BaCl2 solution adjusted to pH 8.1 to minimize carbonate interference. Cation concentrations were measured via Varian SpectrAA 5 Atomic Absorption Spectrometer (Varian Inc., Palo Alto, CA, USA) [46].

2.5. Soil Microbiome Analysis

2.5.1. Mechanical Cell Disruption

From the homogenized soil sample, 0.25 g was transferred to a lysis tube (PowerBead, Qiagen, Hilden, Germany). To this, 800 μL of CD1 buffer (Qiagen, Hilden, Germany) was added, followed by vortexing. Mechanical cell disruption was performed using the MagNA Lyser instrument (Roche Applied Sciences, Penzberg, Germany) at 4000 rpm for 30 s. The samples were incubated at 4 °C for 2 min and subjected to the same MagNA Lyser procedure again. Subsequently, the samples were incubated at 60 °C for 10 min (Dry Block Thermostat, Bio TDB-100, Biosan, Latvia). DNA was pelleted by centrifuging the samples at 16,000× g for 1 min at room temperature. The supernatant (500–600 μL) was carefully transferred to new microcentrifuge tubes (Qiagen GmbH, Hilden, Germany) without disturbing the pellet.

2.5.2. DNA Extraction

DNA extraction was carried out using the Qiagen DNeasy Power Soil Pro Kit (Cat. No. 47014, Qiagen, Hilden, Germany). First, 200 μL of CD2 solution was added to 500–600 μL of supernatant, vortexed for 3 s, and centrifuged at 15,000× g for 1 min. The supernatant (700 μL) was transferred to a new tube, and 600 μL of CD3 solution was added and vortexed for 3 s. The lysate (650 μL) was applied to a QIAamp Mini Spin Column and centrifuged at 15,000× g for 1 min; the filtrate was discarded. This step was repeated with the remaining lysate. During the washing phase, 500 μL EA solution was added to the column, followed by centrifugation for 1 min. Then, 500 μL of C5 solution was added, and another centrifugation step was performed. Afterward, 500 μL of 96–100% ethanol was added and centrifuged, and the eluate was discarded. The column was dried, and 70 μL of C6 buffer was added, incubated for 3 min, and centrifuged to elute the purified DNA. The extracted DNA was stored at −20 °C. DNA quality was assessed using a NanoDrop™ 2000 Spectrophotometerphotometer (Thermo Scientific™, Franklin, MA, USA), and the concentration was measured with a Qubit™ 4 Fluorometer (Invitrogen™, Waltham, MA, USA).

2.5.3. Sequencing Library Preparation (16S and ITS Regions)

For nanopore sequencing library preparation, we followed the Oxford Nanopore Ligation Sequencing V14-PCR Barcoding protocol (SQK-LSK114 with EXP-PBC001, Version: PBC_9182_v114_revK_07Mar2023, last updated on 21 August 2024). Amplicon PCR was carried out using primers specific to the target loci, which were designed to incorporate nanopore-specific adapters. To amplify the full-length 16S rDNA region (~1500 bp), primers V1V9F (5′-tttctgttggtgctgatattgcAGAGTTTGATCCTGGCTCAG-3′) and V1V9R (5′-acttgcctgtcgctctatcttcGNTACCTTGTTACGACTT-3′) were used. For the ITS region (~800 bp), the primers ITS9F (5′-tttctgttggtgctgatattgcTACACACCGCCCGTCG-3′) and ITS4R (5′-acttgcctgtcgctctatcttcCCTSCSCTTANTDATATGC-3′) were applied.
The reaction mixture for PCR included 12.5 µL of LongAmp Hot Start Taq 2X Master Mix (NEB), 1 µL of each primer (5 µM), and the appropriate template DNA. For the 16S amplicon PCR, 20 ng of template DNA was used, whereas the ITS amplicon PCR required 20 ng. The thermal cycling conditions for the 16S region started with an initial denaturation at 95 °C for 3 min, followed by 25 cycles of 95 °C for 20 s, 55 °C for 30 s, and 72 °C for 120 s. A final extension at 72 °C for 5 min completed the process, with samples held at 4 °C afterward. Similarly, the ITS PCR followed the same protocol, except the extension time in each cycle was set to 90 s.
Amplicon products were quantified using the Qubit™ dsDNA HS Quantitation Assay Kit (Thermo Scientific™, Franklin, MA, USA), and library preparation was performed following the manufacturer’s guidelines. Each sample was assigned a unique barcode (BC1–BC12), and the libraries were adjusted to a final concentration of 100 fmol. Sequencing was conducted using the MinION MK1C sequencer (Model No MN-101C, Oxford Nanopore Technologies, Oxford, UK) equipped with R10.4.1 flow cells. During the sequencing run, Guppy continuously improved base calling. Base call accuracy improved as more data were accumulated. As the sequencing run continued, Guppy refined base calling and adjusted for errors [47]. Input files were concatenated, and per-read stats were generated with the Fastcat program [48]. For quality control, MinIONQC was performed [49].
Following an 8 h sequencing run for the 16S library, the flow cell was cleaned using the Wash Kit (EXP-WSH004) before loading the ITS library. The sequencing workflow was managed using MinKNOW software (version 23.07.12) with real-time base calling enabled, utilizing the Ligation Sequencing Kit V14 (SQK-LSK114) and selecting the PCR Barcoding Expansion (EXP-PBC001).
Taxonomic alignment was performed using Epi2me Agent software with the wf-metagenomics (v2.11.0) workflow. The Kraken2 classifier (version 2.1.3) was employed with a minimum identity threshold of 90%, and the analysis was conducted using the ncbi_16S_18S_ITS database. This approach enabled precise taxonomic classification and a thorough evaluation of microbial communities.

2.6. Statistical Data Analysis

Sequencing data were filtered and transformed using the dplyr package in R. Alpha diversity metrics, including the Chao-1 and Shannon indices, were calculated using the phyloseq v.1.44 package [49,50]. Statistical analysis for alpha diversity was conducted using the Kruskal–Wallis test due to the non-normal distribution of the data. Graphs (box plots, line plots, bar plots, area plots, polar plots, volcano plots) were created with the ggplot2 R package (v3.5.0) [51,52]. Heatmaps were generated using the pheatmap R package (v1.0.12) [53], and taxonomic heat trees were constructed with the Metacoder R package [54]. Statistical differences were assessed using the Wilcoxon rank-sum test, as the data did not follow a normal distribution according to the Shapiro–Wilk test. All tests were two-tailed, and statistical significance was set at p < 0.05. No corrections for multiple comparisons were applied to retain potentially valuable findings and allow for independent interpretation from different perspectives, while acknowledging this as a methodological choice that comes with certain limitations in statistical inference.

3. Results

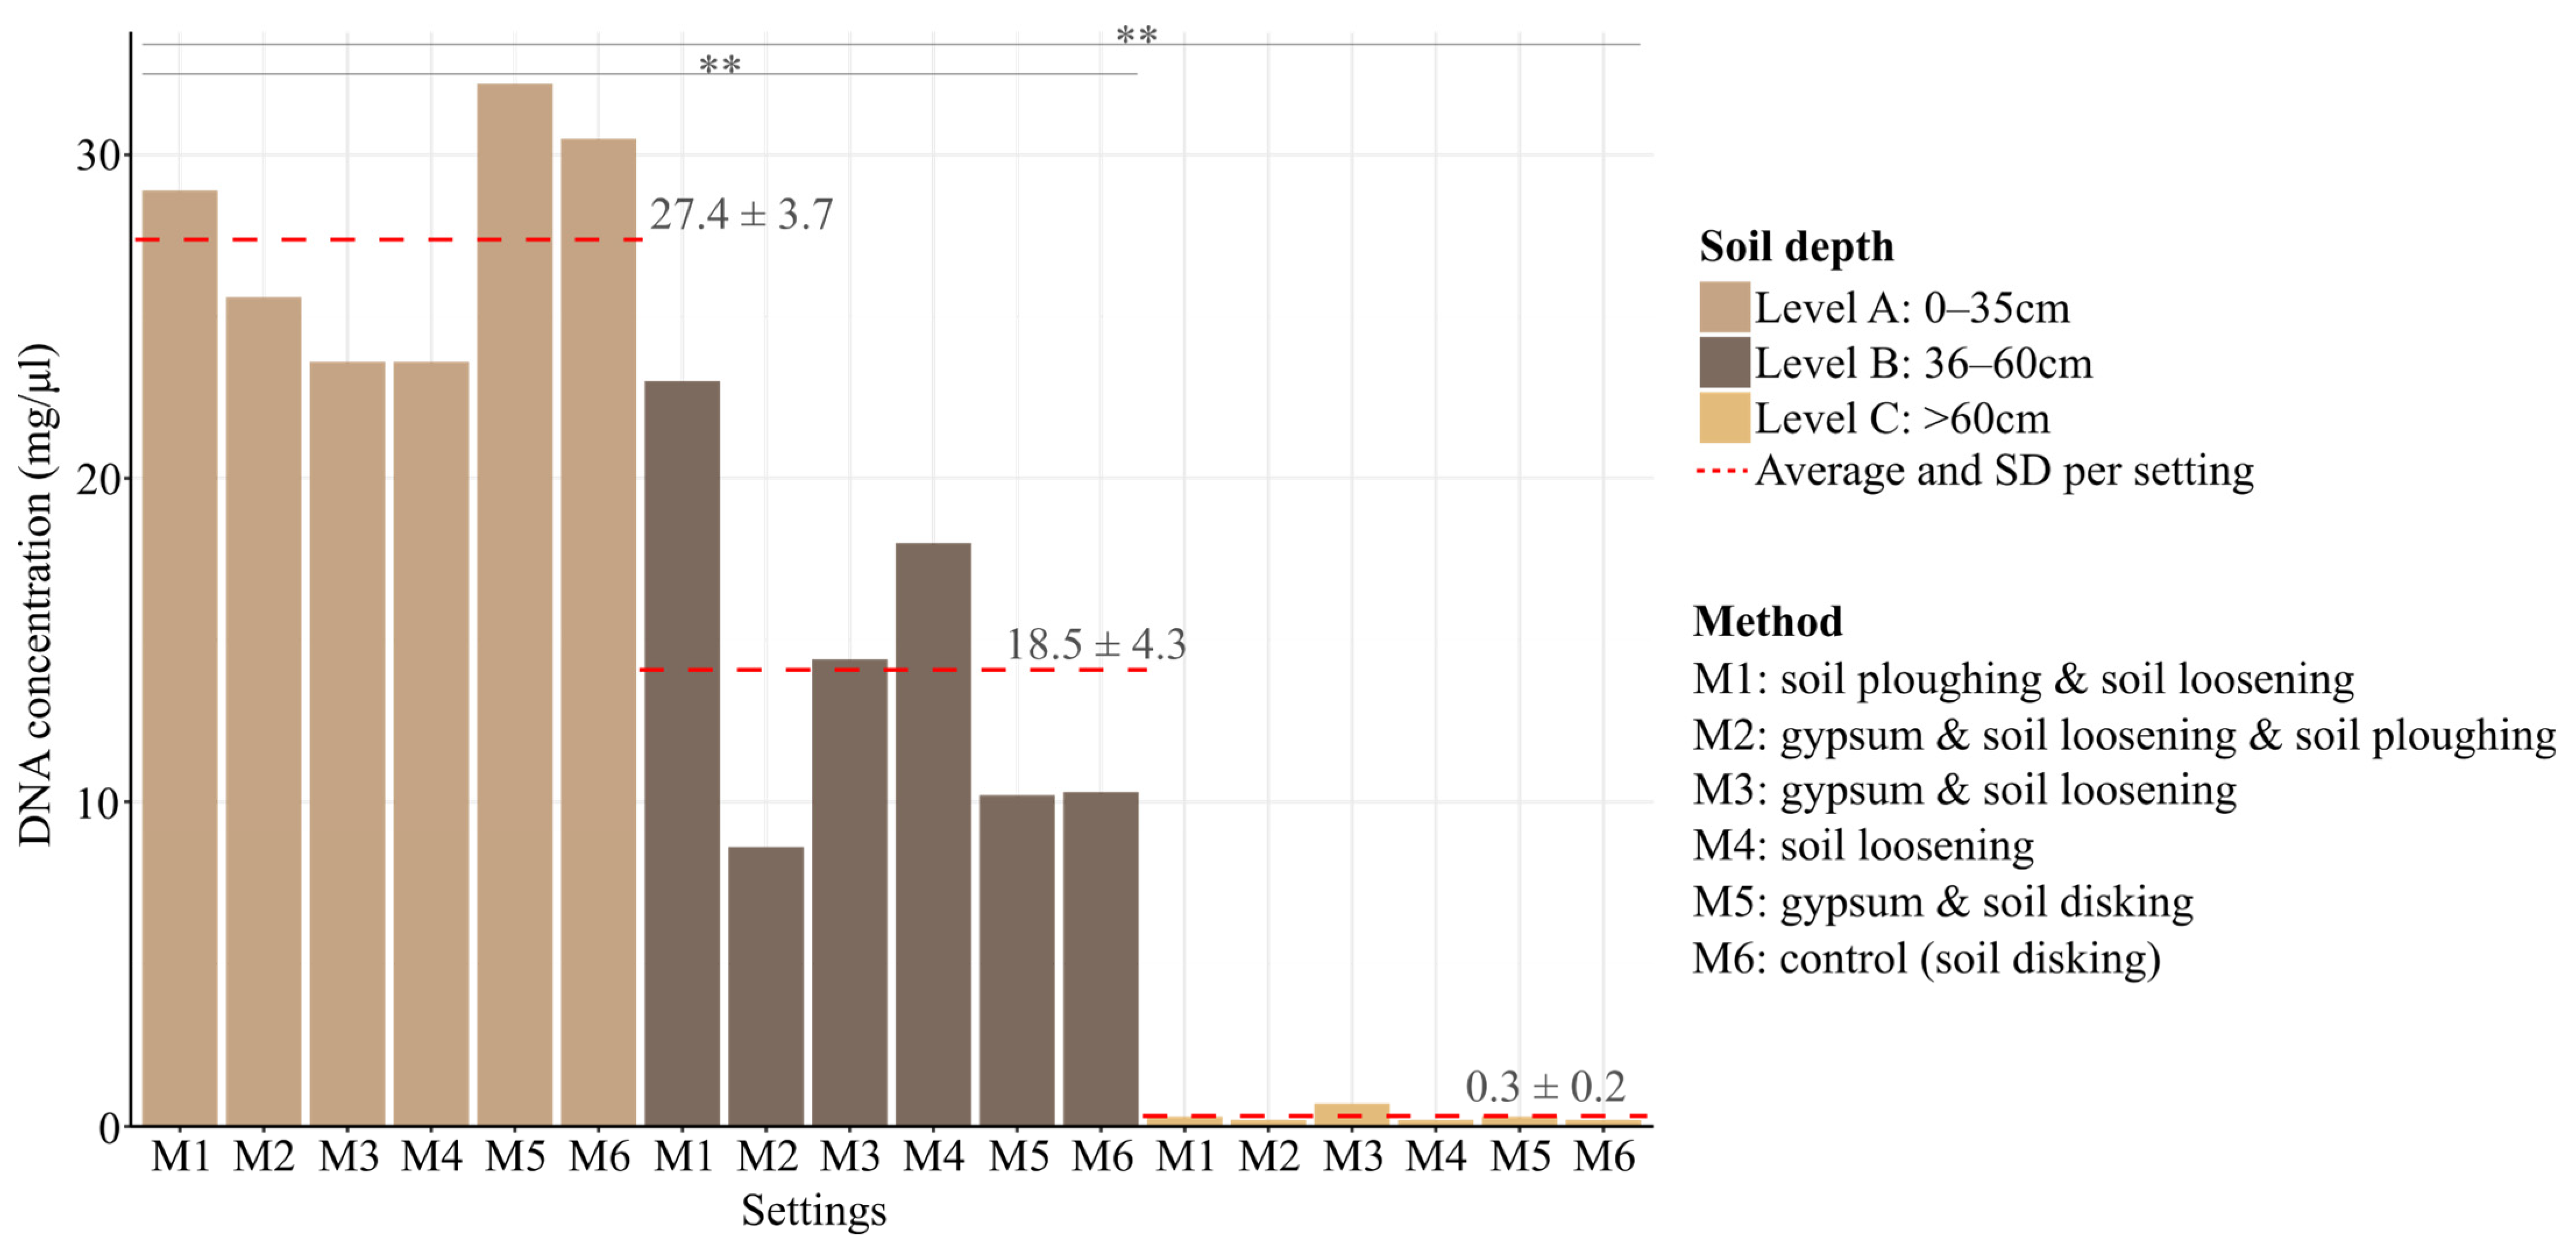
3.1. Soil DNA Extraction

Obtaining the right quality and quantity of DNA is crucial for successfully performing various molecular techniques, such as PCR-based assays and library creation. The results indicated that the highest DNA concentration was extracted from soil level A (27.4 ± 3.7 mg/µL), while concentrations gradually decreased at soil levels B (14.08 ± 3.7 mg/µL) and C (0.32 ± 0.2 mg/µL), as shown in Figure 2. This trend suggests that microbial abundance is highest in the uppermost soil layers, where organic matter and nutrient availability are greater, supporting microbial growth and activity [14,15]. In contrast, DNA extraction from deeper soil levels (B and C) yielded substantially lower concentrations, with level C showing the lowest results. The extremely low DNA concentration at level C was insufficient to meet the critical threshold for successful PCR amplification (16S and ITS: 20 ng), likely due to the harsher environmental conditions in deeper soils. Factors such as reduced organic matter content, lower microbial biomass, and the presence of potential inhibitory compounds can hinder DNA extraction efficiency [54,55,56]. Additionally, compaction and limited aeration at deeper depths may further restrict microbial colonization, leading to lower microbial DNA availability [57]. To quantify these observations, statistical analysis revealed significant differences in DNA concentrations across different soil depths (p < 0.01), particularly between levels A and B, as well as A and C. DNA concentrations at soil level A were significantly higher than at subsurface levels B (p = 0.0049) and C (p = 0.0046).
Due to these constraints, sequencing studies based on the MinION platform were only performed on soil samples from levels A and B, where DNA concentrations were sufficient for further molecular analyses. This selective approach ensured the generation of high-quality sequencing data and minimized potential biases associated with low-template amplification.

3.2. Sequencing Results

The 16S sequencing run of the MinION produced 1,770,000 reads. Of the total reads, 1,248,244 (70.55%) passed the quality qscore of 8 as determined by MinKNOW (version 23.07.12), with a mean qscore of 9.7. The pass reads corresponded to approximately 104,020 reads per sample. In the taxonomic alignment, the majority of barcoded reads (1,245,630) were correctly aligned to the reference (ncbi_16S_18S_ITS) with 99.79% accuracy using the Kraken2 classifier. Metrics of the 16S run are detailed in Table 2.
The ITS sequencing run performed with the MinION yielded a total of 2,140,000 reads. Of these, 1,612,448 reads (75.34%) met the quality threshold of a qscore of 9, as determined by MinKNOW (version 23.07.12), with an average qscore of 13.3. This represents approximately 134,371 reads per sample. During taxonomic classification, the majority of the barcoded reads (1,575,532) were accurately aligned to the reference database (ncbi_16S_18S_ITS) with an alignment accuracy of 97.71% using the Kraken2 classifier. Details of the ITS sequencing run metrics are presented in Table 3.

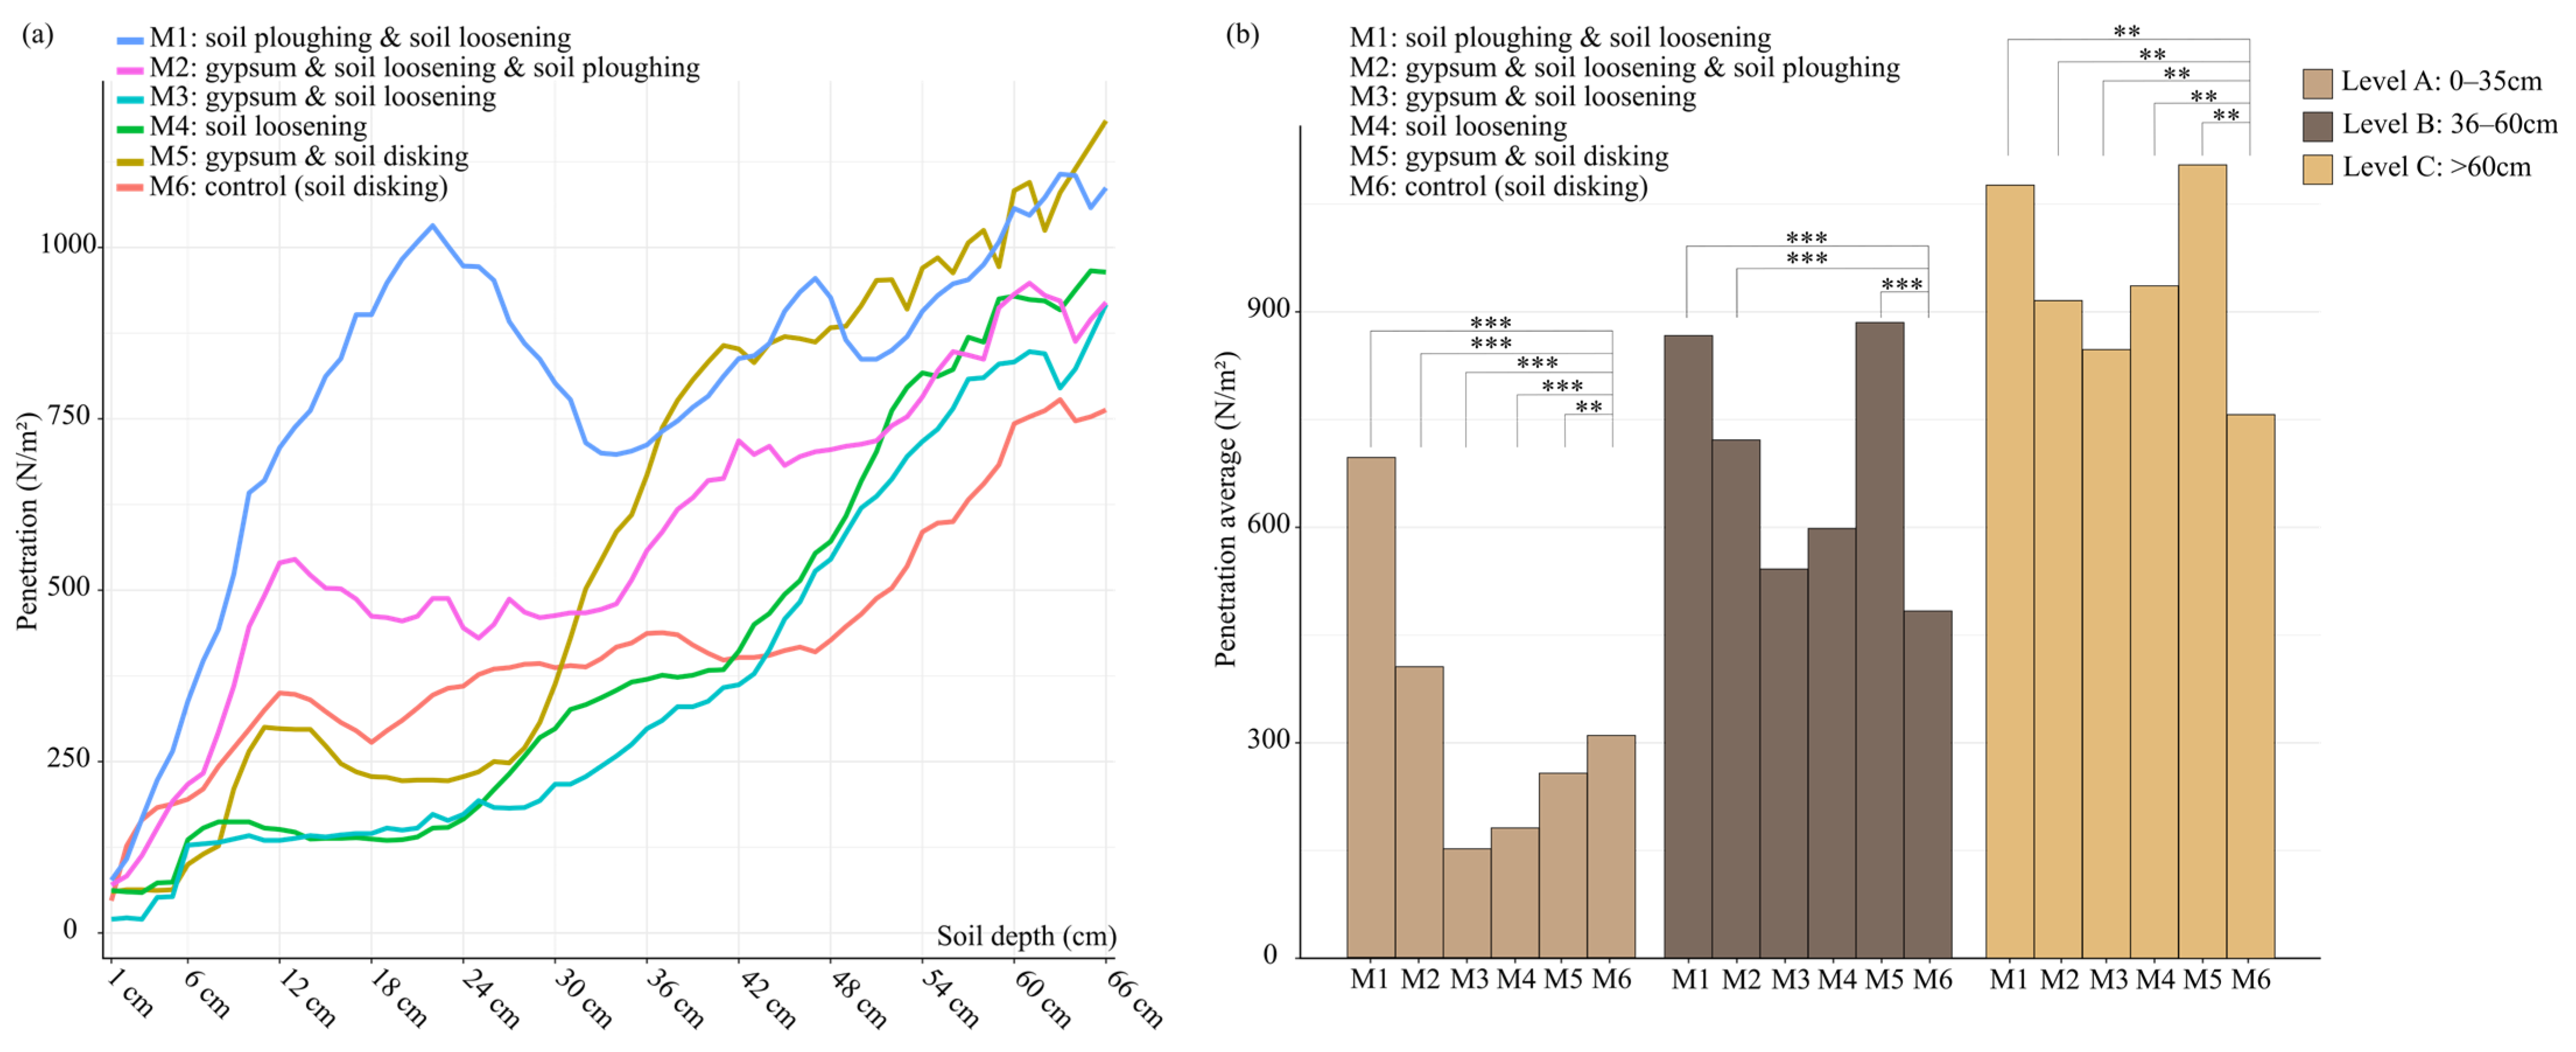
3.3. Physical Parameter of Soil

Soil penetration resistance is a key physical parameter that influences plant growth and microbial activity. Our results showed that soil level A exhibited significantly lower penetration resistance compared to levels B and C (level A penetration: 333 ± 200 N/m2; vs. level B: 683 ± 169 N/m2 p = 0.015; vs. level C: 939 ± 133 N/m2, p = 0.0022), meaning it was the least compacted and most conducive to plant growth (Figure 3b). This was followed by the medium soil level (B), while the deepest soil level (C) showed the highest penetration resistance, indicating more compacted conditions.
Significant differences in soil penetration values were observed among all treatments applied when comparing with the control treatment (p < 0.05). Statistical analysis revealed that different tillage methods had a notable impact on soil compaction or soil penetration resistance (Figure 3a). Focusing on soil level A, which is the best for plant and microbial growth, the combination of loosening and gypsum treatment (M3) resulted in the best outcomes, with significant differences from the control (p < 0.001). This combination helped in the reduction in compaction and improvement in soil structure, creating better conditions for plant growth. On the other hand, the ploughing method combined with loosening (M1) showed the worst results, leading to the highest soil compaction (p < 0.001).

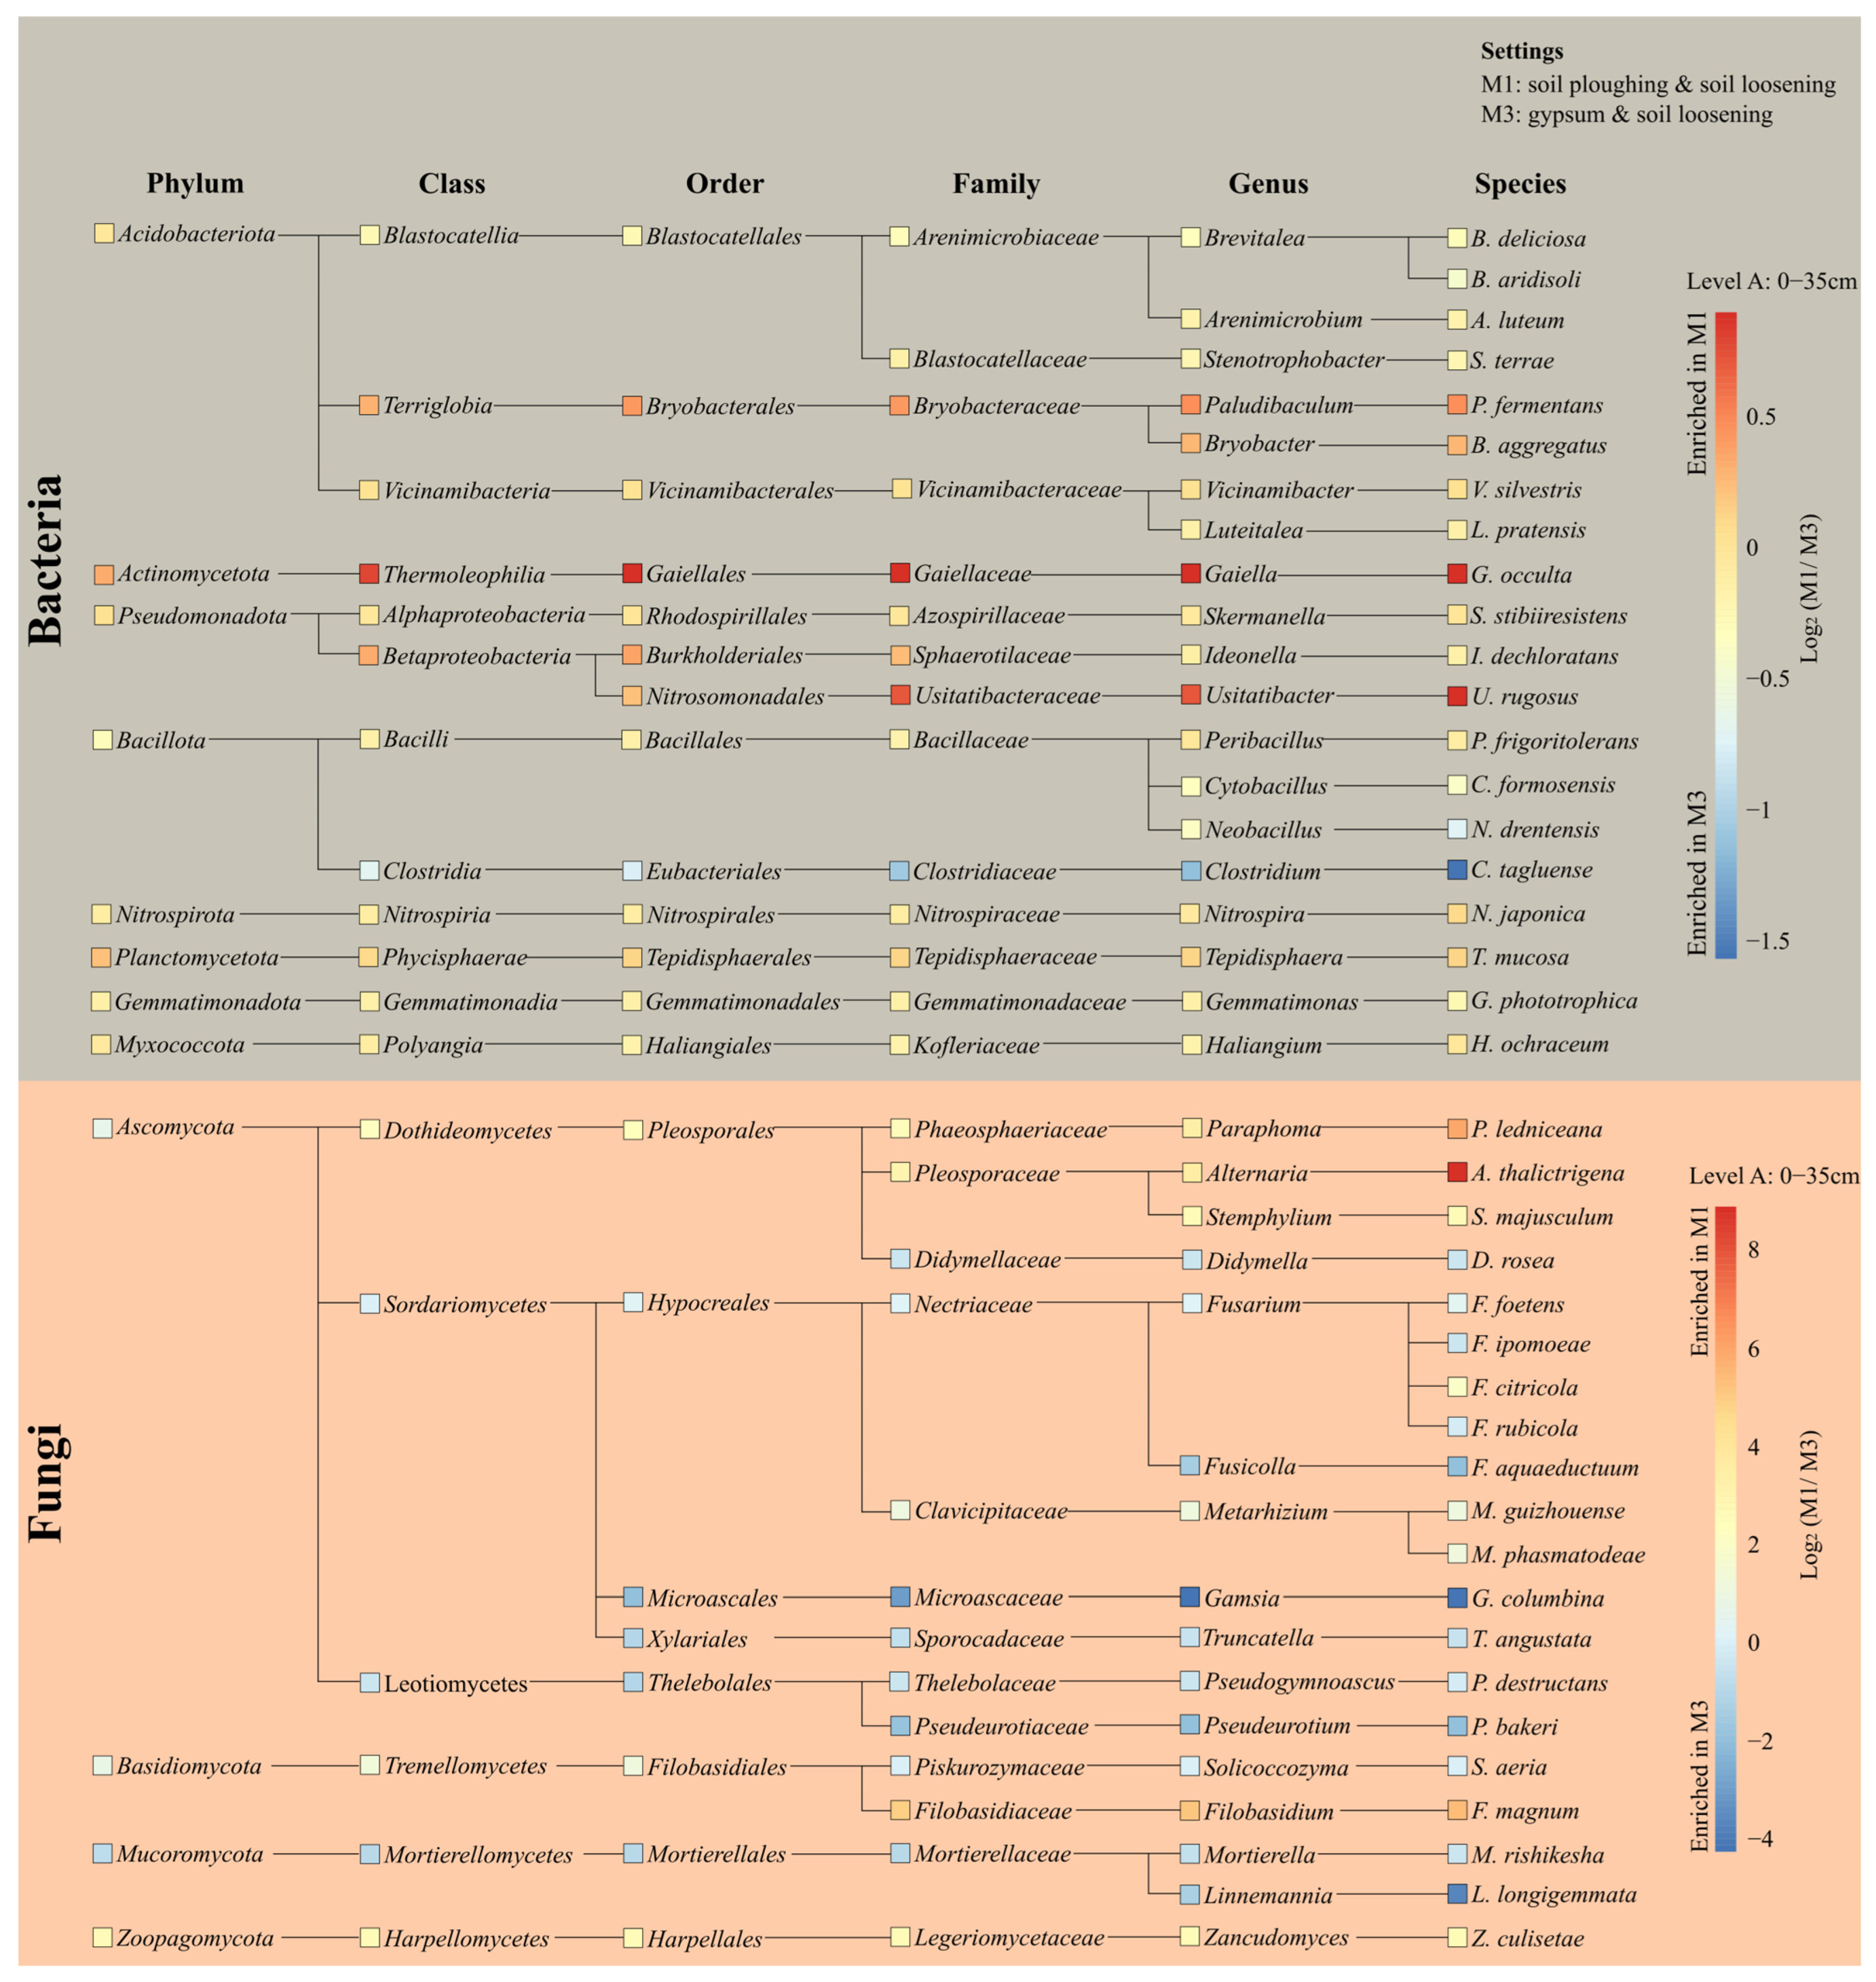
3.4. Microbial Community at Soil Level A

To gain a deeper understanding of how the M1 and M3 methods influence the soil microbiome at level A, we performed a detailed analysis across different taxonomic levels. The results indicated that bacterial communities thrived more under M1, whereas M3 favored specific fungal taxa (Figure 4).
In the bacterial group, taxa predominantly enriched in M1 included Paludibaculum (log2FC = 0.467), known for its role in organic matter decomposition [58], with P. fermentans (log2FC = 0.467) as a representative species. Additionally, Gaiella (log2FC = 0.904), which inhibits the growth of pathogenic fungi [59], was significantly enriched, particularly G. occulta (log2FC = 0.904). Usitatibacter (log2FC = 0.721) also exhibited higher abundance, with U. rugosus (log2FC = 0.901) being a notable species. Conversely, taxa enriched in M3 samples included Clostridium (log2FC = −1.130), which plays a crucial role in nitrogen preservation [60], particularly C. tagluense (log2FC = −1.562).
For fungi, M1 favored Alternaria thalictrigena (log2FC = 8.169), a species from the Alternaria genus known for its pathogenic traits [61], and Filobasidium (log2FC = 4.390), particularly F. magnum (log2FC = 4.685), known for its contribution to lipid biotransformation [62], thrived under M1. In contrast, M3 supported Gamsia (log2FC = −4.891), with G. columbina (log2FC = −4.902) being most affected. Similarly, Pseudeurotium (log2FC = −2.615), known for its role in biodegradation [63], exhibited higher prevalence under M3, with P. bakeri (log2FC = −2.586) as a representative species. Additionally, Linnemannia (log2FC = −1.915), which contributes to plant growth promotion [64], was more abundant under M3, particularly L. longigemmata (log2FC = −4.338).

3.5. Examination of Genera Associated with Beneficial Functions for Soil Health

We also analyzed the impact of these specific soil treatments on the functional activities of microorganisms in the soil, which are crucial for various soil health processes, including nutrient cycling, bioremediation, and pathogen suppression. As shown in Figure 5, reduced tillage was also more effective in enhancing beneficial microbial genera, leading to a higher abundance of all functional microbial groups compared to conventional tillage. In contrast, conventional tillage did not yield the same benefits, with microbial functional activity remaining lower. Additionally, both soil level and gypsum application played significant roles in shaping the abundance and functional activity of distinct microbial communities. Soil level A showed the highest abundance of genera associated with bioremediation functions. This indicates a strong relationship with the promotion of microbial communities involved in environmental contaminant breakdown. Similarly, functional groups responsible for cellulose degradation, which play a crucial role in breaking down organic matter, and also plant growth-promoting genera were found to be more abundant at soil level A. On the other hand, soil level B also showed a rich community of functional genera. Those associated with siderophore production, antibiotic production, and antimicrobial agent synthesis were more prevalent at this deeper soil level. In contrast, genera involved in nutrient mobilization exhibited a consistent distribution across both soil depths. While soil depth was a key factor in distinguishing the presence of specific genera, the gypsum amendment proved to be effective across nearly all genera.

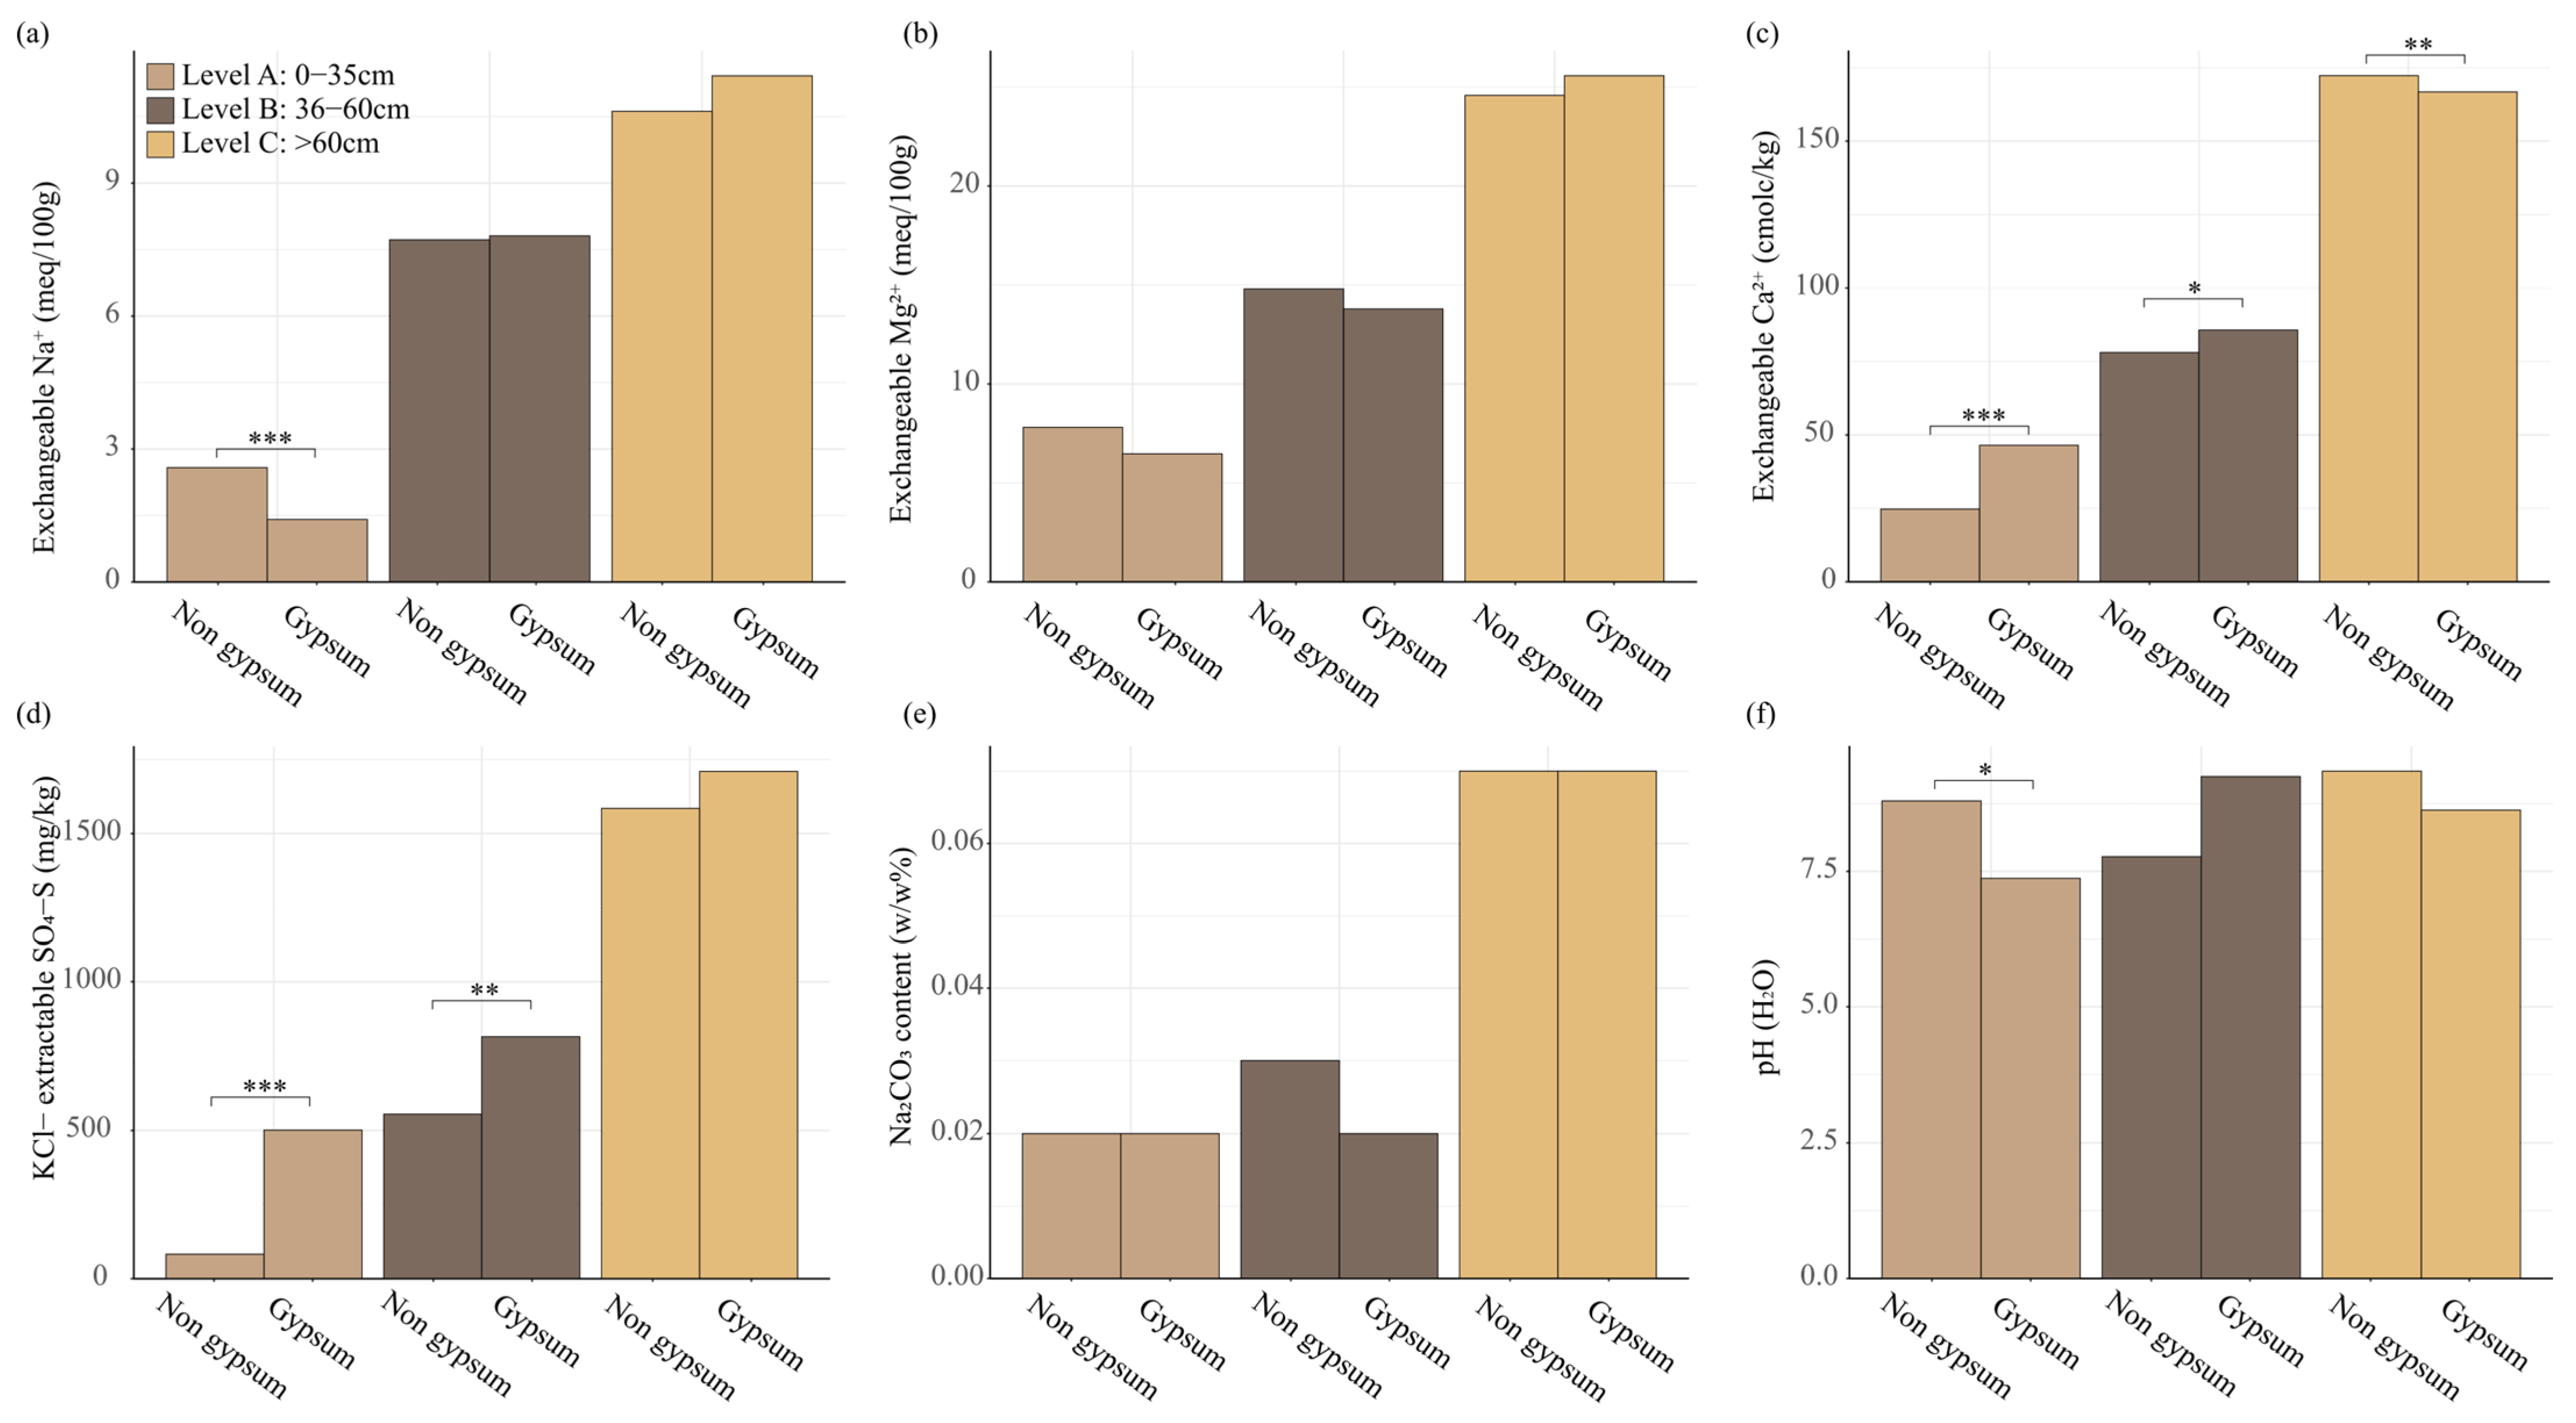
3.6. Chemical Parameters of Soil

The chemical parameters of the soil and the effect of gypsum application were also analyzed. The results showed that gypsum amendment had a significant positive impact on soil chemical properties, particularly nutrient balance (Figure 6). Its application reduced exchangeable sodium (Na+) levels (p < 0.001), especially at soil level A, by displacing sodium ions with calcium (Ca2+) ions due to gypsum’s high calcium content, increasing the soil’s calcium levels. So, this process not only decreased sodium concentrations but also increased exchangeable calcium levels (p < 0.001 for level A, p < 0.05 for level B, p > 0.05 for level C), enhancing soil structure and fertility. Additionally, gypsum raised potassium chloride (KCl) levels, an essential nutrient for plant growth, aiding processes like photosynthesis and water regulation (p < 0.001 for level A, p < 0.001 for level B). It also helped lower the soil pH (p < 0.05 for level A), which is especially beneficial for alkaline soils, where high pH can hinder nutrient availability. The greatest changes were recorded at soil level A, and the smallest at soil level C, which may be attributed to the short-term effect of gypsum, which can be more effective in the upper parts of soil. As shown in Figure 6, soil level C contained the highest concentration of all plant nutrients, followed by level B, while level A had the lowest nutrient levels. This can be attributed to the salinity of the soil, which can be responsible for this nutrient accumulation at deeper levels of soil.

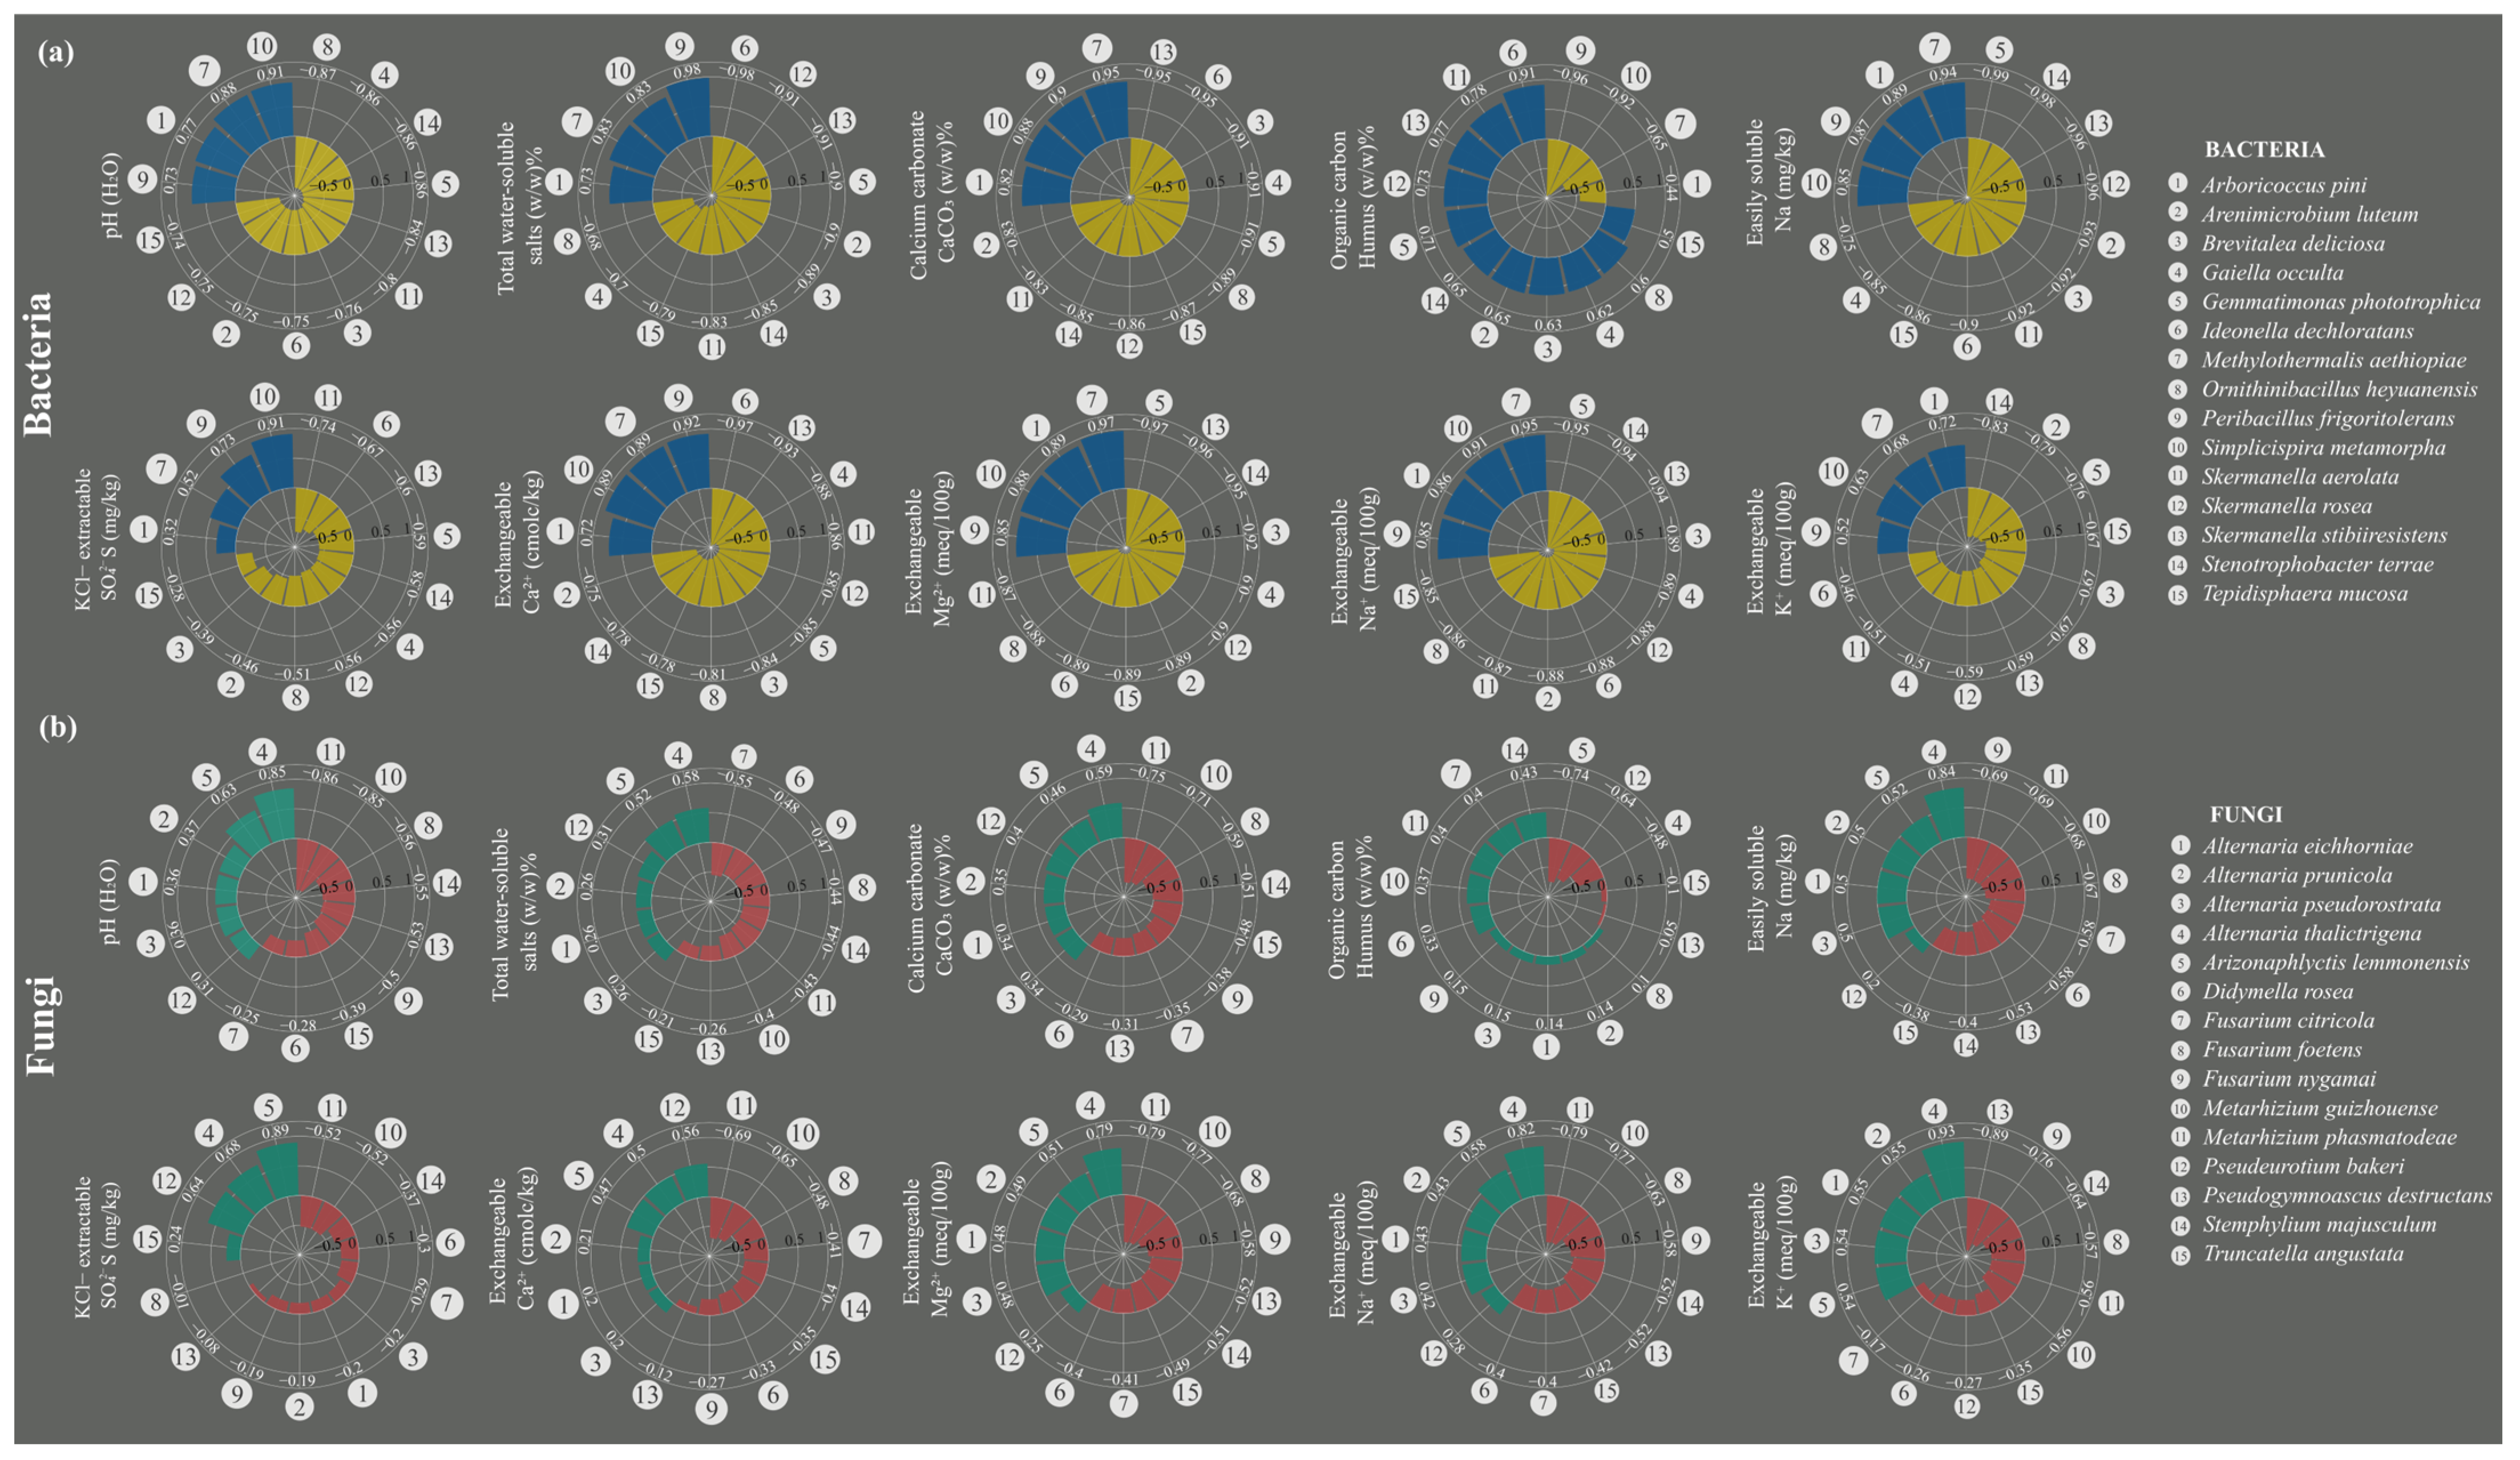
3.7. Species Exhibiting Strong Correlations with Changes in Soil Chemistry

Changes in the chemical parameters of soil are absolutely influential for its ‘inhabitants’. Analyses exploring the correlations between the soil microbiome (bacteria and fungi) and soil chemical parameters under gypsum treatment are presented in Figure 7. Generally, there were more correlations for bacteria and less for fungi for all chemical parameters. The correlation analysis highlighted notable trends among bacterial species and soil parameters. Gaiella occulta showed strong negative correlations with soluble salts (R = −0.70) and CaCO3 (R = −0.91), indicating it thrives in low-salinity and low-calcium environments. Ideonella dechloratans was also negatively correlated with soluble salts (R = −0.98) and CaCO3 (R = −0.95) but positively associated with humus (R = 0.91), suggesting a preference for organic-rich soils. On the other hand, Peribacillus frigoritolerans had strong positive correlations with soluble salts (R = 0.99), CaCO3 (R = 0.896), and exchangeable Ca2+ (R = 0.92), indicating adaptability to saline and calcareous conditions. Methylothermalis aethiopiae also correlated positively with CaCO3 (R = 0.95) and exchangeable Na+ (R = 0.95), hinting at salt tolerance. A striking trend was seen with Gemmatimonas phototrophica, which exhibited negative correlations across nearly all parameters, including pH (R = −0.86), easily soluble Na+ (R = −0.99), and exchangeable Ca2+ (R = −0.85), suggesting sensitivity to high-salinity and alkaline conditions. In contrast, Arboricoccus pini had positive correlations with pH (R = 0.77) and exchangeable Na+ (R = 0.86), indicating a different ecological adaptation.
Also, the analysis of fungal species revealed distinct correlations with various chemical parameters, with some showing strong positive and negative relationships. Alternaria thalictrigena exhibited the highest positive correlation with exchangeable K+ (R = 0.93), and also showed a significant positive correlation with pH (R = 0.85). In contrast, Metarhizium phasmatodeae displayed a strong negative correlation with pH (R = −0.86), suggesting a preference for more acidic environments. It also showed negative correlations with easily soluble Na+ (R = −0.79) and humus (R = −0.74). Another interesting trend was seen in Metarhizium guizhouense, which shared similar negative correlations with pH (R = −0.85) and humus (R = −0.71). This points to a preference for more acidic soils with less organic matter. Species such as Stemphylium majusculum and Fusarium foetens exhibited negative correlations with multiple parameters, including soluble salts, exchangeable Ca2+, and Mg2+, pointing to a preference for environments with low salt and mineral contents. Fusarium nygamai also showed negative correlations with pH (R = −0.50) and easily soluble Na+ (R = −0.69), indicating that it thrives in more acidic soils with lower sodium concentrations. Additionally, Alternaria pseudorostrata exhibited a positive correlation with K+ (R = 0.54) and Ca2+ (R = 0.47), highlighting its preference for soils with higher mineral levels. On the other hand, Pseudogymnoascus destructans was one of the few species to show a strong negative correlation with Ca2+ (R = −0.89), indicating its preference for soils with a lower calcium content. Generally, compared to bacteria, fungi showed weaker correlations with humus, exchangeable Ca2+, and water-soluble salts.

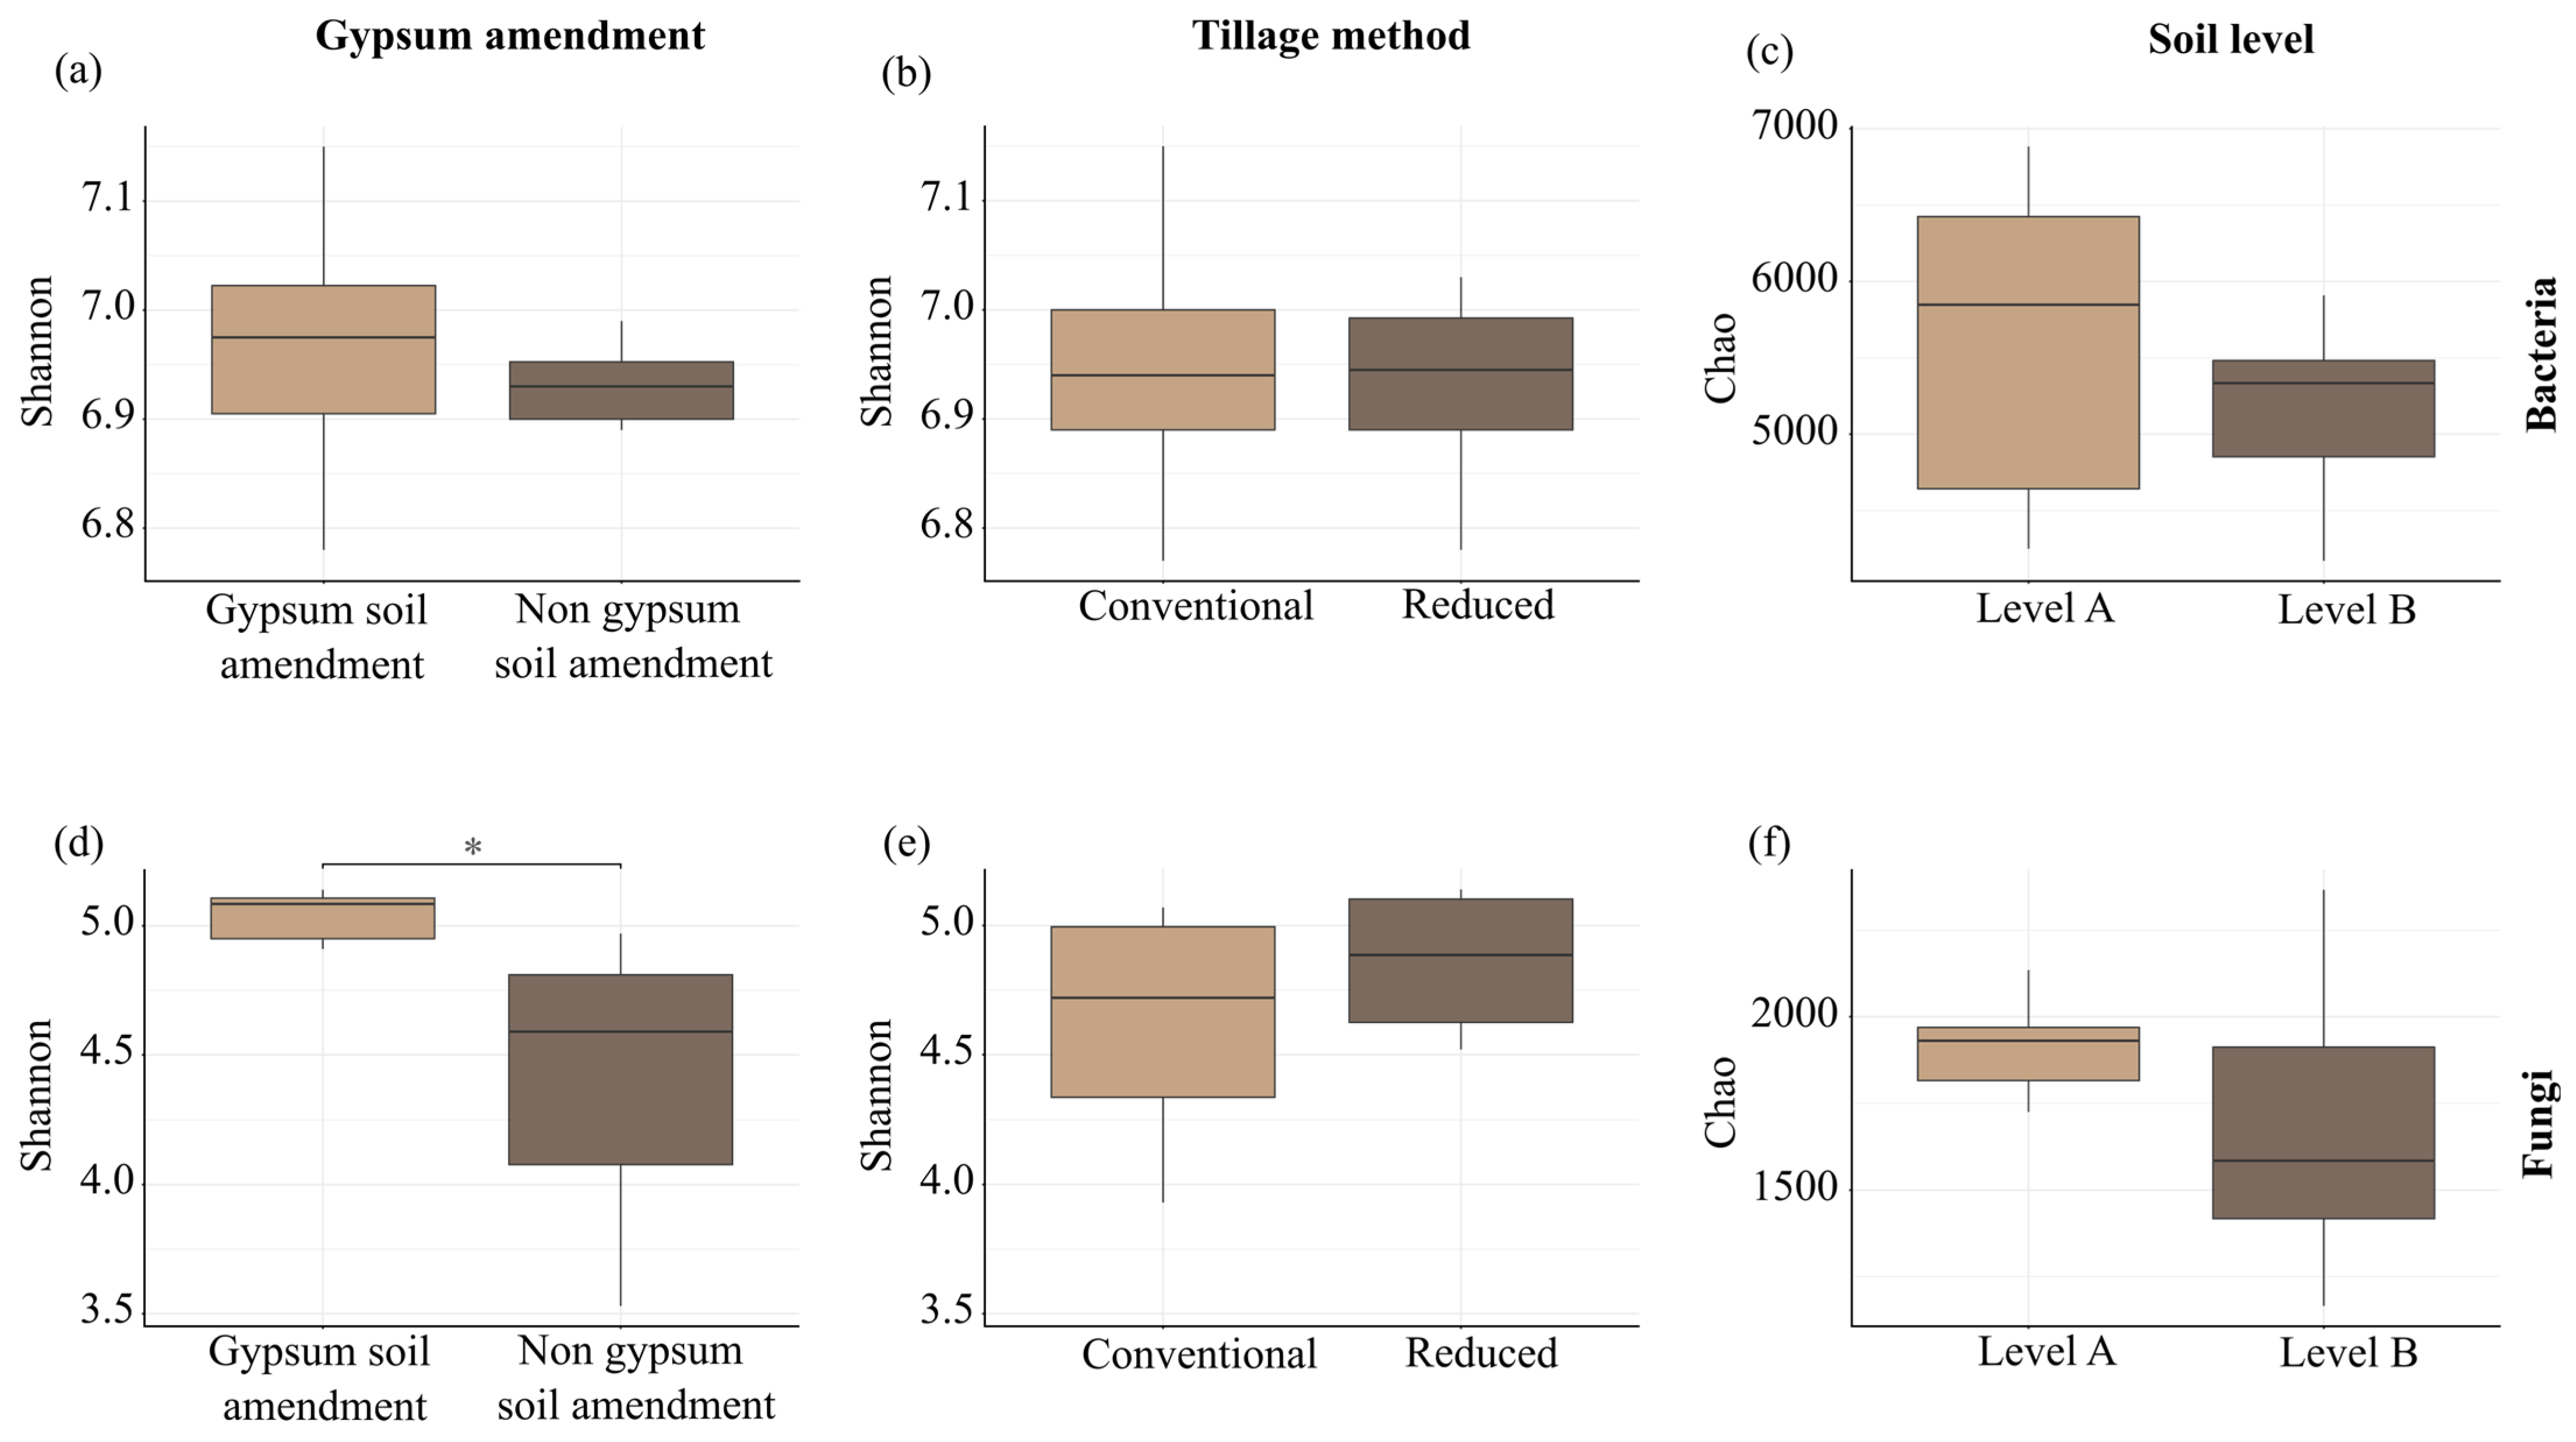
3.8. Overall Diversity of Soil

We observed that gypsum amendment positively influenced soil diversity, with a particularly significant impact on fungal communities, as indicated by the Shannon diversity indices (p = 0.04). Although the differences were not statistically significant, reduced tillage methods tended to promote higher soil diversity compared to conventional tillage (Figure 8). This suggests that reduced soil disturbance may create more favorable conditions for diverse microbial communities. Additionally, soil depth emerged as an important factor influencing community composition, with soil level A exhibiting greater diversity than deeper soil levels (level B).

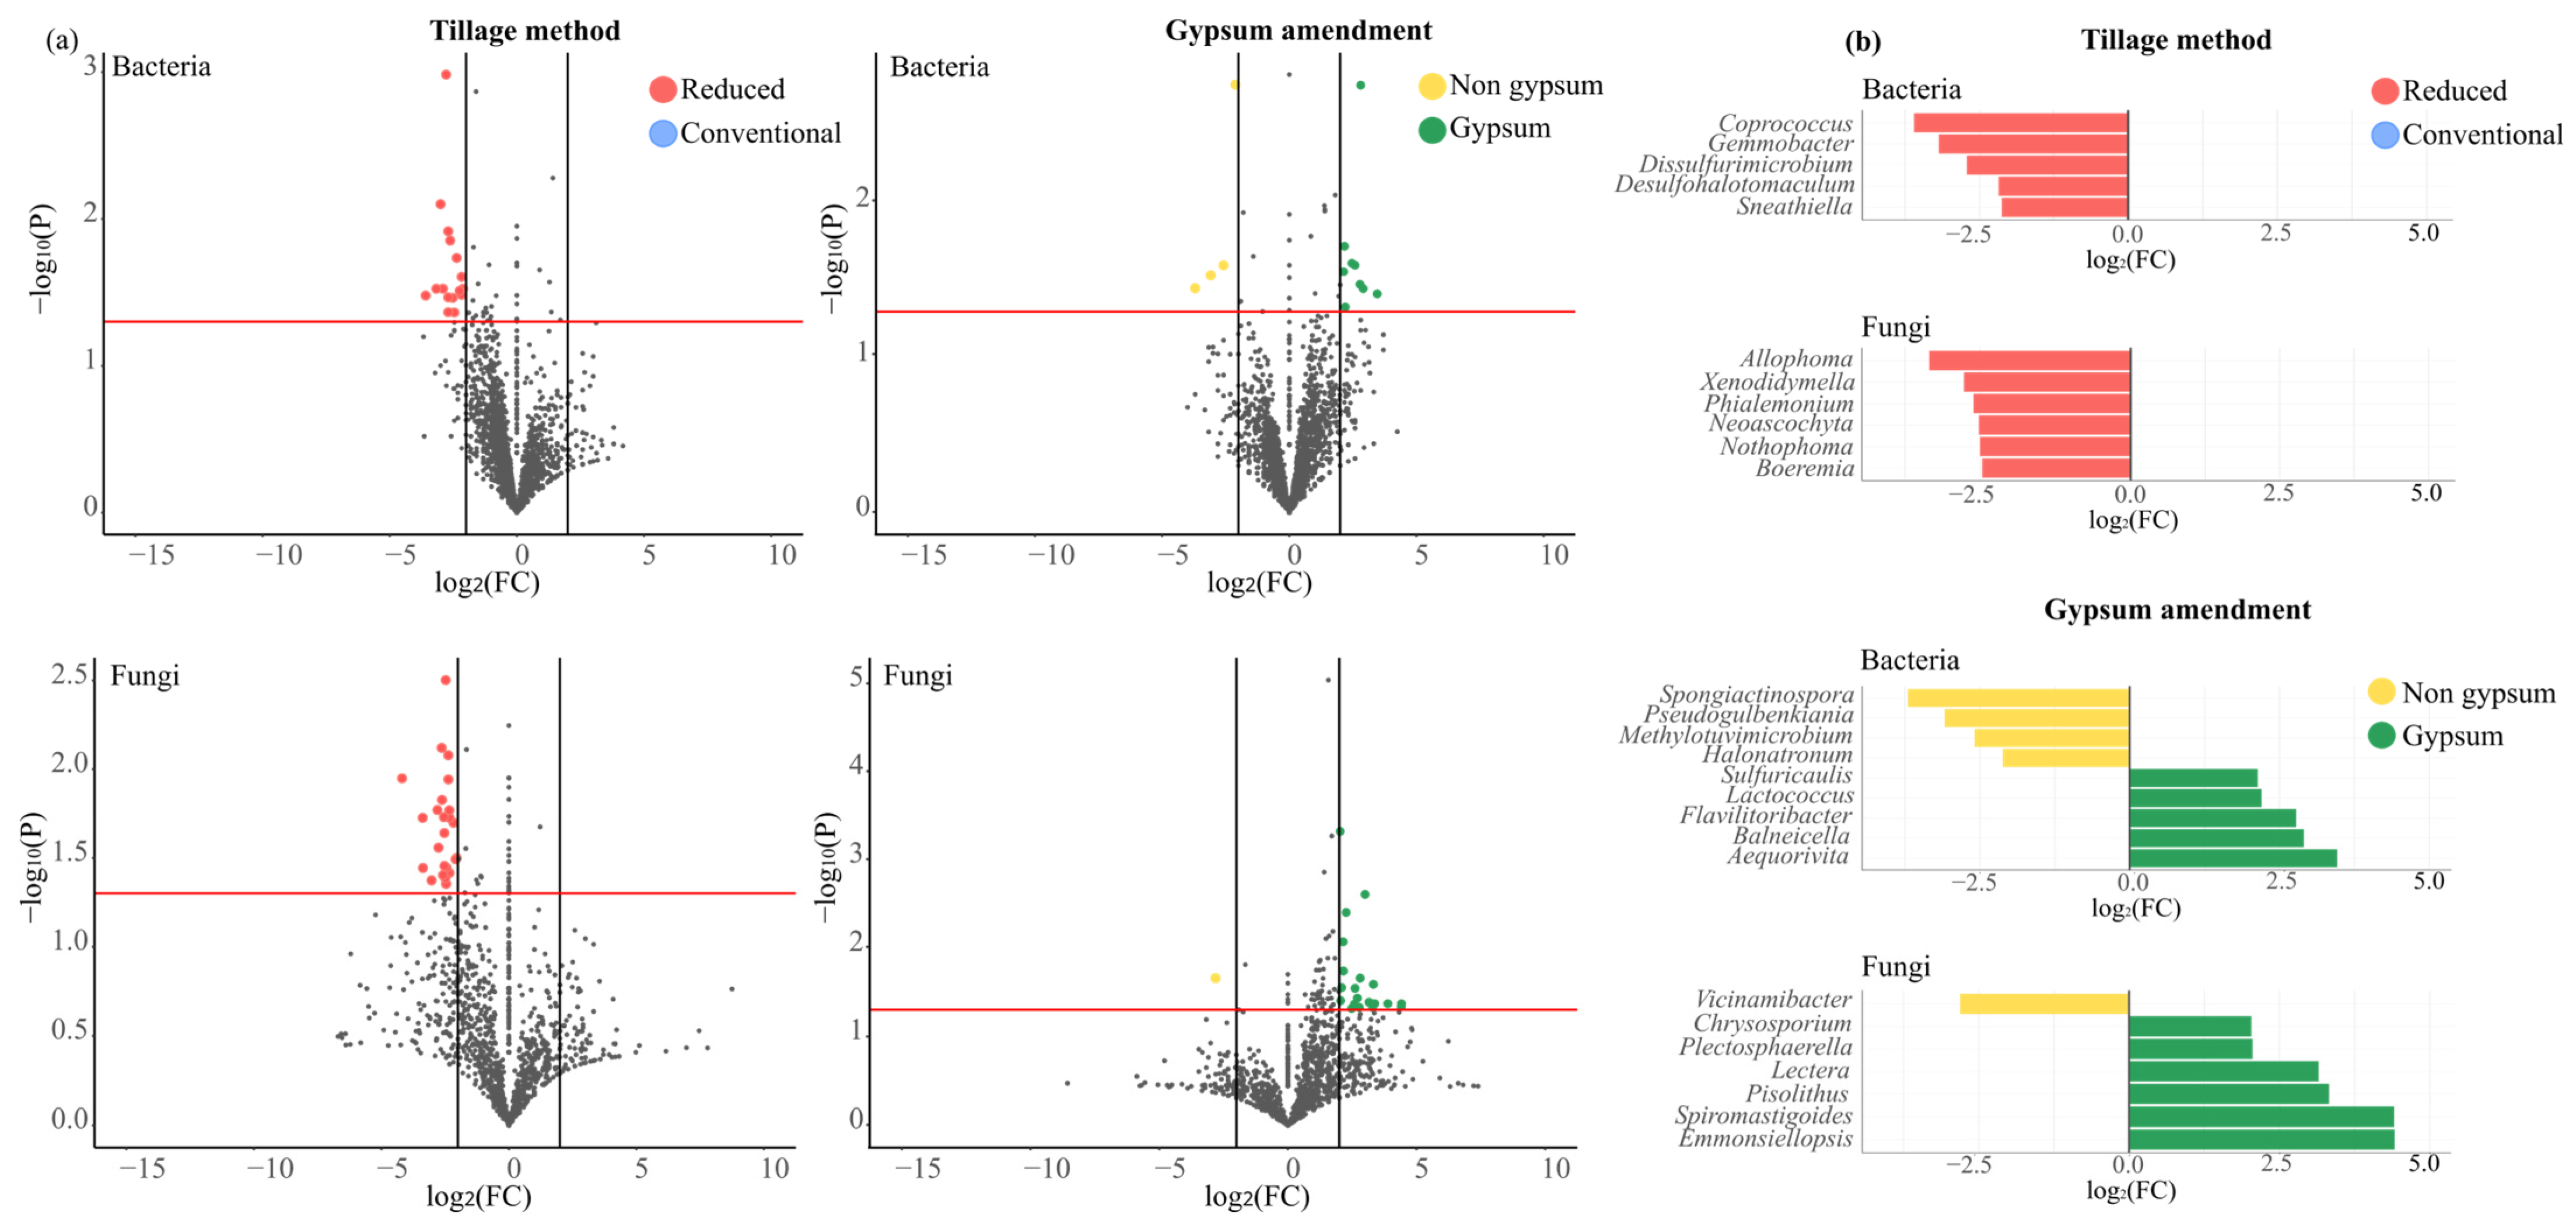
3.9. Microbial Community Dynamics Under Different Tillage Practices and Gypsum Application

Figure 9 shows the specific changes in soil microbial communities under different tillage practices and gypsum application. Reduced tillage significantly altered both bacterial and fungal communities, with notable changes in the genera present. For bacteria, Sneathiella (log2(FC) = −2.12), known for its role in nitrification [103], and Desulfohalotomaculum (log2(FC) = −2.17), a sulfate-reducing genus [104], were more prevalent under reduced tillage conditions. Similarly, fungal communities showed a trend of increased genera diversity under reduced tillage, but interestingly, pathogenic bacteria dominated this group. Specifically, Allophoma (log2(FC) = −3.38) and Allophoma species (Phialemonium (log2(FC) = −2.64), Neoascochyta (log2(FC) = −2.55), Nothophoma (log2(FC) = −2.53), and Boeremia (log2(FC) = −2.49)) were significantly more abundant, suggesting a shift toward more pathogenic fungal genera under reduced tillage.
On the other hand, gypsum application also created favorable conditions for bacteria, with a significant increase in the presence of Lactococcus (log2(FC) = 2.20), known for its role in soil fertility and nutrient uptake [105], and Sulfuricaulis (log2(FC) = 2.13), a genus involved in sulfur oxidation [106]. For fungi, gypsum treatment resulted in the presence of a mix of both beneficial and pathogenic genera. Notably, Pisolithus (log2(FC) = 3.32) and Chrysosporium (log2(FC) = 2.03) were observed as beneficial, while Lectera (log2(FC) = 3.15) and Plectosphaerella (log2(FC) = 2.05) were observed as pathogenic.

4. Discussion

Soil health plays a critical role in ensuring the production of healthy and safe food while supporting environmental sustainability. Our study analyzed soil parameters across various depths and identified several key trends influencing soil health and plant growth. The results indicated that soil level A exhibited the lowest penetration resistance, making it the least compact and the most favorable for plant development. Penetration resistance is a key factor in soil physical quality, as it determines how easily roots can access water and nutrients. Softer soils facilitate water infiltration and aeration, promoting microbial activity and improving overall soil health. In contrast, deeper soil levels (B and C) displayed significantly higher penetration resistance, meaning they were more compacted. Compacted soils tend to have reduced pore space, which can lead to waterlogging, poor aeration, and limited biological activity. Similar findings have been reported in previous studies, which highlight that deeper layers often experience greater compaction due to natural settling and external pressures such as machinery load and repeated tillage [107]. Although our study focused on the impact of different tillage methods and gypsum application on soil penetration resistance, natural compaction processes may have influenced the results, particularly at deeper soil levels. We acknowledge this as a limitation and recommend further research that incorporates long-term monitoring of natural soil changes.
Gypsum application significantly reduced penetration resistance, particularly at soil level A. The effectiveness of gypsum in improving soil physical properties can be attributed to its role in enhancing soil aggregation. By providing calcium, gypsum binds soil particles together, forming stable aggregates that improve soil structure and prevent surface sealing. This leads to increased water infiltration, reduced crusting, and overall better soil structure. Our findings align with those of Hamza and Anderson [108], who demonstrated that gypsum application improves soil structure, particularly in sandy clay loam soils, by increasing aggregate stability and preventing hard-setting. Additionally, gypsum has been widely used to mitigate the negative effects of sodium in saline soils by enhancing flocculation, reducing dispersion, and improving overall soil permeability.
The tillage method also played a critical role in penetration resistance. Among the tested approaches, M3 and M6 (both reduced tillage systems) maintained the lowest penetration resistance, indicating that they preserved the soil structure more effectively than conventional tillage. In addition to the impact of tillage methods on penetration resistance, plant roots themselves play a significant role in modifying soil compaction. Roots have been shown to adapt to compacted environments by growing longer root hairs and thicker roots to maximize resource acquisition and provide mechanical support for penetration into compacted soils [109]. These adaptive strategies help roots navigate through compacted soils, contributing to the breakdown of compacted layers. Furthermore, roots can modify the soil structure over time by releasing mucilage and water, which can increase soil porosity and facilitate water infiltration, making soil less compact and more conducive to root growth [110,111]. This process is particularly significant in reduced tillage systems, where the preservation of soil structure allows roots to penetrate more effectively, further enhancing the positive effects on penetration resistance.
Reduced tillage improves soil physical conditions by minimizing mechanical disturbance, allowing natural aggregation processes to stabilize the soil. This leads to better soil porosity, improved water retention, and reduced risk of re-compaction. In contrast, M1, representing conventional tillage, resulted in the highest penetration resistance. This is likely due to repeated ploughing, which initially loosens the soil but subsequently leads to the formation of compacted layers as the soil settles. This effect has been widely documented, with studies showing that ploughing creates a dense subsurface layer that restricts water movement and gas exchange [112]. Although conventional tillage is often used to break up compacted soil, its long-term effects can be counter-productive, particularly when combined with excessive loosening. In settings like M1, where high-intensity tillage was used, initial improvements in soil penetration resistance may be offset by re-compaction over time. This occurs because excessive disturbance disrupts aggregate stability, leading to finer soil particles that are more prone to compaction. In contrast, reduced tillage methods such as M3 help maintain the soil structure by preserving organic matter and promoting natural aggregation. These findings align with research demonstrating that reduced tillage systems provide long-term improvements in soil physical properties by enhancing soil stability, moisture retention, and biological activity [113]. While M3 was the most effective method for penetration, there were significant differences in how bacteria and fungi responded to the applied soil treatments. M1 promoted the presence of specific bacterial taxa, whereas M3 was more favorable for fungi. Our results align with Pingel et al. [114], who demonstrated that soil disturbance increases bacterial diversity but suppresses fungal diversity. Similarly, Casazza et al. [115] highlighted that soil disturbance reduces fungal presence, though some disturbance-tolerant taxa may persist. This decline occurs because higher levels of soil disturbance disrupt the symbiotic relationships between fungi and plant roots, effectively cutting off their carbon supply [116].
M3, however, was shown to create an environment that favored microbial communities responsible for key ecosystem functions, including bioremediation, plant growth promotion, and nutrient cycling. By preserving microbial habitats and organic matter, reduced tillage sustains microbial activity, while gypsum application further enhances these effects by improving soil chemistry and moisture retention. Our results demonstrate that beneficial microbial genera associated with bioremediation, phytohormone production, and plant growth promotion were significantly more abundant at soil level A. This enrichment is primarily linked to higher organic matter content, improved aeration, and root exudates, all of which are preserved under reduced tillage. These conditions create microenvironments that enhance microbial interactions and nutrient mobilization, supporting long-term soil health and crop productivity. Previous studies have similarly highlighted the role of rhizosphere bacteria in promoting plant resilience and biocontrol [117]. Additionally, the vertical distribution of organic carbon and nitrogen has been shown to influence microbial activity [118], further supporting our findings that soil level A provides optimal conditions for functionally beneficial microbes. In contrast, the deeper soil level (B) exhibited a higher prevalence of specific functional genera adapted to nutrient-limited conditions. Siderophore-producing genera were particularly abundant in this layer, likely due to the lower iron availability caused by the high pH and elevated CaCO3 content. These microorganisms play a crucial role in iron solubilization and uptake, supporting plant and microbial metabolism under iron-limiting conditions [119]. Additionally, genera associated with antibiotic and antimicrobial production were more prominent at soil level B, a pattern that aligns with findings from studies on microbial competition in oligotrophic environments [120]. The lower availability of organic matter and microbial diversity at deeper levels likely exert selective pressure, favoring microbes that produce antimicrobial compounds to outcompete others.
The impact of gypsum application further underscores its role in enhancing microbial functions beyond its known effects on soil structure and moisture retention. Our results indicate a notable increase in functional groups involved in bioremediation, cellulose degradation, and plant growth in gypsum-treated soils. These findings align with previous studies demonstrating that gypsum application improves microbial-mediated nutrient cycling, enhances soil porosity, and mitigates salinity stress [121]. Furthermore, gypsum’s contribution to soil calcium and sulfur availability has been linked to increased populations of plant growth-promoting bacteria, facilitating nutrient uptake and improving crop performance [122].
Gypsum amendment significantly contributed to a more balanced chemical profile in the soil, particularly in terms of sodium (Na+) and calcium (Ca2+) levels. This improvement can be attributed to the composition of gypsum (CaSO4·2H2O), which helps neutralize soil by enhancing calcium, magnesium, and sulfur levels. Specifically, gypsum promotes the exchange of sodium ions (Na+) for calcium ions (Ca2+), thereby improving the soil’s ion balance and increasing the ratio of Ca2+ to Na+, which is essential for soil health [25]. These findings are consistent with other studies that demonstrate the positive effects of gypsum on soil density, water infiltration, nutrient availability, and overall soil health [25,123]. Gypsum has long been recognized for its ability to improve soil structure, enhance water movement, and promote better nutrient absorption. These benefits collectively contribute to the long-term vitality and productivity of the soil [123,124]. Additionally, the application of gypsum has been shown to lower the soil pH, as noted by Khan et al. [125], which further contributes to enhanced soil quality by reducing soil acidity and improving the availability of essential nutrients. Although previous studies suggest that gypsum can have a more pronounced effect on deeper soil levels over time [126], our results did not show significant changes in these deeper levels. This can likely be attributed to the fact that the impact of gypsum is most noticeable in the surface layers initially, and its effects on deeper soil profiles may take longer to manifest. The results of this study demonstrate that gypsum application significantly improves soil chemical parameters and structure, particularly in the short term. However, the positive effects of gypsum diminish over time as it leaches away, which may require regular reapplication to sustain these improvements. To ensure long-term benefits, high application rates, along with adequate rainfall or irrigation, are necessary for effective salt leaching, making gypsum a slow-acting but more sustainable solution to soil salinity. Long-term studies have shown that even after 16 years, gypsum continued to enhance subsoil chemical properties and crop yields [127]. Its application increases exchangeable calcium at deeper soil levels while reducing sodium levels, though sodium leaching may be lower than expected, highlighting the need for accurate application models and potential reapplications to sustain soil improvements [126]. Despite these findings, further research is required to determine whether the benefits of gypsum application will persist across multiple growing seasons or if periodic reapplication will be necessary to maintain soil health and agricultural productivity. Furthermore, while gypsum improves soil structure and salinity, its application can lead to environmental concerns. The leaching of sulfate and other ions can elevate sulfate concentrations in groundwater, potentially impacting water quality and human and animal health [128]. Additionally, gypsum can displace nutrients like potassium, leading to levels that exceed recommended guidelines [129]. Additionally, it has been observed that the application of gypsum led to an increase in the soluble concentrations of cadmium, manganese, and lead in the soil [130]. In terms of the microbiome, bacteria were more significantly impacted by changes in soil chemical composition than fungi. Beneficial bacterial species like Gaiella occulta, Ideonella dechloratans, Peribacillus frigoritolerans, and Skermanella aerolata responded strongly to changes in pH, soluble salts, and calcium concentrations, thriving in nutrient-rich, low-salinity environments. Skermanella aerolata, linked to nitrogen fixation [131], showed positive responses to nutrient availability, indicating its preference for well-balanced soil chemistry. This suggests that bacteria are more sensitive to soil chemical composition, aligning with findings that show their abundance in stable, nutrient-rich environments [132,133]. In contrast, fungi were less responsive to soil chemical changes, likely due to their inherent stability and resilience to environmental fluctuations [134]. Fungal species are more tolerant of pH and salinity variations than bacteria, supporting their greater resilience to environmental stressors [133,135,136]. However, pathogenic fungi like Alternaria prunicola, Fusarium citricola, Fusarium foetens, and Fusarium nygamai were significantly affected by changes in soil chemistry, particularly pH, soluble salts, CaCO3, exchangeable Na, and easily soluble Na. This highlights that while beneficial bacteria thrive in balanced chemical conditions, soil chemistry can also favor pathogenic fungi, stressing the need for careful soil management to maintain a healthy microbial environment and reduce pathogen risks.
Our results indicated that reduced tillage enhanced soil biodiversity by minimizing soil disturbance, thus providing a more stable environment for microbial communities. This finding aligns with previous studies that showed that adopting reduced tillage or no-till practices promoted higher abundance, biomass, and species diversity, which contribute to improved soil structure and organic matter decomposition [137,138]. By reducing physical disruption, reduced tillage fostered a healthier and more diverse soil ecosystem while maintaining soil integrity over time. Gypsum application significantly influenced soil microbial communities by modifying soil chemistry and structure, which created a more favorable environment for microbial activity. By altering the levels of key ions, such as calcium and sodium, gypsum helped balance soil properties, reduced salinity stress, and improved soil fertility. Our findings are consistent with other research indicating that gypsum positively affected the fungal taxa, particularly increasing the abundance of arbuscular mycorrhizal fungi, which play a crucial role in soil reclamation, plant growth, and ecosystem resilience [139,140]. Additionally, microbial diversity was significantly higher at soil level A, where nutrient availability, oxygen levels, and organic matter content were greater, supporting a more dynamic and diverse microbial community [141]. This confirms previous studies that demonstrated surface soils, enriched with organic inputs and aeration, harbor more diverse and functionally active microbial populations. Our results also suggested that reduced tillage promoted the presence of specific microbial genera, enhancing the abundance of beneficial bacterial genera. However, its effect on fungi seemed to be the opposite. This could be attributed to minimal soil disturbance and increased organic matter retention under reduced tillage, which may have created favorable conditions for fungal growth. Similar studies showed that reduced tillage favored Fusarium spp., including pathogenic species like Fusarium avenaceum, a known cause of Fusarium Head Blight in cereals [142]. Moreover, reduced tillage was linked to increased weed infestations, which were associated with a rise in pathogenic fungal communities [143].

5. Conclusions

In conclusion, this study showed that the combination of gypsum amendment and reduced tillage significantly enhanced soil health and microbial dynamics, particularly at the top soil level. Gypsum not only improved soil penetration rates and balanced nutrient levels but also mitigated salinity, contributing to better overall soil functionality. Notably, the treatments led to an increase in fungal diversity, though bacterial diversity remained unchanged. Strong correlations between microbial communities and soil chemical parameters underscore the critical role of these interactions in supporting soil productivity. Reduced tillage, coupled with gypsum, also promoted functional soil activities such as nutrient mobilization, antibiotic production, and plant growth stimulation, thus fostering greater soil resilience and sustainability. Moving forward, additional research is needed to explore the long-term effects of these practices on various soil conditions, microbial dynamics, and the underlying mechanisms driving these changes, in order to fully understand their potential for sustainable agriculture. Although environmental factors such as temperature, rainfall, and irrigation were not explicitly controlled in this study, they play a crucial role in influencing soil behavior. The primary focus here was to isolate the impact of tillage and gypsum on soil properties, but future studies could benefit from incorporating these environmental variables to assess their influence more accurately on the treatment outcomes.

Supplementary Materials

The following supporting information can be downloaded at https://www.mdpi.com/article/10.3390/agriculture15060658/s1: Table S1: Nine key ecosystem services associated with soil microbiomes, including: improved soil aggregate formation, production of antimicrobial agents, siderophore production, cellulose degradation, production of antibiotics, bioremediation, nutrient mobilization, plant growth stimulation, and production of phytohormone-like substances.

Author Contributions

Conceptualization, N.G., Z.S. (Zsombor Szőke) and A.C.; data curation, N.G., Z.S. (Zsombor Szőke), A.C., P.F., M.M. and F.G.; formal analysis, N.G., Z.S. (Zsombor Szőke) and P.F.; investigation, P.D.; methodology, N.G., A.C., Z.S. (Zsombor Szőke) and P.D.; project administration, Z.S. (Zsolt Sándor) and M.P.; supervision, J.R., Z.S. (Zsolt Sándor) and M.P.; writing—original draft, N.G. and Z.S. (Zsombor Szőke); writing—review and editing, L.S., J.R., Z.S. (Zsolt Sándor) and M.P. All authors have read and agreed to the published version of the manuscript.

Funding

This research received no funding.

Institutional Review Board Statement

Not applicable.

Data Availability Statement

The authors will provide the raw data underlying this study’s conclusions upon request.

Acknowledgments

N.G. was supported by the Stipendium Hungaricum Scholarship, and Z.S. and M.M. were supported by the PhD Excellence Scholarship from the Count Istvan Tisza Foundation for the University of Debrecen. This research was supported by the University of Debrecen through the Program for Scientific Publication.

Conflicts of Interest

The authors declare no conflicts of interest.

References

  1. van Dijk, M.; Morley, T.; Rau, M.L.; Saghai, Y. A meta-analysis of projected global food demand and population at risk of hunger for the period 2010–2050. Nat. Food 2021, 2, 494–501. [Google Scholar] [PubMed]
  2. FAOSTAT. Food Balances. 2010. Available online: https://www.fao.org/faostat/en/#data/FBS (accessed on 12 December 2024).
  3. FAO Soils. Where Food Begins: How Can Soils Continue to Sustain the Growing Need for Food Production in the Current Fertilizer Crisis? FAO: Rome, Italy, 2023. [Google Scholar]
  4. FAO. Global Map of Salt-Affected Soils; FAO: Rome, Italy, 2021. [Google Scholar]
  5. Singh, A. Soil salinity: A global threat to sustainable development. Soil Use Manag. 2021, 38, 39–67. [Google Scholar]
  6. FAO. FAO Launches First Major Global Assessment of Salt-Affected Soils in 50 Years; FAO: Rome, Italy, 2024. [Google Scholar]
  7. Negacz, K.; Malek, Ž.; de Vos, A.; Vellinga, P. Saline soils worldwide: Identifying the most promising areas for saline agriculture. J. Arid Environ. 2022, 203, 104775. [Google Scholar]
  8. Eswar, D.; Karuppusamy, R.; Chellamuthu, S. Drivers of soil salinity and their correlation with climate change. Curr. Opin. Environ. Sustain. 2021, 50, 310–318. [Google Scholar]
  9. Yuvaraj, M.; Bose, K.S.C.; Elavarasi, P.; Tawfik, E.; Yuvaraj, M.; Bose, K.S.C.; Elavarasi, P.; Tawfik, E. Soil Salinity and Its Management. In Soil Moisture Importance; IntechOpen: London, UK, 2021; ISBN 978-1-83968-096-0. [Google Scholar]
  10. Laiskhanov, S.U.; Smanov, Z.M.; Kaimuldinova, K.D.; Myrzaly, N.B.; Ussenov, N.E.; Poshanov, M.N.; Azimkhanov, B.; Smanov, Z.M.; Poshanov, M.N. A Study of the Effects of Soil Salinity on the Growth and Development of Maize (Zea mays L.) by using Sentinel-2 Imagery. OnLine J. Biol. Sci. 2022, 22, 323–332. [Google Scholar] [CrossRef]
  11. El-Ramady, H.; Prokisch, J.; Mansour, H.; Bayoumi, Y.A.; Shalaby, T.A.; Veres, S.; Brevik, E.C. Review of Crop Response to Soil Salinity Stress: Possible Approaches from Leaching to Nano-Management. Soil Syst. 2024, 8, 11. [Google Scholar] [CrossRef]
  12. Zhao, C.; Zhang, H.; Song, C.; Zhu, J.-K.; Shabala, S. Mechanisms of Plant Responses and Adaptation to Soil Salinity. Innovation 2020, 1, 100017. [Google Scholar]
  13. Liu, C.; Jiang, X.; Yuan, Z. Plant Responses and Adaptations to Salt Stress: A Review. Horticulturae 2024, 10, 1221. [Google Scholar] [CrossRef]
  14. Tripathi, S.; Kumari, S.; Chakraborty, A.; Gupta, A.; Chakrabarti, K.; Bandyapadhyay, B.K. Microbial biomass and its activities in salt-affected coastal soils. Biol. Fertil. Soils 2006, 42, 273–277. [Google Scholar]
  15. Rietz, D.N.; Haynes, R.J. Effects of irrigation-induced salinity and sodicity on soil microbial activity. Soil Biol. Biochem. 2003, 35, 845–854. [Google Scholar] [CrossRef]
  16. Dong, Y.; Zhang, J.; Chen, R.; Zhong, L.; Lin, X.; Feng, Y. Microbial Community Composition and Activity in Saline Soils of Coastal Agro–Ecosystems. Microorganisms 2022, 10, 835. [Google Scholar] [CrossRef] [PubMed]
  17. Li, Y.; Wang, J.; Li, E.; Yang, X.; Yang, J. Shifts in Microbial Community Structure and Co-occurrence Network along a Wide Soil Salinity Gradient. Microorganisms 2024, 12, 1268. [Google Scholar] [CrossRef] [PubMed]
  18. Zhang, K.; Shi, Y.; Cui, X.; Yue, P.; Li, K.; Liu, X.; Tripathi, B.M.; Chu, H. Salinity Is a Key Determinant for Soil Microbial Communities in a Desert Ecosystem. mSystems 2019, 4, 10-1128. [Google Scholar] [CrossRef]
  19. Zhang, W.; Wang, C.; Xue, R.; Wang, L. Effects of salinity on the soil microbial community and soil fertility. J. Integr. Agric. 2019, 18, 1360–1368. [Google Scholar] [CrossRef]
  20. Wang, X.; Chi, Y.; Song, S. Important soil microbiota’s effects on plants and soils: A comprehensive 30-year systematic literature review. Front. Microbiol. 2024, 15, 1347745. [Google Scholar]
  21. Bidalia, A.; Vikram, K.; Yamal, G.; Rao, K.S. Effect of Salinity on Soil Nutrients and Plant Health. In Salt Stress, Microbes, and Plant Interactions: Causes and Solution; Akhtar, M.S., Ed.; Springer: Singapore, 2019; Volume 1, pp. 273–297. ISBN 9789811388019. [Google Scholar]
  22. Athar, T.; Kanwal, N. Significance of soil health and soil life for sustainable food production. Emergent Life Sci. Res. 2022, 08, 1–4. [Google Scholar] [CrossRef]
  23. Murtaza, G.; Murtaza, B.; Usman, H.; Ghafoor, A. Amelioration of Saline-sodic Soil using Gypsum and Low Quality Water in Following Sorghum-berseem Crop Rotation. Int. J. Agric. Biol. 2013, 15, 640–648. [Google Scholar]
  24. McKenna, B.A.; Kopittke, P.M.; Macfarlane, D.C.; Dalzell, S.A.; Menzies, N.W. Changes in soil chemistry after the application of gypsum and sulfur and irrigation with coal seam water. Geoderma 2019, 337, 782–791. [Google Scholar] [CrossRef]
  25. Bello, S.K.; Alayafi, A.H.; AL-Solaimani, S.G.; Abo-Elyousr, K.A.M. Mitigating Soil Salinity Stress with Gypsum and Bio-Organic Amendments: A Review. Agronomy 2021, 11, 1735. [Google Scholar] [CrossRef]
  26. Liu, R.; Liang, B.; Zhao, H.; Zhao, Y. Impacts of various amendments on the microbial communities and soil organic carbon of coastal saline–alkali soil in the Yellow River Delta. Front. Microbiol. 2023, 14, 1239855. [Google Scholar]
  27. Saqib, A.; Ahmed, K.; Naseem, A.; Qadir, G.; Nawaz, M.; Khalid, M.; Warraich, I.; Arif, M. Integrated Use of Humic Acid and Gypsum under Saline-Sodic Conditions. Pak. J. Agric. Res. 2020, 33, 684–691. [Google Scholar]
  28. Bossolani, J.W.; Crusciol, C.A.C.; Merloti, L.F.; Moretti, L.G.; Costa, N.R.; Tsai, S.M.; Kuramae, E.E. Long-term lime and gypsum amendment increase nitrogen fixation and decrease nitrification and denitrification gene abundances in the rhizosphere and soil in a tropical no-till intercropping system. Geoderma 2020, 375, 114476. [Google Scholar]
  29. López-Lozano, N.E.; Eguiarte, L.E.; Bonilla-Rosso, G.; García-Oliva, F.; Martínez-Piedragil, C.; Rooks, C.; Souza, V. Bacterial Communities and the Nitrogen Cycle in the Gypsum Soils of Cuatro Ciénegas Basin, Coahuila: A Mars Analogue. Astrobiology 2012, 12, 699–709. [Google Scholar] [PubMed]
  30. Somenahally, A.C.; McLawrence, J.; Chaganti, V.N.; Ganjegunte, G.K.; Obayomi, O.; Brady, J.A. Response of soil microbial Communities, inorganic and organic soil carbon pools in arid saline soils to alternative land use practices. Ecol. Indic. 2023, 150, 110227. [Google Scholar]
  31. Tian, Y.; Jiang, W.; Chen, G.; Wang, X.; Li, T. Gypsum and organic materials improved soil quality and crop production in saline-alkali on the loess plateau of China. Front. Environ. Sci. 2024, 12, 1434147. [Google Scholar] [CrossRef]
  32. Ibáñez, A.; Sombrero, A.; Santiago-Pajón, A.; Santiago-Calvo, Y.; Manzanera, M.C.A.S. Effect of long-term conservation tillage management on microbial diversity under Mediterranean rainfed conditions. Soil Tillage Res. 2024, 236, 105923. [Google Scholar]
  33. Kurm, V.; Schilder, M.; Haagsma, W.; Bloem, J.; Scholten, O.; Postma, J. Reduced tillage increases soil biological properties but not suppressiveness against Rhizoctonia solani and Streptomyces scabies. Appl. Soil Ecol. 2023, 181, 104646. [Google Scholar]
  34. 34. Singh, O.; Shahi, U.P.; Dutta, D.; Shivangi; Rajput, V.D.; Singh, A.; Singh, O.; Shahi, U.P.; Dutta, D.; Shivangi; et al. Strategic Tillage for Improved Soil Health and Nutrient Dynamics. In Strategic Tillage and Soil Management—New Perspectives; IntechOpen: London, UK, 2024; ISBN 978-1-83769-223-1. [Google Scholar]
  35. van Balen, D.; Cuperus, F.; Haagsma, W.; de Haan, J.; van den Berg, W.; Sukkel, W. Crop yield response to long-term reduced tillage in a conventional and organic farming system on a sandy loam soil. Soil Tillage Res. 2023, 225, 105553. [Google Scholar]
  36. Birkás, M.; Szalai, T.; Gyuricza, C.; Gecse, M.; Bordás, K. Effects of disk tillage on soil condition, crop yield and weed infestation. Plant Soil Environ. 2002, 48, 20–26. [Google Scholar] [CrossRef]
  37. Finch, H.J.S.; Samuel, A.M.; Lane, G.P.F. Cropping techniques. In Lockhart & Wiseman’s Crop Husbandry Including Grassland; Elsevier: Amsterdam, The Netherlands, 2014; pp. 193–217. ISBN 978-1-78242-371-3. [Google Scholar]
  38. FAO. Guidelines for Soil Description; FAO: Rome, Italy, 2006. [Google Scholar]
  39. FAO. Standard Operating Procedure for Soil pH Determination; FAO: Rome, Italy, 2021. [Google Scholar]
  40. Ferrarezi, R.S.; Lin, X.; Gonzalez Neira, A.C.; Tabay Zambon, F.; Hu, H.; Wang, X.; Huang, J.-H.; Fan, G. Substrate pH Influences the Nutrient Absorption and Rhizosphere Microbiome of Huanglongbing-Affected Grapefruit Plants. Front. Plant Sci. 2022, 13, 856937. [Google Scholar]
  41. Filep, G. Talajvizsgálat. Egyetem Mezőgazdaságtudományi Kar Talajtani és Mikrobiológiai Tanszék, Debreceni Agrártudományi: Debrecen, Hungary, 1995; p. 81. [Google Scholar]
  42. Csubák, M. Talajok kémhatása. In Talajtan, Talajökológia; katai, J., Ed.; Az Eszak—Alföld Régiert Kht.: Debrecen, Hungary, 2008; pp. 86–92. [Google Scholar]
  43. Lukács, A.; Rédly, L. A talajok sótartalmának és sóösszetételének vizsgálata. In Talaj- és Agrokémiai Vizsgálati Módszerkönyv 2; Mezőgazdasági Kiadó: Budapest, Hungary, 1988; pp. 174–210. [Google Scholar]
  44. Buzás, I. A talajfizikai, vízgazdálkodási és ásványtani vizsgálata. Inda4231 Kiadó. 1933, 1, 37–42. [Google Scholar]
  45. Hargitai, L. Az ekvivalens humuszkészlet agrokémiai és környezetvédelmi jelentősége. Kertészeti Egy. Közleményei Bp. 1987, 51, 260–267. [Google Scholar]
  46. Búzás, I. Talaj és Agrokcmiai Vizsgálatok Módszerkonyv; INDA 4231 Kiadó: Budapest, Hungary, 1988. [Google Scholar]
  47. Wick, R.R.; Judd, L.M.; Holt, K.E. Performance of neural network basecalling tools for Oxford Nanopore sequencing. Genome Biol. 2019, 20, 129. [Google Scholar] [CrossRef]
  48. Wright, C. epi2me-labs/fastcat. Github. 2025. Available online: https://github.com/epi2me-labs/fastcat (accessed on 17 February 2025).
  49. Lanfear, R.; Schalamun, M.; Kainer, D.; Wang, W.; Schwessinger, B. MinIONQC: Fast and simple quality control for MinION sequencing data. Bioinformatics 2019, 35, 523–525. [Google Scholar] [CrossRef] [PubMed]
  50. McMurdie, P.J.; Holmes, S. phyloseq: An R Package for Reproducible Interactive Analysis and Graphics of Microbiome Census Data. PLoS ONE 2013, 8, e61217. [Google Scholar] [CrossRef]
  51. McMurdie, P.J. joey711/phyloseq. Github. 2025. Available online: https://github.com/joey711/phyloseq (accessed on 17 February 2025).
  52. Pedersen, T.L. tidyverse/ggplot2. Github. 2025. Available online: https://github.com/tidyverse/ggplot2 (accessed on 17 February 2025).
  53. Taiyun. taiyun/corrplot. Beijing, China. Github. 2024. Available online: https://github.com/taiyun/corrplot (accessed on 17 February 2025).
  54. Foster, Z.S.L.; Sharpton, T.J.; Grünwald, N.J. Metacoder: An R package for visualization and manipulation of community taxonomic diversity data. PLoS Comput. Biol. 2017, 13, e1005404. [Google Scholar] [CrossRef] [PubMed]
  55. Min, K.; Slessarev, E.; Kan, M.; McFarlane, K.; Oerter, E.; Pett-Ridge, J.; Nuccio, E.; Berhe, A.A. Active microbial biomass decreases, but microbial growth potential remains similar across soil depth profiles under deeply-vs. shallow-rooted plants. Soil Biol. Biochem. 2021, 162, 108401. [Google Scholar] [CrossRef]
  56. Rumpel, C.; Kögel-Knabner, I. Deep soil organic matter—A key but poorly understood component of terrestrial C cycle. Plant Soil 2011, 338, 143–158. [Google Scholar] [CrossRef]
  57. Liu, X.; Rezaei Rashti, M.; Van Zwieten, L.; Esfandbod, M.; Rose, M.T.; Chen, C. Microbial carbon functional responses to compaction and moisture stresses in two contrasting Australian soils. Soil Tillage Res. 2023, 234, 105825. [Google Scholar] [CrossRef]
  58. Tapaça, I.d.P.E.; Obieze, C.C.; Pereira, G.V.d.M.; Fangueiro, D.; Coutinho, J.; Fraga, I.; Partelli, F.L.; Ramalho, J.C.; Marques, I.; Ribeiro-Barros, A.I. Irradiance level and elevation shape the soil microbiome communities of Coffea arabica L. Environ. Microbiome 2024, 19, 75. [Google Scholar] [CrossRef]
  59. Amon, C.E.R.; Fossou, R.K.; Ebou, A.E.T.; Koua, D.K.; Kouadjo, C.G.; Brou, Y.C.; Voko Bi, D.R.R.; Cowan, D.A.; Zézé, A. The core bacteriobiome of Côte d’Ivoire soils across three vegetation zones. Front. Microbiol. 2023, 14, 1220655. [Google Scholar]
  60. Gaballah, M.S.; Sobhi, M.; Guo, J.; Philbert, M.; Min, L.; Zheng, Y.; Ghorab, M.A.; Dong, R. Evaluating the removal and impacts of combined tetracycline, oxytetracycline, sulfadiazine, and norfloxacin during swine manure storage process at ambient temperatures. J. Environ. Chem. Eng. 2023, 11, 109765. [Google Scholar]
  61. Dall’Asta, C.; Cirlini, M.; Falavigna, C. Mycotoxins from Alternaria. In Advances in Molecular Toxicology; Fishbein, J.C., Heilman, J.M., Eds.; Elsevier: Amsterdam, The Netherlands, 2014; Volume 8, pp. 107–121. [Google Scholar]
  62. Wu, X.; Cai, W.; Zhu, P.; Peng, Z.; Zheng, T.; Li, D.; Li, J.; Zhou, G.; Zhang, J.; Du, G. Function-driven design of Bacillus kochii and Filobasidium magnum co-culture to improve quality of flue-cured tobacco. Front. Microbiol. 2023, 13, 1024005. [Google Scholar]
  63. Zeng, Z.-Q.; Zhuang, W.-Y. Three New Species of Fusicolla (Hypocreales) from China. J. Fungi 2023, 9, 572. [Google Scholar] [CrossRef] [PubMed]
  64. Vandepol, N.; Liber, J.; Yocca, A.; Matlock, J.; Edger, P.; Bonito, G. Linnemannia elongata (Mortierellaceae) stimulates Arabidopsis thaliana aerial growth and responses to auxin, ethylene, and reactive oxygen species. PLoS ONE 2022, 17, e0261908. [Google Scholar]
  65. Das, K.; Abrol, S.; Verma, R.; Annapragada, H.; Katiyar, N.; Senthilkumar, M. Chapter 8—Pseudomonas. In Beneficial Microbes in Agro-Ecology; Amaresan, N., Senthil Kumar, M., Annapurna, K., Kumar, K., Sankaranarayanan, A., Eds.; Academic Press: Cambridge, MA, USA, 2020; pp. 133–148. ISBN 978-0-12-823414-3. [Google Scholar]
  66. Hayat, R.; Ali, S.; Amara, U.; Khalid, R.; Ahmed, I. Soil beneficial bacteria and their role in plant growth promotion: A review. Ann. Microbiol. 2010, 60, 579–598. [Google Scholar]
  67. Orozco-Mosqueda, M.d.C.; Santoyo, G.; Glick, B.R. Recent Advances in the Bacterial Phytohormone Modulation of Plant Growth. Plants 2023, 12, 606. [Google Scholar] [CrossRef] [PubMed]
  68. Pino-Hurtado, M.S.; Fernández-Fernández, R.; Torres, C.; Robredo, B. Searching for Antimicrobial-Producing Bacteria from Soils through an Educational Project and Their Evaluation as Potential Biocontrol Agents. Antibiotics 2024, 13, 29. [Google Scholar]
  69. Millar, B.C.; Nelson, D.; Moore, R.E.; Rao, J.R.; Moore, J.E. Antimicrobial properties of basidiomycota macrofungi to Mycobacterium abscessus isolated from patients with cystic fibrosis. Int. J. Mycobacteriology 2019, 8, 93–97. [Google Scholar]
  70. Mackay, J.E.; Bernhardt, L.T.; Smith, R.G.; Ernakovich, J.G. Tillage and pesticide seed treatments have distinct effects on soil microbial diversity and function. Soil Biol. Biochem. 2023, 176, 108860. [Google Scholar]
  71. Chen, J.; Song, D.; Liu, D.; Sun, J.; Wang, X.; Zhou, W.; Liang, G. Soil Aggregation Shaped the Distribution and Interaction of Bacterial-Fungal Community Based on a 38-Year Fertilization Experiment in China. Front. Microbiol. 2022, 13, 824681. [Google Scholar] [CrossRef] [PubMed]
  72. Armalytė, J.; Skerniškytė, J.; Bakienė, E.; Krasauskas, R.; Šiugždinienė, R.; Kareivienė, V.; Kerzienė, S.; Klimienė, I.; Sužiedėlienė, E.; Ružauskas, M. Microbial Diversity and Antimicrobial Resistance Profile in Microbiota From Soils of Conventional and Organic Farming Systems. Front. Microbiol. 2019, 10, 892. [Google Scholar] [CrossRef] [PubMed]
  73. Ferreira, C.M.H.; Vilas-Boas, Â.; Sousa, C.A.; Soares, H.M.V.M.; Soares, E.V. Comparison of five bacterial strains producing siderophores with ability to chelate iron under alkaline conditions. AMB Express 2019, 9, 78. [Google Scholar] [CrossRef]
  74. Timofeeva, A.M.; Galyamova, M.R.; Sedykh, S.E. Bacterial Siderophores: Classification, Biosynthesis, Perspectives of Use in Agriculture. Plants 2022, 11, 3065. [Google Scholar] [CrossRef]
  75. Holinsworth, B.; Martin, J.D. Siderophore production by marine-derived fungi. Biometals Int. J. Role Met. Ions Biol. Biochem. Med. 2009, 22, 625–632. [Google Scholar] [CrossRef]
  76. Zhou, C.; Guo, J.; Zhu, L.; Xiao, X.; Xie, Y.; Zhu, J.; Ma, Z.; Wang, J. Paenibacillus polymyxa BFKC01 enhances plant iron absorption via improved root systems and activated iron acquisition mechanisms. Plant Physiol. Biochem. PPB 2016, 105, 162–173. [Google Scholar] [CrossRef]
  77. Soares, F.L.; Melo, I.S.; Dias, A.C.F.; Andreote, F.D. Cellulolytic bacteria from soils in harsh environments. World J. Microbiol. Biotechnol. 2012, 28, 2195–2203. [Google Scholar] [CrossRef] [PubMed]
  78. Thakur, V.; Kumar, V.; Kumar, S.; Singh, D. Diverse culturable bacterial communities with cellulolytic potential revealed from pristine habitat in Indian trans-Himalaya. Can. J. Microbiol. 2018, 64, 798–808. [Google Scholar] [CrossRef]
  79. Gunathilake, K.M.D.; Ratnayake, R.R.; Kulasooriya, S.A.; Karunaratne, D.N. Evaluation of cellulose degrading efficiency of some fungi and bacteria and their biofilms. J. Natl. Sci. Found. Sri Lanka 2013, 41, 155. [Google Scholar] [CrossRef]
  80. Rabha, J.; Devi, S.P.; Das, S.; Roy, N.; Jha, D.K. Chapter 3—Microbial conversion of biomass to value-added chemicals. In Value-Addition in Agri-food Industry Waste Through Enzyme Technology; Kuddus, M., Ramteke, P., Eds.; Academic Press: Cambridge, MA, USA, 2023; pp. 37–64. ISBN 978-0-323-89928-4. [Google Scholar]
  81. Trujillo-Cabrera, Y.; Ponce-Mendoza, A.; Vásquez-Murrieta, M.S.; Rivera-Orduña, F.N.; Wang, E.T. Diverse cellulolytic bacteria isolated from the high humus, alkaline-saline chinampa soils. Ann. Microbiol. 2013, 63, 779–792. [Google Scholar] [CrossRef]
  82. Srinivasan, R.; Prabhu, G.; Prasad, M.; Mishra, M.; Chaudhary, M.; Srivastava, R. Chapter 32—Penicillium. In Beneficial Microbes in Agro-Ecology; Amaresan, N., Senthil Kumar, M., Annapurna, K., Kumar, K., Sankaranarayanan, A., Eds.; Academic Press: Cambridge, MA, USA, 2020; pp. 651–667. ISBN 978-0-12-823414-3. [Google Scholar]
  83. Pimenta, R.S.; Monteiro dos Santos Baliza, D.D.; Moreira da Silva, J.F. Chapter 30—Aspergillus. In Beneficial Microbes in Agro-Ecology; Amaresan, N., Senthil Kumar, M., Annapurna, K., Kumar, K., Sankaranarayanan, A., Eds.; Academic Press: Cambridge, MA, USA, 2020; pp. 611–624. ISBN 978-0-12-823414-3. [Google Scholar]
  84. Stephanopoulos, G.N.; Aristidou, A.A.; Nielsen, J. Chapter 6—Examples of Pathway Manipulations: Metabolic Engineering in Practice. In Metabolic Engineering; Stephanopoulos, G.N., Aristidou, A.A., Nielsen, J., Eds.; Academic Press: San Diego, CA, USA, 1998; pp. 203–283. ISBN 978-0-12-666260-3. [Google Scholar]
  85. Hardy, A.; Kever, L.; Frunzke, J. Antiphage small molecules produced by bacteria—Beyond protein-mediated defenses. Trends Microbiol. 2023, 31, 92–106. [Google Scholar]
  86. Gemechu, G.W. Antibiotics Production from Fungi. Adv. Biotechnol. Microbiol. 2024, 18, 001–004. [Google Scholar] [CrossRef]
  87. Demain, A.L. Importance of microbial natural products and the need to revitalize their discovery. J. Ind. Microbiol. Biotechnol. 2014, 41, 185–201. [Google Scholar] [CrossRef]
  88. Roberts, J.M. Antibiotic Substances Produced by Species of Cephalosporium, with a Description of a New Species. Mycologia 1952, 44, 292–306. [Google Scholar] [CrossRef]
  89. Ngo, M.T.; Van Nguyen, M.; Han, J.W.; Kim, B.; Kim, Y.K.; Park, M.S.; Kim, H.; Choi, G.J. Biocontrol Potential of Aspergillus Species Producing Antimicrobial Metabolites. Front. Microbiol. 2021, 12, 804333. [Google Scholar] [CrossRef] [PubMed]
  90. Zhou, L.; Song, C.; Li, Z.; Kuipers, O.P. Antimicrobial activity screening of rhizosphere soil bacteria from tomato and genome-based analysis of their antimicrobial biosynthetic potential. BMC Genomics 2021, 22, 29. [Google Scholar] [CrossRef]
  91. Schütze, E.; Klose, M.; Merten, D.; Nietzsche, S.; Senftleben, D.; Roth, M.; Kothe, E. Growth of streptomycetes in soil and their impact on bioremediation. J. Hazard. Mater. 2014, 267, 128–135. [Google Scholar] [CrossRef]
  92. Dell’ Anno, F.; Rastelli, E.; Sansone, C.; Brunet, C.; Ianora, A.; Dell’ Anno, A. Bacteria, Fungi and Microalgae for the Bioremediation of Marine Sediments Contaminated by Petroleum Hydrocarbons in the Omics Era. Microorganisms 2021, 9, 1695. [Google Scholar] [CrossRef]
  93. Perpetuini, G.; Nzobouh Fossi, P.A.; Kwak, S.; Namessi, O.; Petchkongkaew, A.; Tofalo, R.; Waché, Y. Pesticides in Foods: Towards Bioremediation Biocatalysts? Catalysts 2023, 13, 1055. [Google Scholar] [CrossRef]
  94. Kundu, D.; Hazra, C.; Chaudhari, A. Bioremediation Potential of Rhodococcus pyridinivorans NT2 in Nitrotoluene-Contaminated Soils: The Effectiveness of Natural Attenuation, Biostimulation and Bioaugmentation Approaches. Soil Sediment Contam. Int. J. 2016, 25, 637–651. [Google Scholar] [CrossRef]
  95. Bolton, S.L.; Brannen, P.M.; Glenn, A.E. A Novel Population of Fusarium fujikuroi Isolated from Southeastern U.S. Winegrapes Reveals the Need to Re-Evaluate the Species’ Fumonisin Production. Toxins 2016, 8, 254. [Google Scholar] [CrossRef] [PubMed]
  96. de Souza, R.; Ambrosini, A.; Passaglia, L.M.P. Plant growth-promoting bacteria as inoculants in agricultural soils. Genet. Mol. Biol. 2015, 38, 401–419. [Google Scholar]
  97. Wani, F.; Ahmad, D.; Ali, T.; Mushtaq, A. Role of Microorganisms in Nutrient Mobilization and Soil Health—A Review. J. Pure Appl. Microbiol. 2015, 9, 1401–1410. [Google Scholar]
  98. Misra, V.; Ansari, M.I. Role of Trichoderma in Agriculture and Disease Management. In Plant Growth-Promoting Microbes for Sustainable Biotic and Abiotic Stress Management; Mohamed, H.I., El-Beltagi, H.E.-D.S., Abd-Elsalam, K.A., Eds.; Springer International Publishing: Cham, Switzerland, 2021; pp. 425–440. ISBN 978-3-030-66587-6. [Google Scholar]
  99. Vio, S.A.; García, S.S.; Casajus, V.; Arango, J.S.; Galar, M.L.; Bernabeu, P.R.; Luna, M.F. Chapter 15—Paraburkholderia. In Beneficial Microbes in Agro-Ecology; Amaresan, N., Senthil Kumar, M., Annapurna, K., Kumar, K., Sankaranarayanan, A., Eds.; Academic Press: Cambridge, MA, USA, 2020; pp. 271–311. ISBN 978-0-12-823414-3. [Google Scholar]
  100. Tsukanova, K.A.; Chebotar, V.K.; Meyer, J.J.M.; Bibikova, T.N. Effect of plant growth-promoting Rhizobacteria on plant hormone homeostasis. S. Afr. J. Bot. 2017, 113, 91–102. [Google Scholar]
  101. Ercole, T.G.; Kava, V.M.; Aluizio, R.; Pauletti, V.; Hungria, M.; Galli-Terasawa, L.V. Co-inoculation of Bacillus velezensis and Stenotrophomonas maltophilia strains improves growth and salinity tolerance in maize (Zea mays L.). Rhizosphere 2023, 27, 100752. [Google Scholar]
  102. Hossain, M.M.; Sultana, F.; Hossain, M.M.; Sultana, F. Application and Mechanisms of Plant Growth Promoting Fungi (PGPF) for Phytostimulation. In Organic Agriculture; IntechOpen: London, UK, 2020; ISBN 978-1-78984-669-0. [Google Scholar]
  103. Li, G.; Wei, M.; Wei, G.; Chen, Z.; Shao, Z. Efficient heterotrophic nitrification by a novel bacterium Sneathiella aquimaris 216LB-ZA1-12T isolated from aquaculture seawater. Ecotoxicol. Environ. Saf. 2023, 266, 115588. [Google Scholar] [CrossRef]
  104. Rahmeh, R.; Akbar, A.; Kumar, V.; Al-Mansour, H.; Kishk, M.; Ahmed, N.; Al-Shamali, M.; Boota, A.; Al-Ballam, Z.; Shajan, A.; et al. Insights into Bacterial Community Involved in Bioremediation of Aged Oil-Contaminated Soil in Arid Environment. Evol. Bioinforma. 2021, 17, 11769343211016887. [Google Scholar]
  105. Murindangabo, Y.T.; Kopecký, M.; Perná, K.; Nguyen, T.G.; Konvalina, P.; Kavková, M. Prominent use of lactic acid bacteria in soil-plant systems. Appl. Soil Ecol. 2023, 189, 104955. [Google Scholar]
  106. Chaudhary, S.; Sindhu, S.S.; Dhanker, R.; Kumari, A. Microbes-mediated sulphur cycling in soil: Impact on soil fertility, crop production and environmental sustainability. Microbiol. Res. 2023, 271, 127340. [Google Scholar] [CrossRef]
  107. Badalíková, B. Influence of Soil Tillage on Soil Compaction. In Soil Engineering; Dedousis, A.P., Bartzanas, T., Eds.; Springer: Berlin/Heidelberg, Germany, 2010; pp. 19–30. ISBN 978-3-642-03681-1. [Google Scholar]
  108. Hamza, M.; Anderson, W. Response of soil properties and grain yield to deep ripping and gypsum application in a compacted loamy sand soil contrasted with a sandy clay loam in Western Australia. Crop Pasture Sci. 2003, 54, 273–282. [Google Scholar]
  109. Peralta Ogorek, L.L.; Gao, Y.; Farrar, E.; Pandey, B.K. Soil compaction sensing mechanisms and root responses. Trends Plant Sci. 2024; ahead of print. [Google Scholar]
  110. Jin, K.; White, P.J.; Whalley, W.R.; Shen, J.; Shi, L. Shaping an Optimal Soil by Root–Soil Interaction. Trends Plant Sci. 2017, 22, 823–829. [Google Scholar] [CrossRef]
  111. Bengough, A.G. Water Dynamics of the Root Zone: Rhizosphere Biophysics and Its Control on Soil Hydrology. Vadose Zone J. 2012, 11, vzj2011.0111. [Google Scholar] [CrossRef]
  112. Munkholm, L.J.; Schjønning, P.; Jørgensen, M.H.; Thorup-Kristensen, K. Mitigation of subsoil recompaction by light traffic and on-land ploughing: II. Root and yield response. Soil Tillage Res. 2005, 80, 159–170. [Google Scholar]
  113. Sojnóczki, I.; Nagy, J.; Illés, Á.; Kecskés, I.; Bojtor, C. Comparative Analysis of Drought Effects on the Soil Moisture Level and Penetration Resistance in Conventional and Non-Conventional Tillage Systems in Maize Production. Agriculture 2024, 14, 1000. [Google Scholar] [CrossRef]
  114. Pingel, M.; Reineke, A.; Leyer, I. Disentangling the mixed effects of soil management on microbial diversity and soil functions: A case study in vineyards. Sci. Rep. 2023, 13, 3568. [Google Scholar]
  115. Casazza, G.; Lumini, E.; Ercole, E.; Dovana, F.; Guerrina, M.; Arnulfo, A.; Minuto, L.; Fusconi, A.; Mucciarelli, M. The abundance and diversity of arbuscular mycorrhizal fungi are linked to the soil chemistry of screes and to slope in the Alpic paleo-endemic Berardia subacaulis. PLoS ONE 2017, 12, e0171866. [Google Scholar]
  116. Wilkes, T.I. The influence of a soil amendment on the abundance and interaction of arbuscular mycorrhizal fungi with arable soils and host winter wheat. Access Microbiol. 2024, 6, 000581.v5. [Google Scholar] [CrossRef]
  117. Saeed, Q.; Xiukang, W.; Haider, F.U.; Kučerik, J.; Mumtaz, M.Z.; Holatko, J.; Naseem, M.; Kintl, A.; Ejaz, M.; Naveed, M.; et al. Rhizosphere Bacteria in Plant Growth Promotion, Biocontrol, and Bioremediation of Contaminated Sites: A Comprehensive Review of Effects and Mechanisms. Int. J. Mol. Sci. 2021, 22, 10529. [Google Scholar] [CrossRef]
  118. Franzluebbers, A.J. Soil depth distribution of particulate organic carbon and nitrogen in the southeastern United States. Agric. Environ. Lett. 2024, 9, e70005. [Google Scholar] [CrossRef]
  119. Ahmed, E.; Holmström, S.J.M. Siderophores in environmental research: Roles and applications. Microb. Biotechnol. 2014, 7, 196–208. [Google Scholar] [CrossRef]
  120. Van Goethem, M.W.; Pierneef, R.; Bezuidt, O.K.I.; Van De Peer, Y.; Cowan, D.A.; Makhalanyane, T.P. A reservoir of ‘historical’ antibiotic resistance genes in remote pristine Antarctic soils. Microbiome 2018, 6, 40. [Google Scholar]
  121. Abbas, F.; Siddique, T.; Fan, R.; Azeem, M. Role of Gypsum in Conserving Soil Moisture Macronutrients Uptake and Improving Wheat Yield in the Rainfed Area. Water 2023, 15, 1011. [Google Scholar] [CrossRef]
  122. Chaudhary, A.; Chaudhary, P.; Upadhyay, A.; Kumar, A.; Singh, A. Effect of Gypsum on Plant Growth Promoting Rhizobacteria. Environ. Ecol. 2021, 39, 1248–1256. [Google Scholar]
  123. Rashmi, I.; Meena, B.P.; Rajendiran, S.; Jayaraman, S.; Joshy, C.G.; Ali, S.; Mina, B.L.; Kumar, K.; Kumar, A.; Kumawat, A.; et al. Can gypsum and organic amendments achieve sustainability, productivity and maintain soil health under soybean-mustard cropping in sodic soils of western India. Soil Tillage Res. 2024, 240, 106075. [Google Scholar]
  124. Costa, J.L.; Aparicio, V.C.; Sallesses, L.F.; Frolla, F.D. Effect of tillage and application of gypsum In a No-Till field under supplementary irrigation with sodium bicarbonate waters. Agric. Water Manag. 2016, 177, 291–297. [Google Scholar]
  125. Khan, M.Z.; Azom, M.G.; Sultan, M.T.; Mandal, S.; Islam, M.A.; Khatun, R.; Billah, S.M.; Ali, A.H.M.Z. Amelioration of Saline Soil by the Application of Gypsum, Calcium Chloride, Rice Husk and Cow Dung. J. Agric. Chem. Environ. 2019, 8, 78–91. [Google Scholar]
  126. Green, H.; Larsen, P.; Koci, J.; Edwards, W.; Nelson, P.N. Long-term effects of gypsum on the chemistry of sodic soils. Soil Tillage Res. 2023, 233, 105780. [Google Scholar]
  127. Toma, M.; Sumner, M.E.; Weeks, G.; Saigusa, M. Long-term Effects of Gypsum on Crop Yield and Subsoil Chemical Properties. Soil Sci. Soc. Am. J. 1999, 63, 891–895. [Google Scholar]
  128. Sharma, M.K.; Kumar, M. Sulphate contamination in groundwater and its remediation: An overview. Environ. Monit. Assess. 2020, 192, 74. [Google Scholar]
  129. Jalali, M.; Rowell, D.L. Potassium leaching in undisturbed soil cores following surface applications of gypsum. Environ. Geol. 2009, 57, 41–48. [Google Scholar]
  130. Dubrovina, T.A.; Losev, A.A.; Karpukhin, M.M.; Vorobeichik, E.L.; Dovletyarova, E.A.; Brykov, V.A.; Brykova, R.A.; Ginocchio, R.; Yáñez, C.; Neaman, A. Gypsum soil amendment in metal-polluted soils—An added environmental hazard. Chemosphere 2021, 281, 130889. [Google Scholar]
  131. Choi, Y.; Ganzorig, M.; Lee, K. Analysis of the Genomes and Adaptive Traits of Skermanella cutis sp. nov., a Human Skin Isolate, and the Type Strains Skermanella rosea and Skermanella mucosa. Microorganisms 2025, 13, 94. [Google Scholar] [CrossRef] [PubMed]
  132. Shivaramu, S.; Tomasch, J.; Kopejtka, K.; Nupur; Saini, M.K.; Bokhari, S.N.H.; Küpper, H.; Koblížek, M. The Influence of Calcium on the Growth, Morphology and Gene Regulation in Gemmatimonas phototrophica. Microorganisms 2023, 11, 27. [Google Scholar]
  133. Chen, Y.; Yin, S.; Shao, Y.; Zhang, K. Soil bacteria are more sensitive than fungi in response to nitrogen and phosphorus enrichment. Front. Microbiol. 2022, 13, 999385. [Google Scholar]
  134. Jumpponen, A.; Jones, K.L. Tallgrass prairie soil fungal communities are resilient to climate change. Fungal Ecol. 2014, 10, 44–57. [Google Scholar]
  135. Wan, Q.; Li, L.; Liu, B.; Zhang, Z.; Liu, Y.; Xie, M. Different and unified responses of soil bacterial and fungal community composition and predicted functional potential to 3 years’ drought stress in a semiarid alpine grassland. Front. Microbiol. 2023, 14, 1104944. [Google Scholar]
  136. Jaeger, A.C.H.; Hartmann, M.; Six, J.; Solly, E.F. Contrasting sensitivity of soil bacterial and fungal community composition to one year of water limitation in Scots pine mesocosms. FEMS Microbiol. Ecol. 2023, 99, fiad051. [Google Scholar]
  137. D’Hose, T.; Molendijk, L.; Van Vooren, L.; van den Berg, W.; Hoek, H.; Runia, W.; van Evert, F.; ten Berge, H.; Spiegel, H.; Sandèn, T.; et al. Responses of soil biota to non-inversion tillage and organic amendments: An analysis on European multiyear field experiments. Pedobiologia 2018, 66, 18–28. [Google Scholar]
  138. Pelosi, C.; Pey, B.; Hedde, M.; Caro, G.; Capowiez, Y.; Guernion, M.; Peigné, J.; Piron, D.; Bertrand, M.; Cluzeau, D. Reducing tillage in cultivated fields increases earthworm functional diversity. Appl. Soil Ecol. 2014, 83, 79–87. [Google Scholar]
  139. Zhang, L.; Ge, A.-H.; Tóth, T.; Yang, F.; Wang, Z.; An, F. Enrichment of keystone fungal taxa after flue gas desulphurization gypsum application drives reclamation of the saline-sodic soil. Land Degrad. Dev. 2023, 34, 2276–2287. [Google Scholar]
  140. Lu, G.; Feng, Z.; Xu, Y.; Jin, Y.; Zhang, G.; Hu, J.; Yu, T.; Wang, M.; Liu, M.; Yang, H.; et al. Impact of Phosphogypsum Application on Fungal Community Structure and Soil Health in Saline–Alkali-Affected Paddy Fields. Agronomy 2023, 13, 2726. [Google Scholar] [CrossRef]
  141. Zhao, H.; Zheng, W.; Zhang, S.; Gao, W.; Fan, Y. Soil microbial community variation with time and soil depth in Eurasian Steppe (Inner Mongolia, China). Ann. Microbiol. 2021, 71, 21. [Google Scholar]
  142. Fernandez, M.R.; Abdellatif, L.; Lokuruge, P.; Schellenberg, M.P.; Lupwayi, N.Z. Root disease and fungal populations in organic crops under different tillage–cropping systems. Crop Sci. 2022, 62, 1288–1304. [Google Scholar]
  143. Jenkinson, P.; Parry, D. Isolation of Fusarium Species from Common Broad-Leaved Weeds and Their Pathogenicity to Winter-Wheat. Mycol. Res. 1994, 98, 776–780. [Google Scholar]
Figure 1. Experimental area. The figure illustrates the application of six different soil treatment methods (M1–M6), where M1 is soil ploughing and soil loosening; M2 is gypsum, soil loosening, and soil ploughing; M3 is gypsum and soil loosening; M4 is soil loosening; M5 is gypsum and soil disking; and M6 is control (soil disking). These treatments were analyzed across three distinct soil levels (A soil level: 0–35 cm; B soil level: 36–60 cm; C soil level: >60 cm).
Agriculture 15 00658 g001
Figure 2. Changes in DNA concentrations at different soil levels. Bar plots show the differences in DNA concentrations between the methods (M), at three soil levels (A, B, C). The red dashed lines indicate the DNA concentration average of the settings corresponding to the soil levels. Asterisks indicate significant differences between A vs. B and A vs. C soil levels, ** p < 0.01.
Agriculture 15 00658 g002
Figure 3. The effect of different tillage methods combined with gypsum amendment on soil penetration resistance (N/m2). In panel (a), the line plots illustrate the variation in penetration resistance (y axis) across the different soil depths (x axis). The different line colors represent the six tillage methods (M1–M6). In panel (b), the bar plots highlight the differences in penetration average (y axis) within the three soil levels (A, B, C) under the six different tillage methods (x axis). Asterisks indicate significant differences, with ** p < 0.01, and *** p < 0.001. Comparisons were performed between the control and all other methods.
Agriculture 15 00658 g003
Figure 4. Variations in microbial community abundance at soil level A. The composite heat map displays the log2 ratios of microbial taxa across phylum, class, order, family, genus, and species levels in soil layer A, representing the top 20 species in both bacterial and fungal communities. Differences are visualized on a log scale as the logarithm of soil M1/M3. Differences are illustrated with gradient colors, where the red scale represents the dominance of taxa in method M1, whereas the blue scale represents the taxa dominant in method M3. Lines connect related taxa.
Agriculture 15 00658 g004
Figure 5. Changes in the functional groups of the microbiome. The area plots display the relative abundance (y axis) of functional genera across different conditions: soil depth, gypsum amendment, and tillage methods (x axis). The area plots display the samples in descending order. The area under the curve (AUC) was normalized to the highest value that represents 100%. Genera included in this analysis can be found in Table S1 in the Supplementary Materials [65,66,67,68,69,70,71,72,73,74,75,76,77,78,79,80,81,82,83,84,85,86,87,88,89,90,91,92,93,94,95,96,97,98,99,100,101,102].
Agriculture 15 00658 g005
Figure 6. Changes in chemical parameters for treatments. The bar plots show the differences calculated between applied gypsum and non-applied gypsum soil samples (x axis) from three soil levels (A, B, C) for different chemical parameters (y axis: (a) Exchangeable Na+, (b) exchangeable Mg2+, (c) exchangeable Ca+, (d) KCl exchangeable SO4−S, (e) Na2CO3, (f) pH). Asterisks indicate significant differences between applied gypsum and non-applied gypsum samples, with * p < 0.05, ** p < 0.01, and *** p < 0.001.
Agriculture 15 00658 g006
Figure 7. Correlations between chemical parameters and taxonomic species in gypsum-amended areas. The polar plots display the relationships between chemical parameters and microbial communities ((a) bacteria, (b) fungi), focusing on the top 15 species, which are labeled with numbers 1–15. Positive correlations are represented by blue and green, while negative correlations are indicated by yellow and red. Correlation values for each species are shown at the edges of the plots.
Agriculture 15 00658 g007
Figure 8. Alpha diversity in different settings. The box plots visualize soil diversity under different settings: gypsum amendment (Shannon index), tillage methods (Shannon index), and soil levels (Chao index). Panels (ac) represent bacterial community diversity, while panels (df) represent fungal community diversity in the soil samples. Asterisks indicate significant differences, with * p < 0.05.
Agriculture 15 00658 g008
Figure 9. Significant changes in genus taxonomic level. In panel (a), the volcano plots illustrate the significantly different genera between different settings, where those showing changes in reduced tillage are colored with yellow, those in conventional tillage are colored with purple, those in soils with gypsum application are marked with red, and those in soils with non-gypsum application are marked with green. Gray dots represent genera that did not change significantly between settings. The x axis represents the logarithm of fold change (log2(FC)), which is significant when log2(FC) > 2 or log2(FC) < −2, while the y axis represents the logarithm of statistical significance (p value) (−log10(p)), which is significant when log10(p) > 1.3. In panel (b), the horizontal bar plots represent the highest absolute fold change changes in each setting.
Agriculture 15 00658 g009
Table 1. Chemical parameters of soil.
Soil Properties Analyzed 1Measured Parameters
A Soil LevelB Soil LevelC Soil Level
Arany’s plasticity index567380
Bulk density (g/cm3)1.3671.4851.472
Humus content (w/w%)2.071.170.46
Na2CO3 content (w/w%)<0.20.0330.72
CaCO3 content (w/w%)0.0863.87.16
pH (KCl)5.757.738.11
pH (H2O)7.258.379.05
Exchangeable K+ (meq/100 g)0.5320.5220.501
Exchangeable Mg2+ (meq/100 g)5.4312.1117.8
Exchangeable Ca2+ (cmolc/kg)16.5184.5171
Exchangeable Na+ (meq/100 g)1.875.118.22
1 Different chemical parameters of soil analyzed at three soil levels: A 0–35 cm, B 36–60 cm, C 61–90 cm.
Table 2. Metrics of the nanopore sequencing run (16S).
Parameters 16SMetrics
Total yield2.91 Gb
Read lengthN50 = 1620 bp
Number of reads
Total1,770,000
Pass1,248,244
Average reads per sample (min–max)104,020 (45,146–227,130)
Reads mapped to reference1,245,630
Average reads per amplicon (min–max)1583 (134.3–18,265.5)
Mean qscore9.7
Table 3. Metrics of the nanopore sequencing run (ITS).
Parameters ITSMetrics
Total yield2.27 Gb
Read lengthN50 = 927 bp
Number of reads
Total2,140,000
Pass1,612,448
Average reads per sample (min–max)134,371 (49,696–175,370)
Reads mapped to reference1,575,532
Average reads per amplicon (min–max)963.3 (112.7–9437.3)
Mean qscore13.3
Disclaimer/Publisher’s Note: The statements, opinions and data contained in all publications are solely those of the individual author(s) and contributor(s) and not of MDPI and/or the editor(s). MDPI and/or the editor(s) disclaim responsibility for any injury to people or property resulting from any ideas, methods, instructions or products referred to in the content.

