1. Introduction
Agricultural industry–university–research (I-U-R) collaborative innovation is an important component of China’s agricultural science and technology (sci-tech) reform in the new era. It represents a key initiative to advance the national innovation-driven development strategy, achieve breakthroughs in core agricultural technologies, facilitate the transformation of scientific and technological achievements, and deepen supply-side structural reforms in agriculture [
1,
2]. Since the 2012 Central No. 1 Document called for breaking down institutional and disciplinary barriers, integrating scientific resources, and establishing collaborative innovation mechanism, multiple national policies have been introduced to promote such cooperation. The 14th Five-Year Plan for National Agricultural and Rural Science and Technology Development in 2021 emphasized establishing long-term collaborative mechanisms to strengthen coordination among diverse entities and deepen I-U-R integration. In 2025, seven ministries, such as the Ministry of Agriculture and Rural Affairs, the Ministry of Science and Technology, and the Ministry of Education, jointly, issued guidelines aimed at improving the agricultural sci-tech innovation system, highlighting better coordinating resources from research institutes, universities, and enterprises to boost teamwork in innovation.
However, due to the inherent instability of I-U-R, the public-good nature, dual risks of agricultural technological innovation, and the urban–rural institutional barriers hindering the flow of innovation factors, China’s agricultural I-U-R collaborative innovation continues to suffer from short-term engagements, weak incentives, low resource attractiveness, and poor factor mobility [
3]. Consequently, such collaborations are long confined to a “short, superficial, and rapid” model, dominated by technology adaptation and introduction [
4], lagging far behind the innovation synergy observed in high-tech manufacturing and service industries [
5]. In this context, breaking down barriers among diverse entities, effectively integrating resources, and establishing a coordinated and efficient system covering the entire process from R&D and commercialization to dissemination and application have become urgent issues in China’s agricultural sci-tech innovation management.
The agricultural I-U-R collaborative innovation network serves as a critical vehicle for such cooperation, and its enhancement hinges on network optimization. Against the backdrop of open innovation, agricultural enterprises, universities, and research institutes have engaged in cross-sector, trans-regional, and interdisciplinary collaborations, forming a complex and interconnected collaborative network. However, the network, still exhibits limited scale, suboptimal structure, and weak relational stability [
6]. These problems stem not only from practical constraints such as resource misallocation, institutional gaps, and disparate capacity among entities but also from an insufficient understanding of the complex nonlinear interactions within the network. There is still a lack of systematic analysis of the internal dynamics and the mechanism through which external interventions influence the network’s evolution.
Current research on the operation mechanism of collaborative innovation networks primarily focuses on areas such as the dual-mechanism network operation model involving carbon taxes and subsidies [
7], the operation mechanism of civil–military integrated industry collaboration networks [
8], and the operation mechanism of collaborative innovation networks in marine ranch technological innovation [
9]. However, the operational processes of collaborative innovation networks are highly complex and do not necessarily follow a linear evolution. They may exhibit leapfrog development via phase transitions. Although the aforementioned studies touch upon the complexity of network operations, they are largely grounded in traditional static analyses or linear models. These approaches overlook the dynamic and systemic nature of closed-loop network operations, thus failing to meet the research needs for understanding network trends and underlying patterns.
With the growing academic emphasis on interdisciplinary research, some scholars begin to develop models capable of simulating complex systems to conduct in-depth investigations [
10]. They observe that certain chemical reactions exhibit characteristics such as self-organization, order, and periodicity, resembling the behavior of complex systems. This has led to the introduction of the B-Z reaction model to study complex systems grounded within synergy theory.
In the field of enterprise management, Zhang et al. were the first to construct a dynamic model with three dimensions, including operational status, scale status, and profitability status, to quantitatively describe enterprise systems and analyze their collaborative operation mechanism [
11]. Li et al. extended this approach to the supply chain domain, revealing the dynamic collaborative mechanism among integrated supply chain enterprises across three dimensions, including supply chain integration degree, knowledge synergy capability, and cooperative innovation performance [
12]. Building on this foundation, research on I-U-R collaborative innovation expanded. Xiang et al. focused on the knowledge flow process in universities, establishing a dynamic model composed of knowledge production capacity, knowledge dissemination capacity, and knowledge transfer capacity to examine the operation mechanism of these three capability subsystems in I-U-R collaborative innovation process [
13]. Ye et al. introduced policy variables and explored the dynamic operation mechanism of I-U-R collaborative innovation across three aspects: enterprise knowledge absorption capacity, university knowledge transfer capacity, and innovation performance [
14]. Research on innovation systems places greater emphasis on macro-level performance evaluation. Su et al. conducted an empirical study of the collaborative operation model of regional innovation systems across three dimensions: innovation potential, innovation allocation, and innovation effectiveness [
15]. Wang et al. investigated the innovation synergy effects among three innovation elements: innovation allocation, innovation output, and innovation potential in national agricultural innovation systems [
16]. Xu et al. revealed the synergistic mechanism among elements within the innovation and entrepreneurship ecosystem across three dimensions: the university innovation talent index, government resource allocation efficiency, and enterprise technological innovation level [
17].
While research on the operation mechanism of collaborative innovation networks has progressed across multiple domains, existing research remains limited by the following limitations. First, studies specifically focusing on agricultural I-U-R collaborative innovation networks remain underdeveloped, predominantly relying on static analyses or linear modeling approaches that are unable to capture the potential nonlinear transition behaviors in network operation. Second, current conceptual frameworks generally lack a systemic closed-loop perspective, thereby failing to comprehensively characterize the dynamic processes of network operation. Third, existing investigations are predominantly confined to single-network paradigms, lacking comparative analysis of operational mechanisms across different network types within agricultural I-U-R collaboration, while also demonstrating limited connectivity between theoretical constructs and practical policy implementation.
Based on these, the contributions of this paper are threefold: First, it introduces a novel theoretical framework by applying the B-Z reaction model to agricultural I-U-R collaboration. This approach moves beyond traditional static or linear analyses, establishing an operational network model that captures the system’s nonlinear, self-organizing dynamics. The model thus offers both a theoretical explanation and an empirical tool for studying these innovation networks. Second, it innovatively constructs a dynamic network operation model with a closed-loop structure. Grounded in the operational logic of the agricultural I-U-R collaborative innovation network, conceptualized as a foundation–process–outcome sequence, the model integrates three critical dimensions: structure embeddedness, resource flow, and innovation output. This tripartite framework resolves the lack of systematic integration in the existing literature, offering a more holistic and accurate representation of the innovation process. Third, it advances beyond conventional single-network studies by systematically comparing the paper, patent, and variety networks. This comparison clearly delineates their distinct operational patterns and heterogeneous needs for government support. Through simulation, it further reveals each network’s dynamic response to varying levels of government support and trends in entity activity. These findings are synthesized into a “dual-wheel” drive matrix, which provides a quantitative analytical method to guide strategic entity realignment and targeted government policymaking.
2. Theoretical Background
2.1. Operation Mechanism Analysis of Agricultural I-U-R Collaborative Innovation Network
Social network theory posits that a network is a set of nodes and the social relationships between them [
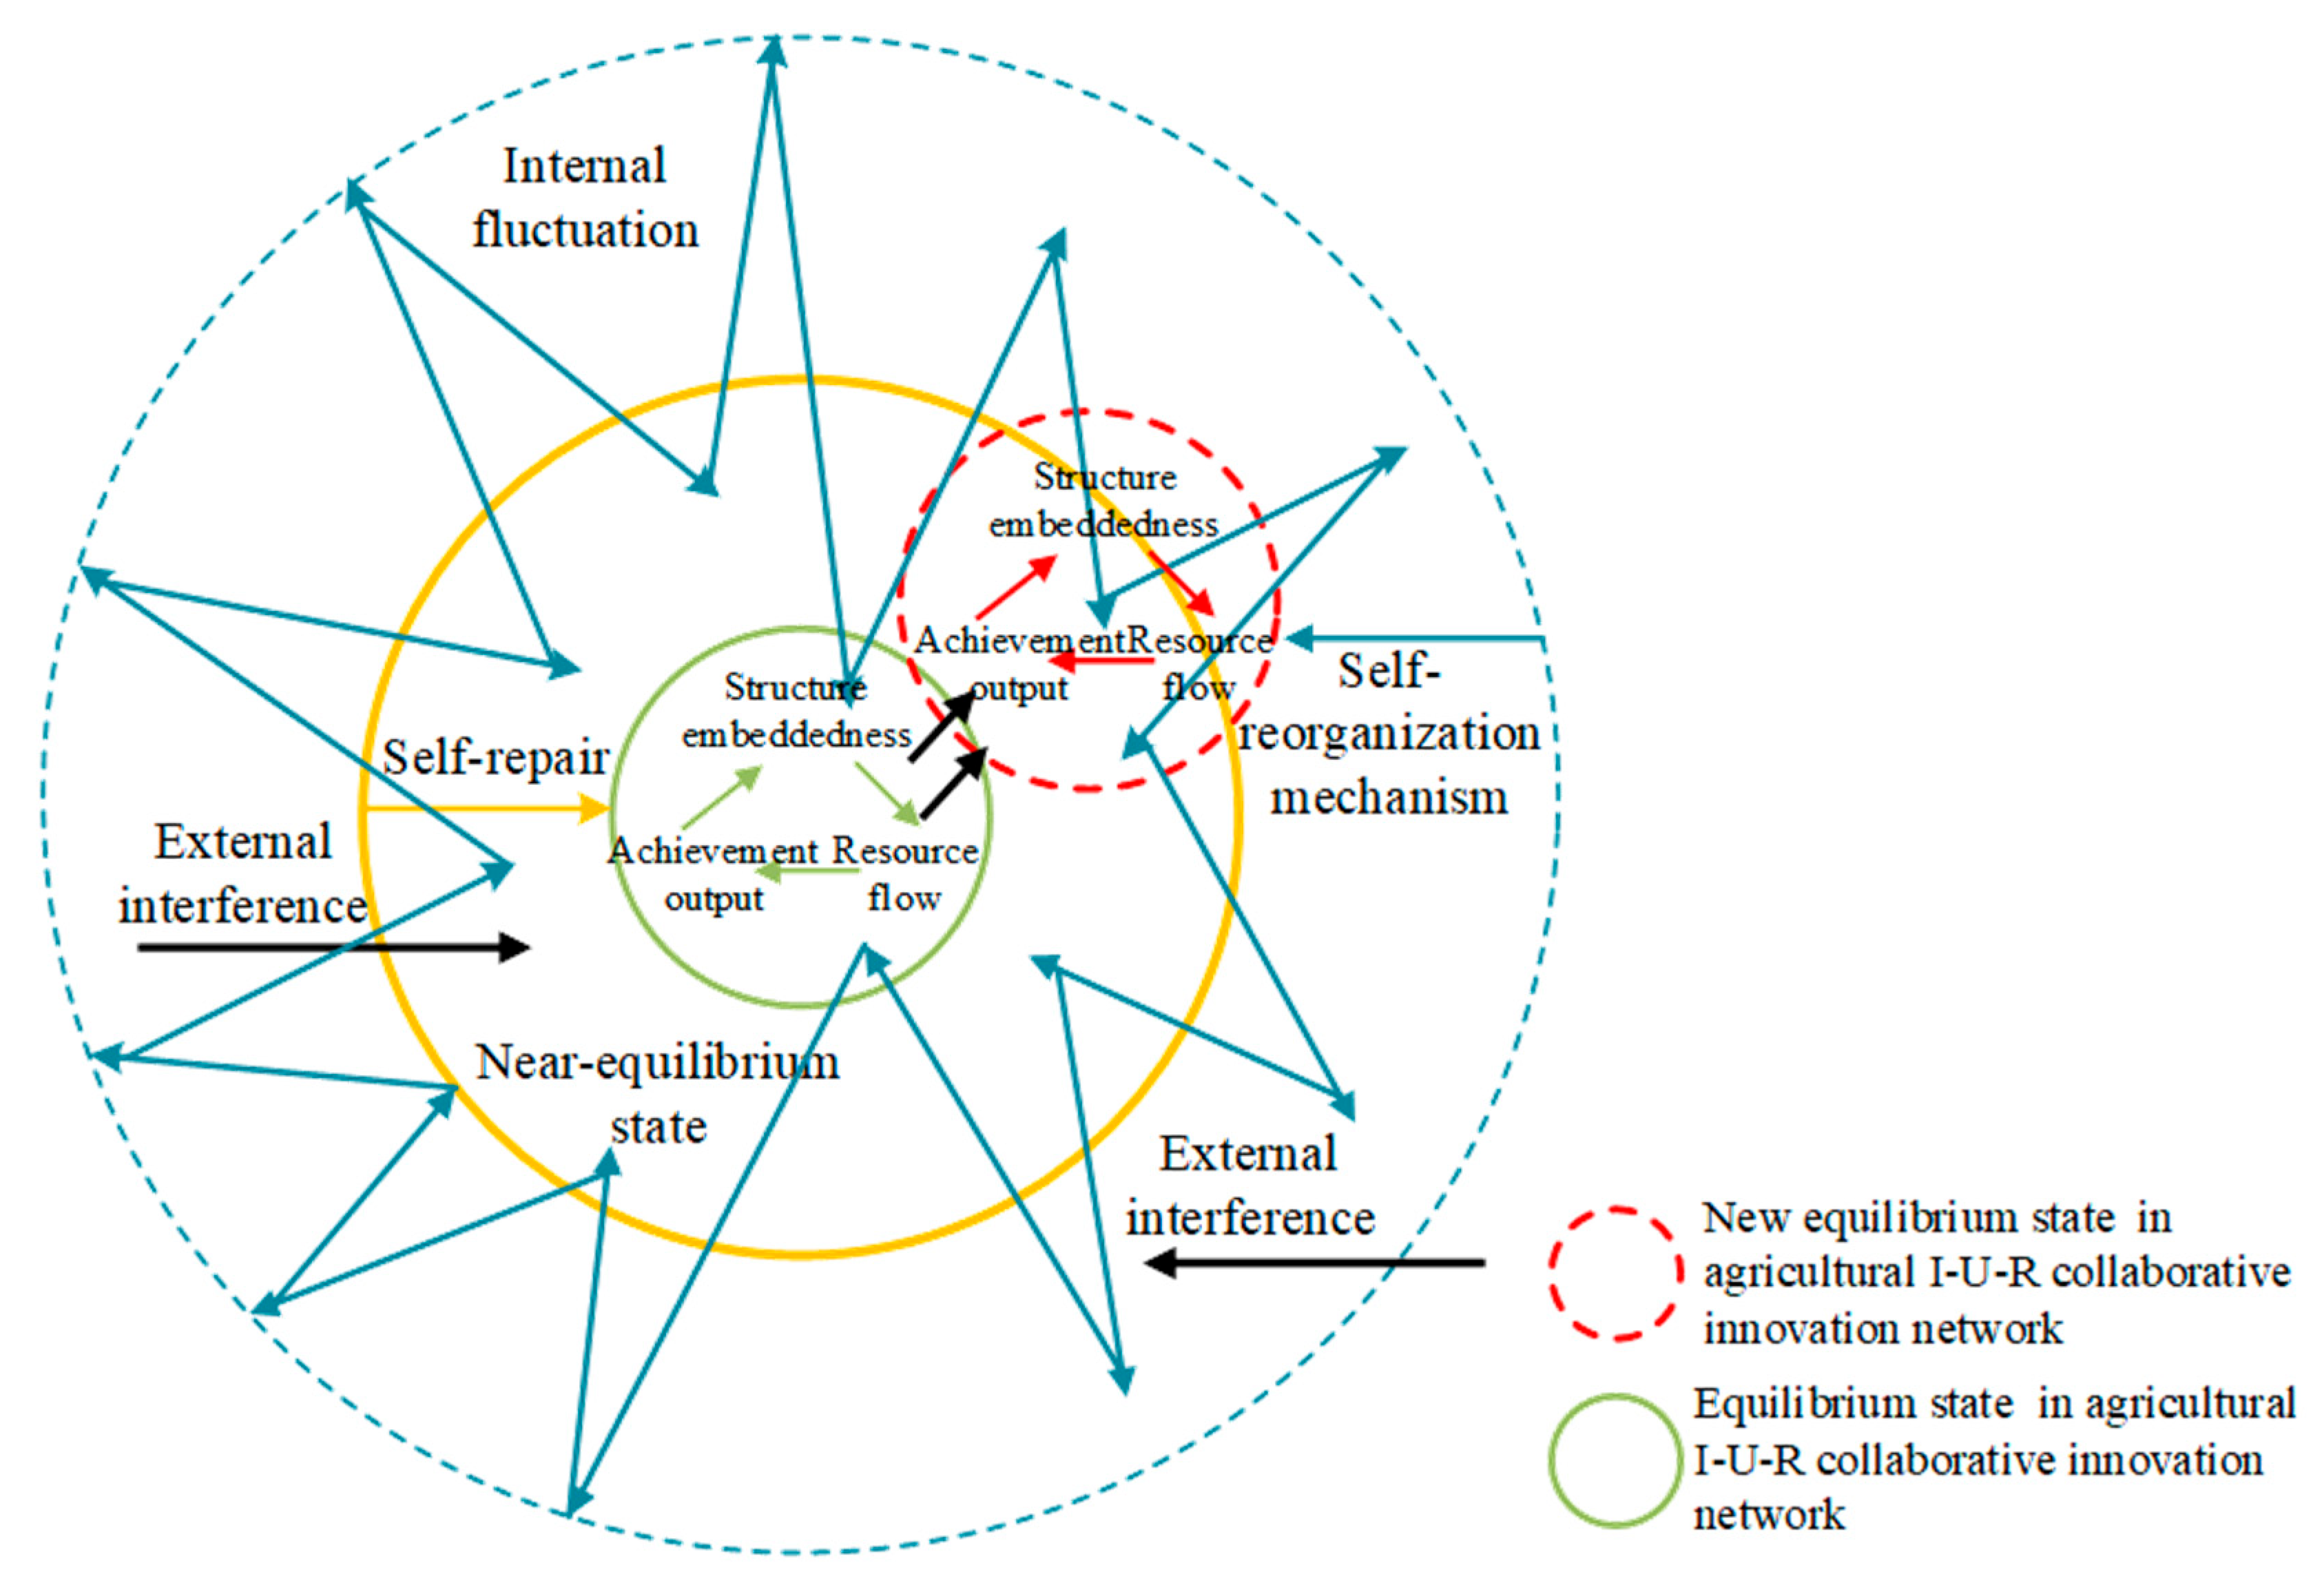
18]. We define the agricultural I-U-R collaborative innovation network as a collection of collaborative relationships formed through collaborative interactions among agricultural technology innovation entities, including agricultural enterprises, universities, and research institutions, that transcend organizational and regional boundaries. In this network, as collaborative innovation activities continue continuously, heterogeneous resources (e.g., knowledge, technology, expertise, and funds) flow among entities along network chains, sustaining the network’s operation. The operation mechanism of the agricultural I-U-R collaborative innovation network is defined herein as the operational principles and modalities through which each entity integrates heterogeneous resources from others with its own resources, based on its capacity to control and allocate resources, to jointly generate agricultural innovation outcomes. The network’s operation mechanism is illustrated in
Figure 1.
As a complex system, its operational process aligns with the characteristics of complex system dynamics. However, the internal elements of China’s agricultural I-U-R collaborative innovation network remain underdeveloped, leaving the network in a chaotic, disordered state far from equilibrium. This implies that entities have greater opportunities to establish connections with others and gradually shift toward positions with more prominent information and resource advantages [
19]. In this context, the agricultural I-U-R collaborative innovation network follows a self-organization mechanism. Its evolution from an equilibrium state to a new, higher-level equilibrium state is driven by the interplay of external disturbances and internal fluctuations.
External disturbances primarily manifest as institutional interventions, with government funding and policy support constituting the core sources of disturbance. These interventions disrupt the networks’ pre-existing equilibrium by altering resource constraints and interaction protocols among entities. Internal fluctuations arise from stochastic variations in the network’s core variables: shifts in structure embeddedness, changes in resource flow, and variances in achievement output. Specifically, entities occupying advantageous positions leverage their inherent strengths to absorb, integrate, and process inflowing heterogeneous resources, thereby altering their positions within the network [
20]. This process attracts other heterogeneous entities to engage in collaborative innovation, collectively generating outcomes that sustain network operations. These innovation outcomes recirculate among entities as direct resources, while also being integrated into the network as indirect resources through modifications to the external environment and other resource pools. This positive feedback loop drives the network to undergo a phase transition, ultimately forming a new equilibrium state characterized by a higher degree of order.
2.2. Metaphor Between the B-Z Reaction and the Operation Mechanism of the Agricultural I-U-R Collaborative Innovation Network
In studying the operation of innovation network, scholars realize that traditional methods of qualitative description and reasoning are inadequate for investigating the operational trends and underlying principles of complex systems. Consequently, some scholars begin constructing models capable of simulating the behavior of complex systems to enable more in-depth investigations [
10]. They observe that chemical reactions between certain substances often exhibit characteristics such as self-organization, sequentially, and periodicity, which resemble the operational features of complex systems. This insight led to the introduction of the B-Z reaction for examining the operational dynamics of complex systems [
11,
12,
14,
15].
The B-Z reaction, also known as the Belousov–Zhabotinsky reaction, serves as a theoretical and experimental template for investigating nonlinear behaviors in chemical reaction systems far from equilibrium. In the B-Z reaction, three key species, such as Br
−, HBrO
2, and Ce(Ⅳ), play pivotal roles. Its reaction mechanism comprises three core sub-processes, including the consumption of Br
−, the autocatalysis of HBrO
2, and the regeneration of Br
−, as shown in Equation (1). Briefly, as Br
− is consumed, their concentration gradually decreases until a critical threshold is reached. Beyond this threshold, the autocatalytic reaction of the second stage and the cyclic reaction of the third stage are triggered, leading to the regeneration of Br
−. This reaction restores the concentration of bromide ions to the threshold, resulting in a periodic red–blue alternating pattern [
21].
Drawing on the characteristics of the B-Z reaction, specifically the spatially irregular self-organized motion of its microscopic chemical species, and the formation of ordered spatial structures through periodicity under threshold concentration conditions, scholars widely adopt a metaphorical approach to characterize and describe complexity. China’s current agricultural I-U-R collaborative innovation network remains far from equilibrium, exhibiting operational characteristics of complex systems such as disordered oscillations, non-equilibrium, and nonlinearity. As a typical nonlinear chemical oscillatory reaction, the B-Z reaction’s feature of “spatially irregular self-organized motion of microscopic chemical species” aligns with the network. Additionally, the agricultural I-U-R collaborative innovation network is influenced by multiple factors, including external environmental elements, network structure embeddedness, partner heterogeneity, and collaborative innovation outputs. When external disturbances and internal fluctuations exceed a critical threshold, the network evolves from one equilibrium state to a higher-level equilibrium state. This is consistent with the B-Z reaction’s characteristic of “exhibiting periodicity to form ordered spatial structures under threshold concentration conditions”.
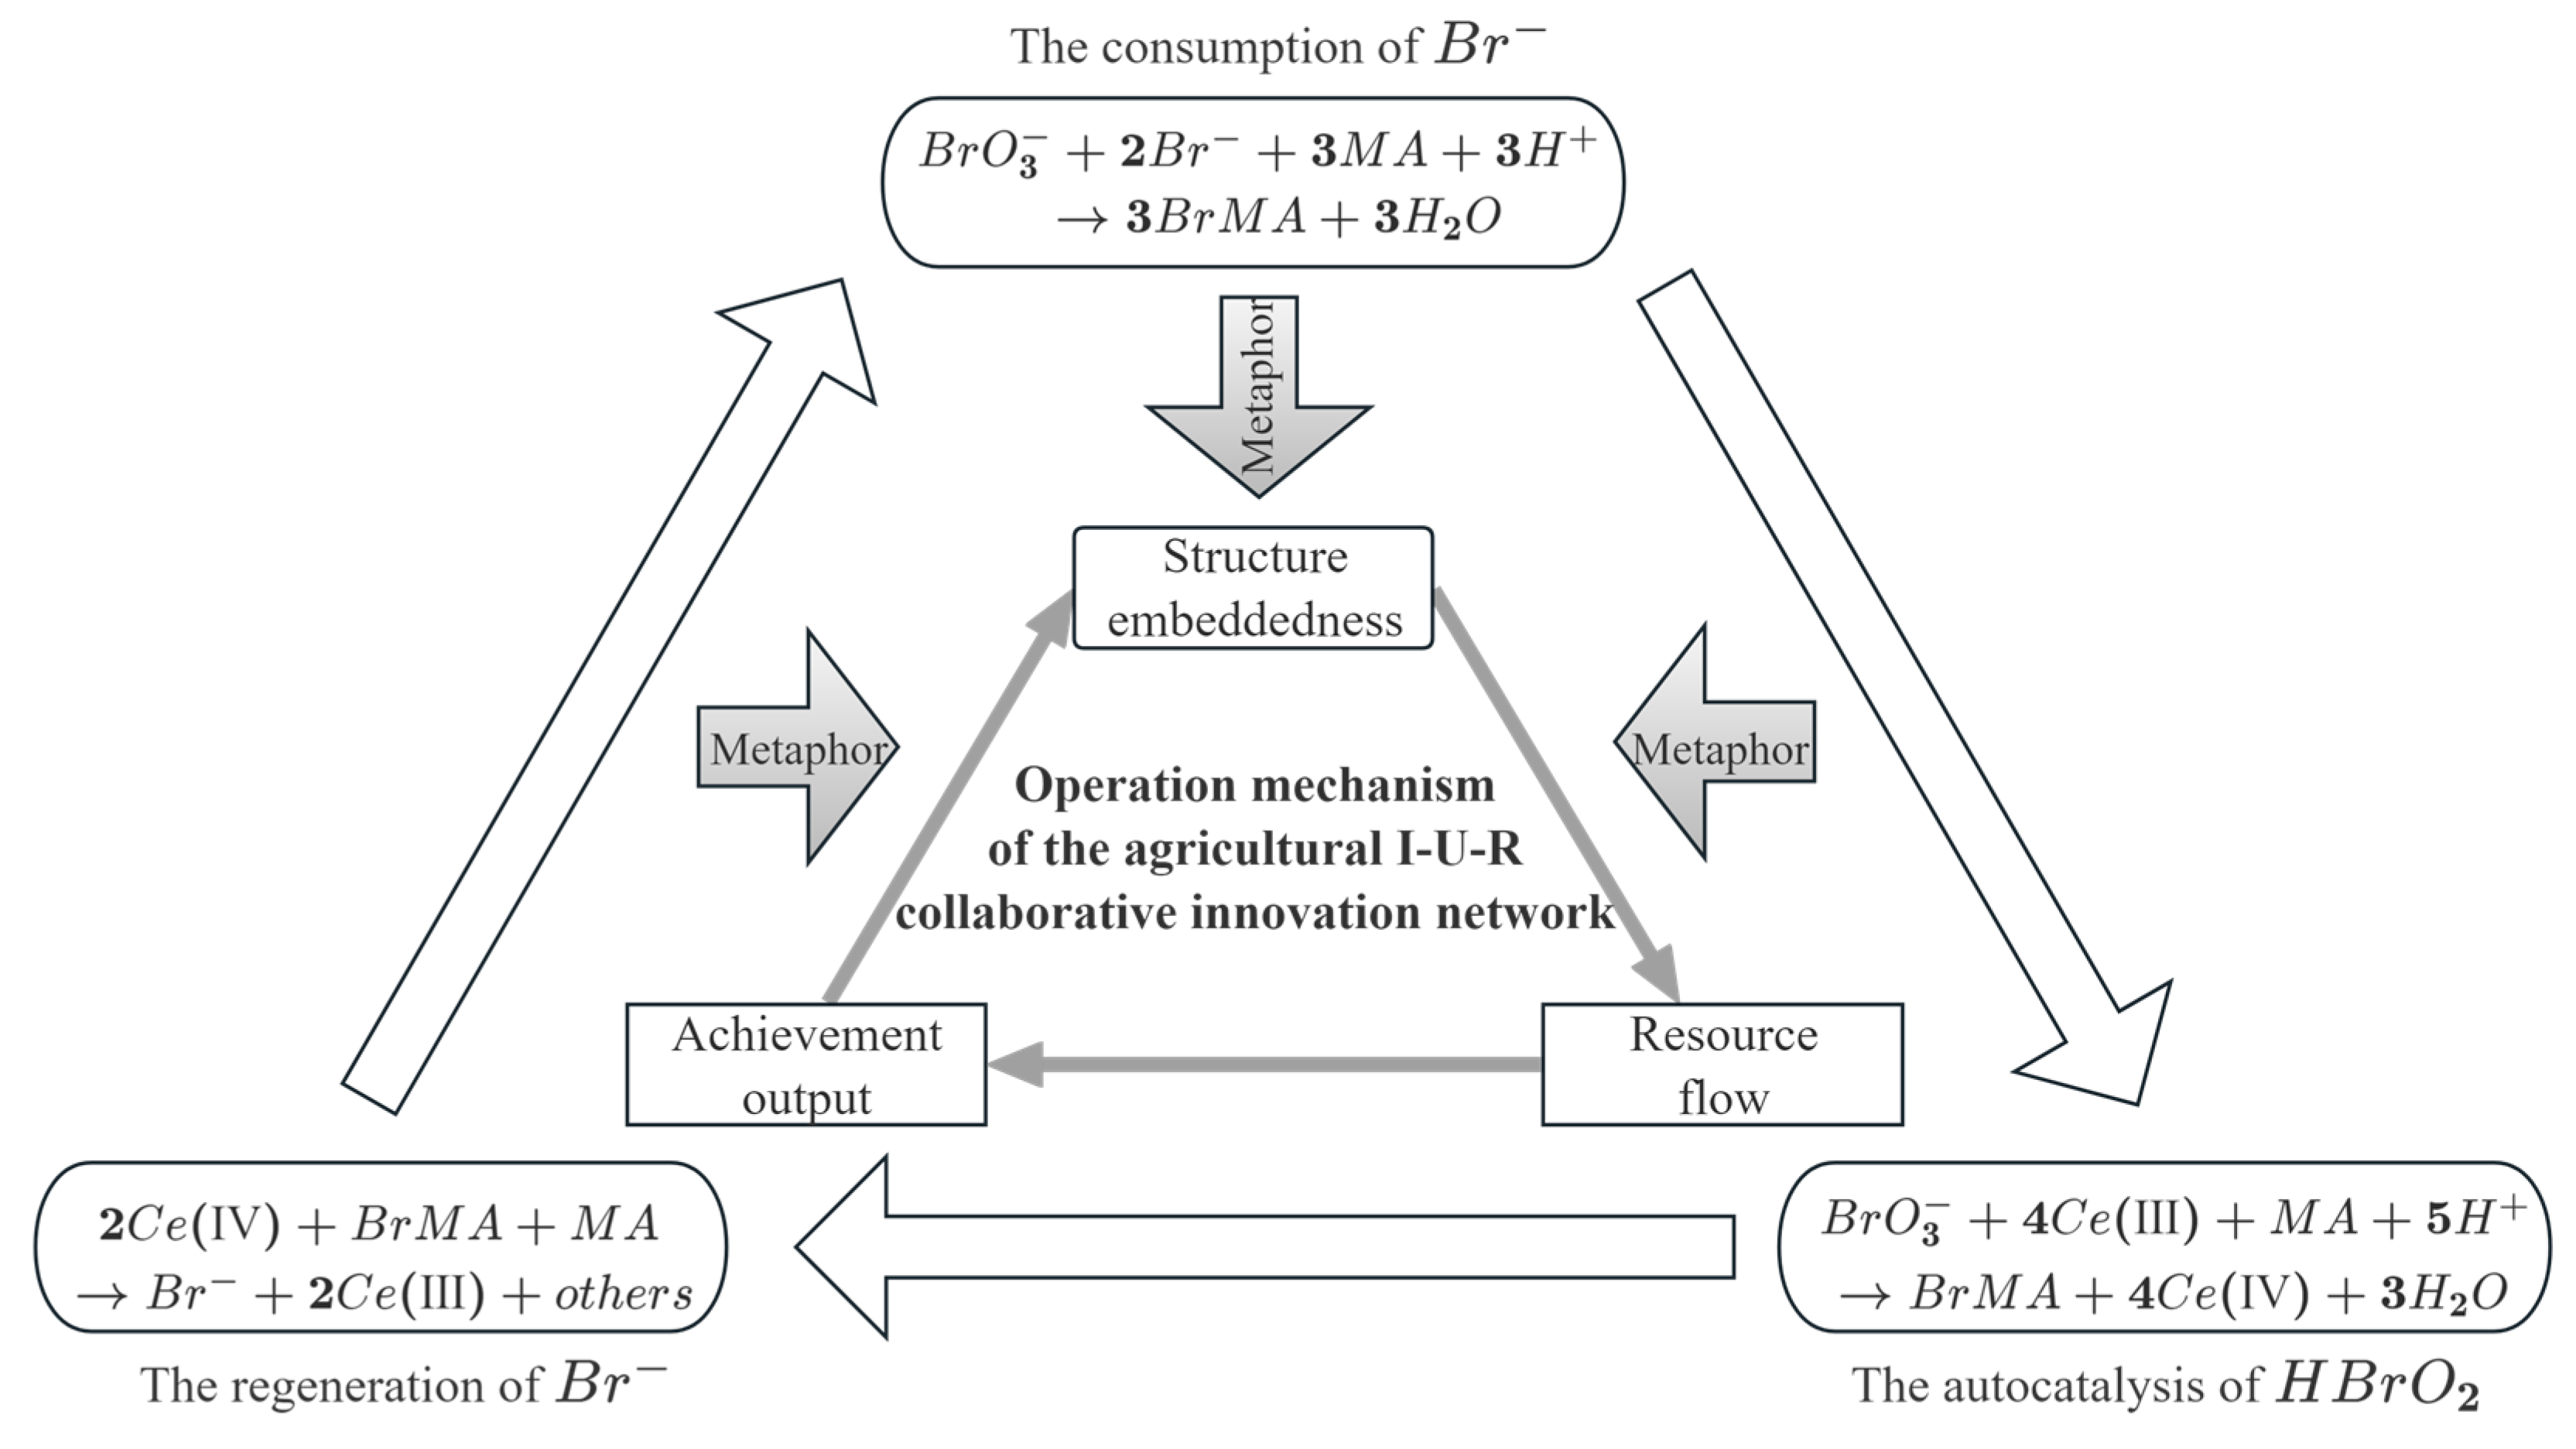
Therefore, we contend that the application of the B-Z reaction to investigate the operational mechanism of the agricultural I-U-R collaborative innovation network is theoretically well-founded. The metaphorical relationship between the two systems is delineated in
Figure 2. We can see that the operational process of the agricultural I-U-R collaborative innovation network exhibits a three-stage structure, which is the same as the B-Z reaction.
First is the “investment” mechanism, including consumption of Br− and structure embeddedness. In the B-Z reaction, the consumption of Br− serves as the initial foundation necessary for the autocatalytic process to proceed. Analogously, in the network, entities in advantageous positions enhance their structural embeddedness through resource integration, thereby reducing initial resistance to forming high-quality connections and priming the network for structural optimization.
Second is the “amplification” mechanism, including autocatalysis of HBrO2 and resource flow. In the B-Z reaction, the autocatalysis of HBrO2 creates a nonlinear positive feedback loop. Similarly, in the network, partner heterogeneity acts as a social catalyst, promoting resource flow and driving network restructuring through a “success-breeds-success” amplification effect.
Third is the “feedback” mechanism, including regeneration of Br− and achievement output. In the B-Z reaction, the regeneration of Br− resets the reaction cycle and supplies essential materials for the next round. Correspondingly, in the network, innovation outputs complete collaborative cycles and, through direct resource feedback and the reshaping of environmental signals, provide new initial conditions for the network’s sustained collaboration.
3. Methodology
3.1. Basic Assumptions of the Complex System
Based on the basic assumptions of dissipative structure in complex system theory, we argue that the agricultural I-U-R collaborative innovation network satisfies the following assumptions: First, the agricultural I-U-R collaborative innovation network is an open system that can evolve into a dissipative structure under specific conditions. Second, there are significant nonlinear interactions within the agricultural I-U-R collaborative innovation network. Third, the agricultural I-U-R collaborative innovation network operates in a state far from equilibrium. Fourth, the agricultural I-U-R collaborative innovation network has internal fluctuations and external disturbances. Fifth, the threshold conditions for the agricultural I-U-R collaborative innovation network to achieve ordered operation are not necessarily unique [
11,
13].
3.2. Variable Selection and Parameter Determination
State variables are a set of variables that fully describe system dynamics and determine the system’s future operational behavior [
15]. During the agricultural I-U-R collaborative innovation network operation, there are three key state variables.
First is the network structure embeddedness state. Once established, heterogeneous resources continuously flow among entities along the relationship chains linking them, sustaining network operation. Each entity leverages its inherent strengths to process the inflowing heterogeneous resources, thereby altering its position within the network. We use the network structure embeddedness state to describe each entity’s power characteristics, its position in the network, its capacity to control others and resources, and its autonomy [
22].
Second is the partner heterogeneity state. Entities in advantaged network positions tend to attract more heterogeneous entities to collaborate with them, thereby acquiring more heterogeneous resources to conduct these activities more effectively. We employ the partner heterogeneity state to represent the degree of difference and diversity among the partners of an entity, serving as a proxy for the inflow of heterogeneous resources.
Third is the collaborative innovation output state. Entities convert the acquired explicit or tacit heterogeneous resources into actual outputs of agricultural I-U-R collaborative innovation through inter-entity interactions and processes. We use the collaborative innovation output state to describe each entity’s capacity to integrate incoming heterogeneous resources and generate outputs.
The agricultural I-U-R collaborative innovation network exhibits self-organized dynamics. When the system’s control variables exceed critical thresholds, one of the state variables becomes the order parameter, the primary driver of system operation. As the slow variable that governs network operation, the order parameter dominates system restricting via self-organization, driving the agricultural I-U-R collaborative innovation network to evolve toward a higher-level state [
23]. The network structure embeddedness state reflects the individual power characteristics of each entity, such as its position in the network, capacity to control others and resources, and autonomy. Compared with the other state variables, it exhibits more pronounced characteristics of an order parameter. Therefore, we identify the network structure embeddedness state as the order parameter for agricultural I-U-R collaborative innovation network operation. In addition, influenced by the particular characteristics of agriculture, agricultural technological innovation differs from other fields, featuring such features as regional specificity, public welfare, periodicity, and risk. Agricultural I-U-R collaborative innovation network operation is inseparable from the supplementation and regulation of external resources. Thus, we use an external government support index to measure the intensity of government funding and policy support for agricultural science, technology, and innovation, designating it as the control variable.
In summary, we identify three state variables, three adjustment parameters, and one control variable, as shown in
Table 1.
3.3. Construction of a Three-Dimensional Dynamical System of Equations
In the operation mechanism of the agricultural I-U-R collaborative innovation network, the operational laws among the three state variables are similar to the self-organizational laws of the B-Z reaction. However, unlike chemical reactions, the operation mechanism cannot be represented by chemical equations, but we can adopt the explanation jointly proposed by Field, Koros, and Noyes, which is expressed using the logistic equation, namely. On this basis, drawing the improved B-Z reaction model [
11,
15,
17], we establish a three-dimensional dynamical system of equations for the operation mechanism of the agricultural I-U-R collaborative innovation network.
3.3.1. Dynamical Equation of the Network Structure Embeddedness State
With external government support, entities will gradually move toward positions with greater information and resource advantages, implying that the degree of network structure embeddedness will continue to deepen. Meanwhile, with external government support, the increase in partner heterogeneity will bring heterogeneous resources to each entity, positively affecting their roles and positions in the network to some extent. However, in the absence of external government support, the direct impact of the partner heterogeneity state on the network structure embeddedness state is nonlinear. As resources continue to accumulate, the burden of controlling and allocating resources on each entity increases, which is not conducive to the further deepening of network structure embeddedness. The dynamical equation for q
1 is as shown in Equation (2).
Among them, δq1 represents the self-influence factor of q1 under the influence of δ; (β/α)δq2 represents the influence factor of q2 on q1 under the effect of δ, where β/α is the influence coefficient; βq1q2 represents the direct influence factor of q2 on q1 apart from the effect of δ, and the two exhibit a co-evolution relationship; φ1ql2 describes the relevant information of q2 in the agricultural industry–university–research collaborative innovation network, where φ1 and l are constants.
3.3.2. Dynamical Equation of the Partner Heterogeneity State
An increase in government funding input for agricultural science, technology, and innovation may lead some entities to over-rely on government funds, resulting in a lack of motivation to actively seek partners independently. Initially, as network structure embeddedness strengthens, entities gradually gain resource acquisition advantages and control capacity, moving toward advantaged network positions. This facilitates establishment of relationships with other heterogeneous entities. However, over time, entities with a high degree of network structure embeddedness may face issues such as cost inefficiency, path dependence, and information overload. In response, they tend to collaborate with entities within their core relationship networks, leading to a decrease in the degree of partner heterogeneity. Collaborative innovation output, as feedback on the effectiveness of the network’s resource allocation, is reintegrated into the network as new resources that flows to entities. It enhances their ability to select partners by improving their own capacity and the environment they operate in. The dynamical equation for q
2 is as shown in Equation (3).
Among them, −δq2 represents the self-influence factor of q2 under the effect of δ; −αq1q2 represents the influence factor of q1 on q2 under the effect of δ; (γ/β)q3 represents the influence factor of q3 on q2, which is weakly endogenously related to whether external government support is received; and γ/β is the influence coefficient.
3.3.3. Dynamical Equation of the Collaborative Innovation Output State
On the one hand, with external government support, entities in core positions of the network typically possess a solid foundation in agricultural science, technology, and innovation and strong network coordination and communication capacity. They can connect with others to conduct agricultural I-U-R collaborative innovation activities, which contributes to the generation of collaborative innovation outcomes. On the other hand, collaborative innovation output is an outcome of system operation and is not directly affected by the control variable. Without external support, as resources are consumed, collaborative innovation output will gradually decrease [
15]. The dynamical equation for q
3 is as shown in Equation (4).
Among them, −φ
2q
3 represents the self-influence factor of q
3, where φ
2 is a constant; φ
3(α/γ)δq
1 represents the influence factor of q
1 on q
3 under the effect of δ, where α/γ is the influence coefficient and φ
3 is a constant. We set φ
1 = 2 and
l = 2 to capture the Matthew effect [
10,
11]. We also set φ
2 = 1, indicating that the network can maintain its current state in the absence of external influences. Additionally, we set φ
3 = 2 to embody the multiplier effect of network structure embeddedness on collaborative innovation output. Thus, the three-dimensional dynamical system for the operation mechanism of the agricultural I-U-R collaborative innovation network can be derived from Equations (2)–(4).
Herein, the parameters α, β, γ, and δ are defined as follows:
is an adjustment parameter for q1, which quantifies the individual power characteristics of an entity. Specifically, αi is an index parameter derived from the conversion of q1; represents the average value of αi; and καi denotes the weight coefficient of the index.
is an adjustment parameter for q2 that measures the entity’s degree of resource heterogeneity. Specifically, βi is an index parameter derived from the conversion of q2; represents the average value of βi; and κβi denotes the weight coefficient of the index.
is an adjustment parameter for q3 that measures the collaborative output level among entities. Specifically, γi is an index parameter derived from the conversion of q3; represents the average value of γi; and κγi denotes the weight coefficient of the index.
is a control variable that measures the level of external government support. Specifically, δi is an index parameter derived from the conversion of δ; represents the average value of δi; and κδi denotes the weight coefficient of the index.
3.4. Solution to the Three-Dimensional Dynamical System of Equations
During the system’s evolution from disorder to order, fluctuations may occur, which may cause the control variable to exceed the threshold conditions. This, in turn, enables the system’s self-organization governed by the order parameter [
14,
23]. We adopt the linear stability analysis method in synergy to determine the threshold conditions for agricultural I-U-R collaborative innovation network operation. Based on Equation (5), a disturbance term is defined, and the corresponding system of equations is expressed as follows.
Herein, θ
i (i = 1, 2, 3) denotes the small disturbance of the steady-state solution, and q
10 = q
20 = q
30 = 0 is the steady-state solution of Equation (6). Using the adiabatic elimination principle, Equation (5) is linearly processed, and a new dynamical equation can be derived, as shown in Equation (7).
Equation (7) is rewritten into vector form, as shown in Equation (8).
The condition for the existence of non-trivial solutions to Equation (8) is that the characteristic equation
holds, as shown in Equation (9).
Thus, the corresponding characteristic equation is derived and presented in Equation (10).
The system can only reach the threshold under instability conditions, which occurs when at least one characteristic root λ has a negative real part [
11]. The Routh–Hurwitz stability criterion is used to determine the critical conditions for the system to achieve higher-order orderliness. Its necessary condition is that all coefficients of the characteristic equation are positive, and the sufficient condition is that all elements in the first column of the Routh array are positive. Therefore, the inequalities in Equation (11) must hold simultaneously.
It can be inferred from the three equations that αβγ < 0 and δ ≠ 0. An odd number of α, β, and γ are negative. Without loss of generality, we assume α > 0; then, β and γ have opposite signs. In this case, the following two cases need to be discussed.
Case 1 is α > 0, β < 0, and γ > 0. In this case, the first inequality can be simplified to (α − β)δ < γ. Since α − β > 0, only two cases, including δ > 0 and δ < 0, need to be discussed. For δ > 0, δ < γ/(α − β), and for β < 0, the first inequality holds identically. In the second inequality, for δ > 0, δ > γ(β − α)/αβ, and for δ < 0, the first inequality holds identically. In the fourth inequality, let A = γ + δ(β − α) and B = δ(−αβδ − αγ + βγ); then, the fourth inequality can be simplified to AB + 3αβγδ2 > 0. For δ > 0, it is necessary to satisfy the intersection of the positive roots of the first and second inequalities simultaneously, namely γ(β − α)/αβ < δ < γ/(α − β). For δ < 0, A > 0, B < 0, AB < 0. In this case, AB + 3αβγδ2 < 0, which fails to satisfy the fourth inequality. Therefore, for α > 0, β < 0, and γ > 0, the range of δ is γ(β − α)/αβ < δ < γ/α − β.
Case 2 is α > 0, β > 0, and γ < 0. In this case, the first inequality can be simplified to (α − β)δ < γ. For δ > 0, if α − β > 0, then δ < γ/(α − β), and the first inequality does not hold. If α − β < 0, then δ > γ/(α − β). For δ < 0, if α − β > 0, then δ < γ/(α − β). If α − β < 0, then δ > γ/(α − β), and the first inequality does not hold. In the second inequality, for δ > 0, combined with the condition α − β < 0 from the first inequality, we get δ < (β − α)γ/αβ, and the second inequality does not hold. For δ < 0, combined with the condition α − β > 0 from the first inequality, we get δ > (β − α)γ/αβ, and the second inequality does not hold. Since all four aforementioned conditions must be satisfied simultaneously, the range of δ is an empty set for α > 0, β > 0, and γ < 0, which is an invalid case.
Combining case 1 and case 2, the instability condition value can be derived, as shown in Equation (12).
Therefore, when α > 0, β < 0, and γ > 0, the agricultural I-U-R collaborative innovation network reaches the instability threshold. This threshold is the critical condition for the system to evolve toward a higher-order ordered state, as shown in Equation (13).
3.5. Expression of the Order Parameter Equation
Following the adiabatic elimination principle, fast variables that are less important for system operation can be removed by dimension reduction using slow variables. This leads to an equation containing only slow variables, namely the order parameter equation. By setting the time derivatives of the fast variables q
2 and q
3 to zero, we obtain Equation (14).
The expressions for q
2 and q
3 in terms of q
1 are given in Equation (15).
Then, q
1 is substituted into Equation (15) to obtain the order parameter equation of the agricultural I-U-R collaborative innovation network, shown in Equation (16).
On this basis, by introducing the time variable, the final order parameter equation becomes Equation (17).
4. Selection of Indicators and Data Sources
4.1. Network Structure Embeddedness Indicators
Entities with certain capacity in social networks can usually seize opportunities and gain advantages [
18]. When an entity plays a less core role in a network, it has limited influence and a weak ability to acquire and control resources and is unable to effectively utilize network resources to carry out agricultural I-U-R collaborative innovation. However, as the entity’s core degree increases, the number of connected entities grows, opportunities to obtain heterogeneous resources increase, and its influence on agricultural I-U-R collaborative innovation activities gradually improves. Based on this, we select indicators from two aspects, including structural holes and network centrality, to reflect the power characteristics of each entity, as shown in
Table 2.
4.2. Partner Heterogeneity Indicator
The operationalization of partner heterogeneity in this study centers on institutional type (e.g., enterprise, university, and research institute). This approach is theoretically grounded in the Triple Helix theory, which posits that these entities embody fundamentally distinct institutional logic, knowledge bases, and resource endowments. Collaborations across these institutional boundaries are therefore primary conduits for the integration of complementary, heterogeneous resource, which is a critical driver of collaboration innovation. Particularly within the context of China’s agricultural innovation system, institutional affiliation serves as a robust and parsimonious proxy for systemic differences in functional orientation and resource control. Based on the above analysis and the existing studies [
24,
25], we define partner heterogeneity as the degree of difference and diversity in knowledge, technology, capacity, and other resources among entities. Its measurement dimensions include difference and diversity. To fully capture this, we use the partner heterogeneity indicator [
26], Equation (18), which considers both the proportion of heterogeneous partners and the number of partner categories. The indicator ranges from 0 (homogeneity) to 1 (complete heterogeneity). Higher values indicate greater heterogeneity.
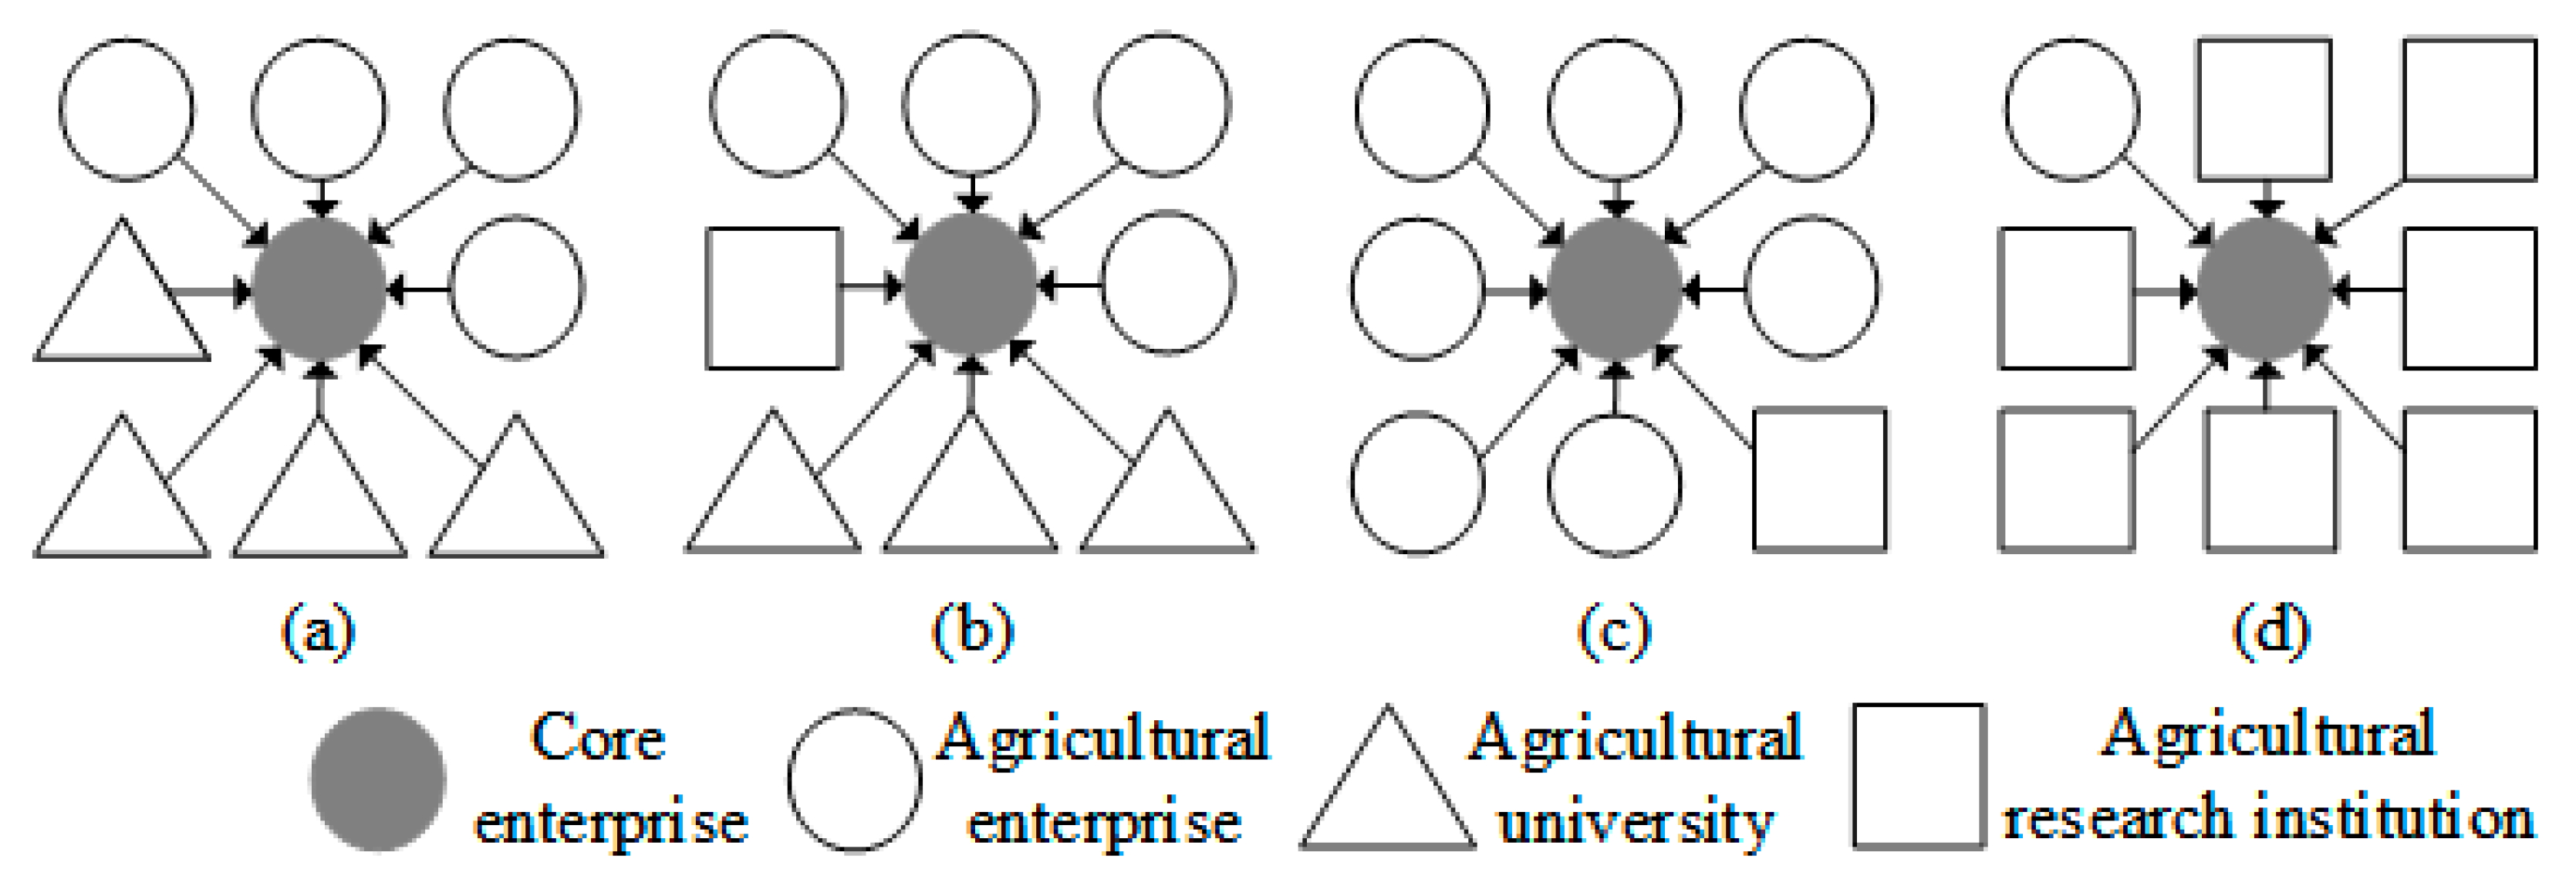
Based on this method, the partner heterogeneity index of
Figure 3a–d is
Ha = 1 − {(0.125 × 4) × [(0.125 × 4)
2 + (0.125 × 4)
2} = 0.7500,
Hb = 1 − {(0.125 × 4) × [(0.125 × 4)
2 + (0.125 × 1)
2+ (0.125 × 3)
2]} = 0.8125,
Hc = 1 − {(0.125 × 7) × [(0.125 × 7)
2 + (0.125 × 1)
2]} = 0.3164, and
Hd = 1 − {(0.125 × 1) × [(0.125 × 1)
2 + (0.125 × 7)
2]} = 0.9023.
4.3. Collaborative Innovation Output Indicators
Agricultural I-U-R co-authored papers, cooperative patents, and jointly authored varieties are concrete outputs of agricultural I-U-R collaborative innovation. These indicators show the output level of entities from both knowledge innovation and technological transformation perspectives.
For co-authored papers, English papers are collected from the Web of Science Core Collection, specifically SCIE and SSCI databases. Retrieval uses the ISSN numbers of all journals in the ESI Agricultural Sciences category. The country/region was set as China, language and document type were set as all languages and journal articles, index types were set as SCI and SSCI, and the filter condition was set as highly cited papers. Chinese papers are highly cited co-authored papers retrieved from CNKI’s Citation Database. (We applied year-specific citation thresholds to identify highly cited papers, accounting for differences in citation accumulation across publication years: ≥70 citations (2011–2012), ≥60 (2013–2014), ≥50 (2015–2016), ≥40 (2017–2018), ≥30 (2019–2020), ≥20 (2021), ≥10 (2022), and ≥5 (2023)). The subject category is agricultural sci-tech. The source literature includes journal articles from SCI, EI, and CSSCI journals. For cooperative patents, retrieval is performed in the National Intellectual Property Administration’s Patent Search Database using IPC classification numbers, based on the Reference Table of International Patent Classification and National Economic Industry Classification and relevant research [
27]. The patent type is valid invention patents. (We selected valid invention patents as the patent indicator because, among the three main patent types (invention patents, utility models, and design patents), invention patents generally have the highest technical content and originality and are widely recognized as the most appropriate measure of applicants’ technological innovation capability). For jointly authored varieties, authorized variety information is gathered from the Variety Protection Database, based on announcements from the Agricultural Rural Ministry Science and Technology Development Center.
Using the retrieval criteria above, we first use a crawler algorithm to collect raw data: 41,963 co-authored papers, 293,295 cooperative patents, and 25,547 jointly authored varieties from 2011 to 2023. Secondly, we extract the entity information of the collected data, excluding patents where the applicants included foreign entities or natural persons, and conduct the first round of screening on the retrieved data based on whether the collected data are co-produced by multiple entities. This reduces the dataset to 3564 co-authored papers, 14,487 cooperative patents, and 3192 jointly authored varieties. Next, we screen again for data co-produced by multiple I-U-R entities. (We categorized cooperative relationships into four types, industry–university, industry–research, university–research, and industry–university–research, to distinguish different forms of cross-sector collaboration). Ultimately, we obtain 921 co-authored papers, 6224 cooperative patents, and 1644 jointly authored varieties.
4.4. External Government Support Indicators
Funding and policy support for agricultural science, technology, and innovation are essential for entities to achieve agricultural I-U-R collaborative innovation. Stable funding and policy support can ensure agricultural I-U-R collaborative innovations. Considering core representativeness, policy relevance, and data availability, we use two indicators, agricultural technological innovation funding and policy support, to represent external government support. Funding is measured by regional fiscal agricultural expenditure and regional R&D expenditure for each province from 2011 to 2023. Policy support is represented by the agricultural technological progress contribution rate for each province in the same period. Data comes from the China Statistical Yearbook, China Science and Technology Statistical Yearbook, as well as the Rural Statistical Yearbooks and the Statistical Communique on National Economic and Social Development of various provinces.
To ensure the representativeness of the selected entities, we take the top 50 entities ranked by the strength centrality of the paper, patent, and variety networks as the research samples for the empirical study. (We chose three networks’ top 50 entities by strength centrality. Their codes can be downloaded at 10.57760/sciencedb.31888). The indicator data vary significantly in dimension, so we first standardize the data from 2011 to 2023. Next, we use the entropy weight method to determine the objective weight coefficients for each indicator in the three networks. We then consult experts and scholars in management science and agricultural economics, using the expert scoring method for subjective weighting. Finally, we construct a subjective–objective combined weighting model [
11]. We assign a combined weight of 0.50 to both the entropy weight method and the expert scoring method. The weight coefficient of each indicator is determined by calculating the average of the two weighting results. The indicator system is shown in
Table 3.
5. Empirical Results
5.1. Collaborative Trend Analysis of Three State Variables
We use MATLAB R2023b software (
Figure 4,
Figure 5,
Figure 6,
Figure 7,
Figure 8 and
Figure 9 are generated using this software) to analyze the operation of the network and explore its structural patterns. The objective is to reveal the collaborative trends associated with network structure embeddedness, partner heterogeneity, and collaborative innovation output. We examine these trends under varying levels of external government support. Using the obtained indicator data and the calculation formulas for adjustment parameters and control variables, we derive the mean values of adjustment parameters and control variables for each network operation mechanism from 2011 to 2023, as shown in
Table 4. According to Equation (13), we also obtain the threshold value δ
c of δ.
As shown in
Table 4, the three networks show stepwise differences in network structure embeddedness, partner heterogeneity, and collaborative innovation output (patent > paper > variety). These differences stem from their collaboration logic and constraints. Patent cooperation focuses on the commercial application of technology. Market competition and interest-driven forces promote frequent interaction and resource integration among entities. This makes it easier to form a stable network structure and an efficient innovation output mechanism. In contrast, the main goal of paper collaboration lies in knowledge production and academic influence accumulation. Its cooperation model is task-oriented and phased. The breadth and depth of cooperation are constrained by project cycles, assessment standards, disciplinary barriers, and other factors. Meanwhile, the variety network faces challenges such as long breeding cycles, complex technical links, strong dependence on natural conditions, and insufficient industrial development maturity. These rigid constraints make it hard for entities to form close and sustainable cooperative bonds and an efficient collaborative operation model, resulting in relatively low levels of partner heterogeneity and innovation output.
Notably, the δ values of the three networks are the same, but their δc values differ significantly. This indicates that the current government provides consistent basic support for three networks. However, the variety network depends more on systematic government support beyond basic guarantees. This is due to insufficient endogenous collaborative motivation and some market mechanism failures. In contrast, the patent network relies on efficient market-driven structure. The paper network relies on a mature academic self-governance mechanism. As a result, both patent and paper networks have relatively limited need for government intervention.
Let the initial state of the system be q
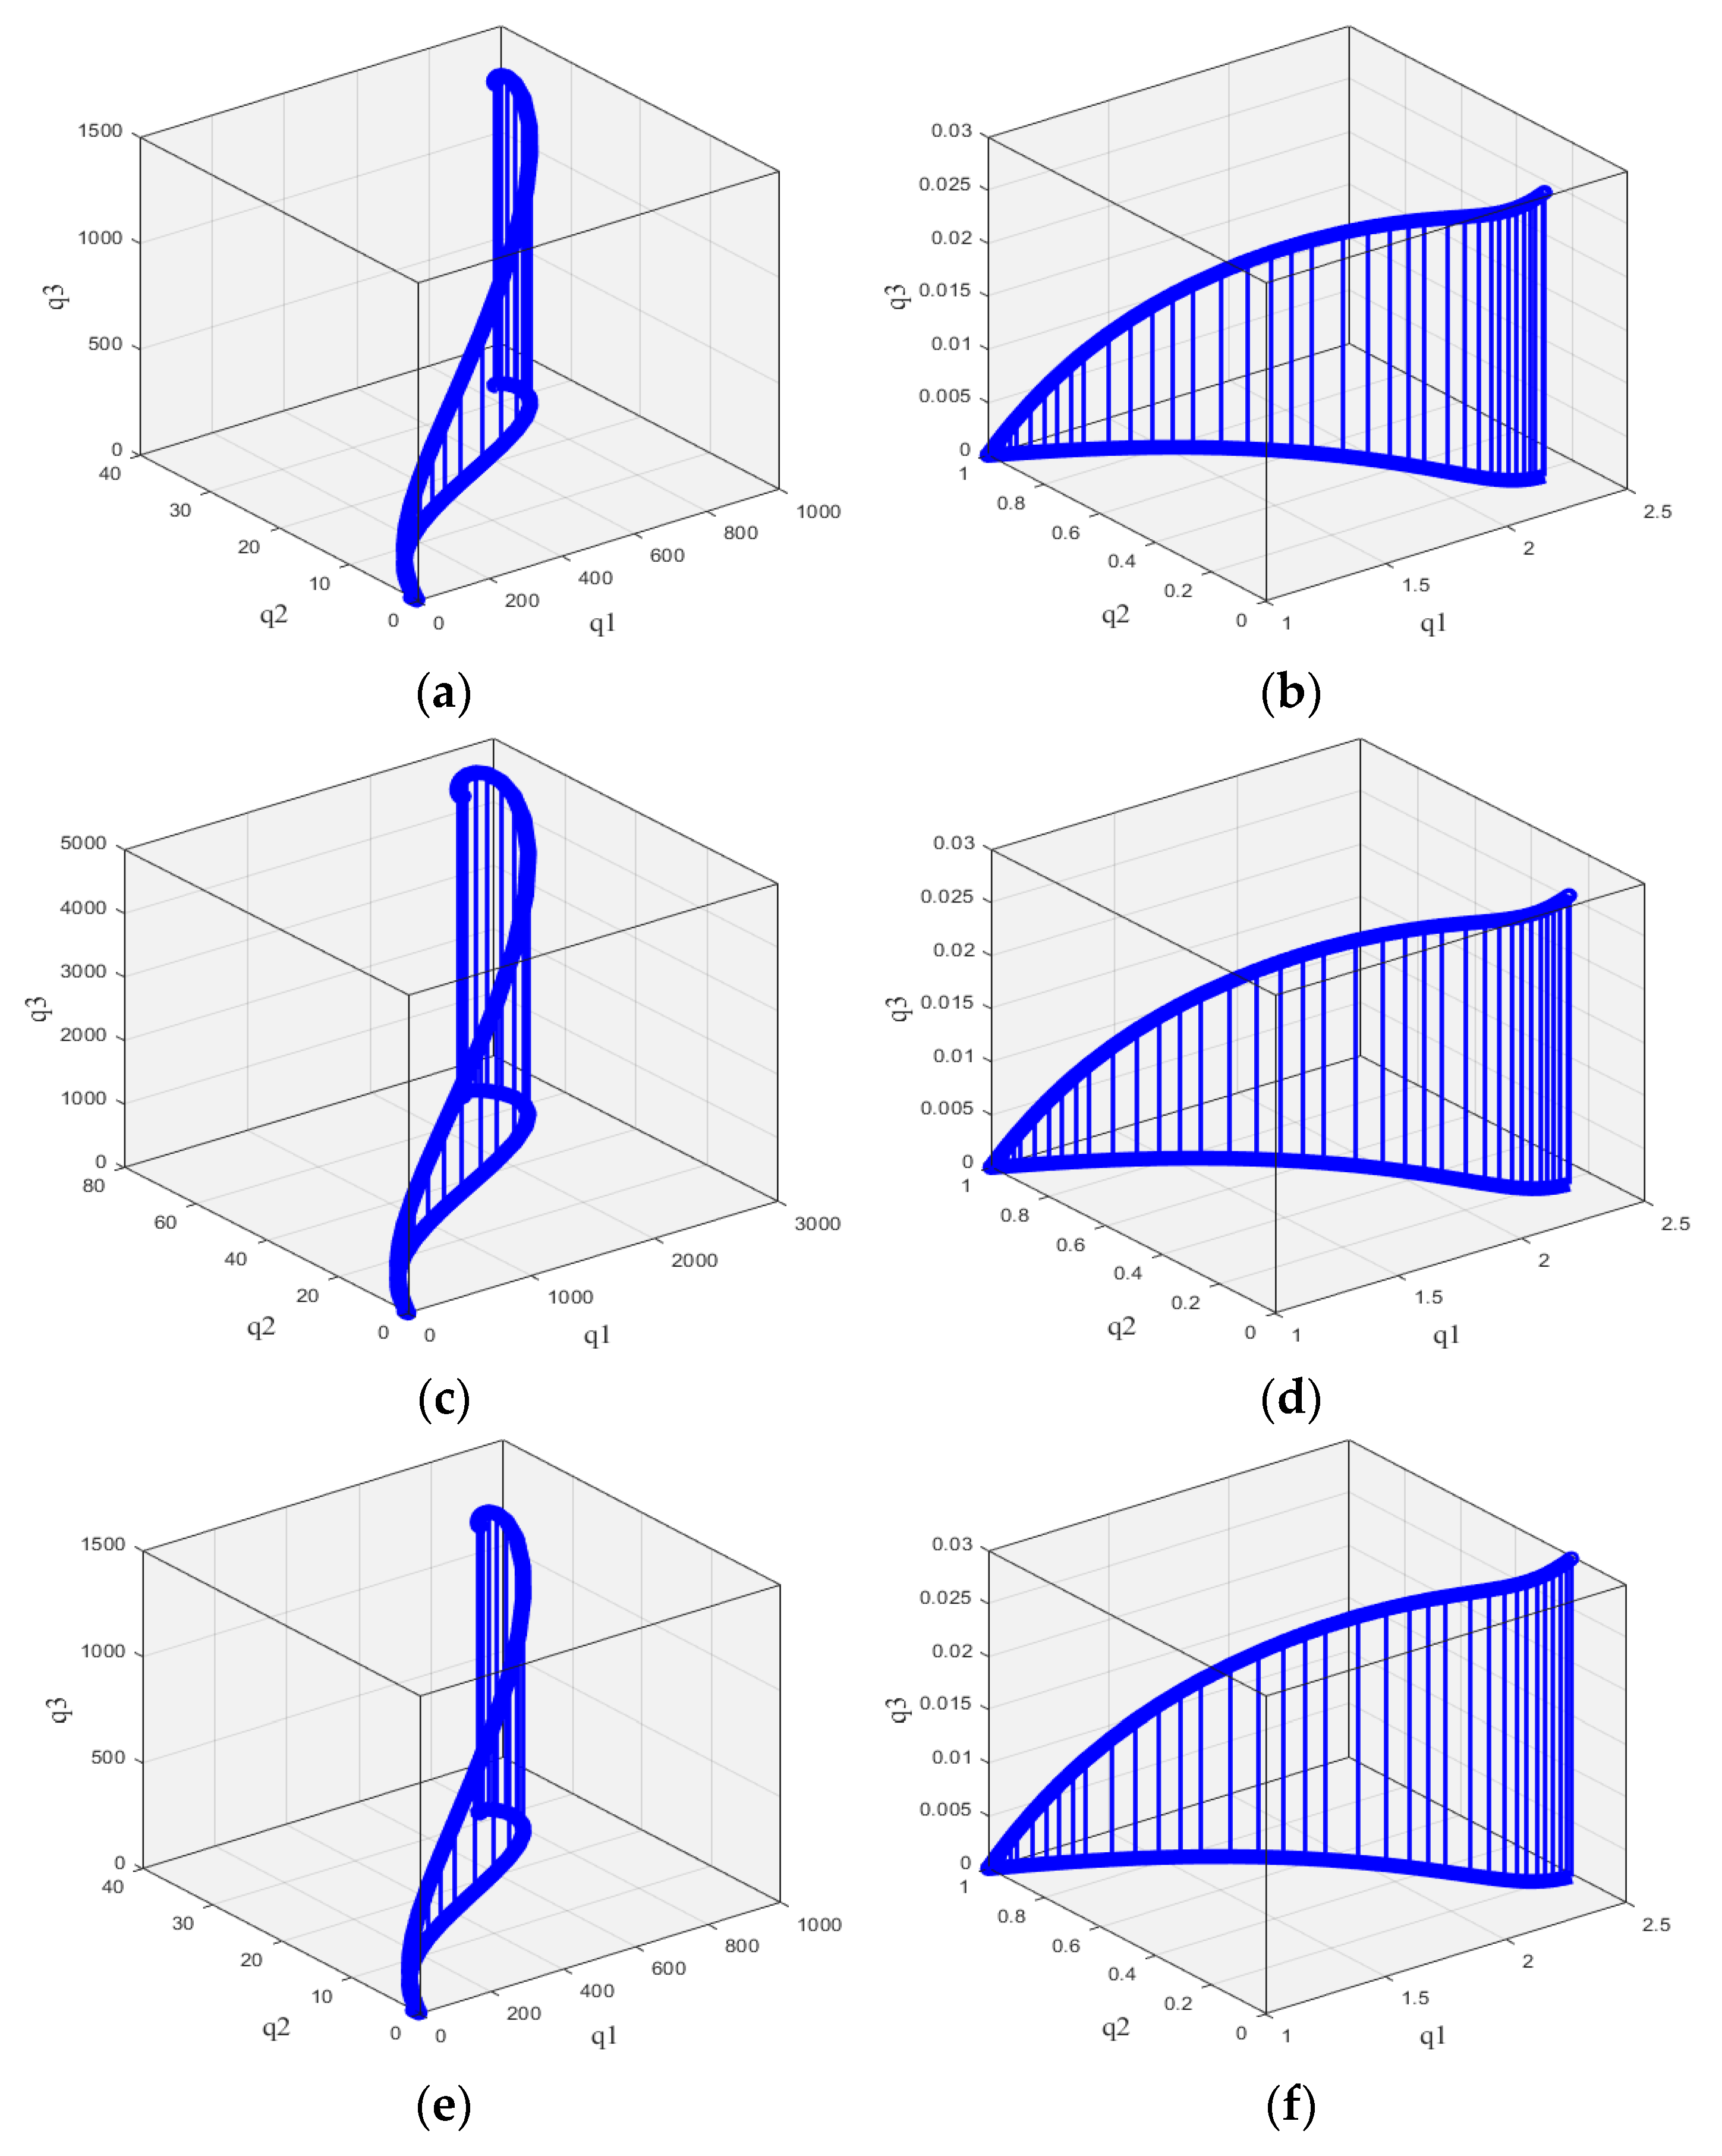
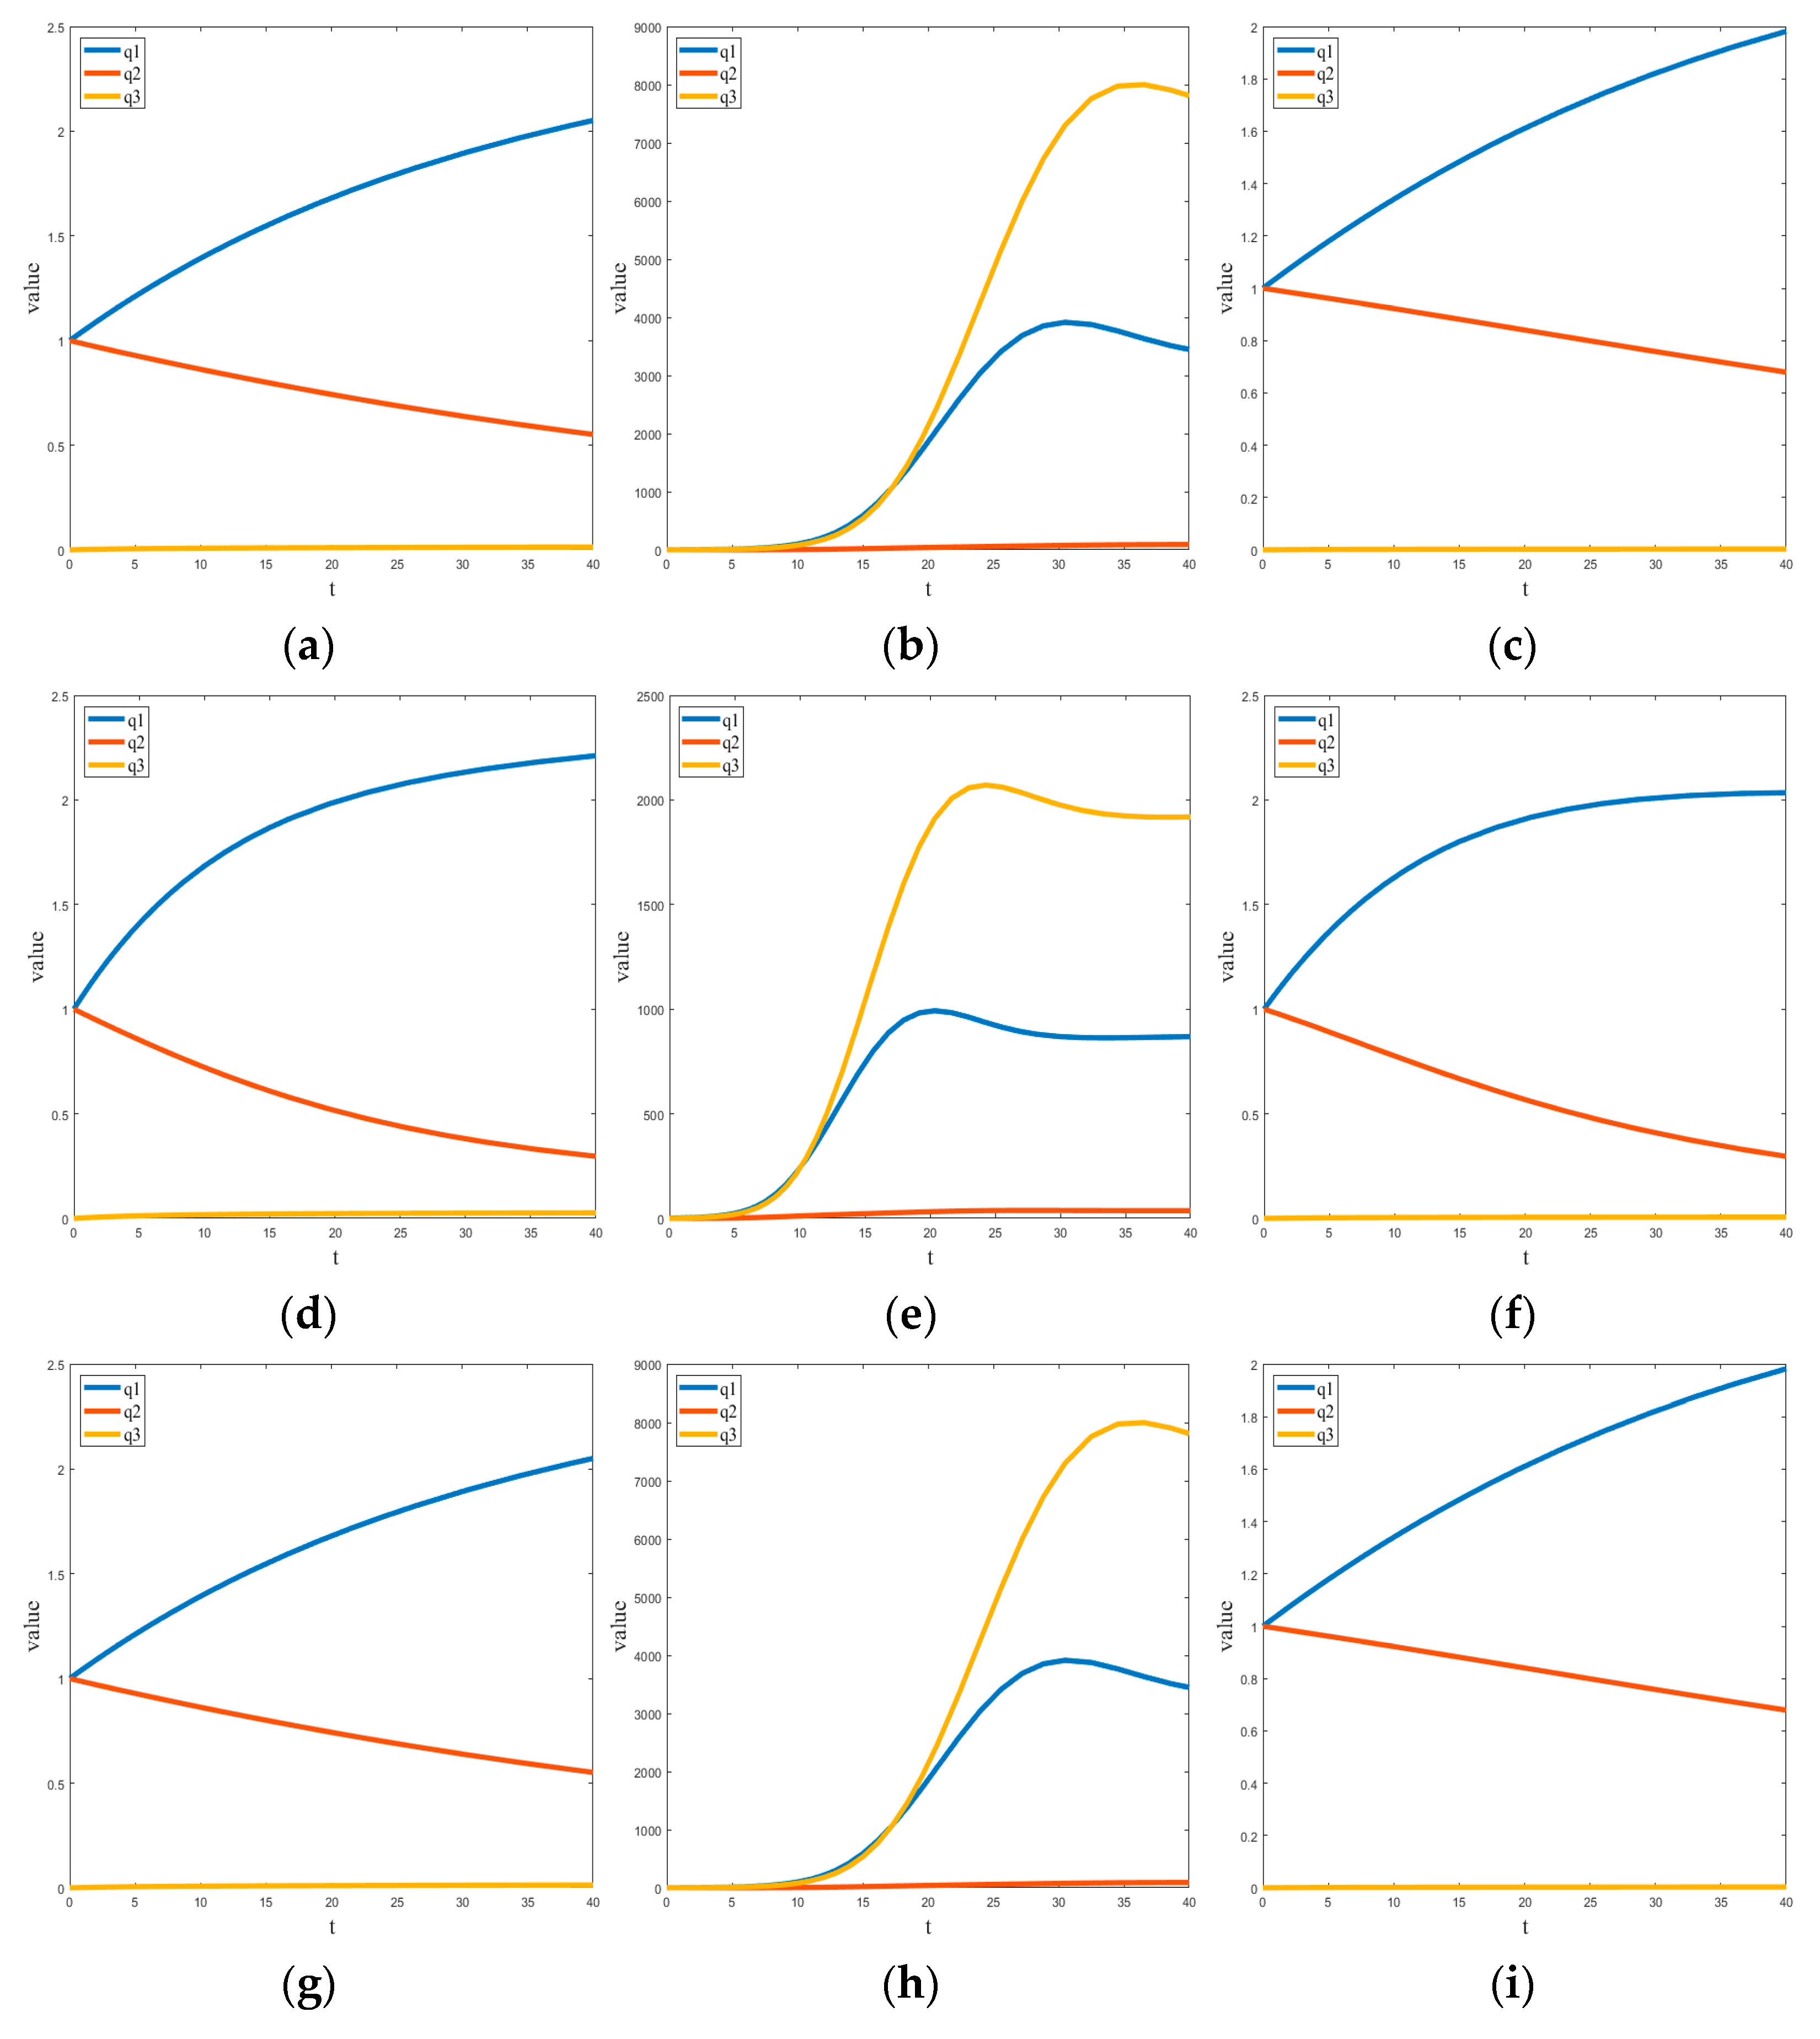
0 = [1, 1, 0]. These values represent the initial conditions of network structure embeddedness, partner heterogeneity, and collaborative innovation output. By substituting the mean values of adjustment parameters and the control variables of each network from 2011 to 2023 into Equation (5) for empirical research, we can obtain the three-dimensional evolution diagrams of the three state variables in the network under threshold conditions and actual situations, as shown in
Figure 4.
As shown in
Figure 4a,c,e, the indexes of network structure embeddedness, partner heterogeneity, and collaborative innovation output were all at a relatively low level initially. Over time, the three curves all show an upward trend. Among them, the upward trends of the collaborative innovation output and the network structure embeddedness index are notable, while the partner heterogeneity index remains relatively stable. This indicates that when the external government support reaches the threshold, it creates a more favorable environment for network operation. Such support unlocks each entity’s ability to control and allocate resources and optimize the state of network structure embeddedness. This thus attracts more heterogeneous entities to participate in agricultural I-U-R collaborative innovation projects, increases the inflow of heterogeneous resources, and further enhances collaborative innovation output.
As shown in
Figure 4b,d,f, the indexes of network structure embeddedness, partner heterogeneity, and collaborative innovation output were all at a relatively low level initially. Over time, the network structure embeddedness index shows an upward trend. This indicates that entities gradually establish a stable collaborative framework through resource integration and relationship strengthening. However, the partner heterogeneity index does not rise but instead declines. This is attributed to collaborative barriers, uneven resource distribution, and information asymmetry among entities in reality, which inflow from heterogeneous resources. Meanwhile, the collaborative innovation output index fails to achieve significant growth in the short term. This is due to factors such as low resource conversion efficiency, bottlenecks in the innovation process, and imperfect innovation incentive mechanism.
By comparing network operation results under threshold and actual situations, it can be concluded that a network is more effective within the same time frame when the threshold conditions are met. This highlights the key role of the level of external government support in the network efficiency. When this external government support reaches the threshold, it can effectively eliminate the obstacles in the actual operation of the network; promote positive interaction among entities; and achieve network structure optimization, efficient resources allocation, and enhanced collaborative innovation output. Thereby, the network achieves stronger collaborative advantages and reaches a higher level of collaboration.
To better study how the three state variables work together over time, we run simulations of the network’s operation mechanism. We use actual, strong, and weak levels of external government support in the simulations.
As shown in
Figure 5a,d,g, each network faces the dilemma of “gradual structural adjustment–continuous resource loss–slow output growth” under the actual level. Entities gradually optimize their positions and resource control capacity through resource integration. This leads to a steady rise in the network structure embeddedness index (1→2.34, 1→2.21, and 1→2.05). However, several factors constrain progress: collaborative barriers, uneven resource distribution, and poor information communication among entities. As a result, the inflow of heterogeneous resources drops sharply, and the partner heterogeneity index continues to decline (1→0.40, 1→0.30, and 1→0.55). Insufficient structural collaboration and scarce innovation resources further limit progress. Collaborative innovation projects lack proper support, which causes long-term stagnation of collaborative innovation output (0→0.03, 0→0.03, and 0→0.01).
From
Figure 5b,e,h, under the strong level, the three networks achieve the state of “structural optimization–resource agglomeration–output leap” during periods 8 ≤ t ≤ 32, 5 ≤ t ≤ 25, and 10 ≤ t ≤ 35. Strengthening external government support promotes the rapid formation of core entities, drives network structure reconstruction, and accelerates improvement in the network structure embeddedness index. As the network matures, collaboration among entities stabilizes. The network structure embeddedness index maintains a high-level steady state (1→1129.91, 1→868.67, and 1→3447.15). For the partner heterogeneity index, funding and policy support break down collaborative barriers and encourage collaborative innovation with heterogeneous entities. This continuously increases the inflow of heterogeneous resources (1→43.50, 1→36.71, and 1→91.44). At this point, an efficient network structure and ample heterogeneous resources facilitate the large-scale development of collaborative innovation projects, forming a virtuous cycle of “structure–resources–output” and leading to a surge in the collaborative innovation output index (0→2349.92, 0→1918.60, and 0→7811.60).
Figure 5c,f,i show that under the weak level, each network is deadlocked in “structural rigidity–resource exhaustion–output stagnation”. With weak external government support, entities can only fine-tune their positions using their own resources. The creation of core entities slows, and network structure becomes rigid (1→2.21, 1→2.03, and 1→1.98). Meanwhile, weak external government support worsens cooperation barriers, lowers willingness to participate, and shrinks the inflow of heterogeneous resources. This leads to a steady decline in partner heterogeneity (1→0.43, 1→0.30, and 1→0.68). As a result, collaborative innovation projects almost completely cease, and collaborative innovation output is nearly zero (0→0.01, 0→0.01, and 0→0.00).
Comparative analysis shows that if external government support is below a certain threshold, the network becomes inefficient or even paralyzed. This happens because a decline in partner heterogeneity triggers negative feedback, which leads to a vicious cycle of “structural rigidity–resource exhaustion–output stagnation”. In contrast, when external government support rises above the threshold, network structure embeddedness, partner heterogeneity, and collaborative innovation output all improve. As a result, the network escapes stagnation and achieves “structural optimization–resource agglomeration–output leap”, maximizing collaborative innovation.
5.2. Operation Trajectory Analysis of Each Entity’s Order Parameter
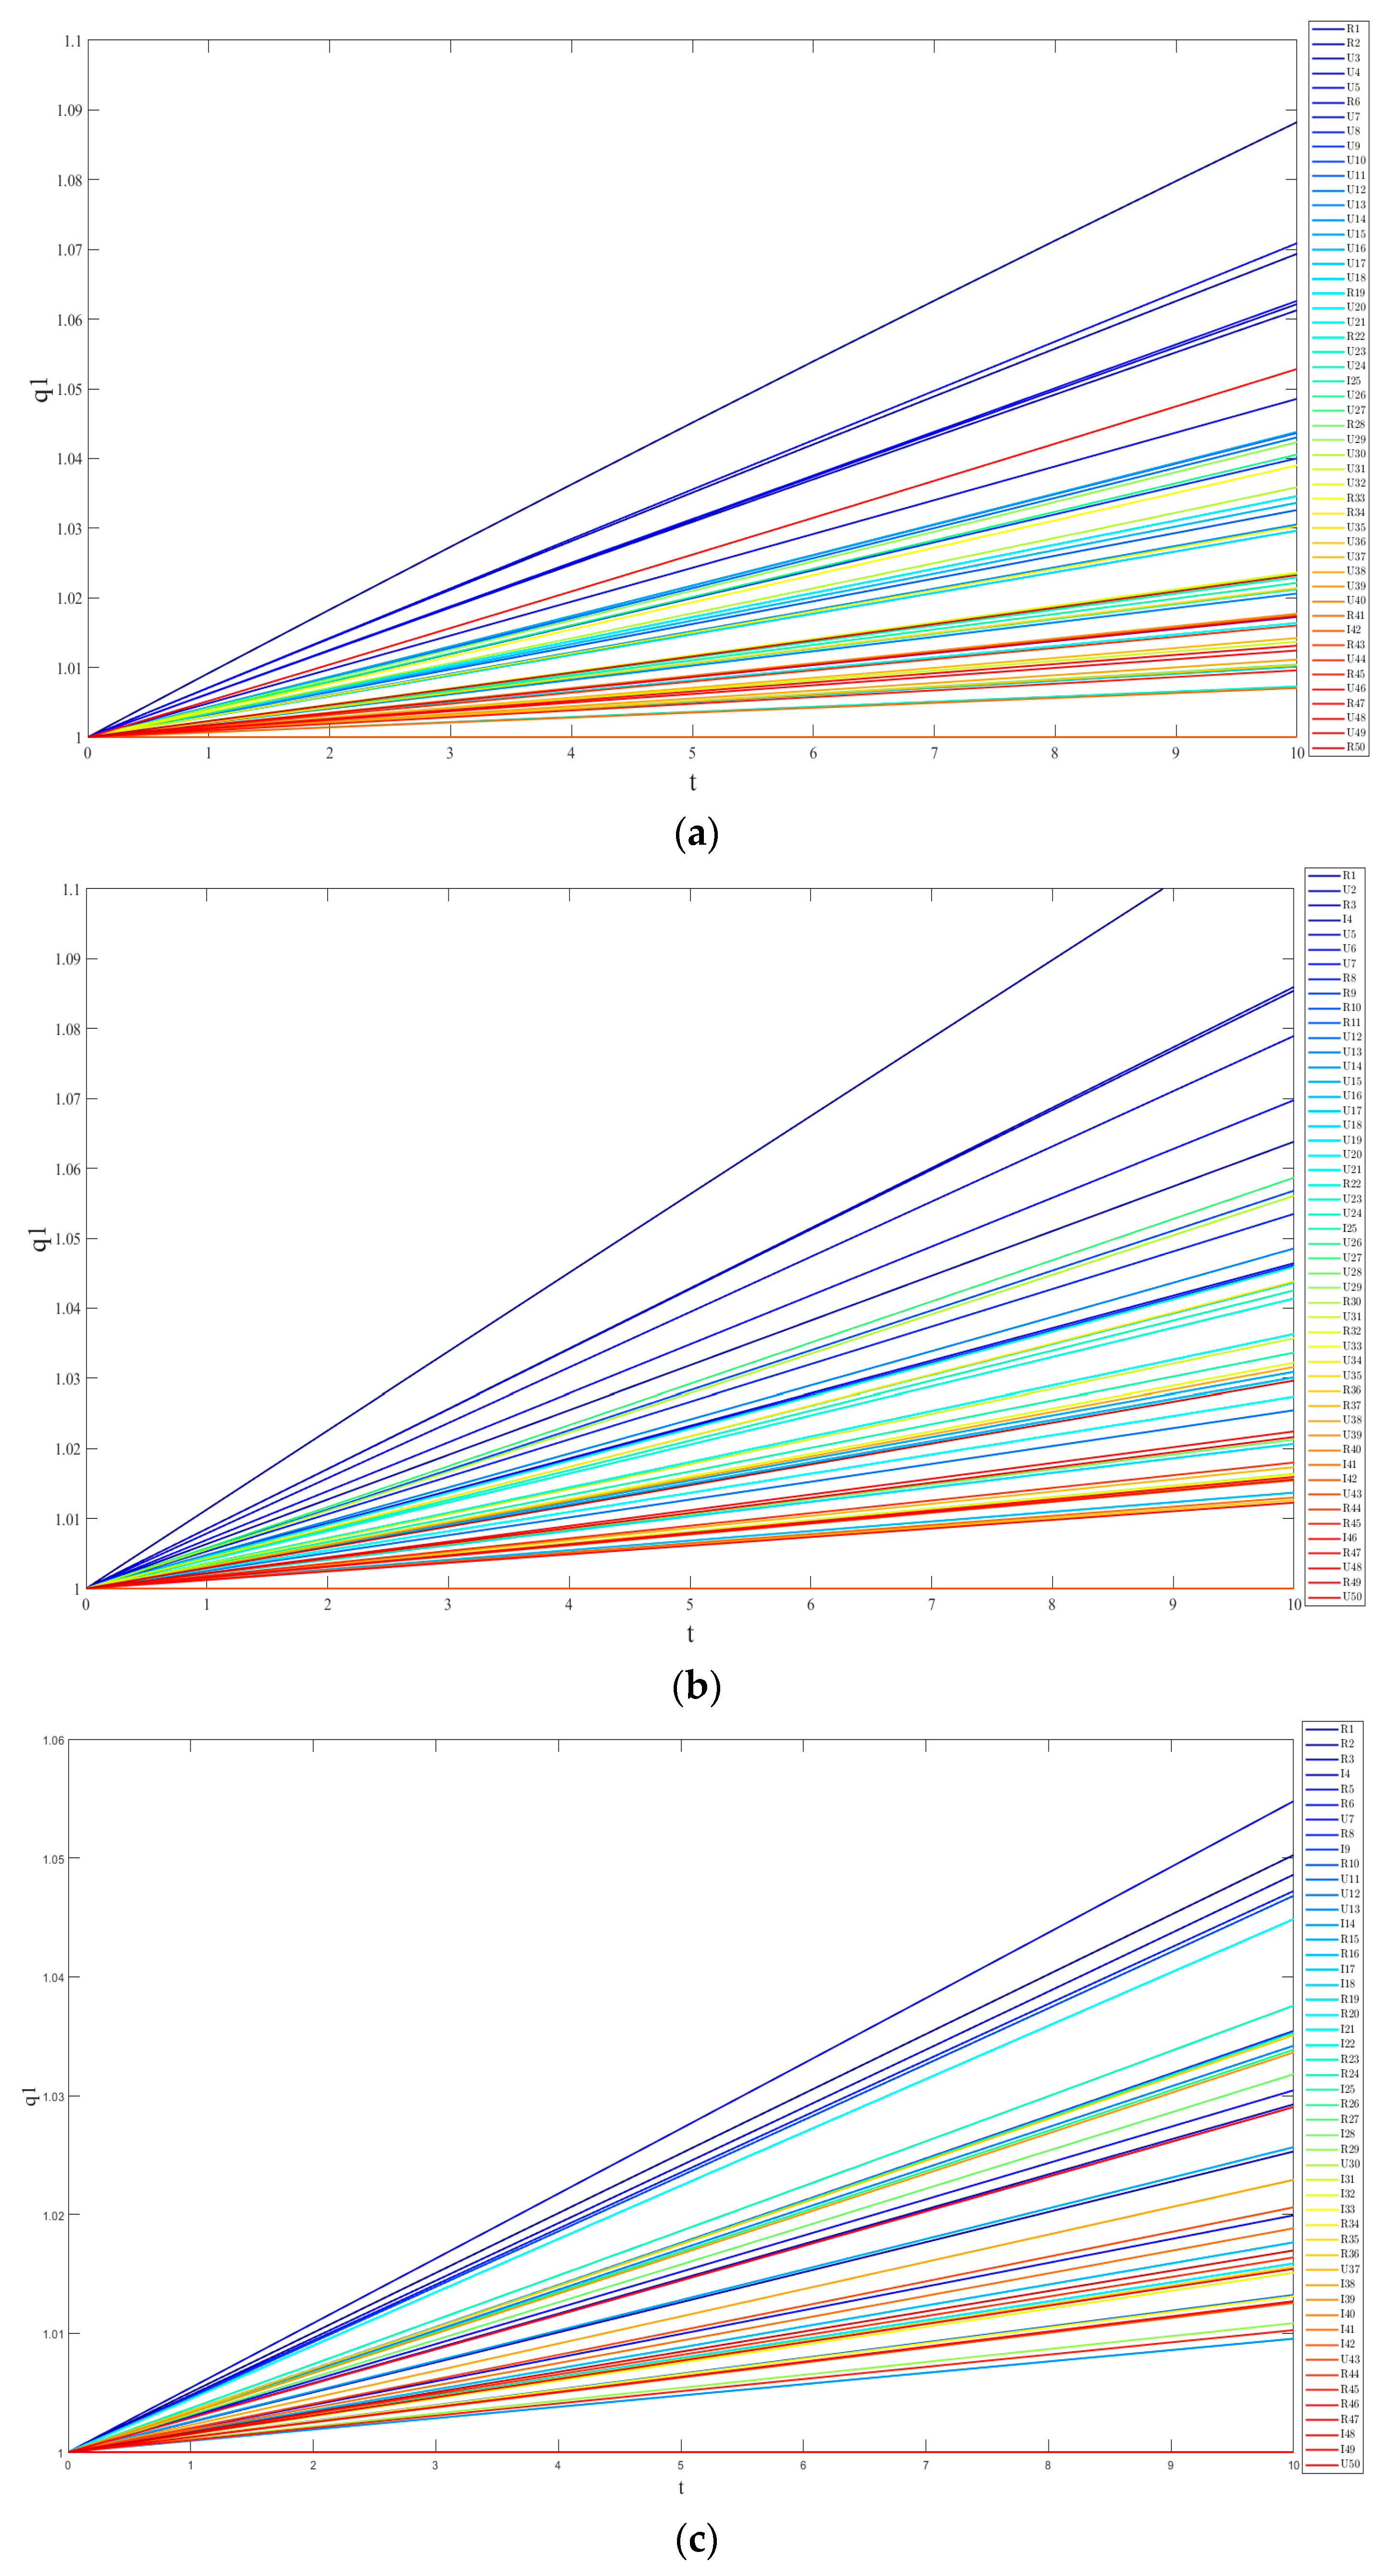
Order parameter, as a key variable governing network operation, can dominate system reconstruction through self-organization when the control variable reaches the threshold, thereby elevating the network to a more advanced operational state. To macroscopically assess the activity level and development trend of each entity in the agricultural I-U-R collaborative innovation network, we substitute the mean values of adjustment parameters and control variable for each network from 2011 to 2023 into Equation (16). The operation trajectories of the top 50 entities ranked by strength centrality in each network (see the
Supplementary Materials) over time are obtained, as shown in
Figure 6. The results reveal three distinct differentiation trends among entities across the three networks, which can be categorized as active, stable, and general types.
Active entities excel in comprehensive capacity, with high activity levels in collaborative innovation. They can quickly improve agricultural I-U-R collaborative innovation capacity and make up 12% of paper, patent, and variety networks. Stable entities also perform well overall, with moderate activity and slower improvement. They make up 32%, 24%, and 28% of these networks. General entities have the weakest capacity and low activity, with slow or stable innovation progress over a long time. They represent 56%, 64%, and 60% in paper, patent, and variety networks. Active entities lead innovation but are scarce in number. Stable entities are the network’s backbone but need more momentum. General entities make up most of the network but lag in innovation.
5.3. Influencing Factors Analysis on the Operation of Order Parameter
5.3.1. Impact of External Government Support Index on the Operation of Order Parameter
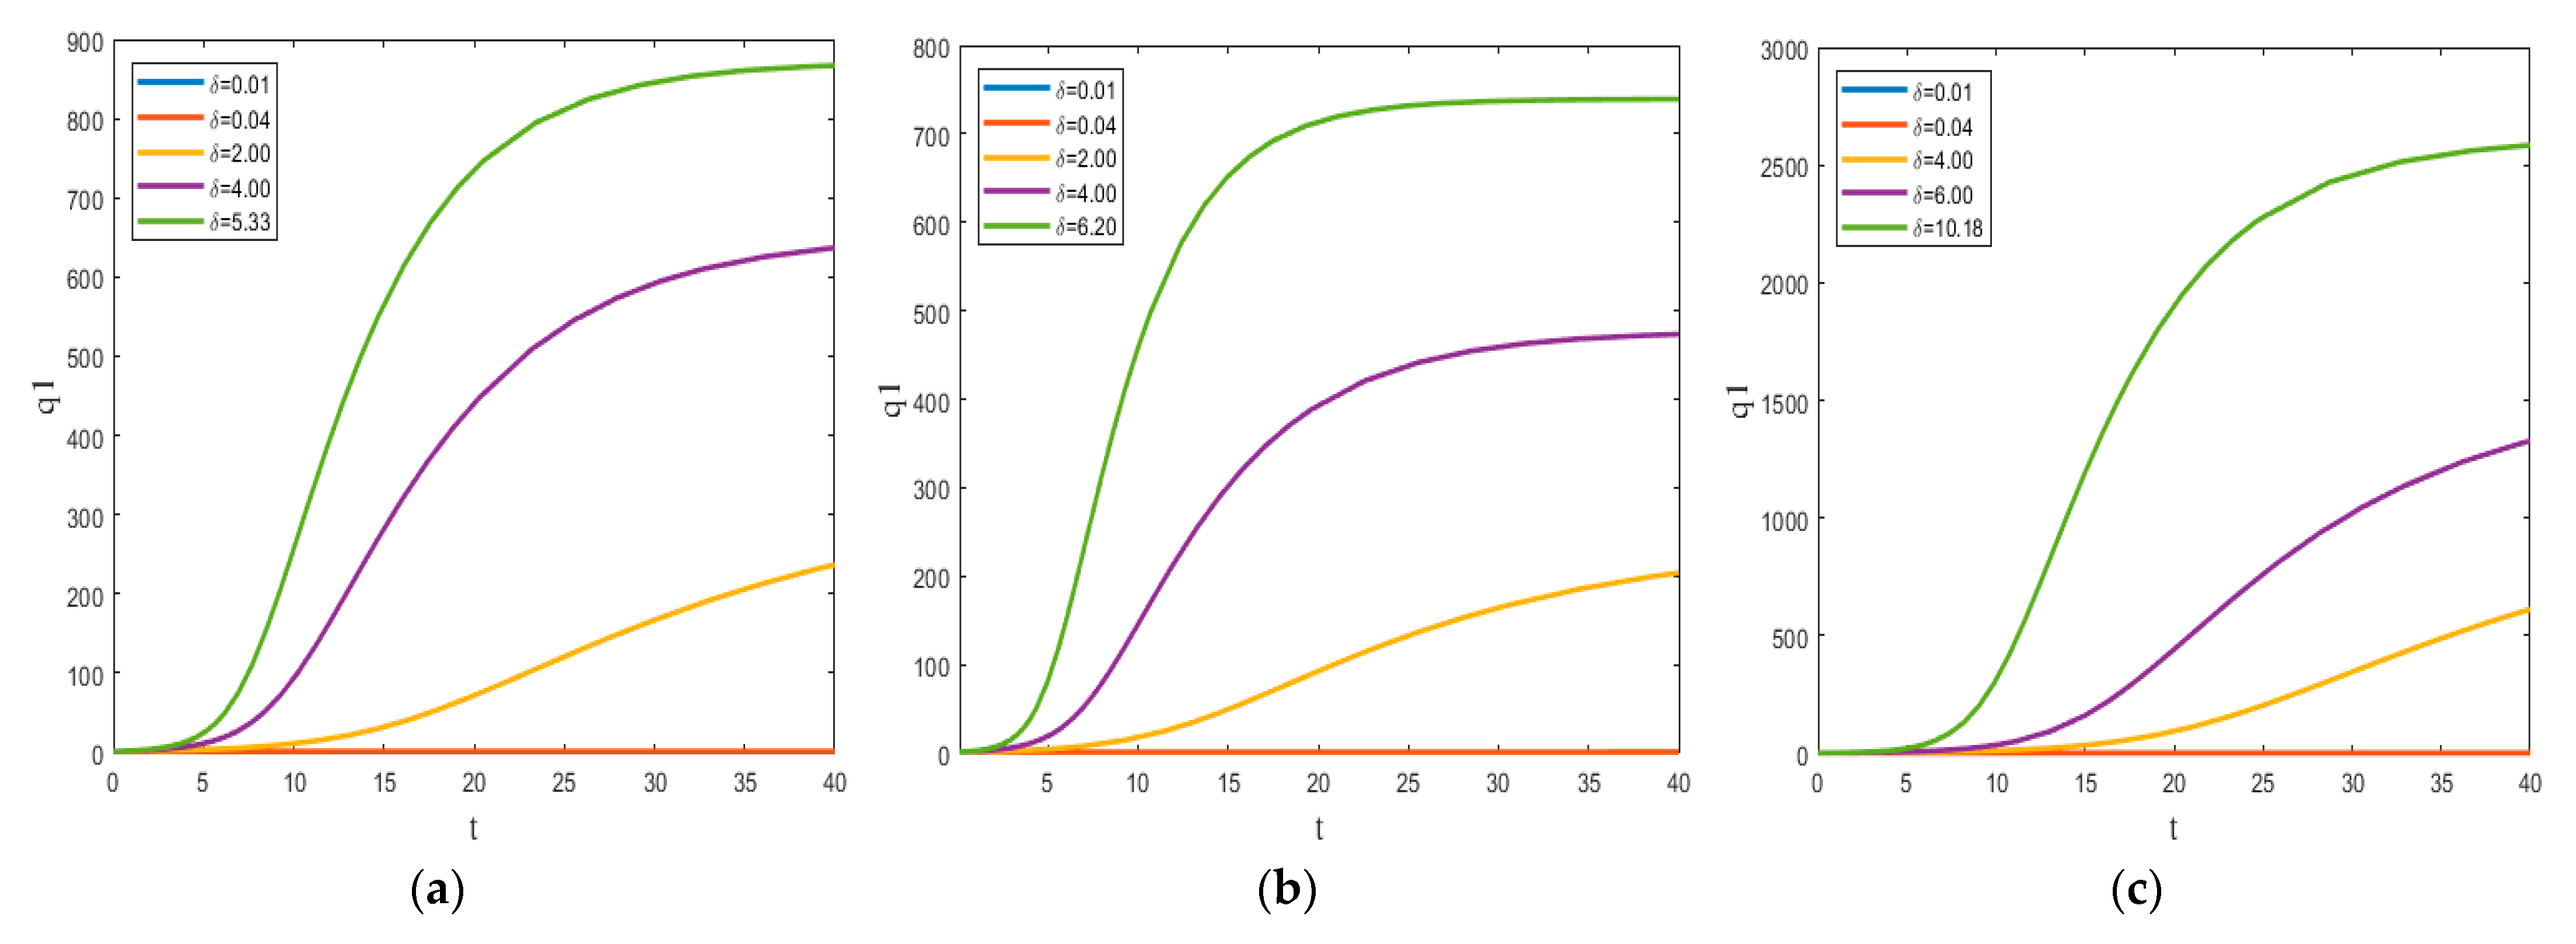
Equation (16) reveals that the external government support index and the network structure embeddedness index exert a measurable influence on network operation. To examine δ’s impact on network operation, we simulate the operation trajectories of the order parameter across varying levels of external government support by adjusting the control variable, as shown in
Figure 7.
Analysis of these trajectories indicates that across all levels of external government support, α as an order parameter dominating network operation develops toward a higher equilibrium level over time. Its evolution presents three-stage characteristics: fluctuation (t < 10, t < 5, and t < 15), convergence (10 ≤ t ≤ 30, 5 ≤ t ≤ 20, and 15 ≤ t ≤ 30), and stabilization (t > 30, t > 20, and t > 30). Furthermore, higher values of δ correspond to higher α, indicating a more pronounced network collaboration effect.
The initial fluctuation stems from early-stage cooperation challenges constrained by multi-dimensional heterogeneity, including geographical proximity, organizational affiliation, social relations, and capability levels. Thereby, entities lack effective matching and in-depth interaction. In this context, heterogeneous entities struggle to coordinate, with teams facing potential dissolution or reorganization, which in turn leads to frequent local adjustments to the network structure. During this phase, the network’s endogenous driving forces are weak, and external government support is inadequate to mitigate these structural obstacles, hindering the network’s progression to a higher development stage.
Once δ exceeds the threshold, α for the three networks rapidly converges to a high equilibrium level at approximately t ≈ 20, t ≈ 15, and t ≈ 15. This reflects that beyond the threshold, external government support effectively breaks down multi-dimensional heterogeneity barriers among entities, facilitating rapid network structure optimization. Conversely, when δ is below the threshold, entities lack collaboration incentives. Network structure optimization is limited by insufficient funding and policy support, leading to a sequential decline in network performance. The network risks falling into a vicious cycle of “structural rigidity–resource exhaustion–output stagnation”. Notably, δ = 0.04 represents the actual observed level of external government support in practice. Comparison of its associated α trajectories across the three networks reveals substantial room for improving α through enhanced government support.
5.3.2. Impact of Network Structure Embeddedness Index on the Operation of Order Parameter
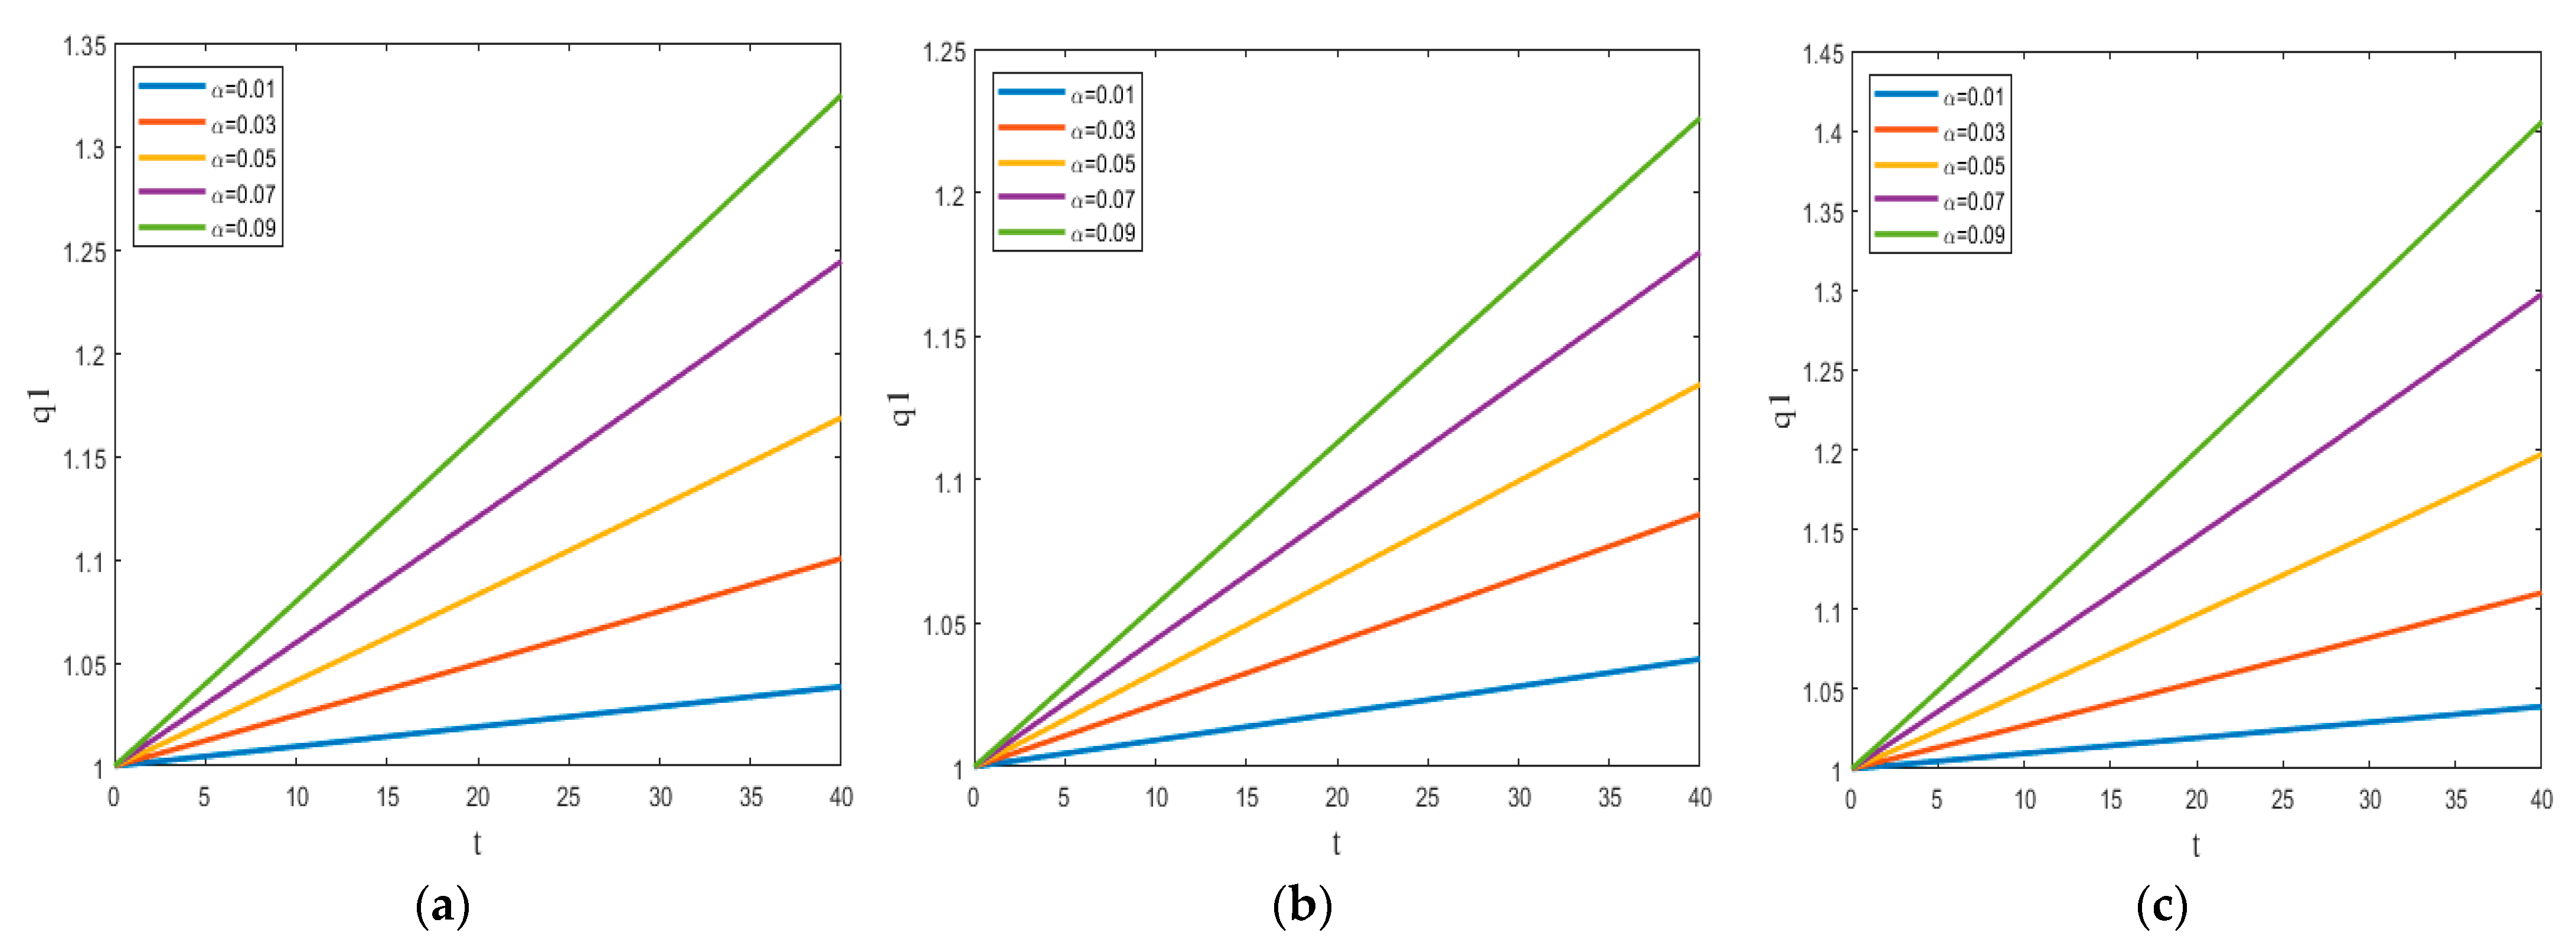
Regarding the impact of the network structure embeddedness index on network operation, since the threshold of δ is related to α, we conduct a simulation analysis of the order parameter operation equation by varying α under the actual δ value. This approach aimed to mitigate bias introduced by the threshold effect. Results are presented in
Figure 8. Analysis reveals that α exhibits a linear growth trend over time as network operation, with the slope increasing as α itself rises. This indicates that α exerts an amplifying effect on enhancing the network structure embeddedness level. Improving α can effectively release the growth potential of the network structure embeddedness and enable the agricultural I-U-R collaborative innovation network to function at a higher level.
5.3.3. Two-Dimensional Matrix Analysis of Factors Influencing the Order Parameter Operation
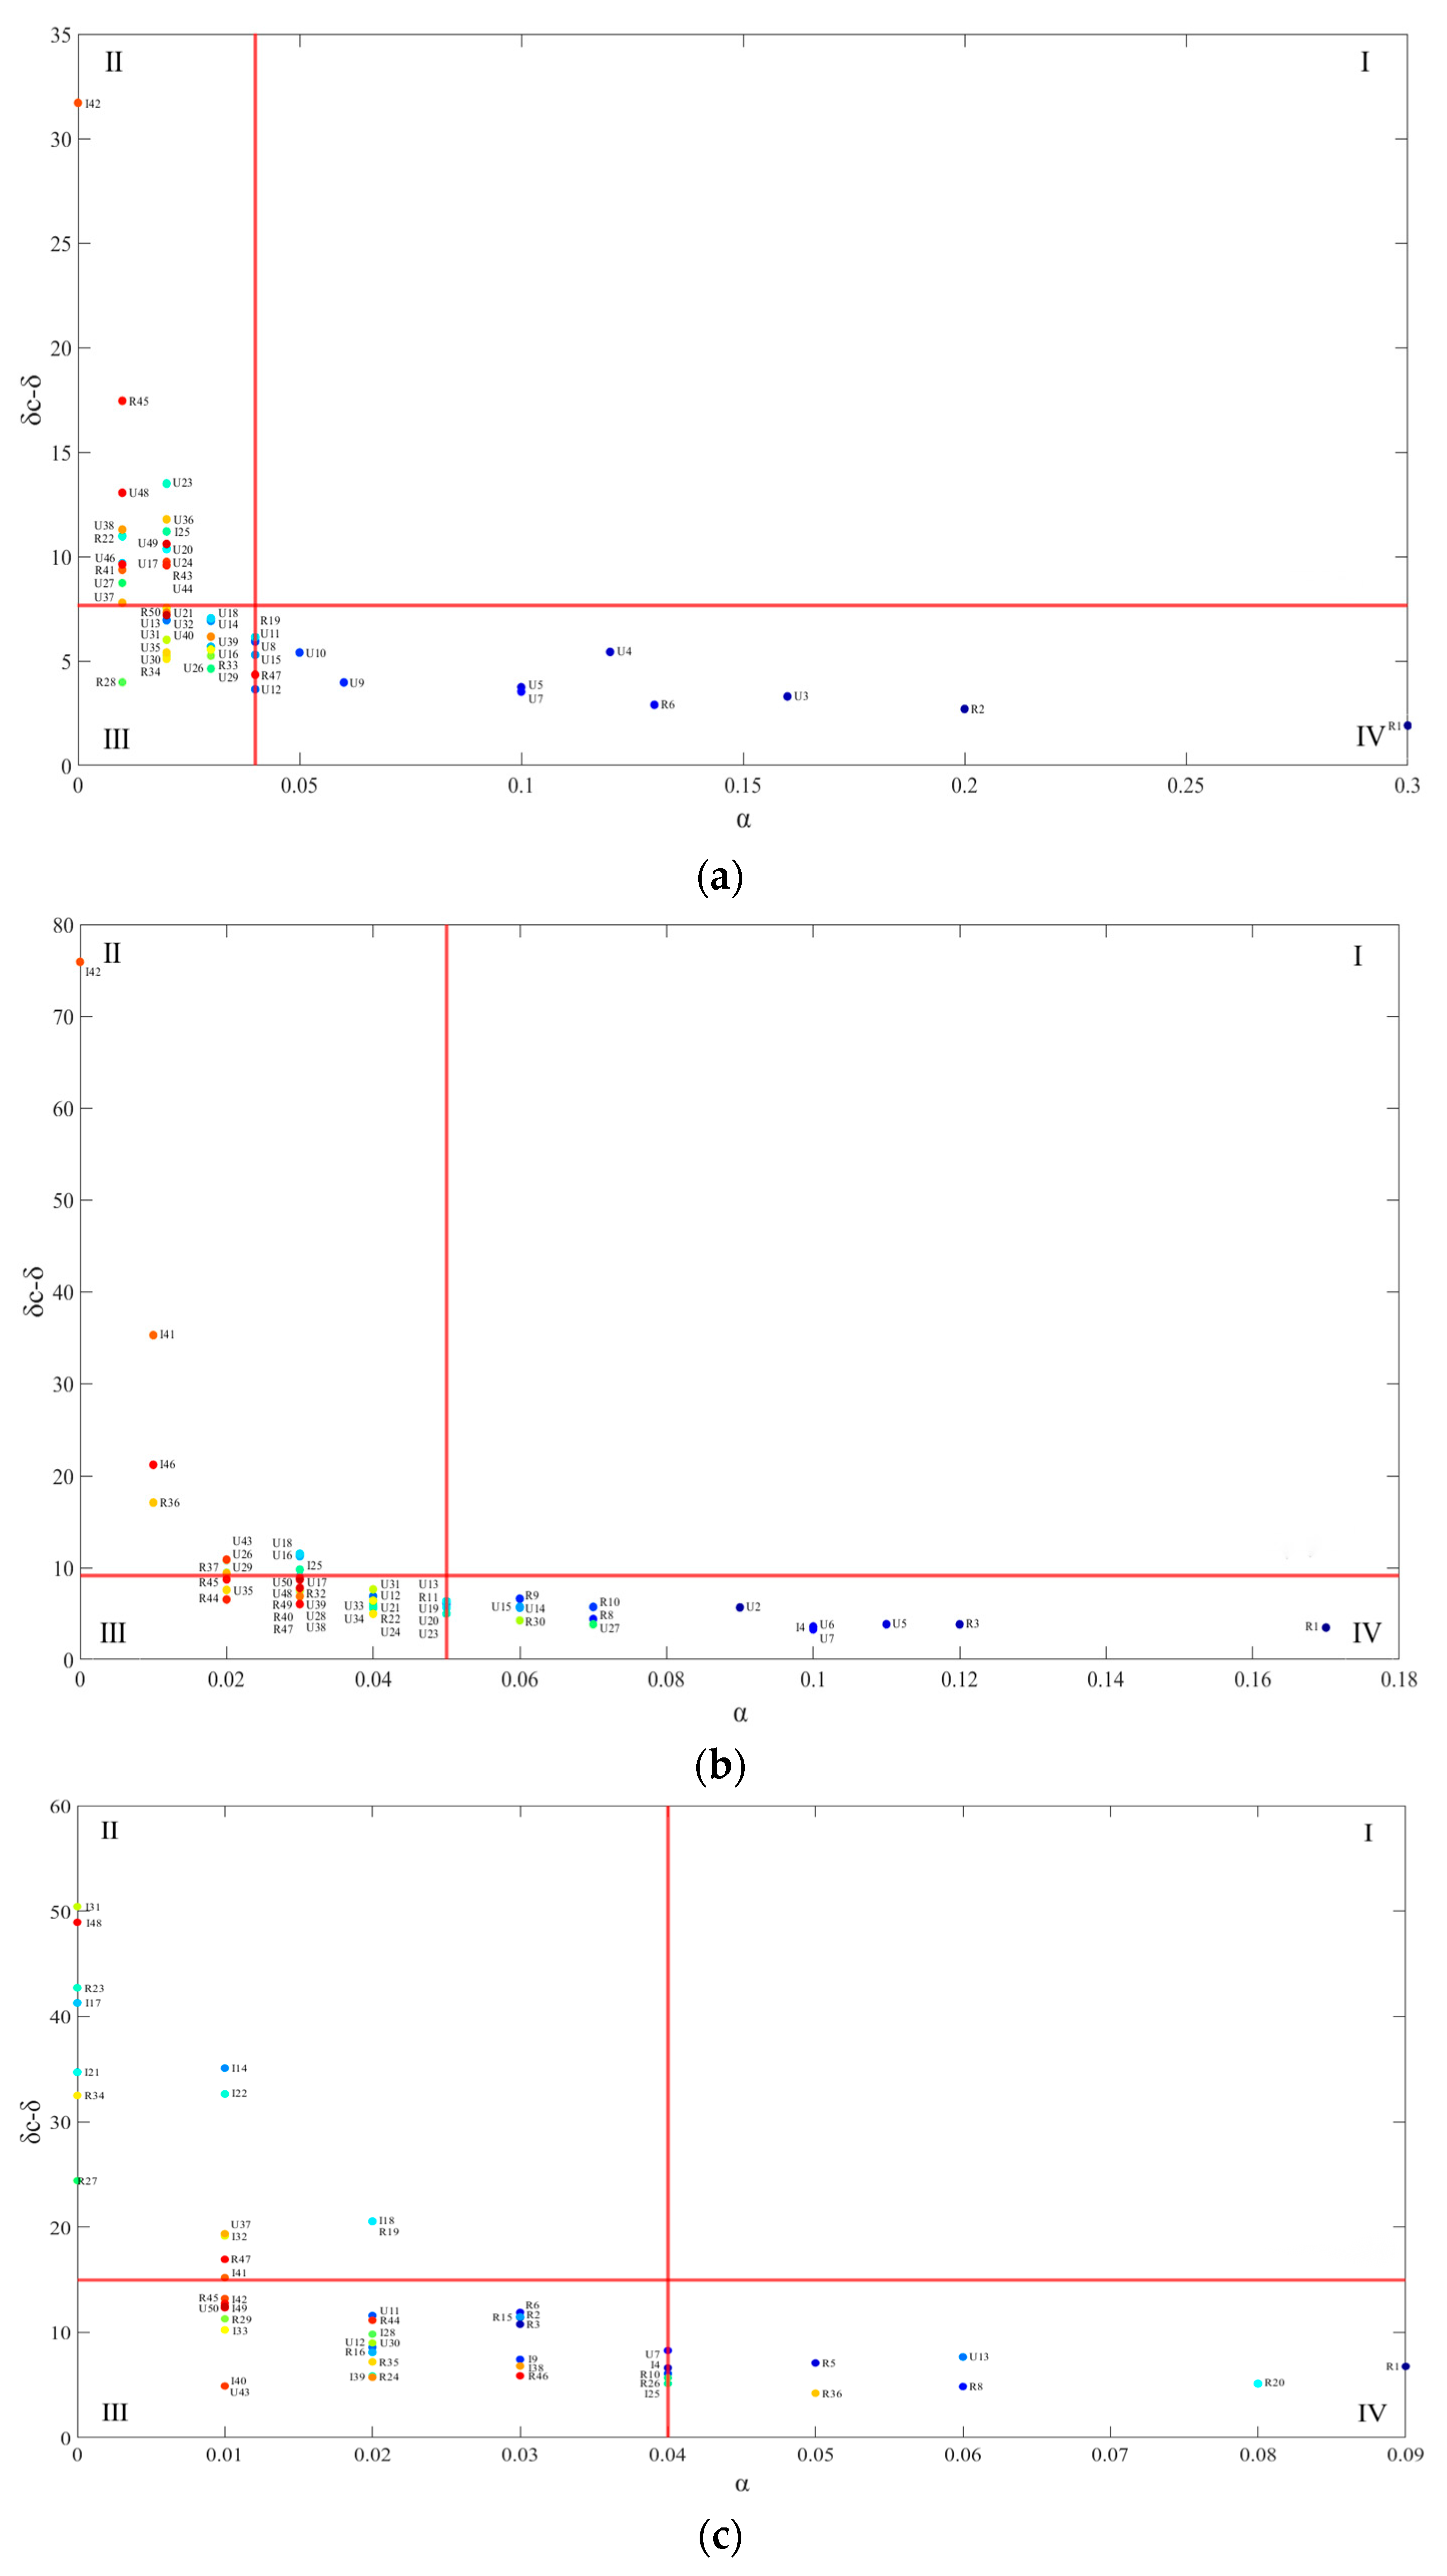
Our simulation analysis above indicates that α and δ are the primary factors affecting order parameter operation. Therefore, improving the level of network structure embeddedness and optimizing the intensity of external government support can effectively promote the network to operate at a higher level. Based on simulation results regarding how α and δ shape the order parameter’s trajectory, we construct two-dimensional matrices for the top 50 entities ranked by strength centrality in the paper, patent, and variety networks. The results are presented in
Figure 9. (We characterized “low-embeddedness” as entities occupying peripheral network positions with limited control over resources and low autonomy in collaborative interactions. In contrast, “high-embeddedness” refers to entities holding central network positions with substantial control over resource flows and high decision-making autonomy. Similarly, “low-support” denotes inadequate government funding coupled with fragmented or inconsistent policy backing for agricultural science, technology and innovation, while “high-support” describes substantial and stable government funding accompanied by coherent, well-implemented policy frameworks in the same domain). As shown, while parameter levels vary significantly across entities, all δ values fall below the threshold.
Entities in the first quadrant, characterized by high network structure embeddedness yet inadequate external government support, do not exist in actual observations. The absence of such entities stems from the fact that entities with excellent network structure embeddedness can secure external government support commensurate with their capacity through their resource integration advantages. This advantage accumulation effect naturally propels high-embeddedness entities beyond the realm of low-intensity external government support, rendering the first quadrant empirically empty.
Entities in the second quadrant exhibit low network structure embeddedness and limited external government support, facing dual developmental constraints of network marginalization and insufficient coverage of external government support. These entities are categorized as “low-embeddedness and low-support” type, accounting for 36%, 22%, and 30% in the paper, patent, and variety networks.
Entities in the third quadrant exhibit low network structure embeddedness but high-intensity external government support. Having long relied on government backing, these entities lack the capacity to proactively integrate resources and confront the policy paradox of resource misallocation, a dynamic that tends to perpetuate a vicious cycle of structural rigidity characterized by “low-embeddedness yet high-support”. Classified as this type, such entities account for 46%, 50%, and 58% in the paper, patent, and variety networks.
Entities in the fourth quadrant exhibit excellent network structure embeddedness and high-intensity external government support, acting as benchmark entities within the networks. Under this “dual-high collaborative” condition, they can foster a virtuous cycle of structural optimization–resource agglomeration–output leap. Classified as this type, these entities account for 18%, 28%, and 12% in the paper, patent, and variety networks.
Combining
Figure 6 and
Figure 9, we derive the classification of each entity, as shown in
Table 5. Among the three networks: “Low-embeddedness and low-support” entities are classified as general types, with no active or stable entities observed. These entities occupy peripheral positions in the networks and possess limited resource integration capacity. Additionally, they confront the dilemma of inadequate external government support, hindering their ability to secure developmentally relevant resources through conventional channels, and their collaborative innovation capacity improves only marginally. Their development model is marked by passive reliance on traditional scientific research pathways, a lack of effective mechanisms to proactively engage with core entities, and a persistent risk of becoming trapped in a low-level lock-in state.
“Low-embeddedness yet high-support” entities are predominantly categorized as stable and general types, with active entities being scarce. Stable entities exhibit high dependence on external government support. Despite receiving substantial government backing, their innovation capacity remains moderate, and network structure embeddedness improves slowly without breakthrough advancements. General entities confront multiple developmental constraints, including geographical disadvantages, insufficient endogenous motivation, and poor information accessibility. They have long relied on government support and lack the capacity to proactively integrate resources. Active entities are limited to I4 and R10 in the variety network. They leverage institutional advantages to absorb external government support and pursue unconventional collaborative innovation pathways, yet they still fail to alleviate the broader “low-embeddedness yet high-support” vicious cycle.
“Dual-high collaborative” entities are predominantly categorized as active and stable types, with a small number of general type exceptions. Active entities leverage their excellent network structure embeddedness and the benefits of external government support to foster a positive feedback loop, namely structural optimization–resource agglomeration–output leap. They continuously expand their competitive advantages through the resource siphoning effect. Stable entities, while fulfilling hub roles in regional networks, face dual constraints, overreliance on traditional development paths, and insufficient upgrading momentum. This places them in a suboptimal equilibrium, making it challenging to transition to the active type. General entities are limited to U14 and U15 in the patent network. Their advantageous resources are misaligned with the patent network’s operation logic, resulting in a dilemma of structural disembeddedness.
5.3.4. Statistical Evaluation of Model Goodness-of-Fit
The Root Mean Square Error (RMSE) quantifies the average deviation between simulated outcomes and empirical observations. To systematically assess the alignment of the theoretical model’s simulations with actual data, this study adopts RMSE as a quantitative indicator for statistical validation.
As shown in
Table 6, within the paper network, the RMSE values for q
1 and q
2 are notably low (0.0525 and 0.0274, respectively), indicating that the model achieves high predictive accuracy for these core state variables. In contrast, the higher RMSE value for q
3 (0.2375) underscores the inherent complexity and multi-factor nature of the collaborative innovation output process. In the patent network, RMSE values are generally moderate, with q
2 exhibiting the best fit (RMSE = 0.1215). The variety network demonstrates particularly strong performance, especially in modeling q
1, where the RMSE value is as low as 0.0104, reflecting the model’s exceptional capacity to capture the structural dynamics of this network.
Collectively, these statistical validation results confirm that the proposed network operation model is not only mathematically sound but also empirically robust. Its ability to effectively replicate observed patterns provides a solid foundation for future policy simulation and targeted intervention analysis.
7. Conclusions
The collaborative efficiency of the three networks shows hierarchical differentiation. The patent network is significantly superior to the paper and variety network in terms of network structure embeddedness, partner heterogeneity, and collaborative innovation output. three networks receive equal levels of actual external government support. However, a higher variety of networks is required to achieve effective collaboration. The network’s demand for external government support increases with technological complexity, collaboration difficulty, and social value. Under ideal conditions with strong external government support, the network achieves a positive cycle: structural optimization, resource agglomeration, and output leap. In actual situations, the network faces gradual structural adjustment, continuous resource loss, and slow output growth.
Eighteen active entities play a significant leading role but are scarce in number, while forty-two stable entities form the backbone of the network but lack innovation momentum. Meanwhile, ninety general entities account for more than half of the total but lag in innovation capability improvement, becoming the main block for network optimization. When comparing the three networks, each faces unique dilemmas. In the paper network, most entities experience both marginalization and insufficient government external support. In contrast, most entities in the patent network can achieve a virtuous cycle of structural optimization, resource agglomeration, and output leap under the dual-high condition. However, in the variety network, most entities tend to fall into a vicious cycle of low embeddedness yet high support. Across all networks, the issues of an excessively large scale of peripheral entities and an insufficient number of benchmark entities coexist. Furthermore, there is a significant mismatch in policy support, providing inefficient aid to dependent entities while failing to adequately support peripheral entities.
“Low-embeddedness and low-support” entities generally have low innovation activity and slow capability improvement. “Low-embeddedness yet high-support” entities either evolve their capabilities gradually or stay stagnant over the long term. Dual-high collaborative entities are mainly characterized by highly active collaborative leadership or stable and continuous improvement, with a relatively low proportion of entities with untapped potential. It can be concluded that the level of network structure embeddedness is the key factor determining agricultural I-U-R collaborative innovation network operation. High external government support must be combined with high network structure embeddedness to be effectively transformed into innovation capacity. Otherwise, it can only strengthen dependence or cause a resource mismatch.