Article

Metabolic Basis of Breast Muscle Flavor in Houdan Chicken Crossbreeds Revealed by GC/LC-MS Metabolomics

1
College of Animal Science and Technology, Henan Agricultural University, Longzihu Campus, Pingan Avenue No. 218, Zhengzhou 450046, China
2
The Shennong Laboratory, Zhengzhou 450046, China
*
Author to whom correspondence should be addressed.
These authors contributed equally to this work.
Agriculture 2025, 15(22), 2360; https://doi.org/10.3390/agriculture15222360
Submission received: 8 October 2025 / Revised: 2 November 2025 / Accepted: 6 November 2025 / Published: 14 November 2025
(This article belongs to the Special Issue Genetic Resource Evaluation and Germplasm Innovation of Poultry)

Abstract

The quality and flavor of chicken meat are fundamentally determined by muscle metabolite composition, which reflects the regulatory effects of genetic background on metabolic pathways and muscle development. In this study, we profiled the meat quality of breast muscle across 3 crossbreeding combinations (D×HD, HD×D, and D×LD) between the Yunong D line and Houdan chickens to elucidate the metabolic mechanisms underlying flavor variation. Eighteen representative breast muscle samples were analyzed using common physicochemical indexes, untargeted metabolomics based on Gas Chromatography-Time-of-Flight Mass Spectrometry (GC-TOF-MS) and Ultra-High-Performance Liquid Chromatography coupled with Quadrupole Exactive Mass Spectrometry (UHPLC-QE-MS). Differential metabolites were identified through Orthogonal Partial Least Squares Discriminant Analysis (OPLS-DA). Multivariate analysis revealed distinct metabolic signatures among crossbreeding combinations, with HD×D exhibiting the most favorable tenderness, color, and water-holding capacity. A total of nine differential metabolites (5 upregulated and 4 downregulated) were identified between D×HD and HD×D, and thirty-eight metabolites (18 upregulated and 27 downregulated) between D×HD and D×LD. The identified metabolites were predominantly associated with amino acid metabolism, lipid biosynthesis, nucleotide turnover, and energy metabolism. Among these, arachidonic acid, taurine, L-alanine, and citric acid exhibited marked intergroup differences. Enrichment analysis based on the Kyoto Encyclopedia of Genes and Genomes (KEGG) indicated significant involvement of pathways such as amino acid biosynthesis, taurine and hypotaurine metabolism, and ABC transporters in flavor formation. Hierarchical clustering and Pearson correlation analyses further delineated synergistic or antagonistic interactions among key metabolites, suggesting the existence of intricate regulatory mechanisms. These findings reveal critical metabolites and metabolic pathways associated with flavor attributes, offering both a theoretical framework and potential molecular targets for enhancing poultry meat quality through breeding strategies.

1. Introduction

With the ongoing optimization of global meat consumption patterns, poultry meat, particularly chicken, has emerged as a crucial source of high-quality dietary protein. Consumer priorities have shifted from quantitative production to qualitative attributes, with flavor and nutritional composition emerging as critical determinants of market value and breeding direction. The flavor of chicken meat is primarily shaped by low-molecular-weight metabolites within muscle tissue, including free amino acids [1], organic acids [2], fatty acids [3], nucleotides [4], and their derivatives [5]. These metabolites collectively contribute to sensory perception and nutritional quality by participating in metabolic pathways regulated by avian genetics and environmental factors [6]. To better understand the biochemical mechanisms underlying chicken meat flavor formation, metabolomics has been increasingly applied in the evaluation of meat quality and in elucidating metabolic variations across breeds [7].This high-throughput analytical approach enables the identification of key metabolic markers associated with muscle development, energy metabolism, and flavor precursors.
The Houdan chicken, a well-known French breed, is recognized for its delicate flavor, lean texture, and low-fat deposition. When introduced into China, it has been used as a parental line in crossbreeding programs aiming to improve flavor and texture in local breeds [8,9]. However, the metabolic mechanisms underlying flavor differentiation among Houdan-derived crossbreeds remain largely unexplored. In this study, three Houdan chicken crossbreeding combinations (D×HD, HD×D, and D×LD) were selected based on their distinct parental contributions, growth performance, and sensory characteristics. The Yunong D line provides excellent growth rate and muscle yield, while the Houdan (HD) and low-leg Houdan (LD) contribute flavor and tenderness traits. By integrating GC-TOF-MS and UHPLC-QE-MS metabolomics, we aimed to comprehensively characterize the metabolite and lipid composition of breast muscle, identify differential pathways related to flavor formation, and clarify how genetic background influences muscle metabolism [10]. This study thus provides both theoretical insight and practical guidance for flavor-oriented breeding in specialty poultry.

2. Materials and Method

2.1. Ethical Statement

All animal experiments and related procedures were performed in accordance with the ethical standards set by the Animal Ethics Committee of Henan Agricultural University (Approval No. 11-0085, issued in October 2022). The study protocol was carefully reviewed and approved by the committee, and every effort was made to ensure the humane treatment of animals and to minimize their distress throughout the experimental process.

2.2. Reagents and Materials

Reagents and Materials: Methanol and acetonitrile were purchased from CNW Technologies (Darmstadt, Germany). Ammonium acetate was obtained from Sigma-Aldrich (St. Louis, MO, USA), and ammonia solution was purchased from Fisher Chemical (Fair Lawn, NK, USA).
Instruments: An ultra-high-performance liquid chromatography system (Thermo Vanquish, Thermo Fisher Scientific, Waltham, MA, USA) equipped with an ACQUITY UPLC® HSS T3 column (2.1 mm × 100 mm, 1.7 μm; Milford, Massachusetts, Waters, USA) was used for chromatographic separation. Mass spectrometric detection was carried out using a Thermo Q Exactive HFX mass spectrometer (Thermo Fisher Scientific, USA). Additionally, a 7890-gas chromatograph (Santa Clara, CA, Agilent Technologies, USA) coupled with a PEGASUS HT mass spectrometer (St. Joseph, MI, LECO Corporation, USA) and a DB-5MS capillary column (30 m × 250 μm × 0.25 μm; Agilent Technologies, USA) was used for GC-MS analysis.

2.3. Animals and Tissue Sampling

The Yunong D line is a genetically stable chicken line developed by the Poultry Genetic Resource Station of Henan Agricultural University through long-term conservation and hybrid selection of indigenous and commercial chicken breeds. In this study, three hybrid combinations were used: D×LD (Yunong D line × low-leg Houdan), D×HD (Yunong D line × Houdan), and HD×D (Houdan × Yunong D line). All fertilized eggs were incubated under identical conditions, and the sex of newly hatched chicks was determined by cloacal examination. Subsequently, fifty healthy males and fifty females from each group were selected and reared under uniform management at the Poultry Genetic Resource Station (Yuanyang County, Xinxiang, China).
The birds were reared in a three-tier cage system under well-ventilated conditions at the Poultry Genetic Resource Station of Henan Agricultural University. According to the growth pattern of poultry, the feeding period was divided into two phases: the starter phase (0–8 weeks) and the grower phase (9–13 weeks). During the starter phase, birds were provided a commercial starter diet (CP Group, Code 520), followed by a grower diet (CP Group, Code 511) during the grower phase. Feed and water were supplied ad libitum to meet the birds’ basic nutritional requirements. The ingredient composition and nutrient levels of the diets are shown in Table 1. The stocking density was maintained at 10 birds/m2, with a 16 h light: 8 h dark photoperiod, ambient temperature of 22–26 °C, and relative humidity of 55–65%.
At 90 days of age, thirty-six birds with comparable body weights were selected (12 per group; 6 males and 6 females). All birds were subjected to a 12 h fasting and water withdrawal period prior to slaughter. The pentobar bital was used for euthanization by vein injection at a dose of 40 mg/kg of body weight according our previous study. After dissection, breast muscle samples were collected from the same side of each carcass. Connective tissue and fascia were carefully removed, and the samples were placed into sterile cryogenic tubes, rapidly frozen in liquid nitrogen, and subsequently stored at –80 °C for further metabolomic analysis. Of the 36 birds, 18 samples were randomly selected for untargeted metabolomic profiling, while all 36 breast muscle samples were used for physicochemical and sensory analyses. The above animal experiments and related procedures were performed in accordance with the ethical standards set by the Animal Ethics Committee of Henan Agricultural University.

3. Experimental Methods

3.1. pH Measurement

The pH of the breast muscle was measured using a portable pH meter (PH-STAR, Matthäus GmbH, Nobitz, Germany) equipped with a direct-insertion glass electrode. The initial pH (pH45) was recorded 45 min postmortem, and the ultimate pH (pH24) was determined after the samples were stored at 4 °C in a refrigerated cabinet for 24 h, then equilibrated to room temperature (22 ± 1 °C). For each sample, the electrode was inserted into three different sites within the same muscle, and the mean value was used for analysis.

3.2. Meat Color Measurement

Meat color parameters (L⁎, a⁎, b⁎) were determined on the right-side pectoralis major muscle using a colorimeter (OPTO-STAR, Matthäus GmbH, Nobitz, Germany) at 1 h postmortem. Measurements were conducted under standardized laboratory lighting at a room temperature of 22 ± 1 °C. Three readings were taken from different positions on each sample, and the average value was recorded to represent lightness (L⁎), redness (a⁎), and yellowness (b⁎).

3.3. Drip Loss Measurement

Standardized breast muscle samples (5 cm × 3 cm × 1 cm) were prepared, gently blotted dry with filter paper, and weighed to obtain the initial weight (W1). Each sample was placed in an inflated, sealed polyethylene bag to avoid direct contact with the inner surface and stored at 4 °C for 24 h. After storage, samples were removed, surface fluids were wiped off, and the final weight (W2) was recorded. Drip loss (%) was calculated according to the following equation:
Drip Loss (%) = [(W1 − W2)/W1] × 100.
This value represents the proportion of water lost from the muscle during refrigerated storage.

3.4. Shear Force Measurement

After determining cooking loss, the breast muscle samples were cut into 1 cm-wide strips parallel to the muscle fiber direction. Each strip was heated in a water bath at 80 °C for 10 min until the internal temperature reached 75 °C, then cooled to room temperature (approximately 25 °C). Shear force was subsequently measured using a texture analyzer (MS-PRO, Shanghai Nirun Intelligent Technology Co., Ltd., Shanghai, China) equipped with a CW-1 Warner–Bratzler shear blade (crosshead speed: 5 mm/s, load cell: 500 N). Each sample was measured at four different positions, and the mean value was recorded as the shear force (N).

3.5. Sensory Evaluation of Breast Muscle Samples

Sensory evaluation of breast muscle samples was conducted by 20 trained panelists (10 males and 10 females, aged 20–55 years). Prior to assessment, all samples were prepared uniformly and maintained at 60 °C in a warming oven to ensure consistent serving temperature. Samples were presented in randomized, coded portions and evaluated in individual booths under controlled conditions with room temperature maintained at approximately 25 °C. Panelists rated the color, aroma, flavor, and overall acceptability of each sample using a 10-point hedonic scale (1 = dislike extremely, 10 = like extremely). Water was provided between samples for palate cleansing. The mean score of each attribute was calculated for subsequent statistical analysis.

3.6. GC-TOF-MS Metabolomics Processing

Approximately 50 ± 1 mg of freeze-dried muscle powder was placed into a 2 mL microcentrifuge tube, and 1 mL of pre-chilled extraction solvent (methanol/acetonitrile/water = 2:2:1, v/v/v) containing 1 mg/mL L-2-chlorophenylalanine as an internal standard was added. The mixture was vortexed for 30 s, homogenized at 35 Hz for 4 min with a stainless-steel bead, and sonicated in an ice-water bath for 5 min. This homogenization–sonication step was repeated three times. The extracts were then incubated at −40 °C for 1 h to precipitate proteins and centrifuged at 12,000 rpm (≈13,800× g) for 15 min at 4 °C. Subsequently, 200 μL of the supernatant was collected, and aliquots from each sample were combined to generate pooled QC samples.
The collected extracts were vacuum-dried and derivatized sequentially with 30 μL of methoxyamine hydrochloride solution (20 mg/mL in pyridine) at 80 °C for 30 min, followed by 40 μL of BSTFA (1% TMCS, v/v) at 70 °C for 1.5 h. After cooling to room temperature, 5 μL of FAMEs in chloroform was added to the QC sample for retention index calibration.
GC-TOF-MS analysis was conducted on an Agilent 7890 gas chromatograph coupled with a LECO time-of-flight mass spectrometer using a DB-5MS capillary column. A 1 μL aliquot was injected in splitless mode with helium as the carrier gas (1 mL/min). The column temperature was programmed from 50 °C (1 min) to 310 °C at 10 °C/min and held for 8 min. The injection port, transfer line, and ion source were maintained at 280 °C, 280 °C, and 250 °C, respectively. Electron impact ionization was performed at −70 eV, scanning m/z 50–500 at 12.5 spectra/s after a 6.25 min solvent delay.
Raw chromatographic data were processed using Chroma TOF software (v4.3x, LECO) for baseline correction, peak extraction, deconvolution, alignment, and integration. Metabolites were identified by comparison with the LECO-Fiehn Rtx5 spectral library. Features detected in fewer than 50% of QC samples or showing RSD > 30% within QC replicates were excluded from further analysis [11].

3.7. UHPLC-QE-MS Metabolomics Processing

A total of 50 mg of tissue sample was mixed with 1 mL of extraction solvent (methanol/acetonitrile/water = 2:2:1, v/v/v) containing an isotopically labeled internal standard mixture. The suspension was homogenized at 35 Hz for 4 min and sonicated for 5 min in an ice-water bath; this process was repeated three times. After incubation at −40 °C for 1 h, the samples were centrifuged at 12,000 rpm for 15 min at 4 °C. The resulting supernatant was collected and transferred into glass vials for instrumental analysis. QC samples were prepared by pooling equal aliquots from all extracts.
UHPLC-MS analysis was carried out using a Vanquish UHPLC system (Thermo Fisher Scientific) fitted with a UPLC BEH Amide column (2.1 × 100 mm, 1.7 μm) and coupled to a Q Exactive HFX Orbitrap mass spectrometer. The mobile phase consisted of (A) 25 mM ammonium acetate + 25 mM ammonia hydroxide (pH 9.75) and (B) acetonitrile. The injection volume was 2 μL, and the autosampler was maintained at 4 °C.
Mass spectra were obtained in data-dependent acquisition (DDA) mode, with the full MS resolution set at 120,000 and MS/MS resolution at 7500. The ESI source parameters were: sheath gas 30 Arb, auxiliary gas 25 Arb, capillary temperature 350 °C, collision energy 10/30/60 eV (NCE mode), and spray voltage +3.6 kV (positive) or −3.2 kV (negative).
Raw data files were converted to mzXML format using ProteoWizard and processed in R with an in-house pipeline based on the XCMS framework for feature detection, extraction, alignment, and integration. Metabolite annotation was achieved using the BiotreeDB database with a similarity threshold of 0.3 [12].

3.8. Data Processing and Analysis

Data organization was performed using Microsoft Excel, with statistical analyses conducted in SPSS 26.0. Intergroup comparisons of production indicators were carried out through one-way analysis of variance (ANOVA), followed by Duncan’s multiple range test for significance assessment. Results are expressed as mean ± standard deviation (X ± SD). All figures were generated with GraphPad Prism 8.0 software [13].
Data matrices from GC-TOF-MS and UHPLC-QE-MS platforms were imported into the SIMCA-P software (version 14.1, Umetrics, Sweden) for multivariate statistical analysis [14]. Unsupervised principal component analysis was first performed to assess sample clustering and detect outliers. Orthogonal partial least squares discriminant analysis (OPLS-DA) was then conducted to identify discriminant metabolites between groups. The quality of the OPLS-DA models was evaluated using R2Y (explained variation) and Q2 (predictive ability) values, and 200-times permutation tests were used to avoid overfitting. Differential metabolites were identified based on the following criteria: variable importance in the projection (VIP) value > 1.0 from the OPLS-DA model, and univariate statistical significance with p < 0.05 (Student’s t-test or ANOVA, depending on the group comparison). Fold change analysis was used to quantify the magnitude of differences between groups. All differential metabolites were annotated and mapped to pathways in the KEGG database (accessed on November 26, 2022, https://www.genome.jp/kegg/). Enrichment analysis was performed using Fisher’s exact test, and pathways with FDR-adjusted p-values < 0.05 were considered statistically significant. Heatmap and volcano plots were generated in R (version 4.2.1) using the “Origin2021” packages [15,16].

4. Results

4.1. Analysis of Breast Muscle Composition

The statistical analysis of meat quality parameters is presented in Table 2. Among the evaluated traits, a significant difference (p < 0.05) was observed only in the breast meat color parameter a⁎, while no significant differences (p > 0.05) were detected for other measured characteristics. Within 24 h postmortem, the pH decline was more pronounced in females than in males, although both exhibited a similar decreasing trend. Female samples also showed generally higher cooking loss compared to males. Sensory evaluation was conducted by a trained panel of 20 assessors of different ages and genders. Under standardized cooking conditions, panelists evaluated the breast meat samples from the different crossbreeding combinations for color, aroma, and flavor using a 10-point hedonic scale. Statistical analysis indicated that the average sensory scores for all crossbred combinations were above 7.5 points. In particular, the female chickens from the HD×D combination received significantly higher overall sensory ratings compared to the other groups (p < 0.05). These findings demonstrate that while all tested products were generally well-accepted by consumers, the HD×D combination was the preferred choice in terms of sensory quality. Notably, breast meat from female chickens tended to receive slightly higher scores than that from males.

4.2. Multivariate Statistical Analysis

To reduce potential interference from external variables, orthogonal partial least squares discriminant analysis (OPLS-DA) was applied to metabolomic profiles obtained from pectoral muscle tissues of different crossbreeding combinations. The score plots demonstrated distinct intragroup clustering and clear intergroup separation, revealing substantial metabolic disparities among the crossbred populations. Specifically, the OPLS-DA model comparing HD×D and D×HD groups yielded R2 = 0.986 and Q2 = 0.678, while the model for D×HD versus D×LD groups showed R2 = 0.972 and Q2 = 0.455 (Figure 1). These parameters indicate high goodness-of-fit and predictive capability of the established models. Additionally, permutation testing confirmed model robustness and reliability, with no overfitting detected, thus validating their applicability for subsequent differential metabolite screening.

4.3. Screening and Analysis of Differential Metabolites

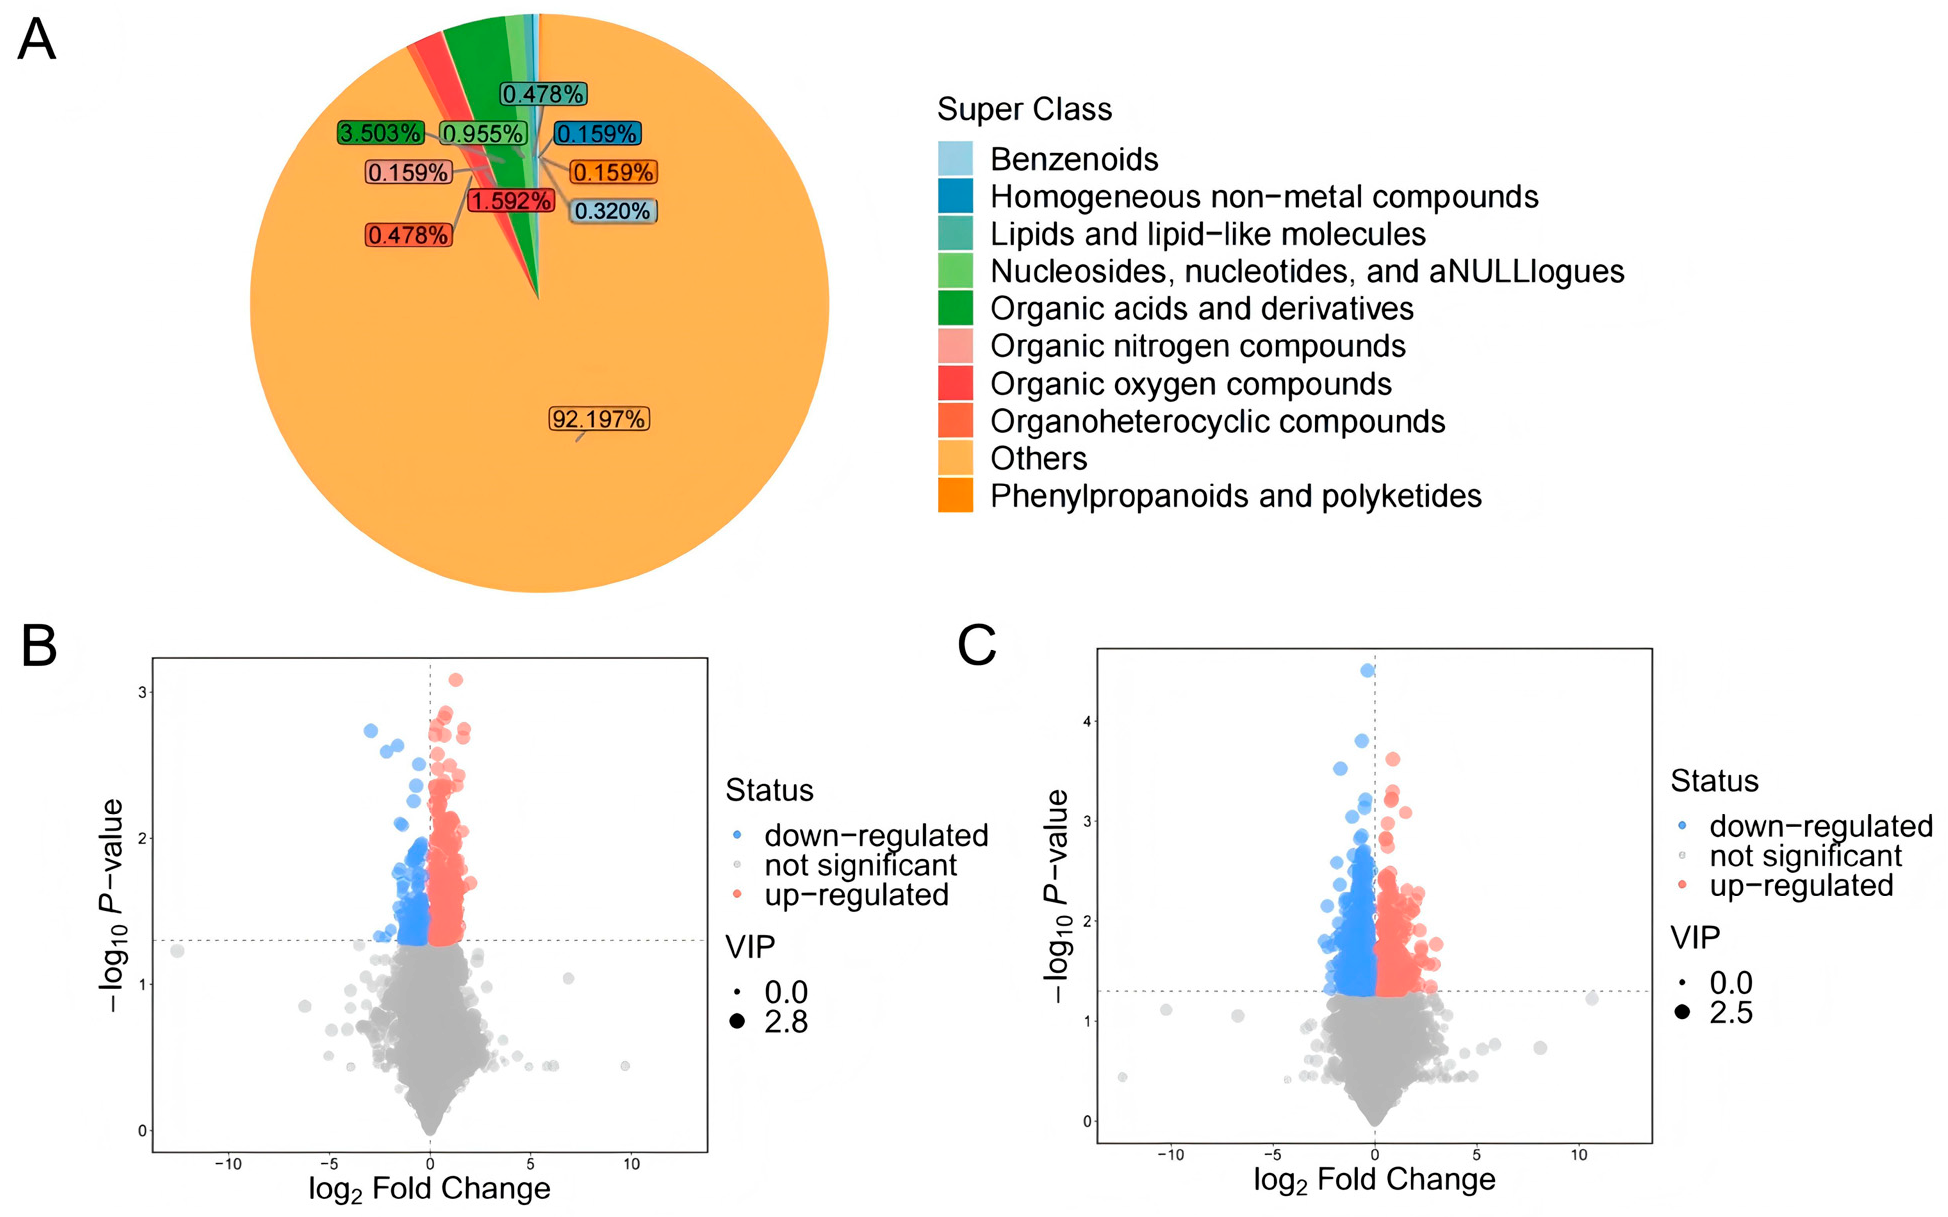
The identified metabolites were systematically classified according to chemical taxonomy and biological function to further delineate their constituent profile. The classification results indicated that lipids and lipid-like molecules, amino acids and their derivatives, organic acids, nucleotides, and other nitrogen-containing heterocyclic compounds constituted the predominant categories of differential metabolites (Figure 2). Organic acids and their derivatives represented the most prevalent category, implying their particular significance in metabolic regulation and flavor development in chicken breast muscle. This systematic categorization establishes a theoretical basis for subsequent pathway enrichment analysis and functional interpretation.
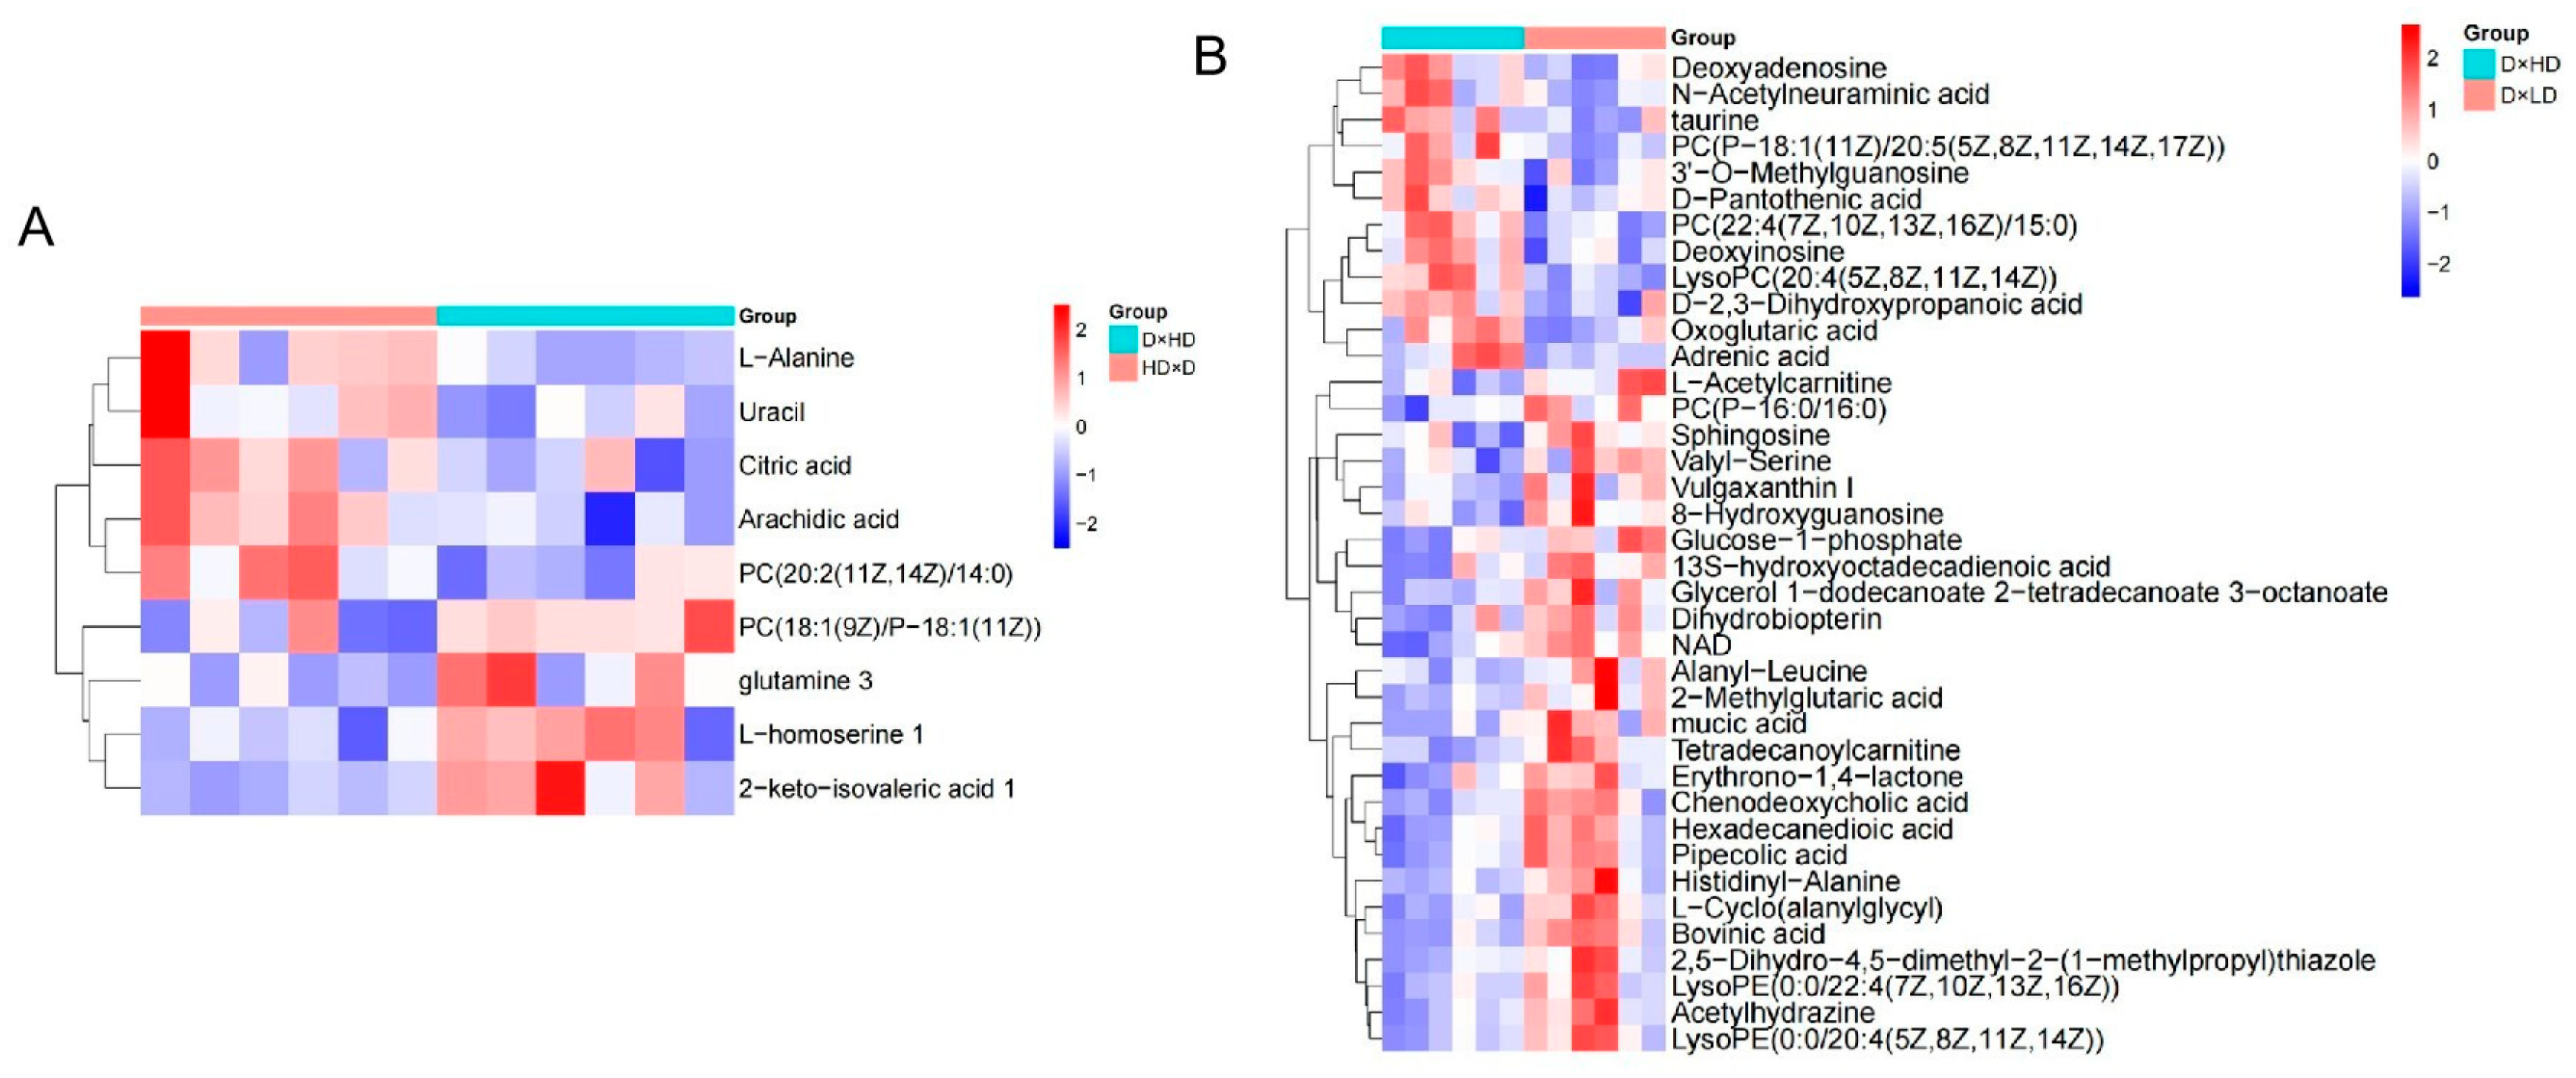
A total of nine significantly different metabolites were identified between the HD×D and D×HD groups, including three lipids, four amino acids and their derivatives, one organic acid, and one nucleotide-related compound (Table 3). Between the D×HD and D×LD groups, 38 differential metabolites were identified, consisting of 13 lipids, six amino acids and analogs, four organic acids and derivatives, and five nucleotide-related compounds (Figure 3). Among these, five metabolites were upregulated (fold change > 1) and four were downregulated in the HD×D and D×HD comparison. In contrast, 11 metabolites were upregulated and 27 were downregulated in the D×HD and D×LD comparison. Notably, lipid and organic acid metabolites tended to be upregulated in the HD×D and D×HD group, whereas lipid and amino acid metabolites were predominantly upregulated in the D×HD and D×LD group. These findings suggest significant metabolic distinctions between the crossbreeding combinations, particularly in lipid metabolism, amino acid biosynthesis, and energy-related pathways, which may contribute to observed differences in breast muscle flavor and nutritional quality (Table 4).

4.4. Hierarchical Clustering Analysis of Differential Metabolites

Hierarchical clustering analysis of the differential metabolites demonstrated distinct expression profiles across the sample groups (Figure 3). Metabolites sharing similar biological functions or participating in common metabolic processes formed discrete clusters, enabling identification of potential functional relationships. In the heatmap, distinct color regions represent specific metabolite clusters, with the upper color bar denoting group classification. Increasing red color intensity corresponds to higher relative metabolite abundance, while blue indicates lower levels. This clustering analysis reveals potential synergistic interactions among metabolites and establishes a foundation for subsequent functional annotation and pathway analysis.

4.5. Differential Metabolite KEGG Pathway Enrichment Analysis

To further elucidate the biological significance of differential metabolites, KEGG pathway enrichment analysis was performed [17]. In the KEGG enrichment plot, each point represents a pathway, and the size of the circle indicates the number of differential metabolites enriched in that pathway. A larger circle indicates a higher number of differential metabolites enriched in the pathway. The color represents the p-value, with smaller p-values indicated by a redder color, indicating a more significant enrichment [18]. In the HD×D and D×HD comparison, nine differential metabolites were enriched in nine pathways, including purine metabolism, alanine, aspartate and glutamate metabolism, D-amino acid metabolism, glyoxylate and dicarboxylate metabolism, nitrogen metabolism, aminoacyl-tRNA biosynthesis, biosynthesis of amino acids, ABC transporters, and general metabolic pathways. Among them, four pathways were associated with amino acid metabolism, two with fundamental metabolic functions, one with transport and regulatory metabolism, and one with nucleotide metabolism (Figure 4).
In contrast, 38 differential metabolites between HD×D and D×LD groups were enriched in only three pathways: taurine and hypotaurine metabolism, ABC transporters, and metabolic pathways. One of these was related to amino acid metabolism and one to transport systems, indicating that the key metabolic distinctions between these two groups primarily involve specific amino acid turnover and cellular regulatory processes.

4.6. Analysis of the Correlation of Metabolites with Differences

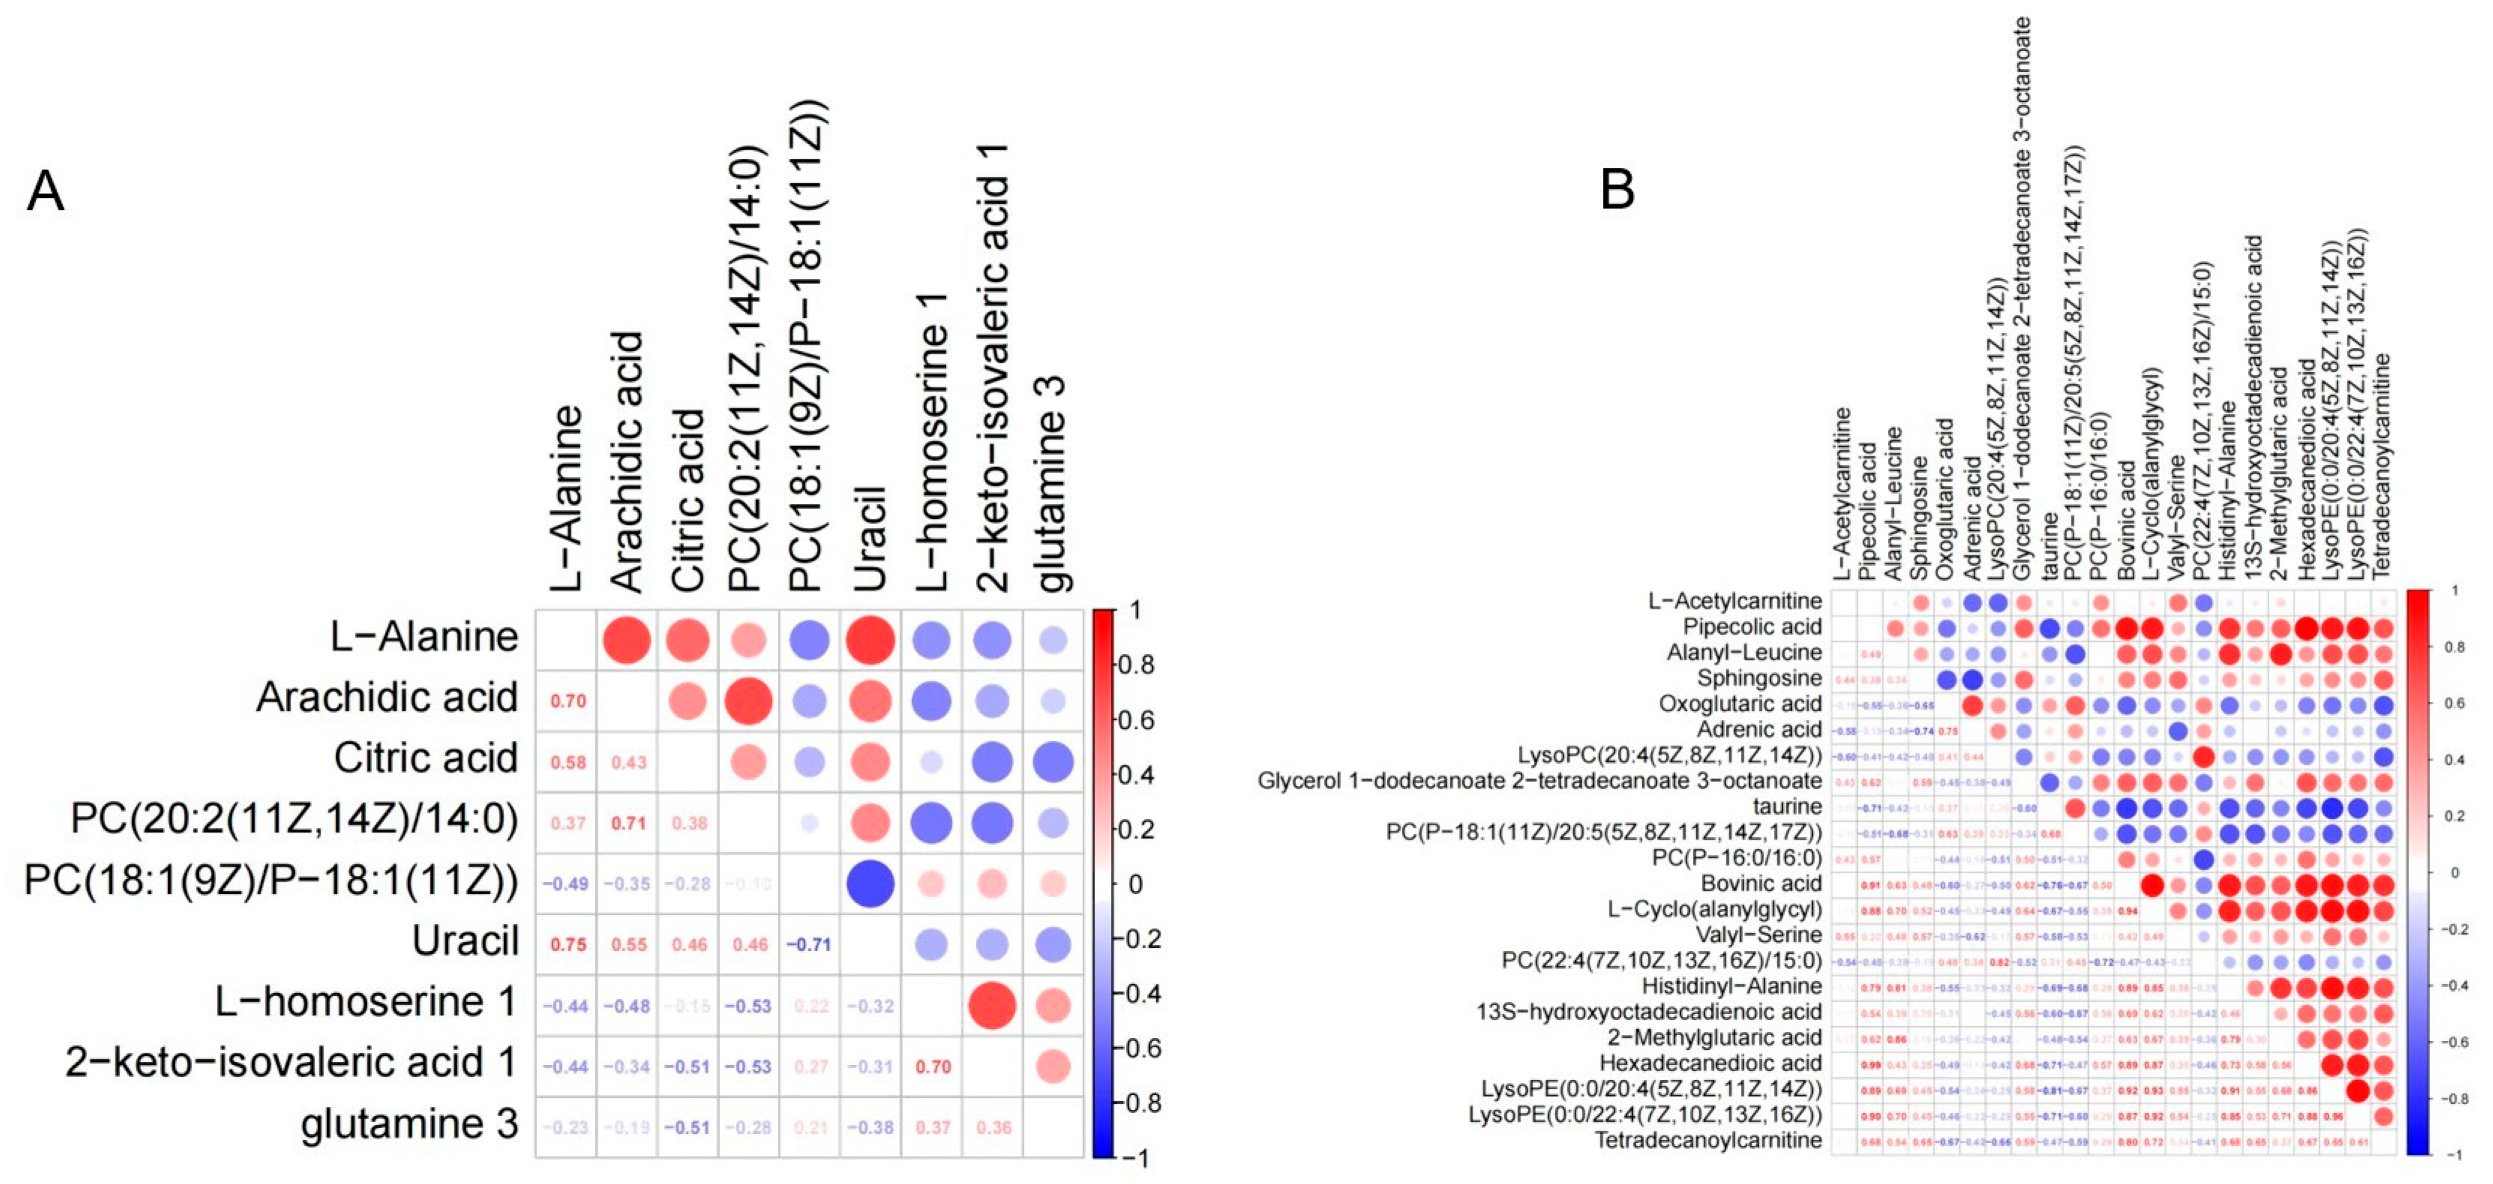
Pearson correlation analysis and heatmap visualization (Figure 5) revealed significant positive and negative correlations among several key metabolites, suggesting potential cooperative or antagonistic metabolic relationships. In the HD×D and D×HD groups, Pipecolic acid showed strong positive correlations with Bovinic acid and L-Cyclo (alanylglycyl), indicating their potential co-involvement in nitrogen metabolism or stress response. Likewise, Hexadecanedioic acid was highly correlated with LysoPE (0:0/20:4) and LysoPE (0:0/22:4), suggesting a coordinated role in membrane lipid remodeling. Tetradecanoylcarnitine was positively correlated with Sphingosine and L-Cyclo(alanylglycyl), suggesting interaction in muscle energy metabolism. In contrast, Oxoglutaric acid showed negative correlations with Sphingosine and Tetradecanoylcarnitine, implying opposing roles in TCA cycle and lipid signaling. Moreover, Taurine was negatively correlated with LysoPE (0:0/20:4), reflecting contrasting roles in antioxidant defense and membrane homeostasis.
In HD×D and D×HD, L-Alanine was positively correlated with Uracil and Arachidic acid, implying co-involvement in amino acid and lipid metabolism; conversely, PC (18:1(9Z)/P-18:1(11Z)) was negatively correlated with Uracil, suggesting functional antagonism. Overall, these correlation patterns highlight the complex metabolic interactions in chicken breast muscle and provide insight into genotype-dependent differences in energy metabolism, amino acid regulation, and membrane lipid remodeling.

5. Discussion

Genetic factors are fundamental determinants of chicken meat quality, as they regulate gene expression, metabolic pathways, and the activity of key enzymes involved in the synthesis and degradation of fatty acids, amino acids, and other metabolites [19,20]. Distinct genomic architectures among breeds or crossbreeding combinations directly influence muscle fiber number, diameter, and fiber-type composition, thereby determining tenderness and texture. Several genes, including MYOD1, MYOG, MYF5 [21], IGF1, IGF2 [22], IGF2BP1 [23], and MSTN [24], have been identified as pivotal regulators of muscle development and growt [25]. In the present study, three crossbreeding combinations—D×HD (Yunong D line × Houdan), HD×D (Houdan × Yunong D line), and D×LD (Yunong D line × low-leg Houdan)—were analyzed to evaluate the influence of genetic background on meat quality traits. Each combination exhibited distinct phenotypic advantages: D×HD demonstrated faster growth rate and greater breast muscle yield; HD×D showed higher intramuscular fat (IMF) content and richer flavor; whereas D×LD has a slower growth rate and a leaner meat type. Both sexes were included to account for potential sex-related differences in metabolism and muscle composition. The Yunong D line, derived from elite local chicken germplasm, contributed to the superior tenderness and characteristic flavor of these hybrids. Previous studies in broilers have indicated that genetic selection effectively enhances body weight, breast muscle yield, and disease resistance, while endocrine factors under partial genetic control—particularly those associated with growth and myogenesis—further shape muscle structure and composition [26,27]. Collectively, these findings highlight the interplay between genetic background and metabolic regulation as a central determinant of chicken meat quality.
Conventional physicochemical indicators, including pH, meat color, shear force, and cooking loss, are essential parameters for assessing chicken meat quality, as they collectively determine consumer acceptability and overall sensory characteristics. The pH value reflects the rate of postmortem glycolysis and thus serves as a crucial indicator of meat freshness and tenderness [28]. After slaughter, muscle glycogen is converted into lactic acid, resulting in a decline in pH within 24 h postmortem. In the present study, breast muscle pH showed a gradual decrease within 24 h, with a greater reduction observed in females than in males, although both exhibited a consistent acidification trend. Meat color is another important trait influencing visual appeal and market value; higher L* values indicate paler meat, while the a* value is positively associated with redness and overall appearance quality [29]. In this study, HD×D males exhibited significantly higher a* values compared with other groups, suggesting superior color intensity and visual quality, whereas females generally displayed lower b* and L* values, indicating darker, more appealing meat coloration. Shear force, representing meat tenderness and texture, showed sex-dependent differences, with males exhibiting higher shear force values than females, suggesting that female breast meat was generally more tender [30]. Cooking loss, which reflects the water-holding capacity of muscle tissue, was higher in females than in males, implying reduced juiciness despite potentially higher dry matter and protein content [31]. Overall, sensory evaluation indicated that hens from the HD×D cross received significantly higher overall ratings than those from other combinations, although no significant differences were observed in their color, aroma, or flavor attributes. Physicochemical analysis revealed that female meat generally had slightly higher tenderness and flavor scores than male meat, albeit these differences were not statistically significant. Collectively, the HD×D cross demonstrated favorable performance in redness (a* value), tenderness, and overall sensory acceptability. These findings suggest that this specific cross may better align with consumer preferences for high-quality chicken meat.
Phospholipids, as major structural components of muscle cell membranes, play a vital role in the generation of characteristic volatile flavor compounds and in maintaining membrane integrity and signaling functions [32,33,34]. In this study, lipidomic analysis revealed that the breast muscles of different crossbreeding combinations exhibited significant variations in phospholipid composition, particularly in polyunsaturated fatty acid (PUFA)-containing glycerophospholipids [35,36]. PUFA-enriched species, such as PC(P-18:1(11Z)/20:5(5Z,8Z,11Z,14Z,17Z)), PC(22:4(7Z,10Z,13Z,16Z)/15:0), and PC(20:2(11Z,14Z)/14:0), were markedly upregulated, whereas PC(18:1(9Z)/P-18:1(11Z)) was consistently downregulated across growth stages. These lipid variations may reflect differences in enzymatic hydrolysis rates and membrane remodeling efficiency between genotypes [37]. Notably, both HD×D and D×HD groups exhibited reduced levels of 13S-hydroxyoctadecadienoic acid (13S-HODE), an oxidative metabolite of linoleic acid known to act as a signaling molecule and PPARγ ligand, regulating lipid metabolism, oxidative stress, and intramuscular fat deposition. Given that 13S-HODE also exhibits antioxidant and anti-inflammatory properties, its reduction may indicate genotype-dependent differences in oxidative stability and lipid-derived flavor precursor synthesis [38]. These findings are consistent with previous reports that highlight the importance of lipid oxidation intermediates in defining chicken meat aroma and stability. Collectively, the observed enrichment of PUFA-containing glycerophospholipids and the differential regulation of oxidative lipid metabolites emphasize the critical role of genetic background in modulating lipid metabolism, which in turn determines both the flavor characteristics and nutritional attributes of chicken meat.
Amino acids and their derivatives represent another crucial class of metabolites that influence both the nutritional value and sensory characteristics of chicken meat [39]. In this study, several amino acid-related metabolites, including L-alanine, glutamine, histidine, isoleucine, alanyl-leucine, valyl-serine, taurine, and histidyl-proline, showed significant variation among the different crossbreeding combinations. Specifically, L-alanine was downregulated in HD×D and D×HD, whereas glutamine and histidine were upregulated, reflecting breed-dependent differences in amino acid metabolism and turnover [40]. L-alanine and glutamine are known contributors to the umami taste, while histidine and isoleucine play essential roles in antioxidant defense, immune regulation, protein synthesis, and muscle fiber growth [41]. The elevated taurine levels observed in certain genotypes also suggest enhanced antioxidative capacity and osmotic regulation, aligning with previous findings that taurine metabolism supports oxidative resistance in chicken muscle [42]. These variations in amino acid composition may underlie the observed differences in flavor and nutritional value among the crossbred groups, particularly between D×HD and D×LD [43,44]. Furthermore, integrating metabolomic and transcriptomic data through gene–metabolite correlation analysis (e.g., WGCNA) could help identify candidate genes regulating amino acid-derived flavor formation, providing new insights into the molecular mechanisms of meat quality differentiation among chicken breeds.
Metabolomic analysis revealed that the metabolic differences among the crossbreeding combinations were primarily enriched in amino acid metabolism and biotin metabolism, suggesting that these pathways are key determinants of the observed variations in meat quality [45]. Notably, nucleotide-related metabolites such as uracil, deoxyadenosine, and 3′-O-methylguanosine differed significantly between groups. Uracil, a central intermediate in pyrimidine metabolism, can be converted into inosine monophosphate (IMP) and guanosine monophosphate (GMP), both of which contribute to the umami taste of chicken meat [46,47]. These findings imply that the flavor differences between HD×D and D×HD may arise from variations in amino acid turnover, nucleotide synthesis, and related regulatory networks affecting energy metabolism and flavor precursor formation.
Biotin metabolism also plays a critical role in fatty acid synthesis, acetylcholine production, and cholesterol metabolism, which collectively influence lipid deposition and energy balance [48]. Previous studies have demonstrated that biotin deficiency in chickens can lead to increased levels of palmitic and linoleic acids, while reducing stearic and arachidonic acids, ultimately disrupting lipid and amino acid metabolism [49]. Consistent with these findings, this study observed significant variations in biotin-related metabolites and fatty acid composition among the crossbred groups, indicating that genetic background may modulate biotin utilization efficiency, thereby affecting flavor, fat deposition, and oxidative stability.
Additionally, the aminoacyl-tRNA biosynthesis pathway and ABC transporters pathway was found to differ between the hybrids, potentially influencing amino acid synthesis and protein translation efficiency [50]. The HD×D group exhibited higher overall amino acid abundance compared to D×HD, consistent with reports in other native breeds such as Cha Hua chickens [45], where enhanced aminoacyl-tRNA activity correlates with improved meat tenderness and flavor. Furthermore, the upregulation of glucose-1-phosphate in D×HD and D×LD suggests more efficient glycogen utilization and flavor precursor synthesis, while variations in citrate levels, a key intermediate of the tricarboxylic acid (TCA) cycle, reflect distinct metabolic efficiencies and redox regulation among genotypes [51]. Together, these results indicate that differences in energy metabolism, oxidative stress response, and metabolite homeostasis collectively contribute to the distinct tenderness, juiciness, and flavor characteristics observed in the various crossbreeding combinations [52].

6. Conclusions

This study comprehensively compared the breast muscle metabolomes of three chicken crossbreeding combinations (HD×D, D×HD, and D×LD) using UHPLC-QE-MS and GC-TOF-MS. Significant differences were identified in lipid metabolism, amino acid biosynthesis, nucleotide turnover, and energy-related pathways. Key metabolites such as taurine, L-alanine, arachidonic acid, and citric acid exhibited genotype-dependent variation, influencing flavor, nutritional value, and texture. These findings highlight the interplay between genetic background and metabolic regulation as major determinants of meat quality, providing molecular insights for identifying flavor-related biomarkers and optimizing breeding strategies to improve poultry meat characteristics.

Author Contributions

Conceptualization, W.L. and X.K.; Methodology, W.X.; Software, C.X.; Validation, C.Z., J.S. and X.J.; Formal Analysis, S.W.; Investigation, Y.M. and Z.C.; Resources, D.L., R.J. and G.S.; Data Curation, C.X.; Writing—Original Draft Preparation, Y.L. and C.X.; Writing—Review and Editing, Y.L., C.X. and W.L.; Visualization, C.Z.; Supervision, D.L. and G.S.; Project Administration, G.S.; Funding Acquisition, W.L. All authors have read and agreed to the published version of the manuscript.

Funding

This research was funded by Wenting Li, the details of the funding are as follows: the Biological Breeding-National Science and Technology Major Project (No. 2023ZD0406403), the Key Research Project of the Shennong Laboratory (No. SN01-2022-05), the Zhongyuan Science and Technology Innovation Young Elite Scientists Project and the Natural Science Foundation of Henan Province (No. 232300421034).

Institutional Review Board Statement

The study was conducted in accordance with the Declaration of Helsinki, and the protocol was approved by the Animal Care and Use Committee (IACUC) of Henan Agricultural University, under approval number 11-0085 on 10 October 2022.

Data Availability Statement

The original contributions presented in this study are included in the article. Further inquiries can be directed to the corresponding author.

Conflicts of Interest

The authors declare no conflicts of interest.

Abbreviations and Nomenclatures

OPLS-DA: Orthogonal partial least squares discriminant analysis; VIP: variable importance in the projection; QC: quality control; GC-TOF-MS: gas chromatography coupled with time-of-flight mass spectrometry; UHPLC-QE-MS: Ultra-High-Performance Liquid Chromatography coupled with Quadrupole Exactive Mass Spectrometry; OPLS-DA: Orthogonal Partial Least Squares Discriminant Analysis; KEGG: Kyoto Encyclopedia of Genes and Genomes.

References

  1. Ueda, S.; Iwamoto, E.; Kato, Y.; Shinohara, M.; Shirai, Y.; Yamanoue, M. Comparative Metabolomics of Japanese Black Cattle Beef and Other Meats Using Gas Chromatography–Mass Spectrometry. Biosci. Biotechnol. Biochem. 2019, 83, 137–147. [Google Scholar] [CrossRef] [PubMed]
  2. Jin, S. Analysis of the Application of Metabolomics in Livestock and Poultry Genetic Breeding. Chin. Livest. Poult. Breed. 2021, 17, 30–31. [Google Scholar]
  3. Marrocco, C.; Zolla, V.; Zolla, L. Meat Quality of the Longissimus Lumborum Muscle of Casertana and Large White Pigs: Metabolomics and Proteomics Intertwined. J. Proteom. 2011, 75, 610–627. [Google Scholar] [CrossRef] [PubMed]
  4. Jastrebski, S.F.; Lamont, S.J.; Schmidt, C.J. Chicken Hepatic Response to Chronic Heat Stress Using Integrated Transcriptome and Metabolome Analysis. PLoS ONE 2017, 12, e0181900. [Google Scholar] [CrossRef]
  5. Goldansaz, S.A.; Guo, A.C.; Sajed, T.; Steele, M.A.; Plastow, G.S.; Wishart, D.S. Livestock Metabolomics and the Livestock Metabolome: A Systematic Review. PLoS ONE 2017, 12, e0177675. [Google Scholar] [CrossRef]
  6. Baira, E.; Dagla, I.; Siapi, E.; Zoumpoulakis, P.; Simitzis, P.; Goliomytis, M.; Deligeorgis, S.G.; Skaltsounis, A.L.; Gikas, E. Uhplc–Hrms-Based Tissue Untargeted Metabolomics Study of Naringin and Hesperidin after Dietary Supplementation in Chickens. Food Chem. 2018, 269, 276–285. [Google Scholar] [CrossRef]
  7. Patti, G.J.; Yanes, O.; Siuzdak, G. Metabolomics: The Apogee of the Omics Trilogy. Nat. Rev. Mol. Cell Biol. 2012, 13, 263–269. [Google Scholar] [CrossRef]
  8. Ma, Y.; Jia, X.; Tang, X.; Fan, Y.; Lu, J. Comparative Study on the Chicken Quality among Different Local Chicken Breeds. J. Anhui Agric. Sci. 2023, 51, 80–88. [Google Scholar]
  9. Peng, Z.; Xu, Z.; Zhang, Y.; Zhang, D. Meat Quality Evaluation of Different Varieties of Quality Broilers. China Poult. 2019, 41, 56–59. [Google Scholar]
  10. Harlina, P.W.; Maritha, V.; Musfiroh, I.; Huda, S.; Sukri, N.; Muchtaridi, M. Possibilities of Liquid Chromatography Mass Spectrometry (Lc-Ms)-Based Metabolomics and Lipidomics in the Authentication of Meat Products: A Mini Review. Food Sci. Anim. Resour. 2022, 42, 744. [Google Scholar] [CrossRef]
  11. Zhang, T.; Zhang, S.; Chen, L.; Ding, H.; Wu, P.; Zhang, G.; Xie, K.; Dai, G.; Wang, J. Uhplc–Ms/Ms-Based Nontargeted Metabolomics Analysis Reveals Biomarkers Related to the Freshness of Chilled Chicken. Foods 2020, 9, 1326. [Google Scholar] [CrossRef] [PubMed]
  12. Xu, M.; Qian, K.; Shao, H.; Yao, Y.; Nair, V.; Ye, J.; Qin, A. Metabolomics Analysis of Cef Cells Infected with Avian Leukosis Virus Subgroup J Based on Uhplc-Qe-Ms. Poult. Sci. 2024, 103, 103693. [Google Scholar] [CrossRef] [PubMed]
  13. Mortazavi, A.; Williams, B.A.; McCue, K.; Schaeffer, L.; Wold, B. Mapping and Quantifying Mammalian Transcriptomes by RNA-Seq. Nat. Methods 2008, 5, 621–628. [Google Scholar] [CrossRef] [PubMed]
  14. Love, M.I.; Huber, W.; Anders, S. Moderated Estimation of Fold Change and Dispersion for RNA-Seq Data with Deseq2. Genome Biol. 2014, 15, 550. [Google Scholar] [CrossRef]
  15. Bylesjö, M.; Eriksson, D.; Kusano, M.; Moritz, T.; Trygg, J. Data Integration in Plant Biology: The O2pls Method for Combined Modeling of Transcript and Metabolite Data. Plant J. 2007, 52, 1181–1191. [Google Scholar] [CrossRef]
  16. Kirwan, G.M.; Johansson, E.; Kleemann, R.; Verheij, E.R.; Wheelock, Å.M.; Goto, S.; Trygg, J.; Wheelock, C.E. Building Multivariate Systems Biology Models. Anal. Chem. 2012, 84, 7064–7071. [Google Scholar] [CrossRef]
  17. Albergamo, A.; Vadalà, R.; Metro, D.; Giuffrida, D.; Monaco, F.; Pergolizzi, S.; Leonardi, M.; Bartolomeo, G.; Petracci, M.; Cicero, N. Effect of Dietary Enrichment with Flaxseed, Vitamin E and Selenium, and of Market Class on the Broiler Breast Meat—Part 2: Technological and Sensorial Traits. Foods 2022, 11, 2567. [Google Scholar] [CrossRef]
  18. Zhang, S.; Wang, C.Y.; Feng, Y.C.; Sheng, Y.N.; Fu, T.X.; Zhang, Y.W.; Jiang, Y.J.; Yu, M.; Zhang, L.Y. Analysis of Metabolites in Rice Produced in Different Regions by Gc-Ms-Based Metabonomics. Food Sci. 2021, 42, 206–213. [Google Scholar]
  19. Bailey, R.A.; Souza, E.; Avendano, S. Characterising the Influence of Genetics on Breast Muscle Myopathies in Broiler Chickens. Front. Physiol. 2020, 11, 1041. [Google Scholar] [CrossRef]
  20. Zhou, H.; Mitchell, A.; McMurtry, J.; Ashwell, C.; Lamont, S.J. Insulin-Like Growth Factor-I Gene Polymorphism Associations with Growth, Body Composition, Skeleton Integrity, and Metabolic Traits in Chickens. Poult. Sci. 2005, 84, 212–219. [Google Scholar] [CrossRef]
  21. Yousefi, K.; Allymehr, M.; Talebi, A.; Tukmechi, A. A Comparative Study on the Expression of Myogenic Genes, and Their Effects on Performance and Meat Quality in Broiler Chicken Strains. Vet. Res. Forum 2024, 15, 243–250. [Google Scholar] [PubMed]
  22. Nattrass, G.S.; Quigley, S.P.; Gardner, G.E.; Bawden, C.S.; McLaughlan, C.J.; Hegarty, R.S.; Greenwood, P.L. Genotypic and Nutritional Regulation of Gene Expression in Two Sheep Hindlimb Muscles with Distinct Myofibre and Metabolic Characteristics. Aust. J. Agric. Res. 2006, 57, 691–698. [Google Scholar] [CrossRef]
  23. Wang, K.; Hu, H.; Tian, Y.; Li, J.; Scheben, A.; Zhang, C.; Li, Y.; Wu, J.; Yang, L.; Fan, X. The Chicken Pan-Genome Reveals Gene Content Variation and a Promoter Region Deletion in Igf2bp1 Affecting Body Size. Mol. Biol. Evol. 2021, 38, 5066–5081. [Google Scholar] [CrossRef] [PubMed]
  24. Nawaz, A.H.; Ding, J.; Ali, M.; Leng, D.; Mukhtar, N.; Ali, A.; Feng, C. Decoding Chicken Growth Regulation through Multi-Omics Insights and Emerging Genetic Tools for Growth Optimization. Poult. Sci. 2025, 104, 105542. [Google Scholar] [CrossRef]
  25. Rehfeldt, C.; Te Pas, M.F.W.; Wimmers, K.; Brameld, J.M.; Nissen, P.M.; Berri, C.; Valente, L.M.P.; Power, D.M.; Picard, B.; Stickland, N.C. Advances in Research on the Prenatal Development of Skeletal Muscle in Animals in Relation to the Quality of Muscle-Based Food. Ii–Genetic Factors Related to Animal Performance and Advances in Methodology. Animal 2011, 5, 718–730. [Google Scholar] [CrossRef]
  26. Chen, X.; Tian, Y.Y.; Zhang, L.X. The Changes of Metabolites During the Withering Process of White Tea Based on Hilic Lc-Qqq Ms Method. J. Tea Sci. 2020, 40, 238–249. [Google Scholar]
  27. Kawarasaki, S.; Matsuo, K.; Kuwata, H.; Zhou, L.; Kwon, J.; Ni, Z.; Takahashi, H.; Nomura, W.; Kenmotsu, H.; Inoue, K. Screening of Flavor Compounds Using Ucp1-Luciferase Reporter Beige Adipocytes Identified 5-Methylquinoxaline as a Novel Ucp1-Inducing Compound. Biosci. Biotechnol. Biochem. 2022, 86, 380–389. [Google Scholar] [CrossRef]
  28. Hamoen, J.R.; Vollebregt, H.M.; Van Der Sman, R.G. Prediction of the Time Evolution of Ph in Meat. Food Chem. 2013, 141, 2363–2372. [Google Scholar] [CrossRef]
  29. Abdullah, A.Y.; Al-Beitawi, N.A.; Rjoup, M.M.S.; Qudsieh, R.I.; Ishmais, M.A.A. Growth Performance, Carcass and Meat Quality Characteristics of Different Commercial Crosses of Broiler Strains of Chicken. J. Poult. Sci. 2010, 47, 13–21. [Google Scholar] [CrossRef]
  30. Cao, C.; Xiao, Z.; Ge, C.; Wu, Y. Application and Research Progress of Proteomics in Chicken Meat Quality and Identification: A Review. Food Rev. Int. 2022, 38, 313–334. [Google Scholar] [CrossRef]
  31. Xiao, Z. Study on Changes of Flavor Compounds of Chinese Local Chicken with Different Age and Breed Based on Metabolomic; Nanjing Agricultural University: Nanjing, China, 2018. [Google Scholar]
  32. Mottram, D.S. Flavour Formation in Meat and Meat Products: A Review. Food Chem. 1998, 62, 415–424. [Google Scholar] [CrossRef]
  33. Wood, J.D.; Enser, M.; Fisher, A.V.; Nute, G.R.; Sheard, P.R.; Richardson, R.I.; Hughes, S.I.; Whittington, F.M. Fat Deposition, Fatty Acid Composition and Meat Quality: A Review. Meat Sci. 2008, 78, 343–358. [Google Scholar] [CrossRef] [PubMed]
  34. Petrova, I.; Aasen, I.M.; Rustad, T.; Eikevik, T.M. Manufacture of Dry-Cured Ham: A Review. Part 1. Biochemical Changes During the Technological Process. Eur. Food Res. Technol. 2015, 241, 587–599. [Google Scholar] [CrossRef]
  35. Fan, M.; Xiao, Q.; Xie, J.; Cheng, J.; Sun, B.; Du, W.; Wang, Y.; Wang, T. Aroma Compounds in Chicken Broths of Beijing Youji and Commercial Broilers. J. Agric. Food Chem. 2018, 66, 10242–10251. [Google Scholar] [CrossRef]
  36. Carrizo, D.; Chevallier, O.P.; Woodside, J.V.; Brennan, S.F.; Cantwell, M.M.; Cuskelly, G.; Elliott, C.T. Untargeted Metabolomic Analysis of Human Serum Samples Associated with Exposure Levels of Persistent Organic Pollutants Indicate Important Perturbations in Sphingolipids and Glycerophospholipids Levels. Chemosphere 2017, 168, 731–738. [Google Scholar] [CrossRef]
  37. Skrivan, M.; Skrivanova, V.; Marounek, M.; Tumova, E.; Wolf, J. Influence of Dietary Fat Source and Copper Supplementation on Broiler Performance, Fatty Acid Profile of Meat and Depot Fat, and on Cholesterol Content in Meat. Br. Poult. Sci. 2000, 41, 608–614. [Google Scholar] [CrossRef]
  38. Meng, J.; Ma, N.; Liu, H.; Liu, J.; Liu, J.; Wang, J.; He, X.; Zhao, X. Untargeted and Targeted Metabolomics Profiling Reveals the Underlying Pathogenesis and Abnormal Arachidonic Acid Metabolism in Laying Hens with Fatty Liver Hemorrhagic Syndrome. Poult. Sci. 2021, 100, 101320. [Google Scholar] [CrossRef]
  39. Hayabuchi, H.; Morita, R.; Ohta, M.; Nanri, A.; Matsumoto, H.; Fujitani, S.; Yoshida, S.; Ito, S.; Sakima, A.; Takase, H. Validation of Preferred Salt Concentration in Soup Based on a Randomized Blinded Experiment in Multiple Regions in Japan—Influence of Umami (L-Glutamate) on Saltiness and Palatability of Low-Salt Solutions. Hypertens. Res. 2020, 43, 525–533. [Google Scholar] [CrossRef]
  40. Su, Z.; Bai, X.; Wang, H.; Wang, S.; Chen, C.; Xiao, F.; Guo, H.; Gao, H.; Leng, L.; Li, H. Identification of Biomarkers Associated with the Feed Efficiency by Metabolomics Profiling: Results from the Broiler Lines Divergent for High or Low Abdominal Fat Content. J. Anim. Sci. Biotechnol. 2022, 13, 122. [Google Scholar] [CrossRef]
  41. Zhang, L.; Han, L.; Li, Z.L. Amino Acids and Volatile Flavor Components in Meat of San Huang Chicken in Stocking Mode. Sci. Technol. Food Ind. 2012, 33, 172–176. [Google Scholar]
  42. Walaszek, Z.; Szemraj, J.; Hanausek, M.; Adams, A.K.; Sherman, U. D-Glucaric Acid Content of Various Fruits and Vegetables and Cholesterol-Lowering Effects of Dietary D-Glucarate in the Rat. Nutr. Res. 1996, 16, 673–681. [Google Scholar] [CrossRef]
  43. Dai, C.H.; He, R.H.; Huang, L.R.; Ma, H.L. Effects of Taurine on the Nutrition and Physiological Function of Animals. Anim. Breed. Feed 2023, 22, 36–41. [Google Scholar]
  44. Kim, W.K.; Singh, A.K.; Wang, J.; Applegate, T. Functional Role of Branched Chain Amino Acids in Poultry: A Review. Poult. Sci. 2022, 101, 101715. [Google Scholar] [CrossRef] [PubMed]
  45. Liu, Y.; Liang, S.; Wang, K.; Zi, X.; Zhang, R.; Wang, G.; Kang, J.; Li, Z.; Dou, T.; Ge, C. Physicochemical, Nutritional Properties and Metabolomics Analysis Fat Deposition Mechanism of Chahua Chicken No. 2 and Yao Chicken. Genes 2022, 13, 1358. [Google Scholar] [CrossRef]
  46. Kawai, M.; Okiyama, A.; Ueda, Y. Taste Enhancements between Various Amino Acids and Imp. Chem. Senses 2002, 27, 739–745. [Google Scholar] [CrossRef]
  47. Kuchiba-Manabe, M.; Matoba, T.; Hasegawa, K. Sensory Changes in Umami Taste of Inosine 5′-Monophosphate Solution after Heating. J. Food Sci. 1991, 56, 1429–1432. [Google Scholar] [CrossRef]
  48. Dominguez, L.J.; Barbagallo, M.; Muñoz-Garcia, M.; Godos, J.; Martinez-Gonzalez, M.A. Dietary Patterns and Cognitive Decline: Key Features for Prevention. Curr. Pharm. Des. 2019, 25, 2428–2442. [Google Scholar] [CrossRef]
  49. Jankowska, M.; Rutkowski, B.; Dębska-Ślizień, A. Vitamins and Microelement Bioavailability in Different Stages of Chronic Kidney Disease. Nutrients 2017, 9, 282. [Google Scholar] [CrossRef]
  50. Wang, S. Effects of Citric Acid on Growth, Immune, Digestive Tract and Blood Indexes in Broilers; Inner Mongolia Agricultural University: Hohhot, China, 2010. [Google Scholar]
  51. Zhang, Y. Glucose-1-Phosphate Production from Starch by Recombinant Glucan Phosphorylase; Zhejiang University: Hangzhou, China, 2015. [Google Scholar]
  52. Dashdorj, D.; Amna, T.; Hwang, I. Influence of Specific Taste-Active Components on Meat Flavor as Affected by Intrinsic and Extrinsic Factors: An Overview. Eur. Food Res. Technol. 2015, 241, 157–171. [Google Scholar] [CrossRef]
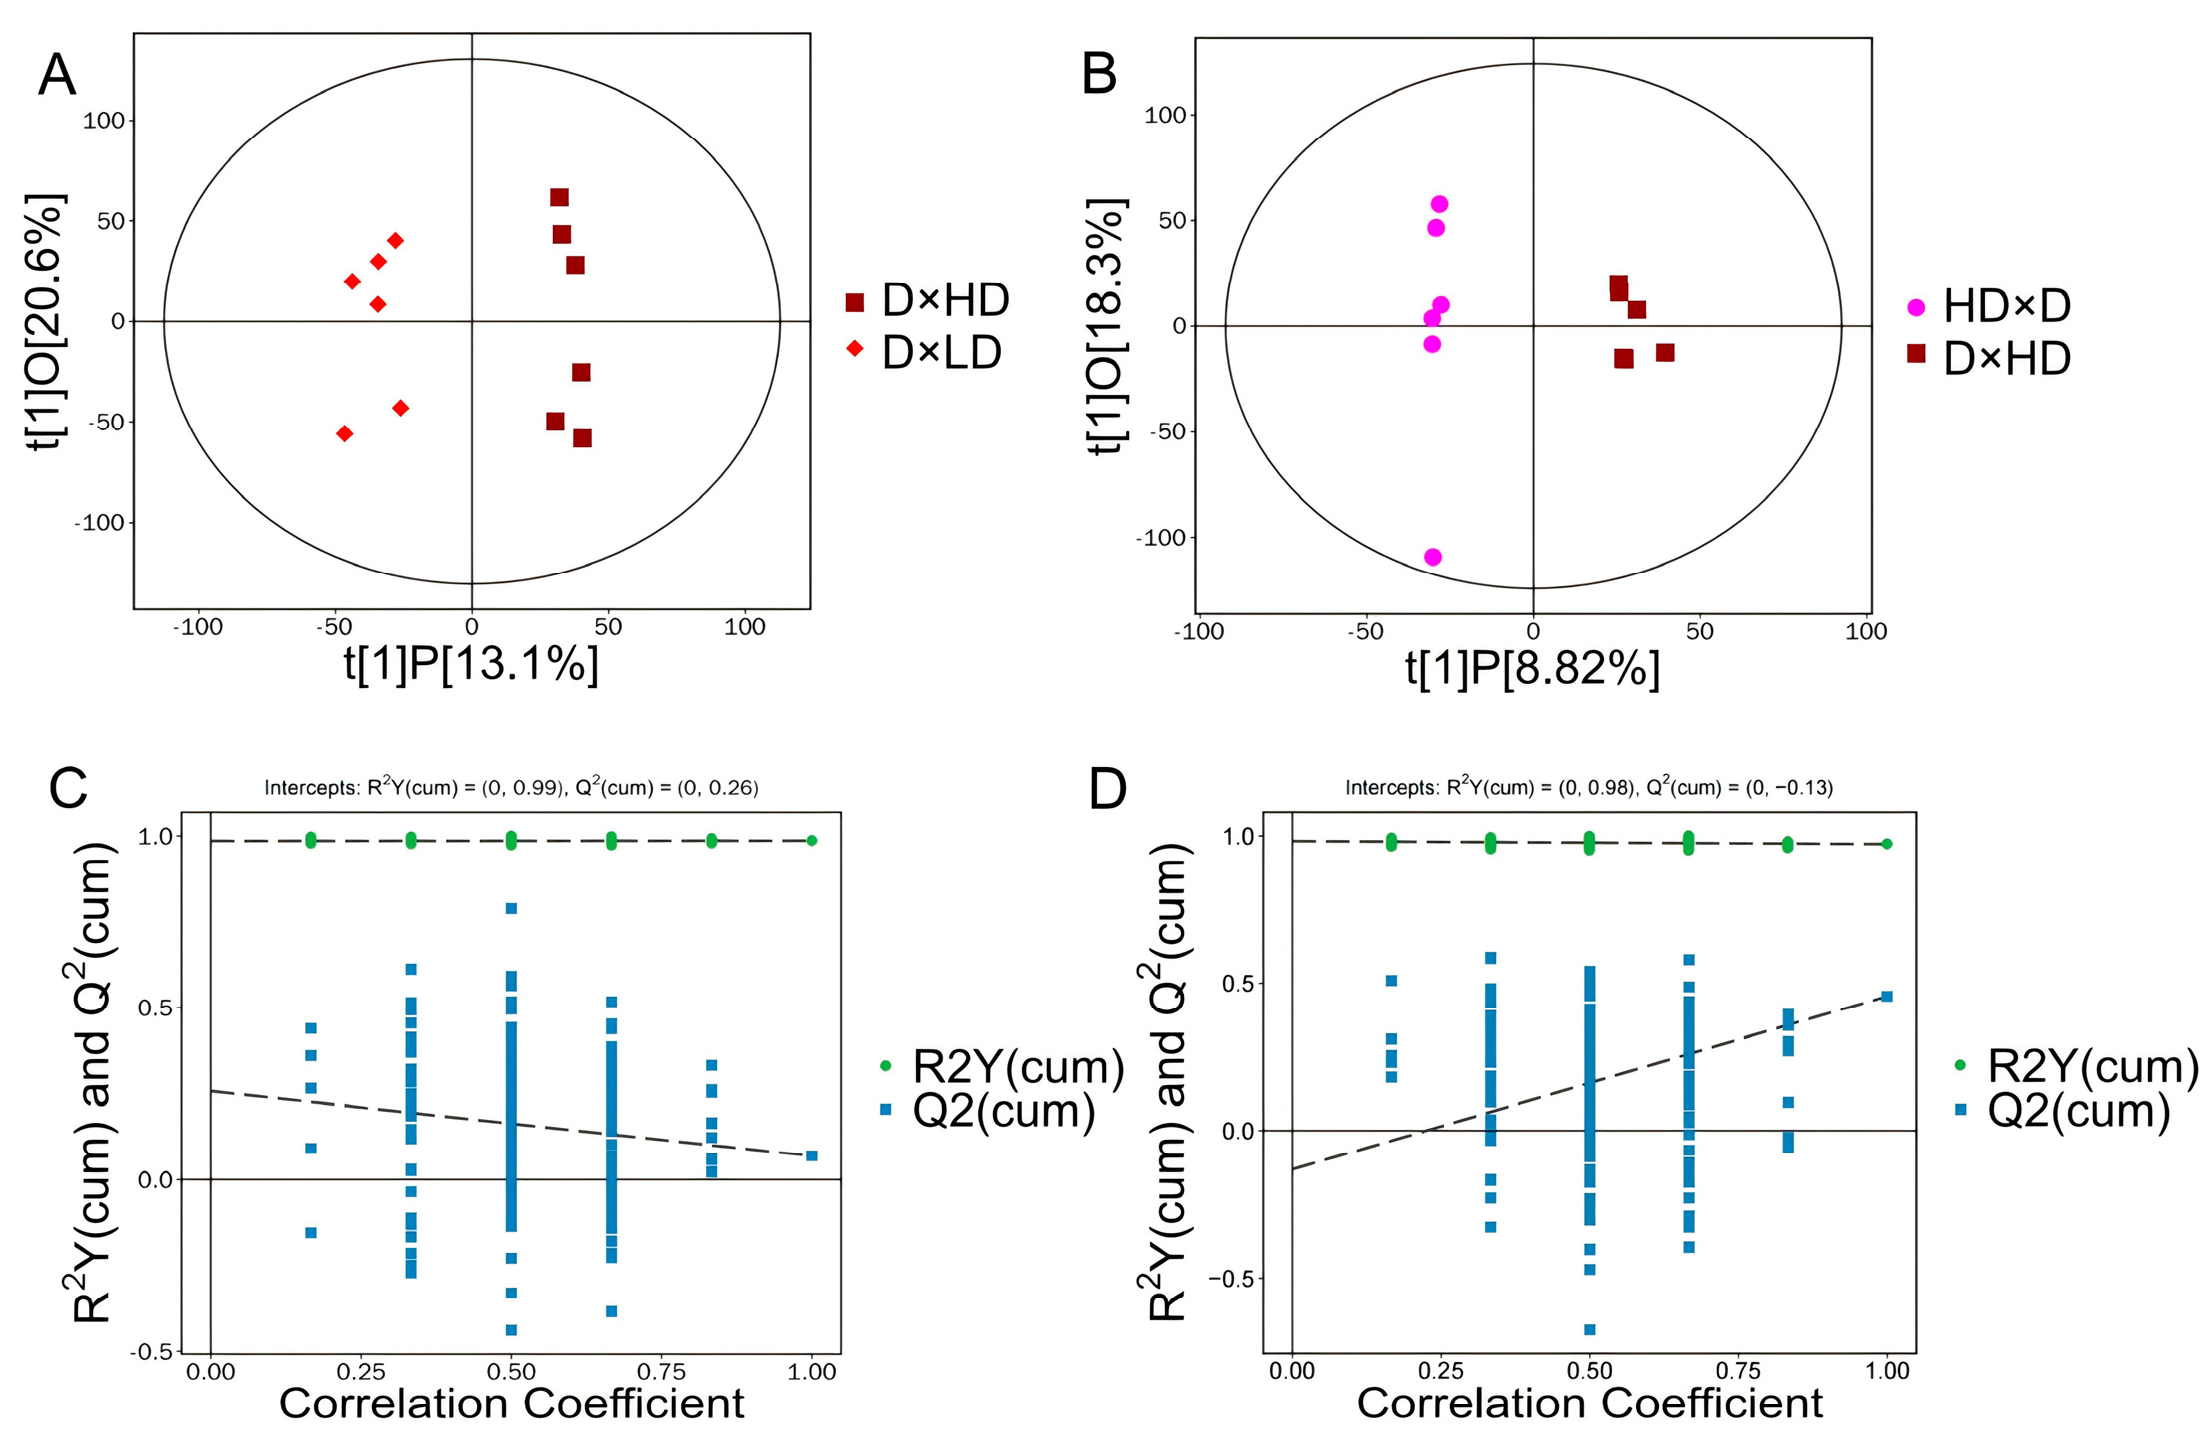
Figure 1. Multivariate statistical analysis of hybrid combinations. (A) Score scatter plot of OPLS-DA model for group D×HD and D×LD. (B) Score scatter plot of OPLS-DA model for group D×HD and HD×D. (C) Permutation plot test of OPLS-DA model for group D×HD and D×LD. (D) Permutation plot test of OPLS-DA model for group D×HD and HD×D. Each point represents one sample; color/shape indicate groups. In permutation plots, green and blue markers represent R2Y and Q2 values, respectively.
Agriculture 15 02360 g001
Figure 2. Metabolic profiling of chicken breast muscle across crossbreeding combinations. (A) Pie chart of metabolite categories and relative abundances. (B) Volcano plot screening differential metabolites between D×HD and HD×D. (C) Volcano plot screening differential metabolites between D×HD and D×LD. Red and blue indicate significantly up- and downregulated metabolites; gray indicates non-significant ones.
Agriculture 15 02360 g002
Figure 3. Hierarchical clustering heatmap of key differential metabolites across crossbreeding combinations. (A) Hierarchical clustering analysis of significantly differential metabolites in breast muscle tissues between D×HD and HD×D crossbreeding combinations. (B) Hierarchical clustering analysis of significantly differential metabolites in breast muscle tissues between D×HD and D×LD crossbreeding combinations. Rows represent metabolites; columns represent crossbreeding groups. Red and blue denote up- and downregulation. Selection criteria: VIP > 1.0 and p < 0.05.
Agriculture 15 02360 g003
Figure 4. Metabolic Pathway Enrichment Analysis of Key Differential Metabolites across Crossbreeding Combinations. (A) Bubble plot of KEGG pathway enrichment analysis for key differential metabolites between D×HD and HD×D crossbreeding combinations. (B) Bubble plot of KEGG pathway enrichment analysis for key differential metabolites between D×HD and D×LD crossbreeding combinations. Circle size and color represent pathway impact and p-value, respectively.
Agriculture 15 02360 g004
Figure 5. Correlation Network Analysis of Key Differential Metabolites across Crossbreeding Combinations. (A) Heatmap of correlation analysis for D×HD and HD×D. (B) Heatmap of correlation analysis for D×HD and D×LD. Red indicates positive and blue negative correlations; deeper color reflects stronger correlation (|ρ| → 1).
Agriculture 15 02360 g005
Table 1. Composition and nutritional components of basic feed for experimental chickens.
Diet CompositionNutrient Contents 520 Content (%)511 Content (%)
CornWater≤14.0≤14.0
Soybean mealCrude protein≥21.0≥19.0
Dicalcium phosphateCalcium0.60–1.200.60–1.20
LimestoneTotal phosphorus≥0.50≥0.40
NaClNaCl0.20–0.800.20–0.80
Minerals and their chelating agentsCoarse fiber≤6.0≤6.0
VitaminCrude ash≤8.0≤8.0
VitamerMethionine + Cystine ≥0.82 ≥0.71
Note: The above is all the information shown on the feed packaging.
Table 2. Meat quality parameters depending on the Houdan chicken crossbreeding combination.
AssemblyD×LDD×HDHD×D
Sex
Drip loss (%)0.96 ± 0.231.42 ± 1.090.82 ± 0.331.44 ± 0.180.86 ± 0.121.15 ± 1.04
Shearing force (N)26.32 ± 12.5513.34 ± 5.6020.71 ± 7.4916.66 ± 13.4529.99 ± 8.8022.93 ± 10.89
pH456.18 ± 0.236.13 ± 0.446.14 ± 0.346.16 ± 0.266.06 ± 0.196.03 ± 0.19
pH245.87 ± 0.095.67 ± 0.065.83 ± 0.205.86 ± 0.075.85 ± 0.115.69 ± 0.09
L*47.95 ± 3.6151.76 ± 6.1748.61 ± 4.3056.01 ± 4.9451.12 ± 3.8247.45 ± 7.26
a*3.45 ± 0.78 ab4.70 ± 1.38 ab2.95 ± 0.80 b3.30 ± 1.06 ab7.01 ± 4.45 a3.18 ± 0.60 ab
b*3.88 ± 0.946.32 ± 4.183.15 ± 1.736.48 ± 1.966.55 ± 2.974.19 ± 0.95
color8.05 ± 1.078.24 ± 1.097.95 ± 1.028.36 ± 1.048.14 ± 1.018.19 ± 1.21
aroma7.64 ± 1.138.02 ± 1.088.12 ± 0.898.29 ± 0.787.88 ± 1.228.05 ± 0.97
flavor7.33 ± 1.237.86 ± 1.297.71 ± 0.857.76 ± 0.947.79 ± 1.337.61 ± 1.31
Taste evaluated value7.67 ± 1.16 b7.93 ± 0.92 ab7.94 ± 1.19 ab8.04 ± 1.15 ab7.95 ± 1.18 ab8.13 ± 0.95 a
Note: D×LD, D×HD, and HD×D represent different cross combinations. ♂ denotes male chickens, ♀ denotes female chickens. Values are expressed as mean ± standard deviation (n = 6). Different superscript letters (a, b, ab) within the same row for a* values indicate significant differences (p < 0.05) according to Duncan’s multiple range test. pH45 and pH24 refer to pH values measured at 45 min and 24 h post-slaughter, respectively. L*, a*, and b* represent muscle color lightness, redness, and yellowness.
Table 3. Significant differences in metabolites between HD×D and D×HD groups.
MetaboliteVIPp-ValueMZRTFold ChangeAnalysis ModeTrend
PC(20:2(11Z,14Z)/14:0)2.100.02759.63204.021.18POSup
L-Alanine2.180.0590.0652.741.25POSup
Arachidic acid2.380.01170.12617.231.34ENGup
Citric acid2.290.02772.58169.311.36NEGup
Uracil1.930.04104.07398.001.43NEGup
Glutamine 31.430.0471.00832.990.26POSdown
2-keto-isovaleric acid 12.540.0289.00491.520.40POSdown
L-homoserine 11.720.04218.00764.770.66POSdown
PC(18:1(9Z)/P-18:1(11Z))2.010.04258.59333.110.77POSdown
Note: VIP = Variable Importance in Projection (VIP > 1.0 indicates significant contribution); p-value < 0.05 was considered statistically significant; MZ = mass-to-charge ratio; RT = Retention time (seconds or minutes); Fold change represents abundance ratio between experimental groups; Analysis mode: POS = Positive ionization mode, NEG = Negative ionization mode, ENG = Engine mode (verify if standard notation); Variation trend indicates regulation direction (up = increased, down = decreased). Metabolite names with numerical suffixes (e.g., Glutamine 3) denote specific isomers/fragments.
Table 4. Significant differences in metabolites between D×HD and D×LD groups.
MetaboliteVIPp-ValueMZRTFold ChangeAnalysis ModeTrend
PC(P-18:1(11Z)/20:5(5Z,8Z,11Z,14Z,17Z)1.770.02222.10145.731.59POSup
Deoxyinosine1.770.02880.59210.001.75NEGup
N-Acetylneuraminic acid1.480.04310.09465.941.76NEGup
PC(22:4(7Z,10Z,13Z,16Z)/15:0)2.06<0.01863.56210.021.76POSup
Adrenic acid1.890.04621.30252.152.27NEGup
Mucic acid1.380.02335.001160.010.23NEGdown
Glucose-1-phosphate1.380.03217.00988.150.31NEGdown
2,5-Dihydro-4,5-dimethyl-2-(1-methylpropyl)thiazole1.730.04210.60530.290.34POSdown
13S-hydroxyoctadecadienoic acid1.410.04276.05467.100.36NEGdown
Sphingosine1.520.03560.08415.000.47POSdown
Note: Due to the excessive number of metabolites, only the top 10 metabolites with VIP values are selected for display.
Disclaimer/Publisher’s Note: The statements, opinions and data contained in all publications are solely those of the individual author(s) and contributor(s) and not of MDPI and/or the editor(s). MDPI and/or the editor(s) disclaim responsibility for any injury to people or property resulting from any ideas, methods, instructions or products referred to in the content.