Article

Combined Genomic and Transcriptomic Screening of Candidate Genes for Asymmetric Oviduct Development in Hens

1
College of Animal Science and Technology, Yangzhou University, Yangzhou 225009, China
2
Joint International Research Laboratory of Agriculture and Agri-Product Safety of the Ministry of Education of China, Yangzhou University, Yangzhou 225009, China
*
Author to whom correspondence should be addressed.
Agriculture 2025, 15(12), 1245; https://doi.org/10.3390/agriculture15121245 (registering DOI)
Submission received: 2 May 2025 / Revised: 30 May 2025 / Accepted: 6 June 2025 / Published: 7 June 2025
(This article belongs to the Special Issue Genetic Resource Evaluation and Germplasm Innovation of Poultry)

Abstract

:
Background: While the mechanism of asymmetric gonadal development is generally understood, the mechanism of asymmetric oviduct development remains unclear. Methods: Right and left oviducts were collected from chick embryos at three developmental stages (Embryonic day 7.5, E9.5, and E11.5) for RNA-seq analysis (RNA-seq). Whole-genome resequencing (WGRS) was performed on hens with bilateral reproductive systems (a rare natural occurrence) and unilateral controls. These data were co-analyzed with public RNA-seq data of female embryonic gonads at different developmental stages (E4.5, E5.5, and E6.5) to screen for candidate genes affecting oviduct degeneration/development. Results: RNA-seq analyses showed that a total of 27, 10, and 38 DEGs were identified between the left and right oviducts at E7.5, E9.5, and E11.5, respectively. WGRS analyses revealed 1045 differentially mutated genes (DMGs) between bilateral (D) and unilateral (S) groups. Preliminary validation highlighted BMP7, PAK3, SLC6A11, PITX2, and SMC1B as candidate genes influencing oviduct asymmetry. Conclusions: This study provides insights into the genetic basis of asymmetric oviduct development and lays the groundwork for breeding hens with bilateral reproductive systems.

1. Introduction

It is well known that mammals have paired reproductive systems (gonads and oviducts); however, in most avian species, including chickens, the female reproductive system develops asymmetrically: only the left ovary and oviduct become functional, while the right side regresses during embryogenesis. Asymmetric development of the reproductive system in birds can result in a reduction in body mass and energy expenditure, facilitating adaptation to flight. Chicken embryos are sexually bipotent until Embryonic day 6 (E6) [1], with the presence of paired gonads, mesonephric ducts (Wolffian ducts, WDs), and paramesonephric ducts (Müllerian ducts, MDs). In males, both gonads develop into physiologically functional testes, the WD develops into the vas deferens, and the MD degenerates and disappears under the influence of sex hormones and related genes [2,3,4]. However, in females, only the left gonad develops into a functional ovary [5,6], while the right gonad slowly degenerates. A similar process occurs with the MD, from which the oviduct develops; only the left side develops normally, and the right side gradually degenerates, while both WDs degenerate and disappear [7,8].
The degeneration of the right gonad of the female chick embryo occurs around E6.5, exhibiting distinct left and right lateral morphological differences around E9 [1]. Previous research has identified the potential involvement of asymmetric signals (ACTRIIA and SHH) in the early Hensen’s node of the chicken embryo [9,10] and a series of asymmetrically expressed genes (CARONTE, NODAL, and LEFTY-1) cascading to the mesoderm, which ultimately leads to the asymmetric expression of PITX2 [11,12]. The asymmetric expression of PITX2 then regulates the development of different organs including gonads. The asymmetric expression of ERα in the cortex of gonads leads to differences in the estrogen pathway in the right and left ovarian cortex [13] and consequently triggers the asymmetric development of the right and left ovaries in female chicken embryos.
The genetic mechanism underlying the degeneration of the right oviduct in female chick embryos remains unclear. It is possible that the pathway and mechanism of degeneration of the oviduct are independent of the gonad, or that the signals originate from gonadal asymmetric development. Indeed, it has been demonstrated that the nucleotide admixture in the right MD declines gradually from E8 to E10, with a pronounced reduction in DNA synthesis at E9, suggesting the beginning of degenerative processes of the right MD [14]. In terms of the degeneration time, the gonads start to degenerate at E6.5, while the oviducts begin to degenerate at E9.5. It is hypothesized that the degeneration mechanisms of the two are the same. Since the gonads are located upstream of the oviducts, the degeneration signal first occurs in the gonads and then in the oviducts. It is important to note, however, that the possibility of an independent degenerative mechanism between the oviduct and gonads cannot be ruled out at this time. This is due to the time-sensitive nature of asymmetric signaling from head to tail and the specific phenomenon of degeneration also occurring in male MDs [8,15,16].
In nature, a small number of hens with naturally occurring bilateral reproductive systems can lay two eggs a day under conditions of sufficient feed nutrition, which results in a higher egg-laying rate than that of hens with unilateral reproductive systems. Therefore, the objective of this study was to examine the genetic factors associated with right oviduct degeneration in hens. By collecting the blood of naturally occurring hens with bilateral reproductive systems and normal unilateral reproductive system hens, for WGRS, we obtained the differentially mutated genes (DMGs) between groups. Concurrently, we collected the right and left oviducts of female embryos at different developmental stages (E7.5, E9.5, and E11.5) to perform RNA-seq to identify differentially expressed genes (DEGs). Additionally, the gonadal RNA-seq data from public databases were jointly analyzed with the data obtained in this study, and with preliminary validation, SMC1B (Structural Maintenance of Chromosomes 1B), PITX2 (Paired Like Homeodomain 2), BMP7 (Bone Morphogenetic Protein 7), SLC6A1 (Solute Carrier Family 6 Member 11), and PAX3 (Paired Box 3) were identified as potential candidate genes affecting oviduct degeneration in female chick embryos. This study provides fundamental data for studying the mechanism of left–right asymmetry development in chickens and lays the foundation for the breeding of hens with bilateral reproductive systems and the improvement of the economic efficiency of the egg industry.

2. Materials and Methods

2.1. Sample Collection

The fertilized eggs of Hyline white layers were purchased from Jiangsu Pinge Biotechnology Co., (Yangzhou, China). Incubation was carried out at 37.5 °C with a relative humidity of 60%. Chicken embryos at the age of E7.5, E8.5, E9.5, E10.5, E11.5, E12.5, E13.5, and E14.5 were collected for photographing the dynamic change in their oviducts, based on which three representative developmental stages (E7.5, undegenerated oviduct stage; E9.5, early stage of oviduct degeneration; E11.5, middle stage of oviduct degeneration) were selected for RNA-seq analysis. Oviduct tissue samples were collected for RNA-seq: E7.5, E9.5, and E11.5 chicken embryos were placed under a microscope, and the oviduct tissue was stripped into pre-cooled PBS using forceps to try to eliminate any mesonephric tissue residues. For E9.5 and E11.5 chick embryos, sex determination was made based on their gonadal morphology; for E7.5 sex determination, 1 µL of embryonic blood was collected for molecular determination [17]. Primers used for sex identification are listed in Table 1. Following sex identification, to obtain sufficient oviduct tissue volume, 10–15 left or right oviducts were pooled into one tube, with nine biological replicates (five replicates for RNA-seq analysis and four replicates for qPCR validation) for each developmental stage: E7.5 right-side oviducts (E7.5O-R1 to E7.5O-R5), E7.5 left-side oviducts (E7.5O-L1 to E7.5O-L5), E9.5 right-side oviducts (E9.5O-R1 to E9.5O-R5), E9.5 left-side oviducts (E9.5O-L1 to E7.5O-L5), E11.5 right-side oviducts (E11.5O-R1 to E11.5O-R5), and E11.5 left-side oviducts (E11.5O-L1 to E11.5O-L5). Oviduct samples were stored at −80 °C until use.
The experimental design utilized 300-day-old Rhode Island Red and White Leghorn hens with bilaterally developed reproductive systems, along with unilaterally developed control counterparts. All avian subjects were procured from Jiangsu Beinongda Agricultural Technology Co., (Taizhou, China) with bilateral reproductive system confirmation conducted through standardized vent sexing protocols. Blood samples were collected and stored at −20 °C until use. The blood of White Leghorn hens was employed for WGRS, with six replicates in each group (bilateral group D1–D6, unilateral group S1–S6). Blood samples from another flock of White Leghorn hens (n = 5) and Rhode Island Red hens (n = 18) were employed for the validation of mutation loci.

2.2. Transcriptome Sequencing

RNA purification, library construction, and paired end (PE) sequencing conducted on the Illumina sequencing platform. Sequencing data contain a number of connectors and low-quality reads, so we used fastp (0.22.0) software to filter the sequencing data to obtain high-quality sequences (Clean Data) for further analysis. The filtered reads were mapped to the reference genome (bGalGal1.mat.broiler.GRCg7b) using HISAT2 (v2.1.0) [18] software. HTSeq (v0.9.1) [19] was used to statistically compare the read count values on each gene to the original expression level of the gene, and Fragments Per Kilo bases per Million fragments (FPKM) was used to standardize the expression level. Then, differences in gene expression were analyzed using DESeq (v1.38.3) [20] with screened conditions as follows: expression difference multiple |log2FoldChange| > 1 and significant p-value < 0.05. At the same time, we used the R language Pheatmap (v1.0.12) software package to perform bi-directional clustering analyses of all the different sample genes. Using topGO (v2.50.0) to perform Gene Ontology (GO, http://geneontology.org/, accessed on 1 May 2024) enrichment analysis on the differential genes (all DEGs/up DEGs/down DEGs), we calculated the p-value with the hypergeometric distribution method (the standard of significant enrichment is a p-value < 0.05), and found the GO term with significantly enriched differential genes to determine the main biological functions performed by differential genes. ClusterProfiler (v4.6.0) software was used to carry out the enrichment analysis of the Kyoto Encyclopedia of Genes and Genomes (KEGG, http://www.kegg.jp/, accessed on 1 May 2024)pathway of differential genes, focusing on the significant enrichment pathway with a p-value < 0.05. The RNA-seq data reported in this study are archived in the National Center for Biotechnology Information (NCBI) (Bethesda, MD, USA) database, https://www.ncbi.nlm.nih.gov/sra/PRJNA1084246 (accessed on 9 March 2024) and https://www.ncbi.nlm.nih.gov/sra/PRJNA1175370 (accessed on 30 October 2024).
Transcriptome sequencing data of gonads at different ages were obtained from the NCBI database [21].

2.3. Whole-Genome Resequencing

Sequencing was performed on the Illumina HiSeq XTen/NovaSeq/BGI platform by a commercial service (Biomarker Technologies, Beijing, China). The concentration and quality of the total genomic DNA were determined using a NanoDrop2000 Spectrophotometer (Thermo Fisher Scientific, Waltham, MA, USA). After DNA library (350 bp) construction, sequencing was performed on the Illumina HiSeq XTen/NovaSeq/BGI platform through a commercial service, with 150 bp read lengths. First, the raw data were processed using the fastp software (0.21.0) [22]. Reads containing adapters, poly-N reads, and low-quality reads were removed to obtain clean reads. Then, the clean reads were mapped to the reference genome sequence (bGalGal1.mat.broiler.GRCg7b) using Bwa-mem2 (2.2) software [23]. The mapping results were sorted, and duplicate reads were removed with the rmdup function using samtools (v1.9). Then, the HaplotypeCaller algorithm from the GATK (3.8) [24] was applied to detect single-nucleotide polymorphism (SNP) and insertion–deletion (InDel) variations. Subsequently, hard filtering was performed using QD < 2.0 | | MQ < 40.0 | | FS > 60.0 | | QUAL < 30.0 | | MQrankSum < −12.5 | | ReadPosRankSum < −8.0-clusterSize 2-clusterWindowSize 5, etc. SNP annotation was performed on the basis of the reference genome using snpEff software (3.6c) [25], and the obtained population-specific SNPs were categorized into intergenic regions, upstream or downstream regions, and exons or introns. The dataset generated and analyzed in this study can be obtained from the NCBI repository, https://www.ncbi.nlm.nih.gov/bioproject/PRJNA1025895 (accessed on 9 October 2023).

2.4. Joint Analysis of RNA-Seq and WGRS Data

The gonad RNA-seq data and the oviduct RNA-seq data were jointly analyzed to screen out the overlapping DEGs and the overlapping enriched pathways of the DEGs. Furthermore, the gonad RNA-seq data and the oviduct RNA-seq data were co-analyzed with WGRS data, respectively, to find the intersecting differential genes (common genes between DEGs and DMGs) and their enriched pathways.

2.5. RNA Extraction and Quantitative PCR (qPCR) Validation

The total RNA from the oviduct tissues of the E7.5O-R, E7.5O-L, E9.5O-R, E9.5O-L, E11.5O-R, and E11.5O-L groups (n = 5) was extracted using TRNzol Universal Total RNA Extraction Reagent (DP424, TIANGEN, Beijing, China) in accordance with the manufacturer’s instructions. The cDNA synthesis was conducted using the Hifair® III 1st Strand cDNA Synthesis SuperMix for qPCR (gDNA digester plus) (11141ES60, YEASEN, Shanghai, China) and the qPCR was performed with Hieff® qPCR SYBR® Green Master Mix (Low Rox Plus) (11202ES03, YEASEN, Shanghai, China), using the QuantStudio3 fluorescence quantitative PCR system. The relative expression levels of the genes were calculated using the 2−ΔΔCt method, with β-actin serving as the internal reference gene. The primers were designed using the NCBI primer design tool, and information about the primers used for qPCR is presented in Table A1.

2.6. DNA Extraction and Sanger Sequencing Validation

Total DNA was extracted from blood samples using the TIANamp Blood DNA Kit (DP348, TIANGEN, Beijing, China) in accordance with the manufacturer’s instructions. PCR amplification was conducted using the 2× Hieff® Robust PCR Master Mix (With Dye) (10106ES08, YEASEN, Shanghai, China) in accordance with the manufacturer’s instructions, with the primers outlined in Table A2. Subsequently, the amplified products were subsequently sent to General Bio Co., (Chuzhou, China) for Sanger sequencing. The obtained sequences, which contain the mutation sites, were analyzed using SnapGene V5.3.2 software (GSL Biotech, San Diego, CA, USA).

2.7. Protein Extraction and Western Blotting

Total protein was extracted from oviduct tissues using RIPA buffer (Cat No. C1053, ApplyGen, Beijing, China) in accordance with the manufacturer’s instructions. Right and left oviduct samples (each sample contains 10 individuals) were placed into 1.5 mL centrifuge tubes (n = 3), to which 300 µL of RIPA buffer and 3 µL of protease inhibitor were added. The samples were then continuously pipetted for 1 min. Following a 10 min incubation on ice, the samples were subjected to centrifugation at 12,000 rpm at 4 °C for 10 min. And the supernatant, comprising the total protein, was then transferred to a separate tube for storage. The relative levels of SLC6A11 protein were determined by Western blots (WB), and the results were analyzed using ImageJ V1.8.0.112 software (National Institutes of Health, Bethesda, MD, USA). The SLC6A11 antibody (Cat No. The SLC6A11 antibody (Cat No. 13920-1-AP, ProteinTech, Rosemont, IL, USA) was used for WBs and the GADPH antibody (bsm33033M, Bioss, Beijing, China) was used as an internal reference. The working concentrations of the SLC6A11 antibody and the GADPH antibody were 1:5000 and 1:10,000, respectively.

2.8. Statistical Data

The data are presented as mean ± standard error. The experimental data presented in this study were subjected to statistical analysis using the independent sample t-test (two-tailed) for two groups and a two-factor ANOVA with the Duncan test for multiple groups. A p-value of less than 0.01 indicates a highly significant difference, while a p-value of less than 0.05 indicates a significant difference.

3. Results

3.1. Phenotypic Changes in the Left and Right Oviducts in Chick Embryos of Different Ages and the Phenotypic Morphology of Hens with Unilateral and Bilateral Oviducts

The gonads of chicken embryos already differentiated at E7.5, with a clear distinction between the left and right gonads at E9.5. However, no significant morphological differences were observed between the left and right oviducts from E7.5 to E9.5. At E10.5, the right oviducts just began to exhibit a reduction in length, while the difference between the left and right ovaries was already pronounced (Figure 1A).
Figure 1B,C illustrate the anatomical photos of a naturally occurring bilateral oviduct hen and a normal unilateral oviduct hen, respectively. It can be observed that the oviducts on both sides of the bilateral oviduct hen developed in a typical manner, and that the ovaries on both sides of the hen were developed, indicating that both sides of the reproductive system were functional.

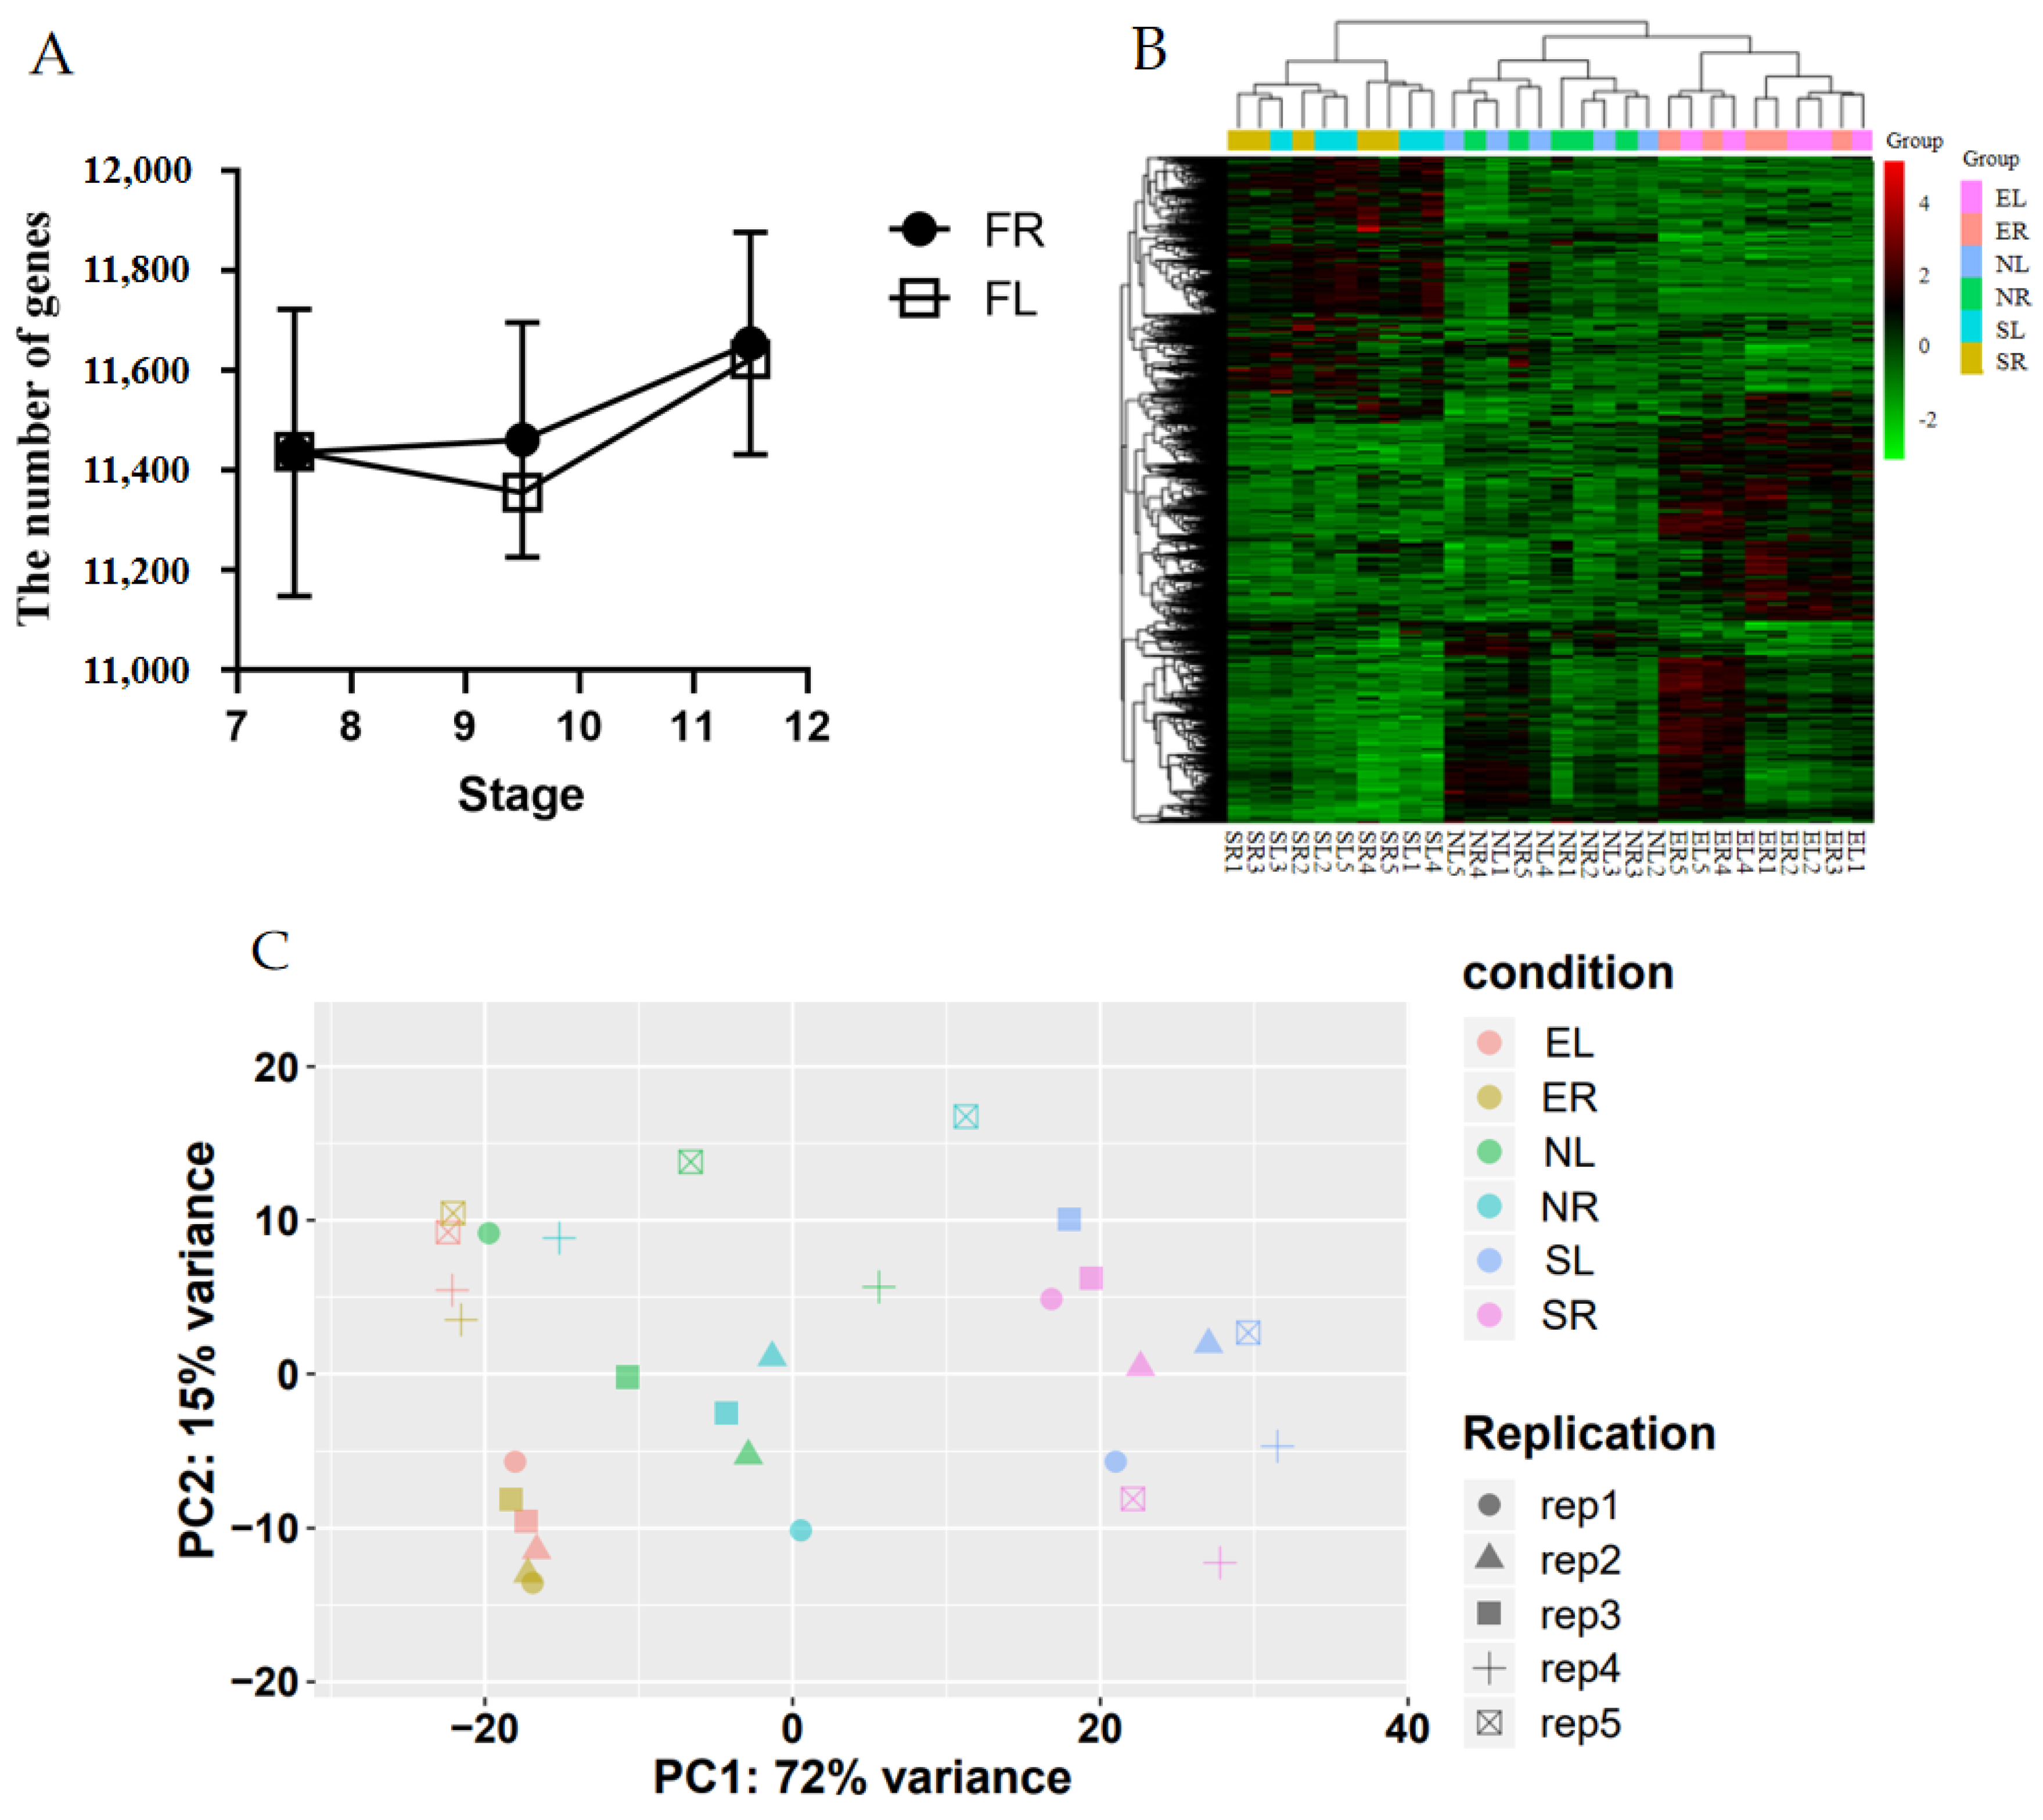
3.2. Analysis of Oviduct RNA-Seq Sequencing Data

RNA-seq was performed on the right and left oviduct samples (n = 5) from E7.5, E9.5, and E11.5 chicken embryos. Following data filtering, over 93.71% of the clean reads were mapped to the chicken genome, with a uniquely mapped rate of over 97.55% (Table S1). Additionally, over 79.65% of the mapped reads were in the gene region, and more than 89.58% of these reads are on the exons, indicating a high coverage of the transcribed sequences (Table S1).
Table S2 presents the expression profiles of all genes (FPKM ≥ 1) for all 30 samples. The average numbers of expressed genes in groups E7.5O-R, E7.5O-L, E9.5O-R, E9.5O-L, E11.5O-R, and E11.5O-L were 11,435.2 ± 258.0, 11,436.2 ± 159.4, 11,460.2 ± 210.3, 11,354.6 ± 159.6, 11,653.6 ± 199.4, and 11,622.4 ± 179.7, respectively (Figure A1). A cluster analysis was employed to categorize the DEGs between the right and left oviducts at different developmental stages. The cluster analysis yielded three major groups and six subclass clusters. Notably, the right and left group of E7.5 were clustered together, as were the right and left group of E9.5/11.5 (Figure A1). The results of the principal component analysis were in accordance with those of the cluster analysis (Figure A1), with the first component (72%) indicating the degree of separation of the samples at the specified developmental stage.
A total of 27 DEGs were identified in the E7.5O-R vs. E7.5O-L group (10 up-regulated and 17 down-regulated), of which 26 were annotated to autosomes and 1 to unknown chromosomes. In the E9.5O-R vs. E9.5O-L group, there were ten DEGs (one up-regulated and nine down-regulated), of which nine were annotated to autosomes and one to sex chromosomes. A total of 38 DEGs (12 up-regulated and 26 down-regulated) were identified in the E11.5O-R vs. E11.5O-L group, of which 37 were annotated to autosomes and 1 to sex chromosomes. A total of 1182 DEGs were identified in the E11.5O-R vs. E9.5O-R group, of which 375 were up-regulated and 807 were down-regulated. Of these, 1101 were annotated to autosomes, 73 to sex chromosomes, and 8 to unknown chromosomes. And 1040 DEGs were identified between E9.5O-R and E7.5O-R (639 were up-regulated and 401 were down-regulated), with 958 annotated to autosomes, 78 to sex chromosomes, and 4 to unknown chromosomes. In the E11.5O-R vs. E7.5O-R comparison, 2232 DEGs were identified, of which 996 were up-regulated and 1236 were down-regulated. The majority of DEGs were found to be associated with autosomes, with only a small proportion of the identified genes being linked to sex chromosomes. Notably, there were just dozens of DEGs in left–right comparisons, with thousands of DEGs between different developmental stages (Figure 2, Table S3). The five genes with the most significant differences (smallest p-values) in the nine comparisons are presented in Table 2.
For pathway analysis, the DEGs were mapped to the Kyoto Encyclopedia of Genes and Genomes (KEGG) pathway, and an enrichment analysis was performed. The majority of DEGs were found to be co-enriched in pathways including neuroactive ligand–receptor interactions, the calcium signaling pathway, and regulation of the actin cytoskeleton (please refer to Table S4 and Figure S1 for further details).

3.3. Analysis of Whole-Genome Resequencing Data

WGRS was conducted on blood DNA from unilateral and bilateral reproductive system hens, and the resulting data on sequencing quality analysis, mapping rate, and average sequence coverage are presented in Table S5. The Q30 for each sample was higher than 90.88%, indicating that the samples were sequenced with high quality and could be utilized for subsequent analysis. The proportion of clean reads mapping to the reference genome was greater than 99.07%. A substantial number of genetic variants were identified in all samples when compared to the reference genome (Table S6). These included 9,072,761 single-nucleotide polymorphisms (SNPs), of which 160,868 occurred in the CDS region, and 1,166,251 INDELs, of which 4073 occurred in the CDS region. A differential analysis between the unilateral and bilateral groups identified 22,333 group-specific SNPs, which were localized to 1045 genes (Table 3). Furthermore, we conducted a GO enrichment analysis and a KEGG analysis of the biological functions of the 1045 differentially mutant genes (DMGs) (Table S7). In the GO analysis, the most significant biological processes (BPs), molecular functions (MFs), and cellular components (CCs) were the adenylate cyclase-activating G protein-coupled receptor signaling pathway, nucleotide binding, and the perinuclear region of the cytoplasm. A KEGG pathway analysis revealed that eight pathways, including the ErbB signaling pathway, glycosaminoglycan biosynthesis of heparan sulfate/heparin, and ferroptosis, were significantly enriched (Figure 3, and Table S8).

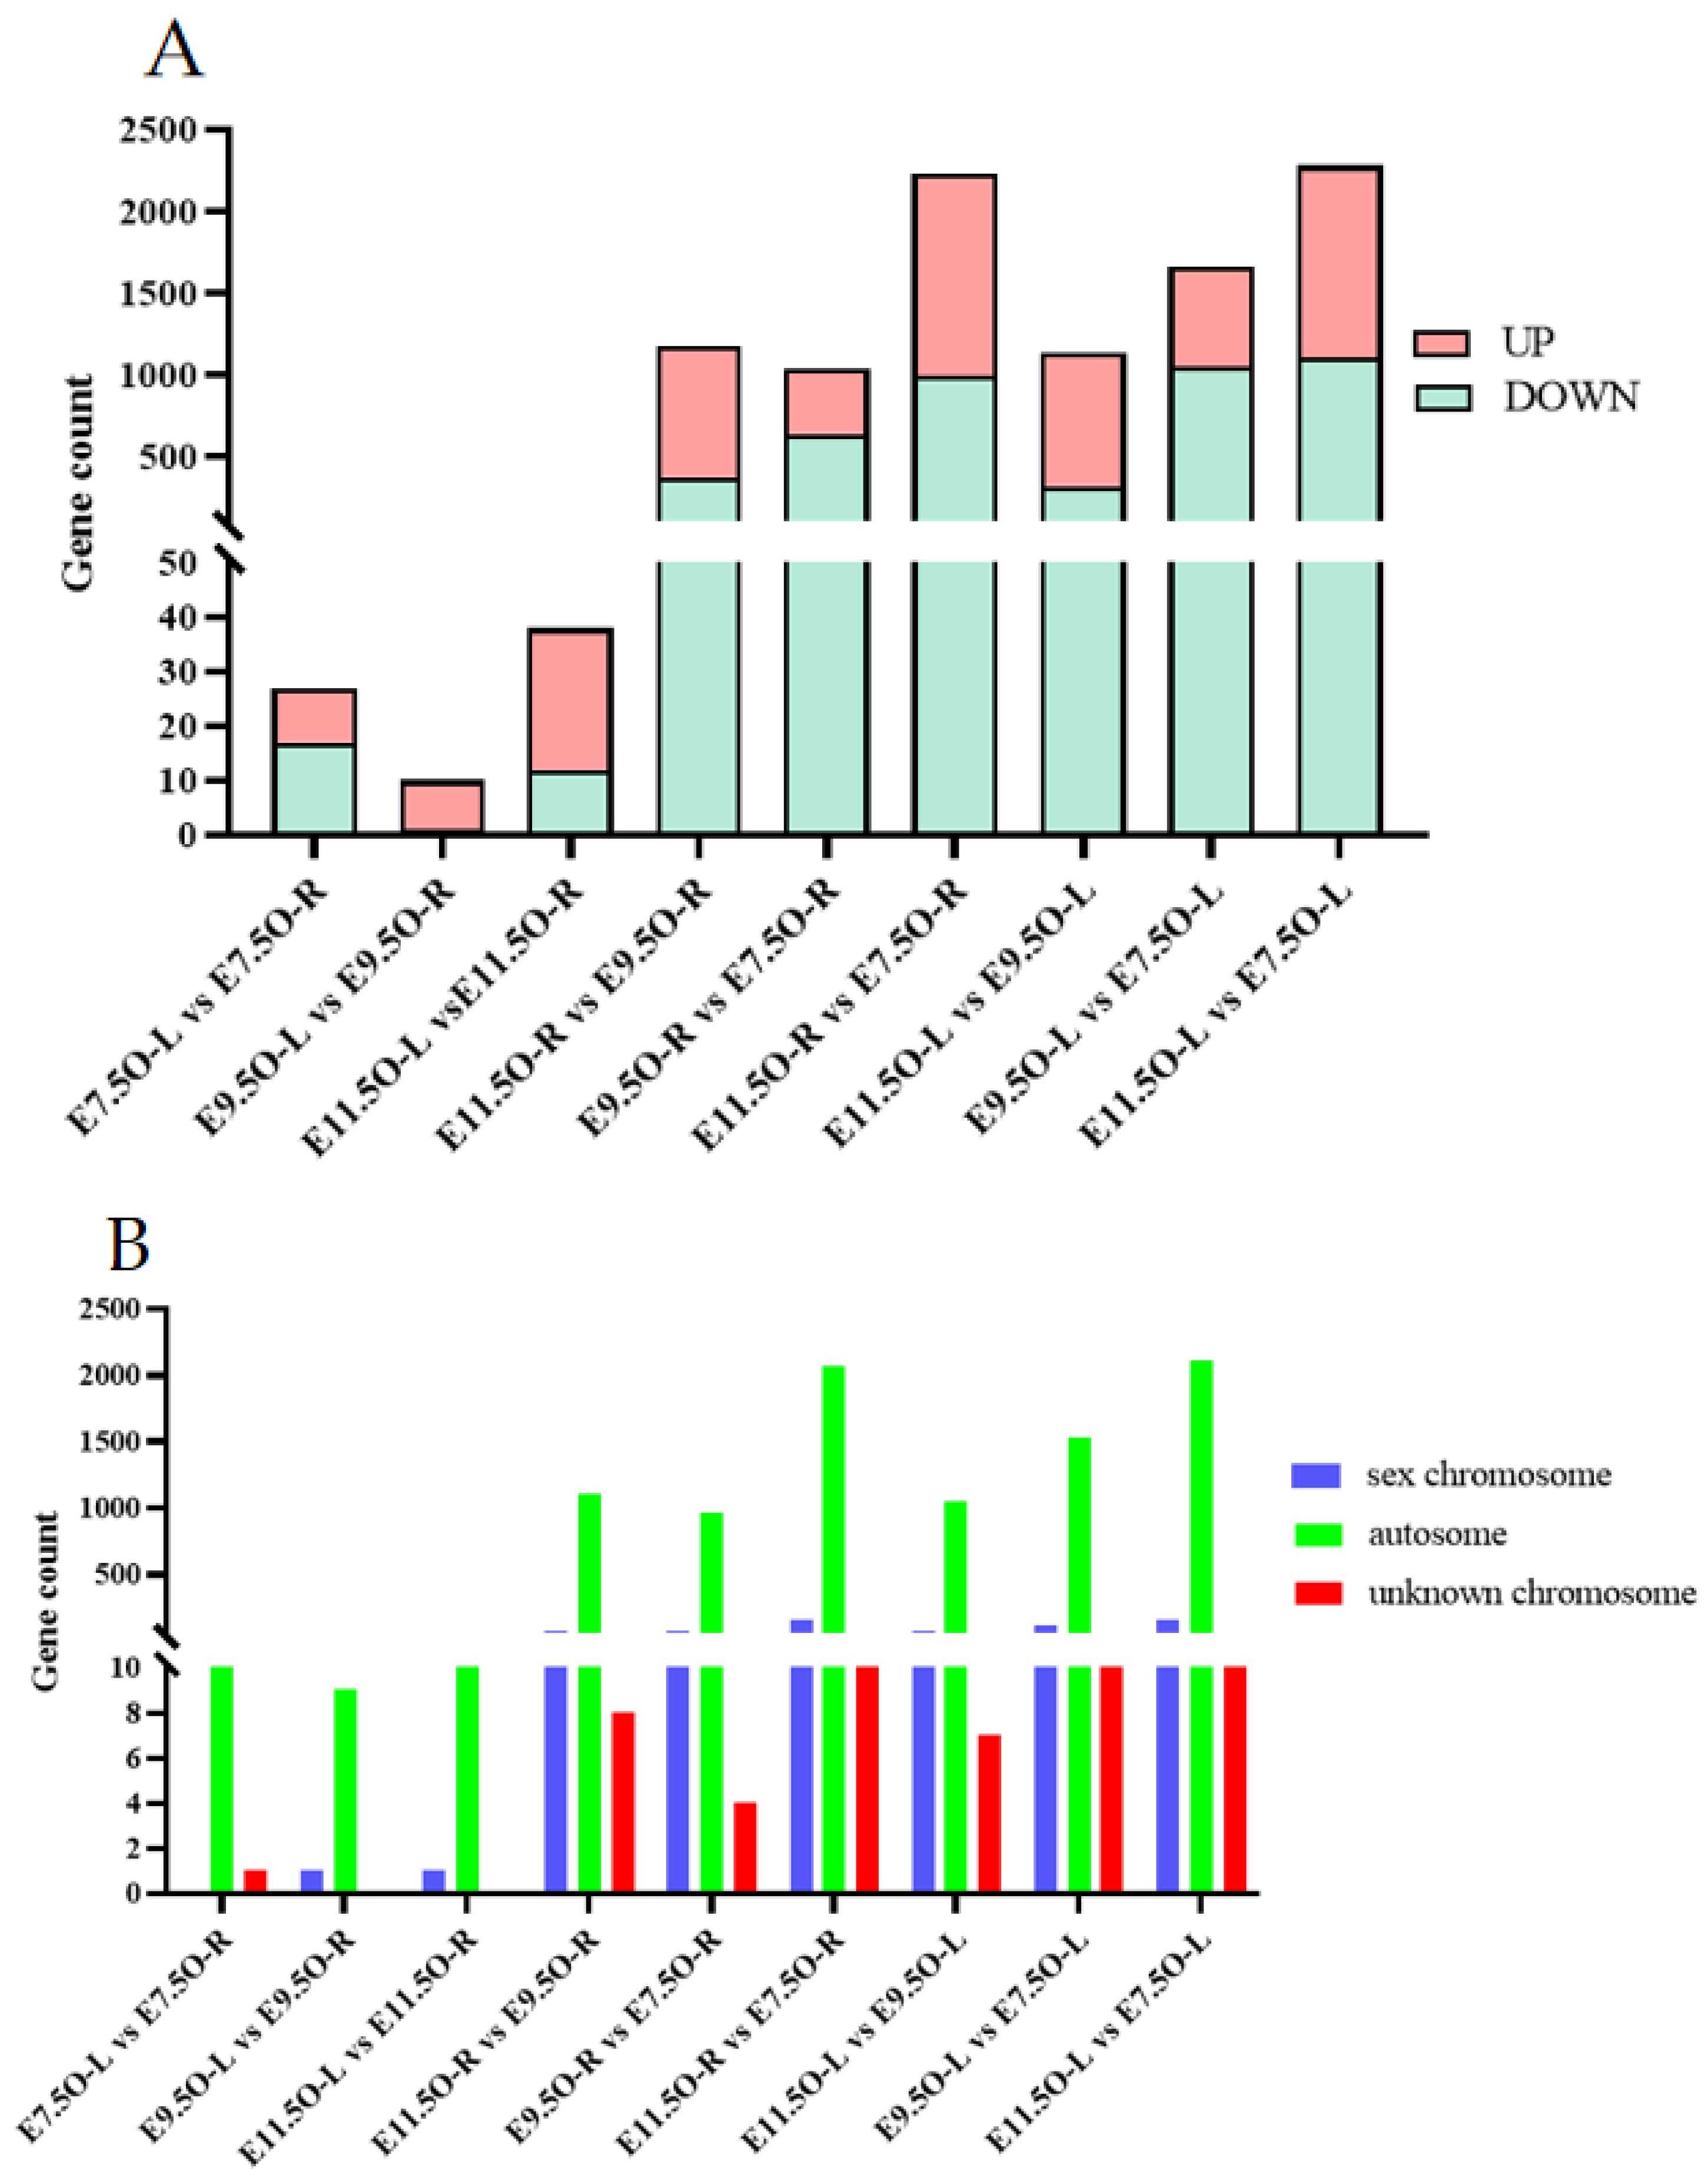
3.4. Combined Analysis of Oviduct RNA-Seq Data and Gonad RNA-Seq Data

The left-right DEGs of the oviduct RNA-seq and the gonad RNA-seq overlapped, and the following genes were identified (Table 4): SMC1B, ENSGALG00000054136, LUZP2, GRIA1, NPHS2, and SLC7A9. Of these, SMC1B exhibited lower expression on the right side than on the left of both E7.5 oviducts and E6.5 gonads, while the remaining overlapping DEGs displayed opposite regulation patterns on the left and right sides of the gonad and oviduct. SMC1B plays a role in the formation of axial elements (AEs) and the organization of chromatin loops along the AEs. Additionally, it is essential for maintaining sister chromatid cohesion following DNA replication. Furthermore, we conducted an overlap analysis between the DEGs’ enriched pathways, identifying multiple common pathways, like oocyte meiosis and neuroactive ligand–receptor interaction in both E6.5 gonad and E7.5 oviducts (Table 5). The results for the other overlapping pathways are presented in Table S9. Notably, SMC1B, which is an overlapping DEG, is also associated with the common pathway of oocyte meiosis, indicating it may be an important candidate gene.

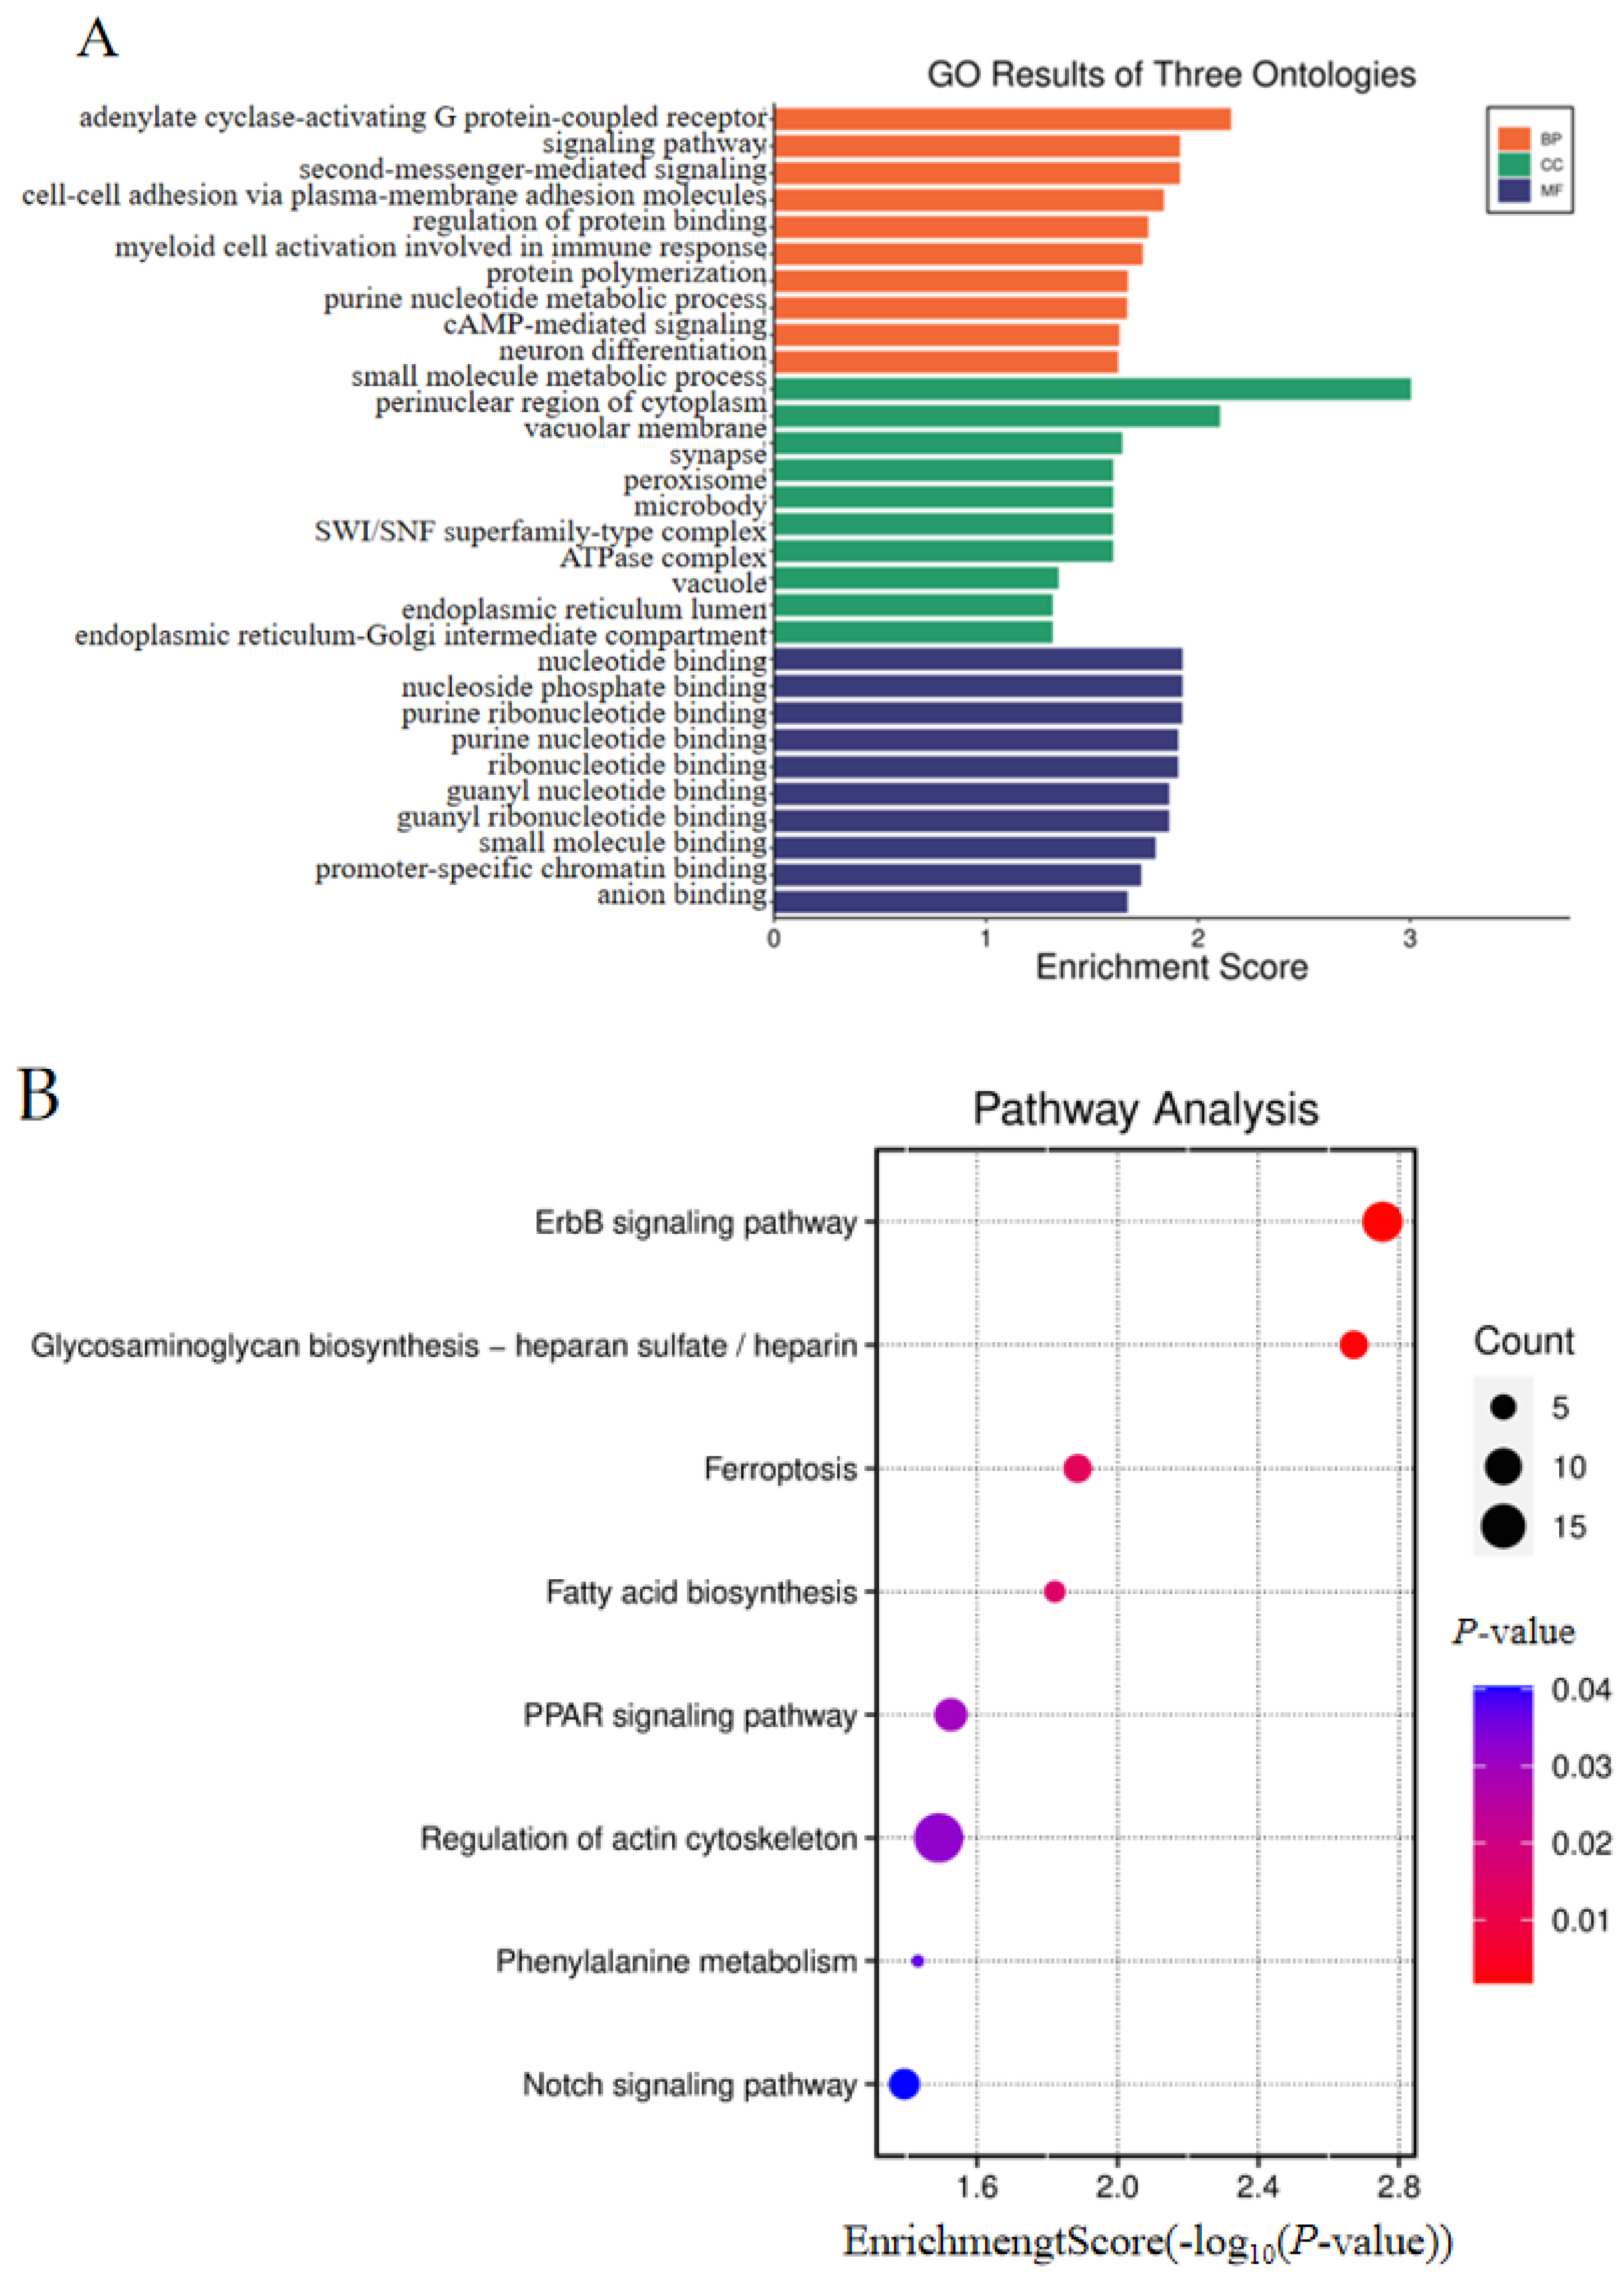
3.5. Combined Analysis of WGRS with Oviduct RNA-Seq and Gonad RNA-Seq Data

DMGs obtained by WGRS, and the DEGs of the nine comparisons of oviduct RNA-seq overlapped, respectively. SLC6A11 was found to be the overlapping differential gene between the DMGs of WGRS and the DEGs in the E7.5O-R vs. E7.5O-L comparison. And GPM6A was the common one between the DMGs and the DEGs of the E9.5O-R vs. E9.5O-L comparison. No intersecting genes were identified between the DMGs and the E11.5O-R vs. E11.5O-L DEGs. The overlapping genes between the DMGs and the other oviduct RNA-seq comparisons are shown in Table S10. Based on the differential expression between the left and right oviduct, as well as the available gene information, the following 16 genes were identified as potential candidates: RGCC, KCTD21, RERG, BMP7, ADAM19, ZMAT3, GPM6A, CREB3L3, PDGFRB, PAK3, PRKCB, ADAMTS5, SLC6A11, PAX3, PITX2, and ETV4 (Table S10). The functions of the identified genes were associated with cell motility, migration, and apoptosis. The KEGGs were enriched for both the DMGs and DEGs, and the results were jointly analyzed (Table S11). And the overlapping KEGG pathways were phenylalanine metabolism and the PPAR signaling pathway.
On the other hand, the DMGs of WGRS and the DEGs of gonad RNA-seq overlapped, yielding 12, 17, and 12 overlapping genes for E4.5, E5.5, and E6.5, respectively. Interestingly, there were seven common genes among these overlapping genes: PITX2, DAZL, TTC39A, ASZ1, TDRD9, CTNNA3, and PIWIL1 (Table S12). PITX2 and ASZ1 were selected as candidate genes based on the mutation locations of their SNPs. Their mutation site occurs in the upstream region, which may affect their mRNA expression levels. Actually, in E4.5, E5.5, and E6.5, ASZ1 and PITX2 exhibit reduced expression on the right side relative to the left. Furthermore, the KEGG pathways enriched for these two kinds of differential genes (DMGs and DEGs) then overlapped (Table A3), and the common pathways significantly enriched were ferroptosis and phenylalanine metabolism.

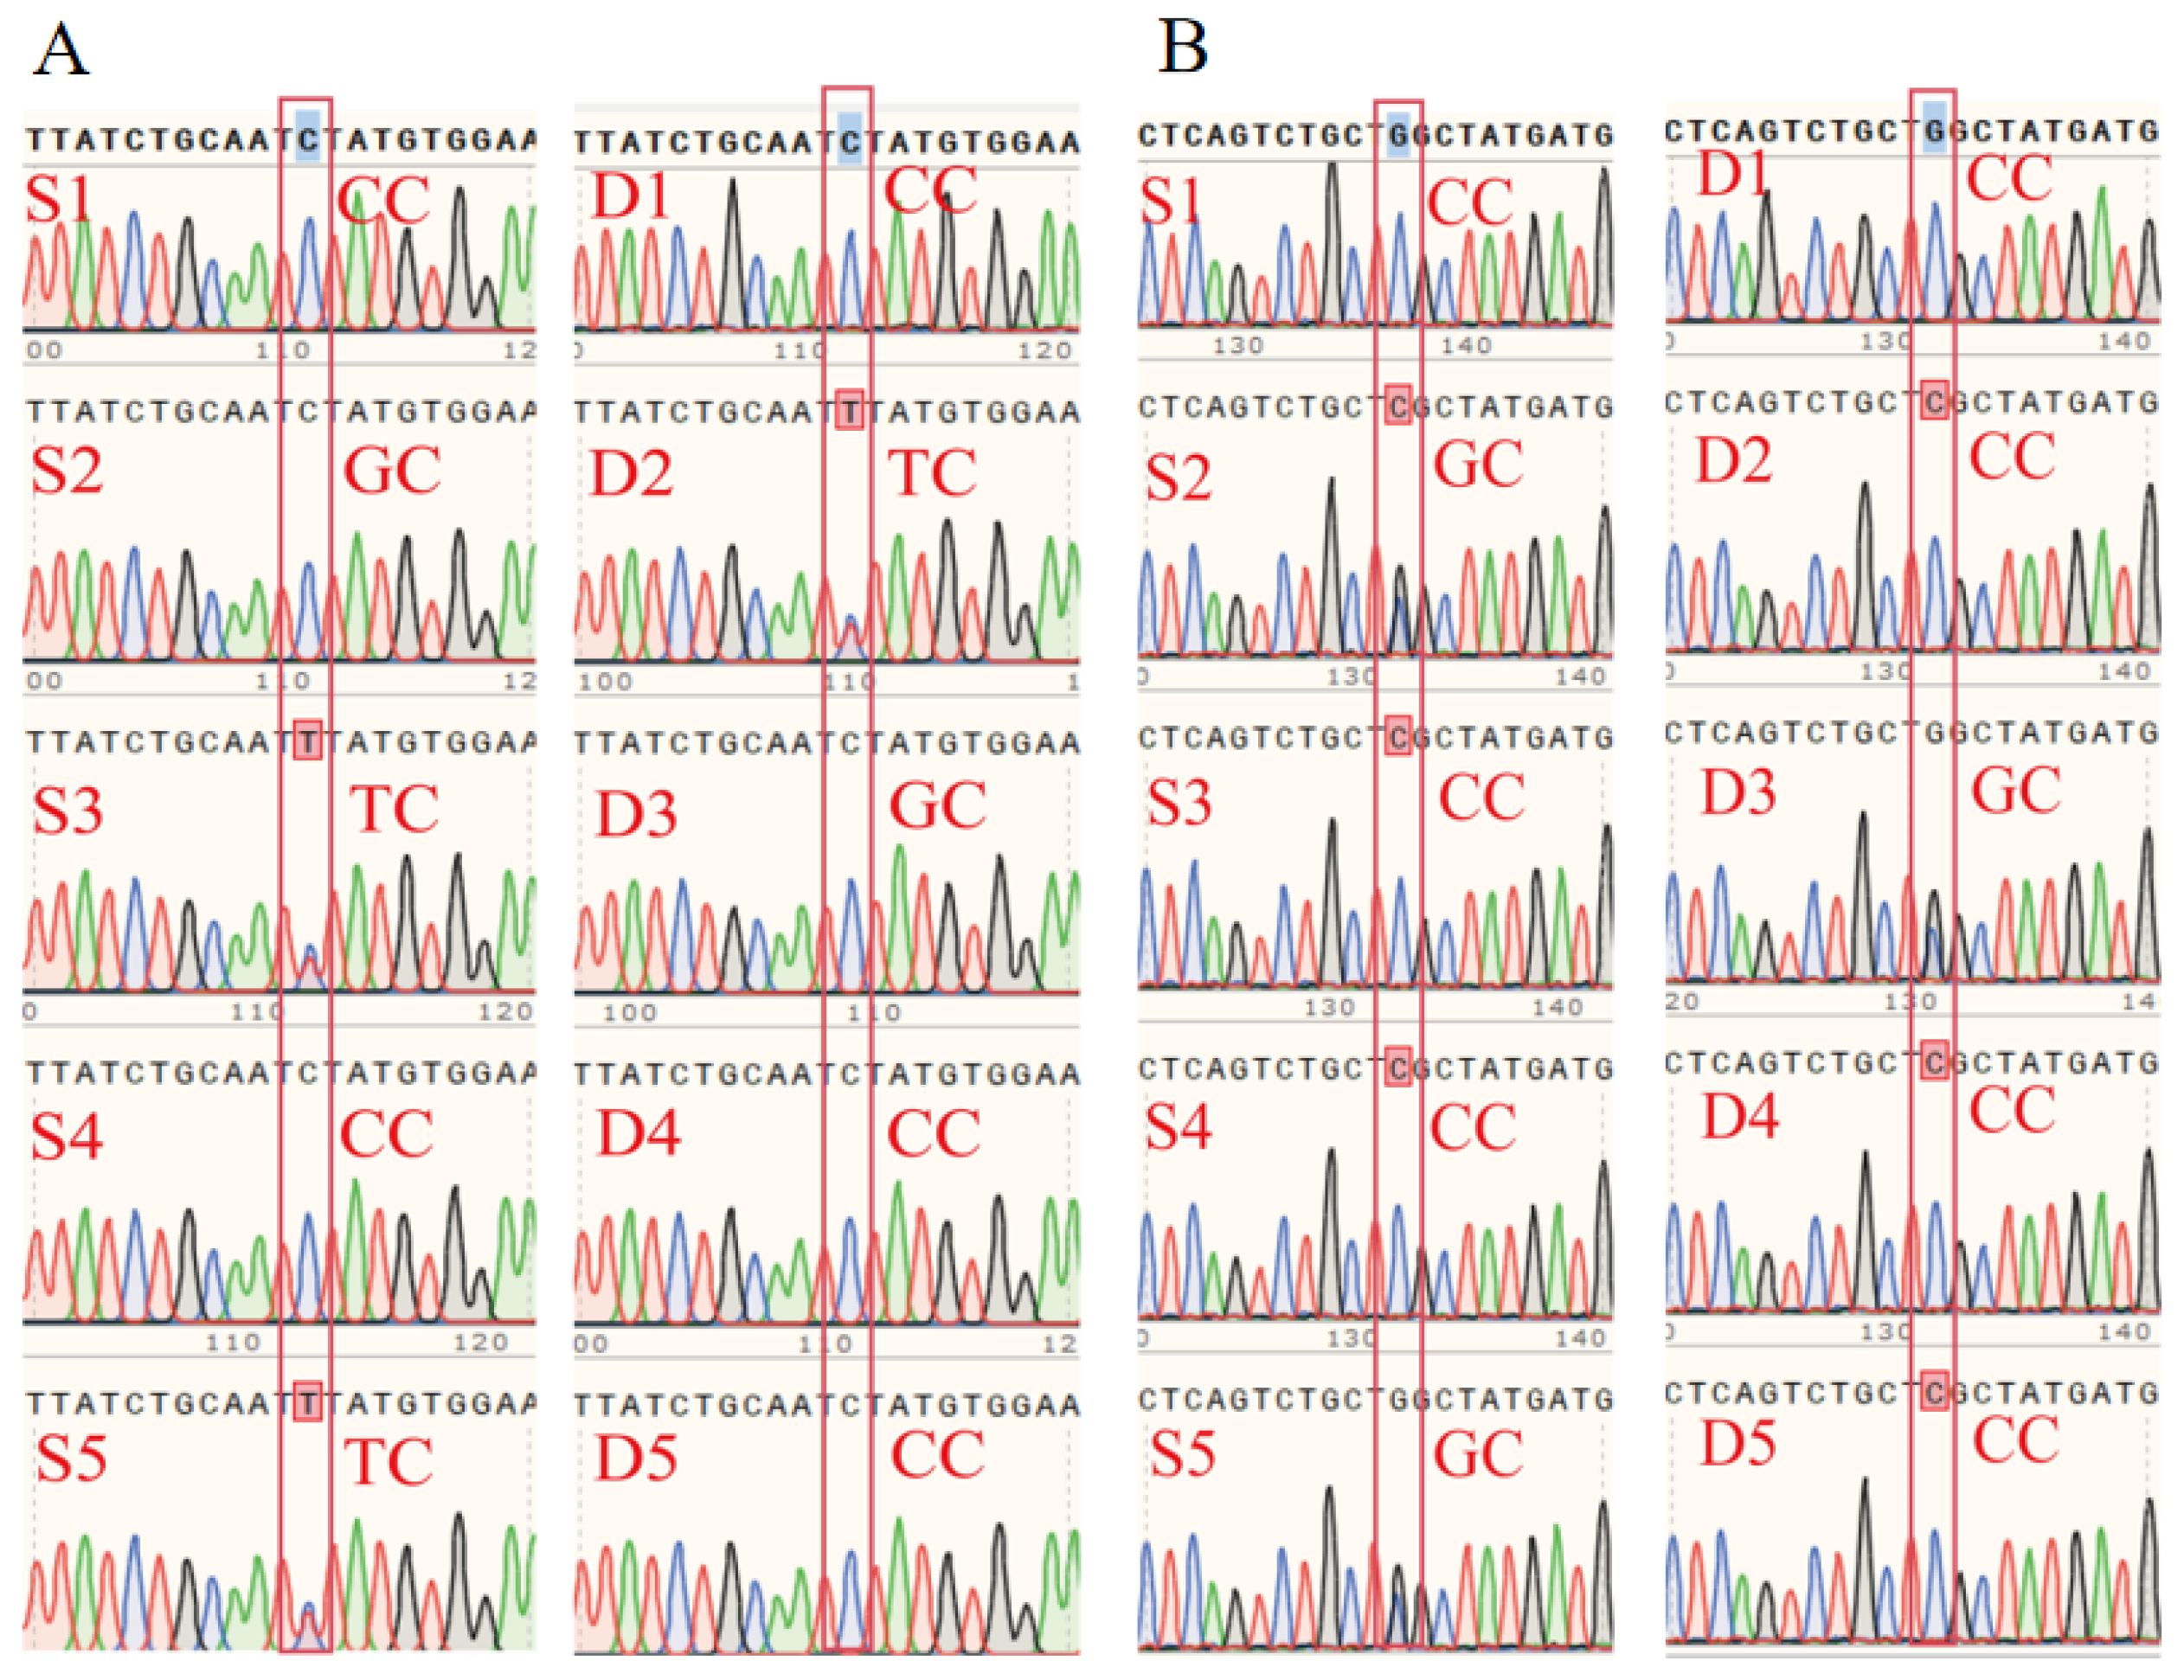
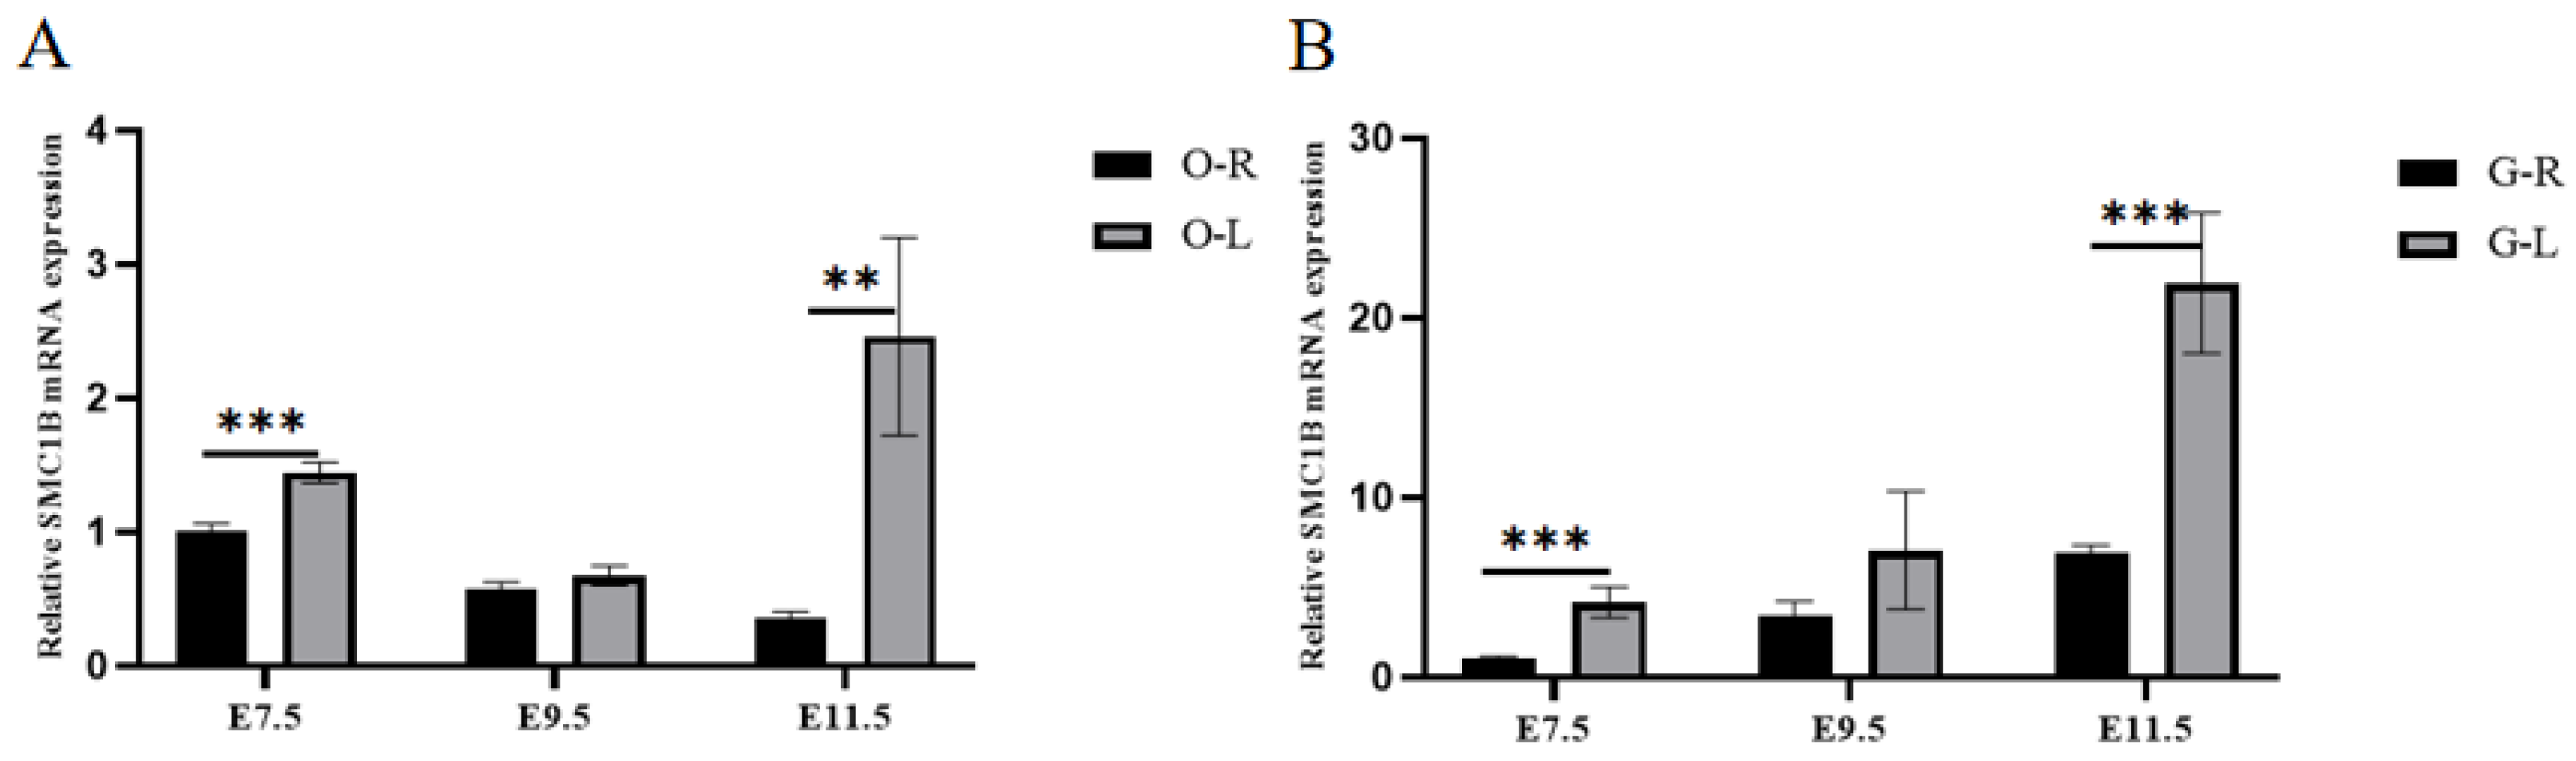
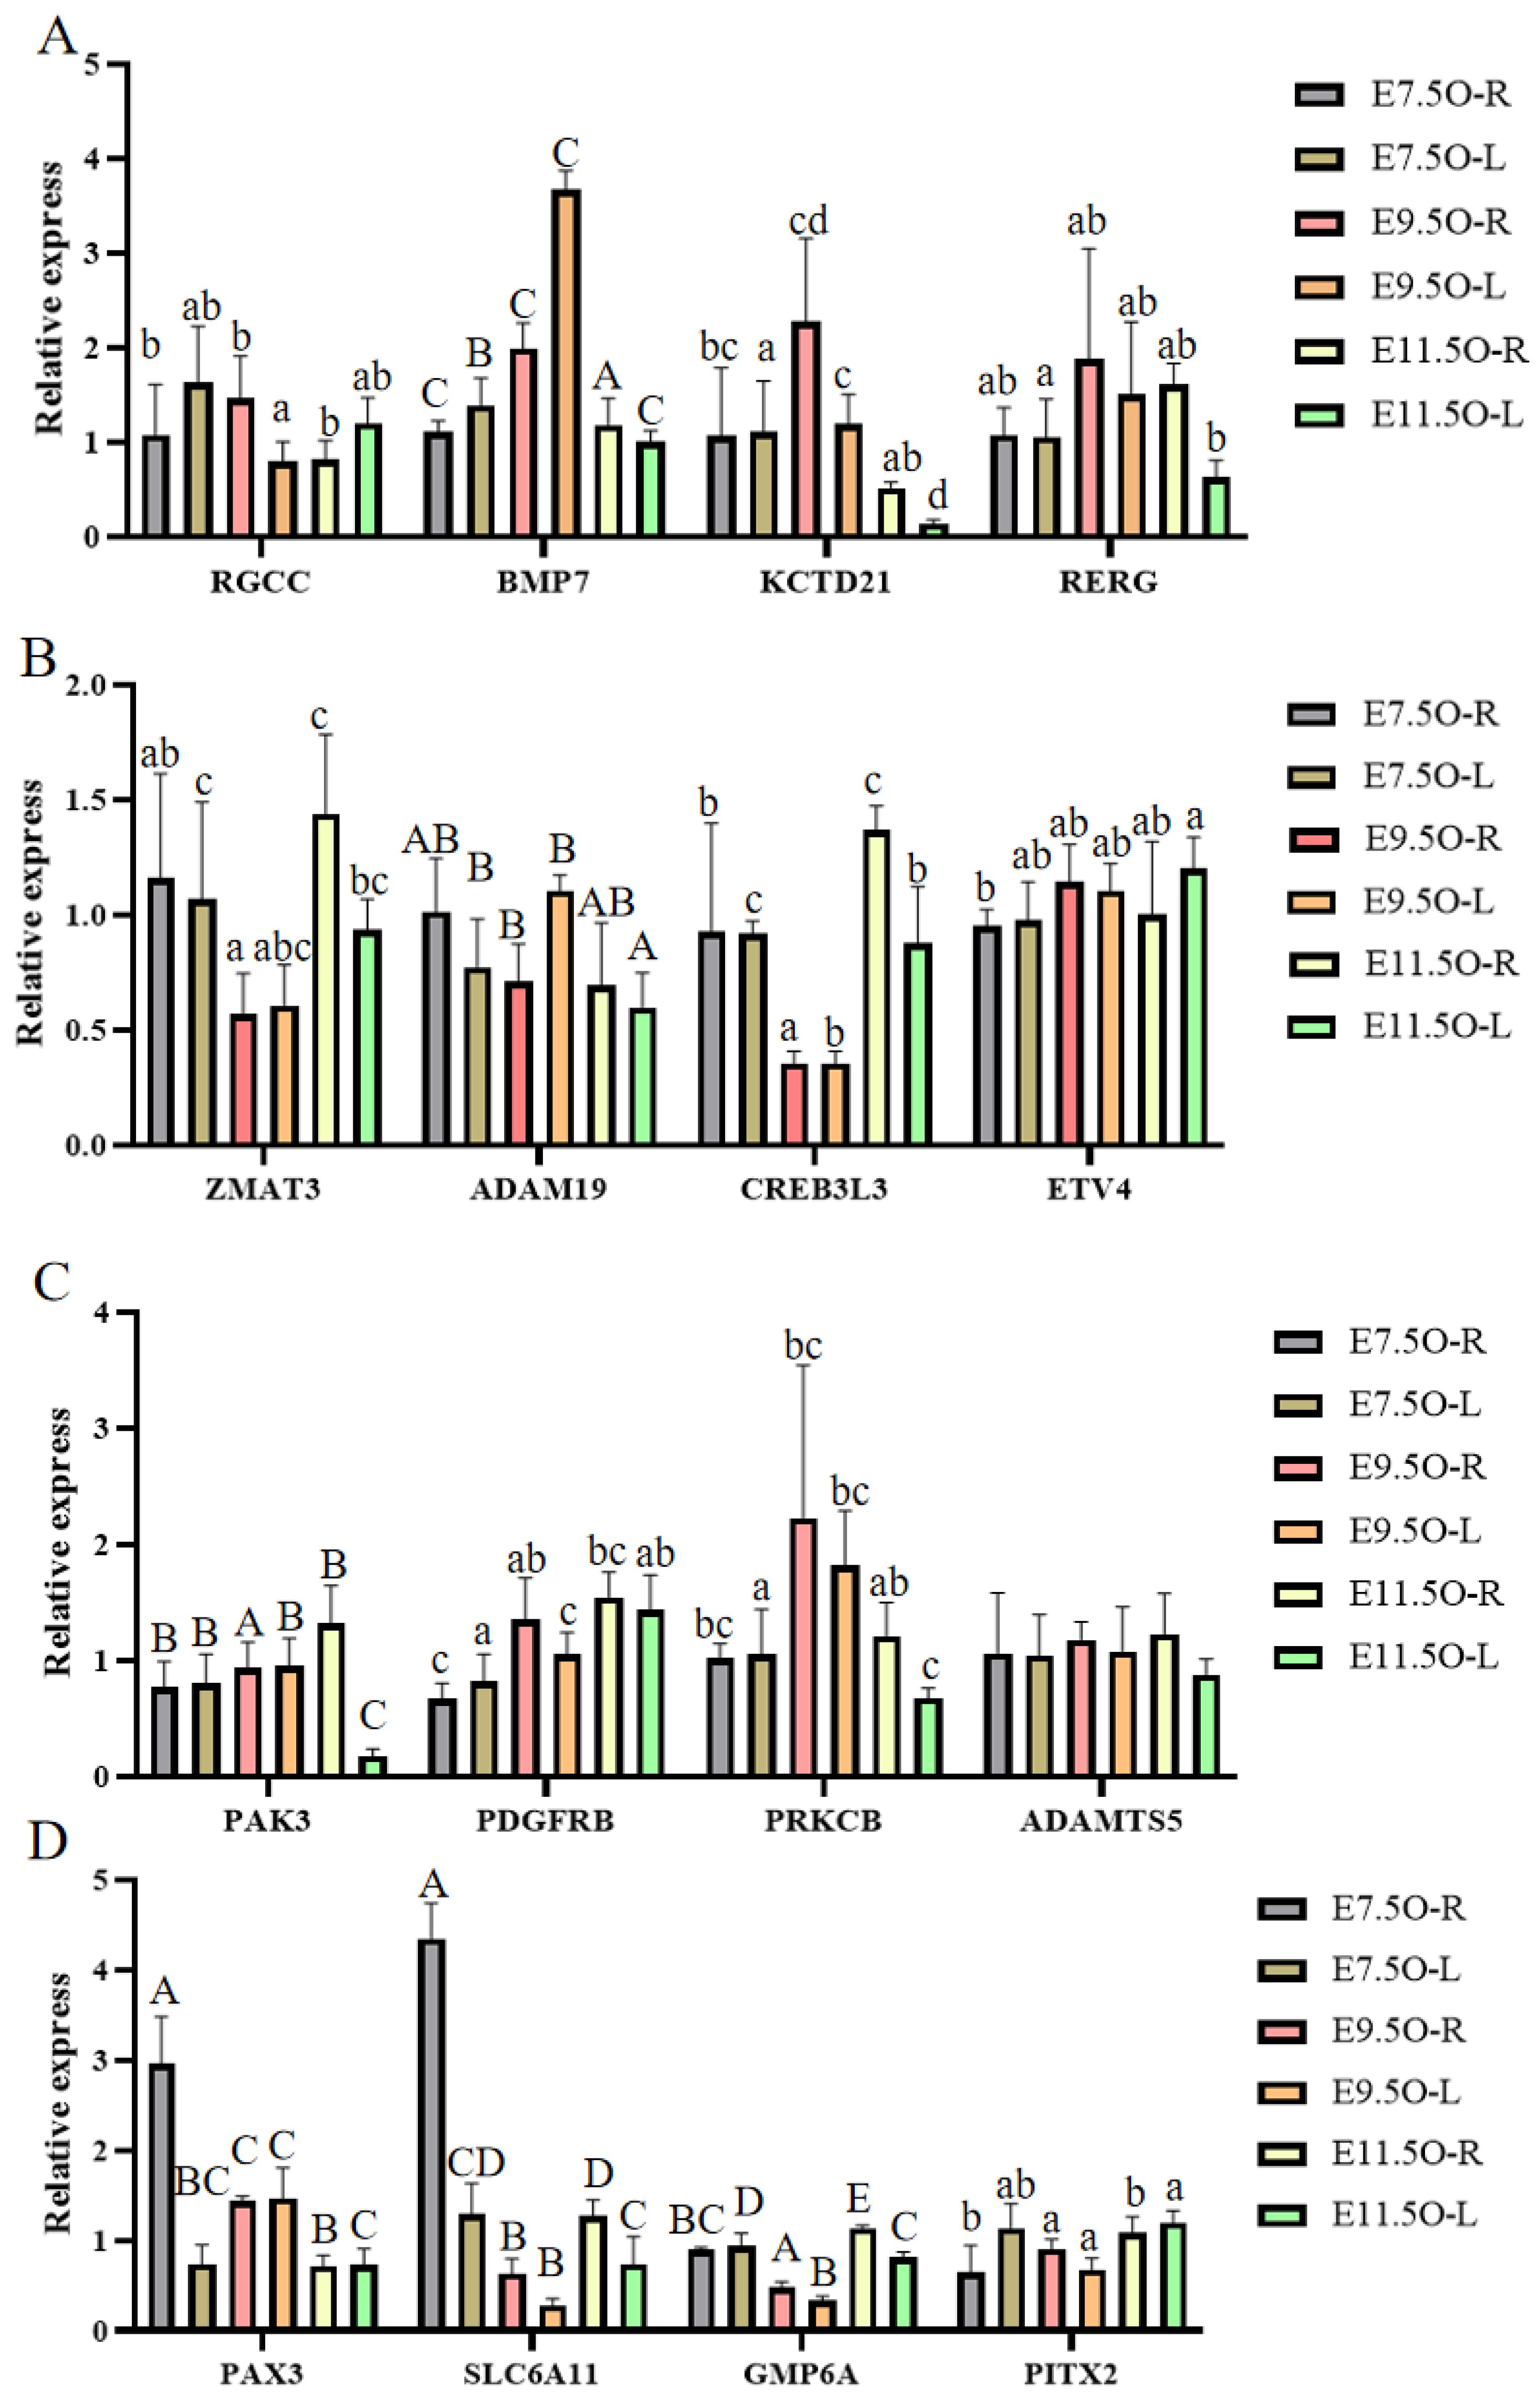
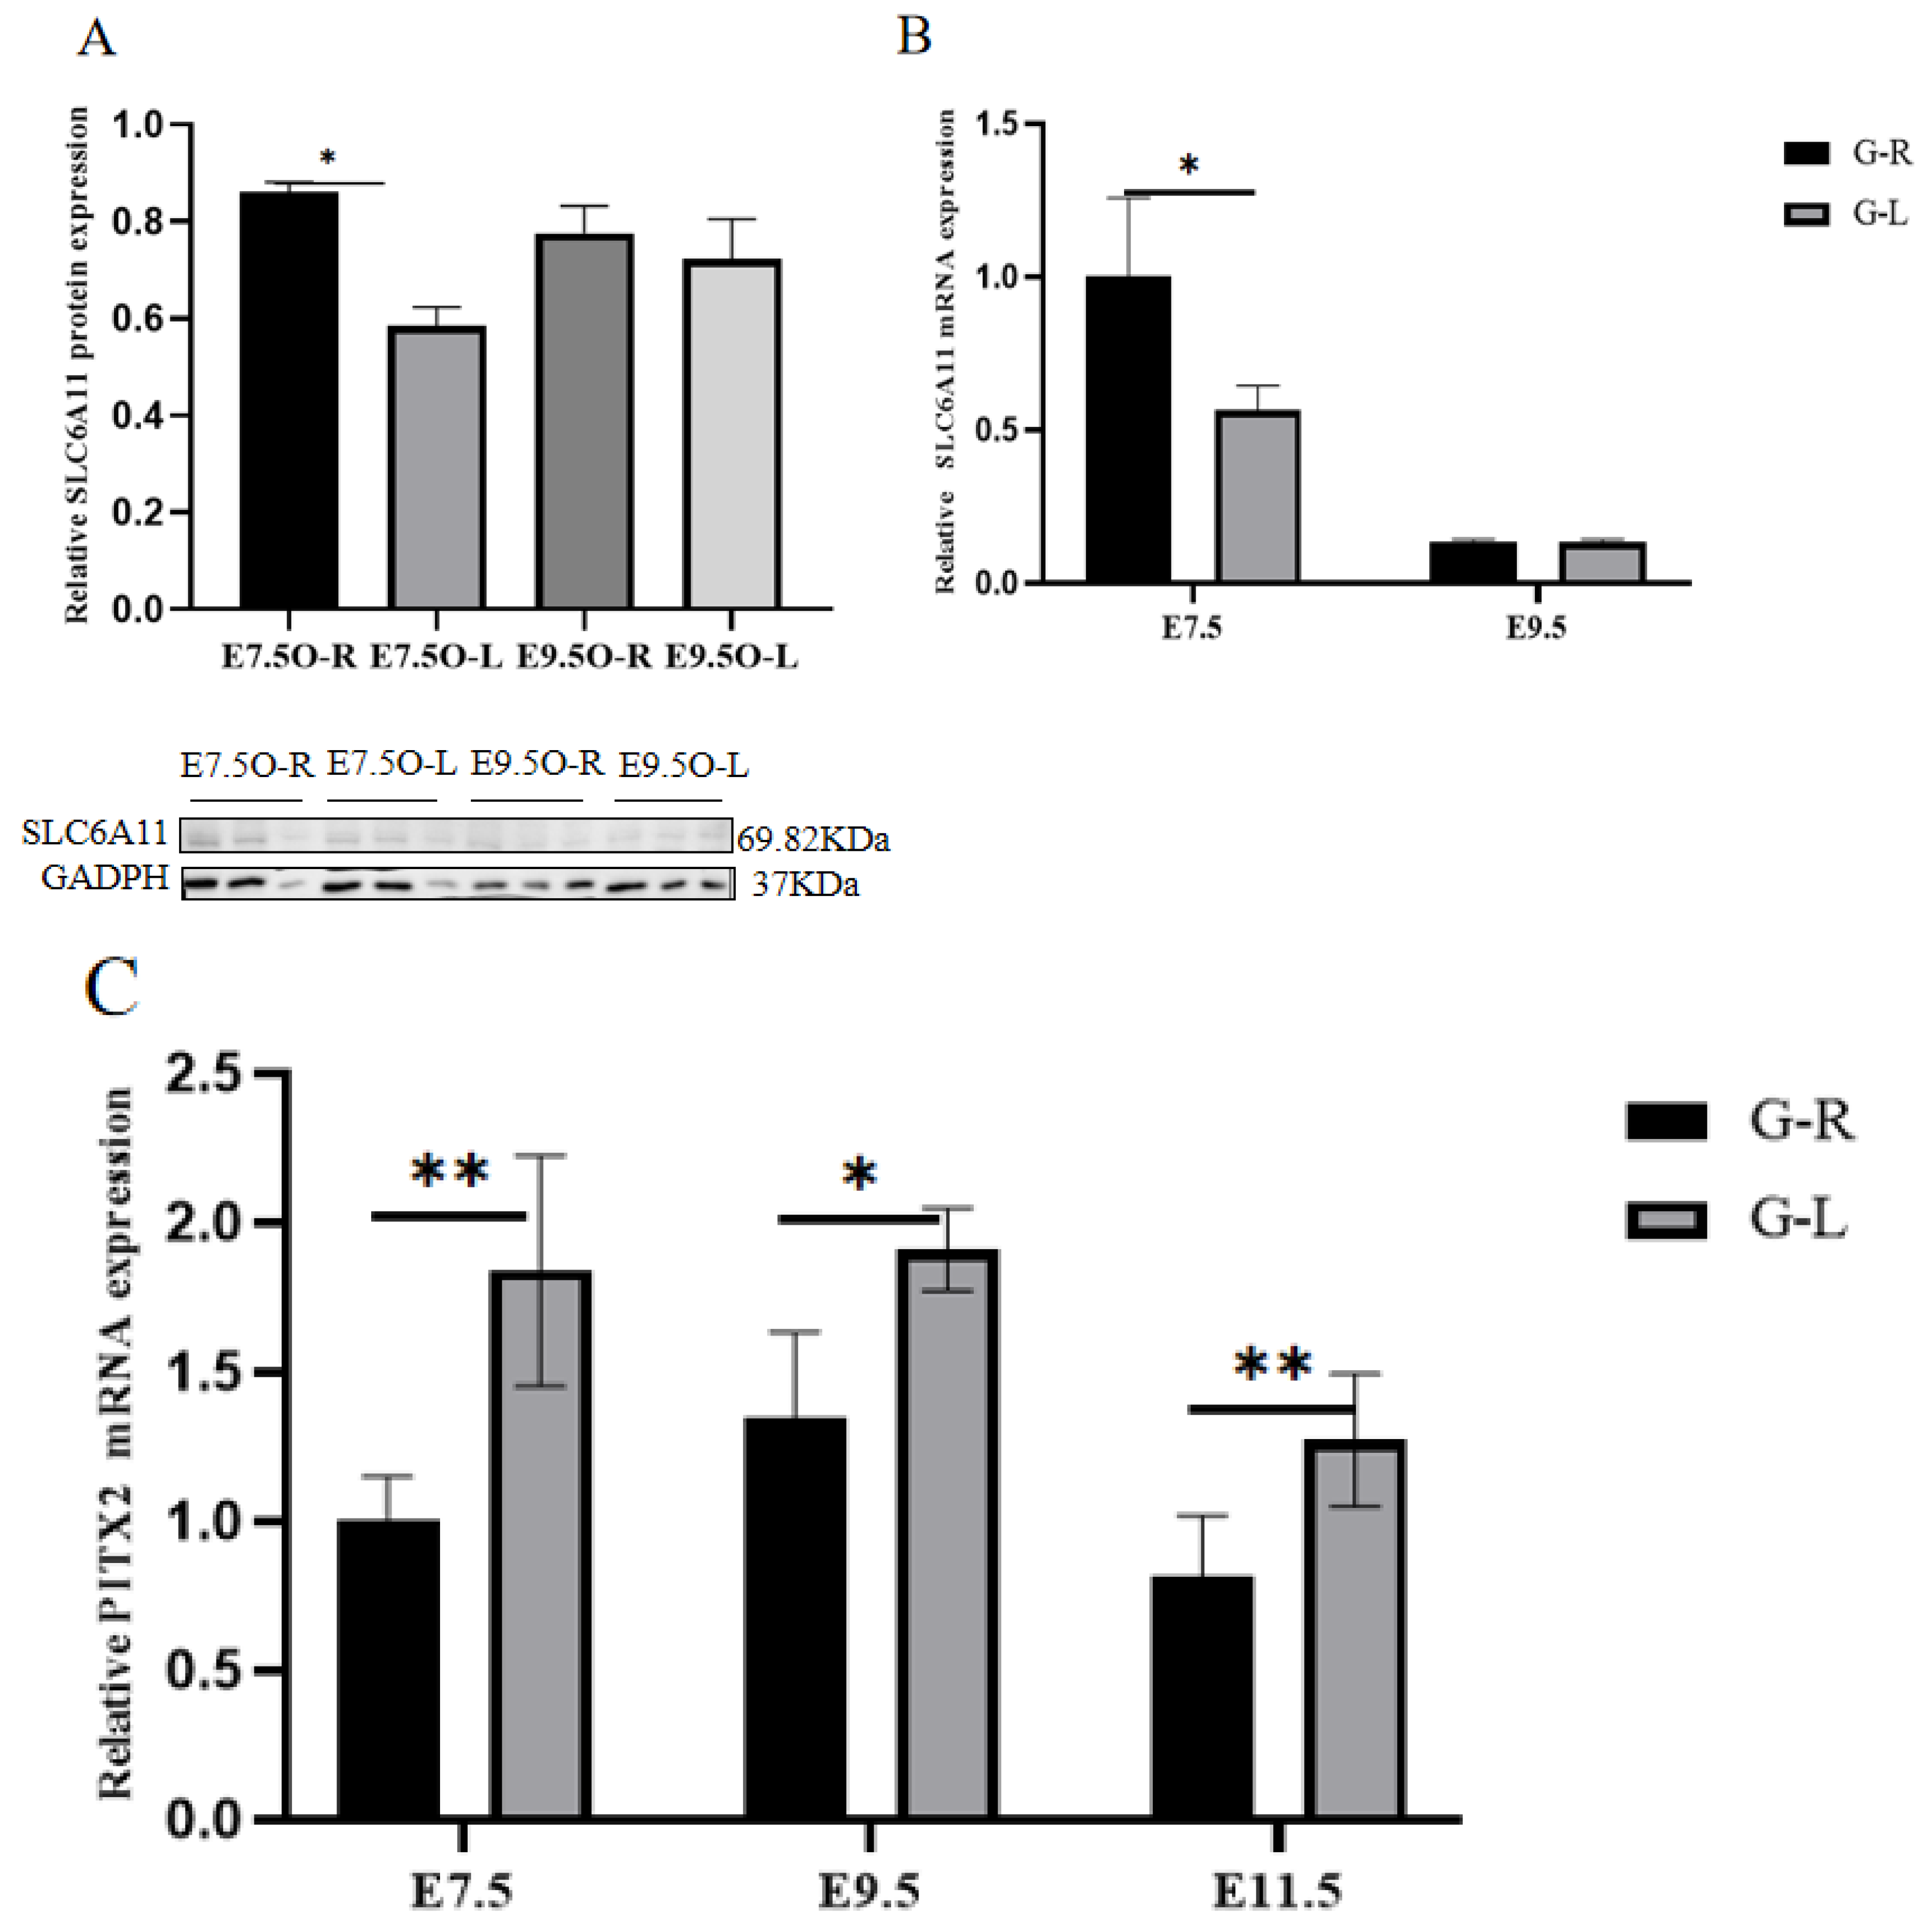
3.6. RT-qPCR, Western Blot, and SNP Validation of Candidate Genes

As shown in the flow chart (Figure 4), candidate genes were screened through the joint analysis of RNA-seq and WGRS.
Following joint oviduct and gonad RNA-seq and the KEGG pathway analysis, the mRNA levels of the candidate gene SMC1B were validated in the oviduct and gonad at different developmental stages. Preliminary verification results from the ovaries and fallopian tubes indicate that, at each time point, the expression level in the right side is lower than that in the left side in both the ovaries and oviducts, which is consistent with the RNA-seq results. Notably, this difference is significant at E7.5 and E11.5, and SMC1B is involved in the process of meiosis and can be a candidate gene for the degeneration of the oviduct on the hens’ right side (Figure 5).
Following a joint analysis of WGRS and oviduct RNA-seq, a total of 16 candidate genes were selected. The 16 genes were validated by RT-qPCR (Figure 6), and the list of primers is provided in Table S1. RT-qPCR validation confirmed that the expression patterns of the genes RGCC, KCTD21, BMP7, ZMAT3, GPM6A, CREB3L3, PAK3, SLC6A11, PITX2, and PAX3 were consistent with RNA-seq results, indicating high-quality sequencing data suitable for further analysis. BMP7 expression was significantly higher on the left side compared to the right at E7.5 and E9.5 (statistically significant difference at E9.5), with involvement in early asymmetric development. PITX2 left-sided expression predominance was observed at E7.5 and E11.5 (significantly higher on the left at E7.5), with asymmetry during early embryonic development. PAX3 expression on the right side was significantly lower than on the left at E7.5, and this transcription factor regulates cell proliferation, migration, and apoptosis. SLC6A11 right-biased expression was detected at E7.5, E9.5, and E11.5, with significant differences at E7.5 and E11.5. Such right-biased expression of SLC6A11 may be involved in the regression of the right-side oviduct. Consequently, PAX3, BMP7, PITX2, and SLC6A11 were identified as potential candidate genes for the asymmetric development of the left and right sides of the oviduct.
As the mutation site of SLC6A11 was identified in the upstream region, it was further verified through Sanger sequencing. Nevertheless, the SNP of SLC6A11 at loci 4,218,730 and 4,222,105 proved to be a false positive (Figure A2). This finding suggests that the mutations at these loci are not the primary drivers of the biased expression of SLC6A11. Subsequently, qPCR was conducted to confirm the expression of SLC6A11 in the gonads, which exhibited a similar pattern to that observed in the oviducts. Notably, the expression was the highest on the right side of E7.5 chicken embryos. Additionally, the Western blotting results indicated that the expression was also high in the right oviduct of E7.5 chicken embryos (Figure 7).
Following a joint analysis of WGRS and gonad RNA-seq data, two candidate genes, PITX2 and ASZ1, were identified and validated by Sanger sequencing of their SNP loci in a small (n = 5) and large (n = 18) population (Table 6). The PITX2 gene was found to have a mutation from T to C in the upstream region at locus 57301142. The WGRS results (n = 6) demonstrated five TT and one TC in group D, and five TC and one CC in group S. In the small group validation (n = 5), PITX2 exhibited five TT in group D, and four TC and one TT in group S, with a significant difference between the two groups (p = 0.004). Consequently, the validation of PITX2 was pursued in a larger population (n = 18), yielding 14 TT in group D and 10 TC in group S (Figure A3), which were also significantly different (p = 0.041). This suggests that this locus may be involved in bilateral oviduct formation when it is a pure T. Subsequent validation of the mRNA levels of PITX2 in embryonic gonads revealed that the expression in the right ovary was lower than that in the left in E7.5, E9.5, and E11.5. This finding suggests that the mutation at locus 57,301,142 in the upstream region of the PITX2 gene may contribute to the degradation of the right reproductive system in females by affecting its mRNA levels (Figure 7C). Furthermore, the G to A mutation of ASZ1 at locus 24,814,074 in the upstream region was validated in the small population (n = 5). The WGRS results (n = 6) demonstrated one GG and five GA in group D, and five GG and one GA in group S. The results of the small population validation indicated two GG and three GA in group D, and four GG and one GA in group S. This difference was not statistically significant (p = 0.704), and thus, no further large population validation was conducted for this mutation point (Figure A3).

4. Discussion

In this study, we performed WGRS on blood samples from hens with unilateral and bilateral oviducts. We then proceeded to perform RNA-seq on the right and left oviducts at varying embryonic developmental stages. Ultimately, we integrated the WGRS data, oviductal RNA-seq data, and RNA-seq data from the right and left gonads at different developmental stages, obtained from a publicly accessible database. Through the utilization of joint multi-omics analyses, we identified DMGs, DEGs, and enriched pathways. This facilitated our search for candidate genes that affect oviduct development and regression. The joint analysis of WGRS and oviduct RNA-seq data revealed overlapping pathways of phenylalanine metabolism and the PPAR signaling pathway. The joint analysis of WGRS and gonad RNA-seq data revealed the presence of overlapping pathways of ferroptosis and phenylalanine metabolism. The joint analysis of oviduct RNA-seq and gonad RNA-seq data revealed that oocyte meiosis and neuroactive ligand–receptor interaction were overlapping pathways. Following joint analysis, a review of the literature, and preliminary validation, it was postulated that SMC1B, PAX3, BMP7, SLC6A11, and PITX2 may be responsible for the development of right oviduct degeneration in hens and warrant further investigation.
For sampling in RNA-seq and WGRS, the ovarian tissues in chicken embryos start to degenerate from E6.5 during sex differentiation, while the oviduct begins to degenerate from E9.5. There are spatiotemporal differences in the degeneration process. The ovary develops from E4.5 and then degenerates from E6.5, and the oviduct develops from E7.5 and degenerates from E11.5. Therefore, the developmental stage of the oviduct (E7.5), the initial degeneration stage of the right oviduct (E9.5), and the stage when the right oviduct has already degenerated (E11.5) are selected. For adult hens with a bilateral reproductive system, obtaining blood samples is convenient and does not affect their normal lives.
According to the WGRS data, a total of 22,333 group-specific SNPs were identified between the groups and mapped to 1045 DMGs. The ErbB signaling pathway, which couples the binding of extracellular growth factor ligands to intracellular signaling pathways regulating a wide range of biological responses, including proliferation, differentiation, cell motility, and survival, was the most notable pathway enriched for these DMGs. As oviductal development progresses, the morphological differences between the right and left oviducts of female chicken embryos become increasingly pronounced, particularly at E11.5 when the right oviduct displays significant degeneration. In accordance with the RNA-seq data, the number of DEGs in the right and left oviducts on E11.5 was significantly higher than those on E7.5 and E9.5 (from 27 on E7.5 and 10 on E9.5, to 38 on E11.5). It is, however, noteworthy that the numbers of DEGs in the left–right comparisons were much smaller than the numbers among different developmental stages (>1000). This suggests that the left and right oviducts undergo similar changes in molecular signaling systems during the early development of the embryonic oviduct. Consequently, a few signaling pathways or genes may play a role in the degeneration of the right oviduct. Furthermore, hierarchical cluster analysis and principal component analysis demonstrated that left and right samples grouped by side at E7.5, E9.5, and E11.5, while samples at different stages exhibited considerable differences. Sixteen randomly selected genes largely concurred with RNA-seq outcomes, substantiating the superior quality of the sequencing data and establishing a dependable foundation for ensuing analyses.
Subsequently, RNA-seq data from the left and right gonads of female chick embryos were jointly analyzed with oviduct RNA-seq data. The analyses demonstrated that SMC1B, a family of cohesion proteins deemed essential for sister chromatid cohesion and DNA recombination in mitosis/meiosis, exhibited divergent expression trends between the left and right. In female chicken embryos across different stages, SMC1B expression was significantly lower in the right ovary than the left, and similarly lower in the right oviduct at E7.5/11.5. This suggests that the reduced expression of SMC1B on the right side of the reproductive system may result in the failure of sister chromatid cohesion during mitosis, which may impede cell division and proliferation, and thus lead to the degradation of the right side of the reproductive system in the hen. These findings are consistent with the observation that DNA synthesis in the epithelium and mesenchyme of the right MD of the chicken embryo was reduced at E9. Additionally, the admixture of nucleotides in the right MD of the chicken embryo was found to gradually decrease from E8 to E10, indicating that the degeneration of the right oviduct of the female embryo was beginning to occur [14]. In zebrafish, Islam et al. [26] also confirmed that SMC1B is essential for meiotic initiation.
A joint analysis of WGRS and oviduct RNA-seq data revealed a total of 132 overlapping pathways. Following screening and preliminary validation of the differential genes, it was concluded that PAX3, BMP7, PITX2, and SLC6A11 may be the candidate genes affecting oviductal degeneration. PAX3, a transcription factor regulating cell proliferation, migration, and apoptosis, with differential expression patterns in the embryonic oviducts at different developmental stages, may be involved in the regulation of oviduct degeneration. Lin et al. [27] found that PAX3 is involved in the Shh signaling process, while SHH is involved in the early asymmetric development of chicken embryos. BMP7 is a bone morphogenic protein that plays a role in the early development of the oviducts [8] and gonads [28]. Hoshino et al. [29] observed asymmetric left–right expression during genital organ formation, with a decrease in ovarian BMP7 expression after aromatase inhibitor treatment. A study identified the presence of BMP receptors in bovine oviduct epithelial cells, indicating the potential function of BMP in oviduct development [30]. The present study identified lower right-side BMP7 expression in oviducts and ovaries, thereby suggesting its involvement in right oviduct degeneration. SLC6A11, which is involved in neurotransmission/metabolism, exhibits asymmetric left–right expression at E7.5/9.5/11.5, with higher levels on the right in both ovary and oviduct. Right-biased expression has been hypothesized to contribute to right oviduct degeneration in chicken embryos; however, further study is required to determine its specific roles.
Following a joint analysis and validation of WGRS and gonad RNA-seq data, PITX2 was identified as a relevant candidate gene. PITX2 is a conserved protein that has been shown to drive asymmetric left–right axis expression across species. For instance, at HH5, PITX2 begins to be highly expressed on the left side of cells around the Hensen’s node [31]. This gives rise to a series of left-biased gene expression cascades (SHH, FGF, CARONTE, BMP, and Nodal) [10,32], which regulate asymmetric development of different organs at different developmental stages [33]. In the female left gonadal cortex, PITX2 has been shown to regulate RALDH2, ERα, and cyclin D1, thereby promoting cell proliferation [34]. As demonstrated by PITX2 expression studies, the protein prevents right ovarian degeneration during gonadogenesis in chicken embryos [13,35,36]. The results of the SNP validation of PITX2 at locus 57,301,142 in this study demonstrated that this gene is associated with the asymmetric development of the oviduct, probably by down-regulating mRNA expression on the right side. Furthermore, the consistent expression pattern of PITX2, BMP7, and SLC6A11 in the ovary and oviduct observed in the preliminary validation lends support to the hypothesis that the pathways in which these genes participate may represent a shared mechanism for the degeneration of the right gonad and oviduct.
In addition, previous studies have demonstrated that a considerable number of genes exhibit asymmetrical expression patterns in the chicken embryonic ovary. For example, LHX9, a downstream target of hedgehog signaling that is strongly expressed in the cortex of the chicken embryonic gonad, [37] has been demonstrated to drive left-sided gonadal development. Ayers et al. [38] identified three new female-biased genes, CAPN5, GPR56, and FGFR3, which may play an important role in ovarian development. The administration of estrogen to chicken embryos has been demonstrated to impede the process of right oviduct degeneration [39]. Conversely, the treatment of chicken embryos with aromatase inhibitors has been shown to result in a reduction in estrogen synthesis, which in turn leads to the degeneration of both the right and left oviducts in female chicken embryos [40]. The expression of MMP2 on the right side leads to the degradation of the basement membrane, which causes degeneration of the oviducts [41,42]. High expression of VCP on the left side and low expression of MSX1 and MSX2 on the right side inhibits cell death and basal degradation, thus promoting cell proliferation or oviduct growth [43]. The knockdown of GPR56 in chicken embryos resulted in a reduction in the length of the MD, so this gene may promote cell proliferation and migration in the MD [44]. In light of the aforementioned studies, this paper proposes that SMC1B, PAX3, BMP7, SLC6A11, and PITX2 may also be involved in the asymmetric development of the reproductive system in female chickens.

5. Conclusions

In conclusion, this paper presents a combined analysis of oviduct RNA-seq data, WGRS, and gonad RNA-seq data, which was employed to screen candidate genes that may affect the degeneration of the right oviduct in female chickens. The oviduct RNA-seq analysis identified a total of 27, 10, and 38 DEGs between the right and left oviduct tissues of E7.5, E9.5, and E11.5 female embryos, respectively. The WGRS analysis revealed 1045 DMGs between the unilateral and bilateral oviducts hens, which were significantly enriched in the regulation of the actin cytoskeleton and the PPAR signaling pathway. Furthermore, through joint analysis and preliminary validation, SMC1B, PAX3, BMP7, SLC6A11, and PITX2 were identified as potential candidate genes affecting oviduct degeneration. Of these, SMC1B, SLC6A11, and PITX2 were consistently expressed in oviducts and gonads, which may represent a shared mechanism of degeneration in the development of the reproductive system of hens. The findings of this study will provide a foundation for further research into the molecular mechanisms of avian-biased genes involved in oviduct development and lays the foundation for the breeding of hens with bilateral reproductive systems and the improvement of the economic efficiency of the egg industry.

Supplementary Materials

The following supporting information can be downloaded at: https://www.mdpi.com/article/10.3390/agriculture15121245/s1, Figure S1: Volcanic diagram (left) and KEGG pathway (right) analysis of differentially expressed genes; Table S1: Distribution of the mapped reads on different regions of the chicken reference genome; Table S2: Expressed genes in all samples (FPKM ≥ 1); Table S3: Differentially expressed genes in each group of oviduct transcriptome sequencing; Table S4:The KEGG pathways that are significantly enriched in each group in the transcriptome sequencing of the oviduct; Table S5: WGRS data quality analysis and summary of mapping to reference genomes; Table S6: Detailed SNP and INDEL annotation classification for all samples; Table S7: Differentially mutated genes between the unilateral and bilateral reproductive systems; Table S8: The most significantly affected GO terms and KEGG pathways on the unilateral and bilateral reproductive systems; Table S9: Overlap of differentially expressed gene enrichment pathways between gonad and oviduct RNA-seq; Table S10: Overlapping genes between differentially expressed genes in RNA-seq oviducts and differentially mutated genes in WGRS; Table S11: Genes in the KEGG pathway of oviduct RNA-seq and WGRS overlap. Table S12: Overlapping genes between differentially expressed genes in RNA-seq gonads and differentially mutated genes in WGRS.

Author Contributions

Conceptualization, L.L. and T.G.; methodology, X.S.; software, M.D.; validation, R.L. and X.L.; formal analysis, R.L.; investigation, Y.L.; resources, M.Z.; data curation, R.L.; writing—original draft preparation, R.L.; writing—review and editing, L.L.; visualization, D.G.; supervision, Y.L.; project administration, M.Z.; funding acquisition, L.L. All authors have read and agreed to the published version of the manuscript.

Funding

This work was supported by the Biological Breeding-National Science and Technology Major Project (2023ZD04053), the “JBGS” Project of Seed Industry Revitalization in Jiangsu Province (Grant number [JBGS [2021]027), Qinghai Provincial Science and Technology Programme (2022-NK-108), the Joint International Research Laboratory of Agriculture and Agri-Product Safety of the Ministry of Education of China, and the Priority Academic Program Development of Jiangsu Higher Education Institutions.

Institutional Review Board Statement

Generated Statement: The animal experimental protocols were reviewed and approved by the Institutional Animal Care and Use Committee of Yangzhou University (SYXK (Su) 2021-0026).

Informed Consent Statement

Not applicable.

Data Availability Statement

The original data presented in this study are openly available in the NCBI (https://www.ncbi.nlm.nih.gov/) under Bioproject accession number PRJNA1025895 (accessed on 9 October 2023), PRJNA1084246 (accessed on 9 March 2024), and PRJNA1175370 (accessed on 30 October 2024).

Conflicts of Interest

The authors declare no conflicts of interest.

Abbreviations

The following abbreviations are used in this manuscript:
WDWolffian ducts
MDMüllerian ducts
WGRSWhole-genome resequencing
DMGsDifferentially mutated genes
DEGsDifferentially expressed genes
E7.5O-RE7.5 right-side oviducts
E7.5O-LE7.5 left-side oviducts
E9.5O-RE9.5 right-side oviducts
E9.5O-LE9.5 left-side oviducts
E11.5O-RE11.5 right-side oviducts
E11.5O-LE11.5 left-side oviducts
DBilateral group
SUnilateral group
FPKMFragments Per Kilo bases per Million fragments
GOGene Ontology
KEGGKyoto Encyclopedia of Genes and Genomes
NCBINational Center for Biotechnology Information
SNPSingle-nucleotide polymorphism
InDelInsertion–deletion

Appendix A

Appendix A.1

Table A1. Primers used for qRT-PCR in this study.
Gene NameGene SequenceGene ID
β-actinTATGTGCAAGGCCGGTTTCNM_205518.2
TGTCTTTCTGGCCCATACCAA
RGCCGCTGATCTGGACAGGACACTXM_417029.8
GGCAGCAGTTCTCCATGACT
ADAM19ATCACGACTCATCTGGCTGCNM_001195122.2
TTGGAAAGGCACATCCCTCC
RERGGATGACACGGTGAAGCCGAAXM_046904998.1
TATGTAGACTCTGACTTGCCCAC
PDGFRBTCTCTGCAGCTCCTCATCCTXM_046900454.1
ACGAGGGAGAAAGTGCTGTG
ADAMTS5CGCCACCACTCTCAAGAACTXM_425541.8
AACGTCTGCCATTCCCAGAG
ZMAT3TGCTAAAGGGGCTGATTCCAGXM_423190.8
TGTCACCACTTAGAGCAGCCT
PAK3TCTACACGCGCTCCGTAATCXM_015278599.4
TCCCACACTCACAATGCTCC
SLC6A11GGAATACTGCACGGTGGGXM_040646635.2
AATGCTGCCGCTTGAGAC
GPM6AAGGACACCCCTCCATCTGTTNM_001012579.2
GGGGGAAATTTGGTCCGAGT
CREB3L3AGATGCCCAGCTCCCTACTAXM_015300011.4
ATCTTCTTCAGCACCCGCTC
PRKCBTCTTCCGCTACATCGACTGGXM_015294481.3
GGTGGATGGCGAGTGAAAAAC
KCTD21GCGCTCACATCTTCTCCACTXM_004938933.5
GGTCAAATGGTTGGGGTCCT
PAX3AGCAGCCCAGTCTGATGAAGNM_001397759.1
AAACCCTCCTGGGATCAGGT
BMP7AGGTCCTCAGCAAACCTCTAAXM_417496.8
CAAATTCCCGTGGTTGCGTT
PITX2GGAGTGTGTCCAGAGCATGAXM_416467.8
GGCCCTGAATCCATCCATGT
SMC1BGGAGTGTGTCCAGAGCATGAXM_416467.8
GGCCCTGAATCCATCCATGT
ETV4CAGATGAGGCCCTTTGCTGAXM_015299450.4
ACAGCCTGGCTACCTCTTCT

Appendix A.2

Table A2. Primers used for PCR in this study.
Gene NameGene SequenceGene ID
PITX2CTTGGGGGATGGAGTAGCACNC_052535.1
TTACACTCCCCCTTGAGCCT
ASZ1CTACAGAGCTGGATGACGGCNC_052532.1
TAGGGGGATAGGGCTGAACG
SLC6A11-1 1GAAGAGAAGTCCCCTGGTGTNC_052543.1
AGTAAACAGAGGGCAGGGTAG
SLC6A11-2 2TATGCGAGGGCTTCTACCCT
AGCCTTGCTGTATGGTAGGC
1 The primer sequence with mutation occurring at site 4218730; 2 the primer sequence with mutation occurring at site 4222105.

Appendix A.3

Table A3. Genes in the KEGG pathway of gonad RNA-seq and WGRS overlap.
Group 1Co-Pathways 2RNA-seqWGRS 3
E4.5G-L vs. E4.5G-RFerroptosisCYBB, MAP1LC3CACSL1, SLC39A8, FTH1, STEAP3, ACSL3, ACSL6
E5.5G-L vs. E5.5G-RPhenylalanine metabolismTAT, HPDPAH, MAOB, MAOA
E6.5G-L vs. E6.5G-R///
1 E4.5/E5.5/E6.5G-L refer to RNA-seq data of the left-side gonads at Embryonic day 4.5, 5.5, and 6.5, respectively; E4.5/E5.5/E6.5G-R refer to RNA-seq data of the right-side gonads at Embryonic day 4.5, 5.5, and 6.5, respectively; 2 common pathway of significant enrichment in two sequencing results; 3 whole-genome resequencing.

Appendix B

Appendix B.1

Figure A1. Analysis of overall gene expression among different samples. (A) There is a statistically significant difference in gene expression levels between the left and right oviducts, using Student’s t-test. FL, left oviduct of chicken embryo; FR, right oviduct of chicken embryo. (B) Cluster all differentially expressed genes. Horizontally representing genes, each column represents a sample, with red indicating high-expression genes and green indicating low-expression genes. (C) Principal component analysis (PCA) of RNA-seq data from biological samples, where different shapes represent different samples and different colors represent different groups.
Agriculture 15 01245 g0a1

Appendix B.2

Figure A2. SLC6A11SNP site validation. (A,B) The SLC6A11 mutation sites are 4218730 and 4222105. S1–S5, hens with unilateral reproductive system; D1–D5, hens with bilateral reproductive systems.
Agriculture 15 01245 g0a2

Appendix B.3

Figure A3. SNP locus validation results for PITX2 and ASZ1. (A,B) represent small group validations of PITX2 and ASZI. D1–D5, hens with bilateral reproductive systems; S1–S5: hens with unilateral reproductive systems. (C,D) Large group validation of PITX2. D1–D18, hens with bilateral reproductive systems; S1–S5: hens with unilateral reproductive systems.
Agriculture 15 01245 g0a3

References

  1. Kuroiwa, A. Sex-Determining Mechanism in Avians. Adv. Exp. Med. Biol. 2017, 1001, 19–31. [Google Scholar] [PubMed]
  2. Josso, N.; di Clemente, N.; Gouédard, L. Anti-Müllerian hormone and its receptors. Mol. Cell. Endocrinol. 2001, 179, 25–32. [Google Scholar] [CrossRef]
  3. Klattig, J.; Englert, C. The Müllerian duct: Recent insights into its development and regression. Sex. Dev. 2007, 1, 271–278. [Google Scholar] [CrossRef]
  4. Mullen, R.D.; Behringer, R. Molecular genetics of Müllerian duct formation, regression and differentiation. Sex. Dev. 2014, 8, 281–296. [Google Scholar] [CrossRef]
  5. Smith, C.A.; Sinclair, A.H. Sex determination: Insights from the chicken. BioEssays 2004, 26, 120–132. [Google Scholar] [CrossRef]
  6. González-Morán, M.G. Histological and stereological changes in growing and regressing chicken ovaries during development. Anat. Rec. 2011, 294, 893–904. [Google Scholar] [CrossRef]
  7. Cunha, G.R.; Kurita, T.; Cao, M.; Shen, J.; Robboy, S.; Baskin, L. Molecular mechanisms of development of the human fetal female reproductive tract. Differentiation 2017, 97, 54–72. [Google Scholar] [CrossRef]
  8. Roly, Z.Y.; Backhouse, B.; Cutting, A.; Tan, T.Y.; Sinclair, A.H.; Ayers, K.L.; Major, A.T.; Smith, C.A. The cell biology and molecular genetics of Müllerian duct development. Wiley Interdiscip. Rev. Dev. Biol. 2018, 7, e310. [Google Scholar] [CrossRef]
  9. Isaac, A.; Sargent, M.G.; Cooke, J. Control of vertebrate left-right asymmetry by a snail-related zinc finger gene. Science 1997, 275, 1301–1304. [Google Scholar] [CrossRef]
  10. Rodríguez Esteban, C.; Capdevila, J.; Economides, A.N.; Pascual, J.; Ortiz, A.; Izpisúa Belmonte, J.C. The novel Cer-like protein Caronte mediates the establishment of embryonic left-right asymmetry. Nature 1999, 401, 243–251. [Google Scholar] [CrossRef]
  11. Welsh, I.C.; Thomsen, M.; Gludish, D.W.; Alfonso-Parra, C.; Bai, Y.; Martin, J.F.; Kurpios, N.A. Integration of left-right Pitx2 transcription and Wnt signaling drives asymmetric gut morphogenesis via Daam2. Dev. Cell 2013, 26, 629–644. [Google Scholar] [CrossRef]
  12. Vermot, J.; Pourquié, O. Retinoic acid coordinates somitogenesis and left-right patterning in vertebrate embryos. Nature 2005, 435, 215–220. [Google Scholar] [CrossRef]
  13. Guioli, S.; Lovell-Badge, R. PITX2 controls asymmetric gonadal development in both sexes of the chick and can rescue the degeneration of the right ovary. Development 2007, 134, 4199–4208. [Google Scholar] [CrossRef]
  14. Beaupain, R. Cell division and cell death during regression of the chick embryo Müllerian ducts. Experientia 1979, 35, 1380–1382. [Google Scholar] [CrossRef]
  15. Howard, J.A.; Hart, K.N.; Thompson, T.B. Molecular Mechanisms of AMH Signaling. Front. Endocrinol. 2022, 13, 927824. [Google Scholar] [CrossRef]
  16. Moses, M.M.; Behringer, R.R. A gene regulatory network for Müllerian duct regression. Environ. Epigenetics 2019, 5, dvz017. [Google Scholar] [CrossRef]
  17. Kang, S.J.; Choi, J.W.; Park, K.J.; Lee, Y.M.; Kim, T.M.; Sohn, S.H.; Lim, J.M.; Han, J.Y. Development of a pheasant interspecies primordial germ cell transfer to chicken embryo: Effect of donor cell sex on chimeric semen production. Theriogenology 2009, 72, 519–527. [Google Scholar] [CrossRef]
  18. Kim, D.; Paggi, J.M.; Park, C.; Bennett, C.; Salzberg, S.L. Graph-based genome alignment and genotyping with HISAT2 and HISAT-genotype. Nat. Biotechnol. 2019, 37, 907–915. [Google Scholar] [CrossRef]
  19. Putri, G.H.; Anders, S.; Pyl, P.T.; Pimanda, J.E.; Zanini, F. Analysing high-throughput sequencing data in Python with HTSeq 2.0. Bioinformatics 2022, 38, 2943–2945. [Google Scholar] [CrossRef]
  20. Love, M.I.; Huber, W.; Anders, S. Moderated estimation of fold change and dispersion for RNA-seq data with DESeq2. Genome Biol. 2014, 15, 550. [Google Scholar] [CrossRef]
  21. Luo, H.; Zhou, H.; Jiang, S.; He, C.; Xu, K.; Ding, J.; Liu, J.; Qin, C.; Chen, K.; Zhou, W.; et al. Gene Expression Profiling Reveals Potential Players of Sex Determination and Asymmetrical Development in Chicken Embryo Gonads. Int. J. Mol. Sci. 2023, 24, 14597. [Google Scholar] [CrossRef] [PubMed]
  22. Chen, S.; Zhou, Y.; Chen, Y.; Gu, J. fastp: An ultra-fast all-in-one FASTQ preprocessor. Bioinformatics 2018, 34, i884–i890. [Google Scholar] [CrossRef] [PubMed]
  23. Li, H.; Durbin, R. Fast and accurate short read alignment with Burrows-Wheeler transform. Bioinformatics 2009, 25, 1754–1760. [Google Scholar] [CrossRef] [PubMed]
  24. Zhu, P.; He, L.; Li, Y.; Huang, W.; Xi, F.; Lin, L.; Zhi, Q.; Zhang, W.; Tang, Y.T.; Geng, C.; et al. OTG-snpcaller: An optimized pipeline based on TMAP and GATK for SNP calling from ion torrent data. PLoS ONE 2014, 9, e97507. [Google Scholar] [CrossRef]
  25. Cingolani, P.; Platts, A.; Wang le, L.; Coon, M.; Nguyen, T.; Wang, L.; Land, S.J.; Lu, X.; Ruden, D.M. A program for annotating and predicting the effects of single nucleotide polymorphisms, SnpEff: SNPs in the genome of Drosophila melanogaster strain w1118; iso-2; iso-3. Fly 2012, 6, 80–92. [Google Scholar] [CrossRef]
  26. Islam, K.N.; Modi, M.M.; Siegfried, K.R. The Zebrafish Meiotic Cohesin Complex Protein Smc1b Is Required for Key Events in Meiotic Prophase I. Front. Cell Dev. Biol. 2021, 9, 714245. [Google Scholar] [CrossRef]
  27. Lin, J.; Wang, C.; Yang, C.; Fu, S.; Redies, C. Pax3 and Pax7 interact reciprocally and regulate the expression of cadherin-7 through inducing neuron differentiation in the developing chicken spinal cord. J. Comp. Neurol. 2016, 524, 940–962. [Google Scholar] [CrossRef]
  28. Meno, C.; Takeuchi, J.; Sakuma, R.; Koshiba-Takeuchi, K.; Ohishi, S.; Saijoh, Y.; Miyazaki, J.; ten Dijke, P.; Ogura, T.; Hamada, H. Diffusion of nodal signaling activity in the absence of the feedback inhibitor Lefty2. Dev. Cell 2001, 1, 127–138. [Google Scholar] [CrossRef]
  29. Hoshino, A.; Koide, M.; Ono, T.; Yasugi, S. Sex-specific and left-right asymmetric expression pattern of Bmp7 in the gonad of normal and sex-reversed chicken embryos. Dev. Growth Differ. 2005, 47, 65–74. [Google Scholar] [CrossRef]
  30. Valdecantos, P.A.; Bravo Miana, R.D.C.; García, E.V.; García, D.C.; Roldán-Olarte, M.; Miceli, D.C. Expression of bone morphogenetic protein receptors in bovine oviductal epithelial cells: Evidence of autocrine BMP signaling. Anim. Reprod. Sci. 2017, 185, 89–96. [Google Scholar] [CrossRef]
  31. Hamburger, V.; Hamilton, H.L. A series of normal stages in the development of the chick embryo. Dev. Dyn. 1951, 195, 231–272. [Google Scholar] [CrossRef] [PubMed]
  32. Gros, J.; Feistel, K.; Viebahn, C.; Blum, M.; Tabin, C.J. Cell movements at Hensen’s node establish left/right asymmetric gene expression in the chick. Science 2009, 324, 941–944. [Google Scholar] [CrossRef]
  33. Tabin, C.J.; Vogan, K.J. A two-cilia model for vertebrate left-right axis specification. Genes Dev. 2003, 17, 1–6. [Google Scholar] [CrossRef]
  34. Ishimaru, Y.; Komatsu, T.; Kasahara, M.; Katoh-Fukui, Y.; Ogawa, H.; Toyama, Y.; Maekawa, M.; Toshimori, K.; Chandraratna, R.A.; Morohashi, K.; et al. Mechanism of asymmetric ovarian development in chick embryos. Development 2008, 35, 677–685. [Google Scholar] [CrossRef]
  35. Intarapat, S.; Stern, C.D. Sexually dimorphic and sex-independent left-right asymmetries in chicken embryonic gonads. PLoS ONE 2013, 8, e69893. [Google Scholar] [CrossRef]
  36. Rodríguez-León, J.; Rodríguez Esteban, C.; Martí, M.; Santiago-Josefat, B.; Dubova, I.; Rubiralta, X.; Izpisúa Belmonte, J.C. Pitx2 regulates gonad morphogenesis. Proc. Natl. Acad. Sci. USA 2008, 105, 11242–11247. [Google Scholar] [CrossRef]
  37. Yoshino, T.; Murai, H.; Saito, D. Hedgehog-BMP signalling establishes dorsoventral patterning in lateral plate mesoderm to trigger gonadogenesis in chicken embryos. Nat. Commun. 2016, 7, 12561. [Google Scholar] [CrossRef]
  38. Ayers, K.L.; Lambeth, L.S.; Davidson, N.M.; Sinclair, A.H.; Oshlack, A.; Smith, C.A. Identification of candidate gonadal sex differentiation genes in the chicken embryo using RNA-seq. BMC Genom. 2015, 16, 704. [Google Scholar] [CrossRef]
  39. Doi, O.; Hutson, J.M. Pretreatment of chick embryos with estrogen in ovo prevents mullerian duct regression in organ culture. Endocrinology 1988, 122, 2888–2891. [Google Scholar] [CrossRef]
  40. Elbrecht, A.; Smith, R. Aromatase enzyme activity and sex determination in chickens. Science 1992, 255, 467–470. [Google Scholar] [CrossRef]
  41. Roly, Z.Y.; Major, A.T.; Fulcher, A.; Estermann, M.A.; Hirst, C.E.; Smith, C.A. Adhesion G-protein-coupled receptor, GPR56, is required for Müllerian duct development in the chick. J. Endocrinol. 2020, 44, 395–413. [Google Scholar] [CrossRef] [PubMed]
  42. Ha, Y.; Tsukada, A.; Saito, N.; Shimada, K. Changes in mRNA expression of MMP-2 in the Müllerian duct of chicken embryo. Gen. Comp. Endocrinol. 2004, 139, 131–136. [Google Scholar] [CrossRef]
  43. Ha, Y.; Tsukada, A.; Saito, N.; Zadworny, D.; Shimada, K. Identification of differentially expressed genes involved in the regression and development of the chicken Müllerian duct. Int. J. Dev. Biol. 2008, 52, 1135–1141. [Google Scholar] [CrossRef]
  44. Roberts, L.M.; Visser, J.A.; Ingraham, H.A. Involvement of a matrix metalloproteinase in MIS-induced cell death during urogenital development. Development 2002, 129, 1487–1496. [Google Scholar] [CrossRef]
Figure 1. Gross morphology of embryonic gonads and oviducts at different developmental stages and bilateral or unilateral reproductive systems in adult hens. (A) Gross morphology of embryonic gonads and oviducts: E7.5, Embryonic day 7.5; RG, right-side gonad; LG, left-side gonad; RO, right-side oviduct; LO, left-side oviduct. (B,C) Anatomy of bilateral reproductive systems in a female adult chicken. R-Ova, right-side ovary; L-Ova, left-side ovary; R-Ovi, right side-oviduct; L-Ovi, left-side oviduct. (D) Anatomy of a unilateral reproductive system in a female adult chicken.
Agriculture 15 01245 g001
Figure 2. Analysis of differentially expressed genes (DEGs) in the oviduct RNA-seq data. (A) The numbers of DEGs between different groups of oviducts. (B) The distribution of DEGs on different kinds of chromosomes. E7.5/E9.5/E11.5O-L refer to RNA-seq data of the left-side oviduct at Embryonic day 7.5, 9.5, and 11.5, respectively; E7.5/E9.5/E11.5O-R refer to RNA-seq data of the right-side oviduct at Embryonic day 7.5, 9.5, and 11.5, respectively. Blue bar, sex chromosomes; green bar, autosomes; red bar, unknown chromosomes.
Agriculture 15 01245 g002
Figure 3. Enrichment analysis of GO and KEGG pathways for group-specific variant genes. (A) GO enrichment analysis in biological processes (BP), cellular components (CC), and molecular function (MF). The blue, orange, and green columns represent MF, BP, and CC, respectively. (B) KEGG pathway enrichment analysis. Count, the number of differentially expressed genes enriched in this pathway; p-value generally ranges from 0 to 1, and the closer it is to zero, the more significant the enrichment.
Agriculture 15 01245 g003
Figure 4. Schematic diagram of candidate gene-screening strategy.
Agriculture 15 01245 g004
Figure 5. Spatiotemporal mRNA expression of SMC1B in chicken embryonic tissues. (A) Relative mRNA expression of SMC1B in embryonic oviducts. O-R: right oviduct; O-L: left oviduct. (B) Relative mRNA expression of SMC1B in embryonic gonads. G-R: right ovary; G-L: left ovary. E7.5/9.5/11.5: 7.5/9.5/11.5 day female chicken embryos. The symbols “**” and “***” represent p < 0.01 and p < 0.001, respectively.
Agriculture 15 01245 g005
Figure 6. Spatiotemporal mRNA expression of 16 candidate genes in chicken embryonic oviducts. (A) Relative expression of RGCCI BMP7I KCTD21 and RERG; (B) Relative expression of ZMAT3, ADAM19, CREB3L3 and ETV4; (C) Relative expression of PAK3, PDGFRB, PRKCB and ADAMTS5; (D) Relative expression of PAX3, SLC6A11, GMP6A and PITX2. Different letters (a, b and c) indicate statistically significant differences (p < 0.05), while different letters (A, B, C, D, and E) indicate statistically significant differences (p < 0.01). No significance exists between the same letters.
Agriculture 15 01245 g006
Figure 7. Spatiotemporal expression of SLC6A11 and PITX2 in chicken embryonic tissues. (A) Relative protein expression of SLC6A11 in embryonic oviducts. E7.5/9.5O-R, the right oviducts of chicken embryos at Embryonic day 7.5/9.5; E7.5/9.5O-L, the left oviducts of chicken embryos at Embryonic day 7.5/9.5. (B) Relative mRNA expression of SLC6A11 in embryonic gonads. (C) Relative mRNA expression of PITX2 in embryonic gonads. G-R: right ovary; G-L: left ovary. E7.5/9.5/11.5: 7.5/9.5/11.5-day female chicken embryos. The symbols “*”and “**” represent p < 0.05, p < 0.01, respectively.
Agriculture 15 01245 g007
Table 1. Sexing PCR primers.
Gene NameGene SequenceGene ID
CHDCTGCGAGAACGTGGCAACAGAGTNM_204941.2
ATTGAAATGATCCAGTGCTTC
Table 2. The top five differentially expressed genes in the different comparisons of oviduct RNA-seq data.
Group 1NameGroup 1NameGroup 1Name
E7.5O-L
vs.
E7.5O-R
EYA1E9.5O-L
vs.
E9.5O-R
GJD2E11.5O-L
vs.
E11.5O-R
LUZP2
EBF2GPM6ASLC30A8
NPHS2RANBP3LTNFRSF6B
SPP1USP42SLC38A3
DDEFL1PPARGVTG1
E11.5O-R
vs.
E9.5O-R
SOX10E9.5O-R
vs.
E7.5O-R
SRD5A2E11.5O-R
vs.
E7.5O-R
CYP2AC1
PDK4DLX6SLC34A1
ACTG2DLX5SRD5A2
TUBB3FSTACSM3
SLC17A8FSTL4SLC6A19
E11.5O-L
vs.
E9.5O-L
SOX10E9.5O-L
vs.
E7.5O-L
SRD5A2E11.5O-L
vs.
E7.5O-L
SRD5A2
SLC17A8FSTL4RHCG
ECEL1DLX5CALB1
ENSGALG00000051930FSTENSGALG00000051882
LAMA3CLCNKBENSGALG00000039159
1 E7.5/E9.5/E11.5O-L refer to RNA-seq data of the left-side oviduct at Embryonic day 7.5, 9.5, and 11.5, respectively; E7.5/E9.5/E11.5O-R refer to RNA-seq data of the right-side oviduct at Embryonic day 7.5, 9.5, and 11.5, respectively.
Table 3. Population-specific SNP statistics and annotation results.
Region 1NumberPercentage
INTRON13,88562.173%
INTERGENIC560325.088%
SYNONYMOUS_CODING2901.299%
NON_SYNONYMOUS_CODING1140.510%
UPSTREAM8453.784%
DOWNSTREAM9054.052%
UTR_3_PRIME4762.131%
UTR_5_PRIME830.372%
START_GAINED510.228%
SPLICE_SITE_REGION500.224%
INTRAGENIC280.125%
SPLICE_SITE_ACCEPTOR10.004%
START_LOST10.004%
STOP_GAINED10.004%
Total22,333100.000%
1 INTRON, intron; INTERGENIC, intergenic region; SYNONYMOUS_CODING, synonymous coding variation; NON_SYNONYMOUS_CODING, nonsynonymous coding variation; UPSTREAM, upstream region of gene (within 5K); DOWNSTREAM, downstream region of gene (within 5K); UTR_5_PRIME, the mutation is located in the UTR5 of one gene; UTR_3_PRIME, the mutation is located in the UTR3 of another gene; START_GAINED, start codon gain (non-coding regions); SPLICE_SITE_REGION, splicing region variation (1–3 base variation in exon or 3–8 base variation in intron); INTRAGENIC, intragenic (no transcript information); SPLICE_SITE_ACCEPTOR, splicing acceptor variation (within the first 2 bp of exon); START_LOST, start codon lost; STOP_GAINED, stop codon gain.
Table 4. Overlap of differentially expressed genes between oviduct RNA-seq data and gonad RNA-seq data.
Overlap 1E7.5-OviductE9.5-OviductE11.5-Oviduct
E4.5-gonadNPHS2/LUZP2, GRIA1
E5.5-gonad//LUZP2, GRIA1
E6.5-gonadENSGALG00000054136, SMC1B/LUZP2, SLC7A9, GRIA1
1 E4.5/E5.5/E6.5-gonad, differentially expressed genes between the left and right sides of gonads at Embryonic day 4.5, 5.5, and 6.5, respectively; E7.5/E9.5/E11.5-oviduct, differentially expressed genes between the left and right sides of oviducts at Embryonic day 7.5, 9.5, and 11.5, respectively.
Table 5. Genes in the co-pathway of E7.5 oviduct RNA-seq data and E6.5 gonad RNA-seq data.
Co-Pathways 1E7.5-Oviduct 2E6.5-Gonad 3
Oocyte meiosisSMC1B, CPEB1, CPEB2SMC1B
Neuroactive ligand–receptor interactionHTR1E, P2RY8, GRIA1, DRD4, GABRA3CCKAR, GLRB, AVPR2
1 Common significantly enriched pathways between two kinds of RNA-seq data; 2 E7.5-oviduct, differentially expressed genes between the left and right sides of oviducts at embryonic day 7.5; 3 E6.5-gonad, differentially expressed genes between the left and right sides of gonads at Embryonic day 6.5.
Table 6. Statistical analysis of the Sanger sequencing validation of SNP of PITX2 and ASZ1.
GeneSiteRegionType of Base MutationWGRSSmall Group Verification ResultsLarge Group Verification Results
Ref 1Alt 2D 3 (n = 6)S 4 (n = 6)D (n = 5)S (n = 5)D (n = 18)S (n = 18)
PITX257301142UPSTREAMTCT(5)
T + C(1)
T(1)
T + C(5)
T(5)T + C(4)
T(1)
T(14) C(2)
T + C(2)
T + C(10)
T(8)
ASZ124814074UPSTREAMGAG + A(5)
G(1)
G(5)
G + A(1)
G + A(3)
G(2)
G + A(1) G(4)//
1 Reference base; 2 alter base; 3 bilateral reproductive system group; 4 unilateral reproductive system group.
Disclaimer/Publisher’s Note: The statements, opinions and data contained in all publications are solely those of the individual author(s) and contributor(s) and not of MDPI and/or the editor(s). MDPI and/or the editor(s) disclaim responsibility for any injury to people or property resulting from any ideas, methods, instructions or products referred to in the content.

