Article

Successive Harvesting Interval and Salinity Level Modulate Biomass Production and Nutritional Value in Sarcocornia fruticosa and Arthrocaulon macrostachyum

1
The Albert Katz International School for Desert Studies, the Jacob Blaustein Institutes for Desert Research, Ben-Gurion University of the Negev, Sede Boqer Campus, Beer Sheva 8499000, Israel
2
Jacob Blaustein Center for Scientific Cooperation, the Jacob Blaustein Institutes for Desert Research, Ben-Gurion University of the Negev, Sede Boqer Campus, Sede Boker 8499000, Israel
3
The Albert Katz Department of Dryland Biotechnologies, French Associates Institute for Agriculture and Biotechnology of Dryland, the Jacob Blaustein Institutes for Desert Research, Ben-Gurion University of the Negev, Sede Boqer Campus, Beer Sheva 8499000, Israel
4
Morris Kahn Marine Research Station, the Leon H. Charney School of Marine Sciences, University of Haifa, Haifa 3498838, Israel
5
Centre of Marine Sciences, University of Algarve, Campus de Gambelas, 8005-139 Faro, Portugal
6
Ministry of Science and Technology, Netivot 8771002, Israel
7
Katif Research Center, Sedot Negev 8771002, Israel
*
Authors to whom correspondence should be addressed.
Agriculture 2025, 15(21), 2182; https://doi.org/10.3390/agriculture15212182 (registering DOI)
Submission received: 24 August 2025 / Revised: 20 October 2025 / Accepted: 21 October 2025 / Published: 22 October 2025
(This article belongs to the Section Agricultural Product Quality and Safety)

Abstract

Halophyte bio-saline agriculture can supplement conventional farm methods in salinized soils and salty water. The current study compares the yield and nutritional value of new Sarcocornia fruticosa ecotypes (Shikmona, Megadim, Naaman, and Ruhama) to those of the current ecotype (VM). Additionally, Arthrocaulon macrostachyum, phenotypically similar to Sarcocornia, was compared to Sarcocornia ecotypes, and the effects of the harvesting regime and irrigation water salinity on yield and nutritional value were studied. At both salinity levels (50 and 150 mM NaCl), 30-day harvesting intervals over a 210-day growth period increased plant yield compared to a 21-day regime. It also tended to improve electrical conductivity (EC) and total soluble sugars (TSS), lower malondialdehyde levels (a marker of toxic stress), and enhance radical inhibition activity in most ecotypes. Compared to VM, the Sarcocornia ecotypes Ruh and Naa exhibited much higher biomass with similar radical inhibition activity but lower total protein content. Higher salinity improved fresh biomass, shoot diameter, relative water content, chlorophyll level, TSS, and EC and tended to increase anthocyanin and carotenoid levels. In contrast, lower salinity tended to increase total flavonoids, polyphenols, and radical inhibition activity. In the 30-day harvest regime, A. macrostachyum exhibited the highest and second-highest yields at high and low salinity, respectively; the highest shoot diameter, total flavonoids, and radical inhibition activity; and one of the lowest malondialdehyde levels. The current study highlights the importance of optimizing harvest frequency and the advantages of employing A. macrostachyum and the Sarcocornia ecotypes Ruhama, Naaman, and Megadim with a 30-day harvesting regime under higher-salinity conditions.

1. Introduction

Abiotic stressors, such as salinity, significantly affect the growth and development of glycophytic plants [1,2]. High salt concentrations inhibit plant cell growth, affecting morphological, physiological, and biochemical attributes [3,4]. Halophyte plants are highly adapted to saline soils [4,5] through mechanisms such as salt exclusion and water storage in succulent tissues [2,3]. Halophytes naturally thrive in environments with high NaCl concentrations, such as salt marshes and coastal regions [6,7]. Because of their tolerance, halophytes are being explored as promising alternative crops in response to the growing challenges of freshwater scarcity and soil salinization [4,6,7,8,9]. Several halophyte species, such as Sarcocornia, Salicornia, and A. macrostachyum, have been successfully cultivated at varying salinity levels, making them valuable for cultivation in saline soils [6,10,11,12,13,14,15,16]. Sarcocornia and A. macrostachyum are perennial plants that, with appropriate agrotechniques, can produce young succulent shoots throughout the year, allowing for multiple harvests without flowering and thus providing a continuous supply of marketable vegetables. Such plants can increase farmers’ profitability and serve as important food sources in coastal communities, as well as specialty vegetables in European and North American markets [4,5,6,8,11,17]. Additionally, they can be used in salads and cookery as natural salt substitutes [6,11,15]. A. macrostachyum and Sarcocornia are good sources of antioxidants, vitamins, and essential nutrients in human diets and, therefore, are beneficial for preventing disease [11].
Abiotic stress negatively impacts plant growth and yield by generating reactive oxygen species (ROS) and toxic aldehydes, which, when overproduced, can cause metabolic imbalances and cellular and tissue damage, leading to senescence [2,18,19]. Plants, including halophytes, generate antioxidants to mitigate the effects of ROS-induced oxidative stress and enhance tolerance to environmental stressors [20]. Antioxidants, including polyphenols, flavonoids, carotenoids, and anthocyanins, play crucial roles in plant defense and adaptation to stress [8,11,20,21,22,23]. Antioxidant compounds protect plants from oxidative damage and support their growth under harsh conditions [24,25].
Previous research has primarily focused on the effects of different salt levels on plant growth, biomass yields, and nutritional content, while little attention has been paid to the impact of successive harvesting intervals on yield, nutritional value, and antioxidant composition in Sarcocornia [15] and A. macrostachyum. The current study explored the effects of 21-day and 30-day successive harvesting regimes on plant growth, accumulated biomass productivity, and nutritional value in five Sarcocornia ecotypes (VM, Shikmona, Megadim, Naaman, and Ruhama) and A. macrostachyum growing under two different salinity levels (50 and 150 mM). We also compared the new ecotypes (here, “ecotypes” refers to plants and their progeny collected from distinct areas) with the currently cultivated plant ecotype, VM.

2. Materials and Methods

2.1. Plant Material and Growth Conditions

We used Sarcocornia fruiticosa VM, collected in Israel from the Ramat HaNegev district, which has been used before [15] and is currently being developed in Israel and exported to European markets. The plant material was collected from the Israeli coastal area, as described in Table 1. Based on a partial sequence of the ETS (external transcribed spacer) ribosomal DNA marker, the Sarcocornia plants were confirmed as Sarcocornia fruticosa. Similarly, Arthrocaulon macrostachyum (Moric.) Piirainen & G.Kadereit (AM), previously identified in Israel as Arthrocnemum macrostachyum [(https://www.kkl.org.il/wild-flower/plants/289.aspx?ID=289), accessed on 28 September 2025], was also confirmed (see the attached sequences and the phylogenetic tree in Supplementary Materials taken from the final report of the bilateral project, Portugal/Israel, PT-IL/0003/2019) [26,27,28,29]. Note that all ecotypes showed a shrubby, upright growth habit. Seeds were sown in plastic pots [12 × 8 × 6 cm (length × width × depth)] in autoclave-sterilized soil. Seed germination was visible after 7 days. During the initial seed germination and seedling establishment phase, tap water (0.9 ds m−1) was used. Seedlings were grown in a controlled-temperature growth room (25 to 30 °C) under long-day conditions (16:8 h light–dark), and light was supplied via 100 W fluorescent tubes, providing 200 µmol m2 s−1.
After germination and establishment, seedlings were irrigated with low-salinity water [50 mM NaCl plus 1 g NPK (20-20-20 + micronutrients, Haifa Chemical, Haifa, Israel)]. When they reached 2 cm in length, equally sized seedlings were carefully transferred to 3 L plastic pots containing 14 seedlings per ecotype. The experiment was conducted in a greenhouse under a natural day length and with a temperature range of 10 °C to 40 °C, relative humidity of 75%, and PAR ranging from 650 to 700 µmol m2 s−1. Salinity levels of 50 mM and 150 mM NaCl, including 1 g L−1 NPK nutrients [20-20-20 + micronutrients (Haifa Chemicals, Israel)], were supplemented with 4 mM NH4NO3. The nitrogen in the 20-20-20 was ammonium (1.5 mM), nitrate (2.2 mM), and urea (3.7 mM). K and P were 0.3 mM P as P2O5 and 0.4 mM K as K2O. Micronutrients were Mo 70 ppm, Cu 110 ppm, Zn 150 ppm, Mn 500 ppm, and Fe 1000 ppm.

2.2. Harvest Regime

The first harvest, carried out when plants reached 16 cm in height, was a technical cut to generate the cutting table for future harvests. Everything above 10 cm from the soil level was removed and discarded. Then, plants were successively cropped at intervals of either 21 days or 30 days over 210 days, resulting in a total of ten and seven harvests, respectively. The fresh biomass was weighed immediately after harvest and expressed on a kg per m2 basis. Immediately after harvesting fresh shoots, the shoot diameter was measured, and samples were frozen in liquid nitrogen and stored at −80 °C until analysis.

2.3. Shoot Diameter

The shoot diameter was measured in the middle section of the third segment from the top of the harvested shoot. Six shoots from each ecotype were used at a given salinity level in a harvest regime.

2.4. Chlorophyll and Total Carotenoid Content

Fresh tissue (100 mg) was extracted with 80% ethanol (m/v, 1:10) and incubated in the dark at 4 °C for 48 h until it was colorless. The samples were centrifuged at 18,400 rcf for 15 min at 4 °C and then transferred into new tubes and centrifuged again. Next, 0.2 mL samples were taken to measure absorbance at 665 nm, 649 nm, 652 nm, and 470 nm for chlorophyll a, chlorophyll b, total chlorophyll, and total carotenoids, respectively, using a spectrophotometer (EPOCH, Agilent (BioTek), Santa Clara, CA, USA). The calculations were carried out as described in [30,31].
  • Chlorophyll A = [(12.21 × A664) − (2.81 × A647)/w] × (V/1000)
  • Chlorophyll B = [(20.13 × A647) − (2.03 × A664)/w] × (V/1000)
Total chlorophyll (µg g−1 FW) = (6.1 × Chla) + (20.04 × Chlb)
Total carotenoid (µg g−1 FW) = [(1000 × Car) − (2.05 × Chla) − (114 × Chlb)]/245

2.5. Relative Water Content (Rwc) Measurement

To measure the relative water content (RWC), four fully developed shoots were collected from each ecotype and salinity treatment and cut at a length of 5 cm. Each ecotype and salinity treatment had four replicates. The FW of each shoot was recorded immediately using an analytical balance. The shoots were then placed in 15 mL tubes filled with double-distilled water (DDW), sealed, and kept at 25 °C for 24 h to allow the tissues to achieve full turgidity. Thereafter, the shoots were gently blotted with tissue paper to remove excess surface water, and their turgid weight (TW) was measured immediately. To determine the DW, the shoots were dried at 65 °C until a constant weight was achieved. Finally, the relative water content was calculated using the equation described before [8]:
%RWC = [(FW − DW)/(TW − DW)] × 100
where FW is fresh weight, DW is dry weight, and TW is turgid weight.

2.6. Total Protein Content

Total protein content was measured following the protocol in [32] with slight modifications. Briefly, 100 mg of frozen shoot tissue was ground in liquid nitrogen and then mixed with extraction buffer (m/w 1:20). The extraction buffer was prepared by mixing 0.8 g of sodium chloride, 0.02 g of potassium chloride, 0.144 g of sodium dihydrogen phosphate, and 0.0245 g of potassium dihydrogen phosphate with 80 mL of double-distilled water. The pH was adjusted to 7.4 in a total volume of 100 mL. The extract was centrifuged at 10,000 rcf for 10 min at 4 °C. Afterward, 4.5 mL of Reagent 1 (prepared from 48 mL of 2% sodium carbonate in 0.1 M sodium hydroxide plus 1 mL of 1% sodium potassium tartrate plus 1 mL of 0.5% copper sulfate) was mixed with 0.2 mL of each supernatant sample, and after 15 min incubation, 0.5 mL of freshly prepared Reagent 2 (1-part Folin– Ciocalteu + 1-part DDW) was added, and the mixture was incubated for 30 min in the dark at room temperature (25 °C). Following this, the absorbance was measured at 660 nm. The standard curve was generated using bovine albumin (0–100 μg/mL). The total protein content was determined as milligrams of bovine albumin equivalent per gram fresh weight (mg BSAE g−1 FW).

2.7. Total Soluble Solids (Tss) Content and Electroconductivity (Ec) Level

Sample extraction was performed as we described before [8], with slight modifications. Briefly, 200 mg of fresh tissue was ground in liquid nitrogen and mixed with deionized distilled water (1:10 w/v). Supernatants were collected following centrifugation at 18,400 rcf for 20 min at 4 °C. Electrical conductivity (EC) and total soluble solids (TSS) were determined by using a standard EC meter (ECTestr 11, Eutech Instruments, a Thermo Fisher Scientific manufacturing company, Paisley, UK) and a refractometer (Atago Digital Refractometer PR-1, Tokyo, Japan), respectively. TSS and EC are expressed in % and deci-Siemens per meter (dS m−1), respectively.

2.8. Anthocyanin Contents

Anthocyanin concentrations were determined as described before [8], with a slight modification. Frozen fresh materials (100 mg) were first crushed in liquid nitrogen and 5 mL of 1% HCl-acidified methanol [m/v: 1:7.5 (48.4 mL methanol plus 1.56 mL 32N HCL)] and then centrifuged at 18,400 rcf for 20 min at 4 °C. Next, 500 µL of DDW was added to 500 µL of the supernatant and 1 mL of chloroform; the mixture was thoroughly vortexed and then centrifuged for 20 min at 4 °C at 18,400 rcf. The absorbance was measured at 530 nm and 657 nm. The anthocyanin contents were calculated using the following equation:
Anthocyanin (mg/g FW) = (A530 − (0.25 × A657)) × extraction volume (mL) × 1/weight tissue (g) fresh weight

2.9. Total Polyphenol Content

Total polyphenol content was determined following the method described in [33], with a slight modification. Briefly, frozen fresh tissue (100 mg) was crushed, and 80% ice-cold methanol (m/v: 1:10) was added. The mixture was centrifuged at 22,500 rcf for 20 min at 4 °C. Then, 0.2 mL of supernatant was mixed with 0.5 mL of Folin–Ciocalteu phenol reagent and incubated at room temperature for five minutes before mixing with 2 mL of 20% sodium carbonate. The mixture was incubated in a heated bath for five minutes at 100 °C. Absorbance was measured at 650 nm. The standard curve was prepared using catechol concentrations from 0 to 1000 µg mL−1, and the total polyphenol content is reported as milligrams of catechol equivalents (CE) per gram fresh weight (mg CE g−1 FW).

2.10. Total Flavonoids

The total flavonoid content was determined using a modified method described before [34]. After using liquid nitrogen to crush 100 mg of frozen fresh materials, 80% ice-cold methanol (m/v: 1:10) was added, and the mixture was centrifuged for 20 min at 4 °C at 22,500 rcf. Then, 0.1 mL of the supernatant was mixed with 0.3 mL of 5% sodium nitrate, vortexed, and incubated for 5 min at room temperature. Subsequently, 0.3 mL of aluminum chloride (10% w/v) and 2 mL of sodium hydroxide (1 M) were added and mixed. The absorbance was recorded at 510 nm. The standard curve was prepared using quercetin at concentrations from 0 to 500 µg/mL−1. The results are expressed as quercetin equivalents per gram of fresh weight (mg QE g−1 FW).

2.11. Radical Scavenging Assay

The radical scavenging activity (the antioxidants in the shoot extract) was determined using 2,2-diphenyl-1-picrylhydrazyl (DPPH) as the free radical, as described before [35], with minor modifications. The DPPH stock solution [0.024% (w/v)] was prepared in methanol, and a working solution was made by diluting the stock solution with methanol until the absorbance reached 0.98 ± 0.02 at 517 nm. The scavenging activity of the plant shoot extract was determined by adding 2 mL of DPPH solution to 100 µL of plant extract (as extracted for total polyphenol content determination). The mixture was incubated for 30 min in the dark at room temperature. The absorbance was measured at 517 nm, and Trolox was used as a standard antioxidant at concentrations from 0 to 100 µM. The percentage of DPPH radical scavenging activity of the samples was determined using the following formula:
F r e e   r a d i c a l s c a v e n g i n g   a c t i v i t y   % =   A b s o r b a n c e 517   n m   c o n t r o l   A b s o r b a n c e 517   n m   s a m p l e A b s o r b a n c e 517   n m   c o n t r o l × 100

2.12. Malondialdehyde (MDA) Content

MDA content was estimated using the colorimetric method [36]. Samples were extracted in a 1:10 (w/v) ratio of chilled extraction buffer [1% trichloroacetic acid (TCA), 0.1 M phenylmethylsulfonyl fluoride (PMSF) in a phosphate-buffered saline solution]. Plant extracts were divided into two sets and mixed with equal amounts of 10% TCA and 0.8% thiobarbituric acid (TBA) in 10% TCA, respectively. The extraction buffer was replaced with plant extract to create a blank reaction. Tubes were heated to 99 °C for 1 h, and the absorbance of the developed color was measured at 440, 532, and 600 nm. The reaction with 10% TCA acts as an additional control to remove the effect of anthocyanin and sugar complex accumulation. MDA is expressed in nanomoles per gram fresh weight (nmol g−1 FW).
  • [(Abs532+TBA − Abs600+TBA) − (Abs532−TBA − Abs600−TBA)] = A
  • [(Abs440+TBA − Abs600+TBA) × 0.0571] = B
MDA (nmol g−1 FW) = ((A − B)/157,000) × 106

2.13. Data Analysis

Analyses were performed to determine the effects of 21- and 30-day harvesting intervals under greenhouse conditions with 50 mM and 150 mM salinity treatments on biomass production and nutritional value. Representative data (of two independent experiments) are shown. Significant differences between treatments were determined using the Tukey–Kramer HSD test at a 5% significance level (JMP8 (SAS, Cary, NC, USA)), n = 3 to 9, depending on the analysis assay type and the normal distribution.
Correlation analysis between all detected traits was conducted using TIBCO Software Inc., statistical version 14.0.0.15 [(www.tibco.com, accessed on 10 September 2025)].

3. Results

3.1. Successive Harvesting Interval and Salinity Level Affect Fresh Biomass Production

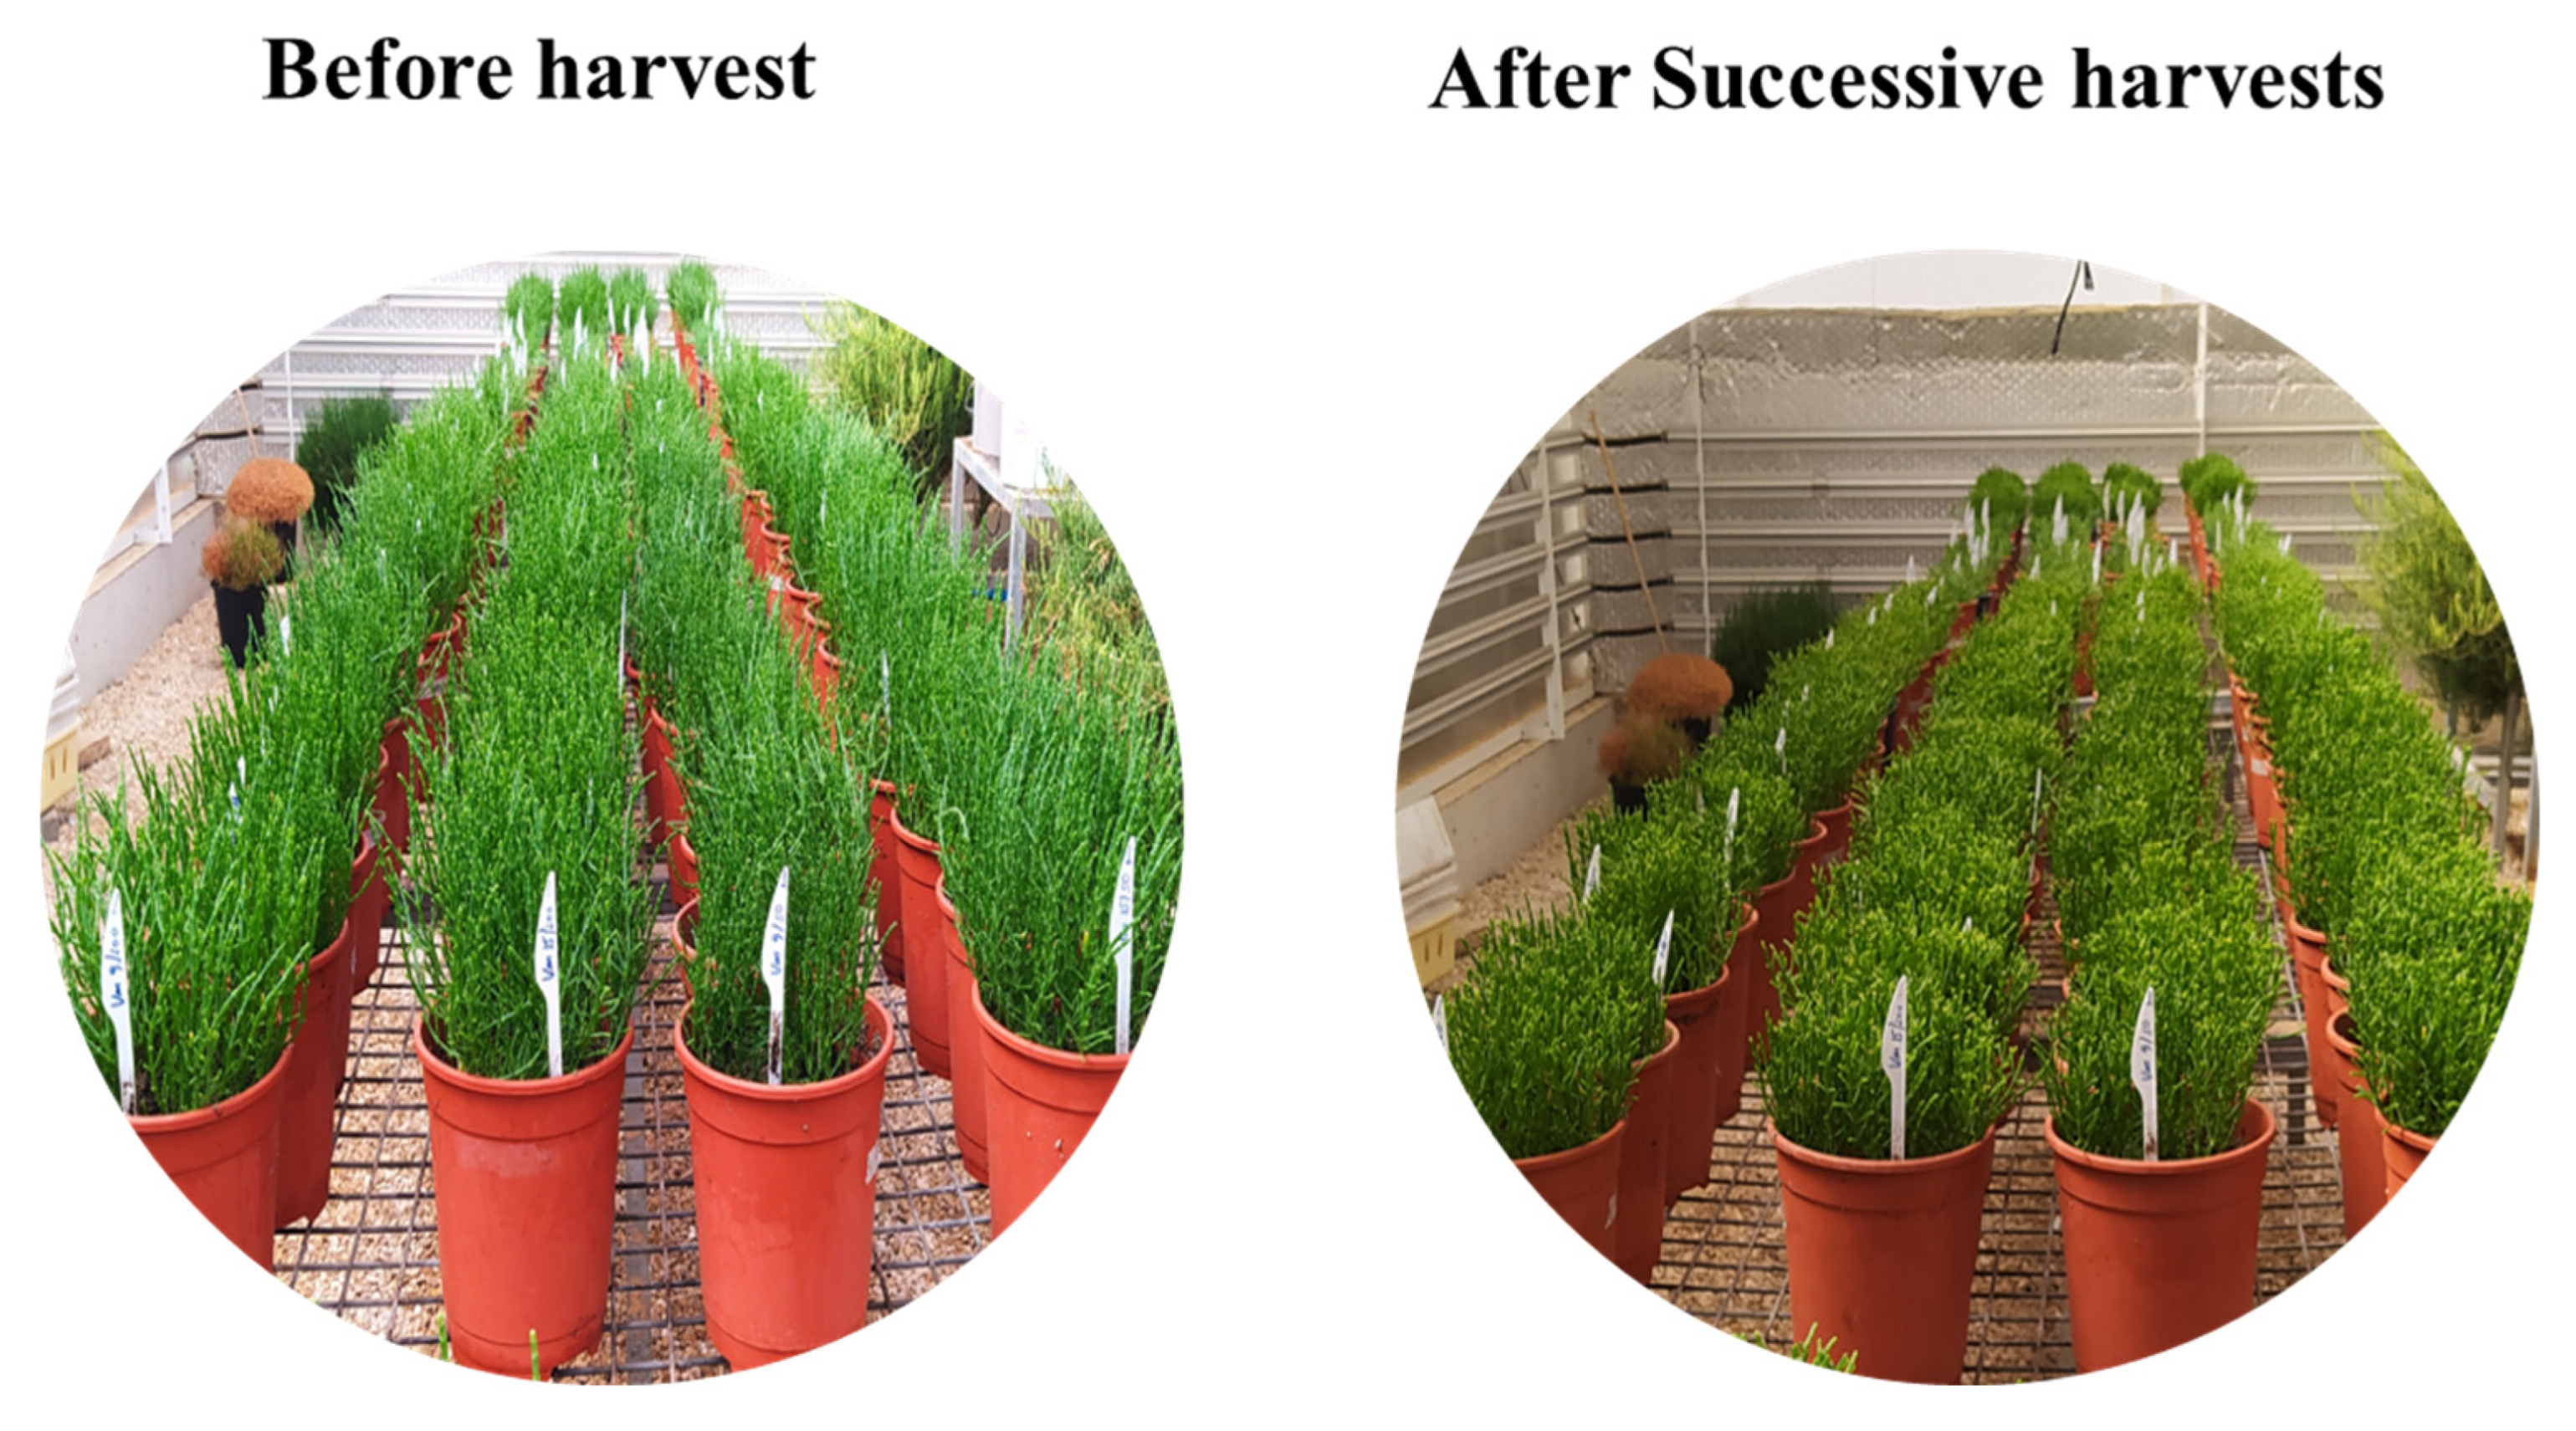
A previous study on Sarcocornia cultivated in a hydroponic system supplied with seawater revealed that a three-week harvesting regime resulted in similar biomass accumulation to that in two- and four-week harvesting regimes [15]. In a following study, the Sarcocornia fruticosa ecotypes EL (not examined in the current experiment) and VM, irrigated with 100 mM saline water and harvested every four weeks, produced remarkably high yields 20 and 30 kg/m2 fresh biomass, respectively [16]. These results indicate the utmost importance of identifying a suitable harvest regime in successively harvested halophytes exposed to various levels of saline water. Accordingly, one Arthrocaulon macrostachyum (Moric.) Piirainen & G.Kadereit (AM) and five Sarcocornia fruticosa ecotypes were subjected to 21-day and 30-day successive harvest intervals under two salinity treatments, resulting in ten and seven successive harvests, respectively (Figure 1), harvested at the final harvest (Figure 2). The 30-day harvesting regime significantly increased the fresh biomass accumulation compared with the 21-day harvesting regime in both salinity treatments (50 and 150 mM). However, there was no significant difference between 30-day harvesting intervals with lower salinity and 21-day harvesting intervals with higher salinity.
The higher-salinity (150 mM) treatment produced significantly greater yields than the lower-salinity (50 mM) treatment in both harvesting regimes across all ecotypes. AM produced the highest and second-highest yield at higher and lower salinity, respectively, in the 30-day harvesting regime. In contrast, in the 21-day harvesting regime, while AM still exhibited the second-best yield at the higher salinity, its yield with the lower salinity treatment was significantly lower than that of the Sarcocornia ecotypes.
Among the Sarcocornia ecotypes, Ruhama (Ruh) produced the highest biomass accumulation in each of the four treatments [(21 days × 2 salinity levels) + (30 days × 2 salinity levels)], significantly higher than the others, followed by Naaman (Naa) and Megadim (Meg), which also generated higher biomass than VM, the ecotype currently used by farmers.

3.2. Successive Harvest Interval and Salinity Affect Shoot Diameter

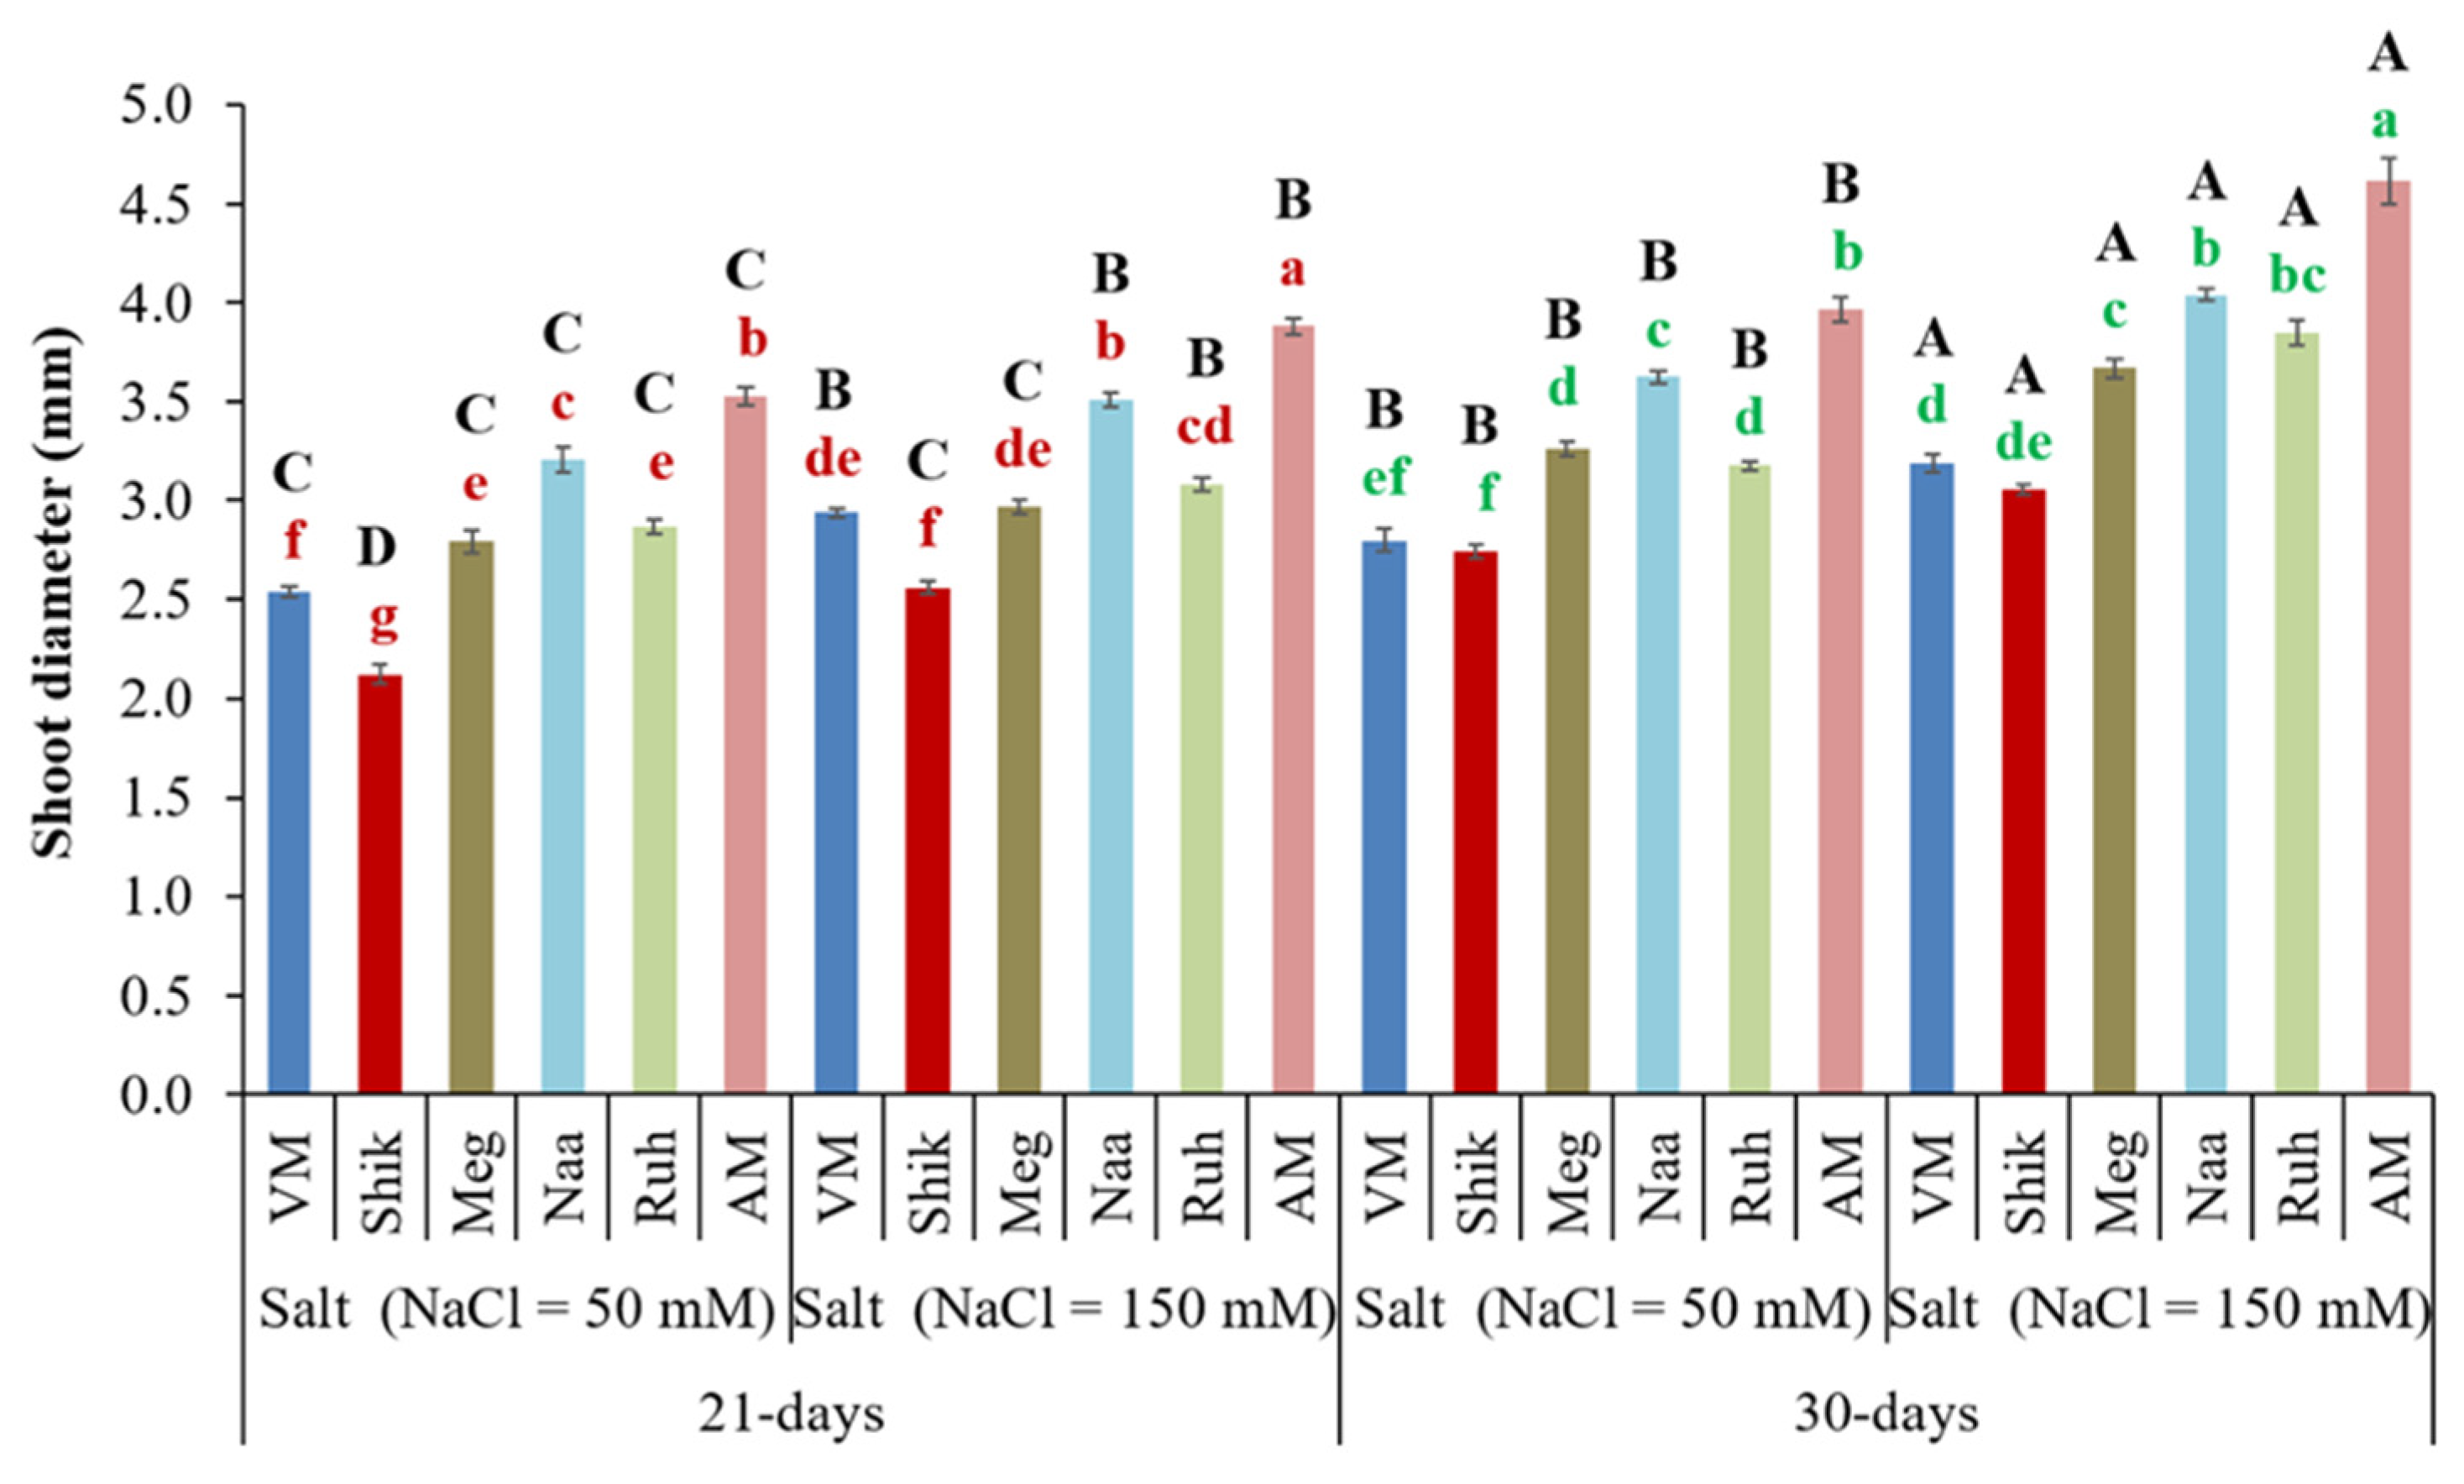
Shoot diameter is an indicator of product quality. Significantly, plants harvested every 30 days showed greater shoot diameters than those harvested in 21-day harvesting intervals in both salinity treatments (Figure 3). Notably, the higher-salinity treatment significantly increased the shoot diameter at both harvesting intervals compared with the lower-salinity treatment.
The new ecotypes Megadim (Meg), Naaman (Naa), and Ruhama (Ruh) exhibited significantly greater shoot diameters than the currently cultivated VM plants across both salinity levels and harvest regimes, except for higher salinity under 21-day harvesting, while showing values comparable to the Shikmona (Shik) ecotype. Generally, the AM ecotype had a greater shoot diameter than the Sarcocornia ecotypes under both salinity treatments and both harvesting intervals.

3.3. Total Chlorophyll and Carotenoid Contents

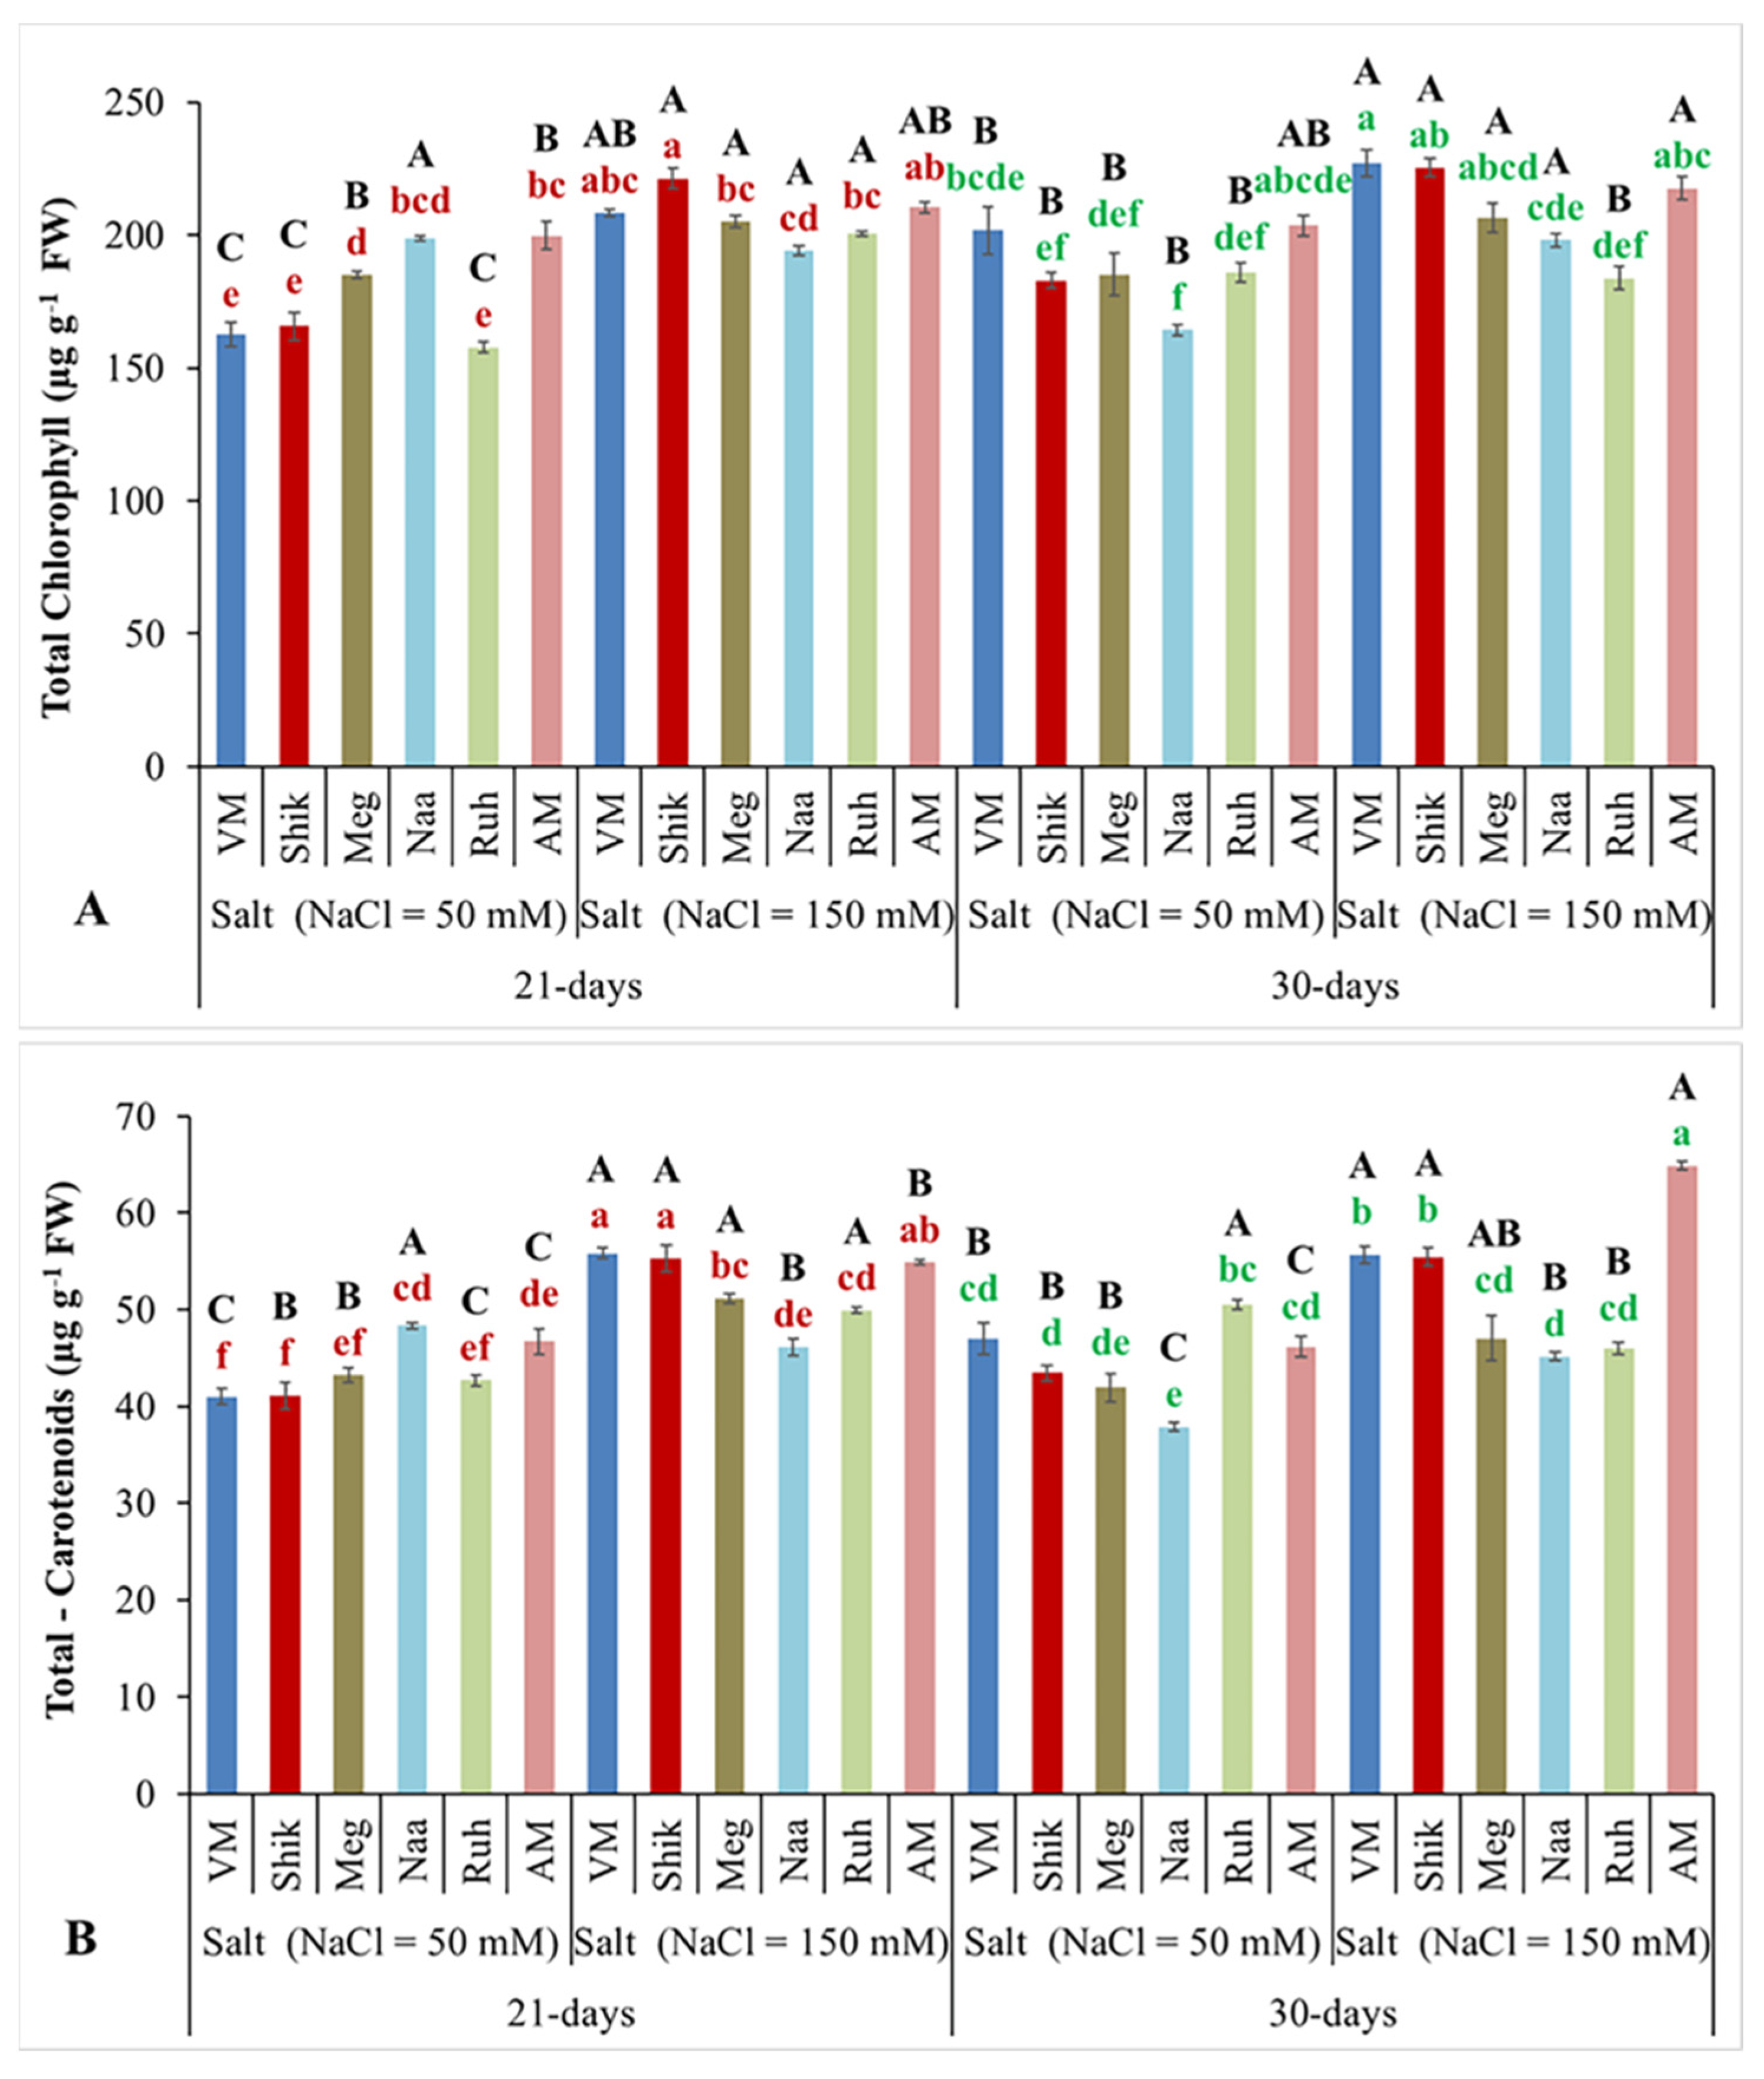
Chlorophyll and carotenoids are organic pigments with antioxidant properties, important for plant health [37] and the nutritional value of vegetables. The results obtained using different salinity levels and harvesting intervals revealed that Sarcocornia ecotypes and AM tended to increase their total chlorophyll (Figure 4A) and carotenoid contents (Figure 4B) when grown under higher salinity. Under lower salinity, VM, Shikmona (Shik), and Ruhama (Ruh) ecotypes displayed lower total chlorophyll contents in the 21-day harvesting regime, while Naaman (Naa) had lower contents with the 30-day harvesting interval. The harvesting regime significantly affected total chlorophyll and carotenoid contents. Total chlorophyll and carotenoid contents were highest at 30-day harvesting intervals, particularly for VM, Shik, and Ruh in the lower-salinity treatment.

3.4. Relative Water Content (Rwc)

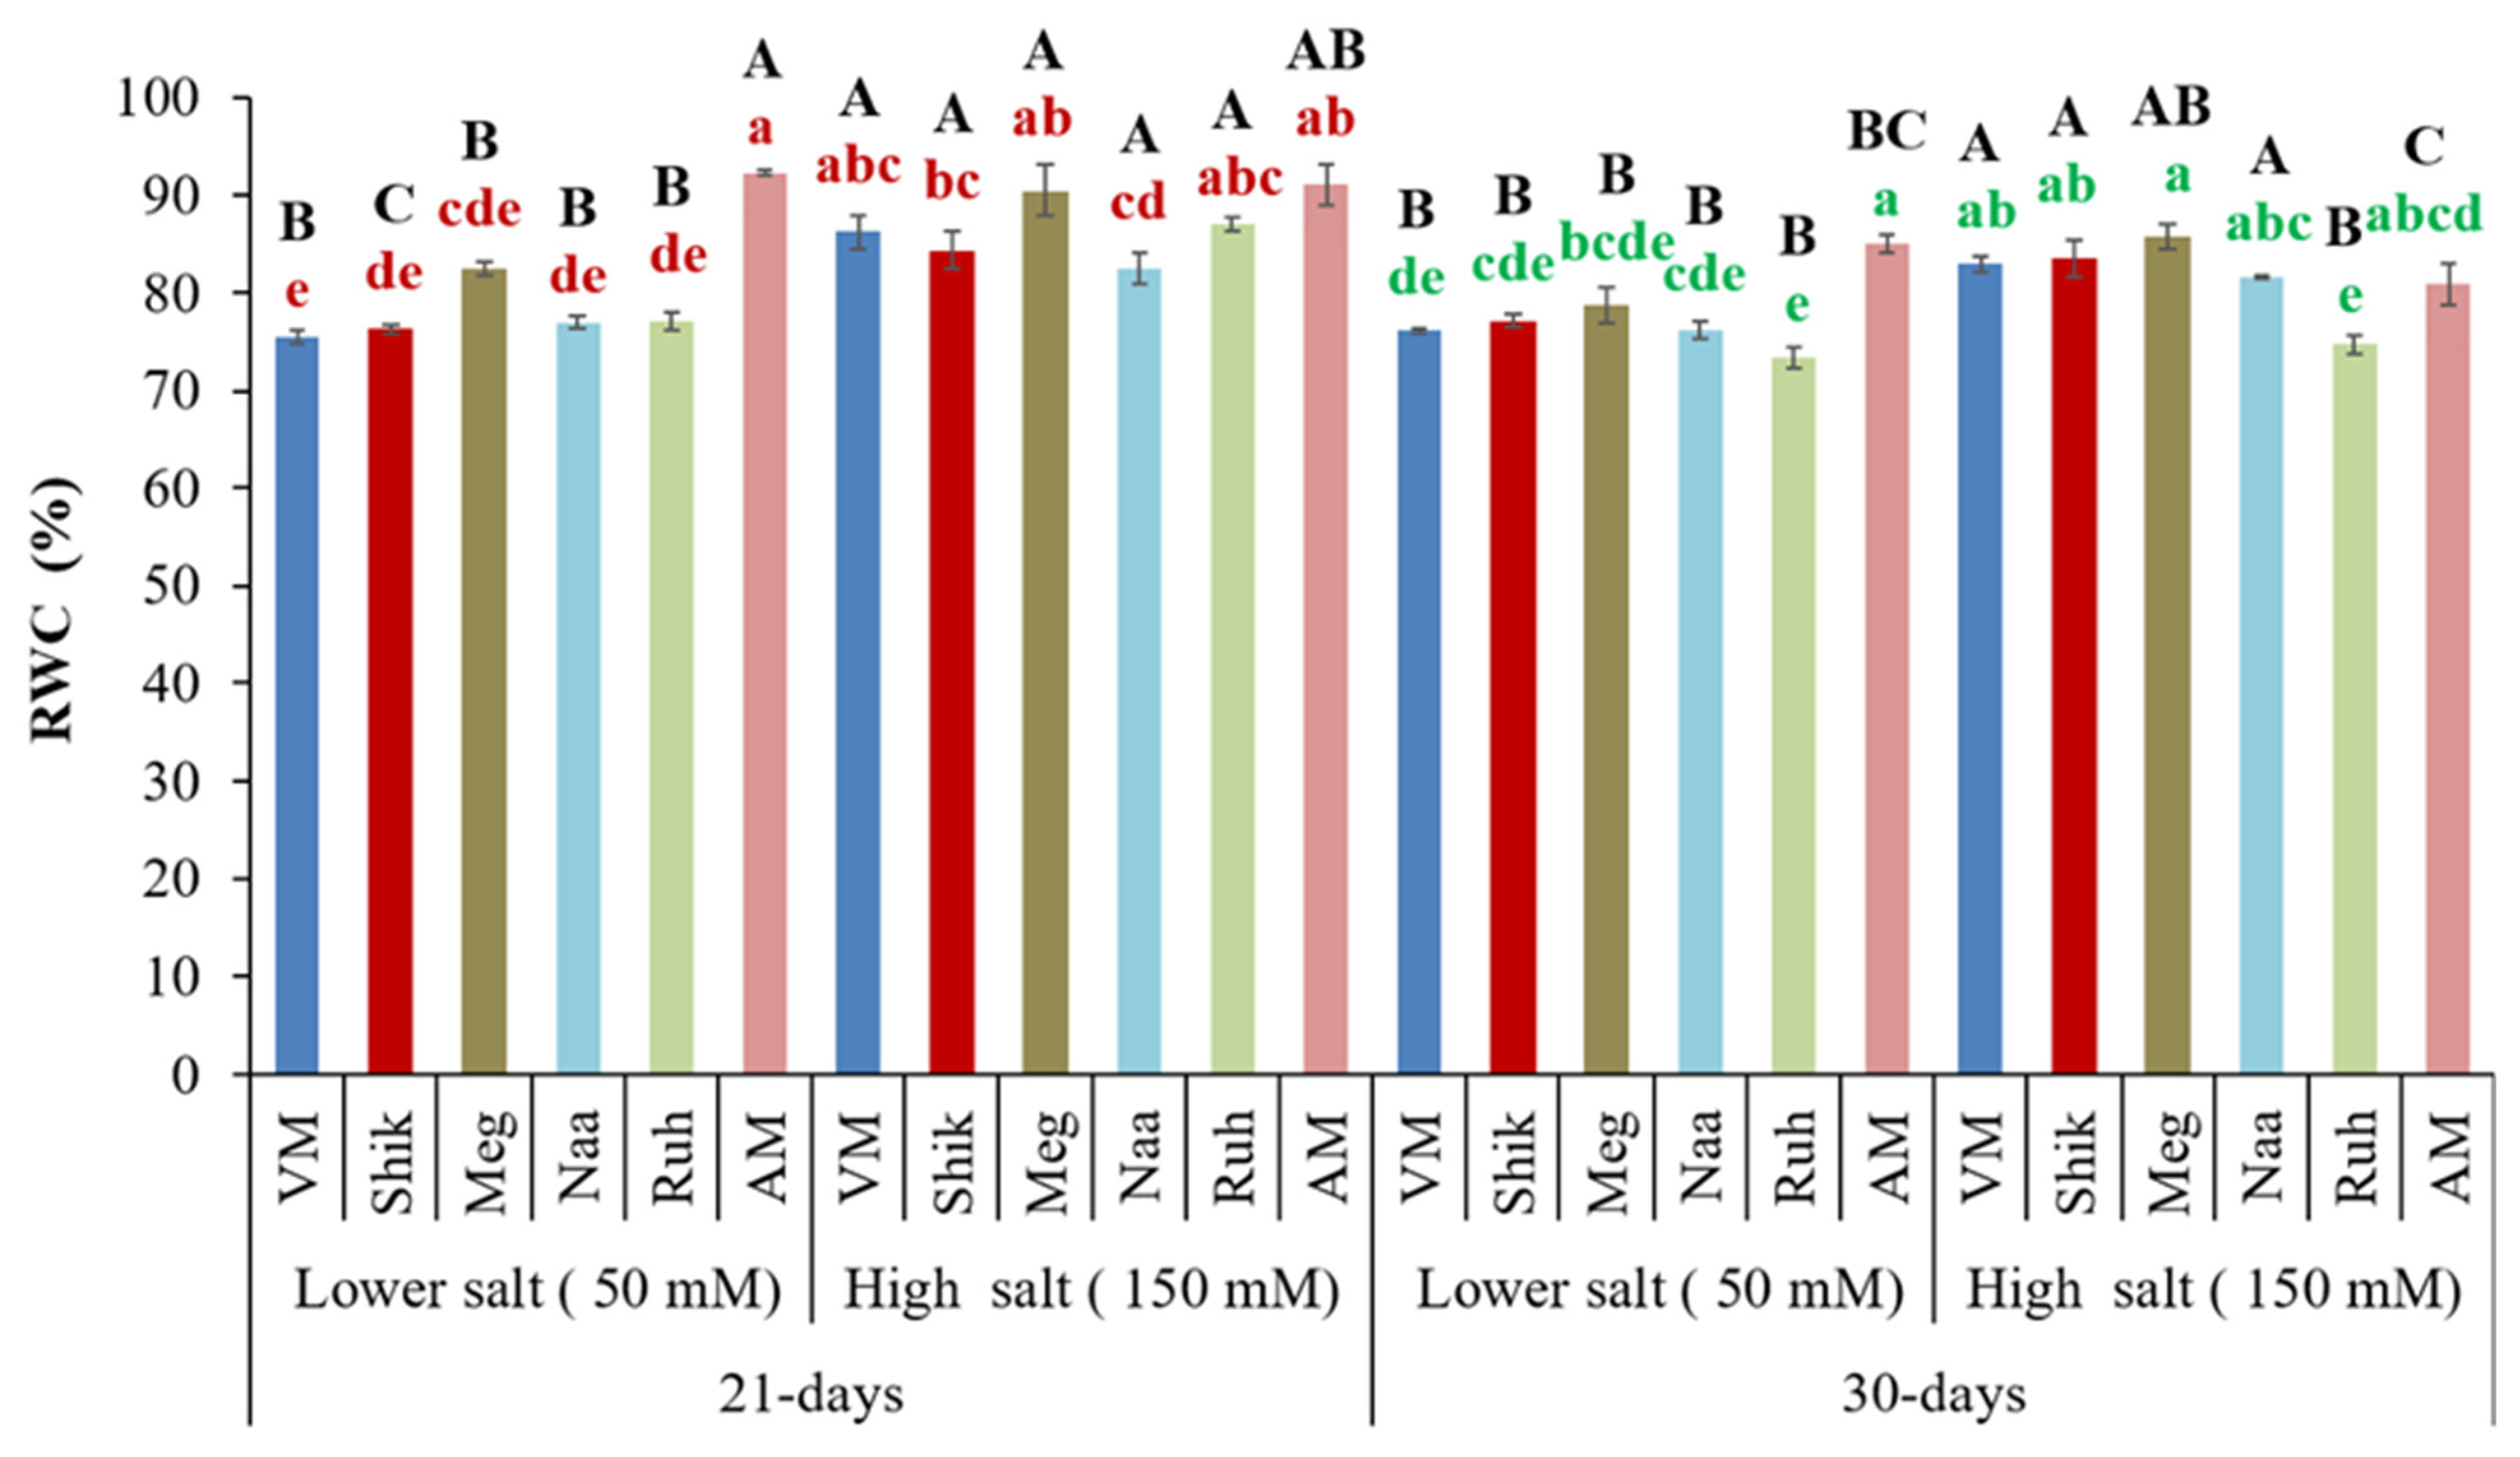
Relative water content (RWC) indicates the plant freshness and response to osmotic challenges and salinity stress. A. macrostachyum (AM) under low salinity and AM and Ruhama (Ruh) under high salinity showed significantly increased RWC in the 21-day harvesting treatment compared to 30-day harvesting intervals. However, Shik showed a significant decrease in RWC with 21-day harvesting under low salinity compared to 30-day harvesting intervals in the same treatment. At the same time, other ecotypes did not experience significant effects (Figure 4). Plants in the higher-salinity treatment exhibited significantly increased RWC compared to those in the lower-salinity treatment in both harvesting regimes, except for the AM ecotype and Naa in the 21-day regime and Naa and Ruh in the 30-day harvesting period. In the 30-day harvesting regime, the Ruh ecotype had a lower RWC than other ecotypes at higher salinity, while it was similar to other ecotypes at lower salinity (Figure 5).

3.5. Successive Harvesting Interval and Salinity Level Affect Total Protein Content

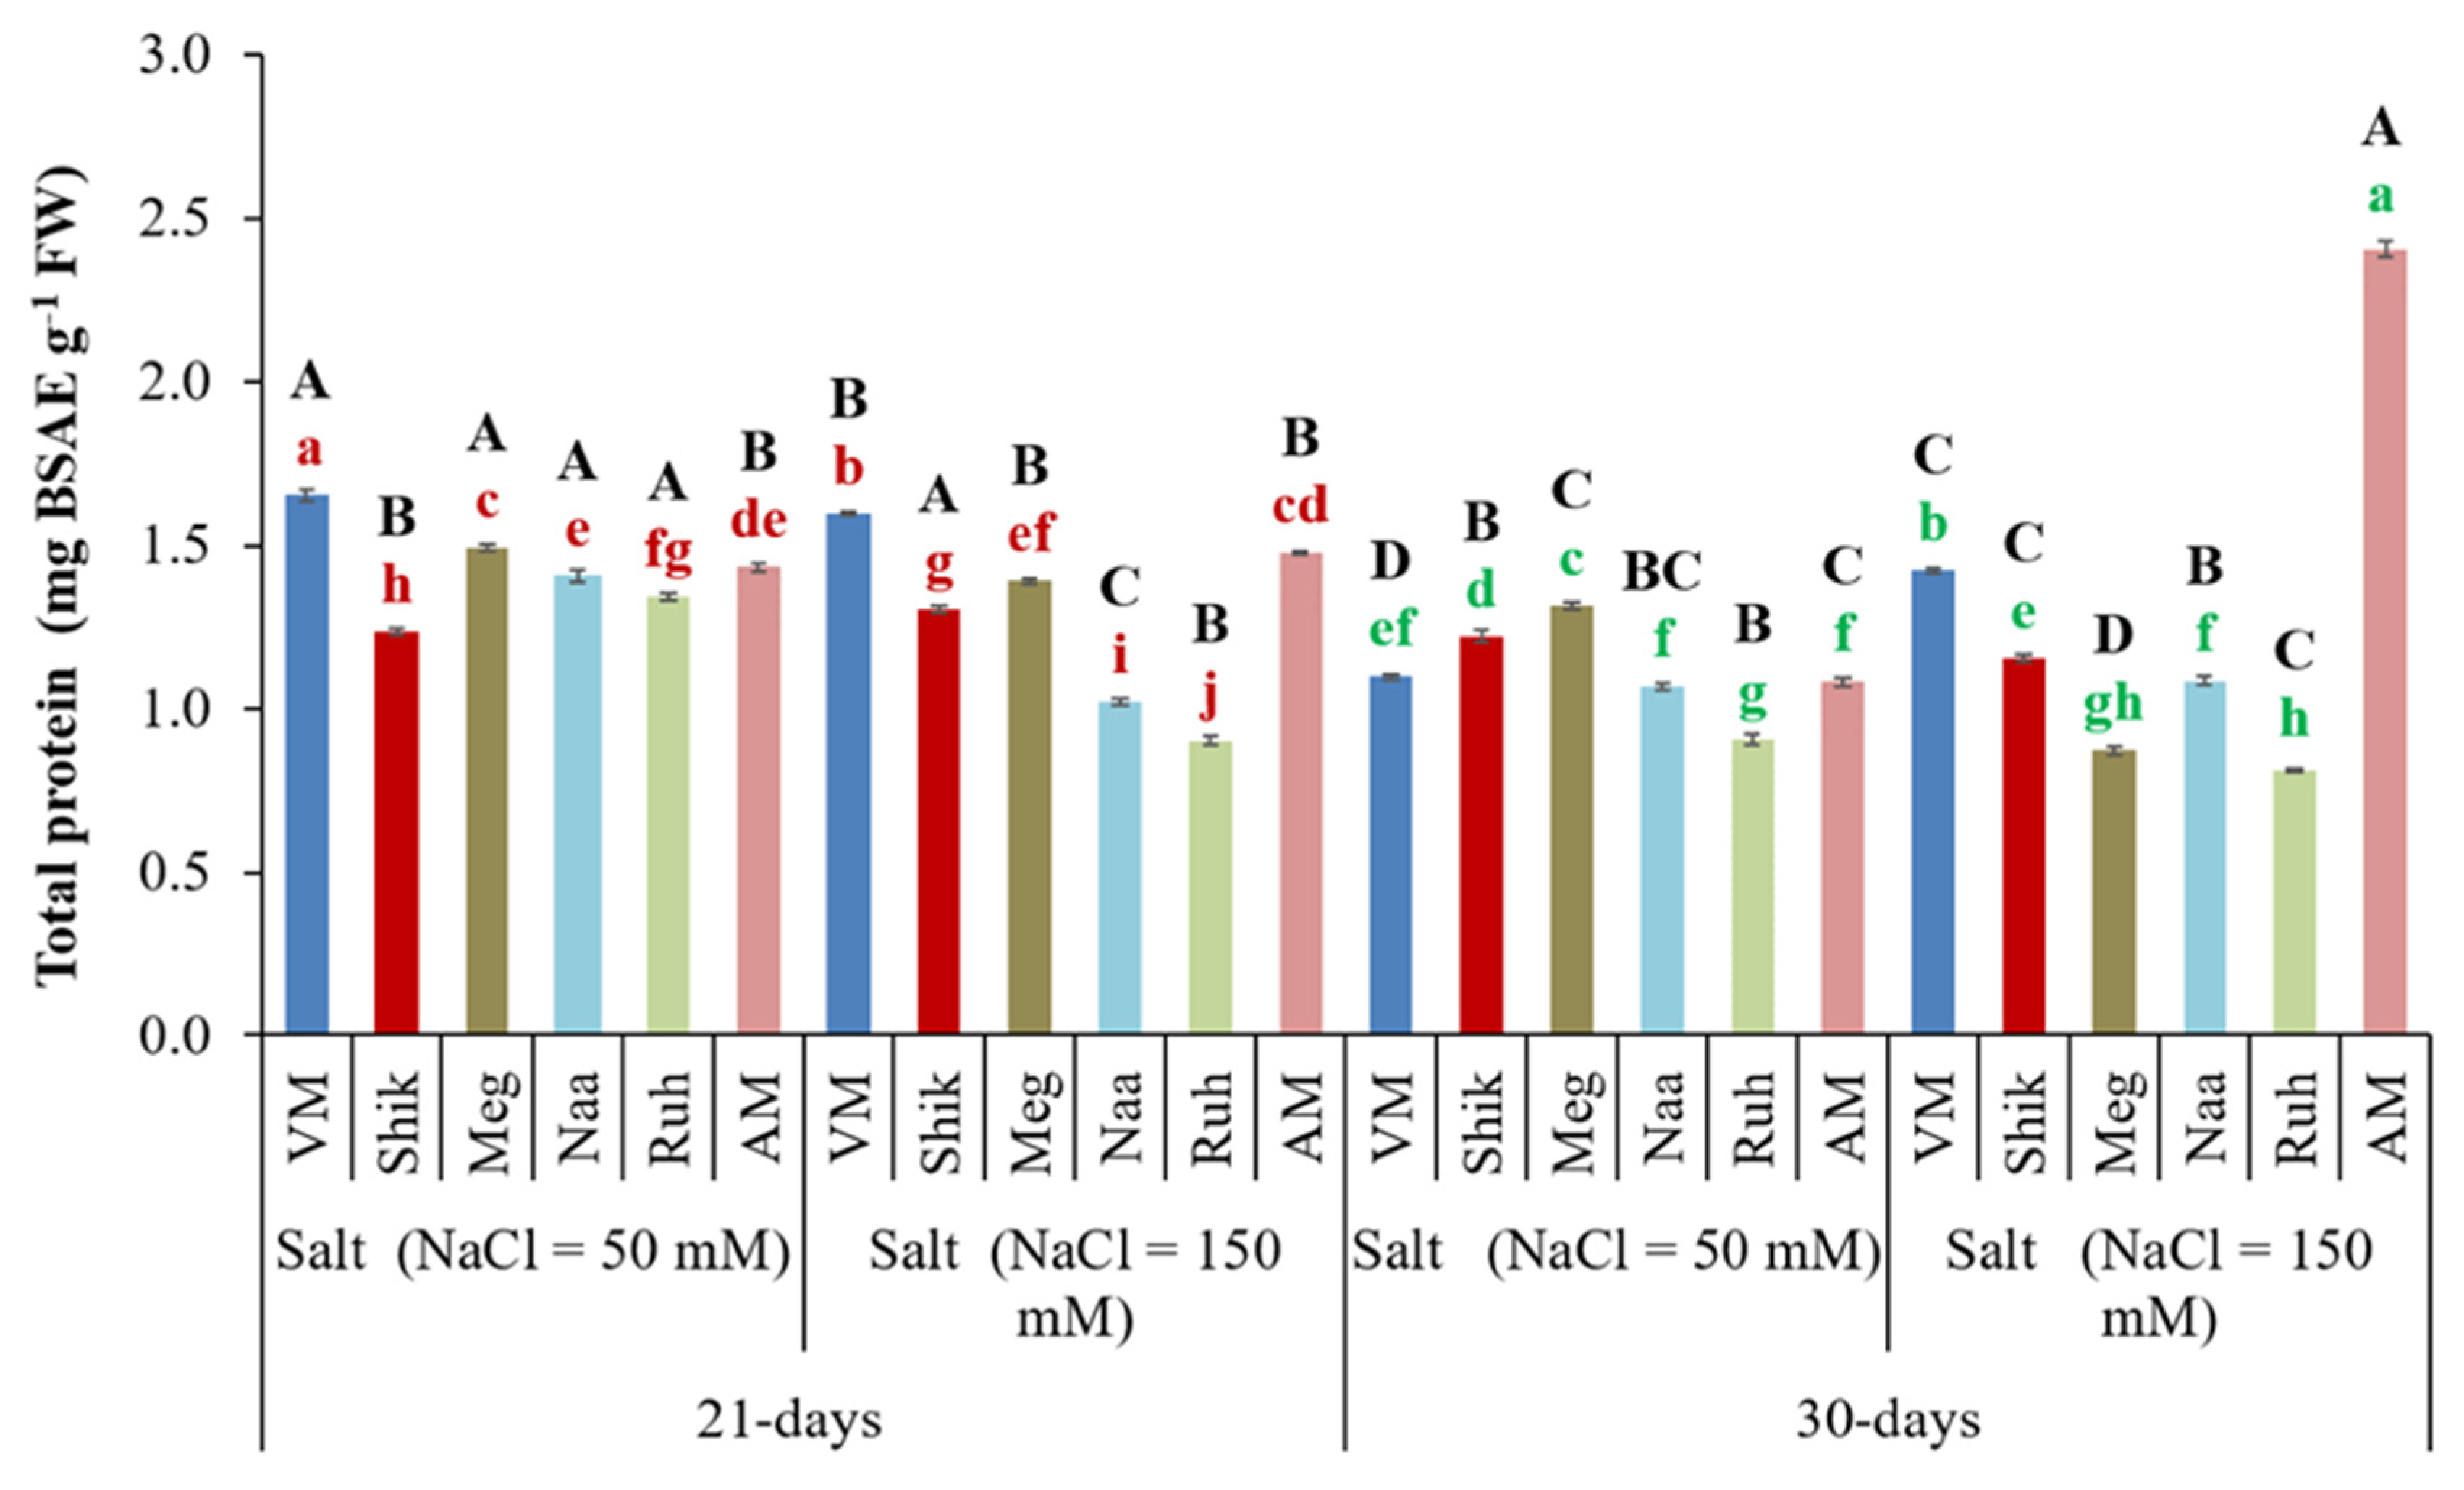
Proteins are necessary for plant growth and are markers of health and development [38]. The total protein content in AM plant tissue in the 30-day harvesting regime under high salinity significantly increased compared to that in the 21-day harvesting regime. However, in the lower-salinity treatment, AM decreased with the 30-day harvest frequency compared to 21-day harvesting at both salinity levels (Figure 6). In contrast, Sarcocornia ecotypes exhibited higher total protein content with the 21-day harvesting interval compared to the 30-day interval under both salinity treatments, except for Shik at lower salinity. However, the Naa ecotype showed a decrease in total protein content with the 21-day harvesting interval relative to the 30-day interval under higher-salinity conditions. Growth under the lower-salinity treatment significantly increased total protein content for VM, Megadim, Naaman, and Ruhama ecotypes at both harvesting intervals compared to higher-salinity treatments. In contrast, the Shikmona ecotype exhibited a higher protein level under the higher-salinity treatment with the 21-day harvesting interval (Figure 6).
The new ecotypes, Shik, Meg, Naa, and Ruh, had significantly decreased total protein content compared to the currently cultivated VM plants across salinity levels and harvest regimes, except in the 21-day harvesting interval under the lower salinity level (Figure 6).

3.6. Successive Harvesting Interval and Salinity Level Significantly Influenced Total Soluble Sugar Content and Electroconductivity

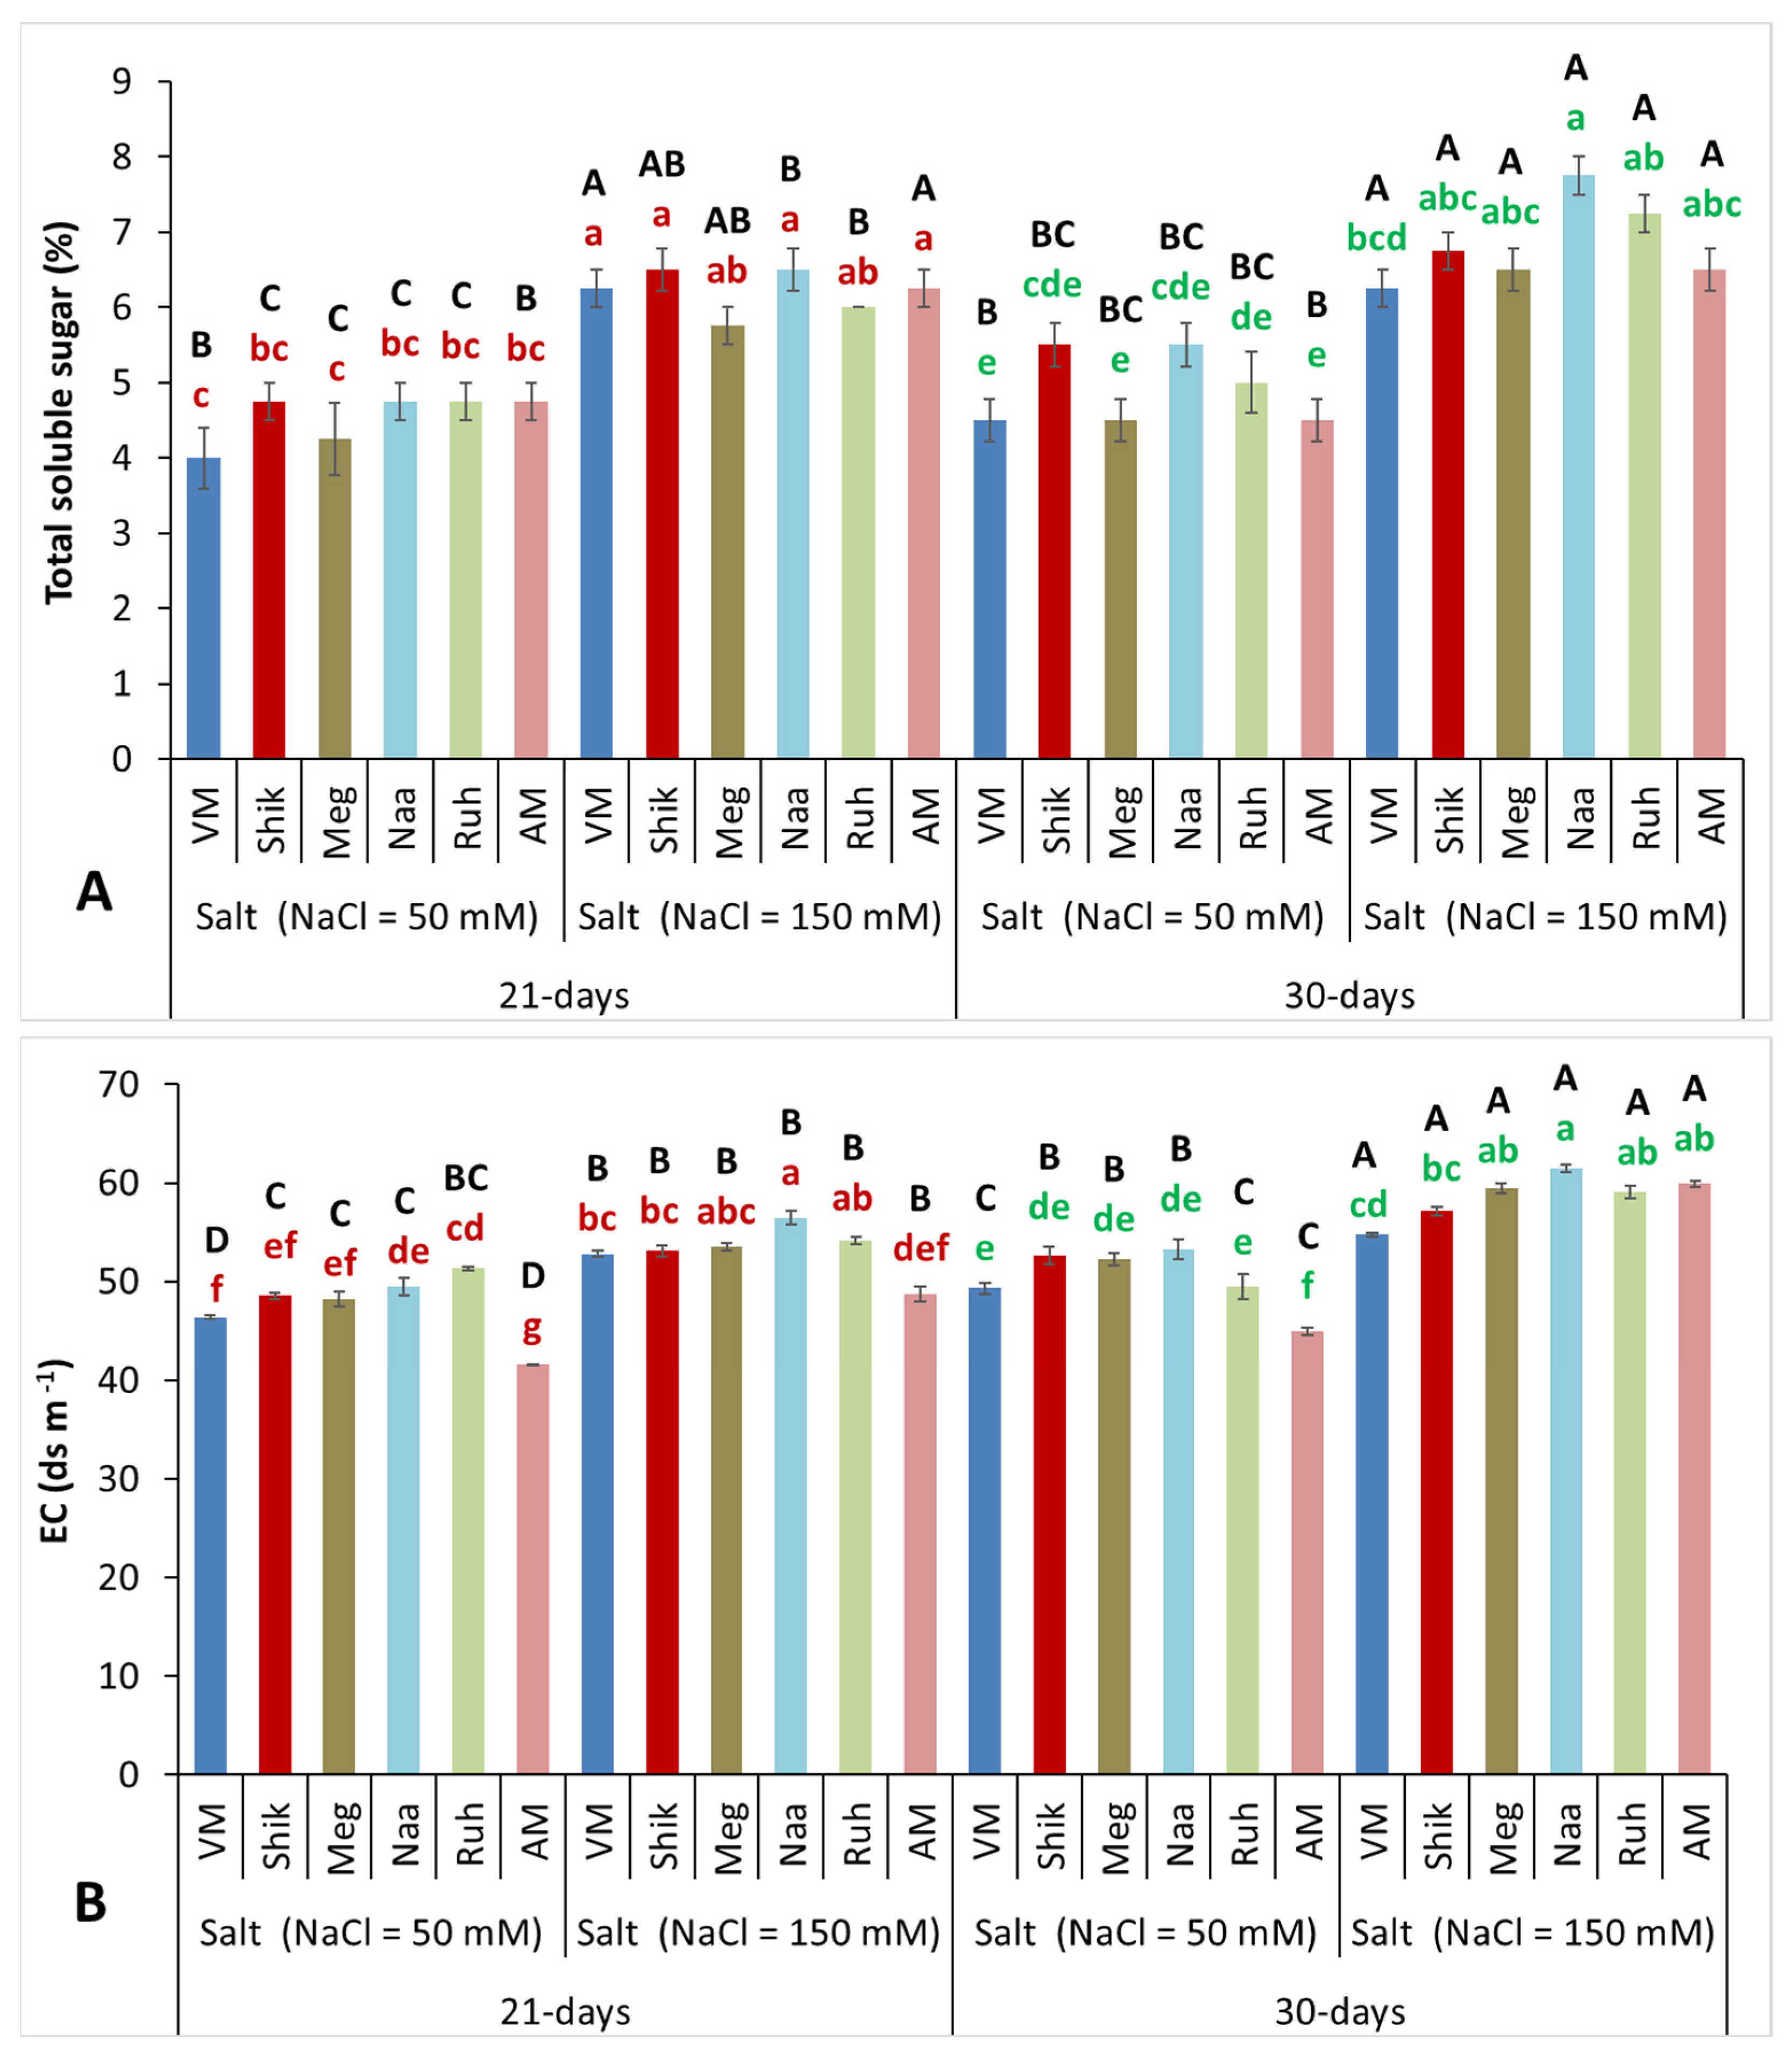
The increase in total soluble sugars (TSS) and electroconductivity in plant tissue is presumably a response to increasing salinity, acting as an osmo-protective mechanism to balance the increased salt uptake and likely serving as an osmotic adjustment mechanism to counteract excessive salinity [8]. The higher-salinity (150 mM) treatment significantly increased TSS content and EC levels compared with the lower-salinity (50 mM) treatment at both 21- and 30-day harvest intervals. The prolonged growth duration promoted greater TSS accumulation only in Ruh and Naa grown with higher salinity, yet EC levels were higher in AM and Sarcocornia ecotypes, suggesting superior osmotic adjustment capacity and better adaptation to the stress of a saline environment (Figure 7A,B).
The EC level was significantly higher under the 30-day harvest interval than the 21-day interval at both salinity levels. Among the tested Sarcocornia ecotypes, the new ecotypes Meg, Naa, and Ruh showed the most significant EC accumulation, surpassing the VM plants under both high salinity with 30-day harvesting and low salinity with 21-day harvesting.

3.7. Harvest Interval and Salinity Level Significantly Influenced Anthocyanin Accumulation

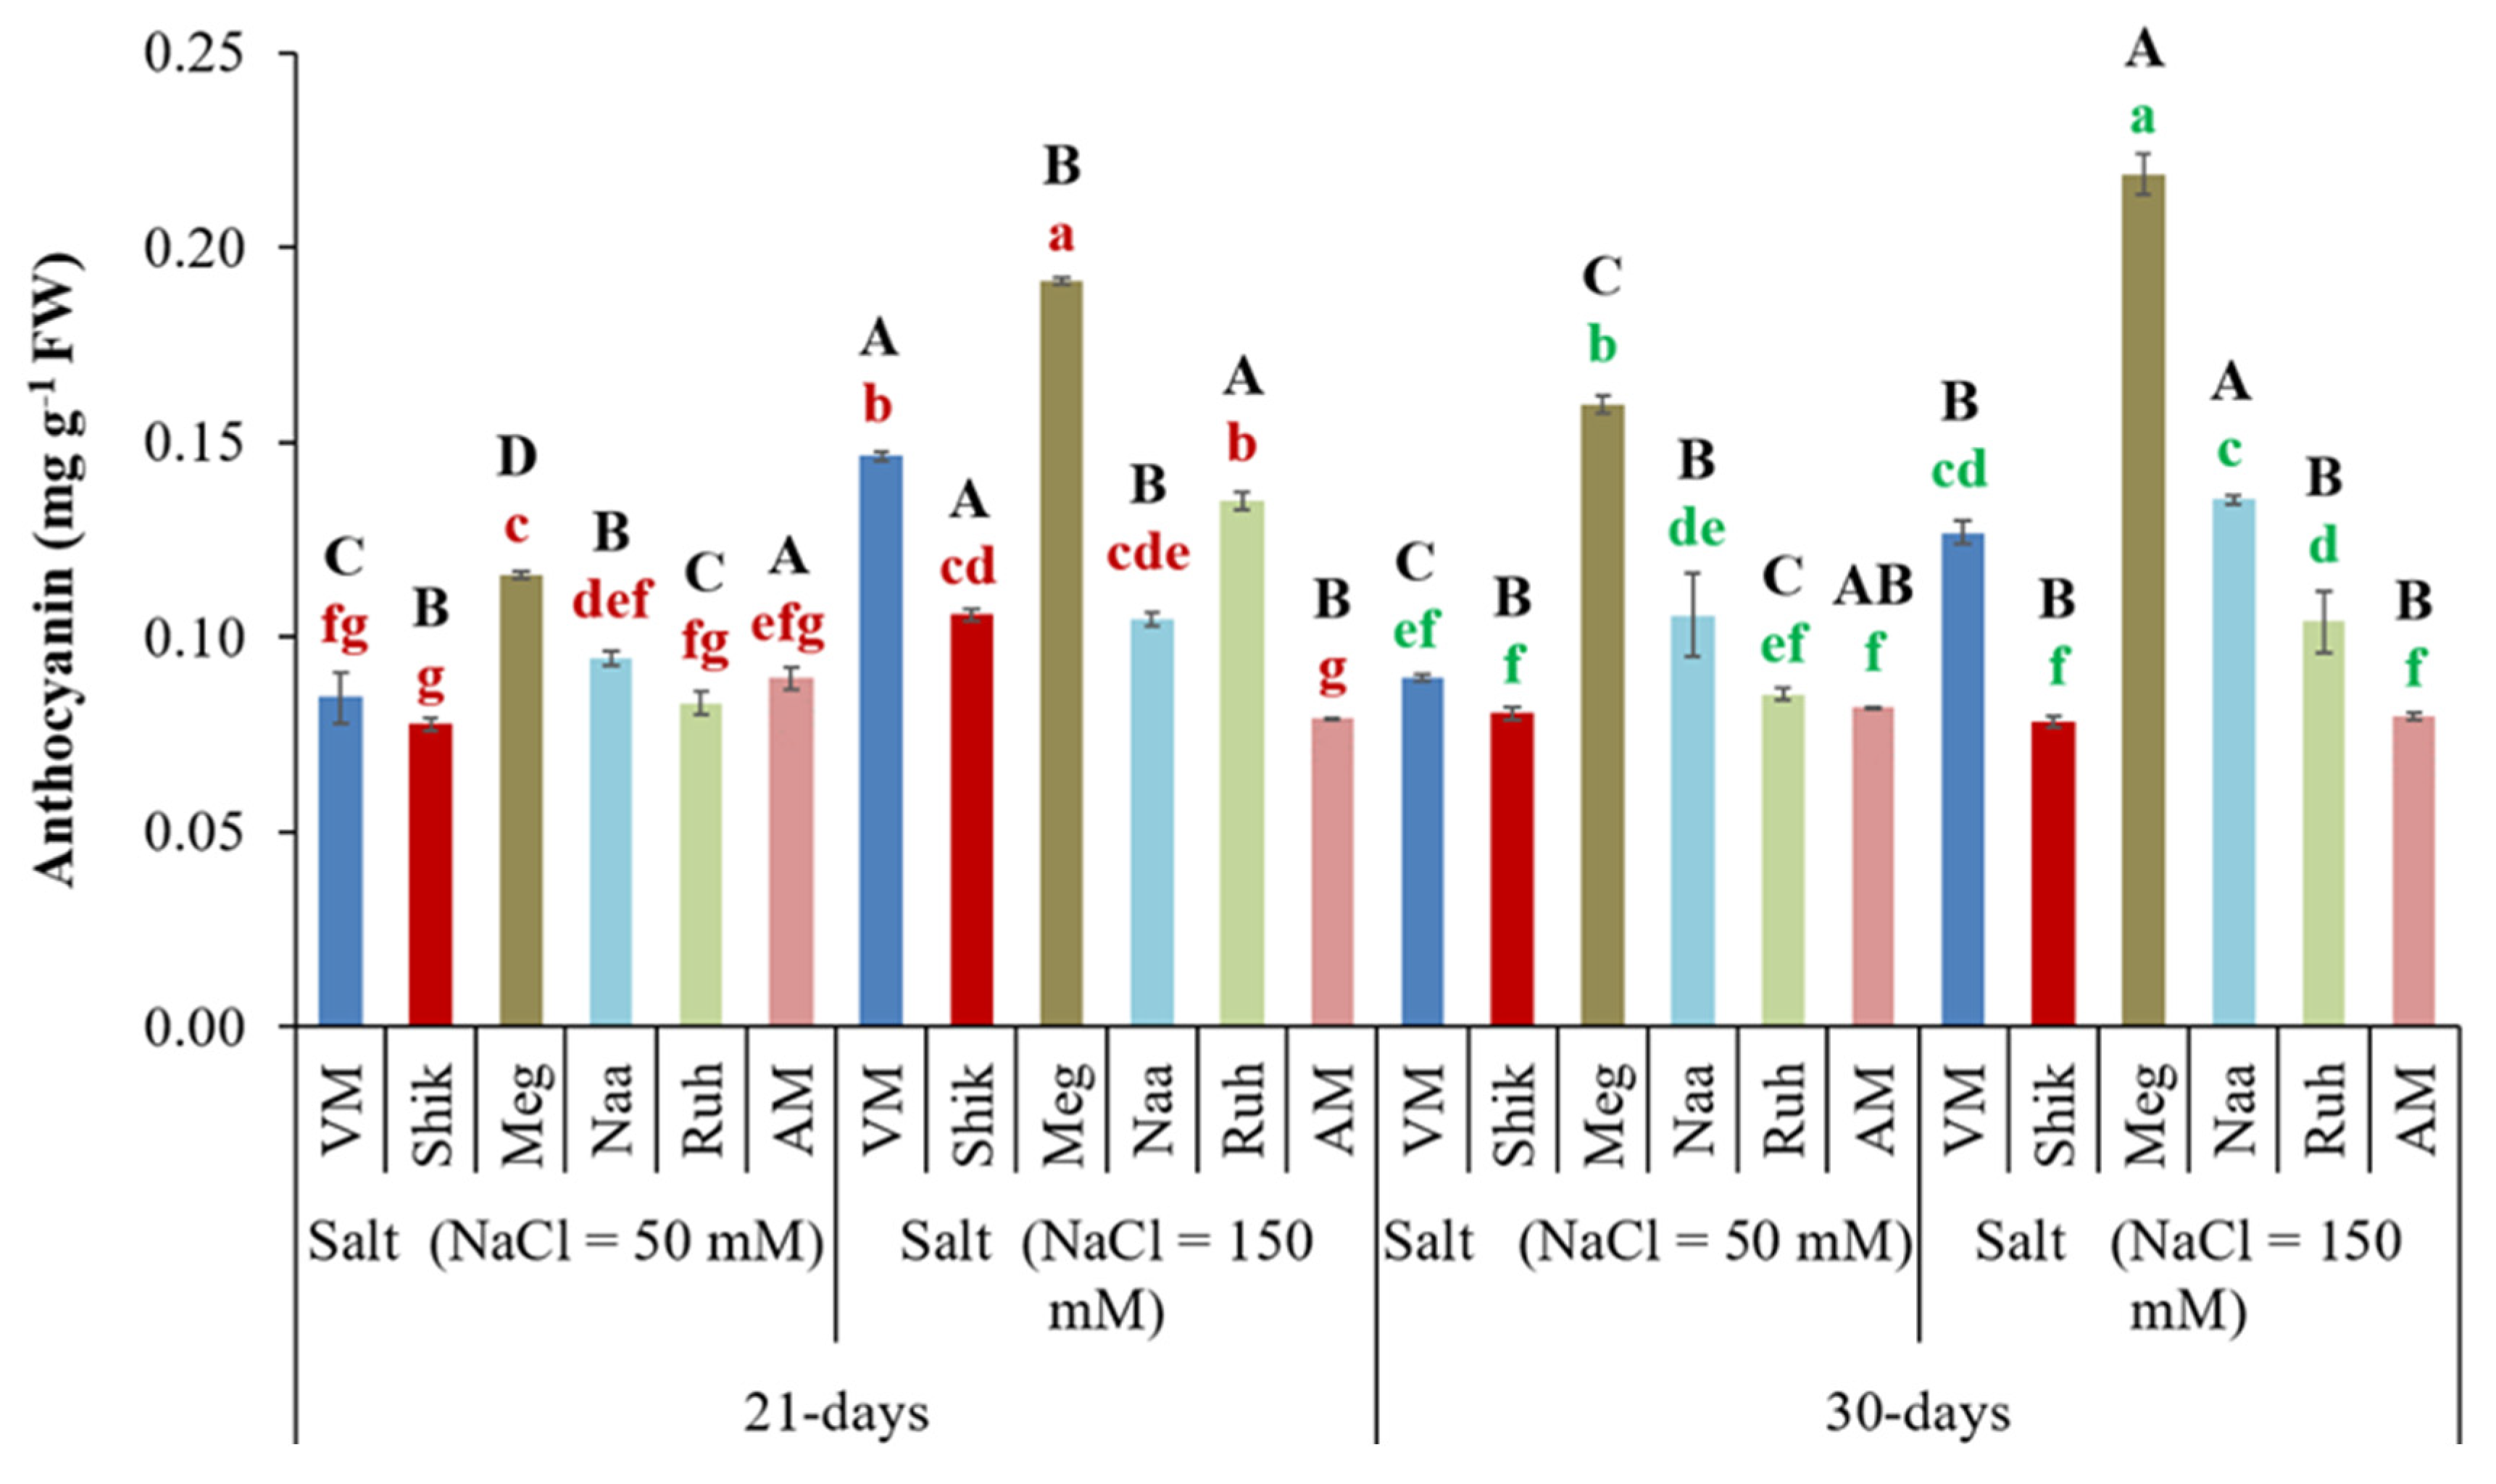
Higher anthocyanin content improves plant resistance to environmental stresses [8]. The VM, Shik, and Ruh ecotypes showed significantly greater anthocyanin accumulation in the high-salinity treatment under the 21-day harvest regime compared to the 30-day treatment. Except for the AM ecotype, higher salinity significantly increased anthocyanin accumulation compared with the lower-salinity treatment in both harvesting regimes. Meg exhibited the highest anthocyanin accumulation with the higher-salinity treatment in the 30-day and 21-day harvesting regimes, with a significantly lower level in the shorter harvest period than in the longer period (Figure 8).

3.8. Total Flavonoid Content

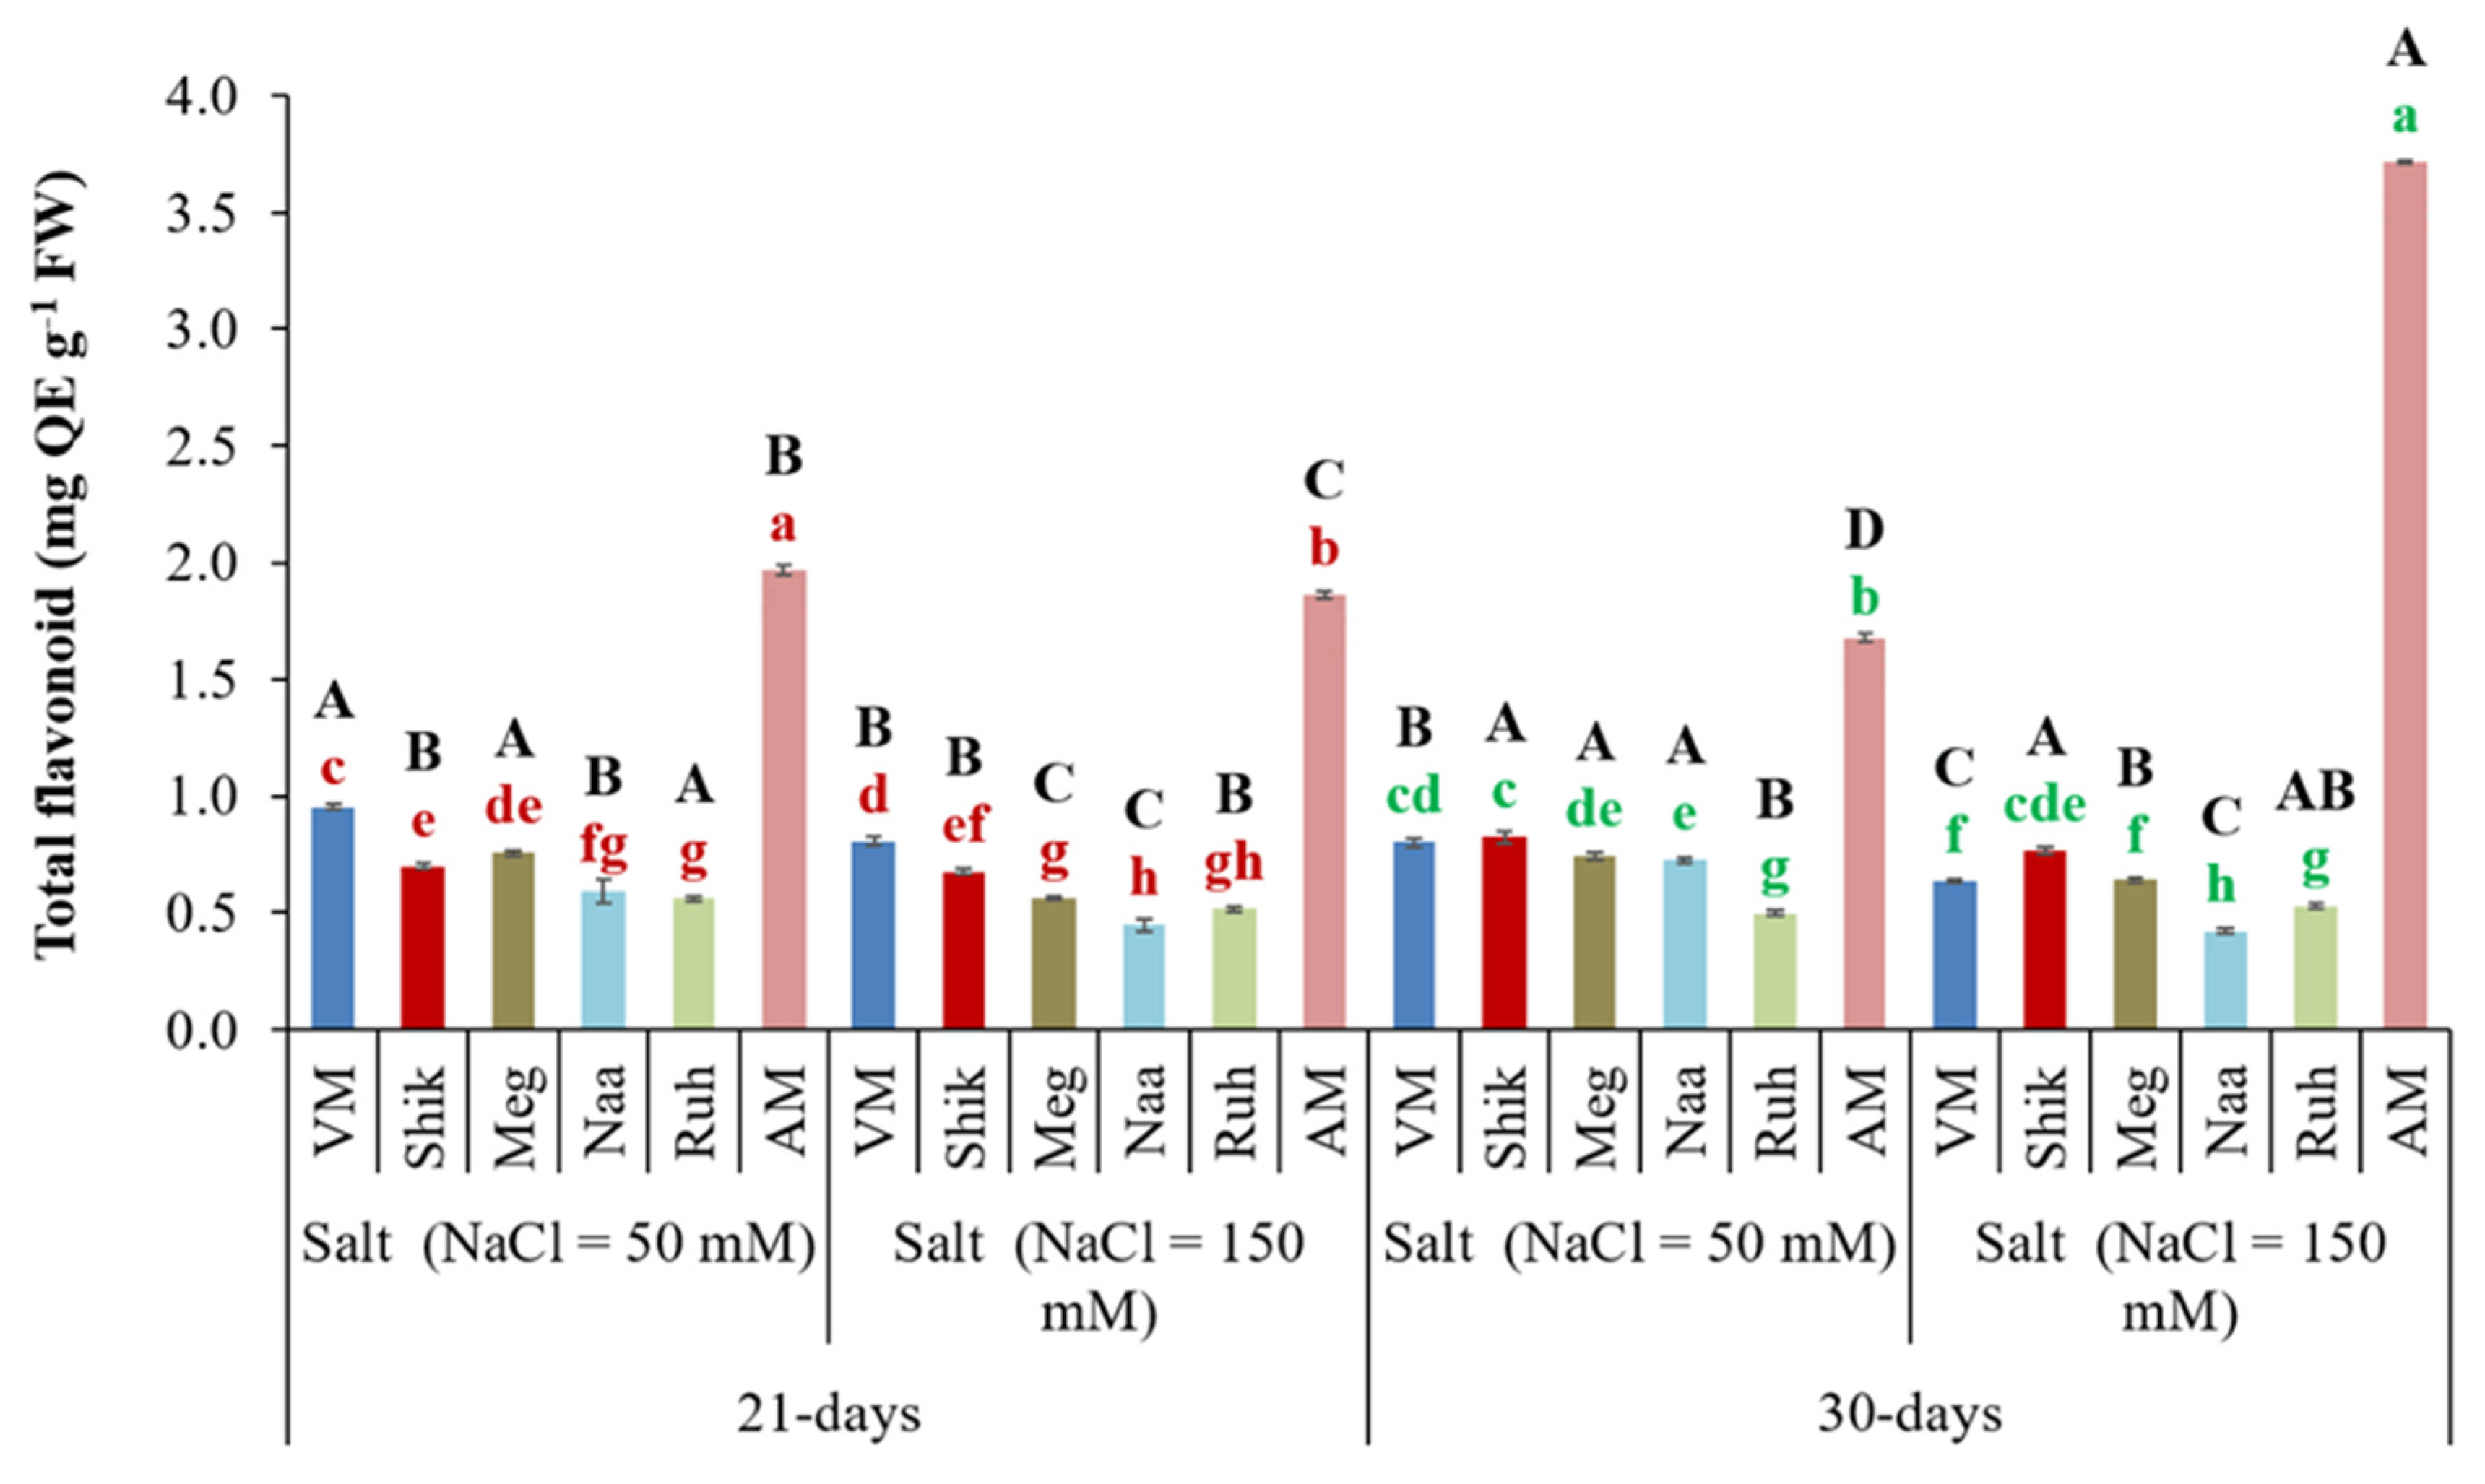
AM exhibited significantly higher total flavonoid content than the Sarcocornia ecotypes across salinity and harvesting regime treatments, with the highest in the 30-day harvest regime irrigated with high salinity. Among the Sarcocornia ecotypes, Ruhama (Ruh) and Naaman (Naa) tended to generate the lowest level in each of the four treatment combinations (two salinity levels and two harvest regimes). In Shikmona (Shik), total flavonoid content significantly increased under 30-day harvesting intervals compared with 21-day harvesting intervals (Figure 9).
Under the 21-day harvest regime, the VM ecotype exhibited higher total flavonoid content than Shik, Meg, Ruh, and Naa. At 30 days, however, its flavonoid levels were comparable to those of Shik and Meg (Figure 9).

3.9. Successive Harvesting Interval and Salinity Affect Polyphenol Accumulations

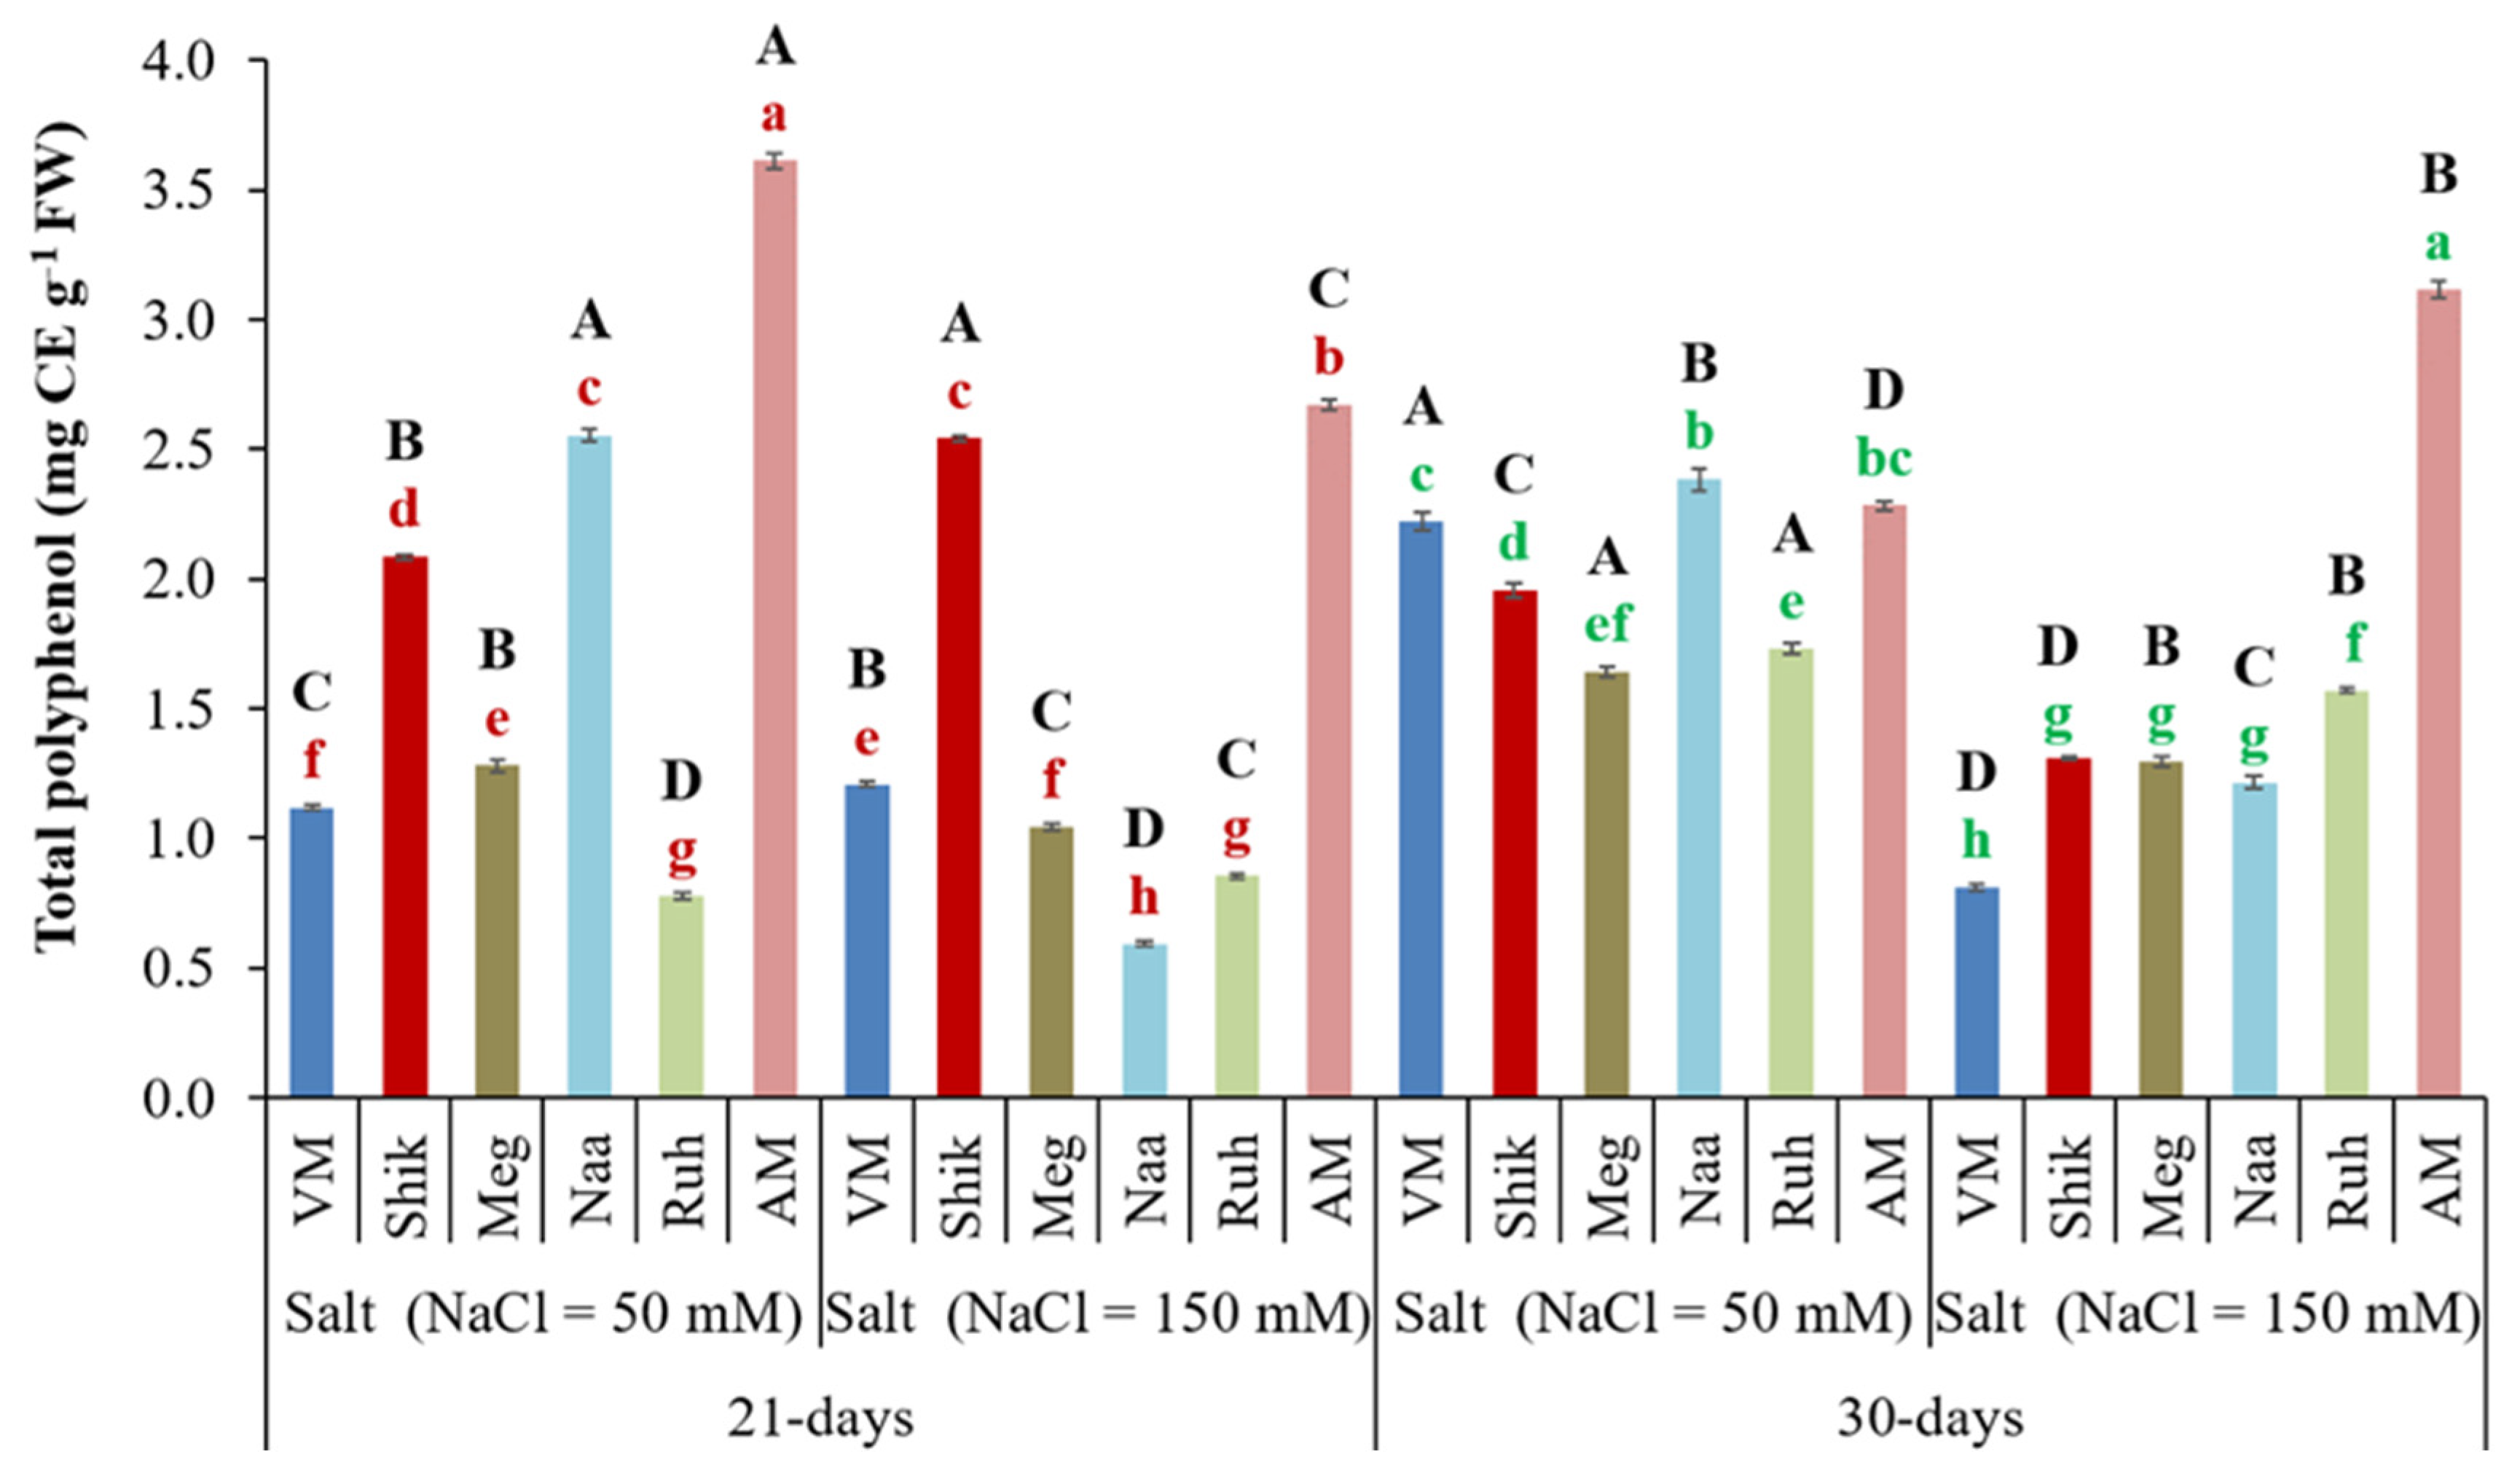
Flavonoids play an important role in plant stress tolerance and are highly relevant to human health due to their anti-inflammatory and antimicrobial properties [39]. Analysis of total polyphenol content in shoots revealed that VM, Megadim (Meg), and Ruhama (Ruh) ecotypes grown under low salinity had significantly higher total polyphenol content under the 30-day harvesting regime compared to the 21-day regime. In contrast, Naaman (Naa) and Shikmona (Shik) ecotypes exhibited higher total polyphenol content under low salinity at 21-day harvesting intervals (Figure 10). Significantly, in the 30-day harvest regime, Sarcocornia ecotypes accumulated higher total polyphenol content at low salinity than under higher-salinity conditions. The AM ecotype exhibited higher total polyphenol content than the Sarcocornia ecotypes across salinity and harvesting regime treatments, except for the 30-day harvest regime under low salinity, in which it showed similar levels to Naa and VM (Figure 10).

3.10. Successive Harvesting Interval and Salinity Affect 2,2-Diphenyl-1-Picrylhydrazyl (DPPH) Radical Scavenging Activity

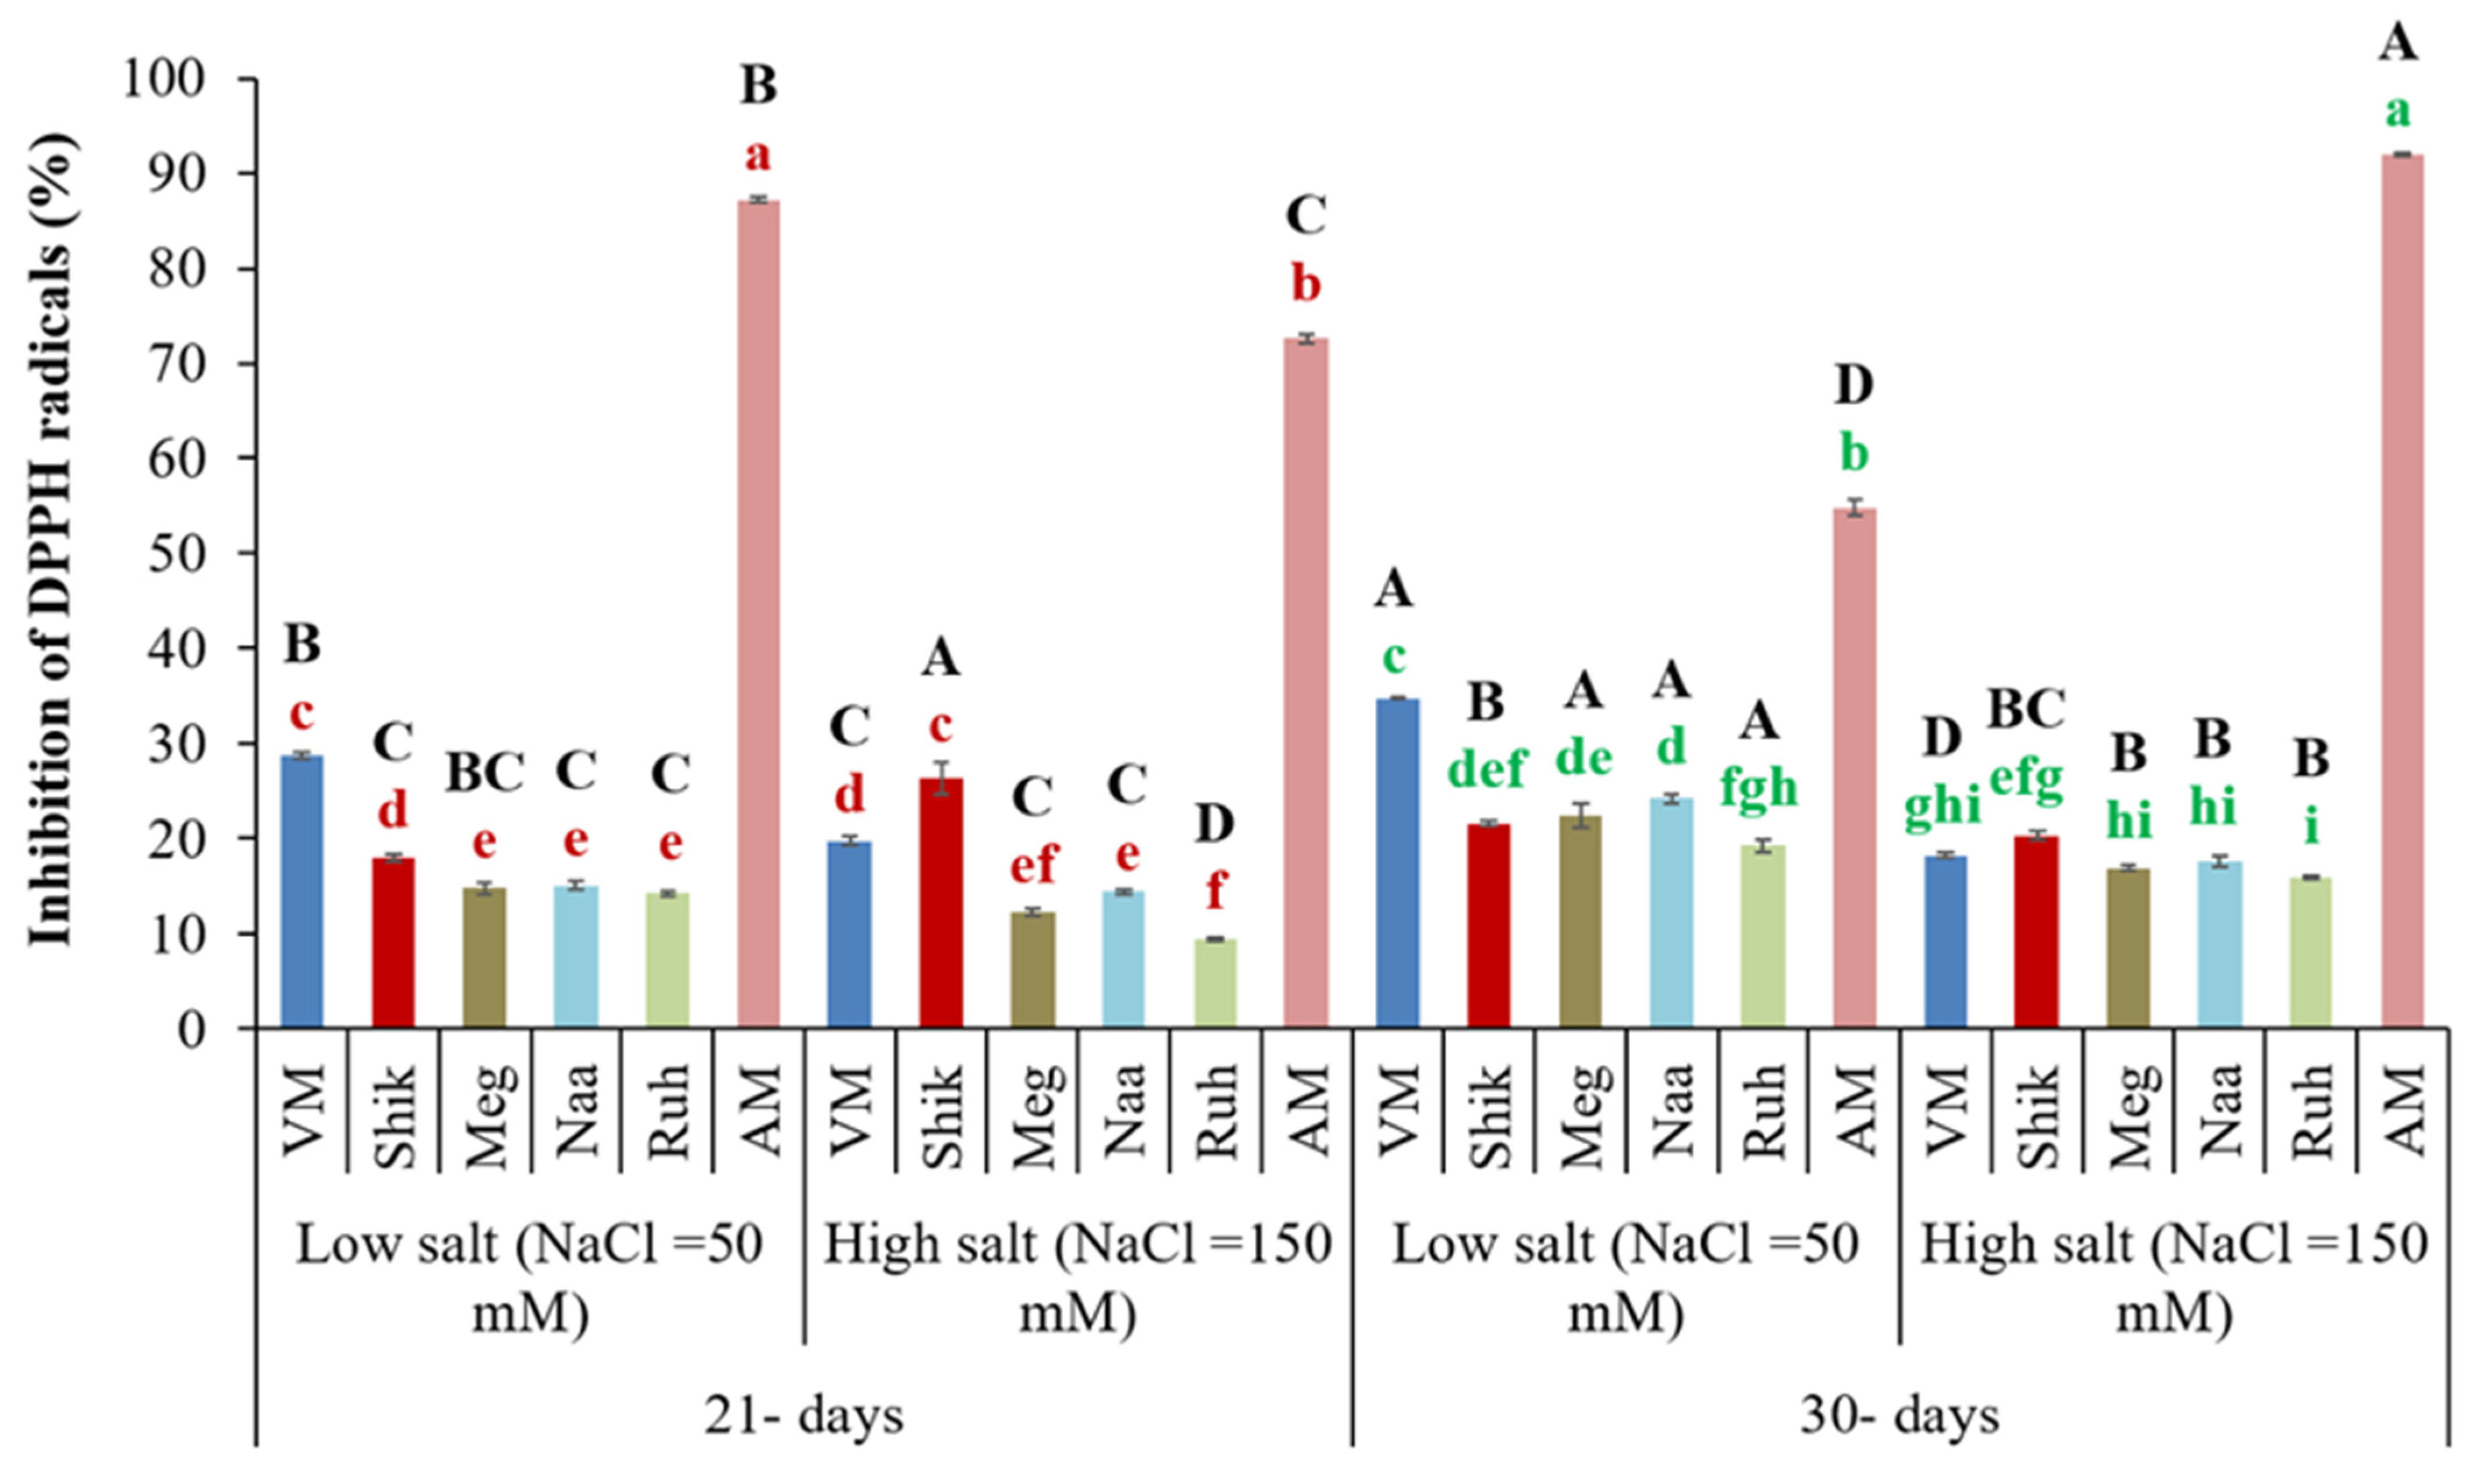
The scavenging of the radical 2,2-diphenyl-1-picrylhydrazyl (DPPH) is a commonly used antioxidant assay to estimate antioxidant capacity to neutralize ROS-induced damage [31]. Under the 30-day harvesting regime, Sarcocornia ecotype plants showed significantly enhanced radical scavenging activity compared to the 21-day harvesting regime in both salinity treatments, except for Shikmona (Shik) and VM, which showed enhanced radical inhibition at high salinity under the 21-day harvest regime (Figure 11). The low-salinity treatment notably increased the free radical scavenging activity in Sarcocornia (VM, Megadim, Naaman, and Ruhuma) ecotypes, except for the Shik ecotype, in both harvest regime intervals. In contrast, AM’s scavenging activity significantly increased at higher salinity with 30-day harvesting intervals and, to a lesser extent, at lower salinity with the 21-day harvesting interval. Significantly, the AM ecotype exhibited higher scavenging activity than the Sarcocornia ecotypes across harvesting regimes and salinity treatments (Figure 11).
At lower salinity, the new Sarcocornia ecotypes showed significantly lower radical scavenging activity than the currently cultivated VM plants across both harvest intervals. In contrast, the Shik ecotype exhibited increased activity under high salinity at the 21-day harvest interval (Figure 11).

3.11. Successive Harvesting Interval and Salinity Affect Malondialdehyde (MDA) Content

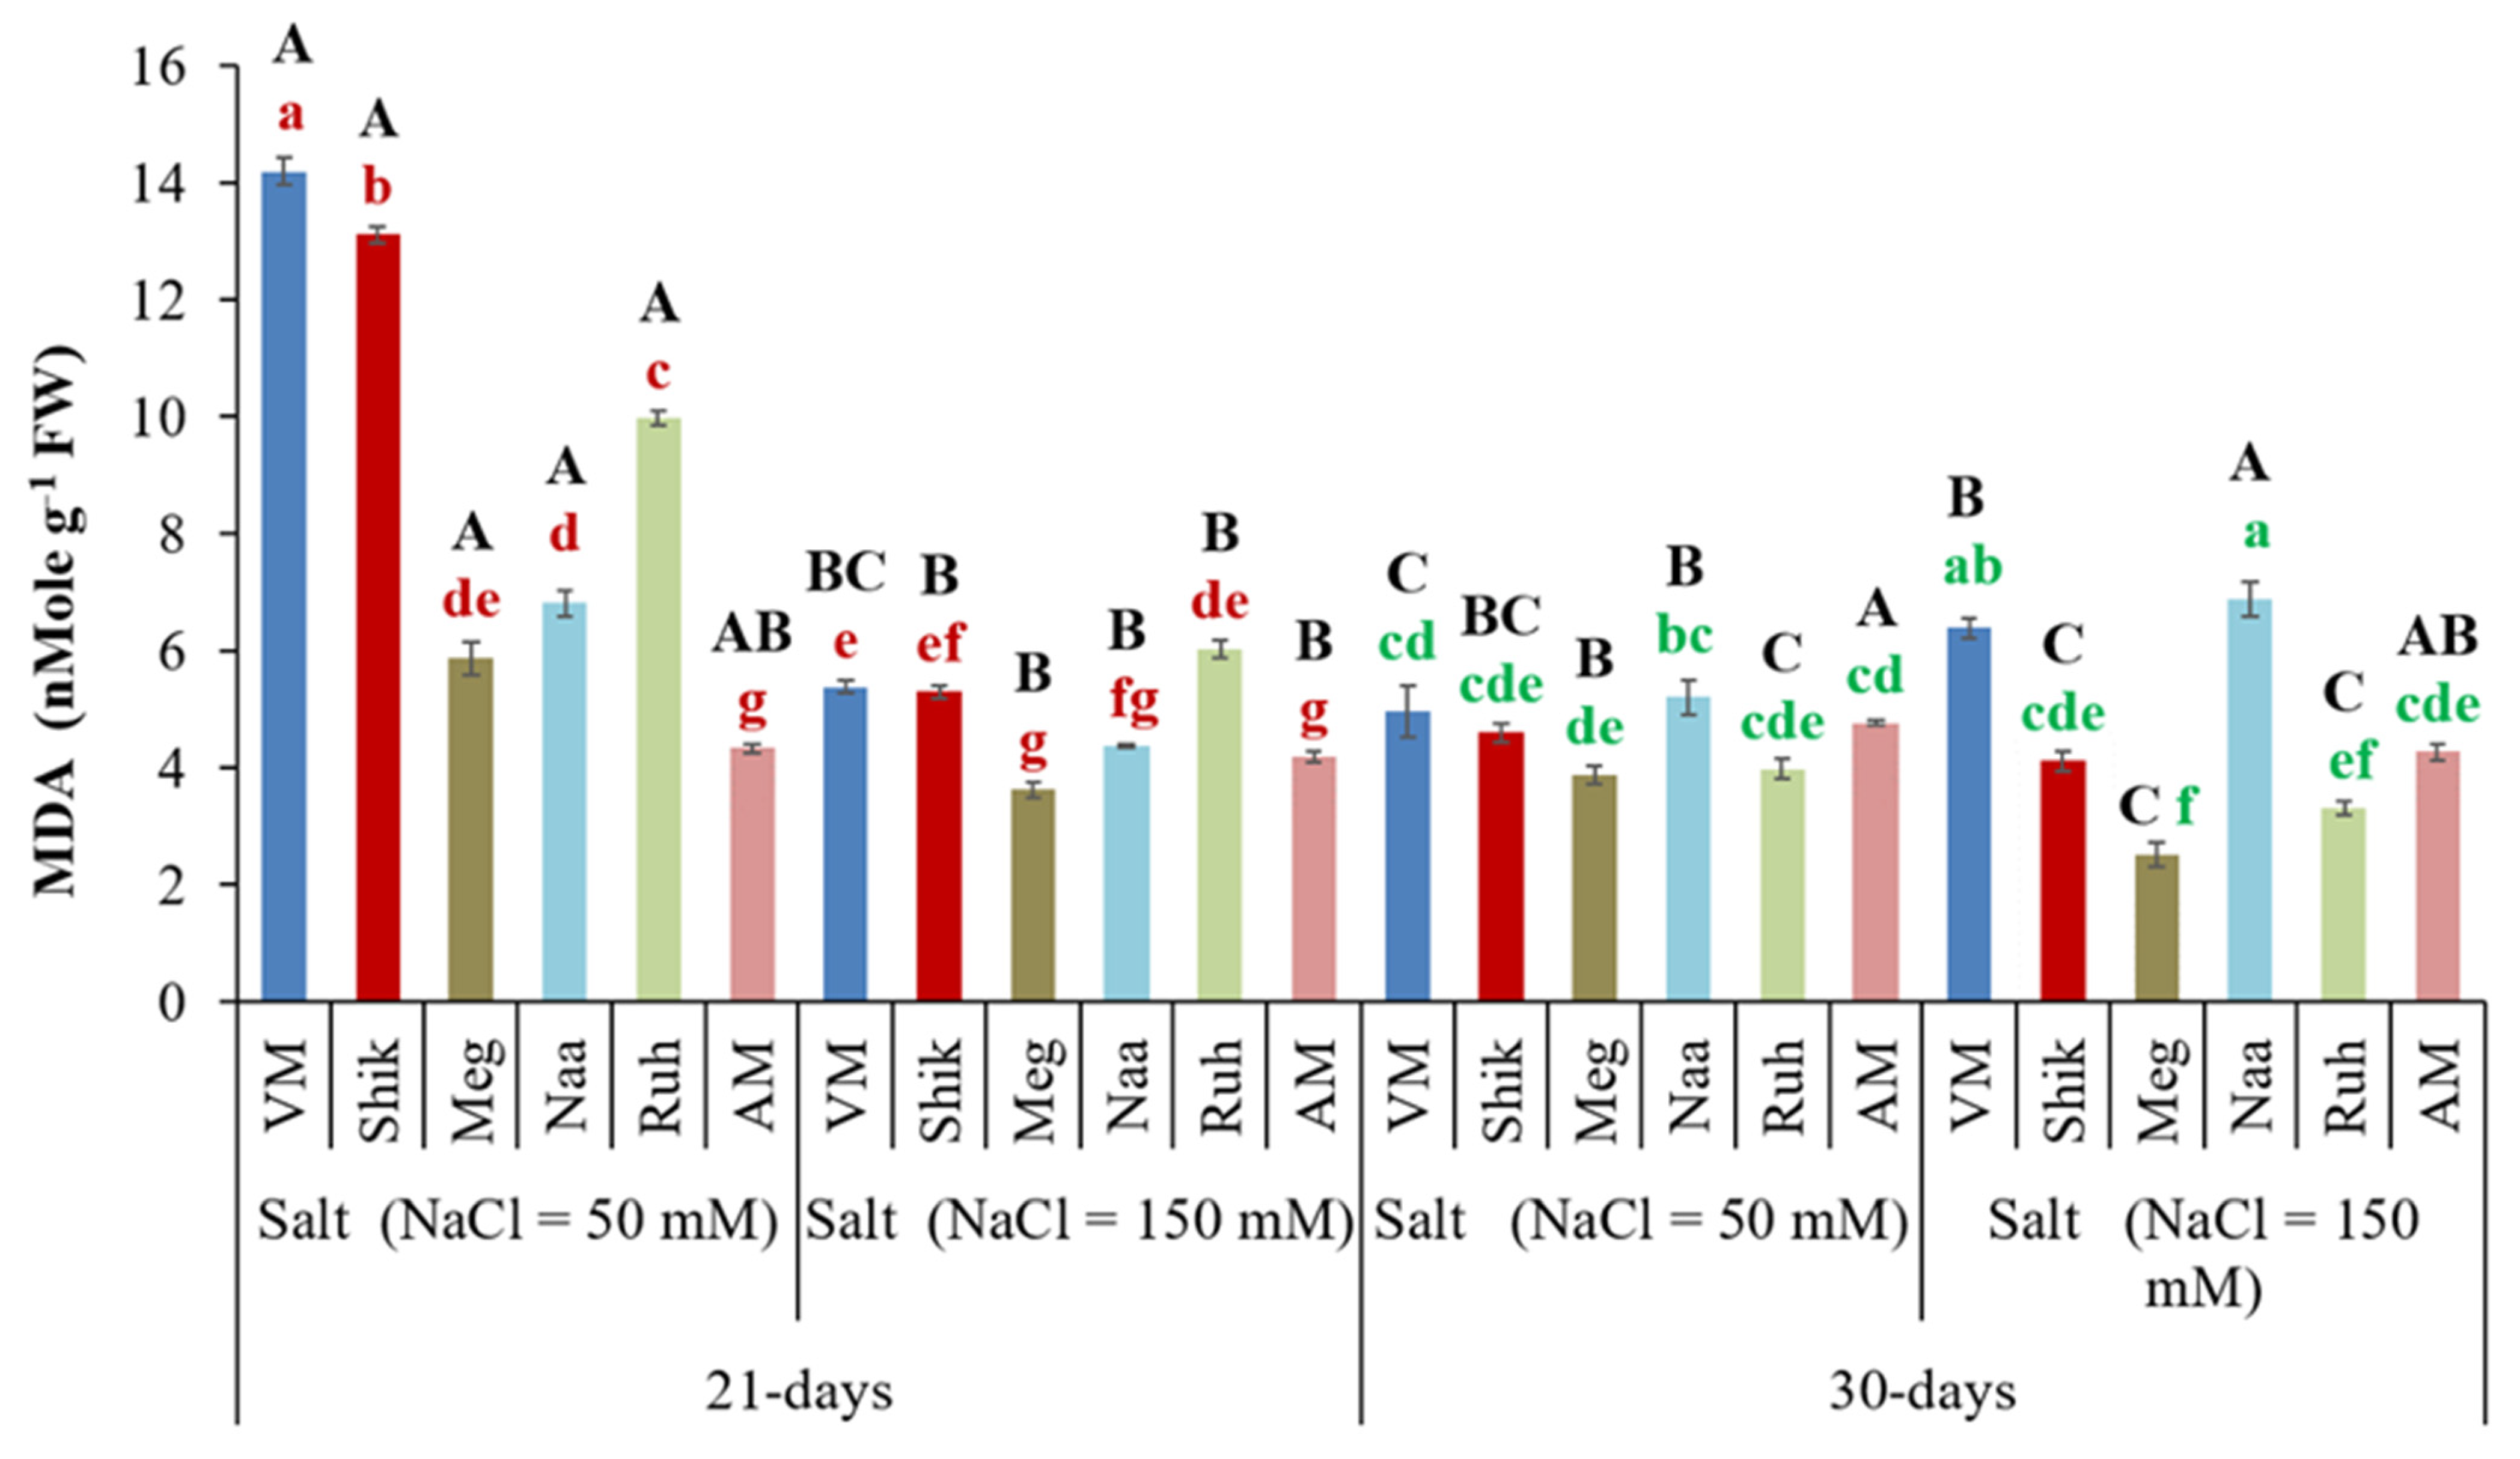
MDA is a toxic carbonyl aldehyde resulting from lipid peroxidation due to prolonged oxidative stress and is a stress marker in plants, with increased MDA content indicating higher stress levels [40]. Plants grown at low salinity under a 21-day harvest regime had significantly higher MDA levels than those grown at high salinity under the 21-day regime or those grown at either salinity level under a 30-day harvesting regime. This was particularly noticeable in the VM, Shikmona (Shik), Megadim (Meg), and Ruhama (Ruh) ecotypes. In contrast, AM exhibited lower MDA than the Sarcocornia ecotypes exposed to low salinity under the short harvest regime and was generally similar to the Sarcocornia ecotypes for the other treatments (Figure 12).

4. Discussion

4.1. Growth Responses

The current study compared the yields of new S. fruticosa ecotypes (Shik, Meg, Naa, and Ruh) to those of the currently used ecotype (VM) and A. macrostachyum (AM), which is phenotypically similar to Sarcocornia. The effect of 21-day and 30-day successive harvesting intervals on the yield of plants exposed to 50 or 150 mM NaCl was examined.
Multiple harvesting in perennial crops is advantageous, enhancing crop yield and enabling a year-round vegetable supply [4]. These regimes are designed to ensure consistently high-quality products, as only young, re-growing shoots are harvested [15]. Sarcocornia ecotypes and AM, as perennials, are well-suited for multiple-harvest regimes due to their extended periods without flowering, while the market value of Salicornia can be influenced by varying day lengths, inducing shoot flowering that makes it unsuitable as a vegetable crop [9,17].
Previous studies of Sarcocornia cultivated in a hydroponic system supplied with complete seawater revealed that a three-week harvesting regime produced similar biomass accumulation to two- and four-week harvesting regimes [15]. The current study demonstrated that over 210 days, harvesting seven times (every 30 days) produced greater biomass than harvesting ten times (every 21 days) (Figure 1).
Additionally, in each harvest regime, the higher salinity level (150 mM NaCl) enhanced plant growth and, therefore, fresh biomass production compared to the lower salinity level (50 mM) (Figure 1). Similarly, harvesting every 30 days produced a greater shoot diameter than harvesting every 21 days, and the higher salinity level also enhanced the shoot diameter compared to the lower salinity level (Figure 3), supporting both yield and quality improvement, as thicker tissues allow greater water content, ions, and assimilate storage to support sustained productivity across harvests [41].
The results indicate that a longer harvesting interval (30 days) and a higher salinity concentration generally enhanced plant productivity in both AM and Sarcocornia ecotypes. Specifically, the growth responses indicate that Meg, Naa, Ruh, and AM better responded to higher salinity than VM and Shik. At the same time, AM accumulated the highest biomass and had the largest shoot diameter under the longer harvest regime (30 days). In contrast, the lower-salinity treatment reduced plant growth, yield, and shoot diameter, especially in AM grown under the shorter harvest interval [21 days (Figure 1 and Figure 2)].
Importantly, these results are supported by studies on other halophyte types, such as Sarcocornia fruticosa, Salicornia bigelovii, Salicornia persica, and Atriplex halimus, demonstrating that moderate salinity promoted growth, while lower salinity (50 mM) or excessively high salinity levels (600 mM) caused stress that limited growth [15,42,43,44,45]. Moderate salinity levels improve osmotic adjustment and ion compartmentalization, which support metabolic activity and plant growth, but excessive salinity causes oxidative stress, ion toxicity, and reduced nutrient uptake [44,46]. In support of these notions, the accumulated yield (FW) exhibited high positive correlations with EC, TSS, and shoot diameter Table 2, [47,48,49].

4.2. Photosynthetic Pigments

Chlorophyll and carotenoids are positively correlated (Table 2) due to their shared, interdependent roles in photosynthesis and photoprotection. Photosynthetic pigments such as chlorophyll are crucial for photosynthesis, as they absorb light energy and convert it into chemical energy [50,51,52,53,54]. In saline environments, decreased chlorophyll levels indicate salt stress, which reduces chlorophyll synthesis and accelerates its degradation [54,55,56]. Chlorophyll degradation, often a photoprotection mechanism, reduces the ability of plants to absorb light [55], while chlorophyll activity is a key indicator of plant health, supporting photosynthetic processes, nutrient cycling, and stress adaptation [56,57,58,59]. The current study revealed that the total chlorophyll concentration significantly differed between 21-day and 30-day harvesting regimes across VM, Shik, and Naa ecotypes at lower salinity, but not at higher salinity. The higher-salinity treatment increased the chlorophyll content compared to the lower-salinity treatment (Figure 4A). These results are consistent with other studies [15,59,60,61,62] that observed increased chlorophyll content with increasing salinity in halophytes and wheat plants.
The accumulation of the photosynthetic pigment anthocyanin is a key response to abiotic stress, with roles in osmoregulation, signaling, and photoprotection [62,63]. Thus, plants produce anthocyanins in response to salinity stress [62,64,65,66], and the level in leaves is closely associated with the ability to tolerate salt stress [64]. While salt-tolerant plants may generate anthocyanins in smaller quantities due to their specific defense mechanisms, higher levels of anthocyanins can help protect salt-sensitive plants from oxidative stress [65]. The current study showed increased anthocyanin concentration in the Meg ecotype under higher salinity in both harvest regimes, though it was higher under the 30-day harvest. In contrast, VM, Shik, and Ruh ecotypes exhibited increased anthocyanin levels under higher salinity during the 21-day harvesting regime (Figure 8). These results are consistent with other studies that observed increased anthocyanin content with increasing salinity [8,55]. AM exhibited lower anthocyanin content than the Sarcocornia ecotypes but showed increased anthocyanin concentration under the 21-day regime at lower salinity (Figure 8), indicating that lower salinity is likely stressful for AM.
Carotenoids are vital non-antioxidants that protect plants against salinity and photo-oxidative stress damage while enhancing photosynthetic performance through improved light harvesting and energy transfer [66,67,68,69,70]. The current study revealed a significant difference in total carotenoid concentration between 21-day and 30-day harvesting regimes across VM, Naa, and Ruh ecotypes at lower salinity, but no significant difference at higher salinity. Carotenoid levels increased under higher salinity in both 21- and 30-day harvesting regimes (Figure 4B). These results align with other studies reporting that carotenoid levels rise in response to enhanced salinity in various halophytes, as well as in wheat plants, as a protective mechanism [2,54,60,61,70].

4.3. Relative Water Content

RWC is a key metric of plant hydration and can indicate plant response to salinity stress. Increased RWC indicates osmolyte accumulation and stable water content, while a decrease signals drought stress [8,30]. Halophytes typically increase their RWC in response to higher salinity to mitigate stress and maintain osmolyte balance [8,70]. This study indicates that RWC significantly increased with higher-salinity treatment under both harvesting regimes. Lower-salinity treatment decreased RWC, particularly in AM, which showed a significant increase in RWC under the 21-day harvesting regime compared to the 30-day regime. In contrast, no significant RWC differences between harvesting regimes were observed in the Sarcocornia ecotypes (Figure 5). Refs. [8,71] also reported increased RWC in halophyte ecotypes under higher-salinity conditions, attributed to enhanced water uptake at elevated salinity levels, osmoregulatory adjustments, and osmoreceptor activation.
The higher-salinity treatment significantly increased the TSS content and EC level in Sarcocornia ecotypes and AM at 21-day and 30-day harvesting intervals (Figure 7A,B). Notably, TSS significantly increased in Sarcocornia ecotypes and AM under higher-salinity treatment compared to lower salinity, while the harvesting interval had no significant effect on total soluble sugar content, except for the Naa and Ruh ecotypes, which exhibited significantly higher TSS levels with 30-day intervals compared to 21-day intervals (Figure 7). These results indicate that, compared to the other Sarcocornia ecotypes under these growth conditions, Naa and Ruh have an advantage—a potential adaptive response to prolonged exposure to salinity stress at the higher salinity level during plant growth.
Stress-associated protein biosynthesis is induced by salinity and environmental stresses such as drought and mineral nutrient levels in saline environments [72]. The increased protein content contributes to osmotic adjustment, helping plants maintain cellular homeostasis. Some of these proteins are newly synthesized as a direct response to salt stress, while others are constitutively present at low levels and become upregulated upon exposure to salinity [70,71,72,73,74]. The current study indicated that the AM ecotype’s protein content significantly increased under a 30-day harvesting interval at higher salinity stress compared to lower salinity. In contrast, Sarcocornia ecotypes had higher protein contents at lower salinity under 21-day harvesting intervals compared with higher salinity and 30-day harvesting intervals (Figure 6), likely indicating the different capacities between AM and Sarcocornia ecotypes to grow at low salinity.

4.4. Antioxidant Responses

Environmental factors such as drought, waterlogging, wounding, UV irradiation, and mineral nutrient levels in saline environments induce oxidative stress by producing ROS, which can damage plant cells and disrupt metabolic activity [18,40,75,76]. MDA, a biomarker of oxidative stress, indicates the extent of lipid peroxidation and ROS damage [18,19]. Lower MDA levels indicate higher tolerance to environmental stress, such as salinity, while higher levels suggest sensitivity. The current study shows that MDA was negatively correlated with radical scavenging activity, polyphenols, flavonoids, proteins, chlorophylls, and carotenoids, further indicating that oxidative stress is inversely related to antioxidant capacity and photosynthetic pigments [Table 2, [48,50,74,77]]. Accordingly, MDA levels were highest under lower-salinity treatment in AM and Sarcocornia, especially for the VM and Shik ecotypes under the 21-day harvesting regime. Sarcocornia ecotypes exhibited higher MDA levels than the AM ecotype across salinity levels and harvesting regimes, indicating that AM is more salinity-stress-tolerant than Sarcocornia.
Radical scavenging activity serves as a crucial defense mechanism under various stress conditions, and it plays a vital role in neutralizing reactive oxygen species that contribute to lipid peroxidation and abiotic stress effects [75]. Antioxidant-related traits, including total polyphenols, flavonoids, carotenoids, and total proteins, were significantly and positively correlated with radical scavenging activity (DPPH), highlighting their central role in antioxidative defense [Table 2, [50,51,75,78]]. The current study shows that radical scavenging activity, detected by measuring DPPH inhibition, significantly increased at both salinity levels with the 30-day harvesting interval. Except for the Shik ecotype, all Sarcocornia ecotypes exhibited higher (or similar) levels of DPPH inhibition under lower-salinity conditions. As with total flavonoids (Figure 9), the AM ecotype demonstrated a higher level of DPPH inhibition compared to the Sarcocornia ecotypes at high and low salinity levels and both harvesting intervals (Figure 11). Accordingly, the level of DPPH inhibition was significantly increased in AM under high salinity at the 30-day harvesting interval, with a smaller increase at the 21-day harvesting interval under lower salinity, indicating that the total flavonoids play a role in the level of DPPH inhibition, at least in AM (Figure 9 and Figure 11).

5. Conclusions

Our study highlights the significant effects of the harvesting interval and salinity level on the yield and nutritional value of Sarcocornia fruticose ecotypes and Arthrocaulon macrostachyum (AM).
At both salinity levels examined (50 and 150 mM NaCl), successive harvesting at 30-day intervals over a 210-day growth period increased Sarcocornia and AM yields compared to the 21-day harvesting regime. It also tended to improve electrical conductivity and total soluble sugars, lower malondialdehyde levels (toxic stress marker), and enhance radical inhibition activity in most Sarcocornia ecotypes.
Compared to VM, the Sarcocornia ecotypes Ruh and Naa exhibited much higher biomass with generally similar radical inhibition activity but lower total protein content. The higher salinity improved fresh biomass, shoot diameter, relative water content, chlorophyll level, TSS, and EC and tended to increase anthocyanin and carotenoid levels. In contrast, the lower salinity tended to increase total flavonoids, polyphenols, and radical inhibition activity in the Sarcocornia ecotypes.
Significantly, AM outperformed both VM and the new Sarcocornia ecotypes (Shik, Meg, Naa, and Ruh) in biomass and productivity at the higher salinity level and 30-day harvesting intervals and exhibited higher radical scavenging activity.
These findings highlight the importance of optimizing harvesting regimes and salinity concentration management to improve yield and quality in such halophytic plants, with potential implications for sustainable agricultural practices in saline water and saline soil environments.

Supplementary Materials

The following supporting information can be downloaded at https://www.mdpi.com/article/10.3390/agriculture15212182/s1.

Author Contributions

T.A.S. and D.S. conceived the idea, participated in designing the research plans, performed the experiments, and analyzed the data. M.S. (Muki Shpigel) and L.M.B.C. participated in conceiving the idea. T.A.S., D.S., J.P., K.K., B.C. and I.G. participated in methodology. T.A.S., J.P., K.K., D.S., Z.D.N. and B.C. participated in preparing plant material. M.S. (Moshe Sagi) conceived the idea, designed the research plan, and supervised the research work. T.A.S., D.S., and M.S. (Moshe Sagi) wrote and edited the manuscript. All authors have read and agreed to the published version of the manuscript.

Funding

This research was funded by the Israeli Foundation for Science and Technology (FCT) and the Portuguese National Budget (bilateral project, Portugal/Israel, PT-IL/0003/2019, and UIDB/04326/2020 project). The research was also funded by the European Union’s Horizon 2020 Research and Innovation Programme (grant agreement no. 820906).

Data Availability Statement

The data presented in this study are available upon request from the corresponding authors.

Acknowledgments

Babita Choudhary is the recipient of a postdoctoral fellowship from the Jacob Blaustein Center for Scientific Cooperation, or words to this effect.

Conflicts of Interest

The authors declare that they have no conflicts of interest to report regarding the present study.

References

  1. Soltabayeva, A.; Ongaltay, A.; Omondi, J.O.O.; Srivastava, S. Morphological, physiological and molecular markers for salt-stressed plants. Plants 2021, 10, 243. [Google Scholar] [CrossRef] [PubMed]
  2. Ventura, Y.; Myrzabayeva, M.; Alikulov, Z.; Omarov, R.; Khozin-Goldberg, I.; Sagi, M. Effects of salinity on flowering, morphology, biomass accumulation and leaf metabolites in an edible halophyte. AoB Plants 2014, 6, plu053. [Google Scholar] [CrossRef] [PubMed]
  3. Castañeda-Loaiza, V.; Oliveira, M.; Santos, T.; Schüler, L.; Lima, A.R.; Gama, F.; Salazar, M.; Neng, N.R.; Nogueira, J.; Varela, J.; et al. Wild vs cultivated halophytes: Nutritional and functional differences. Food Chem. 2020, 333, 127536. [Google Scholar] [CrossRef]
  4. Ventura, Y.; Sagi, M. Halophyte crop cultivation: The case for Salicornia and Sarcocornia. Environ. Exp. Bot. 2013, 92, 144–153. [Google Scholar] [CrossRef]
  5. Lombardi, T.; Bertacchi, A.; Pistelli, L.; Pardossi, A.; Pecchia, S.; Toffanin, A.; Sanmartin, C. Biological and Agronomic Traits of the Main Halophytes Widespread in the Mediterranean Region as Potential New Vegetable Crops. Horticulturae 2022, 8, 195. [Google Scholar] [CrossRef]
  6. Custódio, L.; Rodrigues, M.J.; Pereira, C.G.; Castañeda-Loaiza, V.; Fernandes, E.; Standing, D.; Neori, A.; Shpigel, M.; Sagi, M. A review on Sarcocornia Species: Ethnopharmacology, nutritional properties, phytochemistry, biological activities and propagation. Foods 2021, 10, 2778. [Google Scholar] [CrossRef]
  7. Ventura, Y.; Eshel, A.; Pasternak, D.; Sagi, M. The development of halophyte-based agriculture: Past and present. Ann. Bot. 2015, 115, 529–540. [Google Scholar] [CrossRef]
  8. Sisay, T.A.; Nurbekova, Z.; Oshanova, D.; Dubey, A.K.; Khatri, K.; Mudgal, V.; Mudgal, A.; Neori, A.; Shpigel, M.; Srivastava, R.K.; et al. Effect of Salinity and Nitrogen Fertilization Levels on Growth Parameters of Sarcocornia fruticosa, Salicornia brachiata, and Arthrocnemum macrostachyum. Agronomy 2022, 12, 1749. [Google Scholar] [CrossRef]
  9. Kaushal, S.S.; Likens, G.E.; Pace, M.L.; Utz, R.M.; Haq, S.; Gorman, J.; Grese, M. Freshwater salinization syndrome on a continental scale. Proc. Natl. Acad. Sci. USA 2018, 115, E574–E583. [Google Scholar] [CrossRef]
  10. Agudelo, A.; Carvajal, M.; Martinez-Ballesta, M.d.C. Halophytes of the mediterranean basin—Underutilized species with the potential to be nutritious crops in the scenario of the climate change. Foods 2021, 10, 119. [Google Scholar] [CrossRef]
  11. Barreira, L.; Resek, E.; Rodrigues, M.J.; Rocha, M.I.; Pereira, H.; Bandarra, N.; da Silva, M.M.; Varela, J.; Custódio, L. Halophytes: Gourmet food with nutritional health benefits? J. Food Compos. Anal. 2017, 59, 35–42. [Google Scholar] [CrossRef]
  12. ElNaker, N.A.; Yousef, A.F.; Yousef, L.F. A review of Arthrocnemum (Arthrocaulon) macrostachyum chemical content and bioactivity. Phytochem. Rev. 2020, 19, 1427–1448. [Google Scholar] [CrossRef]
  13. Redondo-Gã3Mez, S.; Mateos-Naranjo, E.; Figueroa, M.E.; Davy, A.J. Salt stimulation of growth and photosynthesis in an extreme halophyte, Arthrocnemum macrostachyum. Plant Biol. 2010, 12, 79–87. [Google Scholar] [CrossRef]
  14. Rodrigues, M.J.; Gangadhar, K.N.; Vizetto-Duarte, C.; Wubshet, S.G.; Nyberg, N.T.; Barreira, L.; Varela, J.; Custódio, L. Maritime halophyte species from southern portugal as sources of bioactive molecules. Mar. Drugs 2014, 12, 2228–2244. [Google Scholar] [CrossRef] [PubMed]
  15. Ventura, Y.; Wuddineh, W.A.; Myrzabayeva, M.; Alikulov, Z.; Khozin-Goldberg, I.; Shpigel, M.; Samocha, T.M.; Sagi, M. Effect of seawater concentration on the productivity and nutritional value of annual Salicornia and perennial Sarcocornia halophytes as leafy vegetable crops. Sci. Hortic. 2011, 128, 189–196. [Google Scholar] [CrossRef]
  16. Ventura, Y.; Wuddineh, W.A.; Shpigel, M.; Samocha, T.M.; Klim, B.C.; Cohen, S.; Shemer, Z.; Santos, R.; Sagi, M. Effects of day length on flowering and yield production of Salicornia and Sarcocornia species. Sci. Hortic. 2011, 130, 510–516. [Google Scholar] [CrossRef]
  17. Antunes, M.D.; Gago, C.; Guerreiro, A.; Sousa, A.R.; Julião, M.; Miguel, M.G.; Faleiro, M.L.; Panagopoulos, T. Nutritional Characterization and Storage Ability of Salicornia ramosissima and Sarcocornia perennis for Fresh Vegetable Salads. Horticulturae 2021, 7, 6. [Google Scholar] [CrossRef]
  18. Mohammadi, H.; Kardan, J. Morphological and physiological responses of some halophytes to salinity stress. In Annales Universitatis Mariae Curie-Sklodowska, Sectio C–Biologia; Wydawnictwo Uniwersytetu Marii Curie-Skłodowskiej: Lublin, Poland, 2015; Volume 70. [Google Scholar]
  19. Patel, J.; Khatri, K.; Sisay, T.A.; Du Nja, Z.; Choudhary, B.; Nurbekova, Z.; Mishra, A.; Sikron, N.; Standing, D.; Mudgal, A.; et al. UV-C-induced reactive carbonyl species are better detoxified in the halophytic plants Salicornia brachiata and Arthrocnemum macrostachyum than in the halophytic Sarcocornia fruticosa plants. Plant J. 2025, 122, e70239. [Google Scholar] [CrossRef]
  20. Mishra, A.; Patel, M.K.; Jha, B. Non-targeted metabolomics and scavenging activity of reactive oxygen species reveal the potential of Salicornia brachiata as a functional food. J. Funct. Foods 2015, 13, 21–31. [Google Scholar] [CrossRef]
  21. Boughalleb, F.; Denden, M. Physiological and Biochemical Changes of Two Halophytes, Nitraria retusa (Forssk.) and Atriplex halimus (L.) Under Increasing Salinity. Agric. J. 2011, 6, 327–339. [Google Scholar] [CrossRef]
  22. Forghani, A.H.; Mohebatinejad, H.; Fazilati, M. The Effect of Salt Stress on Antimicrobial Activity and Potential Production of Anthocyanin and Total Phenolic of Salicornia in Hydroponic Culture. Proc. Natl. Acad. Sci. India Sect. B Biol. Sci. 2024, 94, 793–801. [Google Scholar] [CrossRef]
  23. Rudrapal, M.; Khairnar, S.J.; Khan, J.; Bin Dukhyil, A.; Ansari, M.A.; Alomary, M.N.; Alshabrmi, F.M.; Palai, S.; Deb, P.K.; Devi, R. Dietary Polyphenols and Their Role in Oxidative Stress-Induced Human Diseases: Insights Into Protective Effects, Antioxidant Potentials and Mechanism(s) of Action. Front. Pharmacol. 2022, 13, 806470. [Google Scholar] [CrossRef]
  24. Khlestkina, E. The adaptive role of flavonoids: Emphasis on cereals. Cereal Res. Commun. 2013, 41, 185–198. [Google Scholar] [CrossRef]
  25. Marone, D.; Mastrangelo, A.M.; Borrelli, G.M.; Mores, A.; Laidò, G.; Russo, M.A.; Ficco, D.B.M. Specialized metabolites: Physiological and biochemical role in stress resistance, strategies to improve their accumulation, and new applications in crop breeding and management. Plant Physiol. Biochem. 2022, 172, 48–55. [Google Scholar] [CrossRef] [PubMed]
  26. Kadereit, G.; Ball, P.; Beer, S.; Mucina, L.; Sokoloff, D.; Teege, P.; Yaprak, A.E.; Freitag, H. A taxonomic nightmare comes true: Phylogeny and biogeography of glassworts (Salicornia L., Chenopodiaceae). Taxon 2007, 56, 1143–1170. [Google Scholar] [CrossRef]
  27. Hall, T.A. BioEdit: A user-friendly biological sequence alignment editor and analysis program for Windows 95/98/NT. In Nucleic Acids Symposium Series; Oxford University Press: Oxford, UK, 1999; Volume 41, pp. 95–98. [Google Scholar]
  28. Tamura, K.; Peterson, D.; Peterson, N.; Stecher, G.; Nei, M.; Kumar, S. MEGA5: Molecular evolutionary genetics analysis using maximum likelihood, evolutionary distance, and maximum parsimony methods. Mol. Biol. Evol. 2011, 28, 2731–2739. [Google Scholar] [CrossRef]
  29. Ramírez, E.; Sánchez-Gavilán, D.; Rufo, L.; Sánchez-Mata, D.; De la Fuente, V. Morphology, anatomy and phylogeny of the two sister halophytic genera Microcnemum and Arthrocnemum (Salicornioideae/Amaranthaceae). Plant Biosyst.-Int. J. Deal. All Asp. Plant Biol. 2022, 156, 1422–1437. [Google Scholar]
  30. Ben-Amotz, A.; Lers, A.; Avron, M. Stereoisomers of β-Carotene and Phytoene in the Alga Dunaliella bardawil. Plant Physiol. 1988, 86, 1286–1291. [Google Scholar] [CrossRef]
  31. Lichtenthaler, H.K. Chlorophylls and carotenoids: Pigments of photosynthetic biomembranes. In Methods in Enzymology; Academic Press: Cambridge, MA, USA, 1987; Volume 148, pp. 350–382. [Google Scholar] [CrossRef]
  32. Sarkar, S.; Mondal, M.; Ghosh, P.; Saha, M.; Chatterjee, S. Quantification of total protein content from some traditionally used edible plant leaves: A comparative study. J. Med. Plants Stud. 2020, 8, 166–170. [Google Scholar] [CrossRef]
  33. Khatri, K.; Rathore, M.S. Salt and osmotic stress-induced changes in physio-chemical responses, PSII photochemistry and chlorophyll a fluorescence in peanut. Plant Stress 2022, 3, 100063. [Google Scholar] [CrossRef]
  34. Patel, J.; Khandwal, D.; Choudhary, B.; Ardeshana, D.; Jha, R.K.; Tanna, B.; Yadav, S.; Mishra, A.; Varshney, R.K.; Siddique, K.H.M. Differential Physio-Biochemical and Metabolic Responses of Peanut (Arachis hypogaea L.) under Multiple Abiotic Stress Conditions. Int. J. Mol. Sci. 2022, 23, 660. [Google Scholar] [CrossRef]
  35. Choudhary, B.; Khandwal, D.; Gupta, N.K.; Patel, J.; Mishra, A. Nutrient Composition, Physicobiochemical Analyses, Oxidative Stability and Antinutritional Assessment of Abundant Tropical Seaweeds from the Arabian Sea. Plants 2023, 12, 2302. [Google Scholar] [CrossRef]
  36. Hodges, D.M.; DeLong, J.M.; Forney, C.F.; Prange, R.K. Improving the thiobarbituric acid-reactive-substances assay for estimating lipid peroxidation in plant tissues containing anthocyanin and other interfering compounds. Planta 1999, 207, 604–611. [Google Scholar] [CrossRef]
  37. Srivastava, R. Physicochemical, antioxidant properties of carotenoids and its optoelectronic and interaction studies with chlorophyll pigments. Sci. Rep. 2021, 11, 18365. [Google Scholar] [CrossRef] [PubMed]
  38. Pincus, M.R. Physiological Structure and Function of Proteins. In Cell Physiology Source Book; Academic Press: Cambridge, MA, USA, 2001. [Google Scholar]
  39. Ksouri, R.; Megdiche, W.; Falleh, H.; Trabelsi, N.; Boulaaba, M.; Smaoui, A.; Abdelly, C. Influence of biological, environmental, and technical factors on phenolic content and antioxidant activities of Tunisian halophytes. Comptes Rendus Biol. 2008, 331, 865–873. [Google Scholar] [CrossRef]
  40. Soltabayeva, A.; Bekturova, A.; Kurmanbayeva, A.; Oshanova, D.; Nurbekova, Z.; Srivastava, S.; Standing, D.; Sagi, M. Ureides are accumulated similarly in response to UV-C irradiation and wounding in Arabidopsis leaves but are remobilized differently during recovery. J. Exp. Bot. 2022, 73, 1016–1032. [Google Scholar] [CrossRef]
  41. Katschnig, D.; Broekman, R.; Rozema, J. Salt tolerance in the halophyte salicornia dolichostachya moss: Growth, morphology and physiology. Environ. Exp. Bot. 2013, 92, 32–42. [Google Scholar] [CrossRef]
  42. Aghaleh, M.; Niknam, V.; Ebrahimzadeh, H.; Razavi, K. Salt stress effects on growth, pigments, proteins and lipid peroxidation in Salicornia persica and S. europaea. Biol. Plant. 2009, 53, 243–248. [Google Scholar] [CrossRef]
  43. Salazar, O.R.; Chen, K.; Melino, V.J.; Reddy, M.P.; Hřibová, E.; Čížková, J.; Beránková, D.; Vega, J.P.A.; Leal, L.M.C.; Aranda, M.; et al. SOS1 tonoplast neo-localization and the RGG protein SALTY are important in the extreme salinity tolerance of Salicornia bigelovii. Nat. Commun. 2024, 15, 4279. [Google Scholar] [CrossRef]
  44. Ibraheem, F.; Albaqami, M.; Elghareeb, E.M. Halophytic resilience in extreme environments: Adaptive strategies of Suaeda schimperi in the Red Sea’s hyper-arid salt marshes. Plant Soil Environ. 2025, 71, 320–337. [Google Scholar] [CrossRef]
  45. Kong, Y.; Zheng, Y. Potential of Producing Salicornia bigelovii Hydroponically as a Vegetable at Moderate NaCl Salinity. HortScience 2014, 49, 1154–1157. [Google Scholar] [CrossRef]
  46. Yang, C.; Shi, D.; Wang, D. Comparative effects of salt and alkali stresses on growth, osmotic adjustment and ionic balance of an alkali-resistant halophyte Suaeda glauca (Bge.). Plant Growth Regul. 2008, 56, 179–190. [Google Scholar] [CrossRef]
  47. Homayouni, H.; Razi, H.; Izadi, M.; Alemzadeh, A.; Kazemeini, S.A.; Niazi, A.; Vicente, O. Temporal Changes in Biochemical Responses to Salt Stress in Three Salicornia Species. Plants 2024, 13, 979. [Google Scholar] [CrossRef]
  48. Lee, G.; Carrow, R.N.; Duncan, R.R. Growth and water relation responses to salinity stress in halophytic seashore paspalum ecotypes. Sci. Hortic. 2005, 104, 221–236. [Google Scholar] [CrossRef]
  49. Kumar, H.; Lal, S.B.; Wani, A.M. Correlation Studies for Morphological and Biomass Traits in Half Sib Families of Terminalia Arjuna (L.). Curr. World Environ. J. 2017, 12, 345–354. [Google Scholar] [CrossRef]
  50. Saadati, S.; Borzouei, A.; Rahemi, M.R.; Khiabani, B.N. Alteration of physiological and biochemical properties in leaves and fruits of pomegranate in response to gamma irradiation. Sci. Rep. 2022, 12, 4312. [Google Scholar] [CrossRef] [PubMed]
  51. Mandal, R.; Dutta, G. From photosynthesis to biosensing: Chlorophyll proves to be a versatile molecule. Sens. Int. 2020, 1, 100058. [Google Scholar] [CrossRef]
  52. Tan, X.; Zhu, J.; Wakisaka, M. Effect of protocatechuic acid on Euglena gracilis growth and accumulation of metabolites. Sustainability 2020, 12, 9158. [Google Scholar] [CrossRef]
  53. Jameel, J.; Anwar, T.; Majeed, S.; Qureshi, H.; Siddiqi, E.H.; Sana, S.; Zaman, W.; Ali, H.M. Effect of salinity on growth and biochemical responses of brinjal varieties: Implications for salt tolerance and antioxidant mechanisms. BMC Plant Biol. 2024, 24, 128. [Google Scholar] [CrossRef]
  54. Taïbi, K.; Taïbi, F.; Abderrahim, L.A.; Ennajah, A.; Belkhodja, M.; Mulet, J.M. Effect of salt stress on growth, chlorophyll content, lipid peroxidation and antioxidant defence systems in Phaseolus vulgaris L. S. Afr. J. Bot. 2016, 105, 306–312. [Google Scholar] [CrossRef]
  55. Türkan, I.; Demiral, T. Recent developments in understanding salinity tolerance. Environ. Exp. Bot. 2009, 67, 2–9. [Google Scholar] [CrossRef]
  56. Pavlovic, D.; Nikolic, B.; Djurovic, S.; Waisi, H.; Andjelkovic, A.; Marisavljevic, D. Chlorophyll as a measure of plant health: Agroecological aspects. Pestic. I Fitomed. 2014, 29, 21–34. [Google Scholar] [CrossRef]
  57. Talebzadeh, F.; Valeo, C. Evaluating the Effects of Environmental Stress on Leaf Chlorophyll Content as an Index for Tree Health. In IOP Conference Series: Earth and Environmental Science; IOP Publishing Ltd.: Bristol, UK, 2022. [Google Scholar]
  58. Kumar, S.; Li, G.; Yang, J.; Huang, X.; Ji, Q.; Liu, Z.; Ke, W.; Hou, H. Effect of Salt Stress on Growth, Physiological Parameters, and Ionic Concentration of Water Dropwort (Oenanthe javanica) Cultivars. Front. Plant Sci. 2021, 12, 660409. [Google Scholar] [CrossRef]
  59. Rabhi, M.; Castagna, A.; Remorini, D.; Scattino, C.; Smaoui, A.; Ranieri, A.; Abdelly, C. Photosynthetic responses to salinity in two obligate halophytes: Sesuvium portulacastrum and Tecticornia indica. S. Afr. J. Bot. 2012, 79, 39–47. [Google Scholar] [CrossRef]
  60. Shah, S.H.; Houborg, R.; McCabe, M.F. Response of chlorophyll, carotenoid and SPAD-502 measurement to salinity and nutrient stress in wheat (Triticum aestivum L.). Agronomy 2017, 7, 61. [Google Scholar] [CrossRef]
  61. Dabravolski, S.A.; Isayenkov, S.V. The Role of Anthocyanins in Plant Tolerance to Drought and Salt Stresses. Plants 2023, 12, 2558. [Google Scholar] [CrossRef]
  62. Li, Z.; Ahammed, G.J. Hormonal regulation of anthocyanin biosynthesis for improved stress tolerance in plants. Plant Physiol. Biochem. 2023, 201, 107835. [Google Scholar] [CrossRef] [PubMed]
  63. Kovinich, N.; Kayanja, G.; Chanoca, A.; Riedl, K.; Otegui, M.S.; Grotewold, E. Not all anthocyanins are born equal: Distinct patterns induced by stress in Arabidopsis. Planta 2014, 240, 931–940. [Google Scholar] [CrossRef] [PubMed]
  64. Maduraimuthu, D.; Agric, M.J.; Djanaguiraman, M.; Ramadass, R.; Devi, D.D. Effect of Salinity on Chlorophyll Content of Rice Genotypes Effect of Salt Stress on Germination and Seedling Growth in Rice Genotypes. 2004. Available online: https://www.researchgate.net/publication/284041307 (accessed on 1 January 2024).
  65. Hurkman, W.J.; Fornari, C.S.; Tanaka, C.K. A Comparison of the Effect of Salt on Polypeptides and Translatable mRNAs in Roots of a Salt-Tolerant and a Salt-Sensitive Cultivar of Barley. Plant Physiol. 1989, 90, 1444–1456. [Google Scholar] [CrossRef] [PubMed]
  66. Collini, E. Carotenoids in Photosynthesis: The Revenge of the “Accessory” Pigments. Chem 2019, 5, 494–495. [Google Scholar] [CrossRef]
  67. Croft, H.; Chen, J. Leaf pigment content. In Comprehensive Remote Sensing; Elsevier: Amsterdam, The Netherlands, 2017; Volume 1–9, pp. 117–142. [Google Scholar]
  68. Demmig-Adams, B.; Adams, W.W. Antioxidants in Photosynthesis and Human Nutrition. Available online: https://www.science.org (accessed on 1 January 2024).
  69. Sarker, U.; Oba, S. Salinity stress enhances color parameters, bioactive leaf pigments, vitamins, polyphenols, flavonoids and antioxidant activity in selected Amaranthus leafy vegetables. J. Sci. Food Agric. 2019, 99, 2275–2284. [Google Scholar] [CrossRef]
  70. Parida, A.K.; Veerabathini, S.K.; Kumari, A.; Agarwal, P.K. Physiological, anatomical and metabolic implications of salt tolerance in the halophyte salvadora persica under hydroponic culture condition. Front. Plant Sci. 2016, 7, 351. [Google Scholar] [CrossRef]
  71. Ashraf, M.; Harris, P. Potential biochemical indicators of salinity tolerance in plants. Plant Sci. 2004, 166, 3–16. [Google Scholar] [CrossRef]
  72. Ali, G.; Srivastava, P.; Iqbal, M. Proline accumulation, protein pattern and photosynthesis in Bacopa Monniera regenerants grown under nacl stress. Biol. Plant. 1999, 42, 89–95. [Google Scholar] [CrossRef]
  73. Pareek, A.; Singla, S.L.; Kush, A.K.; Grover, A. Distribution patterns of HSP 90 protein in rice. Plant Sci. 1997, 125, 221–230. [Google Scholar] [CrossRef]
  74. Sagi, M.; Davydov, O.; Orazova, S.; Yesbergenova, Z.; Ophir, R.; Stratmann, J.W.; Fluhr, R. Plant respiratory burst oxidase homologs impinge on wound responsiveness and development in Lycopersicon esculentum. Plant Cell 2004, 16, 616–628. [Google Scholar] [CrossRef] [PubMed]
  75. Kumar, D.; Al Hassan, M.; Naranjo, M.A.; Agrawal, V.; Boscaiu, M.; Vicente, O. Effects of salinity and drought on growth, ionic relations, compatible solutes and activation of antioxidant systems in oleander (Nerium oleander L.). PLoS ONE 2017, 12, e0185017. [Google Scholar] [CrossRef] [PubMed]
  76. Mansinhos, I.; Gonçalves, S.; Rodríguez-Solana, R.; Pereira-Caro, G.; Moreno-Rojas, J.M.; Romano, A. Nutrient Deficiency-Induced Stress Improves Skincare Effects and Phytochemical Content of Green Extracts from Lamiaceae In Vitro Cultures. Horticulturae 2024, 10, 947. [Google Scholar] [CrossRef]
  77. Harboub, N.; Mighri, H.; Bennour, N.; Dbara, M.; Pereira, C.; Chouikhi, N.; Custódio, L.; Abdellaoui, R.; Akrout, A. Nutritional profile, chemical composition and health promoting properties of Salicornia emerici Duval-Jouve and Sarcocornia alpini (Lag.) Rivas Mart. from southern Tunisia. Biocatal. Agric. Biotechnol. 2025, 64, 103502. [Google Scholar] [CrossRef]
  78. Esmaeili, K.A.; Taha, R.M.; Mohajer, S.; Banisalam, B. Antioxidant Activity and Total Phenolic and Flavonoid Content of Various Solvent Extracts from In Vivo and In Vitro Grown Trifolium pratense L. (Red Clover). Biomed. Res. Int. 2015, 2015, 643285. [Google Scholar] [CrossRef]
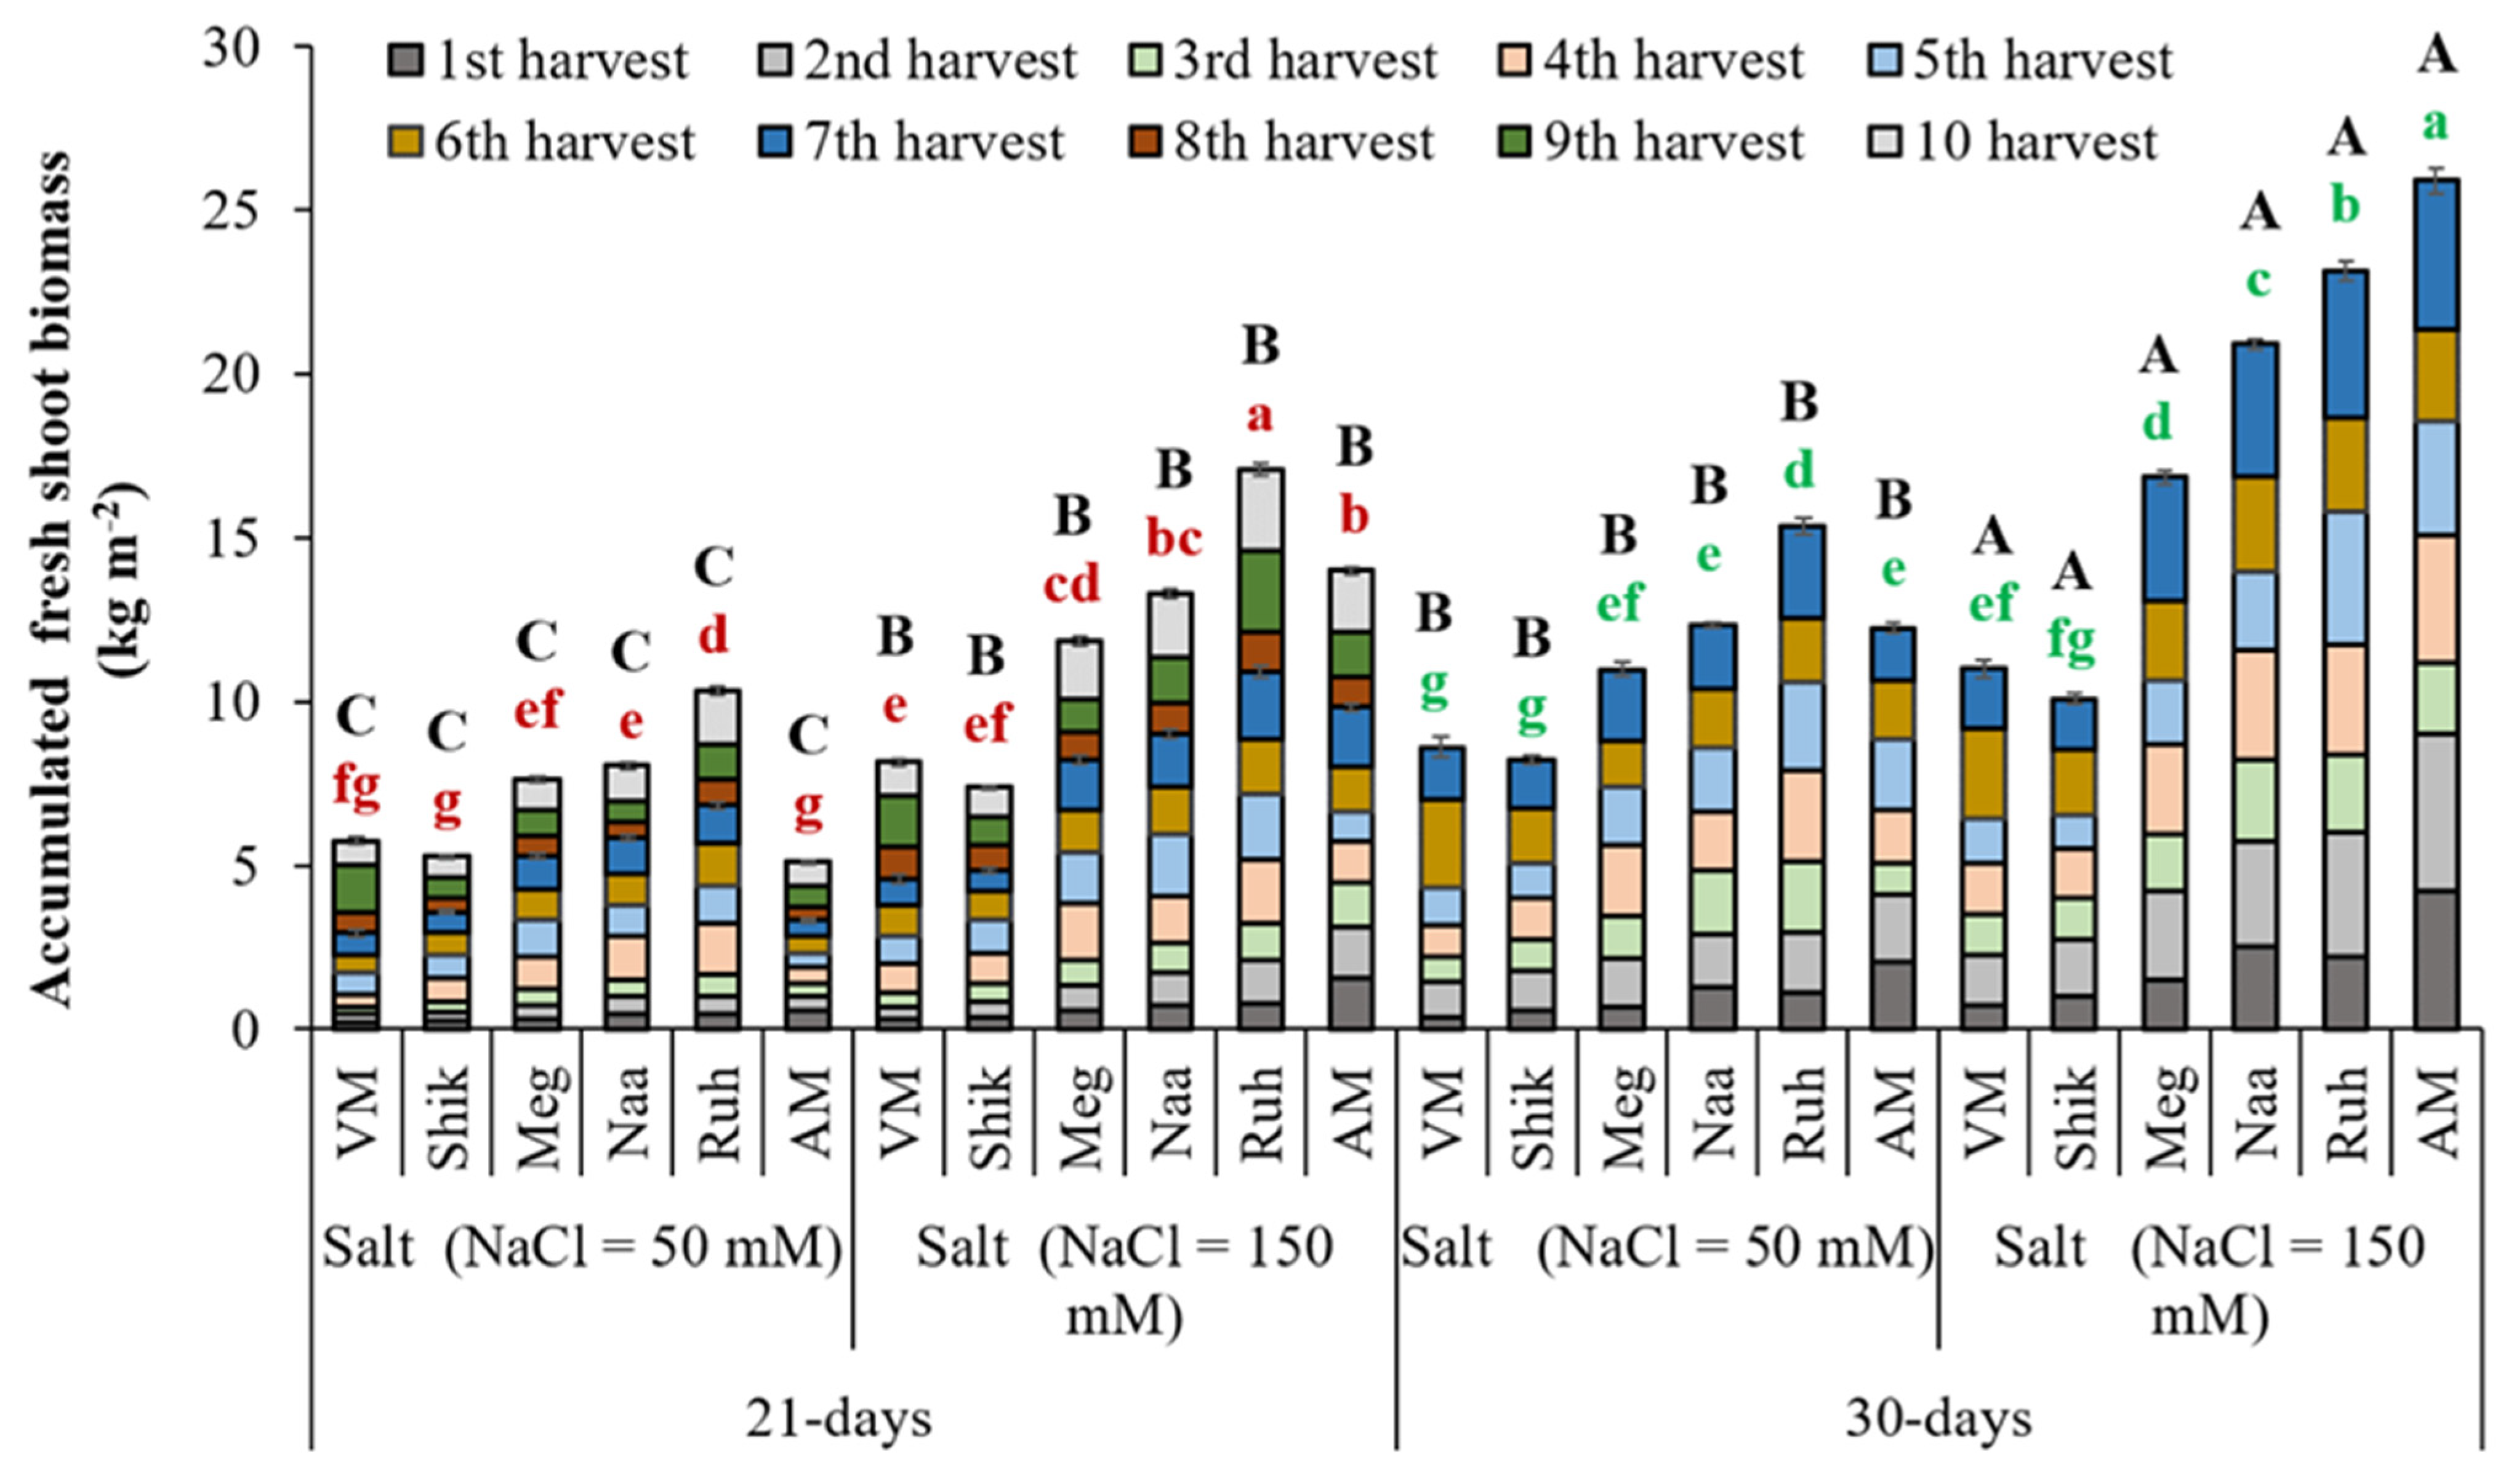
Figure 1. The impact of 21-day and 30-day successive harvesting intervals on fresh biomass accumulation in Sarcocornia ecotypes VM, Shikmona (Shik), Megadim (Meg), Naaman (Naa), and Ruhama (Ruh) and Arthrocaulon macrostachyum (AM). Two sodium chloride levels were used in the supplied water (50 and 150 mM). The mean plus standard error (+SE) is shown. Different uppercase letters indicate significant differences between the same ecotypes across various harvesting intervals and salinity levels. Lowercase letters represent significant differences among the various ecotypes within the same harvesting interval and under different salinity treatments (Tukey’s HSD, p ≤ 0.05, n = 3). Representative data (of two independent experiments) are shown.
Agriculture 15 02182 g001
Figure 2. The appearance of five S. fruticosa ecotypes (VM, Shikmona, Megadim, Naaman, and Ruhama) and Arthrocaulon macrostachyum before (left) and after the final harvest (210 days after the technical harvest). Each replica of either treatment was randomly allocated in the greenhouse area. Plants were exposed to one of two salinity levels (50 or 150 mM NaCl) with harvesting intervals of 21 or 30 days.
Agriculture 15 02182 g002
Figure 3. The effect of 21-day and 30-day harvesting intervals on shoot diameters of VM, Shikmona (Shik), Megadim (Meg), Naaman (Naa), and Ruhama (Ruh) and Arthrocaulon macrostachyum (AM). Two sodium chloride levels were used in the supplied water (50 and 150 mM). The mean plus standard error (+SE) is shown. Different uppercase letters indicate significant differences between the same ecotypes across various harvesting intervals and salinity levels. Lowercase letters represent significant differences among the various ecotypes within the same harvesting interval and under different salinity treatments (Tukey’s HSD, p ≤ 0.05, n = 6). Representative data (of two independent experiments) are shown.
Agriculture 15 02182 g003
Figure 4. The effects of 21-day and 30-day harvesting intervals on total chlorophyll (A) and total carotenoid (B) levels in the shoots of Sarcocornia ecotypes VM, Shikmona (Shik), Megadim (Meg), Naaman (Naa), and Ruhama (Ruh) and Arthrocaulon macrostachyum (AM). Two sodium chloride levels were used in the supplied water (50 and 150 mM). The mean plus standard error (+SE) is shown. Different uppercase letters indicate significant differences between the same ecotypes across various harvesting intervals and salinity levels. Lowercase letters represent significant differences among the various ecotypes within the same harvesting interval and under different salinity treatments (Tukey’s HSD, p ≤ 0.05, n = 9). Representative data (of two independent experiments) are shown.
Agriculture 15 02182 g004
Figure 5. Relative water content in the shoots of Sarcocornia ecotypes VM, Shikmona (Shik), Megadim (Meg), Naaman (Naa), and Ruhama (Ruh) and Arthrocaulon macrostachyum (AM) harvested with two different intervals (21 days and 30 days) and treated with two different salinity levels (50 and 150 mM). The mean plus standard error (+SE) is shown. Different uppercase letters indicate significant differences between the same ecotypes across various harvesting intervals and salinity levels. Lowercase letters represent significant differences among the various ecotypes within the same harvesting interval and under different salinity treatments (Tukey’s HSD, p ≤ 0.05, n = 4). Representative data (of two independent experiments) are shown.
Agriculture 15 02182 g005
Figure 6. The impact of 21-day and 30-day harvesting intervals on total protein contents in the shoots of Sarcocornia ecotypes VM, Shikmona (Shik), Megadim (Meg), Naaman (Naa), and Ruhama (Ruh) and Arthrocaulon macrostachyum (AM). Two sodium chloride levels were used in the supplied water (50 and 150 mM). The mean plus standard error (+SE) is shown. Different uppercase letters indicate significant differences between the same ecotypes across various harvesting intervals and salinity levels. Lowercase letters represent significant differences among the various ecotypes within the same harvesting interval and under different salinity treatments (Tukey’s HSD, p ≤ 0.05, n = 6). Representative data (of two independent experiments) are shown.
Agriculture 15 02182 g006
Figure 7. The impact of 21-day and 30-day harvesting intervals on total soluble sugar content (A) and electrical conductivity (B) in the shoots of Sarcocornia ecotypes VM, Shikmona (Shik), Megadim (Meg), Naaman (Naa), and Ruhama (Ruh) and Arthrocaulon macrostachyum (AM). Two sodium chloride levels were used in the supplied water (50 and 150 mM). The mean plus standard error (+SE) is shown. Different uppercase letters indicate significant differences between the same ecotypes across various harvesting intervals and salinity levels. Lowercase letters represent significant differences among the various ecotypes within the same harvesting interval and under different salinity treatments (Tukey’s HSD, p ≤ 0.05, n = 3–4). Representative data (of two independent experiments) are shown.
Agriculture 15 02182 g007
Figure 8. The impact of 21-day and 30-day harvesting intervals on anthocyanin levels in the shoots of Sarcocornia ecotypes VM, Shikmona (Shik), Megadim (Meg), Naaman (Naa), and Ruhama (Ruh) and Arthrocaulon macrostachyum (AM). Two sodium chloride levels were used in the supplied water (50 and 150 mM). Mean plus standard error (+SE) is shown. Different uppercase letters indicate significant differences between the same ecotypes across various harvesting intervals and salinity levels. Lowercase letters represent significant differences among the various ecotypes within the same harvesting interval and under different salinity treatments (Tukey’s HSD, p ≤ 0.05, n = 4). Representative data (of two independent experiments) are shown.
Agriculture 15 02182 g008
Figure 9. The impact of 21-day and 30-day harvesting intervals on total flavonoid levels in the shoots of Sarcocornia ecotypes VM, Shikmona (Shik), Megadim (Meg), Naaman (Naa), and Ruhama (Ruh) and Arthrocaulon macrostachyum (AM). Two sodium chloride levels were used in the supplied water (50 and 150 mM). The mean plus standard error (+SE) is shown. Different uppercase letters indicate significant differences between the same ecotypes across various harvesting intervals and salinity levels. Lowercase letters represent significant differences among the various ecotypes within the same harvesting interval and under different salinity treatments (Tukey’s HSD, p ≤ 0.05, n = 6). Representative data (of two independent experiments) are shown.
Agriculture 15 02182 g009
Figure 10. The impact of 21-day and 30-day harvesting intervals on total polyphenol content in the shoots of Sarcocornia ecotypes VM, Shikmona (Shik), Megadim (Meg), Naaman (Naa), and Ruhama (Ruh) and Arthrocaulon macrostachyum (AM). Two sodium chloride levels were used in the supplied water (50 and 150 mM). The mean plus standard error (+SE) is shown. Different uppercase letters indicate significant differences between the same ecotypes across various harvesting intervals and salinity levels. Lowercase letters represent significant differences among the various ecotypes within the same harvesting interval and under different salinity treatments (Tukey’s HSD, p ≤ 0.05, n = 6). Representative data (of two independent experiments) are shown.
Agriculture 15 02182 g010
Figure 11. The impact of 21-day and 30-day harvesting intervals on DPPH radical scavenging activity in fresh shoots of Sarcocornia ecotypes VM, Shikmona (Shik), Megadim (Meg), Naaman (Naa), and Ruhama (Ruh) and Arthrocaulon macrostachyum (AM). Two sodium chloride levels were used in the supplied water (50 and 150 mM). The mean plus standard error (+SE) is shown. Different uppercase letters indicate significant differences between the same ecotypes across various harvesting intervals and salinity levels. Lowercase letters represent significant differences among the various ecotypes within the same harvesting interval and under different salinity treatments (Tukey’s HSD, p ≤ 0.05, n = 6). Representative data (of two independent experiments) are shown.
Agriculture 15 02182 g011
Figure 12. Malondialdehyde levels in shoots of Sarcocornia ecotypes VM, Shikmona (Shik), Megadim (Meg), Naaman (Naa), and Ruhama (Ruh) and Arthrocaulon macrostachyum (AM) at two different harvesting intervals (21-day and 30-day) with two different salinity levels (50 and 150 mM) treatments. The mean plus standard error (+SE) is shown. Different uppercase letters indicate significant differences between the same ecotypes across various harvesting intervals and salinity levels. Lowercase letters represent significant differences among the various ecotypes within the same harvesting interval and under different salinity treatments (Tukey’s HSD, p ≤ 0.05, n = 4). Representative data (of two independent experiments) are shown.
Agriculture 15 02182 g012
Table 1. Ecotype designation, collection site, habitat, date of collection, and collectors.
SpeciesEcotype DesignationMap Coordinates of Sampling SitesDate of CollectionCollectors or Source ReferenceHabitat
1Sarcocornia fruticosaVM31° N2011[15]Inland salt pan, Negev area
2Sarcocornia fruticosaShikmona (Shik)32.8261, 34.9576810 November 2020Sagi and Shpigel laboratoriesCoastal, tidal area
3Sarcocornia fruticosaMegadim (Meg)32.73940, 34.9506710 November 2020Sagi and Shpigel laboratoriesCoastal, supratidal area, no tidal flooding
4Sarcocornia fruticosaNaaman (Naa)32.91284, 35.0855110 November 2020Sagi and Shpigel laboratoriesCoastal, tidal area
5Sarcocornia fruticosaRuhama (Ruh)32.71746, 34.9485510 November 2020Sagi and Shpigel laboratoriesCoastal, tidal area
6A. macrostachyumA. macrostachyum (AM)30.96463, 35.371966 August 2020Sagi and Shpigel laboratoriesDead Sea shore
Table 2. Correlation analysis between the detected traits (correlations marked with asterisks are significant at p < 0.05, N = 72).
VariableCorrelations Marked with Asterisks Are Significant at p < 0.05000 N = 72.
Total
Chlorophyll
Total CarotenoidTotal PolyphenolTotal FlavonoidDPPHTotal ProteinShoot DiameterTSSRWCAnthocyaninECFWMDA
Total chlorophyll1.0000.908 *0.1660.337 *0.313 *0.1790.397 *0.411 *0.548 *0.319 *0.333 *0.257 *−0.645 *
Total carotenoid0.908 *1.0000.1510.432 *0.364 *0.317 *0.367 *0.475 *0.468 *0.2120.365 *0.330 *−0.496 *
Total polyphenol0.1660.1511.0000.645 *0.763 *0.333 *0.286 *−0.1150.077−0.410 *−0.388 *−0.064−0.182
Total flavonoid0.337 *0.432 *0.645 *1.0000.919 *0.732 *0.538 *0.0250.215−0.329 *−0.1020.285 *−0.137
DPPH0.313 *0.364 *0.763 *0.919 *1.0000.565 *0.517 *−0.0150.320 *−0.379 *−0.293 *0.144−0.183
Total protein0.1790.317 *0.333 *0.732 *0.565 *1.0000.114−0.1170.087−0.207−0.098−0.0310.205
Shoot diameter0.397 *0.367 *0.286 *0.5388 *0.517 *0.1141.0000.417 *0.1720.0630.366 *0.774 *−0.532 *
TSS0.411 *0.475 *−0.1150.025−0.015−0.1170.417 *1.0000.1860.2130.719 *0.601 *−0.354 *
RWC0.548 *0.468 *0.0770.2150.320 *0.0870.1720.1861.0000.278 *−0.084−0.070−0.333 *
Anthocyanin0.319 *0.212−0.410 *−0.329 *−0.379 *−0.2070.0630.2130.278 *1.0000.402 *0.193−0.342 *
EC0.333 *0.365 *−0.388 *−0.102−0.293 *−0.0980.366 *0.719 *−0.0840.402 *1.0000.703 *−0.312 *
FW0.257 *0.330 *−0.0640.285 *0.144−0.0310.774 *0.601 *−0.0700.1930.703 *1.000−0.410 *
MDA−0.645 *−0.496 *−0.182−0.137−0.1830.205−0.532 *−0.354 *−0.333 *−0.342 *−0.312 *−0.410 *1.000
Disclaimer/Publisher’s Note: The statements, opinions and data contained in all publications are solely those of the individual author(s) and contributor(s) and not of MDPI and/or the editor(s). MDPI and/or the editor(s) disclaim responsibility for any injury to people or property resulting from any ideas, methods, instructions or products referred to in the content.