Article

Characteristics of the Spatiotemporal Evolution and Driving Mechanisms of Soil Organic Matter in the Songnen Plain in China

1
State Key Laboratory of Black Soils Conservation and Utilization, Northeast Institute of Geography and Agroecology, Chinese Academy of Sciences, No. 138 Haping Road, Nangang District, Harbin 150081, China
2
Northeast Institute of Geography and Agroecology, University of Chinese Academy of Sciences, Beijing 100049, China
3
School of Environment, Beijing Normal University, No. 19 Xinjiekouwai St, Haidian District, Beijing 100875, China
4
College of Resources and Environment, Northeast Agricultural University, No. 600 Changjiang Road, Xiangfang District, Harbin 150030, China
*
Authors to whom correspondence should be addressed.
Agriculture 2025, 15(20), 2156; https://doi.org/10.3390/agriculture15202156
Submission received: 9 September 2025 / Revised: 29 September 2025 / Accepted: 11 October 2025 / Published: 17 October 2025
(This article belongs to the Section Agricultural Soils)

Abstract

Soil organic matter (SOM) is a key component of nutrient cycling and soil fertility in terrestrial ecosystems. SOM is of great significance to the stability of terrestrial ecosystems and the improvement of soil productivity; to further exert its role, it is first necessary to clarify its actual distribution and occurrence status in specific regions. Under the combined impacts of intensive agriculture, unreasonable farming practices, and climate change, the SOM content in the Songnen Plain is showing a degradation trend, posing multiple stresses on its soil ecosystem functions. This study aims to systematically track the dynamic changes of SOM in the Songnen Plain, assess its spatiotemporal evolution characteristics, and reveal its driving mechanisms. A total of 113 representative soil profiles were selected in 2023; standardized excavation and sampling procedures were employed in the Songnen Plain. Soil pH, SOM, total nitrogen (TN), total phosphorus (TP), total potassium (TK), particle size (PSD), texture, and Munsell soil colors of samples were determined. Temporal variation characteristics, as well as horizontal and vertical spatial distribution patterns, in SOM content in the Songnen Plain were assayed. Structural equation modeling (SEM), together with freeze–thaw of soil and soil color mechanism analyses, was applied to reveal the spatiotemporal dynamics and driving mechanisms of SOM. The result indicated that the distribution pattern of SOM content in horizontal space shows higher levels in the northeastern region and lower levels in the southwestern region, and decreased with increasing soil depth. SEM analysis indicated that TN and PSD were the main positive factors, whereas bulk density exerted a dominant negative effect. The ranking of contribution rates is TN > TK > TP > PSD > annual average temperature > annual precipitation > bulk density. Mechanistic analysis revealed a significant negative correlation between SOM content and R, G, B values, with soil color intensity serving as a visual indicator of SOM content. Freeze–thaw thickness of soil was positively correlated with SOM content. These findings provide a scientific basis for soil fertility management and ecological conservation in cold regions.

1. Introduction

Soil organic matter (SOM), as a key component of the solid phase of soil, plays a central role in the material cycling and energy flow of terrestrial ecosystems [1], and directly affects the level of soil fertility and the realization of ecological functions. The Songnen Plain, an important commodity grain production base in China, has its soil quality playing a crucial role in safeguarding national food security [2]. In recent years, affected by the combined impacts of long-term intensive agricultural activities, irrational farming practices, and climate change, the content of SOM in this region has shown a significant downward trend [3]. This change not only leads to reduced soil capacity for retaining nutrients and water, soil structure degradation, and poor aeration and water permeability, but also weakens soil microbial activity, posing a threat to the stability and functional integrity of the soil ecosystem, and thereby restricting the sustainable development of regional agriculture. Therefore, conducting in-depth research into the evolution patterns and driving mechanisms of SOM in the Songnen Plain is of urgent and significant practical importance for formulating scientifically sound and effective strategies for improving and conserving soil quality, thereby ensuring high yields, stable production, and sustainable development of regional agriculture [4].
The Songnen Plain exhibits a complex geographical setting with pronounced spatial heterogeneity in climate, topography, and human activities. Together with dynamic shifts in agricultural practices, these conditions lead to the complex evolution patterns of SOM being observed both in terms of time and space scales [5]. The dynamic evolution of SOM is a complex process driven by the synergistic effects of diverse environmental and anthropogenic factors [6]. Identifying the key drivers and mechanisms of SOM dynamics provides the theoretical foundation for improving soil fertility and optimizing ecosystem functions in the Songnen Plain [7]. Previous studies have conducted multi-dimensional explorations of the spatiotemporal distribution of SOM and its influencing factors in the Songnen Plain. For instance, in terms of the spatiotemporal distribution of SOM, Jiang et al. [8] used data from the Second National Soil Survey of China (1980s) and 2015 field surveys to examine soil organic carbon (SOC) density in the 0–10 cm layer of farmland soils across the Songnen Plain. They reported that over the past 35 years, 81.59% of the farmland SOC density has shown a downward trend. Qin et al. [9] analyzed data from the 1980s and the Northeast China Farmland Fertility Survey (in 2015) to assess SOM dynamics and influencing factors in the black soil region of the Songnen Plain. They observed that SOM content declined across each city compared with the 1980s, with higher levels in the northeast and lower levels in the southwest. They further identified effective accumulated temperature, elevation, latitude–longitude, and annual precipitation as key drivers of SOM variability, with accumulated temperature exerting the strongest influence. Using principal component analysis and geographically weighted regression, Liu [10] demonstrated that 0.05–2 mm sand particles, temperature, and fertilizer input are the dominant factors controlling SOC. However, there are still many shortcomings in the current research. In particular, systematic tracking of SOM dynamic evolution over the past decade is lacking. At the spatial scale, most studies on vertical profiles have focused on surface soils, while knowledge of the dynamic processes, migration, and transformation of SOM in deeper layers remains limited. Regarding influencing factors, most studies have mainly relied on single-factor or simple linear relationship analysis. Such approaches hinder the quantification of direct and indirect pathways among multiple drivers and limit understanding of their synergistic effects in complex ecosystems [11]. Moreover, the research on the influence mechanisms of key elements such as soil color and freeze–thaw processes, which have regional characteristics, is still in the exploratory stage and has not yet formed a systematic understanding.
Building on previous research, this study addresses existing shortcomings by integrating soil survey data from three key periods: the 1980s, 2015, and 2023. The aim is to construct a long-term time-series dataset to systematically track SOM dynamics over the past decade and evaluate their temporal evolution. In addition, by combining vertical stratification of soil profiles with regional horizontal distribution, this study moves beyond surface soil research to examine the spatial evolution and migration–transformation mechanisms of SOM in deeper layers. Furthermore, structural equation modeling (SEM) is applied to quantify the direct and indirect influence pathways of seven key factors: precipitation, mean annual temperature (MAT), bulk density, total nitrogen (TN), total phosphorus (TP), total potassium (TK), and particle size distribution (PSD). This comprehensive analysis highlights the synergistic effects among multiple factors, with particular attention to soil color responses to SOM and the regulatory role of freeze–thaw thickness in SOM decomposition, transformation, and migration. These insights advance systematic understanding of key regional mechanisms. The findings provide a theoretical basis and practical guidance for improving SOM management and promoting sustainable agriculture in the Songnen Plain.

2. Materials and Methods

2.1. Study Area

The Songnen Plain is the largest part of the Northeast Plain, spanning across Heilongjiang and Jilin Provinces. It lies in the central Songliao Basin, bordered by the Greater and Lesser Khingan Ranges, the Changbai Mountains, and the Songliao Watershed. Formed primarily by the alluvial deposits of the Songhua and Nenjiang Rivers, the plain covers an area of approximately 200,000 km2. As a key section of the Northeast Plain, it plays a role of significant agricultural and ecological importance. The study area is located in the Songnen Plain of Northeast China (42°30′–51°20′ N, 122°40′–128°30′ E), with 113 sampling sites established in the region (Figure 1).
The Songnen Plain is characterized by relatively flat terrain and a temperate continental monsoon climate that is semi-humid and semi-arid, with marked contrasts between wet and dry seasons. Annual precipitation ranges from 400 to 600 mm [12]. The plain slopes gradually from the northeast to the southwest, with elevations ranging from 98 to 1692 m. The landforms are primarily plains, consisting of northeastern mountainous and hilly zones and southwestern alluvial plains, while soils are dominated by black soil and black calcareous soil. The mean annual wind speed is 3.4–4.4 m·s−1 [13], and temperatures range from −16 °C to 26 °C. Precipitation is concentrated in June–August, peaking in July with an average of 156.04 mm, whereas February records only 9.72 mm, yielding a monthly difference of 146.32 mm. On an annual basis, the mean precipitation is 598.29 mm [14]. The soils of the Songnen Plain are nutrient-rich, contain high levels of SOM, and have strong water and nutrient retention capacities. They are primarily used for agriculture and support diverse crop production, making the Songnen Plain one of the most important agricultural soil resources in Heilongjiang Province.

2.2. Soil Samples

This study focuses on the Songnen Plain. Based on the collection of relevant data, a preliminary survey of soil distribution was conducted to analyze soil type patterns in the study area. A total of 113 representative soil profiles were selected in 2023, considering different landform units, land use types, and soil development conditions. Standardized excavation and sampling procedures were employed. Each profile measured 2–4 m in length, 1.2–1.5 m in width, and 1.2–2.0 m in depth. After excavation, the left one-third of the profile was prepared as a natural surface using a profile knife, while the right side was smoothed. GPS positioning was used to determine the latitude and longitude of each sampling point, providing spatial information for subsequent analysis. During sampling, a ruler was placed from top to bottom, and stratification was carried out according to soil horizon characteristics.
At every sampling location, soil cores were collected using a stainless steel corer that was 100 cm in length and had a 4 cm diameter. Each soil sample was a composite of 5 sub-samples with more than 5 m between each pair of sub-samples, and all sub-samples were collected from the different soil depths. All these sub-samples were gathered within a 10 m × 10 m zone at each site, and the distance from each sampling point to the trunk of nearby trees was kept over 1 m. Finally, samples were collected sequentially from top to bottom at four depth intervals: 0–20 cm, 20–60 cm, 60–100 cm, and 100–130 cm, in order to capture variations in soil physical and chemical properties with depth. Soil samples were divided into analytical and reference groups according to their respective soil horizons.
All collected soil samples were placed into iceboxes and transported to the laboratory. Upon arrival, they were sieved through a sieve with a mesh size of <2 mm to eliminate stones, root pieces, and large organic residues. After being thoroughly homogenized, each sample was split into two sub-samples. One sub-sample was stored at 4 °C for the analysis of SOC and TN. The other sub-sample was air-dried at ambient temperature, which was later used to determine soil pH and TP. Subsequently, a portion of each air-dried soil sample was ground and passed through a 0.15 mm sieve; this processed soil was then used to determine the contents of SOC, TN, and TP.

2.3. Soil Property Measurement

Soil pH was measured in a 1:2.5 (weight/volume) soil/water suspension with a pH meter (Mettler Toledo FE20, Shanghai, China). SOC and TN were assayed with a C/N analyzer (VarioEL III, Germany, Berlin). TP was determined via flame photometry (FP640, Shanghai Precision Instrument Co., Shanghai, China). For this analysis, potassium chloride (KCl) standard solutions were prepared for calibration curve construction, and sample K+ concentrations were measured against these standards. TK was determined by flame photometry after fusion with sodium hydroxide. Soil texture was determined using direct methods, which involved measuring the mass of oven-dried soil samples and their volume (obtained by measuring the dimensions of the sampling cylinder, or quantifying sand/water displacement). Common approaches include the core method, in which the mass of oven-dried soil is weighed and the total volume (including air and moisture) is measured indirectly; bulk density is then calculated using the corresponding formula. Munsell soil colors were determined by skilled personnel under natural daylight using the 43.

2.4. Data Source

The mean values and percentage distribution of SOM during the 1980s in different regions of the Songnen Plain were obtained from soils of Heilongjiang [15], soils of Inner Mongolia [16], and soils of Jilin [17]. The classification standards for SOM were based on Reference [18], which, based on the existing Chinese classification system, divided farmland SOM in the Songnen Plain into six levels: Grade I (≥40 g·kg−1, extremely rich), Grade II (30–40 g·kg−1, rich), Grade III (20–30 g·kg−1, moderate), Grade IV (10–20 g·kg−1, relatively low), Grade V (6–10 g·kg−1, low), and Grade VI (<6 g·kg−1, extremely low).
Climatic parameters, including MAT and mean annual precipitation, were obtained for each site from the WorldClim global database (https://www.ncei.noaa.gov/access/metadata/landing-page/bin/iso?id=gov.noaa.ncdc:C00979, accessed on 12 August 2025) using data from 1951 to 2023 at a spatial resolution of 1 km.

2.5. Statistical Analysis

SEM was applied to test hypotheses concerning relationships among system components [19]. Unlike simple correlation analysis, SEM can comprehensively allow for a assessment of both direct and indirect effects among variables. This makes it particularly useful for exploring complex ecological systems where multiple interacting factors drive SOM dynamics. Because many factors influencing SOM (such as pH, annual precipitation, etc.) are interdependent, SEM provides a more nuanced understanding than simple correlation analysis [20]. SEM facilitates the study of complex ecological processes by modeling exogenous, endogenous, and latent variables, as well as their complex causal relationships, including direct, indirect, and total effects within interactive systems [21,22,23]. In analyzing SOM dynamics, measurement models evaluate accuracy and reliability by linking latent variables with observable indicators. The structural models, in contrast, describe causal relationships among latent variables. For SOM studies, factors such as MAT, annual precipitation (MAP), soil pH, and vegetation type can be treated as latent variables and included in structural models to explore the direct and indirect influence pathways of these factors on SOM content and composition.
In this study, an initial SEM was constructed using data on SOM content and its influencing factors from the Songnen Plain. The model incorporated key factors such as MAT, MAP, soil pH, and soil texture, etc. At the same time, potential interactions among these factors were also considered. The SEM was conducted with the software package AMOS 28.0 software (IBM; SPSS Inc., Chicago, IL, USA)

3. Results

3.1. Temporal Variation Characteristics of SOM Content in the Arable Layer of the Songnen Plain Soil

In 2023, SOM content in the Songnen Plain ranged from 2.24 to 79.65 g·kg−1. Among these, Baicheng City had the highest coefficient of variation for SOM content, reaching 71.28%, while Yushu City had the lowest coefficient of variation, only 3.73%. The results of the analysis of variance showed that the average SOM content in Heihe City was significantly higher than that in the other cities, at 57.09 g·kg−1, followed by Wudalianchi City and Hailun City. In contrast, the SOM content in Baicheng City was significantly lower than that in the other cities, with an average of 12.84 g·kg−1. There were no significant differences in SOM content between Suihua City and Qiqihar City, as well as between Yushu County and Dehui County.
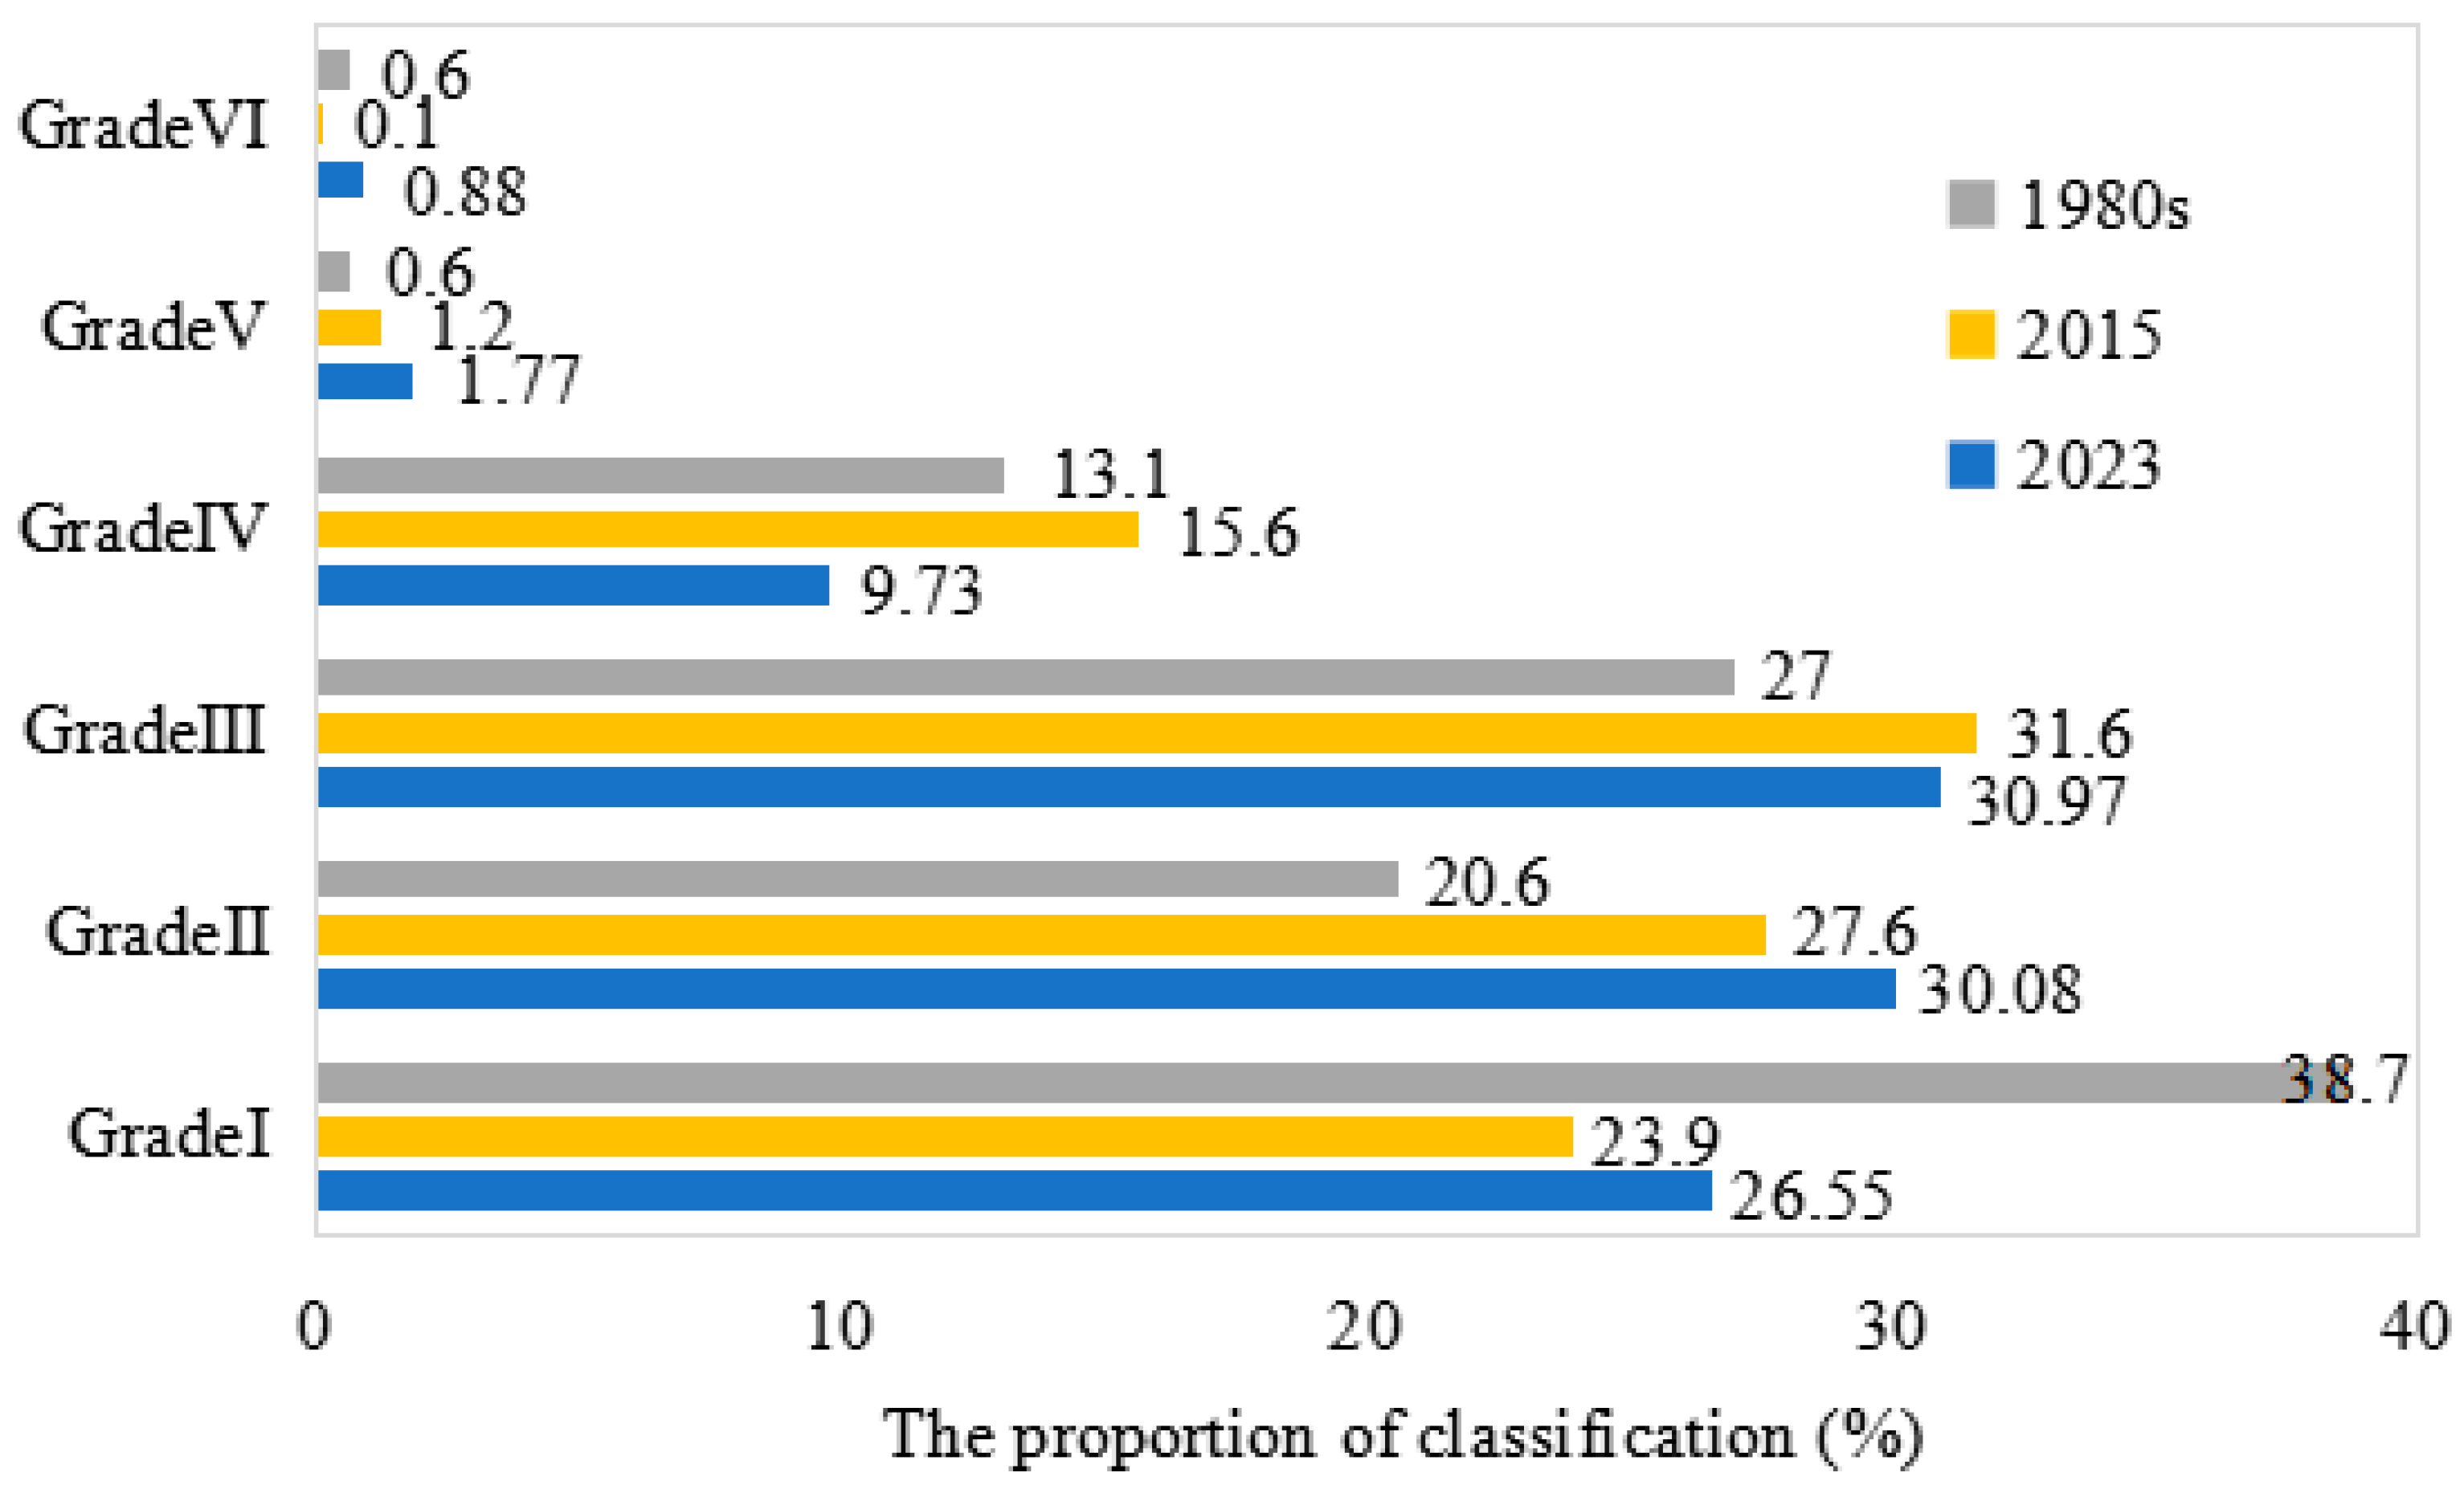
As shown in Figure 2, during the 1980s, the largest share of SOM in the black soil region of the Songnen Plain was at Level I (38.7%). The combined proportion of Levels I–III reached 85%. In 2015, Level III accounted for the largest proportion (31.6%), and the combined share of Levels I–III was about 83%. Compared with NLS II, the proportions in Levels I and VI declined by 14.8% and 0.2%, respectively, while the proportions of levels II, III, IV, and V increased to varying degrees, by 7.1%, 4.6%, 2.5%, and 0.5%, respectively. In 2023, Level III still accounted for the largest share (30.0%), representing a 0.6% decrease from 2015. Meanwhile, the proportion at Level IV decreased by 5.9%, whereas Levels I, II, V, and VI increased by 2.6%, 2.5%, 0.6%, and 0.8%, respectively.
Compared with 2015, the mean SOM content of farmland soils in Harbin City, Qiqihar City, and Suihua City declined in 2023 by 4.52, 2.93, and 5.75 g·kg−1, respectively. Over time, farmland is subject to erosion, and regions with different erosion intensities exhibit distinct changes in SOM, with stronger erosion causing greater losses of organic carbon [24]. At the same time, climate also plays a major role in SOM decomposition and oxidation. Studies indicate that rising temperatures and reduced MAP lower SOM content. This occurs because higher temperatures accelerate SOM decomposition, while lower MAP inhibits vegetation growth and reduces litter input [25], both of which are major sources of SOM. In contrast, SOM content in cultivated soils of other cities increased to varying degrees. Songyuan City showed the largest increase, reaching 44% (27.71 g·kg−1), followed by Heihe City and Changchun City, with increases exceeding 10% (5.95 and 3.69 g·kg−1).
Compared with the 1980s, the SOM content of farmland soils in Suihua and Baicheng City decreased in 2023. This decline is mainly attributed to the combined effects of human activities and natural factors. At an agricultural production level, long-term single-crop monoculture, as well as frequent plowing and turning, will reduce the stability of soil aggregates and destroy the soil granular structure, accelerating the oxidation and decomposition of SOM [26]. In addition, the extensive use of chemical fertilizers has replaced traditional organic amendments, creating a situation in which SOM consumption exceeds replenishment, ultimately leading to long-term deficits.
Among natural factors, wind erosion not only reduces SOM by promoting its gradual decomposition into CO2 but also by physically removing SOM from the soil surface [27]. Topsoil of sloping farmland, rich in SOM, is easily eroded by wind and rainfall, exposing infertile subsoil and further reducing overall SOM levels. Furthermore, grassland plowing and seeding temporarily reduce soil carbon storage by lowering primary productivity and increasing soil respiration [28]. These processes disrupt the natural input of SOM from vegetation litter, depriving the soil of an important source of carbon replenishment. Collectively, these factors contribute to the continuous decline of SOM in the Songnen Plain, highlighting the need for improved farming practices and greater use of organic amendments to mitigate this trend.

3.2. Characteristics of Changes in SOM Content in the Songnen Plain

3.2.1. Horizontal Spatial Distribution Pattern

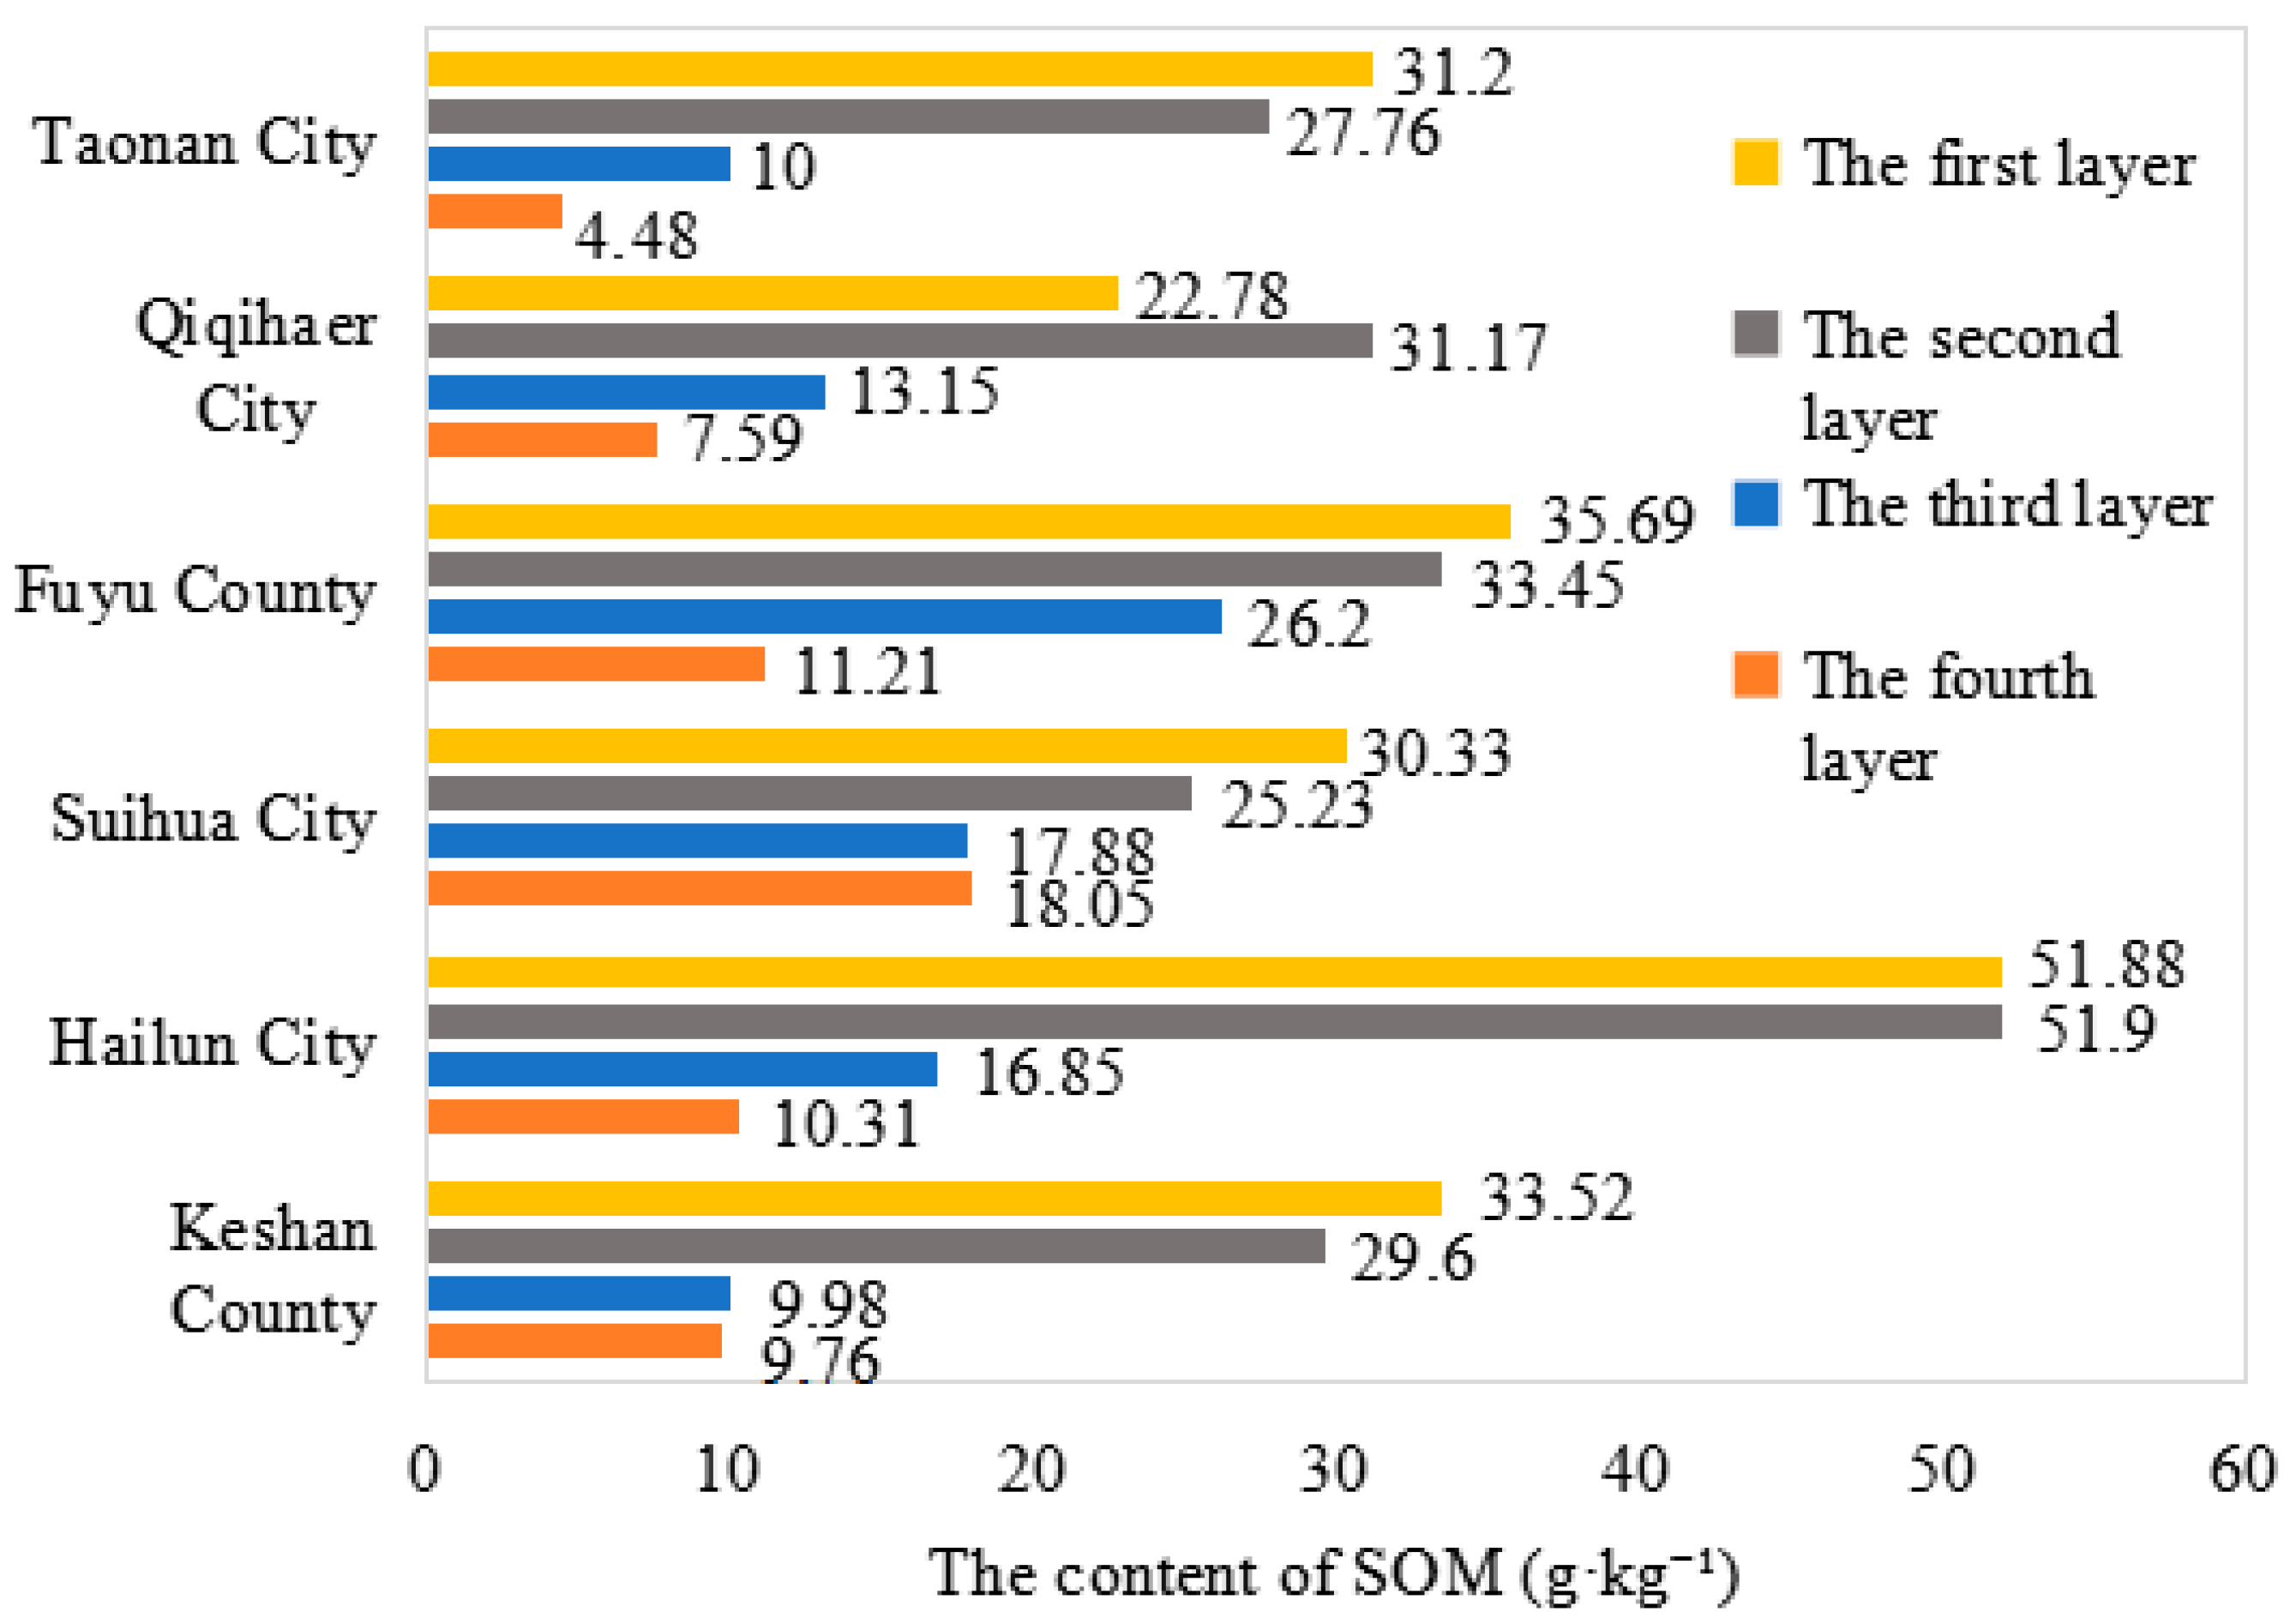
As shown in Figure 3, the SOM content in the Songnen Plain shows a clear spatial pattern of being higher in the northeast and lower in the southwest. In the northeast areas (e.g., Beian City, Keshan County, and Hailun City), the SOM is consistently higher across soil layers, whereas in the southwest areas (e.g., Taonan City and Changling County), levels are comparatively lower. Studies have shown that the Songnen Plain is located at the edge of the East Asian summer monsoon region and is particularly sensitive to monsoon variability [29,30]. Spatial variation of water and heat conditions is the main natural driving factor of SOM differences.
Among them, in the northeast, stronger monsoon influence results in higher MAP and lower evaporation. Adequate moisture enhances vegetation biomass, increasing SOM content through greater litter and root inputs [31]. In the southwest, low MAP and high evaporation suppress vegetation growth, reduce litter input, and lower SOM [32]. Temperature also plays a role. The northeast, with higher latitude and elevation, has lower MAT, which suppresses microbial activity and slows SOM decomposition, resulting in higher SOC accumulation [33]. In contrast, the southwest, with lower latitude and flatter terrain, has higher MAT, which accelerates SOM mineralization, and the retained content is lower. Topographic slope orientation further shapes SOM distribution. Northeastern slopes are predominantly shaded, with shorter sunlight exposure and better moisture, favoring meadow grasslands and deciduous broad leaf forests, which support high biomass and SOM accumulation [34]. In contrast, southwestern slopes are mainly sunny, warmer, and drier, with sparse vegetation and reduced SOM accumulation [35]. Human activities also further reinforce this imbalance. The northeast was developed later, with a shorter history of large-scale cultivation, resulting in less disturbance to native SOM and better preservation. By contrast, the southwest has a long cultivation history, where prolonged farming has degraded soil structure and accelerated SOM decomposition [36].

3.2.2. Vertical Spatial Distribution Pattern

As shown in Figure 3, analysis of data on SOM content of the four layers indicates a general decline in SOM content with increasing depth in the Songnen Plain. In the surface layer, SOM is replenished by continuous inputs of plant residues, including litter and root exudate, making it the primary source of SOM. In contrast, deeper layers receive very little fresh SOM, and at the same time, microbial activity remains relatively high, and repeated decomposition and transformation processes produce a more stable SOM pool. However, at greater depths (the fourth layer), the SOM accumulation declines sharply because of limited residue input and restricted microbial metabolism. Previous studies have showed that most SOM decomposes within the top 10 cm, generating soluble parts. Some migrate downward to deeper layers, while others are fixed in the surface soil [37]. This process results in relatively high organic carbon concentrations in surface soils and much lower levels at depth. Moreover, microorganisms in surface soils primarily utilize plant-derived carbon. With increasing depth of soil, SOM itself gradually becomes the dominant carbon source [38], leading to reduced SOM content in deeper soil layers. However, the vertical decline varies regionally, with some areas showing only minor reductions in deep SOM content. This pattern may be linked to the distinctive physical and chemical properties of the parent material.

3.3. Structural Equation Model

In the SEM developed for SOM and its relative factors in the Songnen Plain, path coefficients—key parameters ranging from −1 to 1 that quantify the strength and direction of causal relationships—were estimated (Figure 4). The absolute value indicates the strength of the effect [39]. The results revealed a strong positive effect of TN on SOM, whereas bulk density exhibited a significant negative effect, as indicated by its negative path coefficient. The relative contributions of influencing factors to SOM content, ranked by the absolute values of their standardized path coefficients, were as follows: TN > TK > TP > PSD > MAT > MAP > bulk density.
SEM further indicates that bulk density exerts a significant direct negative effect on SOM. Higher temperatures enhance soil moisture loss, causing particles to contract and compact, thereby increasing bulk density [40]. In contrast, MAP moistens the soil; promotes root growth and soil fauna activities [41]; improves pore structure; and reduces bulk density. High bulk density deteriorates soil aeration, reduces aerobic microbial activities, and slows SOM decomposition [42].
Consistent with previous findings [20], MAT exerts a negative effect on SOM. In this study area, higher MAT stimulates microbial activity, promoting decomposition and mineralization of SOM and thereby leading to a decrease in SOM content [43]. Increased MAP saturates soil pores, creating favorable conditions for microbial activity that enhance metabolism and accelerate SOM mineralization. However, excessive MAP beyond vegetation demand and soil water-holding capacity inhibits root respiration, restricts plant growth, and reduces SOM input from plant residues.
This study indicates that MAP and MAT not only directly affect the content of SOM but also indirectly influence it by regulating the contents of N, P, K, and soil particle size composition and bulk density. In the Songnen Plain, where MAT is below 10 °C, soil TN content is strongly correlated with MAT [44]. Higher temperatures enhance the activity of ammonifying and nitrifying bacteria, accelerating the mineralization of organic nitrogen into inorganic forms. However, inorganic nitrogen is easily lost through leaching or volatilization during MAP, thereby reducing TN [45]. At the same time, higher MAP raises soil moisture, stimulating nitrogen-fixing microorganisms (e.g., rhizobia and free-living diazotrophs), increasing soil TN [46]. When temperature rises or MAP decreases, soil TN declines. Microorganisms unable to use organic nitrogen then decompose SOM to obtain nitrogen, further reducing SOM content [47].
Regarding TP, higher temperatures enhance soil moisture evaporation, driving dissolved phosphorus upward with capillary water toward the surface. Under alkaline conditions, this phosphorus readily precipitates, reducing available P content [48]. Rainfall infiltration accelerates the hydrolysis of P-bearing minerals, releasing soluble P into the soil [49]. When temperature rises and MAP declines, TP decreases. Microorganisms then decompose SOM to obtain phosphorus, further reducing SOM.
Regarding TK, higher temperatures promote transpiration, leading to greater passive uptake of K+ by plant roots and a reduction in soil TK [50]. MAP enhances hydration of K-bearing minerals (e.g., feldspar, mica), releasing K+ into the soil [51]. In addition, K+ in soil colloids exchanges with negatively charged sites on SOM, promoting humus desorption into solution and accelerating its decomposition [52]. Therefore, higher temperature and reduced MAP deplete K+ on soil colloids, indirectly accelerating SOM decomposition.
Regarding PSD, higher temperatures induce frequent thermal expansion and contraction of soil minerals, accelerating sand particle formation [53]. The surface runoff formed by MAP removes sand particles while retaining clay and silt. Since clay and silt can protect SOM from microbial decomposition through adsorption and agglomeration, whereas sand lacks this capacity, higher temperature and reduced MAP will be unfavorable for the retention of fine particles, making SOM more prone to decomposition.
The SEM analysis clearly distinguished the direct and indirect influencing factors of SOM. Among the direct factors, MAT exerted a negative effect, whereas MAP exerted a positive effect. Among the indirect factors, TN and PSD showed positive effects, while TP, TK, and bulk density showed negative effects. Future studies can further consider the combined effects of additional environmental and biological variables, as well as the differences in different ecosystems and geographical regions, to develop a more comprehensive understanding of SOM dynamics. Such efforts would provide a stronger scientific basis for soil fertility management and ecosystem protection.

4. Discussion

4.1. Soil Color Response Mechanism

Soil color is an important indicator of SOM content, and its variation is closely related to SOM content, mineral composition, and hydrological conditions. Studies have shown that dark-colored soils generally contain higher SOM content and greater water-holding capacity [54]. If the soil contains hematite, it appears red, and if it contains goethite, it appears bright yellow [55]. Thus, soil color is strongly linked to pedogenesis. Soil color also provides a rapid and effective proxy for predicting SOM content in different land use types. Darkening of surface soils from SOM accumulation, together with vertical differentiation within the profile, serves as a visible indicator of SOM spatial distribution. Comparison of infertile and fertile fields shows that as SOM declines through degradation, the underlying mineral colors masked by SOM become visible. Thus, soil color is an important visual indicator of soil quality [56].
The widely used Munsell color system quantifies hue, lightness, and chroma to convert soil color into measurable indicators. Due to the use of visual color comparison, there is a certain degree of error. Therefore, we use the soil red (R), green (G), and blue (B) values as auxiliary tools to help visualize soil color. However, visual color matching introduces some degree of error. To reduce this limitation, soil R, G, and B values were used as auxiliary indicators to visualize soil color. RGB values, widely applied in digital imaging, describe soil color as numerical combinations of R, G, and B channels. First, SOM and RGB values were examined using a 3D scatter plot (as shown in Figure 5), where sphere size indicates SOM content. The plot shows that the SOM decreases as RGB values increase. Secondly, a linear regression analysis is conducted between the two (as shown in Figure 6), and it can be concluded that there is a significant negative correlation between SOM content and R, G, and B values; that is, the higher the SOM content, the lower the R, G, and B values of the soil.
The response of soil color to SOM reflects the combined effects of humic light absorption and mineral coloration. Bowers and Hanks [57] reported a significant correlation between SOM and soil reflectance in the visible spectrum. SOM content is also correlated with specific wavelength regions, including ultraviolet (376.8 nm), visible (616.5 nm), and near-infrared (724.1 nm) [58]. Owing to its conjugated double bonds (e.g., C=C, C=O) and quinone–phenol electron transfer systems, humus exhibits strong charge-transfer absorption in the 400–700 nm visible range, reducing soil reflectance and lowering R, G, and B values. Among these, the G channel is less sensitive, so soils with high SOM appear dark brown to blackish-brown. When the SOM content decreases, its light absorption effect weakens, increasing soil reflectance in the red and blue spectra and raising G and B values. Hematite primarily absorbs light near 550 and 880 nm (red), whereas goethite absorbs near 480 and 920 nm (yellow–brown) [59]. The strong reflectance of hematite in the red band markedly elevates the R value, whereas moderate reflectance of goethite in the yellow band raises the G value. The increase in R exceeds that of G and B, giving soils with low SOM a light brown to yellow hue and further reinforcing the linkage between color and SOM. Beyond its role as a nutrient reservoir, SOM is essential for soil aggregate formation, water retention, and heavy metal immobilization owing to its strong adsorption and colloidal properties.

4.2. Analysis of Soil Freeze–Thaw Mechanisms

Soil freeze–thaw processes not only affect SOM content, but also have an impact on other indicators of soil fertility. For example, the alternating freeze–thaw cycles may reduce the content of NO3-N in the soil while increasing the content of NH4+-N [60]. These changes will affect the soil N status, thereby influencing the plant growth and overall fertility of the soil. Frost layer thickness regulates SOM decomposition by altering soil structure and respiration. Warmer soils typically decompose SOM more rapidly, whereas colder soils retain more due to slower decomposition [61]. Freeze–thaw cycles can disrupt soil aggregates, plant materials, and microbial cells, thereby increasing substrate availability for microbial substrates. When soil moisture freezes, ice crystals form in pores and compress soil particles, reducing porosity and aeration. Oxygen deprivation inhibits aerobic microbes, lowering soil respiration, reducing microbial activity, and slowing SOM decomposition [62].
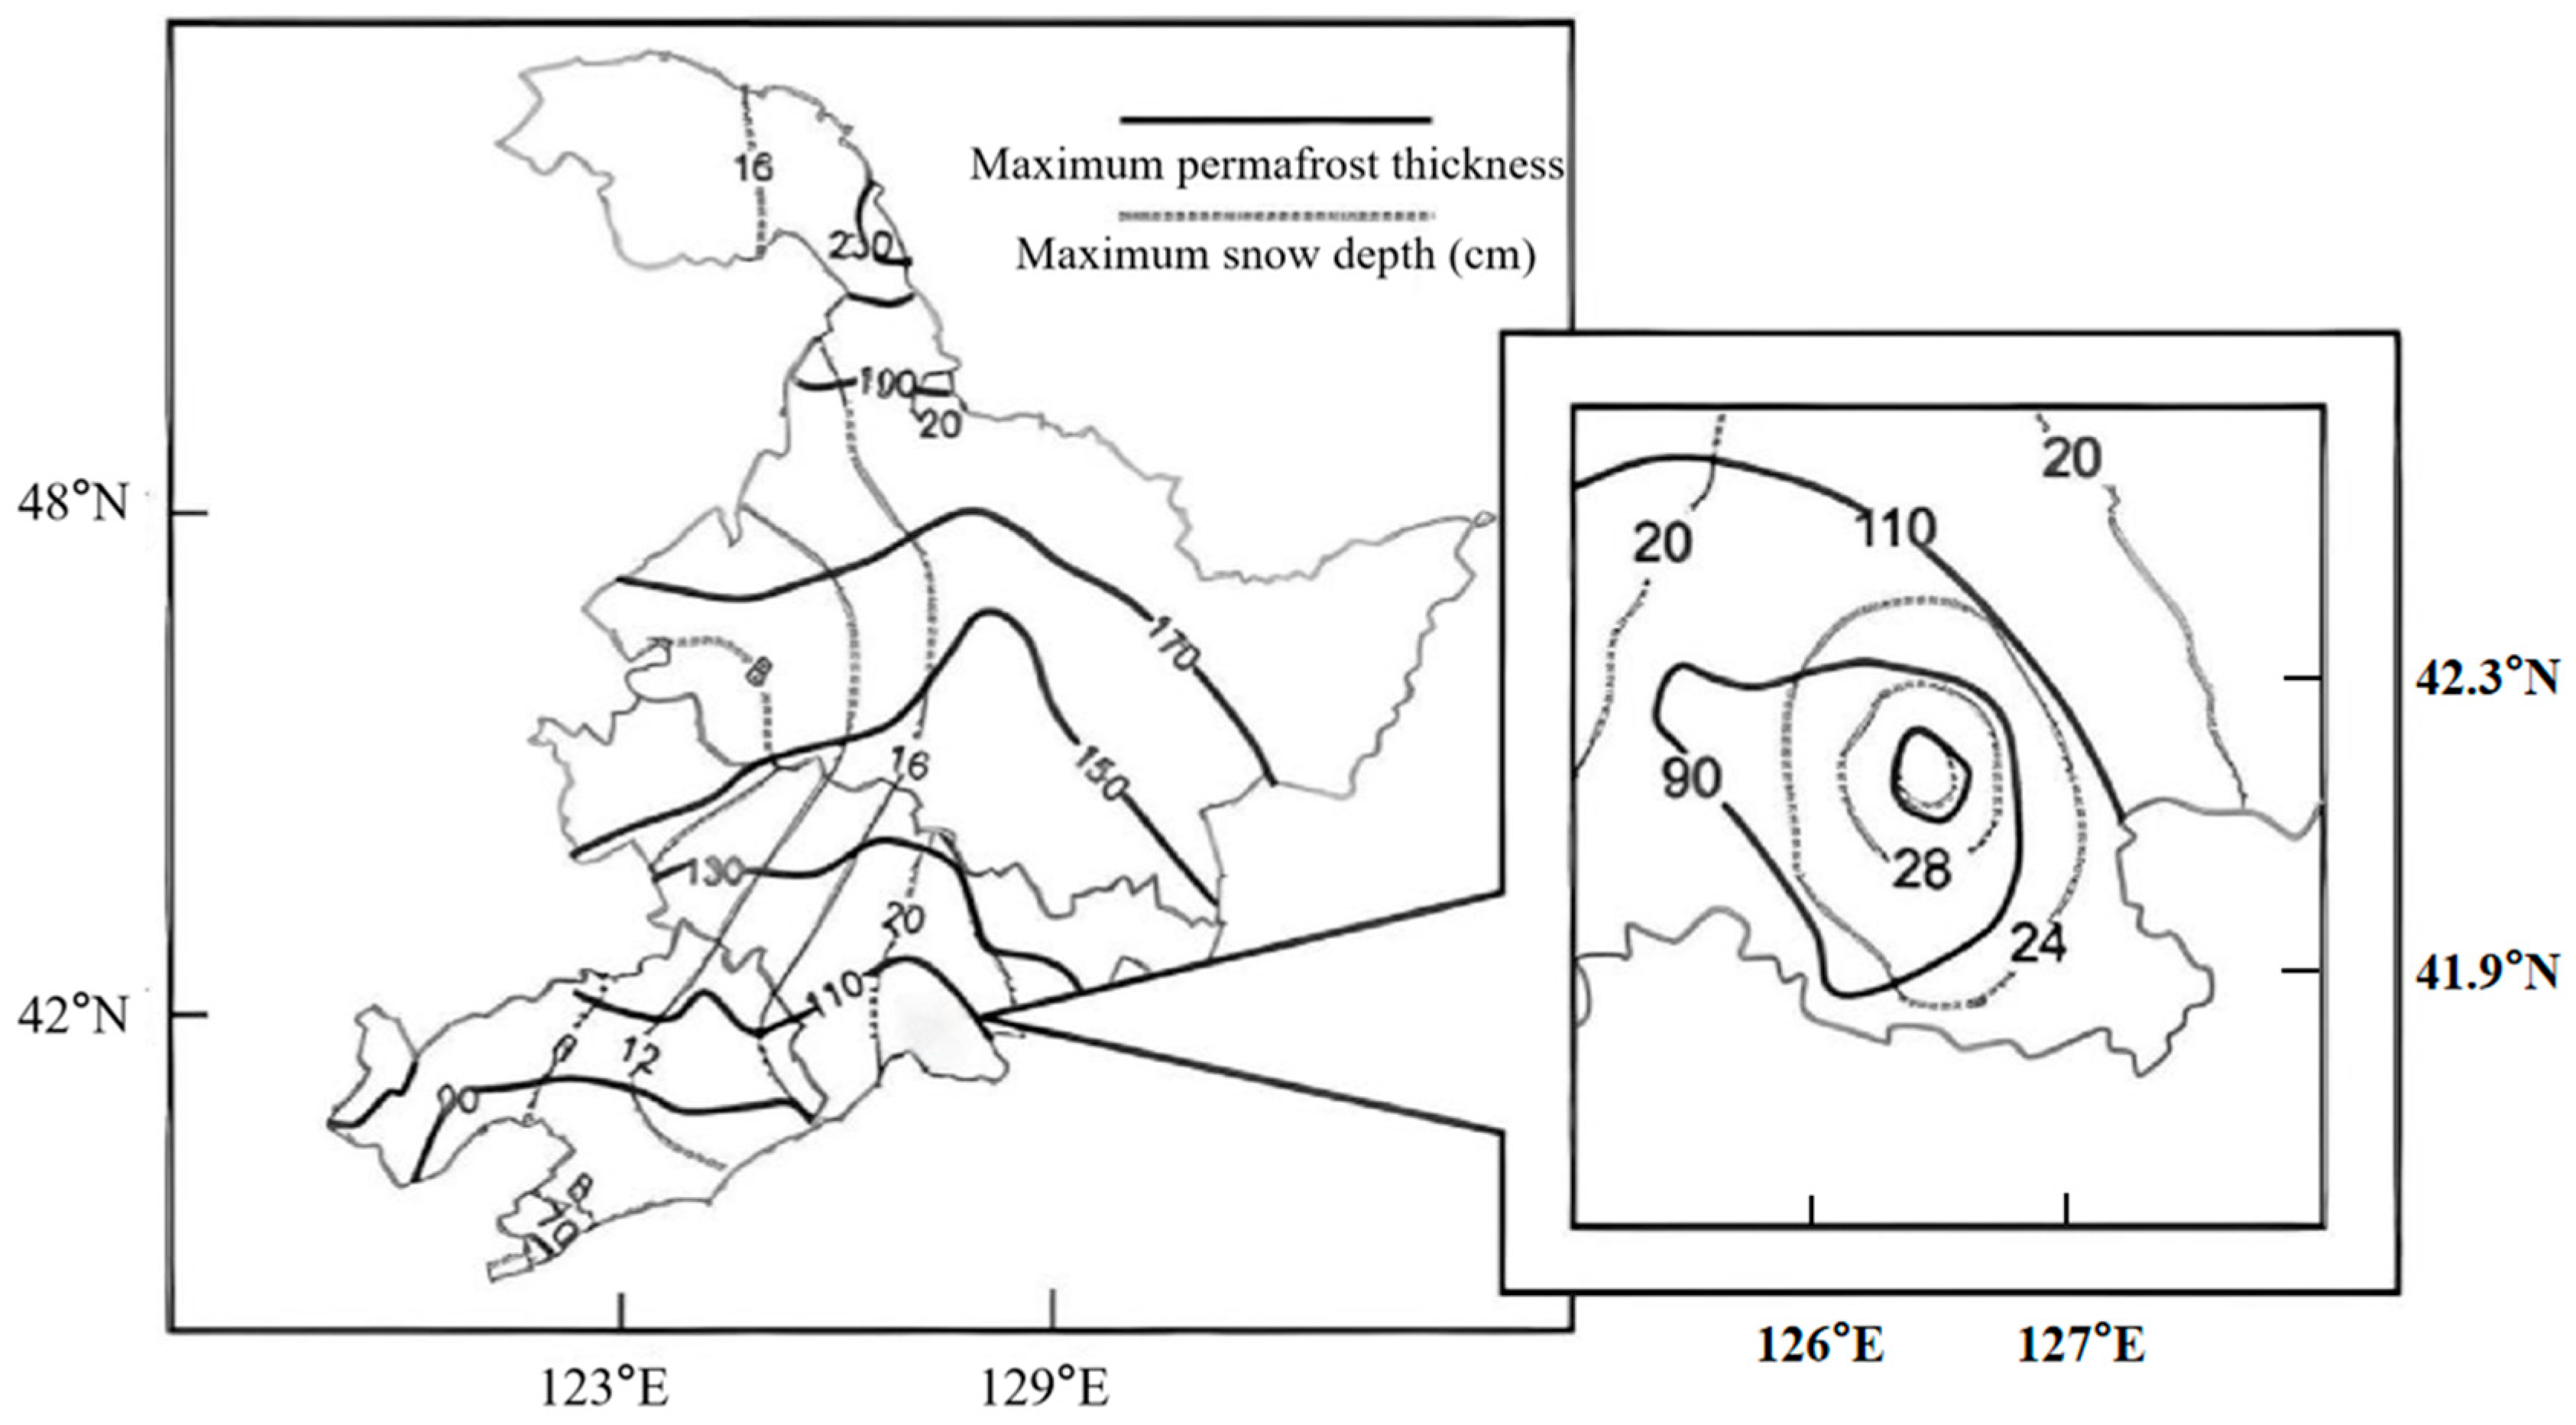
As shown in Figure 7, through spatial distribution matching analysis, it is found that in regions with thick permafrost and deep snow cover, the soil freeze–thaw thickness is correspondingly thicker, and the SOM content is also at a relatively high level. Local-scale analysis further showed that sites with pronounced freeze–thaw features also had higher SOM content. In the north of Songnen Plain (e.g., Heihe City and Hailun City), thawing depth typically ranges from 220 to 260 cm, with SOM content exceeding 50 g·kg−1. In contrast, in the south of Songnen Plain (e.g., Qiqihar City and Songyuan City), freeze–thaw depth is generally <200 cm, with SOM content around 20–30 g·kg−1.
This occurs because a thicker freeze–thaw layer prolongs low-temperature periods, suppresses microbial activity, slows SOM decomposition, and promotes accumulation. Moreover, black soils undergo strong humidification, producing deep layers rich in SOM with abundant reserves. Prolonged freeze–thaw cycles also promote soil aggregate formation [63]. Studies have shown that aggregates protect SOM from microbial decomposition by providing a physical barrier that reduces decomposition and leaching losses [64]. Furthermore, water migration during freeze–thaw may enhance binding between SOM and minerals, forming stable organo-mineral complexes. Comprehensive analysis of the systematic data of soil freeze–thaw thickness and SOM content shows that the freeze–thaw thickness of the soil in the Songnen Plain and the SOM content present a significant positive correlation; that is, the thicker the freeze–thaw thickness, the higher the SOM content.
The SEM analysis indicated that bulk density exerted a significant negative direct effect on SOM, showing that soil compaction reduces SOM content. By restricting microbial activity and material exchange, bulk density becomes a key physical constraint on SOM accumulation. TN had a strong positive effect on SOM, highlighting that nutrient interactions directly promote SOM accumulation. The SOM content was negatively correlated with R, G, and B values, enabling estimation of SOM content through soil color. Meanwhile, freeze–thaw thickness in this area also positively influenced SOM content. Thicker layers prolonged low-temperature periods, suppressed microbial activity, slowed decomposition, and promoted SOM accumulation.

5. Conclusions

This study examined the characteristics of SOM in the black soil region of the Songnen Plain. In time-series SOM, content ranged from 2.24 to 79.65 g·kg−1 in 2023, with a relatively low overall coefficient of variation. From 2015 to 2023, Grade III SOM consistently dominated, while the proportions of Grade I, Grade II, Grade V, and Grade VI increased and Grade IV decreased. Spatially, SOM content in the Songnen Plain exhibited distinct vertical and horizontal variation. Vertically, it decreased as the depth of the soil layer increased, while horizontally it followed a “higher in the northeast, lower in the southwest” pattern.

Author Contributions

Y.W. and Y.C. contributed to the writing of the original draft. X.W., B.Z., Y.S. (Yining Sun), Y.Z. and Y.L. were responsible for conducting the experimental operations. Y.S. (Yueyu Sui) and Y.D. were responsible for the review and editing of the manuscript. All authors have read and agreed to the published version of the manuscript.

Funding

This research was financially supported by the National Key Research and Development Program of China (2021YFD1500102 and 2023YFD1500105); the National Science and Technology Basic Resources Survey Special Project (2021FY100400); and the International Partnership Project of Chinese Academy of Sciences (131323KYSB20210004).

Data Availability Statement

The original contributions presented in this study are included in the article; further inquiries can be directed to the corresponding author.

Conflicts of Interest

The authors declare no conflicts of interest.

References

  1. Wang, L.; Wang, X.; Kooch, Y. Remote Estimation of Soil Organic Carbon Under Different Land Use Types in Agroecosystems of Eastern China. J. Catena 2023, 231, 107369. [Google Scholar] [CrossRef]
  2. Cui, Y.J.; Song, C.W. Spatial Distribution Characteristics of Soil Nutrients in Typical Black Soil Area of the Songnen Plain. Mod. Agric. Sci. Technol. 2023, 16, 174–177. [Google Scholar]
  3. Yang, H.P.; Zhao, X.; Sun, J.J. Spatiotemporal Changes of Soil Organic Matter in the Songnen and Sanjiang Plains of Heilongjiang Province Over 40 Years. Geophys. Geochem. Explor. 2024, 48, 1103–1113. [Google Scholar]
  4. Chantigny, M.H.; Harrison-Kirk, T.; Curtin, D.; Beare, M. Temperature and Duration of Extraction Affect the Biochemical Composition of Soil Water-Extractable Organic Matter. Soil Biol. Biochem. 2014, 75, 161–166. [Google Scholar] [CrossRef]
  5. Zhang, M.W.; Wang, X.Q.; Zhou, Y.N.; Zhang, M.N.; Liu, H.J.; Yang, H.X.; Zeng, L.T.; Sun, X.L. Predicting Spatial–Temporal Soil Organic Matter Dynamics in a Mollisols Region of the Northern Songnen Plain, China, During 2009–2018 Using a Spectral-Temporal Feature Set. Geoderma 2025, 461, 117461. [Google Scholar] [CrossRef]
  6. Mikhailova, E.A.; Bryant, R.B.; De Gloria, S.D.; Post, C.J.; Vassenev, I.I. Modeling Soil Organic Matter Dynamics after Conversion of Native Grassland to Long-Term Continuous Fallow Using the CENTURY Model. Ecol. Modell. 2000, 132, 247–257. [Google Scholar] [CrossRef]
  7. Liu, Y.; Lü, J.S.; Zhang, B.; Li, Y.; Wang, Z.; Ren, C. Spatio-Temporal Variation of Soil Organic Matter and its Influencing Factors in the Black Soil Region of the Songnen Plain, Northeast China. Catena 2025, 244, 108–119. [Google Scholar]
  8. Jiang, L.; Zang, S.; Zhang, L.; Sun, L.; Yan, B. Temporal and Spatial Variations of Organic Carbon and Evaluation of Carbon Sequestration Potential in the Agricultural Topsoil of the Songnen Plain. Acta Ecol. Sin. 2017, 37, 7068–7081. [Google Scholar] [CrossRef]
  9. Qin, S.H.; Sun, J.G.; Chang, K.; Xu, Y.D.; Wang, J.K. Spatial-Temporal Variation of Soil Organic Matter Content and Its Influencing Factors in the Black Soil Area of the Songnen Plain. J. Agric. Res. Environ. 2025, 42, 120–128. [Google Scholar]
  10. Liu, C. Temporal and Spatial Variation of Soil Organic Carbon and Its Influencing Factors in Western Songnen Plain. Ph.D. Dissertation, Harbin Normal University, Harbin, China, 2017. [Google Scholar]
  11. Liu, X.; Wang, M.; Liu, Z.; Bao, Y.; Li, X.; Wang, F.; Ji, X. Improving Spatial Prediction of Soil Organic Matter in Typical Black Soil Area of Northeast China Using Structural Equation Modeling Integration Framework. Comput. Electron. Agric. 2025, 236, 110404. [Google Scholar] [CrossRef]
  12. Liu, J.; Chen, B.; Zhang, M. Construction and Optimization of Ecological Security Patterns in the Songnen Plain. Front. Environ. Sci. 2024, 12, 1302896. [Google Scholar] [CrossRef]
  13. Du, Y.; Yang, S.; Dong, H.; Li, J.; Sun, Q.; Zhong, Y.; Wang, H.; Wu, Y. Effects of Marsh Wetland Degradation on the Soil Nematode Community Composition and Functions in the Songnen Plain, Northeastern China. Glob. Ecol. Conserv. 2024, 56, e03277. [Google Scholar] [CrossRef]
  14. Zhang, F. Optimal Sowing Date and Yield Effect Evaluation of Spring Maize Adaptation to Climate Change in Songnen Plain. Ph.D. Dissertation, Heilongjiang Bayi Agricultural University, Daqing, China, 2025. [Google Scholar]
  15. Jiang, F.H.; Zhang, Z.B.; Chen, B.Y.; Wang, Y.X.; Wang, N.; Qi, H.; Wang, Z.Y.; Gong, X.W.; Xue, X.W.; Islam, M.U. A Six-site Field Study on Assessing the Suitability of Conservation and Conventional Tillage in the Black Soil Region, Northeast China. J. Soil Tillage Res. 2025, 248, 106379. [Google Scholar] [CrossRef]
  16. Inner Mongolia Autonomous Region Soil Census Office. Soil in Inner Mongolia; Science Press: Beijing, China, 1994; pp. 40–76. [Google Scholar]
  17. Kong, D.P.; Luo, C.; Liu, H.J. Enhancing Soil Organic Matter Mapping in Saline-Alkali and Black Soil Areas with Prior Knowledge and Multi-Temporal Remote Sensing. J. Integr. Agric. 2025, 24, 1829–1842. [Google Scholar] [CrossRef]
  18. Singbah, P.T.; Huang, J.; Ahmed, I.; Abdelaziz, M.; Tadesse, K.A.; Daba, N.A.; Li, J.; Yan, J.; Liu, S.; Liu, L.; et al. Soil Humus and Aluminum-iron Interactions Enhance Carbon Sequestration and Yield Sustainability after Long-Term Fertilization in Three Different Soils. J. Agric. Food Res. 2025, 21, 101995. [Google Scholar] [CrossRef]
  19. Sui, J.; Dai, Y. Analysis of Conservation Practices for Black Soil Based on Organic Matter and Nitrogen Contents in the Black Soil Region of Northeast China. Sci. Rep. 2025, 15, 23989. [Google Scholar] [CrossRef]
  20. Li, Y.; Zheng, S.; Wang, L. Systematic Identification of Factors Influencing the Spatial Ddistribution of Soil Organic Matter in Croplands Within the Black Soil Region of Northeastern China Across Multiple Scales. J. Catena 2025, 249, 108633. [Google Scholar] [CrossRef]
  21. Li, Z.; Wang, X.; Li, X.; Sha, J.; Liu, C.; Qi, H.; Liu, Z.; Dai, Y. New Discovery of a Promising Cellulose Degrading Bacterium and its Degradation Mechanism. Pol. J. Environ. Stud. 2025, in press. [Google Scholar] [CrossRef]
  22. Deutsch, E.S.; Alameddine, I.; Qian, S.S. Using Structural Equation Modeling to Better Understand Microcystis Biovolume Dynamics in a Mediterranean Hypereutrophic Reservoir. Ecol. Model. 2020, 435, 109282. [Google Scholar] [CrossRef]
  23. Tian, P.Y.; Sun, H.J.; Xue, J.W.; Liu, M.Y. Soil Quality Assessment and Constraining Factor Analysis in Plantation Forests of North China Plain. Bull. Soil Water Conserv. 2025, 1, 18–27. [Google Scholar]
  24. Liu, X.; Wang, M.; Liu, Z.; Li, X.; Ji, X.; Wang, F. Spatial and Temporal Evolution of Soil Organic Matter and Its Response to Dynamic Factors in the Southern Part of Black Soil Region of Northeast China. Soil Tillage Res. 2025, 248, 106475. [Google Scholar] [CrossRef]
  25. Li, Y.; Wang, X.; Chen, Y.; Gong, X.; Yao, C.; Cao, W.; Lian, J. Application of Predictor Variables to Support Regression Kriging for the Spatial Distribution of Soil Organic Carbon Stocks in Native Temperate Grasslands. J. Soils Sediment 2023, 23, 700–717. [Google Scholar] [CrossRef]
  26. Weidhuner, A.; Hanauer, A.; Krausz, R.; Crittenden, S.J.; Gage, K.; Sadeghpour, A. Tillage Impacts on Soil Aggregation and Aggregate-Associated Carbon and Nitrogen After 49 Years. Soil Tillage Res. 2021, 208, 104852. [Google Scholar] [CrossRef]
  27. Chappel, A.; Webb, N.P.; Leys, J.F.; Waters, C.M.; Orgill, S.; Eyres, M.J. Minimising Soil Organic Carbon Erosion by Wind is Critical for Land Degradation Neutrality. Environ. Sci. Policy 2019, 93, 43–52. [Google Scholar] [CrossRef]
  28. Reinsch, T.; Loges, R.; Kluß, C.; Taube, F. Effect of Grassland Ploughing and Reseeding on CO2 Emissions and Soil Carbon Stocks. Agric. Ecosyst. Environ. 2018, 264, 27–34. [Google Scholar] [CrossRef]
  29. Yang, Y.; Sun, W.; Zhao, M.; Ma, M.; Dong, T. Research Progress on the Interaction Mechanism and Ecological Function of Soil Microorganisms and Physical-Chemical Properties in Orchards. J. Fruit Sci. 2025, 2, 1–21. [Google Scholar]
  30. Ren, B.; Hou, H.; Sui, Y.; Wang, Z.; Cao, M.; Zhan, Z. Climate Change at Orbital Scale in Songnen Plain During the Middle and Late Pleistocene. J. Geol. Bull. China 2025, 44, 392–403. [Google Scholar]
  31. Davidson, E.A.; Janssens, I.A. Temperature Sensitivity of Soil Carbon Decomposition and Feedbacks to Climate Change. J. Nat. 2006, 440, 165–173. [Google Scholar] [CrossRef]
  32. Qiu, L.; Hao, M.; Wu, Y. Potential Impacts of Climate Change on Carbon Dynamics in a Rain-Fed Agro-Ecosystem on the Loess Plateau of China. Sci. Total Environ. 2017, 577, 267–278. [Google Scholar] [CrossRef]
  33. Carvalhais, N.; Forkel, M.; Khomik, M.; Bellarby, J.; Jung, M.; Migliavacca, M.; Reichstein, M. Global Covariation of Carbon Turnover Times With Climate in Terrestrial Ecosystems. Nature 2014, 514, 213–217. [Google Scholar] [CrossRef]
  34. Zhu, M.; Feng, Q.; Qin, Y.Y.; Cao, J.J.; Zhua, M.X.; Liu, W.; Deo, R.C.; Zhang, C.Q.; Liu, R.L.; Liao, B.F. The Role of Topography in Shaping the Spatial Patterns of Soil Organic Carbon. Geoderma 2019, 348, 21–28. [Google Scholar] [CrossRef]
  35. Lozano-García, B.; Parras-Alcántara, L.; Brevik, E.C. Impact of Topographic Aspect and Vegetation (Native and Reforested Areas) on Soil Organic Carbon and Nitrogen Budgets in Mediterranean Natural Areas. Sci. Total Environ. 2016, 544, 963–970. [Google Scholar] [PubMed]
  36. Zhang, N.; Yan, J.; Chen, X.; Zou, W. Anthropogenic Soil Management Performs an Important Role in Increasing Soil Organic Carbon Content in Northeastern China: A Meta-Analysis. Agric. Ecosyst. Environ. 2023, 350, 108481. [Google Scholar] [CrossRef]
  37. Ofiti, N.O.; Zosso, C.U.; Soong, J.L.; Solly, E.F.; Torn, M.S.; Wiesenberg, G.L.; Schmidt, M.W. Warming Promotes Loss of Subsoil Carbon Through Accelerated Degradation of Plant-Derived Organic Matter. Soil Biol. Biochem. 2021, 156, 108185. [Google Scholar] [CrossRef]
  38. Su, X.Y.; Zhang, L.; Meng, H.; Zhao, J.X.; Wang, H.; Shang, L.X.; Guo, Q.Y.; Xing, Y.P.; Song, X.L.; Sun, X.Z.; et al. The Different Pathways of Microbial Regulation of Organic Carbon Turnover in the Topsoil and Subsoil of Coastal Saline Soil after Long-Term Stubble Return and Subsoiling. Appl. Soil Ecol. 2025, 197, 105324. [Google Scholar] [CrossRef]
  39. Kline, R.; Kline, R.B.; Kline, R. Principles and Practice of Structural Equation Modeling. J. Am. Stat. Assoc. 2006, 101, 406. [Google Scholar]
  40. Abu, H.; Nidal, H. Thermal Properties of Soils as Affected By Density and Water Content. Biosyst. Eng. 2003, 86, 97–102. [Google Scholar] [CrossRef]
  41. Bai, W.; Wan, S.; Niu, S. Increased Temperature and Precipitation Interact to Affect Root Production, Mortality, and Turnover in A Temperate Steppe: Implications for Ecosystem C Cycling. J. Glob. Change Biol. 2010, 16, 1306–1316. [Google Scholar] [CrossRef]
  42. Keiluweit, M.; Wanzek, T.; Kleber, M. Anaerobic Microsites Have an Unaccounted Role in Soil Carbon Stabilization. J. Nat. Commun. 2017, 8, 1771. [Google Scholar] [CrossRef] [PubMed]
  43. Melillo, J.M.; Frey, S.D.; DeAngelis, K.M. Long-Term Pattern and Magnitude of Soil Carbon Feedback to the Climate System in A Warming World. J. Sci. 2017, 358, 101–105. [Google Scholar] [CrossRef]
  44. Gong, S.; Zhang, T.; Guo, J. Warming and Nitrogen Deposition Accelerate Soil Phosphorus Cycling in a Temperate Meadow Ecosystem. Soil Res. 2019, 58, 109–115. [Google Scholar] [CrossRef]
  45. Taylor, A.E.; Giguere, A.T.; Zoebelein, C.M.; Myrold, D.D.; Bottomley, P.J. Modeling of Soil Nitrification Responses to Temperature Reveals Thermodynamic Differences Between Ammonia-Oxidizing Activity of Archaea and Bacteria. ISME J. 2017, 11, 896–908. [Google Scholar] [CrossRef]
  46. Dai, Y.; Yin, H.; Zhao, J.; Zhu, P.; Suo, Z. Preparation of Biochar from Straw in Northeast China to Assist in Carbon Neutrality: Data Visualization and Comprehensive Evaluation. Water Air Soil Pollut. 2025, 236, 324. [Google Scholar] [CrossRef]
  47. Wang, B.; Dou, Y.; Liang, C.; Liu, C.; Ao, D.; Yao, H.; Yang, E.; An, S.; Wen, Z. Microbial Necromass in Soil Profiles Increases Less Efficiently Than Root Biomass in Long-Term Fenced Grassland: Effects of Microbial Nitrogen Limitation and Soil Depth. Sci. Total Environ. 2024, 956, 177058. [Google Scholar] [CrossRef] [PubMed]
  48. Gao, Y.J.; Tariq, A.; Zeng, F.J.; Sardans, J.; Al-Bakre, D.A.; Peñuelas, J. Drying and Rewetting Affect the Chemical Speciation and Bioavailability of Soil Phosphorus in a Hyper-Arid Desert Ecosystem. Pedosphere 2024, 34, 101354. [Google Scholar] [CrossRef]
  49. Ma, H.; Zhang, B.; Wang, S.; Liu, C.; Zhu, L.; Zhao, Z.; Li, W.; Shao, Z.; Liu, X.; Dai, Y. Enhanced Removal of Tetracycline by Vitamin C-modified Cow Manure Biochar in Water. Sci. Rep. 2024, 14, 22362. [Google Scholar] [CrossRef]
  50. Johnson, R.; Vishwakarma, K.; Hossen, M.S.; Kumar, V.; Shackira, A.M.; Puthur, J.T.; Abdi, G.; Hasanuzzaman, M. Potassium in Plants: Growth Regulation, Signaling, and Environmental Stress Tolerance. Plant Physiol. Biochem. 2022, 172, 56–69. [Google Scholar] [CrossRef]
  51. Meena, V.S.; Bahadur, I.; Maurya, B.R.; Kumar, A.; Meena, R.K.; Meena, S.K.; Verma, J.P. Potassium-Solubilizing Microorganism in Evergreen Agriculture: An Overview. In Potassium Solubilizing Microorganisms for Sustainable Agriculture; Springer: Berlin/Heidelberg, Germany, 2016; pp. 1–20. [Google Scholar]
  52. Strawn, D.G. Sorption Mechanisms of Chemicals in Soils. Soil Syst. 2021, 5, 13. [Google Scholar] [CrossRef]
  53. Zihms, S.G.; Switzer, C.; Irvine, J.; Karstunen, M. Effects of High Temperature Processes on Physical Properties of Silica Sand. Eng. Geol. 2013, 164, 139–145. [Google Scholar] [CrossRef]
  54. Hu, X.F.; Du, Y.; Guan, C.L.; Xue, Y.; Zhang, G.L. Color Variations of the Quaternary Red Clay in Southern China and Its Paleoclimatic Implications. Sediment. Geol. 2014, 303, 15–25. [Google Scholar] [CrossRef]
  55. Zheng, J.; Chen, T.; Han, W.; Xu, X.; Yan, X.; Yan, J. The Color Formation of “Lumu Stone” in the Weathering Processes: The Role of Secondary Hematite and Goethite. Minerals 2023, 13, 860. [Google Scholar] [CrossRef]
  56. Wawire, A.W.; Csorba, Á.; Kovács, E.; Mairura, F.S.; Tóth, J.A.; Michéli, E. Comparing Farmers’ Soil Fertility Knowledge Systems and Scientific Assessment in Upper Eastern Kenya. Geoderma 2021, 396, 115090. [Google Scholar] [CrossRef]
  57. Xia, Y.; Cheng, X.Y.; Hu, X. Soil Organic Matter Content Prediction in Tobacco Fields Based on Hyperspectral Remote Sensing and Generative Adversarial Network Data Augmentation. Comput. Electron. Agric. 2025, 229, 108339. [Google Scholar] [CrossRef]
  58. Hou, L.; Wang, Y.; Wang, Z.; Gao, R.; Zhou, X.; Yang, S.; Luo, X.; Jiang, Z.; Liu, Z. Effects of Biochar on Soil Quality in a Maize Soybean Rotation on Mollisols. Agronomy 2025, 15, 1226. [Google Scholar] [CrossRef]
  59. Heller, P.D.; Ben-Dor, E. Effect of Organic Matter Content on the Spectral Signature of Iron Oxides Across the VIS–NIR Spectral Region in Artificial Mixtures: An Example From a Red Soil From Israel. Remote Sens. 2020, 12, 1960. [Google Scholar] [CrossRef]
  60. Wang, L.; Li, T.; Liu, H.; Zhang, Z.; Yang, A.; Li, H. Combined Effect of Freeze–Thaw Cycles and Biochar Addition on Soil Nitrogen Leaching Characteristics in Seasonally Frozen Farmland in Northeast China. Agronomy 2024, 14, 153. [Google Scholar] [CrossRef]
  61. Parewa, H.P.; Meena, V.S.; Meena, S.K.; Choudhary, A.; Kumar, M. Carbon Management Strategies for Sustainable Food Production Systems. In Agricultural Soil Sustainability and Carbon Management; Academic Press: Cambridge, MA, USA, 2023; pp. 69–98. [Google Scholar]
  62. Murtaza, G.; Ahmed, Z.; Usman, M.; Rizwan, M.; Iqbal, R.; Ali, B.; Ali, I. Modeling Climate Change Impact Over Soil Productivity and Agriculture. Chall. Solut. Clim. Impact Agric. 2025, 10, 259–281. [Google Scholar]
  63. Han, X.Z.; Zou, W.X. Research Perspectives and Footprint of Utilization and Protection of Black Soil in Northeast China. Acta Pedol. Sin. 2021, 58, 1341–1358. [Google Scholar]
  64. Zhang, M.N.; Song, X.J.; Wu, X.P.; Zheng, F.J.; Li, S.P.; Zhuang, Y.; Man, X.L.; Degré, A. Microbial Regulation of Aggregate Stability and Carbon Sequestration Under Long-Term Conservation Tillage and Nitrogen Application. Sustain. Prod. Consum. 2024, 44, 74–86. [Google Scholar] [CrossRef]
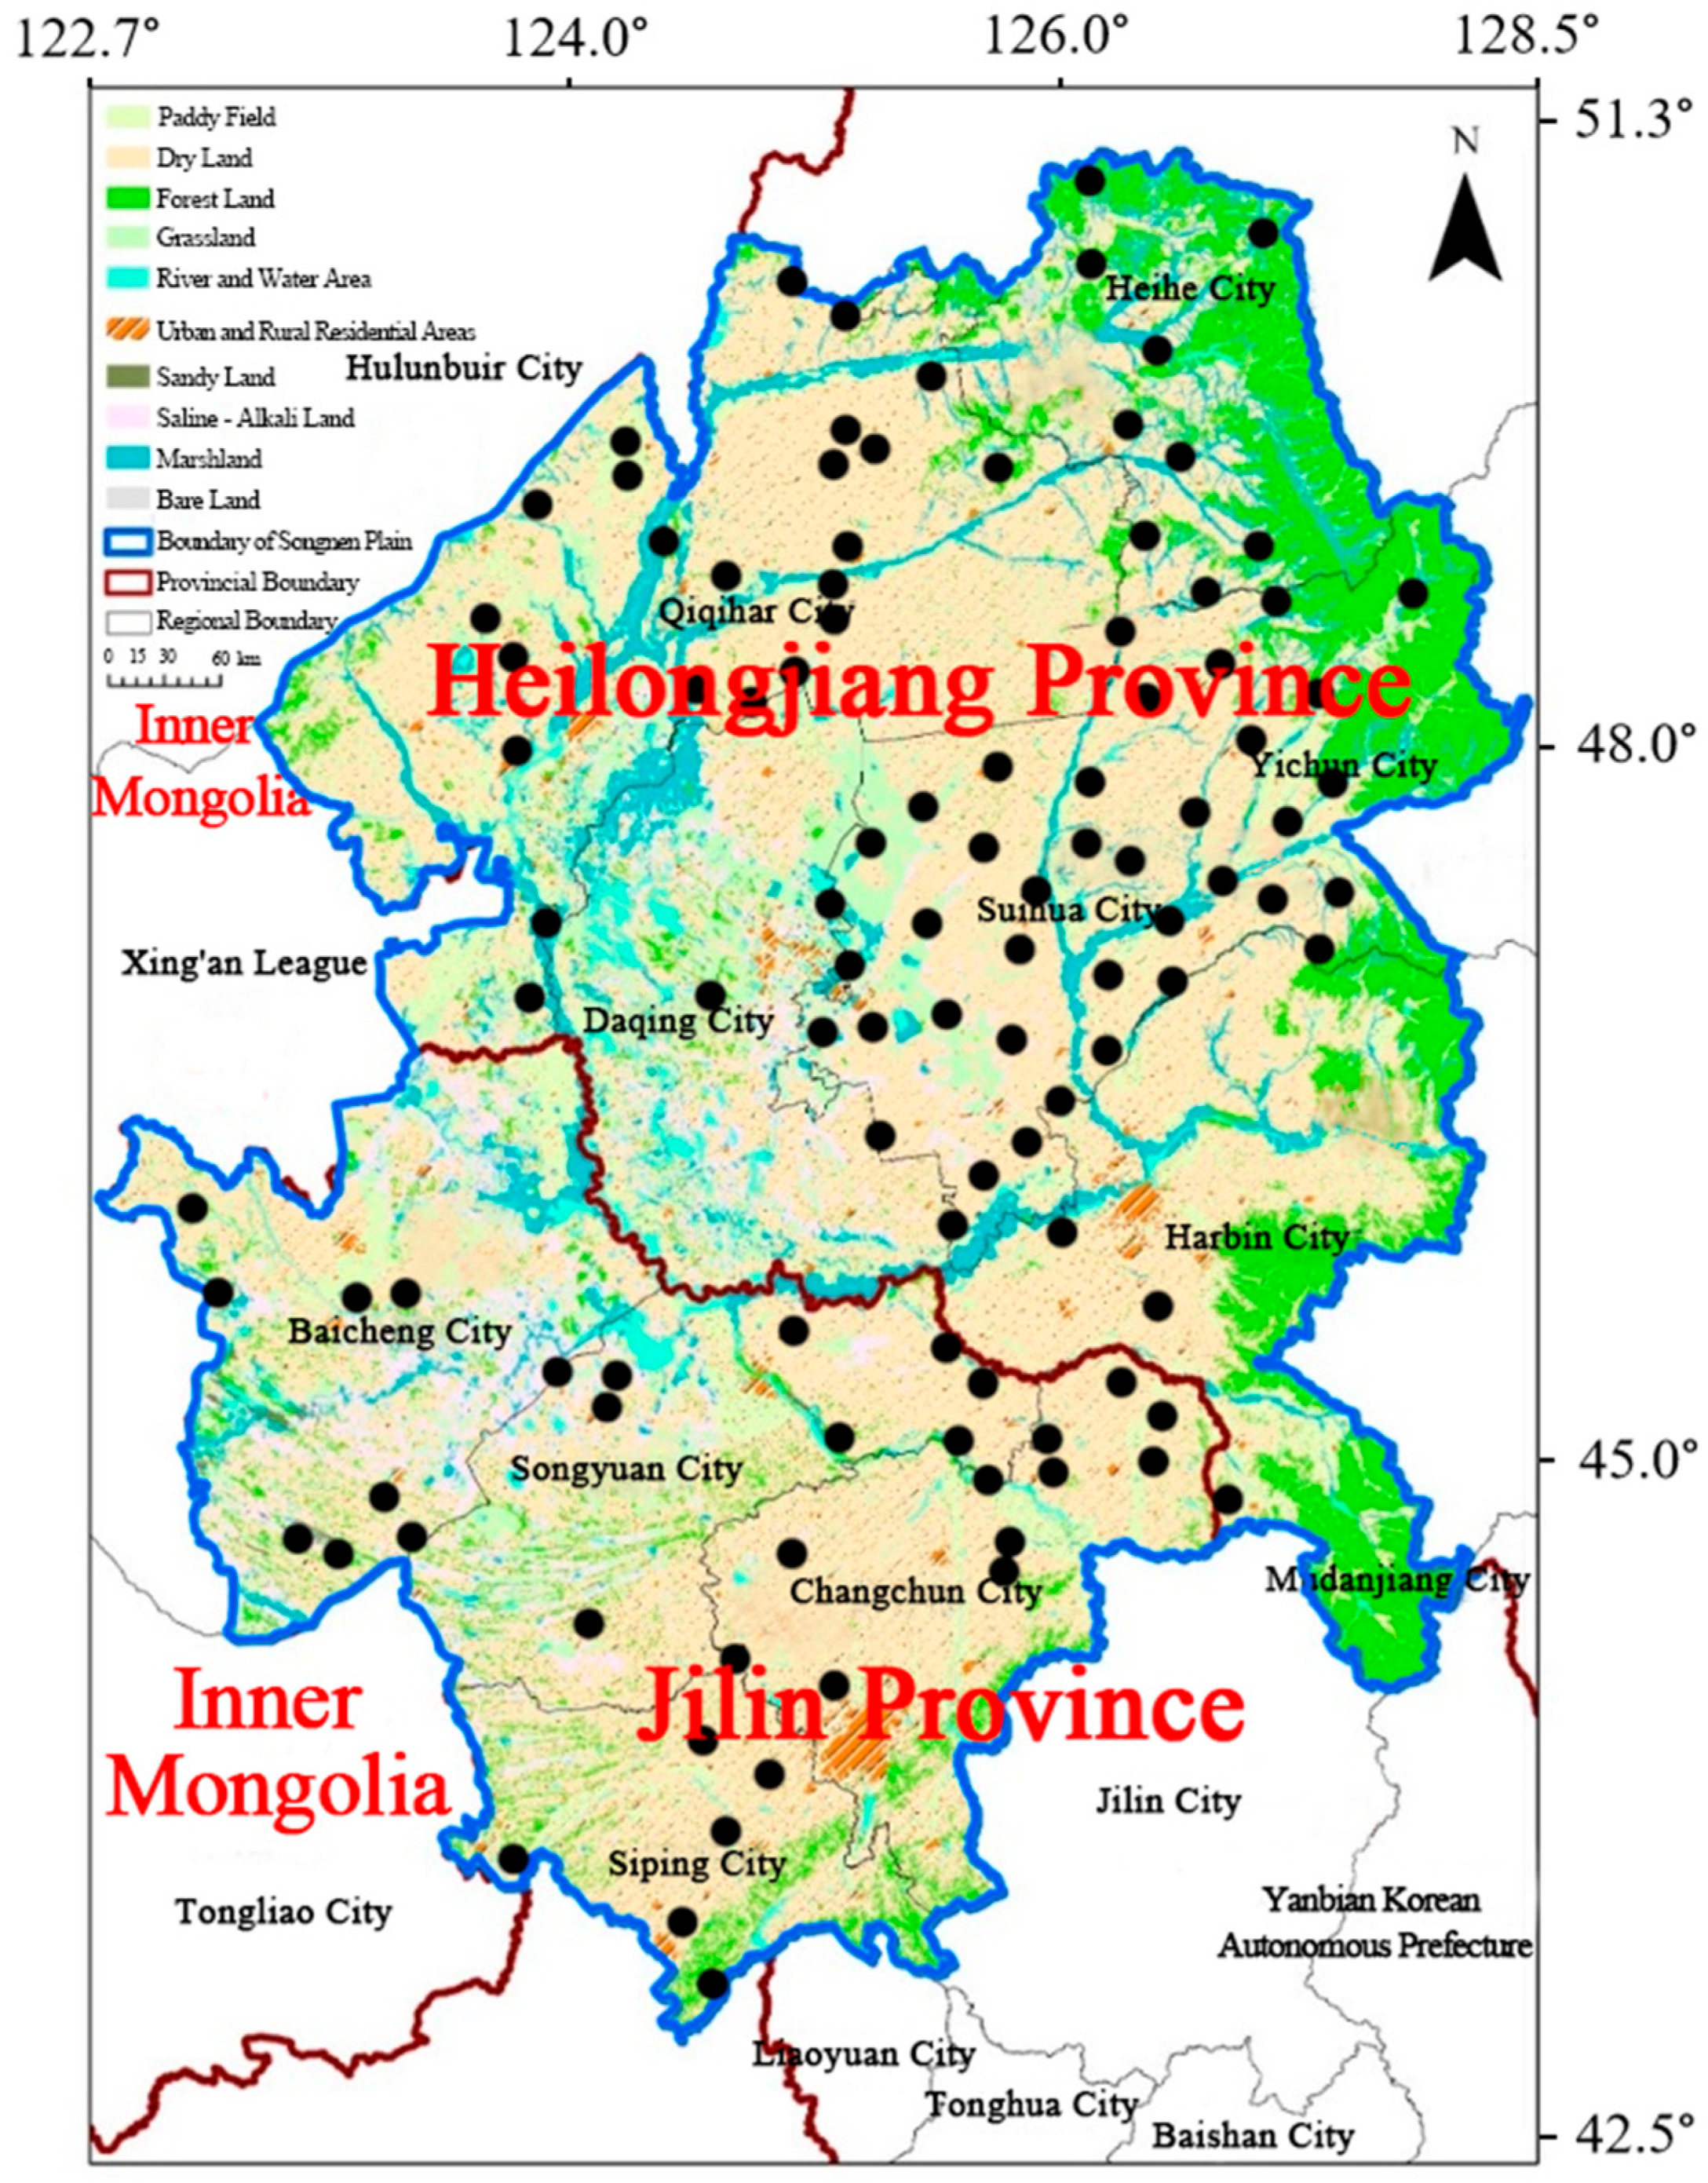
Figure 1. Location of the study area.
Agriculture 15 02156 g001
Figure 2. Classification of SOM in the Songnen Plain.
Agriculture 15 02156 g002
Figure 3. SOM distribution in four layers of Songnen Plain (green: 1st, grey: 2nd, blue: 3rd, yellow: 4th), values in g·kg−1.
Agriculture 15 02156 g003
Figure 4. Effects of various factors on SOM based on structural equation model.
Agriculture 15 02156 g004
Figure 5. Distribution patterns between SOM and R, G, B in 3D space. (Note: sphere size represents SOM amount; coordinates reflect R, G, and B values, showing their combined relationship with SOM.)
Agriculture 15 02156 g005
Figure 6. Linear regression analysis between SOM and R, G, B. (Note: red squares, green circles, and blue triangles represent R, G, and B; equations and R2 show their negative linear relationships with SOM.)
Agriculture 15 02156 g006
Figure 7. Distribution map of spatial locations of maximum permafrost thickness and maximum snow depth of soil in the Songnen Plain.
Agriculture 15 02156 g007
Disclaimer/Publisher’s Note: The statements, opinions and data contained in all publications are solely those of the individual author(s) and contributor(s) and not of MDPI and/or the editor(s). MDPI and/or the editor(s) disclaim responsibility for any injury to people or property resulting from any ideas, methods, instructions or products referred to in the content.