Abstract
Water, energy, and food (WEF) constitute the core strategic resources essential for regional sustainable development, and the governance of the WEF system holds critical significance for the Central Area of the Yangtze River Delta (caYRD)—one of China’s most economically dynamic regions. In this area, however, the potential risks associated with insufficient WEF synergy capacity have become increasingly prominent amid continuous population growth and rapid urbanization. Against this backdrop, this study aimed to evaluate the WEF synergy capacity of 27 prefecture-level cities (PLCs) in the caYRD over the period 2005–2023 using the Projection Pursuit Model (PPM), based on an evaluation framework encompassing 12 indicators. Our results revealed that (1) the WEF system exhibits significant spatiotemporal heterogeneity, which is evident not only in the water resource, energy resource, and food resource subsystems but also in the overall WEF synergy capacity. In the water subsystem, Wenzhou and Ma’anshan achieved the highest and lowest PPM evaluation scores, respectively; in the energy subsystem, Zhoushan and Shanghai recorded the highest and lowest scores, respectively; and in the food subsystem, Yancheng and Zhoushan ranked first and last in terms of PPM scores, respectively. (2) For the integrated WEF synergy capacity evaluation, Yancheng obtained the highest score, whereas Shanghai ranked the lowest; additionally, Chuzhou exhibited the largest fluctuation range in scores, while Taizhou (Jiangsu) exhibited the smallest fluctuation range. (3) Subsequently, based on the PPM evaluation values of WEF synergy capacity, the 27 PLCs were clustered into three groups: the High WEF synergy capacity value cluster, which includes Yancheng and Chuzhou; the Low WEF synergy capacity value cluster, which consists of Shanghai and Suzhou; and the Mid-level WEF synergy capacity value cluster, which comprises the remaining 22 PLCs and is further subdivided into three sub-clusters. The cluster results of WEF synergy capacity imply that special attention to the consumption control of WEF resources is required for different PLCs. The variations in WEF synergy capacity and its spatial distribution patterns provide critical insights for formulating region-specific strategies to optimize the WEF system, which is of great significance for supporting sustainable development decision-making in the caYRD.
1. Introduction
Water, energy, and food are essential resources for human survival and sustainable development [1]. The concept of the Water–Energy–Food Nexus (WEF-Nexus), first proposed at the 2011 Bonn Conference in Germany, encapsulates the interdependent and synergistic relationships among these three critical elements [1]. In 2014, the Food and Agriculture Organization (FAO) of the United Nations elaborated on the nexus from the perspective of food security and conducted a path decision-making analysis from the angles of ensuring food security and promoting sustainable agricultural development [2]. Based on the WEF nexus, the FAO added factors such as land, capital, and labor, enriching and expanding the connotation and scope of the nexus. Different social, economic, and environmental goals, population growth, urbanization, climate change, and other factors will have varying degrees of impact on the nexus [3].
Water, energy, and food are closely interconnected, and these three subsystems, such as the water subsystem, energy subsystem, and food subsystem, form a complete WEF system. From the perspective of sustainable development, the interaction between water, energy, and food resources is an important variable factor restricting regional development [4,5,6]. Changes in any of the WEF subsystems can have an impact on the whole system. Elminshawy and other researchers believe that the consumption of water resources by energy, food, etc., is increasing proportionally, and the relationship between these factors should be reasonably measured to promote the sustainable development of water resources [7,8,9]. Furthermore, water, energy, and food are closely related in time and space.
The WEF nexus needs to consider the mechanism of the nexus as a systematic whole interacting with external factors, which is regarded as a framework method for coordinating the relationship between resource utilization and development. It is necessary to quantify water, energy, and food with the concept of “resource integration” and incorporate external factors to carry out nonlinear integration research on the three subsystems [10]. Relevant research on the nexus has gradually evolved from the initial “connection” to “synergy”, integrating the concept of correlation into resource system research and emphasizing the realization of resource sustainability through associated paths. Water, energy, and food have complex and dynamic interactions, forming a WEF nexus with trade-offs and synergies. Factors such as symbiotic units, symbiotic relationships, and symbiotic environments have gradually been included in the synergy research of the WEF nexus [11]. Thus, the evaluation of the WEF synergy capacity still needs to be elaborately detailed.
2. Literature Review
2.1. Understanding the Concept of the WEF System
The United Nations regards research on the nexus as an important path to promote the sustainable development of society and economy, and to achieve the Sustainable Development Goals (SDGs). It has considered the impact and challenges of external factors such as food policies, water pollution, and carbon-neutral energy consumption on the WEF nexus [12,13,14]. The WEF relationship encompasses interactions at the material, management, and technical levels. As a supporting system, the WEF nexus fulfills three core functions: the mutual consumption, synergy, and trade-offs among water, energy, and food. Energy production and consumption often demand large volumes of water, just as water-related processes, including extraction, treatment, distribution, discharge, and reuse, are inherently energy-intensive [13]. These intricate interdependencies between water, energy, and food systems make managing and planning their resources difficult [14].
As a carrying system, the WEF nexus relationship undertakes the functions of the mutual consumption, synergy, and trade-off of water, energy, and food. Its inputs mainly include two categories: natural resources and artificial resources. Natural resources include natural precipitation, snowmelt, oil, coal, and solar energy, while artificial resources consist of pesticides, arable land, and seeds. Its outputs have both positive and negative dimensions: positive outputs include processed goods and energy for production resources essential to human economic development and daily life, whereas negative outputs refer to issues such as domestic sewage, industrial wastewater, energy-related pollution, and food security risks, all of which stem from improper consumption practices [12]. Therefore, from a systemic viewpoint, the essence of the WEF Nexus is to identify strategies that holistically balance the synergistic development of water, energy, and food within a sustainable framework. Efficient water resource allocation provides stable support for energy and food production; optimized energy structures boost agricultural productivity and water use efficiency; and improved food systems reduce water and energy consumption [15].
The impact of external factors on the WEF nexus is direct and far-reaching. Changes in external conditions, such as climate change, population urbanization, and economic development, will have a dual impact on the nexus. The impact of climate change on the nexus is mainly reflected in the supply side of water, energy, and food. Climate deterioration leads to water scarcity, which in turn triggers a food security crisis, and its negative impact is more significant in underdeveloped areas. Population growth and urbanization, while promoting energy exploitation, also bring energy consumption and water pollution, exacerbating the contradiction between resource tools. Scientific and technological progress and economic development can improve the efficiency and effectiveness of resource use to a certain extent [12,16].
2.2. Coupled Coordination Research of the WEF Nexus
Scholars have carried out research on the coupled and coordinated development of the nexus from internal factors and external factors. Internal factors mainly focus on the correlation and coordination between water, energy, and food in different regions. Bi and others took regions such as Liaoning Province, Jiangsu Province, and Shanghai as research objects, and constructed an evaluation index system for the coupling coordination degree of water, food, and energy [17]. Ren and others proposed a comprehensive collaborative development model based on the traditional coupling model, considering the evolutionary process of subsystems from disorder to order, and conducted a comprehensive collaborative evaluation on the complex characteristics such as aggregation, dynamics, and nonlinearity of the WEF nexus [18]. In a single resource system, changes in a certain factor will affect the other two resource systems. External factors include influencing factors outside the nexus and comprehensively consider many factors, such as natural systems and social systems. With the continuous advancement of urbanization, the impact of external factors such as land pattern, population change, and economic growth on the nexus has become increasingly significant. Based on the theory of sustainable development, Mondal and others incorporated external factors at the social, political, and economic levels to explore the coupling degree between urbanization and resource consumption in the nexus [19]. Li and others used the Exploratory Spatial Data Analysis (ESDA) method and spatial econometric model to study the relationship between water, energy, food, industrial layout, and external industry influences, and proposed that technical progress should be used to improve the utilization efficiency of water, energy, and food to ensure the coordinated development of the nexus [20].
In addition, from the perspective of coupling correlation, the nexus also involves four spatial dimensions: regional, national, regional, and global. For example, Wang and others used spatial Durbin models, mechanical equilibrium models, etc., to analyze the temporal and spatial variation laws of coupled synergy in northwest China, the Yellow River Basin, and other provinces [21]. Regarding the measurement of coupling coordination degree, some scholars have also used prediction models [22], symbiotic evolution mechanisms [23], Sustainability Index (SI) [24], etc., to evaluate regional efficiency and coupling coordination degree, analyze their influencing factors, and find paths to realize the sustainable development of regional resources.
In terms of research methods, to address the challenge of WEF Nexus under the changing context, nexus approaches have been put forward as a robust analytical framework for deciphering the dynamic evolutionary processes of the WEF Nexus [1,25]. By dissecting the intricate interactions across these three systems, the WEF Nexus seeks to elevate overall operational efficiency, unlock synergistic potentials between sectors, and facilitate cross-sectoral collaboration [26]. This holistic lens established the investigation of trade-offs and synergies within the WEF Nexus as a central theme in academic research, a focus that underscores its critical role in formulating sustainable development strategies [27]. Since the formal introduction of the WEF Nexus concept, nations globally have grown increasingly cognizant of how interlinkages between water, energy, and food subsystems shape sustainable socioeconomic progress [28]. This growing recognition has laid a foundational basis for advancing WEF Nexus research.
Presently, the majority of studies in this domain concentrate on three core areas: (1) the conceptual frameworks and theoretical underpinnings of the WEF Nexus [29,30]; (2) quantitative assessments of WEF system interactions [31]; and (3) simulation and predictive modeling of nexus dynamics [32]. Research methodologies in this field have become increasingly diverse, and Geographic Information System technology is integrated. Key approaches include input-output models [33,34], life cycle assessments [35], multi-objective programming models [36,37], coupled coordination models [38], system dynamics models [39,40], and neural network models [41,42].
2.3. Synergy Capacity of the WEF Nexus
The WEF nexus relationship has evolved from the initial focus on “connection” to “synergy”, that is, integrating the thinking of interconnection into the research of resource systems and emphasizing the realization of resource sustainability through interconnected pathways. Water, energy, and food exhibit complex and dynamic interactions, forming a WEF nexus characterized by trade-offs and synergies. Factors such as symbiotic units, symbiotic relationships, and symbiotic environments have gradually been incorporated into the synergy research of the nexus relationship.
Synergy, defined as the combined effects arising from nonlinear interactions between two or more subsystems or components within a system. Studies on synergistic capacities among water, energy, and food have been particularly prominent in different areas and countries, such as the synergistic conceptual framework, synergy efficiency, optimization pathways, and comprehensive assessments of system resilience, sustainability, and coordination [13,43,44,45,46,47,48]. Foran analyzed regional features of the WEF nexus in the Mekong region from a multidisciplinary perspective and formulated policy measures to strengthen the sustainable management [49]. Also, from the perspective of the cross-border context, the connection characteristics and optimization paths of the WEF Nexus in the major river basins of Asia were analyzed by Keskinen et al. [50]. Similarly, Putra et al. analyzed the security characteristics of the WEF nexus in South Asia through a systems theory view [51]. Jones-Crank defined WEF-Nexus as an integrated governance approach to enhance overall system sustainability and demonstrated its application in Singapore [52]. Mabhaudhi et al. pointed out the influence of regional integration and development on the collaborative relationship of the WEF Nexus in Southern Africa [53]. Moreover, Madani et al. analyzed the issues of the WEF Nexus in the Arctic region from the perspective of international law [54]. Increasing research on the WEF Nexus in European countries highlighted that most of the WEF nexus studies were focused on water quantity aspects and energy; however, other resources, including land, climate, ecosystem, and soil, received little attention [3].
In China, studies on WEF have also been widely carried out. Liu et al. pointed out that the overall coordinated security degree of China’s WEF has shown a fluctuating upward trend from 2007 to 2016 [55], and the spatial equilibrium measurement of China’s WEF Nexus is studied by Han et al. [56]. Lu and Li concluded that the level of urbanization, agricultural operation, and scientific and technological innovation could improve the level of synergistic development of the local agricultural WEF system [57].
At basin and regional scales, researches on WEF have garnered increasing attention. Sun et al. revealed that the synergistic development of the WEF system of the five provinces in Northwest China maintains a steady upward trend with narrowed inter-provincial gaps using self-organization theory and the Haken model method [58]. Huang and Liu found that administrative power, market power, resource flow capacity, population density, industrial structure, urbanization level, scientific and technological inputs, environmental governance inputs, and spatial geographic factors significantly influenced regional WEF resilience security, with notable variations across provinces along the Yellow River [59]. Peng et al. quantitatively optimized basin-level water supply indicators using an integrated WEF analytical framework [60]. Luo et al. based on synergetic principles, empirically analyzed the co-evolution of the WEF nexus in the Yellow River from 2010 to 2019 by a “order parameter-subsystem-composite system” framework [61]. Wang et al. combined system dynamics with a Pressure-State-Response model to simulate WEF self-sufficiency rates and deficits under future green development scenarios [62].
Obviously, studies on the Yangtze River Basin’s WEF dynamics are receiving heightened scholarly focus in recent years, and coupling coordination and synergy levels are mainly hot issues that have been studied. Chen et al. analyzed the synergy levels and impacts of the WEF nexus in the Yangtze River Economic Belt from an industrial linkage and ripple effect perspective [63]. Zhang et al. examined the evolutionary characteristics and driving mechanisms of WEF system pressures in the Yangtze River Delta urban agglomeration from 1990 to 2018 [64]. Zhu et al. assessed urban WEF security by using an extended Multi-Attribute Border Approximation Area Comparison method in the Yangtze River Delta Urban Agglomeration [65]. Ji et al. conducted simulation and optimization studies on the Yangtze River Delta’s water-energy-food-ecosystem from 2020 to 2035, and their results suggest resource conservation and technological innovation as critical pathways for balancing resource supply and demand [66]. Deng et al. assessed the coordinated development of Jiangsu Province’s WEF using a coupling coordination model [67]. Chen et al. analyzed the pre-warning measurement of water resources security from the perspective of WEF symbiosis in the Yangtze River Basin, and they also used the two-step measurement method to discuss the WEF symbiotic coordination and its key factors [68].
In combination with previous studies, most researchers emphasize quantitative indicator analysis; however, gaps in quantitative evaluation of WEF remain crucial, particularly for rapidly urbanizing regions with large populations and higher industrialization, one is because the interaction between different systems is intricate and is affected by a variety of external factors (such as urbanization, population growth, etc.). The second is the lack of a dynamic feedback mechanism. Existing studies often lack a dynamic feedback mechanism when building models, making it impossible to accurately simulate the interaction and change processes between systems. Moreover, with the extension of the updated data series, comprehensive assessments of WEF synergy capacity continue to be necessary for China’s Yangtze River Delta, the nation’s most economically vibrant and densely populated area. The characteristics and regional disparities of WEF systems require further investigation. Particularly, temporal analyses at the municipal scale remain underexplored.
Therefore, it is necessary to incorporate external factors such as society, economy, and humanities, and interaction indicators need to be particularly considered, and the internal mechanism and external correlation of the nexus need to be continuously expanded to improve the efficiency of comprehensive resource utilization. Thus, we focus to examine the spatiotemporal evolution patterns and differentiation of WEF synergy capacity in the prefecture-level cities of the central area of Yangtze River Basin in China employing Projection Pursuit Model method through more interconnected indicators such as Water use per unit GDP, Percentage of primary industry in total energy consumption, Energy consumption per unit GDP, Mechanical power per unit grain cultivation area, etc.
The structure of this paper is as follows: following Section 1 and Section 2, Section 3 displays the study area. An integrated evaluation index system is constructed, and the calculation procedure of the PPM is presented in Section 4. The evaluation values of the subsystems of the WEF Nexus and the synergy capacity of WEF are calculated; the spatiotemporal of the synergy capacity of WEF is intensively analyzed, and the 27 PLCs are categorized into different clusters by Hierarchical Cluster Analysis in Section 5. Finally, Discussion and suggestions, Conclusions, and Limitations are given in Section 6, Section 7, and Section 8, respectively.
As a whole, the main focus of this article is as follows: (1) The integrated evaluation index system was constructed based on the interconnected indicators and their systematic mechanism in the social-economic element relating to the WEF Nexus is included. (2) The PPM method combined with the Accelerated Genetic Algorithm (AGA) was conducted to calculate the evaluation values, in which it can reveal intrinsic data structures, classification features, or anomaly patterns and obtain the optimal projection direction. (3) The spatial and temporal characteristics and regional differences in static and dynamic evaluation values of WEF subsystems and the synergy capacity of WEF were identified and analyzed. (4) The corresponding regulation and policy suggestions are provided.
3. Study Area
The Yangtze River Delta (YRD), one of China’s most economically active, open, and innovative regions. In 2019, the Communist Party of China Central Committee and the State Council issued an Outline of the Regional Integrated Development Plan of the YRD. According to this Plan, the YRD encompasses the entire administrative areas of Jiangsu, Zhejiang, Anhui provinces, and Shanghai Municipality. By the end of 2024, this region occupies about 4% of China’s total land area, 16.1% of the nation’s population, and nearly a quarter of the national Gross Domestic Product (GDP). However, resource availability, ecological conditions, and economic development levels remain mismatched in the YRD.
As China’s most densely networked river basin, the YRD possesses 215 billion m3 of water resources. Yet its per capita water availability is less than half the national average and merely one-eighth of the global average. The region’s per capita grain output reaches only about 78% of the national average. For the energy part, the energy production accounts for under 4% of China’s total; however, Jiangsu, Zhejiang, and Shanghai rely on external input and import due to limited indigenous energy resources, except for Anhui Province, which has relatively abundant coal reserves [66]. From an ecological perspective, high-intensity development has led to ecological land occupation, excessive resource consumption, and prominent water/air pollution. With tight resource constraints and escalating ecological pressures, the YRD emerges as a critical testing ground for exploring WEF nexus synergies and sustainable development.
This study focuses on the prefecture-level city (PLC) scale, totally 27 prefecture-level cities (PLCs) in caYRD are investigated (Figure 1).
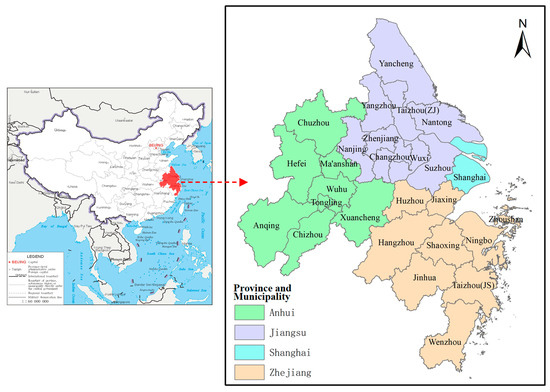
Figure 1.
Location of study area and the 27 PLCs in caYRD of China.
These 27 PLCs form the entirety of the caYRD, which is also called the YRD urban agglomeration as defined by the high-quality development core zone in the aforementioned Outline of the Regional Integrated Development Plan of the Yangtze River Delta. Covering 225,000 km2, the study area generated a GDP of 21.8 trillion yuan in 2024 (≈20% of China’s total) and hosts over 165 million permanent residents. The 27 PLCs belong to four provinces and municipalities (Table 1).

Table 1.
Provinces and municipalities with their prefecture-level cities studied.
Considering that the study area is located in the lower reaches of the Yangtze River and the evaluation indicators used in the research have very weak correlation with the upstream areas, the introduction and the possible influencing factors of the upstream areas are not included.
4. Materials and Methods
4.1. Evaluation Index System and Data Sources
A scientifically sound and rational evaluation index system forms the prerequisite for accurately assessing WEF synergy capacity levels. By comprehensively considering the WEF synergy capacity among three water, energy, and food subsystems, and referencing existing research findings, we adhere to the principles of scientific rigor, comprehensiveness, and authenticity. Thus, we constructed the three-dimensional system to evaluate WEF synergy capacity (Table 2), incorporating the resource-energy efficiency interconnected indicators such as the proportion of agricultural water usage, the share of energy consumption in the primary industry, and the total mechanical power per unit of grain cultivation area, etc. These indicators have close resource correlations with the WEF subsystems, and are also correlated with the socioeconomic elements characterized by GDP and Population. Meanwhile, indicators are correlated with agriculture, which is most directly associated with the WEF Nexus.

Table 2.
WEF Synergy Capacity Evaluation Index System.
This study focuses on 27 PLCs in caYRD within the research period spanning from 2005 to 2023. Data are collected from the Provincial Statistical Yearbooks (Jiangsu, Zhejiang, Anhui, Shanghai), Water Resources Bulletins, and Provincial Environmental Bulletins. Missing data were supplemented using linear interpolation methods.
4.2. Projection Pursuit Model
The Projection Pursuit Model is a nonparametric statistical method for analyzing high-dimensional data, aiming to reduce dimensionality (typically to 1–2 dimensions) by identifying optimal projection directions that reveal intrinsic data structures, classification features, or anomaly patterns. Its core principle involves optimizing specific objective functions (projection indices) to uncover hidden regularities in low-dimensional spaces, particularly effective for analyzing complex systems, nonlinear relationships, and high-dimensional non-normal distributions [69,70]. The PPM method has been widely applied across scientific disciplines, including resource-environment interactions and socio-economic development. Zhang et al. applied the PPM to assess agricultural drought risks in Henan Province [71]. Jin et al. employed the Projection Pursuit method to analyze changes in water carrying capacity in Anhui Province from 2005 to 2015 [72]. He et al. evaluated the security of the water-energy-food-population system in the Beijing-Tianjin-Hebei region using a projection pursuit model [73]. Therefore, the PPM is well-suited for assessing WEF synergy capacity in caYRD.
The calculation process of the PPM is as follows [71,72,73]:
Let the initially constructed evaluation indicator dataset be: {Xij, i = 1,…,n; j = 1,…,p}, where Xij represents the j-th indicator value of the i-th PLC. To eliminate dimensional effects in system evaluation indicators, we standardize the original data to ensure comparability and measurability using the following methods:
For positive indicators:
For negative indicators:
where is the original data of the j-th indicator in the i-th year, maxXj and minXj represent the maximum and minimum values of each original indicator over the years, respectively, and is the standardized data after processing.
Construct the projection indicator function Q(a). By combining the multi-dimensional data of the paper’s indicator system with the projection direction a = {a(1),…,a(j),…,a(p)}, we obtain one-dimensional projection values :
To make the projection values exhibit characteristics of local density and global dispersion, let be the standard deviation of projection values and be the local density of projection values . The projection indicator function Q(a) is expressed as:
where is the mean projection value of the Zi sequence; R is the window radius of local density (generally taken as 0.1); is the distance between the projection values of each two samples, and is the unit step function, where
Finding the Optimal Projection Direction. Determining the optimal projection direction is crucial for the projection pursuit method. This can be achieved by maximizing the projection indicator function:
The solution for optimal projection direction is solved by the Accelerated Genetic Algorithm (AGA), as genetic algorithms are suitable for mathematical models with complex multi-constraint conditions. The parallel processing of AGA significantly reduces evolutionary time, by continuously retaining elite individuals to optimize the search space, it achieves more comprehensive searching coverage, selects superior solutions, and realizes global optimization, thereby obtaining the optimal projection direction a*.
Thus, the optimal projection directions corresponding to the water resource subsystem, energy subsystem, and food subsystem within the WEF system can be obtained for each year, namely a*Water, a*Energy, and a*Food.
Meanwhile, the evaluation value of WEF Synergy Capacity (denoted as a*WEF Synergy Capacity) for each year is calculated as follows:
5. Results
5.1. PPM Evaluation of Water System
The PPM evaluation results of the water system reveal significant spatial disparities and regional imbalances among 27 PLCs demonstrated by the boxplot and the mean PPM values (Figure 2a).
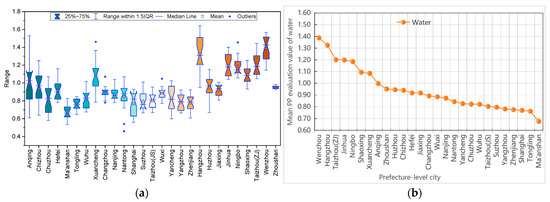
Figure 2.
Boxplot (a) and the mean (b) PPM values of water system in caYRD in 2005–2023.
The PLC Anqing has the largest range, while Zhoushan has the least. Most PLCs in Zhejiang Province have generally higher evaluation scores of the water systems, and those in Anhui Province rank second, while PLCs in Jiangsu Province have relatively the lowest values (Figure 2a). Spatial differences might reflect the influencing factors of the Zhejiang PLCs within caYRD such as Hangzhou, Wenzhou, Jinhua, and Taizhou (ZJ) are predominantly economically developed and densely populated areas. The concentrated industrial activities and large populations resulted in the substantial water demands likely contributed to the relatively high evaluation scores and consistently similar fluctuations in Hangzhou, Wenzhou, Jinhua, and Taizhou (ZJ). Among these four PLCs, Hangzhou has a high mean value and pronounced fluctuations in water resources; it represents a high-value, high-variation city, indicating that water resources significantly impact its economic development with notable uncertainties.
Mean PPM evaluation values for the water system in 27 PLCs ranged between 0.68 and 1.39 (Figure 2b), the difference is 0.71 in view of the mean values of the year between 2005 and 2023 in each PLC (Figure 3a). Wenzhou exhibited the highest value, followed by Hangzhou and Taizhou (ZJ), while Ma’anshan, Tongling, and Shanghai are at the lowest three values. Temporally, Anqing showed the largest variation amplitude of with the range amplitude is 0.9205, whereas Zhoushan had the smallest fluctuation, with the range amplitude of 0.0562 (Figure 2 and Figure 3a). The PLCs, including Anqing, Chizhou, Chuzhou, Xuancheng, and Shanghai, experienced frequent inter-annual fluctuations with a larger linear fitting slope (Figure 3b) while Zhoushan, Taizhou (ZJ), Nanjing, Wuxi, and Wenzhou have the least fitting slope, which is ranked at the last but five.
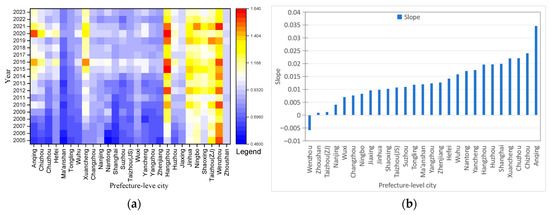
Figure 3.
Heat map (a) and the Slope (b) of PPM values of water system in caYRD in 2005–2023.
In the water system, 26 of 27 PLCs exhibited an increasing trend in PPM values, and regional differences were evident; only one, Wenzhou, showed a decreasing trend (Figure 3b). From the lens of the PLCs in the provinces and municipalities of the caYRD, PLCS such as Changzhou, Zhoushan, Tongling, and Ma’anshan showed stable and small increases, while the other PLCS experienced larger increments with marked fluctuations.
5.2. PPM Evaluation of Energy System
The valuation values of the energy system highlight pronounced regional disparities in the caYRD with large variations between high-and low-value PLCs investigated (Figure 4a). Zhoushan ranked the highest in the mean PPM evaluation value, followed by Anqing and Chizhou, while Shanghai and Suzhou scored the lowest (Figure 4b). However, the mean PPM value of most PLCs is relatively high.
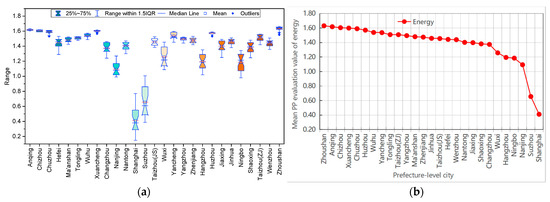
Figure 4.
Boxplot (a) and the mean (b) PPM values of energy system in caYRD in 2005–2023.
From the provincial perspective, Shanghai scored the lowest, which is likely due to its high energy consumption (Figure 4a). In Jiangsu Province, Suzhou and Nanjing had lower scores, correlating with their large economic output and energy demands, while the other PLCs scored higher with greater consistency. In Zhejiang Province, Hangzhou and Ningbo ranked lower, whereas the other PLCs showed higher and more consistent scores. In Anhui Province, Hefei scored lower, while the other PLCs maintained higher and stable values. This reflects that PLCs with larger economies and higher energy consumption tend to have lower energy resource evaluation scores, while smaller economies with lower energy consumption exhibit better consistency.
For the temporal change, the PPM values of a total of 25 PLCs are at high level and fluctuated slightly, while the PLCs of Shanghai and Suzhou are at lower value and experienced the most significant reductions with a variation at 0.6197 and 0.6195, respectively (Figure 5a), this is in accordance with the mean PPM value in energy resource aforementioned in Figure 4b.
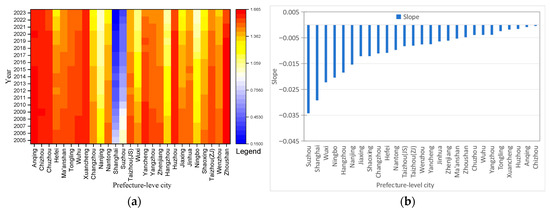
Figure 5.
Heat map (a) and the Slope (b) of PPM values of energy system in caYRD in 2005–2023.
PPM values of energy for all 27 PLCs displayed a decreasing trend during 2005–2023, although the slopes of each PLC have a relatively larger range (Figure 5b), which are likely linked to energy policies and environmental regulations that promote energy conservation and carbon emissions reduction. The linear fitting slope of PPM evaluation value for the energy system in each PLC showed that Ningbo has the largest negative slope of −0.0341, while Changzhou exhibits the smallest decrease slope, with a slope value of −0.00013, suggesting that its evaluation value shows almost no change since 2005.
5.3. PPM Evaluation of Food System
It can be identified that the PLCs Yancheng and Chuzhou have much higher scores evaluated, and most other PLCs scored lower, with Zhoushan ranked lowest and followed by Chizhou based on the PPM evaluation of the food subsystem (Figure 6). The PLCs of high PPM scores (Yancheng, Chuzhou, Nantong, and Hefei) have a large variation range, while the PLCs with lower PPM scores have a minimal variation. This implied that the spatial difference between each PLC is significant in the food resource system in caYRD.
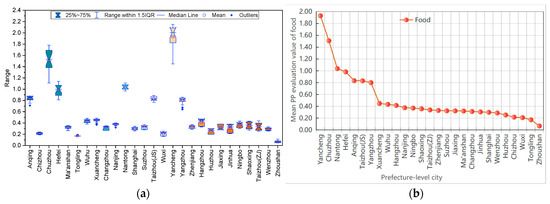
Figure 6.
Boxplot (a) and the mean (b) of PPM values of food system in caYRD in 2005–2023.
Smaller change range and less fluctuation lie in most PLCs of the caYRD, demonstrated by the temporal change in the PPM scores of the food resource system, implying that the food system, especially the food production, is in a relatively balanced state under the fast urban expansion and the industrialization (Figure 7a).
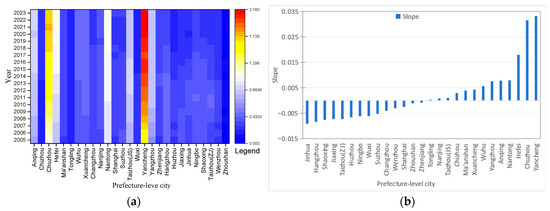
Figure 7.
Heat map (a) and the Slope (b) of PPM values of food system in caYRD in 2005–2023.
Totally 14 PLCs displayed a decreasing trend during 2005–2023, in which Jinhua has a maximal negative slope of −0.0092 and Zhenjiang has a minimal negative slope of −0.001, while 13 PLCs showed an increasing trend in which Yancheng has a maximal slope of 0.0332 and Tongling has a minimal slope of 0.0003 (Figure 7b). At the provincial level, 3 PLCs, Yancheng, Nantong, and Yangzhou in Jiangsu, showed increasing trends; the other 4 PLCs of Jiangsu showed decreasing trends. Shanghai experienced a slight decline, which is possibly linked to greatly reduced agricultural land and rapid urbanization. All PLCs in Zhejiang showed a decreasing trend, which is likely tied to rapid urbanization and land use changes. Conversely, all PLCs in Anhui exhibited increasing trends in which Chuzhou, Hefei, and Anqing showed higher increases, while Chizhou, Tongling, Ma’anshan, Wuhu, and Xuancheng had smaller increments with fewer fluctuations (Figure 7).
5.4. PPM Evaluation of WEF Synergy Capacity
Integrated evaluation of WEF synergy capacity is more complicated in contrast to the above three subsystems; its results showed that Yancheng and Chuzhou, with high food subsystem scores, remained top-ranked, while Shanghai scored lowest (Figure 8).
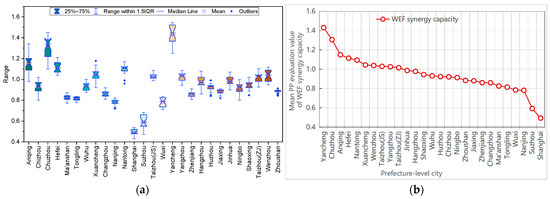
Figure 8.
Boxplot (a) and the mean (b) of PPM values of WEF synergy capacity in caYRD in 2005–2023.
The PCLs like Anqing, Chuzhou, and Yancheng have larger fluctuations, while Zhoushan exhibited the smallest variation during 2005–2023, and the other PLCs generally showed minor fluctuations. Totally 13 PLCs, nearly half of the 27 PLCs, scored a median value between 0.8 and 1.0; this means that the difference mainly falls in the upper or the lower score interval (Figure 8a).
Temporal change and trends in the PPM composite scores of WEF synergy capacity also displayed an evident spatial difference compared with the spatial pattern of the water, energy and food subsystem (Figure 9a). 13 PLCs versus 14 PLCs have a decreasing trend and increasing trend, respectively, in which, Chuzhou has the largest slope while Taizhou (JS) the least slope of the linear fitting analysis (Figure 9b).
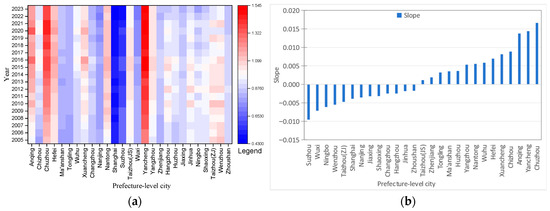
Figure 9.
Heat map (a) and the Slope (b) of PPM values of WEF synergy capacity in caYRD in 2005–2023.
In Jiangsu Province, Yancheng showed a significant increase in WEF synergy capacity score, while other PLCs displayed slight declines; Shanghai exhibited a low-value decrease trend (Figure 9b and Figure 10a). In Zhejiang Province, the PLCs showed a frequent fluctuation with an overall downward trend (Figure 9b and Figure 10b). However, in Anhui Province, most PLCs showed an increasing trend, but the increments were small in Tongling, Ma’anshan, Chizhou, and Wuhu (Figure 9b and Figure 10c).
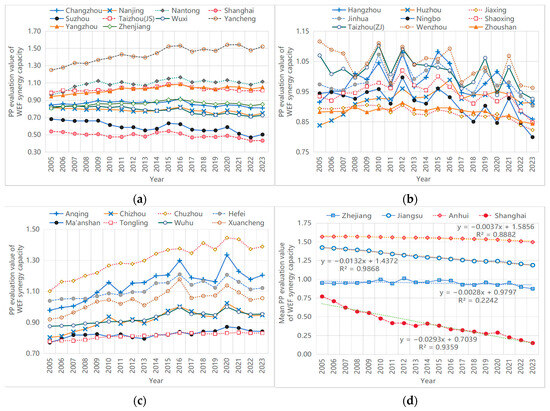
Figure 10.
PPM evaluation values of WEF synergy capacity in caYRD in 2005–2023. (a) Shanghai, and Jiangsu, (b) Zhejiang, (c) Anhui, (d) Mean PPM evaluation values of the PLCs in each province.
For further insight into the spatial pattern of the WEF synergy capacity, Hierarchical Cluster Analysis of the WEF synergy capacity PPM evaluation values of 27 PLCs was conducted to reveal the spatial characteristics in caYRD (Figure 11). The results indicate that the WEF synergy capacity evaluation scores in the region can be spatially categorized into three distinct clusters: High WEF synergy capacity value cluster, Low WEF synergy capacity value cluster, and Mid-level WEF synergy capacity value cluster.
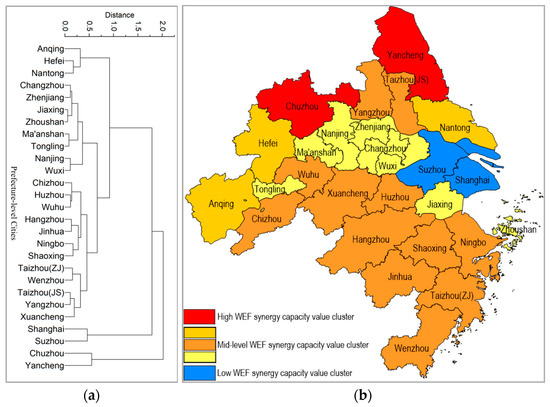
Figure 11.
Cluster of PLCs based on the WEF synergy capacity values in 2005–2023 in caYRD (a) and its spatial pattern map (b).
The High WEF synergy capacity value cluster consists of two PLCs, Yancheng and Chuzhou, with their mean PPM value of 1.3695 during 2005–2023. The Low WEF synergy capacity value cluster consists of Shanghai and Suzhou, with a mean value of 0.5427. The other 22 PLCs are in the Mid-level WEF synergy capacity value cluster and can be further divided into three sub-clusters (Figure 11). Within the Mid-level PPM values cluster, three sub-clusters can be further identified (Figure 11), one is the second-highest value category, including Anqing, Hefei, and Nantong, with an average of 1.1199 during 2005–2023. 7 PLCS, Chizhou, Huzhou, Wuhu, Hangzhou, Jinhua, Ningbo, Shaoxing, Taizhou (ZJ), Wenzhou, Taizhou (JS), Yangzhou, and Xuancheng belong to another cluster, with a mean PPM value of 0.9796. Hence, the third cluster includes Changzhou, Zhenjiang, Jiaxing, Zhoushan, Ma’anshan, Tongling, Nanjing, and Wuxi with a mean of PPPM value of 0.8362.
6. Discussion and Suggestions
6.1. Evaluation of the WEF Subsystems
Spatial differences in water resources might reflect the results of the influencing factors in Zhejiang’s PLCs, such as Hangzhou, Wenzhou, Jinhua, and Taizhou (ZJ) are predominantly economically developed and densely populated areas. Concentrated industrial activities and large populations resulted in the substantial water demands likely contributed to the relatively high evaluation scores of the water subsystem and consistently similar fluctuations in Hangzhou, Wenzhou, Jinhua, and Taizhou (ZJ). Among these four PLCs, Hangzhou has a high mean value and pronounced fluctuations in water resources; it represents a high-value, high-variation city, indicating that water resources significantly impact its economic development with notable uncertainties. This conclusion is relatively consistent with the research by [65,68]; that is, the water resource endowment in relevant cities of Zhejiang Province plays an important role in water security. The concentrated industrial activities and large populations have led to substantial water demands.
At the macro-regional level, the prefecture-level cities (PLCs) in Jiangsu Province and Shanghai showed consistent fluctuation patterns (Figure 3). This may be due to the fact that Jiangsu and Shanghai are geographically closer, both being plain areas, and having more similarities in precipitation and water resource utilization methods. In Zhejiang Province, the prefecture-level cities other than Zhoushan also showed synchronized fluctuations. In Anhui Province, Tongling and Ma’anshan showed stable trends, while other prefecture-level cities had frequent fluctuations. This is related to the more complex spatial distribution of surface watersheds and hilly terrain among the prefecture-level cities in Zhejiang and Anhui Provinces. It is similar to the results of existing research [66,68].
As some influencing factors in the water subsystem have a significant impact on the evaluation values of the WEF system, such as the water production modulus and per capita water resources related to the total amount of water resources. Therefore, attention should be paid to the total amount of water resources and urban sewage treatment capacity, and efforts should be made to improve the water subsystem by increasing the water production modulus and per capita water resources.
The evaluation values of the energy system highlight pronounced regional disparities in the caYRD with large variations between high- and low-value PLCs. From the provincial perspective, the PLCs with higher mean values (e.g., Anqing) exhibited smaller fluctuations, whereas the PLCs with lower values (e.g., Shanghai, Suzhou, Ningbo) showed larger variations.
As the index of energy system is assured be negative which might lead to that the overall PPM evaluation values of energy system are negative slope, this also implies that although the energy consumption has been carefully controlled, the total energy consumption is still growing in, which is an important restrictive factor for the sustainable development of and more fine and effective policy is needed for the caYRD.
By the identification of the key influencing factors of the WEF system, we can find that some influencing factors in the energy subsystem have a great impact on the assessment of the WEF ecosystem, such as primary energy production and power generation installed capacity related to energy supply, energy consumption elasticity coefficient and energy market liquidity related to energy consumption, energy self-sufficiency rate related to energy supply and consumption.
The temporal changes in PPM scores of the food resource system reveal that most PLCs within the caYRD exhibit a narrower range of variation and less fluctuation. This suggests that the food system, particularly food production, remains relatively balanced despite rapid urban expansion and industrialization. Yancheng and Chuzhou have much higher scores evaluated, and most other PLCs scored lower; this spatial disparity is likely related to spatial differences in cultivated land area and grain production (Figure 6a). Yancheng and Chuzhou have a larger amount of arable land, leading to a large agricultural output, while Zhoushan has limited arable land since Zhoushan is an island area mainly covered by rock. The changes in the slope of the food resource system at the provincial level also indicate that the industrial and economic structure, and especially farming land, contribute to the difference in the PPM values.
6.2. Evaluation of WEF Synergy Capacity
Regional differences in WEF synergy capacity are closely related to the PPM evaluation values of the food and energy systems aforementioned. Lower WEF synergy capacity evaluation scores were observed in PLCs with a larger economic amount represented by GDP, and vice versa, reflecting the combined influence of positive food-related indicators and negative energy-related metrics, highlighting significant spatial disparities across the region over the caYRD. This also means the interplay and the interconnection of regional economic scales, resource utilization patterns, and policy impacts on the WEF in caYRD.
Combining the changes in the corresponding WEF system evaluation index of each PLC aforementioned, these spatial clusters disparities among the aforementioned three clusters provide critical insights for formulating region-specific development strategies to optimize the synergy of water, energy, and food systems in caYRD.
Especially for WEF synergy capacity values of PLCs in Zhejiang, those cities have relatively close connections, as Huzhou, Jiaxing, Shaoxing, Ningbo, and Taizhou are related to their surrounding cities, showing that PLCs in Zhejiang province form a relatively close spatial relation network. Therefore, targeted strategies need to be effectively formulated for future WEF utilization and optimization for different PLCs in different clusters, as well as for mutual reference in regional governance among similar areas. Overall, the spatial pattern of WEF synergy capacity is at a good level of heterogeneity, while within different cluster types, their spatial distributions of PLCs are relatively clustered and proximate [42,65].
6.3. Regulation and Policy Suggestions
As the Yangtze River Delta (YRD) is the core area of the world-class urbanized agglomeration, it is featured by a high concentration of population and the consumption of environmental resources. The WEF synergy capacity is directly related to the safe and sustainable development of PLCs in the future. Based on the research findings regarding the spatio-temporal differentiation characteristics and possible influencing factors, some suggestions are put forward to improve the synergy capacity levels.
- (1)
- PLCs such as Shanghai, Hangzhou, Nanjing, and Hefei need to be fully recognized for promoting the WEF synergy capacity through measures such as scientific planning and utilization of environmental resources, especially optimizing the energy resource structure, improving energy utilization efficiency, and saving energy and reducing carbon emissions, thereby enhancing the overall resilience level of WEF.
- (2)
- As there are clusters with high, low, and mid-level evaluation values of WEF synergy capacity. PLCs with different types and characteristics need to adopt differential measures to improve the WEF synergy capacity according to their own development stages. For PLCs categorized as the “High WEF Synergy Capacity Cluster”, it is necessary to continuously stabilize their agricultural system output, improve water resource utilization and the total power capacity of agricultural machinery, as well as enhance agricultural water use efficiency. For PLCs categorized as the “Low WEF Synergy Capacity Cluster”, which mainly include two cities, namely Shanghai and Suzhou, it is necessary to comprehensively improve the utilization efficiency of water and energy resources, save water and energy to enhance the overall synergy capacity, and at the same time, make up for the shortcomings in existing agricultural output. For PLCs categorized as the “Mid-level WEF Synergy Capacity Cluster”, there are significant differences among different PLCs. It is necessary to strengthen the comprehensive improvement approaches for water, energy, and food. On the basis of emphasizing agricultural output, rationally control the utilization methods and consumption of water resources, pay special attention to the optimization of energy consumption, and achieve synergy capacity between economic development and energy consumption.
- (3)
- According to the evaluation results, as well as the variation in resource endowment in caYRD, instability is the common obstacle to WEF synergy capacity since most indicators related to the water and the food system vary in different years. This indicates that infrastructure investment is not consistent with the growing demand for environmental resources, especially in the water and food subsystems. Therefore, it is necessary to invest in and build infrastructure that could meet a stable WEF synergy capacity, because there is still space for its improvement, especially in the context of urbanization and climate change. Furthermore, policies should be made to increase the level of social public management scientifically to promote the WEF synergy capacity.
- (4)
- For policy regulations, it needs to establish cross-departmental/cross-regional WEF synergy governance mechanisms, to integrate the associated cooperation among sectors such as water resources, energy, and agriculture, and to promote technological innovation and application of WEF nexus coupling: Water resource aspect: Develop “water-saving and energy-saving” linkage technologies, as well as technologies like wastewater recycling and energy recovery in the industrial sector. Energy aspect: Prioritize the development of low water-consuming energy technologies to reduce the additional pressure of energy waste on the WEF system. Food aspect: Popularize precision agriculture and low-carbon cultivation technologies to reduce the dependence of the food system on external energy and water resources.
Meanwhile, strengthen the construction of a WEF resource recycling system to form a circular chain of “Food-Energy-Water-Food”, and enhance the integration of urban WEF metabolism systems. Furthermore, it is necessary to establish dynamic monitoring and risk early warning for the WEF system: track regional water resource reserves, energy supply and demand, food production, and key associated indicators among the three (e.g., irrigation energy consumption, water consumption for energy production); identify risks of synergy imbalance (e.g., irrigation interruption caused by energy shortage, drought affecting food and bioenergy supply). Special attention should be paid to economic development planning to predict potential conflicts (e.g., cascading “Water-Energy-Food” shortages under extreme weather) and formulate corresponding emergency plans, so as to improve the resilience of the WEF system.
7. Conclusions
Based on the (PPM evaluation, the spatio-temporal heterogeneity of WEF synergy capacity is evident in caYRD. The conclusions can be summarized as follows:
- (1)
- Spatiotemporal heterogeneity of WEF synergy capacity is clear in caYRD based on PPM evaluation. Not only did the evaluation of each water resource, energy resource, and food resource subsystem display a spatiotemporal heterogeneity, but the integrated WEF synergy capacity index also has prominent spatiotemporal differences. The integrated evaluation of WEF synergy capacity reveals that Yancheng scored the highest, while Shanghai had the lowest score. Chuzhou has the highest fluctuation range, while Taizhou (JS) has the lowest. At the provincial scale, Anhui ranked the highest, followed by Jiangsu and Zhejiang, and Shanghai had the lowest average score in the yearly average of WEF synergy capacity values of each PLC.
- (2)
- The whole 27 PLCs can be divided into three clusters by the WEF synergy capacity values in caYRD. The High values cluster includes Yancheng and Chuzhou, the Low values cluster consists of Shanghai and Suzhou, and the Mid-level values cluster consists of the other 22 PLCs, and these 22 PLCs are further divided into three sub-clusters.
- (3)
- Energy has a more prominent overall impact on WEF synergy capacity compared to the relatively stable water and food resource systems due to population growth and urbanization development, especially industrial growth, which has increased demand for energy and resources and thus altered WEF synergy capacity. Additionally, economically developed PLCs such as Shanghai, Suzhou, Wuxi, Changzhou (in southern Jiangsu), and Hangzhou tend to have lower PPM evaluation values, mainly because of urban land expansion and a relative reduction in arable land area. By contrast, major PLCs in Anhui and northern Jiangsu have relatively higher WEF synergy capacity values, as they have weaker industrialization and less land occupied by urban expansion. The potential impact of these factors on the WEF nexus and the clustering results of WEF synergy capacity requires special attention to the production and consumption control of energy and food resources in the optimization and development strategies of WEF synergy capacity for the corresponding PLCs.
- (4)
- Policy guideline is suggested as: To establish cross-departmental/regional WEF governance, integrate water-energy-agriculture collaboration, and advance WEF Nexus technology. Especially, Shanghai, Hangzhou, Nanjing, Hefei, and other PLCs should use scientific environmental resource planning (e.g., optimizing energy structure, boosting energy efficiency, energy-saving, and carbon reduction) to enhance WEF synergy and overall resilience. Further, to develop “water-energy saving” technology, additional industrial wastewater recycling and energy recovery are needed for the water system. Prioritize low water-consuming energy tech to cut WEF pressure from energy waste for the energy subsystem. Promote precision agriculture and low-carbon cultivation to reduce the food system’s external water/energy reliance for the food system.
- (5)
- The main contributions of this article are to analyze the synergy capacity level of the WEF system in the caYRD using the PPM method. Firstly, indicators chosen in the evaluation system that take into account the interconnected indicators of resource-energy efficiency are correlated with agriculture, which is most directly associated with the WEF Nexus. Then, the study further reveals the system’s spatiotemporal distribution characteristics and explores the potential primary drivers behind these patterns. Unlike most existing studies, which place emphasis on the individual coupling analysis between water, energy, and food, this research delivers an evaluative analysis that treats the WEF system as an integrated entity.
8. Limitations
Due to the complexity of the interaction between the WEF nexus and the limitation of indicators, data, and materials, this paper only included a preliminary discussion on the assessment of spatiotemporal variation in WEF synergy capacity of 27 PLCs in caYRD from the perspective of water resource, energy resource, and food resource subsystems. It is surely necessary to further optimize the index system and the detailed influencing factors of the WEF system in the future, to include more perspectives and to compare different PLCs, so as to more systematically demonstrate a clear reveal of the WEF synergy capacity in caYRD. Furthermore, efforts should be further strengthened to conduct a deterministic analysis of the key influencing factors underlying the symbiotic coordination of the WEF system in future research. Meanwhile, studies on changes in WEF synergy capacity and its adaptability under the impact of climate change and other related topics remain to be further explored.
Author Contributions
Conceptualization, Z.Y. and Z.L.; Funding acquisition, Z.Y. and H.X.; Methodology, Z.Y., Z.L. and Q.R.; Project administration, Z.Y.; Software, Z.Y., Z.L. and Q.R.; Supervision, J.W., M.F., and H.X.; Writing—original draft, Z.Y. and Z.L.; Writing—review and editing, Z.Y. All authors have read and agreed to the published version of the manuscript.
Funding
This research was funded by the Humanity and Social Sciences Foundation of the Ministry of Education of China (Grant No: 22YJAZH135; 22YJAZH121).
Institutional Review Board Statement
This study complies with the Measures for Ethical Review of Science and Technology established by the Ethics Committee for Science and Technology of China. And the authors confirm that the study has been conducted ethically and responsibly, in full compliance with the relevant experimentation codes and legislation.
Data Availability Statement
The data presented in this study are available on request from the corresponding author.
Conflicts of Interest
The authors declare no conflicts of interest.
Abbreviations
The following abbreviations are used in this manuscript:
| WEF | Water, energy, and food |
| YRD | Yangtze River Delta |
| caYRD | Central area of Yangtze River Delta |
| PLCs | Prefecture-level cities |
| GDP | Gross Domestic Product |
| PPM | Projection Pursuit Model |
References
- Hoff, H. Understanding the Nexus: Background Paper for the Bonn 2011 Nexus Conference; Stockholm Environment Institute (SEI): Stockholm, Sweden, 2011; Available online: https://www.sei.org/mediamanager/documents/Publications/SEI-Paper-Hoff-UnderstandingTheNexus-2011.pdf (accessed on 13 October 2025).
- FAO. The Water-Energy-Food Nexus: A New Approach in Support of Food Security and Sustainable Agriculture; FAO: Rome, Italy, 2014. [Google Scholar]
- Eriksson, N.; Avellán, T.; Teutschbein, C.; Blicharska, M. Towards a common understanding of water-energy-food nexus research: A view of the European nexus community and beyond. Sci. Total Environ. 2025, 967, 178775. [Google Scholar] [CrossRef] [PubMed]
- Dominguez, P. Thinking About Water Differently: Managing the Water-Food-Energy Nexus; Asian Development Bank: Manila, Philippines, 2013. [Google Scholar]
- Googin, C.; Pu, H.; Chen, J. Exploring The Water-Energy-Food (WEF) Nexus Through an Industry Perspective on New Technology. Technol. Innov. 2025, 2454188. [Google Scholar] [CrossRef]
- Wang, H.R.; Zhao, W.J.; Deng, C.Y.; Jan, J.-W. Analysis on Issues of Water-energy-food Nexus. J. Nat. Resour. 2022, 37, 307–319, (In Chinese with English Abstract). [Google Scholar] [CrossRef]
- Elminshawy, N.A.; Osama, A.; Gagliano, A.; Oterkus, E.; Tina, G.M. A Technical and Economic Evaluation of Floating Photovoltaic Systems in the Context of the Water-energy Nexus. Energy 2024, 303, 131904. [Google Scholar] [CrossRef]
- Albrecht, T.R.; Crootof, A.; Scott, C.A. The Water-energy-food Nexus: A Systematic Review of Methods for Nexus Assessment. Environ. Res. Lett. 2018, 13, 043002. [Google Scholar] [CrossRef]
- Allan, T.; Keulert, Z.M.; Woertz, E. The Water-food-energy Nexus: An Introduction to Nexus Concepts and Some Conceptual and Operational Problems. Int. J. Water Resour. Dev. 2015, 31, 301–311. [Google Scholar] [CrossRef]
- Wang, Y.; Xie, Y.; Qi, L.; He, Y.; Bo, H. Synergies Evaluation and Influencing Factors Analysis of the Water-energy-food Nexus from Symbiosis Perspective: A Case Study in the Beijing-Tianjin-Hebei Region. Sci. Total Environ. 2022, 818, 151731. [Google Scholar] [CrossRef]
- Hao, L.G.; Yu, J.J.; Wang, P.; Han, C. Analysis of the Water-energy-food Nexus System for Sustainable Development and its Research Framework. Prog. Geogr. 2023, 42, 173–184, (In Chinese with English Abstract). [Google Scholar] [CrossRef]
- Shang, H.Y.; Hu, Y.; Su, F. Review on the Water-energy-food Nexus. J. Earth Sci. Environ. 2025, 47, 397–413, (In Chinese with English Abstract). [Google Scholar]
- Cansino-Loeza, B.; MunguÍA-Lopez, A.D.C.; Ponce-Ortega, J.M. A water-energy-food security nexus framework based on optimal resource allocation. Environ. Sci. Policy 2022, 133, 1–16. [Google Scholar] [CrossRef]
- Raya-Tapia, A.Y.; Cansino-Loeza, B.; Sánchez-Zarco, X.G.; Ramírez-Márquez, C.; Martín, M.; Ponce-Ortega, J.M. A spatial and temporal assessment of resource security in the water, energy, food and waste nexus in Spain. Sustain. Prod. Consum. 2023, 39, 109–122. [Google Scholar] [CrossRef]
- Huang, R.H.; Cui, S.M.; Wang, X.J.; Huang, X.; Cao, X.C. Spatio-temporal differentiation and obstacle mechanism of sustainability of the water energy-food nexus system in the middle reaches of the Yellow River. J. Soil Water Conserv. 2025, 39, 369–379, (In Chinese with English Abstract). [Google Scholar]
- Zhao, H.; Li, Z.L.; Wang, H.R.; Liu, Y.X.; Li, M. Simulation and resilience regulation of water-energy-food-carbon nexus in the middle reaches of the Yellow River. J. North China Univ. Water Resour. Electr. Power (Nat. Sci. Ed.) 2024, 45, 9–19, (In Chinese with English Abstract). [Google Scholar]
- Bo, B.I.; Chen, D.; Deng, P.; Zhang, D.; Zhu, L.Y.; Zhang, P. The Evolutionary Characteristics Analysis of Coupling and Coordination of Regional Water-energy-food. China Rural Water Hydropower 2018, 2, 72–77, (In Chinese with English Abstract). [Google Scholar]
- Ren, X.Y.; Tan, Y.R.; Wu, F.C.; Si, T.; Wang, Z. Collaborative Development Model of Regional Water-energy-food Nexus. Bull. Soil Water Conserv. 2021, 41, 218–225, (In Chinese with English Abstract). [Google Scholar]
- Mondal, K.; Chatterjee, C.; Singh, R. Examining the Coupling and Coordination of Water-energy food Nexus at a Sub-national Scalein India: Insights from the Perspective of Sustainable Development Goals. Sustain. Prod. Consum. 2023, 43, 140–154. [Google Scholar] [CrossRef]
- Li, C.Y.; Zhang, S.Q. Chinese Provincial Water-energy-food Coupling Coordination Degree and Influencing Factors Research. China Popul. Resour. Environ. 2020, 30, 120–128, (In Chinese with English Abstract). [Google Scholar]
- Wang, Z.H.; Chen, B.H. Spatio-temporal Coupling and Spatial Effect of Economic Growth-ecological Environment-population Agglomeration: A Case Study of Songhua River Basin. Ecol. Econ. 2023, 39, 171–177,186, (In Chinese with English Abstract). [Google Scholar]
- Sun, C.Z.; Hao, S. Coordination Degree and Differential Optimizing of Water-energy-food System in China. Yangtze River 2023, 54, 12–20, (In Chinese with English Abstract). [Google Scholar]
- Egieya, J.; Parker, Y.; Hofmann, V.; Daher, B.; Gorgens, J.; Goosen, N. Predictive Simulation of the Water-energy-food Nexus for the City of Cape Town. Sci. Total Environ. 2024, 934, 173289. [Google Scholar] [CrossRef] [PubMed]
- Fu, Y.B.; Ren, Y.T.; Pei, W. Evaluation of the Symbiosis Level of the Water-energy-food Complex System Based on the Improved Cloud Model: A Case Study in Heilongjiang Province. Environ. Sci. Pollut. Res. Int. 2023, 30, 22963–22984. [Google Scholar] [CrossRef] [PubMed]
- Diasi, Y.P.; Lazaro, L.L.B.; Barros, V.G. Water-energy-food Security Nexus: Estimating Future Water Demand Scenarios Based on Nexus Thinking: The Watershed as a Territory. Sustainability 2023, 15, 7050. [Google Scholar] [CrossRef]
- Luo, W.; Yang, X.Z.; Yang, Y.F.; Cheng, S.Y. Synergistic evolution and prediction of water-energy-food nexus in the Yellow River Basin. Resour. Sci. 2022, 44, 608–619, (In Chinese with English Abstract). [Google Scholar]
- Saidmamatov, O.; Rudenko, I.; Pfister, S.; Koziel, J. Water-energy–food nexus framework for promoting regional integration in Central Asia. Water 2020, 12, 1896. [Google Scholar] [CrossRef]
- Venghaus, S.; Dieken, S. From a few security indices to the FEW security index: Consistency in global food, energy and water security assessment. Sustain. Prod. Consum. 2019, 20, 342–355. [Google Scholar] [CrossRef]
- Soleimanian, E.; Afshar, A.; Molajou, A. A review on water simulation models for the WEF nexus: Development perspective. Environ. Sci. Pollut. Res. 2022, 29, 79769–79785. [Google Scholar] [CrossRef] [PubMed]
- Mayor, B.; López-Gunn, E.; Villarroya, F.I.; Montero, E. Application of a Water-energy-food nexus framework for the Duero river basin in Spain. Water Int. 2015, 40, 791–808. [Google Scholar] [CrossRef]
- Conway, D.; Van Garderen, E.A.; Deryng, D.; Dorling, S.; Krueger, T.; Landman, W.; Lankford, B.; Lebek, K.; Osborn, T.; Ringler, C.; et al. Climate and southern Africa’s Water-Energy-Food nexus. Nat. Clim. Change 2015, 5, 837–846. [Google Scholar] [CrossRef]
- Hao, L.; Yu, J.; Wang, P.; Han, C.; Gojenko, B.; Qu, B.; Jiang, E.; Muminov, S. A comprehensive assessment indicator of the water-energy-food nexus system based on the material consumption relationship. J. Hydrol. 2024, 633, 130997. [Google Scholar] [CrossRef]
- Liu, Y.; Jiang, Y.; Xu, C.; Lyu, J.; Su, Z. A quantitative analysis framework for water-food-energy nexus in an agricultural watershed using WEAP-MODFLOW. Sustain. Prod. Consum. 2022, 31, 693–706. [Google Scholar] [CrossRef]
- Ling, M.; Qi, T.; Li, W.; Yu, L.; Xia, Q. Simulating and predicting the development trends of the Water–energy–food–ecology system in Henan Province, China. Ecol. Indic. 2024, 158, 111513. [Google Scholar] [CrossRef]
- Owen, A.; Scott, K.; Barrett, J. Identifying critical supply chains and final products: An input-output approach to exploring the energy-water-food nexus. Appl. Energy 2018, 210, 632–642. [Google Scholar] [CrossRef]
- Vats, G.; Sharma, D.; Sandu, S. A flexible input-output price model for assessment of a nexus perspective to energy, water, food security policymaking. Renew. Sustain. Energy Transit. 2021, 1, 100012. [Google Scholar] [CrossRef]
- Chen, C.; Fen, K.; Ma, H. Uncover the interdependent environmental impacts associated with the water-energy-food nexus under resource management strategies. Resour. Conserv. Recycl. 2020, 160, 104909. [Google Scholar] [CrossRef]
- Yue, Q.; Gu, P. Managing agricultural water-energy-food-environment nexus considering water footprint and carbon footprint under uncertainty. Agric. Water Manag. 2021, 252, 106899. [Google Scholar] [CrossRef]
- Zhou, F.; Zhang, W.; Jiang, A.; Peng, H.; Li, L.; Deng, L.; Sun, Y.; Wang, H. Spatial-temporal variation characteristics and coupling coordination of the “water resources-water environment-water ecology” carrying capacity in the three gorges reservoir area. Ecol. Indic. 2023, 154, 110874. [Google Scholar] [CrossRef]
- Ravar, Z.; Zahrai, B.; Sharifinejad, A. System dynamics modeling for assessment of water-food-energy resources security and nexus in gavkhuni basin in Iran. Ecol. Indic. 2020, 108, 105682. [Google Scholar] [CrossRef]
- Chen, X.; Li, Y.; Gao, P.; Liu, J.; Zhang, H. A multi-scenario BP-neural-network ecologically-extended input-output model for synergetic management of water electricity nexus system: A case study of Fujian province. J. Clean. Prod. 2023, 399, 136581. [Google Scholar] [CrossRef]
- Chen, Y.; He, Z.; Niu, X.; Huang, D. How water resource management policies shape the coupled coordination development of the water-energy-food nexus: Evidence from the dual pathways of taxation and property rights. J. Environ. Manag. 2025, 381, 125311. [Google Scholar] [CrossRef]
- Rezaei Kalvani, S.; Celico, F. The Water-Energy-Food Nexus in European Countries: A Review and Future Perspectives. Sustainability 2023, 15, 4960. [Google Scholar] [CrossRef]
- Tye, M.R.; Wilhelmi, O.; Boehnert, J.; Faye, E.; Milestad, R.; Pierce, A.L.; Laborgne, P. Examining urban resilience through a food-water-energy nexus lens to understand the effects of climate change. iScience 2024, 27, 110311. [Google Scholar]
- Bai, J.F.; Zhang, H.J. Spatio-temporal Variation and Driving Force of Water-Energy-Food Pressure in China. Sci. Geogr. Sin. 2018, 38, 1653–1660, (In Chinese with English Abstract). [Google Scholar]
- Sun, C.Z.; Zhou, Z.; Zhao, L.S. System Simulation of Water-Energy-Food in Southwest China Based on SD model. Econ. Geogr. 2021, 41, 20–29, (In Chinese with English Abstract). [Google Scholar]
- Chapagain, K.; Babel, M.S.; Karthe, D.; Stamm, J. Integrated assessment of water-energy-food nexus: Conceptual framework and application to the Ping River basin, Thailand. Int. J. Water Resour. Dev. 2023, 40, 284–318. [Google Scholar] [CrossRef]
- Qin, J.; Duan, W.; Chen, Y.; Dukhovny, V.A.; Sorokin, D.; Li, Y.; Wang, X. Comprehensive Evaluation and Sustainable Development of Water-Energy-Food-Ecology Systems in Central Asia. Renew. Sustain. Energy Rev. 2022, 157, 112061. [Google Scholar] [CrossRef]
- Foran, T. Node and regime: Interdisciplinary analysis of water-energy-food nexus in the Mekong region. Water Altern. 2015, 8, 655–674. [Google Scholar]
- Keskinen, M.; Guillaume, J.H.A.; Kattelus, M.; Porkka, M.; Räsänen, T.A.; Varis, O. The Water-Energy-Food Nexus and the Transboundary Context: Insights from Large Asian Rivers. Water 2016, 8, 193. [Google Scholar] [CrossRef]
- Putra, M.P.I.F.; Pradhan, P.; Kropp, J.P. A systematic analysis of Water-Energy-Food security nexus: A South Asian case study. Sci. Total Environ. 2020, 728, 138451. [Google Scholar] [CrossRef]
- Jones-Crank, J.L. The contribution of water-energy-food nexus governance to sustainability: A case study of Singapore. Environ. Sci. Policy 2024, 160, 103849. [Google Scholar] [CrossRef]
- Mabhaudhi, T.; Mpandeli, S.; Madhlopa, A.; Modi, A.T.; Backeberg, G.; Nhamo, L. Southern Africa’s Water–Energy Nexus: Towards Regional Integration and Development. Water 2016, 8, 235. [Google Scholar] [CrossRef]
- Madani, Z.; Natcher, D. Water, Energy and Food (WEF) Nexus in the Changing Arctic: An International Law Review and Analysis. Water 2024, 16, 835. [Google Scholar] [CrossRef]
- Liu, J.; Liu, C.; Li, X.; Wang, G.; Bao, Z. Security evaluation of water-energy-food nexus system in China. Hydro-Sci. Eng. 2020, 4, 24–32, (In Chinese with English Abstract). [Google Scholar]
- Han, C.; Han, X.; Ma, B.; Li, D.; Wang, Z.; Hao, Z.; Zhang, X. Research on the Coupling Coordination Relationship and Spatial Equilibrium Measurement of the Water-Energy-Food Nexus System in China. Water 2025, 17, 527. [Google Scholar] [CrossRef]
- Lu, Z.Y.; Li, H.M. Synergistic Development of the Water-Energy-Food Nexus System in Chinese Agriculture and Its Influencing Factors. Econ. Geogr. 2024, 44, 177–186, (In Chinese with English Abstract). [Google Scholar]
- Sun, C.Z.; Wei, Y.Q.; Zhao, L.S. Co-evolution of water-energy-food nexus in arid areas: Take Northwest China as an example. J. Nat. Resour. 2022, 37, 320–333, (In Chinese with English Abstract). [Google Scholar] [CrossRef]
- Huang, R.; Liu, H. Evaluation and External Driving Factors Analysis of Water–Energy–Food Resilience Security-Based on Spatial Durbin Model and Four Provinces Along the Yellow River. Sustainability 2024, 16, 10126. [Google Scholar] [CrossRef]
- Peng, S.M.; Zheng, X.K.; Wang, Y.; Jiang, G. Study on water-energy-food collaborative optimization for Yellow River basin. Adv. Water Sci. 2017, 28, 681–690, (In Chinese with English Abstract). [Google Scholar]
- Wang, Y.; Li, N.; Song, J.; Li, Q. Solving the sustainable development dilemma in the Yellow River Basin of China: Water-energy-food linkages. J. Clean. Prod. 2025, 490, 144797. [Google Scholar] [CrossRef]
- Wang, H.M.; Hong, J.; Liu, G. Simulation research on different policies of regional green development under the nexus of water-energy-food. China Popul. Resour. Environ. 2019, 29, 74–84, (In Chinese with English Abstract). [Google Scholar]
- Chen, J.F.; Shi, Y.Q.; Yan, X.D. WEF industry correlation and ripple effect in Yangtze River Economic Belt. South–North Water Transf. Water Sci. Technol. 2023, 21, 597–607, (In Chinese with English Abstract). [Google Scholar]
- Zhang, Z.H.; Sun, S.M.; Gao, J. Evolution characteristic and influencing mechanism of water-energy-food stress in Yangtze River Delta Urban Agglomeration. J. Nat. Resour. 2022, 37, 1586–1597, (In Chinese with English Abstract). [Google Scholar] [CrossRef]
- Zhu, Y.; Zhang, C.; Huang, D. Assessing Urban Water–Energy–Food Security: A Case of Yangtze River Delta Urban Agglomeration. Soc. Indic. Res. 2024, 175, 487–516. [Google Scholar] [CrossRef]
- Ji, J.; Chen, J.F.; Deng, M.H.; Gu, Y.; Yan, X.D. Simulation and optimization of water-energy-food-ecosystem nexus under green development in the Yangtze River Delta region. Soft Sci. 2023, 37, 105–114, (In Chinese with English Abstract). [Google Scholar]
- Deng, P.; Chen, J.; Chen, D.; Shi, H.Y.; Bi, B.; Liu, Z.; Yin, Y.; Cao, X.C. The evolutionary characteristics analysis of the coupling and coordination among water, energy and food: Take Jiangsu Province as an example. J. Water Resour. Water Eng. 2017, 28, 232–238, (In Chinese with English Abstract). [Google Scholar]
- Chen, W.; Chen, Y. Pre-Warning Measurement of Water Resources Security in the Yangtze River Basin from the Perspective of Water-Energy-Food Symbiosis. Water 2021, 13, 475. [Google Scholar] [CrossRef]
- Chen, W.; Chen, Y. Two-Step Measurement of Water–Energy–Food Symbiotic Coordination and Identification of Key Influencing Factors in the Yangtze River Basin. Entropy 2021, 23, 798. [Google Scholar] [CrossRef]
- Tang, Q.Y.; Zhang, C.X. Data Processing System (DPS) software with experimental design, statistical analysis and data mining developed for use in entomological research. Insect Sci. 2013, 20, 254–260. [Google Scholar] [CrossRef]
- Zhang, J.J.; Guo, Z.F. Comprehensive evaluation on the agricultural drought risk in Henan Province based on Projection Pursuit Model. J. Arid Land Resour. Environ. 2016, 30, 83–88, (In Chinese with English Abstract). [Google Scholar]
- Jin, J.L.; Yang, T.Z.; Li, J.Q.; Chen, M.L.; Ning, S.W.; Zhang, H.Y. Application of projection pursuit method in assessment and prediction of water resources carrying capacity. Hydro-Sci. Eng. 2020, 4, 10–16, (In Chinese with English Abstract). [Google Scholar]
- He, L.X.; Zhou, S.Y.; Zhang, Z.; Li, Z.H. Water-energy-food-population system security evaluation based on projection pursuit model. Yellow River 2024, 46, 73–78, (In Chinese with English Abstract). [Google Scholar]
Disclaimer/Publisher’s Note: The statements, opinions and data contained in all publications are solely those of the individual author(s) and contributor(s) and not of MDPI and/or the editor(s). MDPI and/or the editor(s) disclaim responsibility for any injury to people or property resulting from any ideas, methods, instructions or products referred to in the content. |
© 2025 by the authors. Licensee MDPI, Basel, Switzerland. This article is an open access article distributed under the terms and conditions of the Creative Commons Attribution (CC BY) license (https://creativecommons.org/licenses/by/4.0/).