Abstract
Soil pollution by petroleum hydrocarbons is a problem of concern to researchers in various domains. Many depollution methods exist for these situations, but not in all cases can the pollutant be recovered. Soil, an important environmental factor, has to be kept clean and often has to be returned to agricultural use. A common situation of accidental soil pollution is the transportation of petroleum products through pipelines. In this paper, a study is presented that highlights a fast-acting option for significant pollutant recovery, thus limiting major soil pollution. A study on the use of electrodes to help achieve these objectives is proposed. Three working variants have been established, with different electrodes (stainless steel and copper). The degrees of depollution achieved during one week with a working voltage of 12 V were determined. The highest degree of depollution (52.94%) was obtained for copper electrodes. Although electrokinetic depollution is mainly applied to polluted waters and for the removal of metals, the method proved to be efficient also for an agricultural soil polluted with 7% diesel oil. Nutrients (NPKs) and wash water were analyzed before and after depollution to verify if secondary pollution was present.
1. Introduction
In the case of an accidental surface spill of petroleum products, the negative effects spread within a short time after the accident, in particular in the upper soil profile due to its high viscosity, but also into the atmosphere through evaporation of slightly volatile compounds. In the case of gasoline or diesel oil, the pollution can extend to the soil, subsoil, and even the water table. Migration occurs by successive impregnation with the pollutant. In highly permeable soils, penetration occurs in the vertical direction, whereas in less permeable soils, capillary forces play a much more important role and penetration is predominantly in the horizontal direction. It is therefore necessary to choose the most appropriate methods of depollution. Electrokinetic depollution is the preferred method, especially for pollutant recovery without affecting other environmental factors. The presence of the electrodes and the presence of water cause the pollutant to migrate through the soil structure to a collection area where it can be recovered. Electrokinetic soil remediation is the extraction of pollutants from the soil by controlled movement of the pollutants into the moist underground environment under the action of an electric field formed by electrodes. Under the action of the electric current in the underground environment, phenomena that favor the extraction of pollutants take place: electrolysis, electro-migration, electro-osmosis, and electrophoresis. Electrolysis is the phenomenon of decomposition of an electrolyte in the presence of electric current by the migration of electrolyte ions to the electrodes subject to the potential difference; electro-migration is the transport of ions under the influence of the electric field, with positive ions moving towards the cathode and negative ions towards the anode; electro-osmosis is the process by which, under the influence of an electric current, water in the soil moves from the anode to the cathode, creating an electroosmotic flux; and electrophoresis is the movement of electrically charged particles under the influence of an electric field. Literature data recommend the use of electrodes in hydrocarbon-polluted soils in various positions, among which we mention the following: circular, with the cathode centrally located, with the anodes placed parallel and at one end of the cathode, or with the anodes in a square and the cathode centrally located [1,2,3,4,5,6,7]. There are studies on the use of facilitating agents for the electrokinetic method, in particular the use of surfactants, when a degree of depollution between 63 and 98% was obtained [8]. Other authors recommend the use of selected oxidants, achieving up to 65% remediation for historically polluted soils (more than 16 years of standing pollutant in the soil) [9,10]. Compared with the electrokinetic method, the following can also be used: thermal depollution methods, when the degree of depollution can be maximized (in the case of combustion depollution), but two disadvantages of the method arise: destruction of organic material in the soil structure and air pollution by flue gases resulting from the combustion of fuel and from the combustion of the pollutant [11]. In the case of thermal desorption at 400 °C, the electric heating method is preferred for a depollution degree of more than 90% for light pollutants, compared to the method using fuel combustion. The disadvantage of the method is the power consumption and its cost [12]. In the case of depollution by successive solvent extraction, the degree of depollution can also be high, depending on the number of solvents used [13]. Also, in the case of bioremediation, there is interest among specialists in achieving a higher degree of depollution, almost 83% [14]. After the application of the thermal depollution method through combustion, it is important to mix the decontaminated soil with clean soil with a high humic acid content, which is responsible for restoring the germination potential [15]. In recent studies, various electrode materials have been presented, and capacitive deionization (CDI) technology has been highlighted. The advantages of these new materials are presented: carbon nanotubes and graphene, which are expected to improve electrode activity. The advantages of the capacitive deionization (CDI) method are low energy consumption (0.1–2 kWh/m3) and reduced pollution side effects. Electrode activity enhancement has an application described in the literature as desalination of seawater and wastewater treatment [16]. Several authors have addressed the issue of secondary pollution (such as pollution of effluent water) in order to prevent its occurrence and to preserve the macronutrient balance of the soil. Titanium and iron electrodes have been compared for phosphorus removal, with iron being preferred, and soils with low permeability were used for the study. The consumption of phosphorus in the soil was tracked to prevent excessive fertilization [17]. Other authors claim that the presence of electrodes increases efficiency and durability, proposing hybrid technologies (electrocoagulation and biological treatments) [18]. Combining electrokinetic remediation with phytoremediation for heavy metal polluted soils using graphite plate electrodes is also proposed [19]. Other authors recommend the removal of metals by the electrokinetic method with different electrode positions, parallel electrode configurations, and hexagonal electrode configurations [20,21]. Specifically for arsenic removal, electrokinetic depollution with titanium with iridium electrodes was used, using the electrolytes NaOH, oxalic acid, and citric acid [22]. Therefore, as the electrokinetic depollution method is mainly recommended for wastewater treatment and for metal removal, the proposed method with different types of electrodes follows the possibility of removing the pollutant—a petroleum product. Selecting an appropriate method for remediating petroleum hydrocarbon-contaminated soils is a complex task. In accidental pollution situations with hydrocarbons, action must be taken as quickly as possible. Such pollutants penetrate quickly into the soil structure, both vertically and horizontally. The advantage of the proposed method is that the pollutant can be recovered to a greater extent than with the other methods mentioned. In order to avoid any side effects on environmental sustainability, control tests were carried out for the washing water, for the nutrient content before and after the proposed electrokinetic depollution. Special attention is dedicated to nitrogen in the soil structure [23,24].
The latest studies show the possibility of combining the electrokinetic remediation method with phytoremediation and bioremediation, but using expensive electrodes. (Ti/Ru and graphite). Thus, the possibility of removing mercury using a pulsed electric field is presented [25]. It is also recommended to combine the electrokinetic method with reactive filter media and graphite electrodes to remove heavy metals [26].
The paper [27] presents a summary of the efficiency of reverse polarity for improving the performance of the electrokinetic decontamination method. The method, combined with phytoremediation, has advantages and disadvantages. A decontamination rate of 35.1% is mentioned for soil contaminated with diesel oil.
A recent study also presents a detailed analysis of biological remediation techniques. This remediation technique is the most frequently studied [28,29].
An extensive study is dedicated to interfacial processes that highlight the optimization of soil decontamination [30].
With regard to agricultural soil, there are global concerns about the elimination of petroleum hydrocarbons and soil remediation. Research has been conducted on certain types of crops, and the following recommendations have been made: for soybean crops, the authors recommend remediation through chemical oxidation combined with biological remediation [31] and for corn crops, there are studies on the use of sorbents, which have stimulated soil enzyme activity and accelerated the degradation of petroleum products [32].
Therefore, the health of agricultural soil means the overall health of environmental factors, and this paper introduces the possibility of rapid recovery of pollutants accidentally spilled on agricultural soil.
In this study, agricultural soil was chosen because, due to its high content of organic matter (humic acids), it has a medium retention capacity (kg/m3 dry soil) for liquids (water and diesel oil); this is due to the agglutination of the aggregates in the structure, with high formation of big particles. The retention capacity varies inversely proportional to the permeability (cm3/h), a property that ensures the penetration of liquids into the soil.
The choice of the pollutant was based on its physical properties. Since there are many real situations where, accidentally, the pollutant is even diesel oil, this choice was obvious. The controlled contamination level used in the laboratory (7%) reflects the average concentrations typically found in real field conditions, such as those caused by leaks or cracks in transportation pipelines.
Immediately after a pipeline burst, petroleum hydrocarbons tend to spread to the surface and penetrate the soil structure if the soil is permeable. The degree of penetration into the soil also depends on the nature of the soil and the nature of the spilled products. Lower viscosity products will penetrate the soil faster than more viscous products. The vertical component of pollutant penetration into the soil is due to gravity, and the horizontal component is due to capillary action. Migration of the pollutant occurs by successive impregnation of large areas. In highly permeable soils, penetration occurs predominantly in the vertical direction, whereas in less permeable soils, capillary forces play a more important role and penetration occurs predominantly in the horizontal direction.
The proposed method has the advantage of rapidly removing a significant portion of the pollutant, which, fortunately, can be reused. Compared to other methods, biological depollution does not ensure the recovery of the pollutant, only its irreversible degradation. When thermal methods are applied, the original organic material is destroyed, but so is the pollutant (400 °C during desorption and 800 °C during combustion). In addition, ecological reconstruction (adding and mixing with fresh soil) is used to restore germination potential.
When we talk about the main pipelines for transporting petroleum products, which can crack, urgent action is required. The paper proposes, in the first phase, the possibility of recovering a significant amount of pollutants. The aim is to apply a method that is both fast and economical. The proposed method is based on washing the contaminated soil with water in the laboratory in the presence of different types of electrodes. For comparison, a sample without electrodes was also tested.
2. Materials and Methods
2.1. Presentation of Experimental Stands
Based on data from the literature, the study started from the idea of recovering pollutants spilled on soil. The electrokinetic method, applied for wastewater treatment or for removing metals from soil, was tested for this purpose. The first tests were performed on a setup without electrodes, based on washing the contaminated soil with water. Then, several types of electrodes were used, of the same length but made of different materials (stainless steel and copper) and shapes (rectangular and cylindrical).
For the experiments, the following were used: a plastic box, agricultural soil, diesel oil, electrodes, and a power source.
The experimental setup started from the idea of imitating soil horizons down to the water table.
- –
- A plastic box (length 37 cm, width 25 cm, height 15 cm) was chosen in which the following was mounted: a plastic plate with dense and symmetrical holes at 2 cm above the bottom of the box. A layer of gauze (canvas low) was placed to prevent the holes from clogging with solid aggregates of sand and soil. A fine layer of sand, a layer of lightly moistened soil, and then a layer of soil taken directly from the field were placed in the box from bottom to top. Holes were also made at the bottom of the box for the removal of both washing water and pollutants. Holes in the bottom of the vessel were placed in the cathode zone for all experiments, where the hydrocarbons were predominantly directed, but could be placed at any point just for collection, as a rigid plastic plate with holes was placed under the thinnest layer.
- –
- Agricultural soil was chosen for which the physical properties were determined: density, capillarity, granulometry, permeability, pH, nutrient content (NPK), water content, and electrical conductivity. The determination methods are described in the literature [13].
- –
- A pollutant was chosen—diesel oil—for which density and viscosity at various temperatures were determined; these two properties are responsible for the penetration of the pollutant into the soil structure. All physical properties of diesel oil determined in the laboratory (density and viscosity) or that we had available from the source are presented in the paper. In the laboratory, agricultural soil was contaminated with 7% diesel oil, and the sample was placed in a box.
- –
- A 12 V power source (the 5 V version initially used did not give any result).
- –
- Stainless steel and copper electrodes, with geometrical characteristics shown in Table 1 (these materials are available and do not induce new manufacturing costs).
 Table 1. Geometrical characteristics for electrodes.
The scheme of the experimental module is shown in Figure 1 without electrodes and in Figure 2 with electrodes.
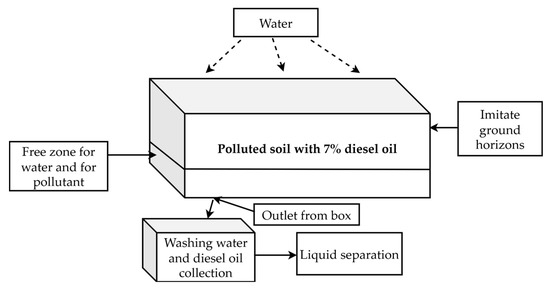
Figure 1.
The scheme of the experimental module without electrodes.
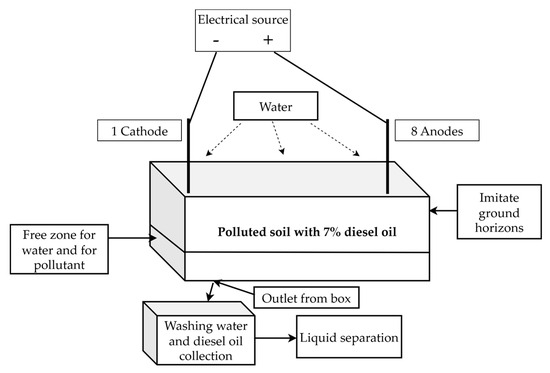
Figure 2.
The scheme of the experimental module with electrodes.
All the experiments were performed with 7% pollutant for seven days at 12 V.
In order to highlight the importance of using electrodes, the behavior of the pollutant and its migration were studied when water was applied without electrodes.
Three experiments with different electrodes were performed on the 7% diesel oil-contaminated sample. All variants have been performed several times. Three replicates of the experiments were performed.
Variant 1—with 9 stainless steel cylindrical electrodes, shown in Figure 3, positioned in a circular pattern—uses the cathode (with a big diameter and holes) in the middle and 8 identical anodes.
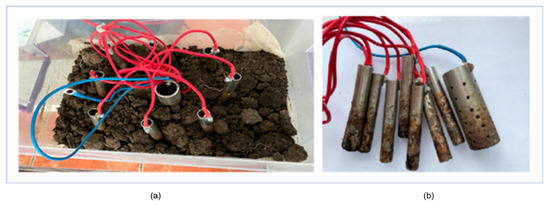
Figure 3.
Stainless steel electrodes in working variant 1. (a) The box with electrodes; (b) the electrodes after the experiment.
Variant 2—with 9 electrodes positioned as shown in Figure 4—uses a rectangular cathode with holes on one side and only 8 identical cylindrical stainless steel anodes placed on the other side.
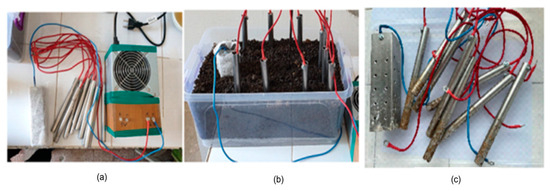
Figure 4.
Stainless steel electrodes in working variant 2—electrodes and power source. (a) Electrical source and the electrodes; (b) the box with electrodes; (c) the electrodes after the experiment.
Variant 3—with 9 identical cylindrical copper electrodes, with four anodes placed along each length of the setup and a single cathode positioned on one width (Figure 5).
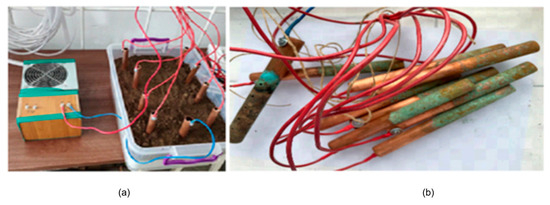
Figure 5.
Copper electrodes in working variant 3. (a) Electrical source and the box with copper electrodes; (b) the electrodes after the experiment.
Initially, a voltage of 5 V was used, but the results were unsatisfactory. Then the voltage was set at 12 V, and so all the experiments were conducted. The experiments lasted seven days.
Each day, the soil was “watered” with 1000 mL of water, added gradually at equal intervals. At the end of each day, the collected volumes of water and pollutants were measured separately. During the night, the water supply was turned off, but not the electricity supply. There was no question of drying the soil overnight, taking into account the retention capacity of the agricultural soil for wash water. In particular, we followed the migration of the pollutant through the water (the soil was watered between 7 a.m.–7 p.m. for 12 h, and for another 12 h the soil was not watered).
In order to understand more easily how liquid petroleum hydrocarbons penetrate into the soil structure, it is necessary to characterize their physical properties. In the vessel in which the electrodes were mounted, soil horizons were simulated. By periodically watering the entire surface, it was necessary to establish an outlet zone for both the water and the pollutant carried in the flow.
Holes in the bottom vessel were located in the cathode area for all experiments (Figure 1 and Figure 2). The established working algorithm is shown in Figure 6.
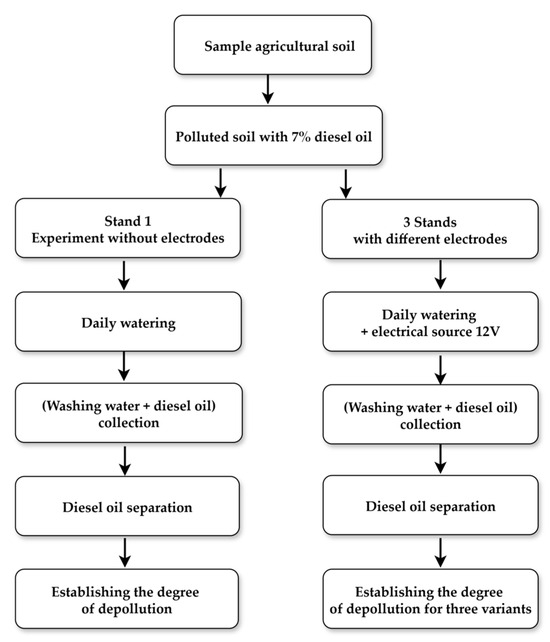
Figure 6.
The stages of the experimental activity.
2.2. Statistical Analysis
The statistical analysis of the results obtained for the four stands (variant without electrodes, variant 1, variant 2, and variant 3) was performed using Microsoft EXCEL 2016 with the Data Analysis ToolPak module. The basic values include mean (M), standard deviation (SD), coefficient of variation (CV), and standard error of the mean (SEM). The One-Way ANOVA test was also applied to establish statistically significant differences (p-value).
3. Results
3.1. Soil Characterization
The working soil was physically analyzed, and its physical properties are summarized in Table 2, along with other characteristics. All physical properties of the soil were determined using oven-dried samples, dried for one hour at 105 °C. Soil pH, water content (%), and qualitative NPK nutrient content were also analyzed in the laboratory.

Table 2.
Characteristics and properties of the analyzed soil.
The user’s manual of the test kit for the content of nutrients indicates the following values for the identified domains: trace—0–5 ppm, low—5–15 ppm, medium—15–30 ppm, high—30–50 ppm.
3.2. Characterization of the Pollutant—Diesel Oil
The physical properties of the pollutant that influence its penetration and migration into the soil structure are density and viscosity. These were determined at three temperatures (20, 40, and 60 °C), and the results are presented in Table 3.

Table 3.
Density and viscosity of diesel oil at various temperatures.
The behavior of the pollutant, diesel oil, in the soil matrix depends on a large number of variables that cannot be known. The displacement velocity depends mainly on density and viscosity; therefore, emphasis was put on these properties determined in the laboratory.
Table 4 shows all the diesel properties available to us at the time of the experimental determinations.

Table 4.
The properties for the pollutant—diesel oil.
3.3. Determining the Degree of Depollution
The results for the control sample, the sample without electrodes, are centralized in Table 5.

Table 5.
Results obtained for the washing cleanup of the sample polluted with 7% pollutant (884 mL used) without electrodes.
The results obtained for the application of the electrokinetic method in the three variants presented are shown in Table 6, for the seven days of determinations.

Table 6.
Results obtained for the washing of the sample polluted with 7% pollutant (884 mL used) with electrodes, in the three variants of work.
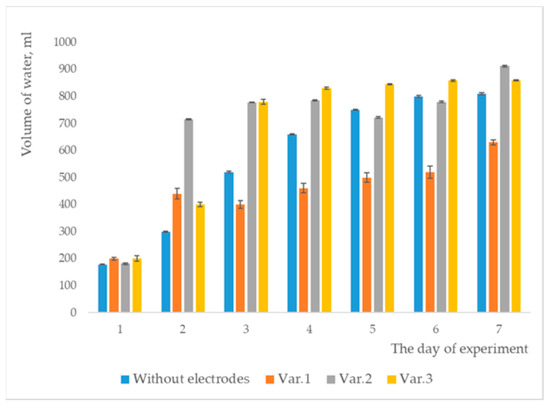
Figure 7.
Volumes of water collected.
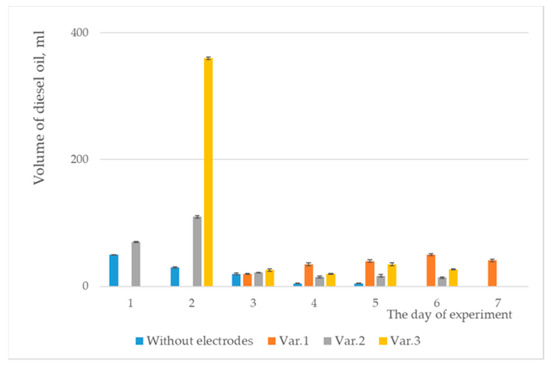
Figure 8.
Volumes of diesel oil collected.
For both graphical representations, the standard deviation was considered, and error bars were included.
3.4. Analyses for Water and NPK Nutrient Content
Table 7 shows the results for the wash water after passing through the soil with and without electrodes. These analyses were necessary to verify that the collected water did not introduce another source of environmental pollution. The aim of the experiments was to avoid causing any secondary pollution.

Table 7.
The properties of the washing water after passing through the soil.
Table 8 shows the qualitative nutrient contents in soils subjected to electrokinetic soil treatment.

Table 8.
Nutrient content in soil after electrokinetic depollution method.
3.5. Comparative Analyses for Depollution
Since the results of Variant 3 showed promising levels of depollution, it was compared with other depollution methods using the same type of soil and pollutant under laboratory conditions. The results are presented in Table 9.

Table 9.
Comparative results on the degree of depollution.
From an economic point of view, the literature data shows comparative costs, and for this reason, electrokinetic depollution may be preferred [6]. These costs are presented in Table 10.

Table 10.
The maximum costs of depollution methods [6].
3.6. Results of Statistical Analysis
The differences between the experimental stands were highlighted by the volumes of petroleum product collected. The significant differences between these volumes showed different performances of the experimental setups (different types of electrodes used). The results are shown as follows: Table 11 for washing water collected, Table 12 for diesel oil collected, and Table 13 for washing water properties.

Table 11.
Results of statistical analysis of washing water collected in experiments.

Table 12.
Results of statistical analysis of diesel oil collected in experiments.

Table 13.
Results of statistical analysis of washing water properties collected in experiments.
These results support the hypothesis that the shape and materials of the electrodes significantly influence the removal of the pollutant (diesel oil) from the analyzed soil structure (agricultural soil).
The value for the standard deviation (SD) calculated using relation (1) was added to each calculated average and is shown in Table 5, Table 6 and Table 7.
The coefficient of variation (CV) calculated using Equation (2):
The standard error of the mean number (SEM) was calculated using Equation (3):
where
xi—value for each determination (value/replicate);
xm—the mean for the three experiments (M);
n—number of experiments—replicates (3).
4. Discussion
Agricultural soil was chosen for its high organic matter content. Initially, the study included another type of soil (red soil), poor in nutrients and humic acids. Electrokinetic purification was not possible. This agricultural soil has a good permeability for water (1063 cm3/h) and low permeability for the pollutant (100 cm3/h). The presence of water makes the pollutant move between the electrodes (there are many hydrophobic aliphatic hydrocarbons). Retention capacity, which is inversely proportional to permeability, is 487 kg/m3soil for water and 338 kg/m3soil for diesel oil. These soil properties (Table 2), together with the density and viscosity for the pollutant (Table 3), explain the migration of the pollutant into the soil structure.
The organic matter content was not determined in the laboratory, but a high content was estimated based on the Munsell color of the analyzed soil (10YR) and the corresponding figures for value (3) and chroma (3).
Checking the electrical conductivity of the soil solution was important for the beginning of the experiments (0.8 mS/cm), within the ideal range of 0.2–1.2 mS/cm. Water and pollutant samples were collected together, then separated and measured.
For diesel oil, the main physical properties were determined in the laboratory (density and viscosity). These help to understand how the pollutant will penetrate the soil structure. The analysis report, which contains the other properties for diesel oil presented in Table 4, accompanied the sample from a refinery. Spectral measurements were performed on an IRAFINITY spectrophotometer for diesel oil to verify the occurrence of structural changes after applying the proposed method (only for variant 3). Since no major structural changes occurred after electrokinetic depollution, it can be concluded that the diesel oil is not affected and can be reused. Since the determination was made only for variant 3, the results are not presented in this paper.
The results for the degrees of depollution achieved are presented in Table 5 and Table 6. Interestingly, for variant 3, the highest volume of pollutant was collected on the second day. This behavior of the pollutant was repeated in every experiment. The highest degree of depollution was achieved with copper electrodes (52.94%).
Table 7 shows the analyses of the wash water, confirming the exclusion of significant secondary pollution. In Table 7, for variants 1 and 2, the values for electrical conductivity and salinity for water decrease because the migrating ions can be concentrated and retained near the electrodes. Since agricultural soil is high in organic matter, some of the ions can attach themselves to solid soil aggregates, which explains the values in the table. Electrophoresis and electro-osmosis occur here. For variant 3, the values are even lower for electrical conductivity and salinity because the copper ions produced at the anode do not fall into the wash water. In this variant 3, both ion migration and chemical reactions can occur. The pH value in Table 7 is explained by the migration of OH- ions to the cathode. Copper electrodes were chosen in an attempt to better mobilize the pollutant in the presence of water. It was considered that at a voltage of 12 V, the release of copper ions would not be significant, the only problem being the deposits, which can affect the transmission of the electric current.
Table 5, Table 6 and Table 7 show the mean values (M) for the three replicates together with the standard deviation (SD).
Table 8 shows the changes in nutrient content (qualitative determination only, based on colorimetry and turbidimetry). Values are estimated in ppm. Nitrogen is an essential plant nutrient and a key component of cell protoplasm. Excess nitrogen accelerates plant growth but reduces fruiting. Compared to nitrogen, phosphorus is found in small amounts in plant tissues and plays an important role in physiological processes. Potassium works as a biocatalyst in photosynthesis, respiration, and transpiration. These elements are classified as soil macro-elements, along with calcium, magnesium, and sulfur. After the application of soil treatments, the germinative potential of soils can be restored by adding fresh soil, which returns to the required nutrient content. In this way, the nutrient content can also be restored. It can be seen in Table 8 that in variant 3, there are slight changes: nitrogen and potassium decrease slightly, and phosphorus increases slightly. NPK monitoring is important for agricultural applications.
Table 8 presents results estimated according to value ranges (the analysis being qualitative rather than quantitative) recommended by the literature. Repeating the analyses and framing them within the same range for the three repetitions of the experiments did not require statistical analysis.
Table 9 shows the results for the same type of soil contaminated with diesel oil, subjected to other decontamination methods. Although the value of 52.94% is lower, the advantage is the rapid recovery of diesel fuel without it being affected.
The results in Table 9 show that the proposed electrokinetic depollution method using copper electrodes is advantageous, effectively recovering the pollutant without causing significant changes in water quality, thereby supporting the method’s sustainability. Although combustion achieves the highest degree of depollution, it burns the pollutant and negatively impacts the soil’s organic matter.
As shown by studies (Table 10), the electrokinetic decontamination method appears to be the most inexpensive. The proposed method is also based on the use of inexpensive electrodes and the possibility of rapid application to accidentally contaminated areas.
The statistical analysis performed using the ANOVA test, using Microsoft Excel 2016, with a single factor, confirmed the existence of significant differences between stands. In all cases presented in Table 11, Table 12 and Table 13, the p-value ˂ 0.05. The results indicated that the differences between the stands were statistically significant.
Thus, it is demonstrated that each stand used in the experiments has different results, and the volumes of pollutant collected indicate performance when using copper electrodes.
The results obtained in this study support the hypothesis that copper electrodes can be used as a rapid method for removing petroleum hydrocarbons from soil structures.
The idea of this study is part of a large project on the behavior of pollutants on different types of soils and on finding methods to remove them without affecting any of them. After using different types of electrodes in this study, it can be observed that a higher degree of depollution was achieved when almost identical copper electrodes were used in variant 3. Considering the value of the degree of depollution obtained, 52.94%, it can be appreciated that this method can be at least a preliminary depollution variant in order to take advantage of the pollutant recovery. Electrokinetic remediation has been extensively studied over the last decade and has been widely recognized as a promising method to treat different types of organically contaminated soil. By combining electrokinetic technology with other remediation technologies, the reaction time can be effectively saved (biological depollution-biodegradation). Biolixiviation can also be successfully applied if the aim is to remove metals from the soil.
This study focuses on electrokinetic technologies improved by different variants (1–3). The proposed realization can be oriented towards even medium voltages, given the higher pollutant concentrations (>10%) existing in the real areas subjected to depollution.
Although it is possible to collect liquid samples from the bottom of the can in the laboratory, this is not possible industrially. Therefore, future efforts will focus on finding a “closed” cathode for pollutant extraction. Figure 9 shows a proposal for an in situ application to limit major, accidentally occurring pollution from the cracking of petroleum product transportation pipelines.
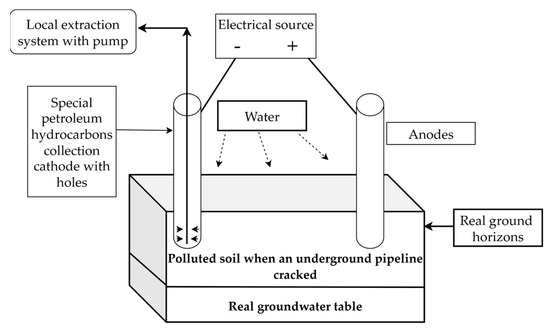
Figure 9.
Proposed scheme for rapid in situ action.
In the literature, electrokinetic depollution is recommended for the depollution of contaminated water and the removal of heavy metals. The novelty of the proposed topic lies in the possibility of recovering the pollutant at the lowest possible cost, using less expensive electrodes. The proposal in Figure 9 is for known and analyzed areas through which the main pipelines for transporting petroleum products pass. These areas can traverse large areas of agricultural land, and the proposed method can be successfully applied. Over the course of several years, various types of soil were tested. The soil that responded best to the proposed method was agricultural soil, which brings improvements to the methods applied so far on soils polluted with petroleum hydrocarbons. This can be considered a plus in quickly solving environmental problems that arise all the time.
For future research, both the electric voltage and the number of electrodes can be increased, and an optimal positioning of the electrodes on the working surface should be established. Last but not least, the soil metal content before and after electrokinetic depollution with variants 1–3 represents the beginning of a new laboratory study. Future studies will be based on an analysis of deposits on the electrodes used in the experiments.
In the future, we will also try a version in which only the cathode is made of copper and the anodes are made of stainless steel. With this variant, several types of soil will be tested again. The metal content in the soil before and after electrokinetic decontamination will also be taken into account.
From an environmental protection perspective, as long as the properties of the wash water are properly monitored and the metal content is checked and kept under control, there are no risks associated with small current sources.
5. Conclusions
The soil is an open and dynamic system and is constantly exposed to contamination. The amount of soil affected by petroleum hydrocarbons in accidental spills depends on how quickly action is taken.
The pollution front must be stopped quickly, before it reaches saturation in the soil and before it penetrates the water table.
The method proposed in this study solves two problems at the same time: the elimination and the possibility of reusing the pollutant.
Trying to change both the shape and the material of the electrodes has resulted in varying degrees of depollution. In conclusion, the types of electrodes have influenced the way in which the pollutant, diesel oil, was moved by water from the anode to the cathode through the phenomenon of electro-osmosis. The constituent hydrocarbons largely responsible for this phenomenon are aliphatic hydrocarbons (in high proportion in the diesel oil analyzed). In all three variants, the cathodes had symmetrical orifices, as seen in Figure 3, Figure 4 and Figure 5, to allow easier “trapping” of displaced petroleum hydrocarbons.
All these experiments have been made out of a desire to find a quick method of action when, accidentally, the soil may be polluted with petroleum hydrocarbons. Diesel oil recovery is the biggest advantage of the proposed method in the variant of using copper as electrodes.
We can theoretically anticipate that the copper ions that can be released at 12 V voltage cannot occur in large amounts. This low voltage may allow copper to form complex compounds with the organic material in the soil. A disadvantage would be deposits on the electrodes, which would prevent the electric current from carrying. An increase in the electrical conductivity of the wash water may be possible due to the initial salts in the soil.
It is crucial to intervene immediately in cases of accidental soil pollution, as recovering a high proportion of the pollutant (>50%) greatly benefits the soil.
Since the sample analyzed without electrodes showed a decontamination degree of 12.44% (Table 5), compared to 52.94% with copper electrodes (Table 6), future efforts will focus on finding the optimal decontamination method. Several factors will be considered, including time, electrical voltage, electrode shape and dimensions, and their positioning within the experimental setup.
As previously mentioned, using copper electrodes at 12 V does not compromise the health of the purified soil. This issue is of interest to chemical and environmental engineers as well as agronomists. Achieving healthy agriculture requires collaborative efforts, and the combined expertise of these specialists will lead to improved soil treatment methods and more effective solutions.
Combining this new proposal with a biological method (bioleaching, biolixiviation) can contribute to obtaining healthy soil that can be reused in agriculture. Electrokinetic decontamination is the only method of decontaminating soil contaminated with petroleum hydrocarbons in which the pollutant can be recovered in an increasingly large proportion.
Funding
This research received no external funding.
Data Availability Statement
The data presented in this study are available on request from the author.
Conflicts of Interest
The author declares no conflicts of interest.
References
- Popa, M.; Negoita, L.I.; Arnautu, B. Advantages of using the electro-kinetic method for soil depollution. Sci. Pap. Ser. E Land Reclam. Earth Obs. Surv. Environ. Eng. 2019, 8, 192–196. [Google Scholar]
- Streche, C.; Baracu, T.; Apostol, T.; Cocârță, D.M.; Stan, C. Evaluation of the Efficiency of Combining the Electrochemical Remediation and Soil Flushing Methods in the Soil Contamination with Diesel. In Proceedings of the 2017 International Conference on ENERGY and ENVIRONMENT (CIEM), Bucharest, Romania, 19–20 October 2017. [Google Scholar] [CrossRef]
- Li, D.; Ji, G.; Hu, J.; Hu, S.; Yuan, X. Remediation strategy and electrochemistry flushing & reduction technology for real Cr(IV)-contaminated soils. Chem. Eng. J. 2018, 334, 1281–1288. [Google Scholar]
- Lysenko, L.L.; Shen, A.E.; Rynda, E.F. Prevention of Ground water Pollution by Using the Electroosmotic Flushing of Soil systems. J. Water Chem. Technol. 2018, 40, 102–107. [Google Scholar] [CrossRef]
- Han, S.-J.; Kim, S.-S.; Kim, B.-I. Electroosmosis and pore pressure development characteristics in lead contaminated soil during electrokinetic remediation. Geosci. J. 2004, 8, 85–93. [Google Scholar] [CrossRef]
- Ren, L.; Lu, H.; He, L.; Zhang, Y. Enhanced electrokinetic technologies with oxidization-reduction for organically-contaminated soil remediation. Chem. Eng. J. 2014, 247, 111–124. [Google Scholar] [CrossRef]
- Risco, C.; Lopez-Vizcaino, R.; Saez, C.; Yustres, A.; Canizares, P.; Navarro, V.; Rodrigo, M.A. Remediation of soils polluted with 2,4-D by electrokinetic soil flushing with facing rows of electrodes: A case study in a pilot plant. Chem. Eng. J. 2016, 285, 128–136. [Google Scholar] [CrossRef]
- Yuan, C.; Weng, C.H. Remediating ethylbenzene-contaminated clayey soil by a surfactant-aided electrokinetic (SAEK) process. Chemosphere 2004, 57, 225–232. [Google Scholar] [CrossRef] [PubMed]
- Sandu, C.; Popescu, M.; Rosales, E.; Pazos, M.; Lazăr, G.; Sanroman, M.A. Electrokinetic oxidant soil flushing: A solution for in situ remediation of hydrocarbons polluted soils. J. Electroanal. Chem. 2017, 799, 1–8. [Google Scholar] [CrossRef]
- Popescu, M.; Rosales, E.; Sandu, C.; Meijide, J.; Pazos, M.; Lazăr, G.; Sanroman, M.A. Soil flushing and simultaneous degradation of organic pollutants in soils by electrokinetic-Fenton treatment. Process Saf. Environ. Prot. 2017, 108, 99–107. [Google Scholar] [CrossRef]
- Popa, M.; Onuţu, I. Studies on the Seed Germination after Thermal Decontamination of Crude Oil Polluted Soils. Agric. Agric. Sci. Procedia 2016, 10, 452–457. [Google Scholar] [CrossRef]
- Popa, M. The influence of the application of electrical desorption on soil nutrient content. Rom. J. Pet. Gas Technol. 2023, IV, 117–122. [Google Scholar] [CrossRef]
- Popa, M. Remediation of soil contaminated with hydrocarbon used the succesive extraction method with solvents. Ann. Dunarea De Jos Univ. Galati. Fascicle IX Metall. Mater. Sci. 2024, 47, 38–43. [Google Scholar] [CrossRef]
- Micle, V.; Sur, I.M. Experimental Investigation of a Pilot-Scale Concerning Ex-Situ Bioremediation of Petroleum Hydrocarbons Contaminated Soil. Sustainability 2021, 13, 8165. [Google Scholar] [CrossRef]
- Ma, Y.; Cheng, X.; Zhang, Y. The Impact of Humic Acid Fertilizers on Crop Yield and Nitrogen Use Efficiency: A Meta-Analysis. Agronomy 2024, 14, 2763. [Google Scholar] [CrossRef]
- Huang, Q.; Sheng, L.; Wu, T.; Huang, L.; Yan, J.; Li, M.; Chen, Z.; Zhang, H. Research progress on the application of carbon-based composites in capacitive deionization technology. Desalination 2025, 593, 118197. [Google Scholar] [CrossRef]
- Abou-Shady, A.; Osman, M.A.; El-Araby, H.; Khalil, A.K.A.; Kotp, Y.H. Electrokinetics-Based Phosphorus Management in Soils and Sewage Sludge. Sustainability 2024, 16, 10334. [Google Scholar] [CrossRef]
- Lee, J.; Pearce, J.M.; Santoro, D. Electrochemical Method for Nutient Removal in Wastewater: A Review of Advanced Electrode Materials, Process, and Applications. Sustainability 2024, 16, 9764. [Google Scholar] [CrossRef]
- Mulati, H.; Mamat, A.; Ailijiang, N.; Jiang, L.; Li, N.; Hu, Y.; Su, Y. Electrokinetic-Assisted Phytoremediation of Pb-Contaminated Soil: Influences of Periodic Polarity Reversal Direct Current Field. Sustainability 2023, 15, 8439. [Google Scholar] [CrossRef]
- Jeon, E.K.; Jung, J.M.; Kim, W.S.; Ko, S.H.; Baek, K. In situ electrokinetic remediation of As-, Cu-, and Pb- contaminates paddy soil using hexagonal electrode configuration: A full scale study. Environ. Sci. Pollut. Res. 2015, 22, 711–720. [Google Scholar] [CrossRef] [PubMed]
- Jeon, E.K.; Jung, J.M.; Ryn, S.R.; Baek, K. In situ field application of electrokinetic remediation for an As-, Cu-, and Pb- contaminated rice paddy using parallel electrode configuration. Environ. Sci. Pollut. Res. 2015, 22, 15763–15771. [Google Scholar] [CrossRef]
- Shin, S.Y.; Park, S.M.; Baek, K. Electrokinetic Removal of As from Soil Washing Residue. Water Air Soil Pollut. 2016, 227, 223. [Google Scholar] [CrossRef]
- Liu, J.; Cai, H.; Chen, S.; Pi, J.; Zhao, L.A. Review on Soil Nitrogen Sensing Technologies: Challenges, Progress and Perspectives. Agriculture 2023, 13, 743. [Google Scholar] [CrossRef]
- Acosta, M.; Rodríguez-Carretero, I.; Blasco, J.; de Paz, J.M.; Quiñones, A. Non-Destructive Appraisal of Macro- and Micronutrients in Persimmon Leaves Using Vis/NIR Hyperspectral Imaging. Agriculture 2023, 13, 916. [Google Scholar] [CrossRef]
- Abu-Shady, A.; El-Araby, H. Soil electrokinetic remediation to restore mercury-polluted soils: A critical review. Chemosphere 2025, 377, 144336. [Google Scholar] [CrossRef] [PubMed]
- Hamdi, F.M.; Altae, A.; Aedan, Y.; Zhou, J.; Al-Ejji, M.; Hawari, A.H.; Zaidi, S.J.; Mohsen, M.; Kardani, R. Decontamination of Heavy Metals from Soil by Electrokinetic Combined with Reactive Filter Media from Industrial Wastes. Water Air Soil Pollut. 2025, 236, 565. [Google Scholar] [CrossRef]
- Abu-Shady, A.; El-Araby, H. Reverse Polarity-Based Soil Electrokinetic Remediation: A Comprehensive Reviw of the Published Data During the Past 32 Years (1993–2023). ChemEngineering 2024, 8, 82. [Google Scholar] [CrossRef]
- Santos, M.; Rebola, S.; Evtuguin, D.V. Soil Remediation: Current Approaches and Emerging Bio-Based Trends. Soil Syst. 2025, 9, 35. [Google Scholar] [CrossRef]
- Iorga, C.M.; Georgescu, L.P.; Ungureanu, C.; Stancu, M.M. Sustainable Remediation of Polluted Soils from the Oil Industry Using Sludge from Municipal Watewater Treatment Plants. Processes 2025, 13, 245. [Google Scholar] [CrossRef]
- Omo-Okoro, P.; Ofori, P.; Amalapridman, V.; Dadrasnia, A.; Abbey, L.; Emenike, C. Soil Pollution and Its Interrelation with Interfacial Chemistry. Molecules 2025, 30, 2636. [Google Scholar] [CrossRef]
- Wyszkowska, J.; Borowik, A.; Zabrowska, M.; Kucharski, J. Revitalization of Soil Contaminated by Petroleum roducts Using Materials That Improve the Physicochemical and Biochemical Properties of the Soil. Molecules 2024, 29, 5838. [Google Scholar] [CrossRef]
- Jiang, D.; Li, T.; Liang, X.; Zhao, X.; Li, S.; Li, Y.; Oh, K.; Liu, H.; Cao, T. Evaluation of Petroleum Hydrocarbon-Contaminated Soil Remediation Technologies and Their Effects on Soybean Growth. Environments 2025, 12, 6. [Google Scholar] [CrossRef]
Disclaimer/Publisher’s Note: The statements, opinions and data contained in all publications are solely those of the individual author(s) and contributor(s) and not of MDPI and/or the editor(s). MDPI and/or the editor(s) disclaim responsibility for any injury to people or property resulting from any ideas, methods, instructions or products referred to in the content. |
© 2025 by the author. Licensee MDPI, Basel, Switzerland. This article is an open access article distributed under the terms and conditions of the Creative Commons Attribution (CC BY) license (https://creativecommons.org/licenses/by/4.0/).