Article

Indirect Regulation of SOC by Different Land Uses in Karst Areas Through the Modulation of Soil Microbiomes and Aggregate Stability

1
College of Soil and Water Conservation, Southwest Forestry University, Kunming 650224, China
2
College of Ecology and Environment, Southwest Forestry University, Kunming 650224, China
*
Author to whom correspondence should be addressed.
Agriculture 2025, 15(11), 1220; https://doi.org/10.3390/agriculture15111220
Submission received: 6 April 2025 / Revised: 26 May 2025 / Accepted: 2 June 2025 / Published: 3 June 2025
(This article belongs to the Section Agricultural Soils)

Abstract

:
Natural restoration of vegetation and plantation are effective land use measures to promote soil organic carbon (SOC) sequestration. How soil physicochemical properties, microorganisms, Glomalin-related soil proteins (GRSPs), and aggregates interact to regulate SOC accumulation and sequestration remains unclear. This study examined five land uses in the karst region of Southwest China: corn field (CF), corn intercropped with cabbage fields (CICF), orchard (OR), plantation (PL), and natural restoration of vegetation (NRV). The results revealed that SOC, total nitrogen (TN), total phosphorus (TP), total GRSP (T-GRSP), and easily extractable GRSP (EE-GRSP) contents were significantly higher under NRV and PL than in the CF, CICF, and OR, with increases ranging from 10.69% to 266.72%. Land use significantly influenced bacterial α-diversity, though fungal α-diversity remained unaffected. The stability of soil aggregates among the five land uses followed the order: PL > NRV > CF > OR > CICF. Partial least-squares path modeling (PLS-PM) identified land use as the most critical factor influencing SOC. SOC accumulation and stability were enhanced through improved soil properties, increased microbial diversity, and greater community abundance, promoting GRSP secretion and strengthening soil aggregate stability. In particular, soil microorganisms adhere to the aggregates of soil particles through the entanglement of fine roots and microbial hyphae and their secretions (GRSPs, etc.) to maintain the stability of the aggregates, thus protecting SOC from decomposition. Natural restoration of vegetation and plantation proved more effective for soil carbon sequestration in the karst region of Southwest China compared to sloping cropland and orchards.

Graphical Abstract

1. Introduction

Land use integrates human activities and natural processes, with anthropogenic disturbances causing significant changes in land use types [1] that profoundly affect the soil environment. Soil aggregates, a key component of soil structure, are formed through the aggregation of soil particles, with stronger adhesion between aggregated particles than their surroundings [2]. Differences in land use types affect the mass fraction of soil aggregates [1] and alter soil aggregation by modifying soil properties, microbial diversity, and Glomalin-related soil protein (GRSP) levels [3,4]. Aggregates provide a suitable habitat for soil microorganisms, supporting microbial growth. The mineralization of organic matter and mineral particles by microorganisms, along with the adhesion of fungal hyphae to soil particles, promotes aggregate formation [5]. GRSP, a hydrophobic glycoprotein secreted by the mycelium of arbuscular mycorrhizal fungi (AMF), is characterized by recalcitrance, hydrophobicity, and viscosity [6,7]. GRSP binds soil fine particles to form microaggregates and macroaggregates, enhancing the accumulation and stability of soil organic carbon (SOC) [6].
Differences in vegetation type, cover, anthropogenic disturbances, and other factors associated with various land use patterns can significantly alter soil physicochemical properties. For example, An et al. [8] showed that land use exerts a significant influence on the heterogeneity and distribution of soil moisture content (SMC). Converting farmland to forest effectively increases vegetation cover, enhances soil water retention, and raises soil moisture levels. Salinity variations resulting from different land use types [9] and the contributions of lime to phosphorus and clay content [10] have been identified as factors influencing soil pH. Bai et al. [11] found that arable land has higher nitrogen, phosphorus, and potassium content than grassland due to fertilizer application, with long-term fertilization leading to nutrient accumulation and soil acidification [12]. Liu et al. [13] reported that global organic carbon stocks vary by land use type, with forest land > cropland > grassland, and soil carbon stocks decline with increasing annual mean temperature and pH. It is still unclear what factors affect the physicochemical characteristics of soil under various land uses. However, by changing the physicochemical characteristics of the soil, land uses have a substantial impact on the diversity and populations of soil microorganisms, which in turn affects the secretion and accumulation of GRSP. Previous studies have shown that converting farmland to forest significantly enhances soil microbial diversity [14] and community abundance [11]. Forested land reduces soil disturbance compared to cropland, immobilizing soil organic matter (SOM) and reducing its decomposition, thereby increasing SOM content and plant root abundance. These changes favor microbial growth and activity, stimulate the growth of AMF, expand the AMF mycelial network, and promote the production of GRSP in forested soils [6]. Gu et al. [15] reached similar conclusions, noting that afforestation of degraded farmland increases fine root biomass (FRB), which stimulates the growth of AMF biomass. The root system provides ecological niches that support the survival and reproduction of AMF, leading to a positive correlation between FRB and AMF biomass and subsequently higher GRSP production [16]. In addition, Zhang et al. [16] suggested that increased GRSP content may also result from improved soil physicochemical properties following prolonged fallow forestation. Enhanced vegetation cover can alter soil pH, creating neutral or slightly acidic conditions that favor AMF growth and facilitate GRSP accumulation [17].
Differences in land use patterns affect the composition and stability of soil aggregates [18] and the accumulation of SOC. Changes in SOC further regulate soil aggregate dynamics, as the processes of formation, stabilization, and decomposition of soil aggregates directly determine SOC accumulation and stability [4]. For example, Yu et al. [19] demonstrated in the Jinfoshan Karst ecosystem in Chongqing, China, that afforestation improved aggregate stability by increasing the content of soil macroaggregates. Enhanced vegetation cover promoted the production of resistant binders such as humus, polysaccharides, and root secretions, facilitating soil aggregate formation and increasing SOC content in both whole soil and aggregates [18,20]. In contrast, Zolfaghari et al. [21] reported that plantation and pastures in central Zagros, Iran, reduced soil aggregate stability by decreasing macroaggregate content compared to primary forests. Tillage further disrupted aggregates by exposing previously protected SOM to microbial attack, accelerating its decomposition and mineralization [22] and weakening the bonding between soil particles. Extensive research has demonstrated that physical protection by soil aggregates plays a fundamental role in carbon stabilization [23,24]. Research has demonstrated that macroaggregates in afforested soils provide significant physical protection for SOC, effectively inhibiting microbial decomposition and mineralization [25,26]. This makes macroaggregates the primary contributors to carbon accumulation. In contrast, microaggregate-dominated soil structures demonstrate reduced structural stability and are prone to fragmentation into fine particulate matter. This disintegration results in reduced storage of SOM, decreased ecosystem productivity, and slow vegetation recovery [27,28]. Additionally, microbial activity influences the cementation of soil particles within aggregates by degrading surrounding SOM and producing metabolites, which further impact SOC accumulation. GRSP, a persistent binder secreted by AMF mycelium, plays a crucial role in SOC stabilization due to its recalcitrant chemical properties and ability to strengthen soil aggregates [29]. GRSP adsorbs onto organic matter, clay, and chalk particles, facilitating connections within and between microaggregates. The binding action of AMF mycelium on particles or microaggregates promotes the formation and stabilization of soil macroaggregates [6], providing additional protection to SOC from microbial decomposition. However, the mechanisms by which different land use patterns influence SOC accumulation by altering aggregate stability and how SOC changes impact aggregate stability remain poorly understood and require further investigation.
The ecosystems in the karst region of Southwest China are highly fragile, characterized by thin, erodible soil layers and low vegetation cover, making the region particularly susceptible to natural disasters such as droughts and floods [30,31]. The health of the ecosystem can be effectively enhanced through scientific land management and restoration measures, especially in karst mountainous areas, where rational land use planning is crucial for ecological restoration [32]. By assessing the characteristics of SOC accumulation and sequestration under different land uses in the Karst region, we have enriched the theoretical framework of the soil carbon cycle. This study provides a scientific foundation for the development of rational land use planning in the future. Few studies have explored how different land uses in karst regions affect the accumulation and stability of SOC through their impacts on soil physicochemical properties, soil microorganisms, GRSP and soil aggregates, resulting in differences in SOC. This study investigated five different land uses of the Yunnan karst region: sloping cropland (corn field—CF; corn intercropped with cabbage field—CICF), orchard (kiwifruit field—OR), plantation (PL), and natural restoration of vegetation (NRV). This study aimed to evaluate the differences in SOC content across various land uses and determine the main factors influencing SOC sequestration. We aimed to resolve two research questions: (1) Which land use is more favorable for SOC accumulation and carbon sequestration under different land uses? (2) Which factors dominate soil organic carbon accumulation and sequestration under different land uses? What is the correlation between them? We hypothesized that (H1) the natural restoration of vegetation and plantation are more conducive to SOC accumulation and sequestration. This is due to the high vegetation cover and the substantial amounts of litter and root secretions in the surface layer, which can replenish soil nutrients through decomposition and transformation, thereby increasing SOC content [11]. (H2) Land use may act as an indirect regulator, which indirectly affect soil microorganisms by influencing soil physicochemical properties [33]. These microorganisms, in turn, regulate SOC by influencing GRSP secretion and soil aggregate stability [7,34].

2. Materials and Methods

2.1. Overview of the Study Area

This study was conducted in the Longjing sub-basin (27°42′–27°47′ N, 104°50′–104°53′ E) in the middle and upper reaches of the Chishui River basin in Zhenxiong, Yunnan Province, which is located on the Yunnan–Guizhou Plateau and is dominated by plateau mountains; it is a typical karst landscape and the entire sub-basin area of 29.58 km2. The study area is characterized by a subtropical monsoon climate, with annual precipitation ranging from 749 to 1286 mm, an average annual temperature of 13.0 °C, and an annual runoff volume of approximately 9.7 billion m3. Classified as a “humid climate zone” and “moderate rainfall area”, the basin receives 87.6% of its rainfall and 75% of its runoff during the flood season from May to October (National Meteorological Information Center, http://data.cma.cn, accessed 30 April 2025). Based on the classification guidelines of the World Reference Base for Soil Resources (WRB) [35], the dominant soil type in the study area is classified as Haplic Cambisol (Loamic, Humic, and Eutric). Corn is the predominant cash crop, with an output of 53.15 × 10⁴ t and 120.20 × 10⁴ t in 2019, accounting for 31.58% and 13.07% of agricultural production, respectively. Vegetation includes plantations such as Chinese fir (Cunningham IA lanceolata), sea buckthorn (Hippophage rhomboids), firethorn (Pyracantha fortune Ana), and Stenoloma Fee, as well as natural restoration of vegetation such as Chinese ash (Fraxinus chinensis Roxb), rough-leaved hydrangea (Hydrangea aspera D. Don), mugwort (Artemisia argyi), and Artemisia dubia. (Figure S1).
Prior to the 1970s, a large amount of forest land was reclaimed as arable land in order to meet the demand for food from a rapidly growing population. The over-exploitation of sloping arable land led to serious soil erosion, land degradation, and increasingly serious ecological and environmental problems. Between the late 1980s and the early 1990s, the Southwest Karst region began to implement a number of ecological protection projects, such as returning farmland to forests and planting trees, in an attempt to slow down the process of rocky desertification. According to statistics, by 2020, the cumulative area of returning farmland to forest and grassland in the Southwest Karst region exceeded 35 million mu (about 2.33 million hectares), reducing the area of sloping arable land by about 30–40%. Among them, by returning farmland to forests, the area of forested land in the Yunnan karst region has increased by about 10 million mu (about 660,000 hectares), and the forest coverage rate has increased, from 44.3% in 2000 to 65.04% in 2020.

2.2. Plot Setting and Sample Collection

In this study, we conducted an investigation on crop cultivation and land use in the research area in April 2023. The survey revealed that corn and kiwifruit are the primary cash crops in the region. Vegetables are typically intercropped with corn to meet local production demands. The study selected five types of land use: corn field, corn intercropped with cabbage field, orchard, plantation, and natural restoration of vegetation. In the karst landscape, the rugged terrain poses challenges to traditional crop cultivation. Over the past 39 years, sloping farmland has been transformed into terraces. These terraces are used for corn cultivation and are intercropped with Chinese cabbage. The common practice in corn and corn intercropped with cabbage fields is to plow the soil to a depth of 15 cm prior to sowing. The kiwifruit orchard has been established for 7 years, with harvesting taking place once a year in October. Annual herbaceous plants are retained as green manure in the orchard to improve kiwifruit growth. The plantation, established through both planting and aerial seeding, has been in existence for eight years. Previously, this area served as farmland until 2017. The section designated for natural restoration of vegetation was also formerly agricultural land, which has been taken out of cultivation since 2018 to facilitate the recovery of natural vegetation (mostly shrubs and herbs). Vegetation surveys were conducted in standard plots within the plantation and natural vegetation restoration areas, each measuring 20 m × 20 m, separated by a distance of at least 50 m. Dominant plant communities within the plots were identified by calculating the correlation values of each plant species. Vegetation coverage analysis was performed on plot-level vertical imagery utilizing ImageJ software (v1.53e, NIH, Bethesda, MD, USA). The basic characteristics of the sample plots are presented in Table S1.
Fertilizer application was conducted according to local agricultural practices. Corn field and corn intercropped with cabbage fields were fertilized during the sowing period (March), seedling period (April), and growing period (June) each year. The depth of hole fertilization is around 10 cm. Orchards were fertilized in early March annually. The depth of hole fertilization is 20–30 cm. The fertilizers used included urea (N 46%) and composite fertilizer (N 20%, P2O5 10%, K2O 10%). The specific quantities of fertilizer applied are provided in Table S2.
In the present study, a total of 25 sampling plots (five land use types × five standard sampling plots) were selected randomly in the Longjing sub-basin, effectively covering the entire Longjing sub-basin. Within each plot, five points were randomly selected (ensuring that they covered the entire plot). At each sampling point, undisturbed soil samples were collected at three depths: 0–10 cm, 10–20 cm, and 20–30 cm. Soils from five plots were mixed to form a composite sample, and impurities such as plant roots and stones were removed. Aluminum boxes (31.4 cm3) were used separately to collect soil samples from the same locations for the determination of SMC. Part of the collected soil samples were air-dried naturally for the analysis of soil physicochemical properties, soil aggregate fractionation, GRSP, and other related indicators. Another portion of the fresh soil samples were stored at −80 °C for microbial analysis.

2.3. Soil Analysis

SMC was measured using the drying method. Soil pH was analyzed with a pH meter (FE20K, Mettler Toledo, Zurich, Switzerland) at a water-to-soil ratio of 2.5:1. Soil clay content was determined using a laser particle size analyzer (Masterizer 2000, Malvern Panalytical, Malvern, UK). SOC was quantified through redox titration with dichromate. The soil was treated with H2SO4 and left overnight, during which it was sealed with plastic wrap to prevent oxidation. After digestion, total nitrogen (TN) was measured using a continuous flow analyzer (Auto Analyzer 3, SEAL Analytical, Norderstedt, Germany), while total phosphorus (TP) and total potassium [3] were determined using ICP-OES (Thermo Fisher Scientific, Waltham, MA, USA) [3].
Total GRSP (T-GRSP) and readily extractable GRSP (EE-GRSP) were determined following the method of [7]. The results were expressed as g kg−1 dry soil.
The undisturbed soil samples were air-dried naturally, and impurities such as plant roots and stones were removed. The samples were then sieved into water-stable aggregates with particle sizes >2 mm, 1–2 mm, 0.5–1 mm, 0.25–0.5 mm, and <0.25 mm following the modified method described by Six J [36]. The proxy aggregate content of >0.25 mm (r>0.25mm) reflects the resistance strength against soil erosion; the mean weight diameter (MWD) indicates the size distribution of aggregates, while the fractal dimension of soil aggregates (D) characterizes the soil particle size distribution and uniformity [37,38]. The parameters r>0.25mm, MWD, and D were calculated using the following equations:
r > 0.25 m m = M r / M t × 100 %
where Mr is the amount of water-stable aggregates >0.25 mm (g) and Mt is the total amount of aggregates after wet sieving (g).
M W D = i = 1 n ( x i ¯ w i ) / i = 1 n w i
where xi is the average diameter of aggregates of i size and wi is the percentage of aggregates of i size.
D = 3 log ( M ( i < x i ) M t ) / log ( x i ¯ x max )
where M(i<xi) is the aggregate content of particle size < xi; Mt is the sum of the aggregate content of each particle size; xi is the average diameter of the aggregates of particle size i; and xmax is the average diameter of the aggregates of the largest aggregate size.
We extracted DNA from 0.5 g of soil samples using the Hi Pure Stool DNA Kit for Soil (Magen, Guangzhou, China). The bacterial 16S rRNA (V3–V4 region) and fungal ITS regions were amplified with standard protocols. Sequencing libraries were prepared and sequenced on the Illumina MiSeq PE250 platform (Illumina, San Diego, CA, USA). Sequences were processed with SILVA (bacteria) and Unite (fungi) databases, followed by OTU clustering at 97% similarity. Alpha diversity indices were calculated using QIIME, and taxonomic classification was conducted with the RDP Classifier (confidence threshold: 0.7) (https://www.majorbio.com/, accessed 21 October 2024).

2.4. Statistical Analysis

Repeated measures analysis of variance was conducted to evaluate the effects of land use, soil depth, and their interactions on various biotic and abiotic variables, including soil physicochemical properties (e.g., pH, SMC, and SOC), T-GRSP, and EE-GRSP. Statistical significance was set at p < 0.05. One-way ANOVA, followed by the Least Significant Difference (LSD) method and Duncan’s post hoc test, was used to compare soil physicochemical properties, soil aggregate stability, GRSP, and microbial diversity across different land uses. SPSS 26.0 was used to analyze the data (SPSS Inc., Chicago, IL, USA).
Abstract figures were plotted using https://www.medpeer.cn/ (accessed 2 April 2025). Redundancy analysis (RDA) was employed to assess the influence of land use, soil physicochemical properties, GRSP, and aggregate stability on bacterial and fungal communities. Spearman’s correlation analysis, Mantel’s test, and RDA were used to explore the relationships between microbial communities and environmental factors. Correlation analyses and visualizations of environmental factors and community composition were generated using the “linkET” package in R 4.4.1. Based on correlation and variable selection results, partial least squares path modeling (PLS-PM) was applied to investigate potential pathways influencing SOC formation. The model was constructed using the plspm function in the “plspm” package of R 4.4.1. Box plots were created with the “ggplot2” package in R 4.4.1, while other plots were generated using https://www.chiplot.online/ (accessed 2 April 2025).

3. Results

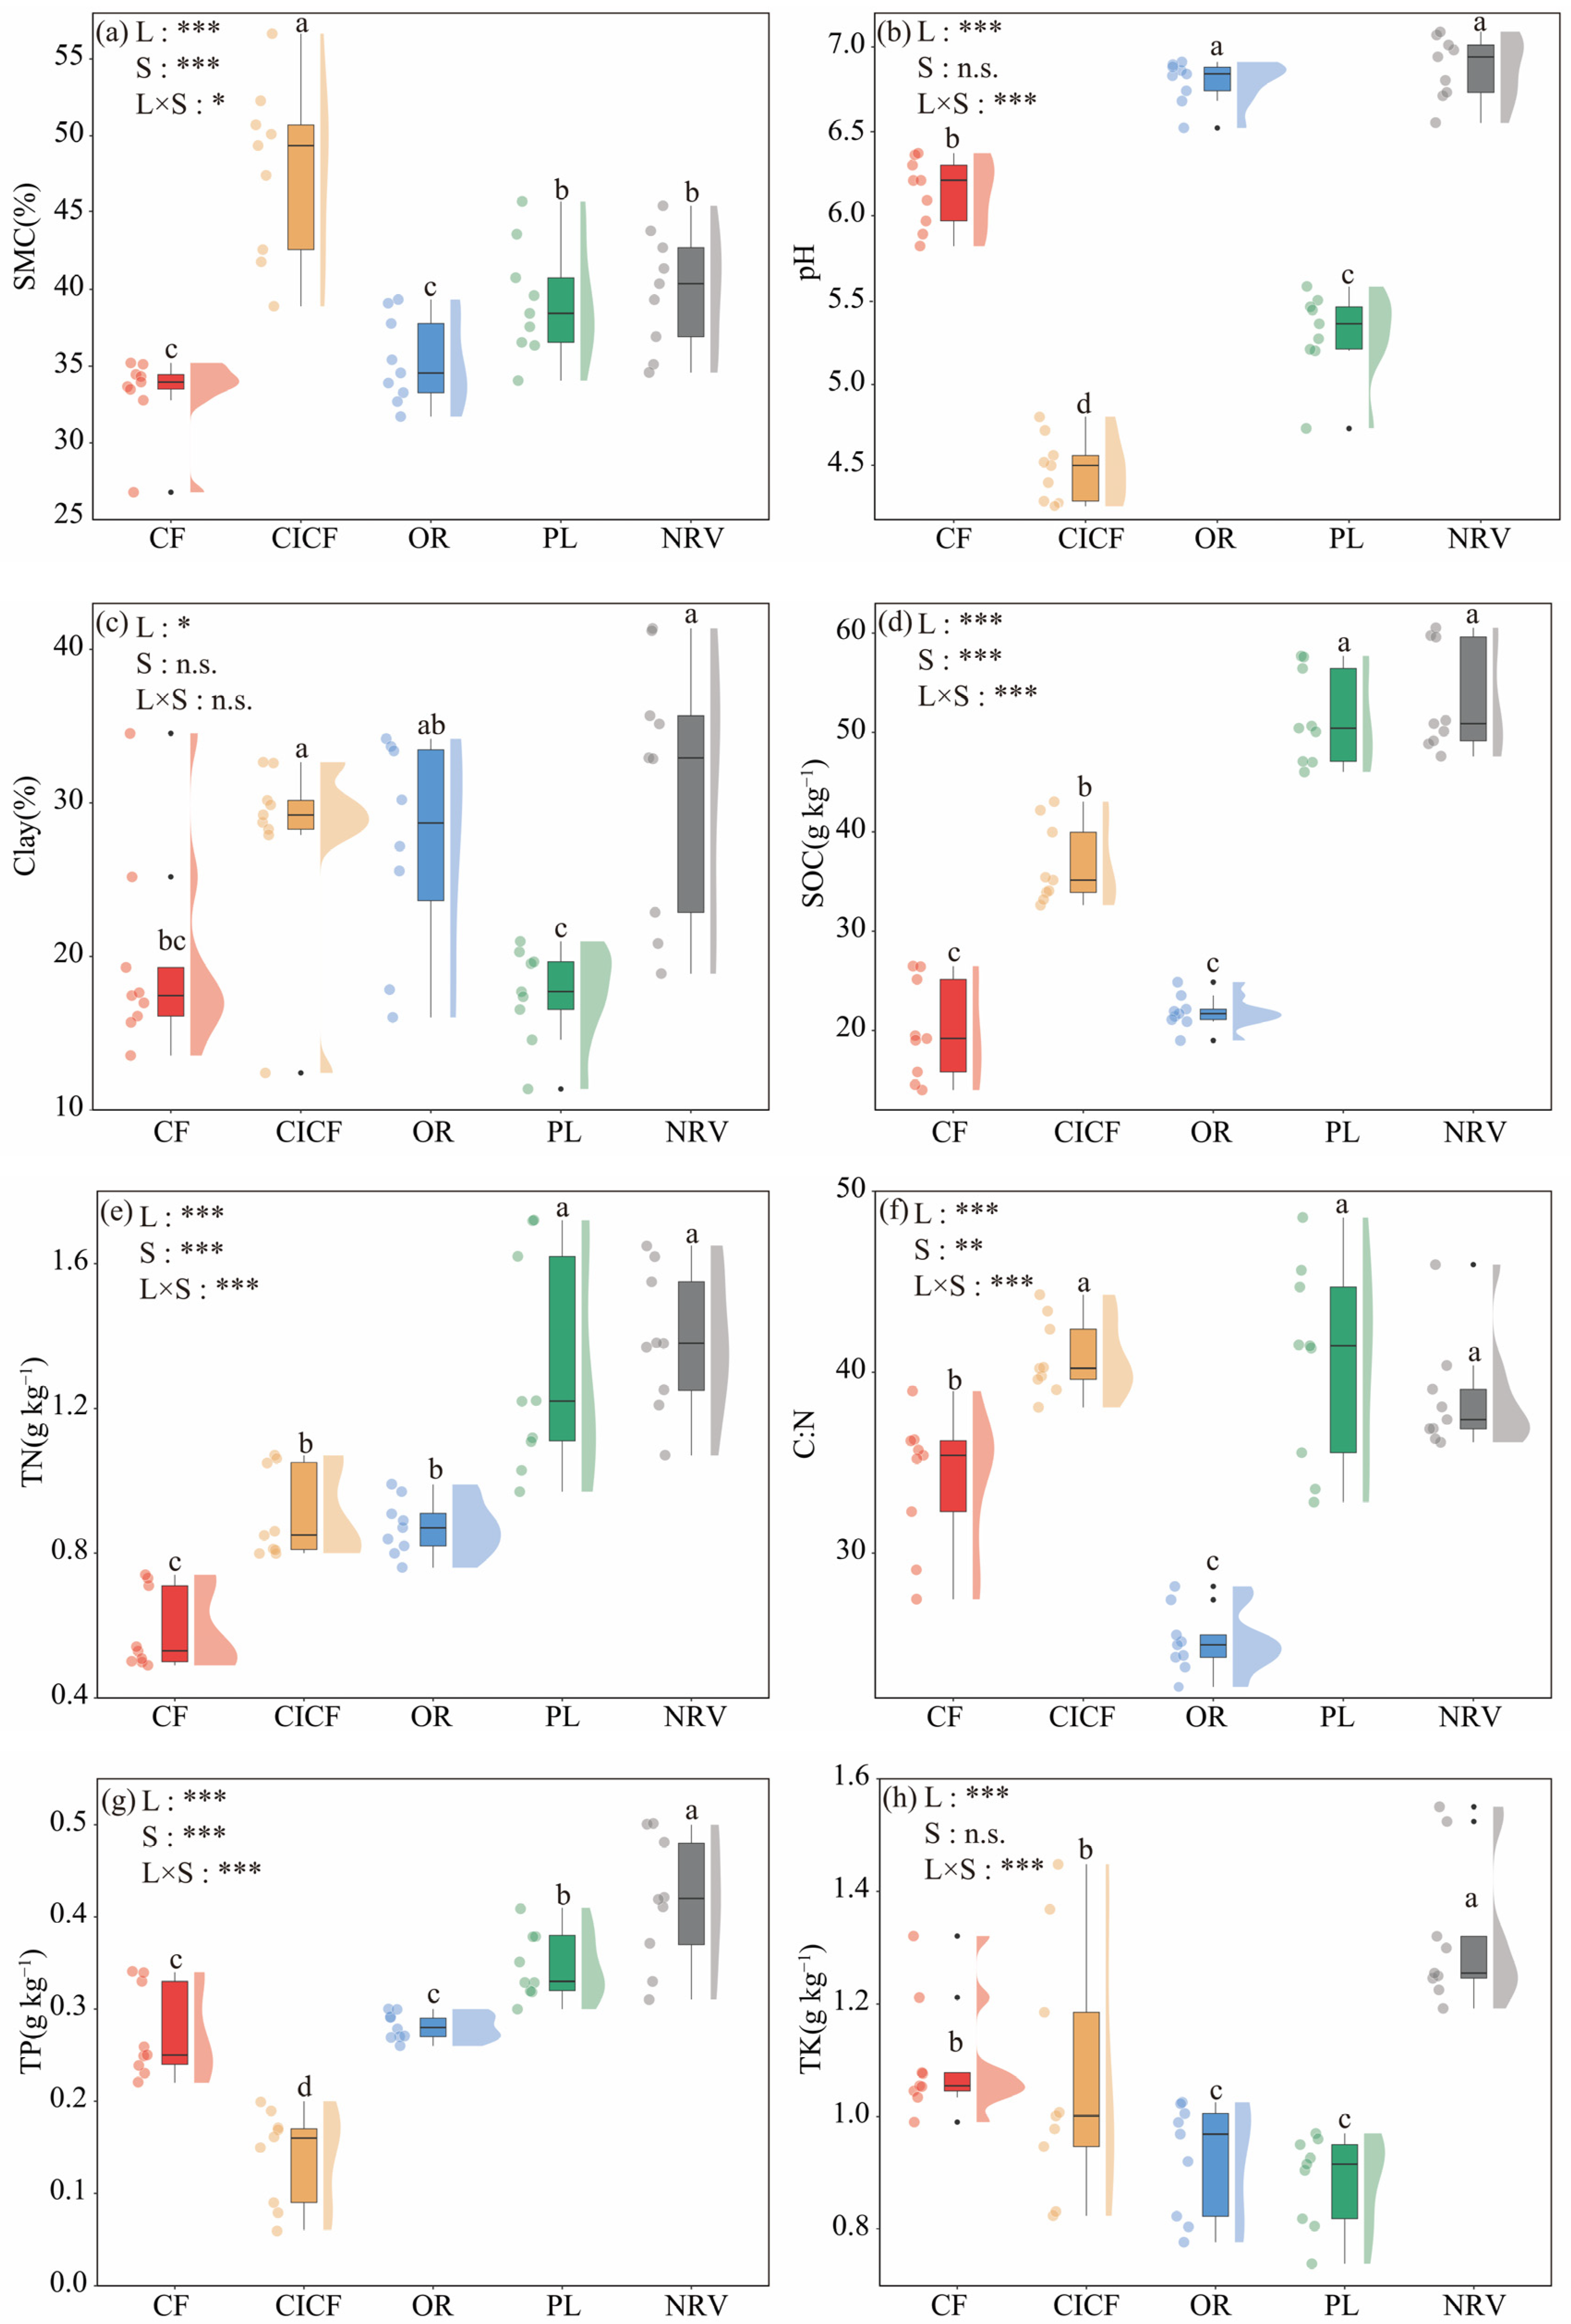
3.1. Impact of Different Land Uses on Soil Physicochemical Properties

Soil physicochemical properties were significantly affected by Land use, soil depth, and their interactions (p < 0.05, Figure 1). The SMC in NRV and PL was markedly higher than in CF and OR, with increases ranging from 10.97% to 19.97% across the 0–30 cm soil depth (Figure 1a). Soil pH across all land use types was weakly acidic (4.50~6.88), with the highest values observed in NRV and OR (6.88 and 6.80, respectively) (Figure 1b), significantly exceeding those in CF, CICF, and PL (by 10.75~52.83%). NRV and PL also exhibited significantly higher SOC, TN, and TP contents compared to CF, CICF, and OR, with increases ranging from 23.32% to 194.49%, but there were no significant differences in the SWC, SOC, and TN of NRV and PL. SMC, SOC, TN, C:N, and TP contents consistently decreased with increasing soil depth across the 0–10 cm, 10–20 cm, and 20–30 cm layers. In contrast, soil depth did not significantly affect soil pH, clay content, and TK. Additionally, no significant interaction effect (p > 0.05) between land use and soil depth was observed for clay content (Figure 1c).

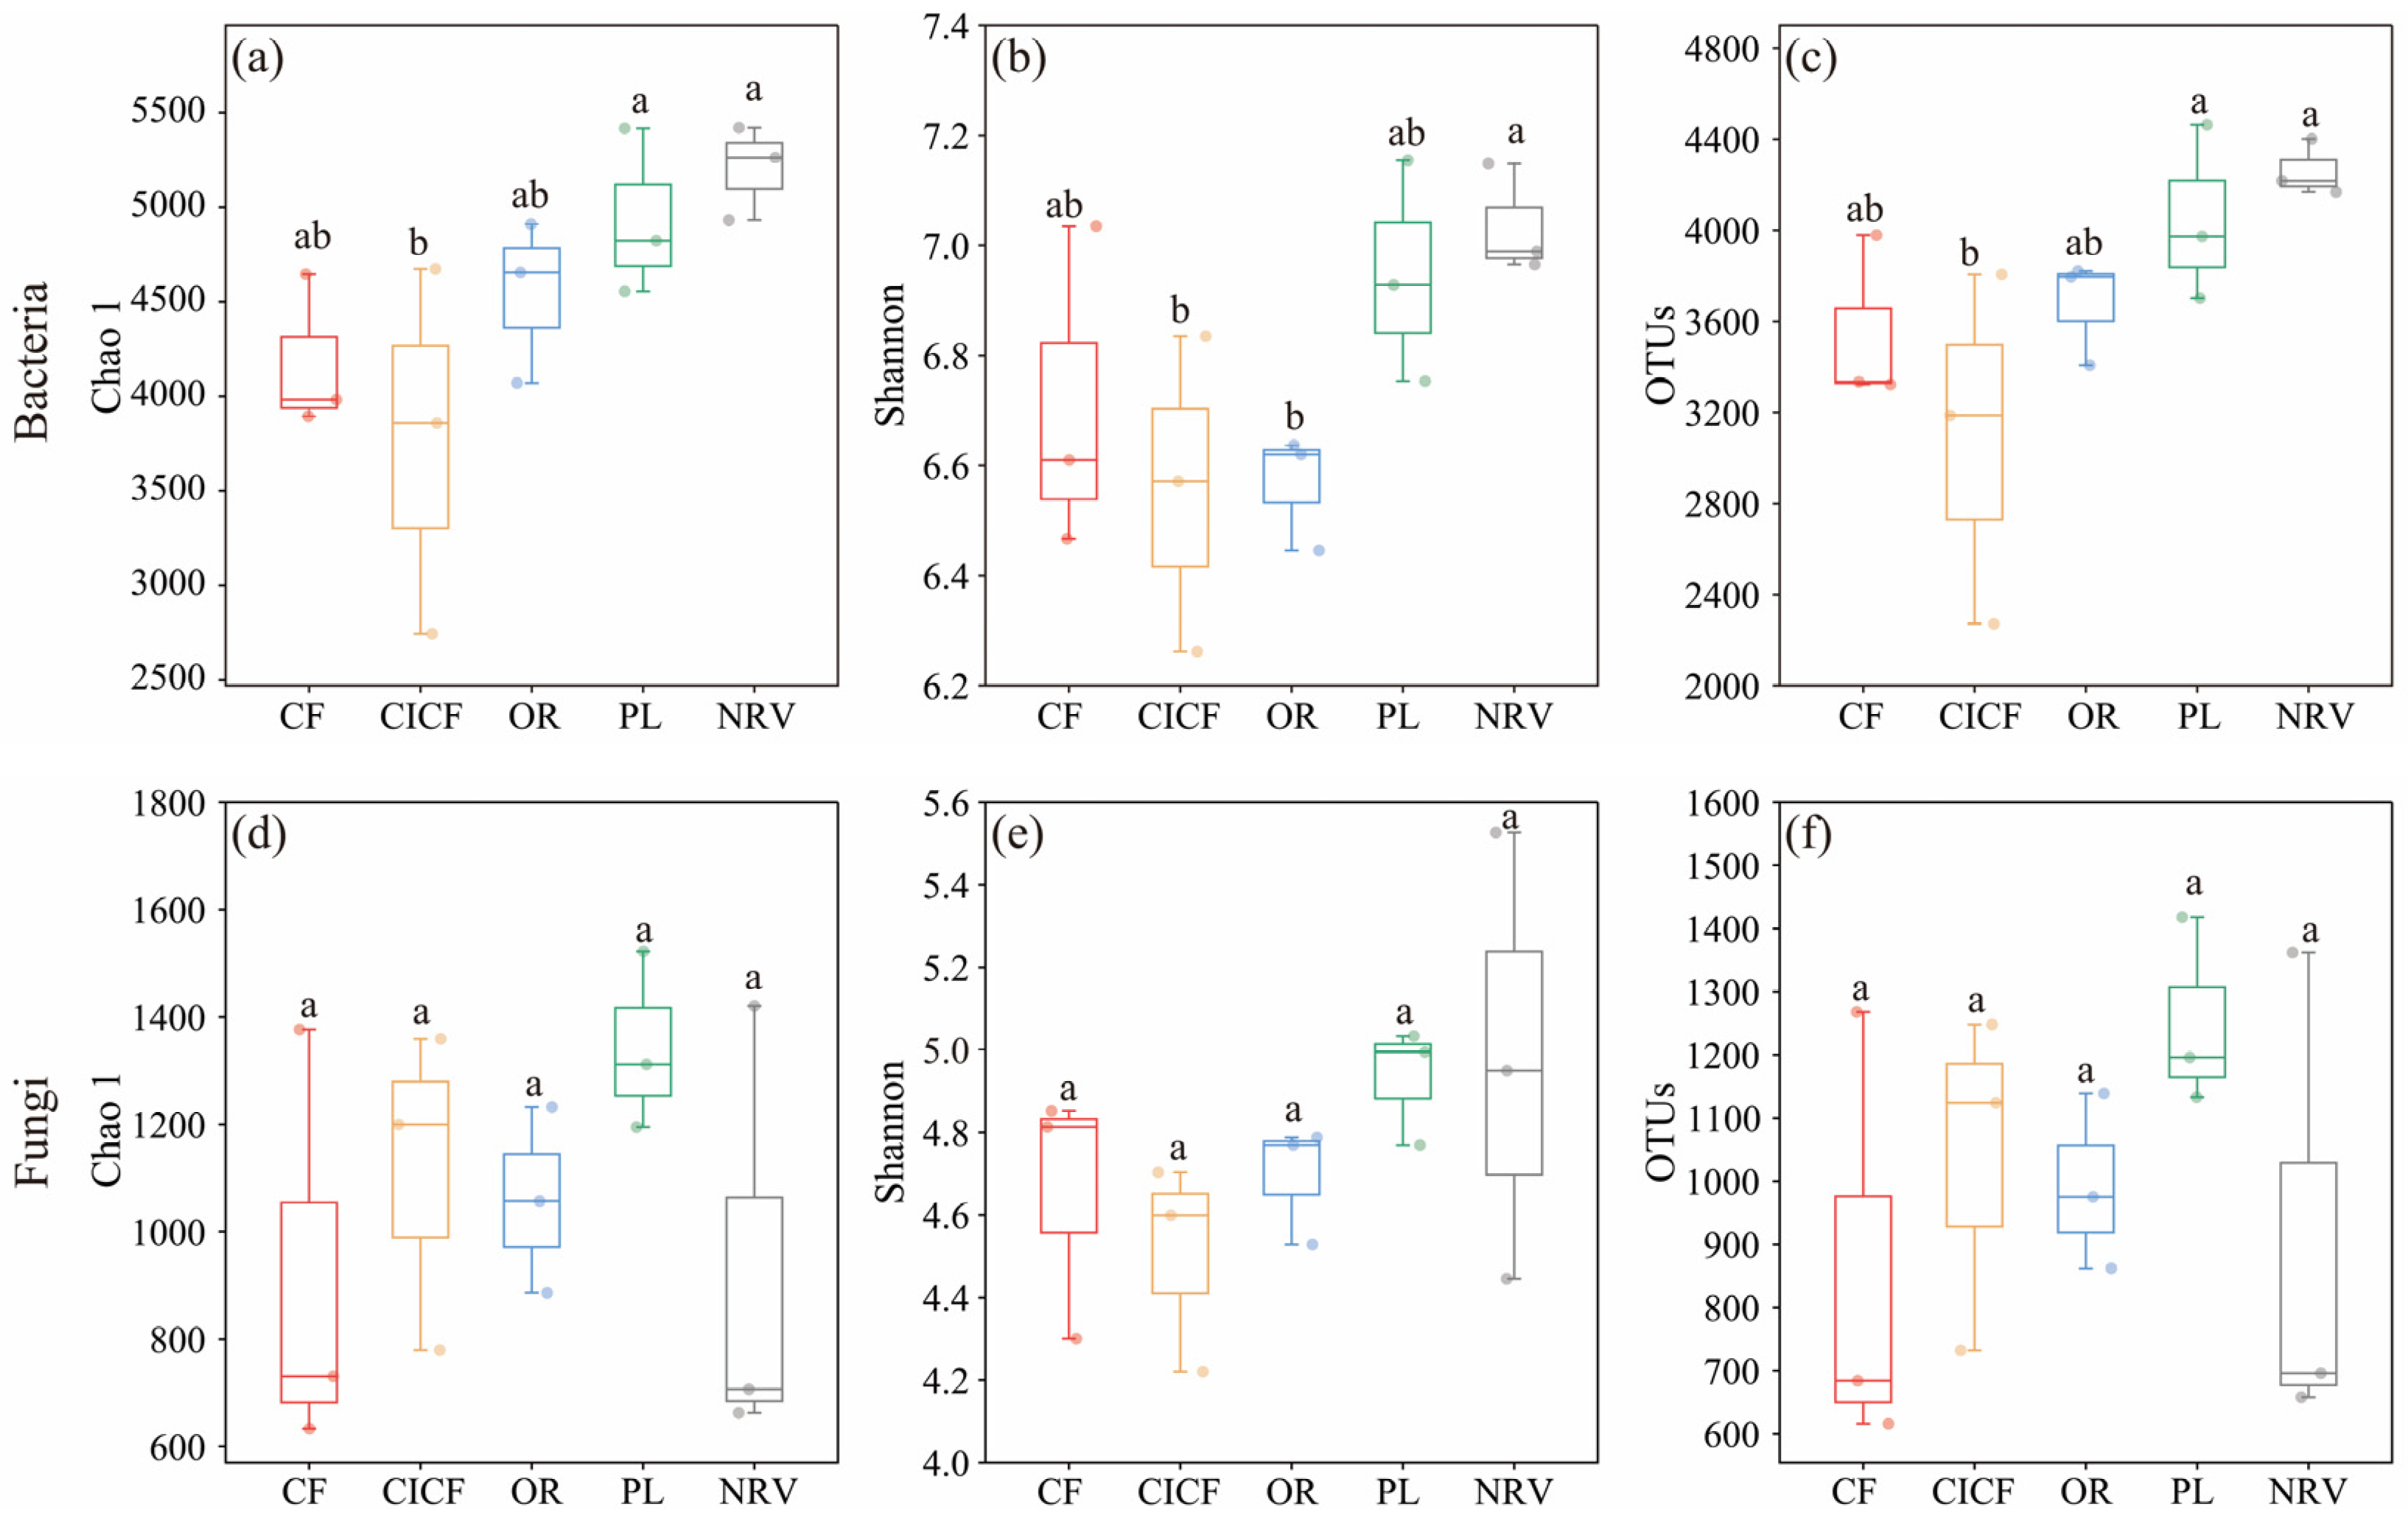
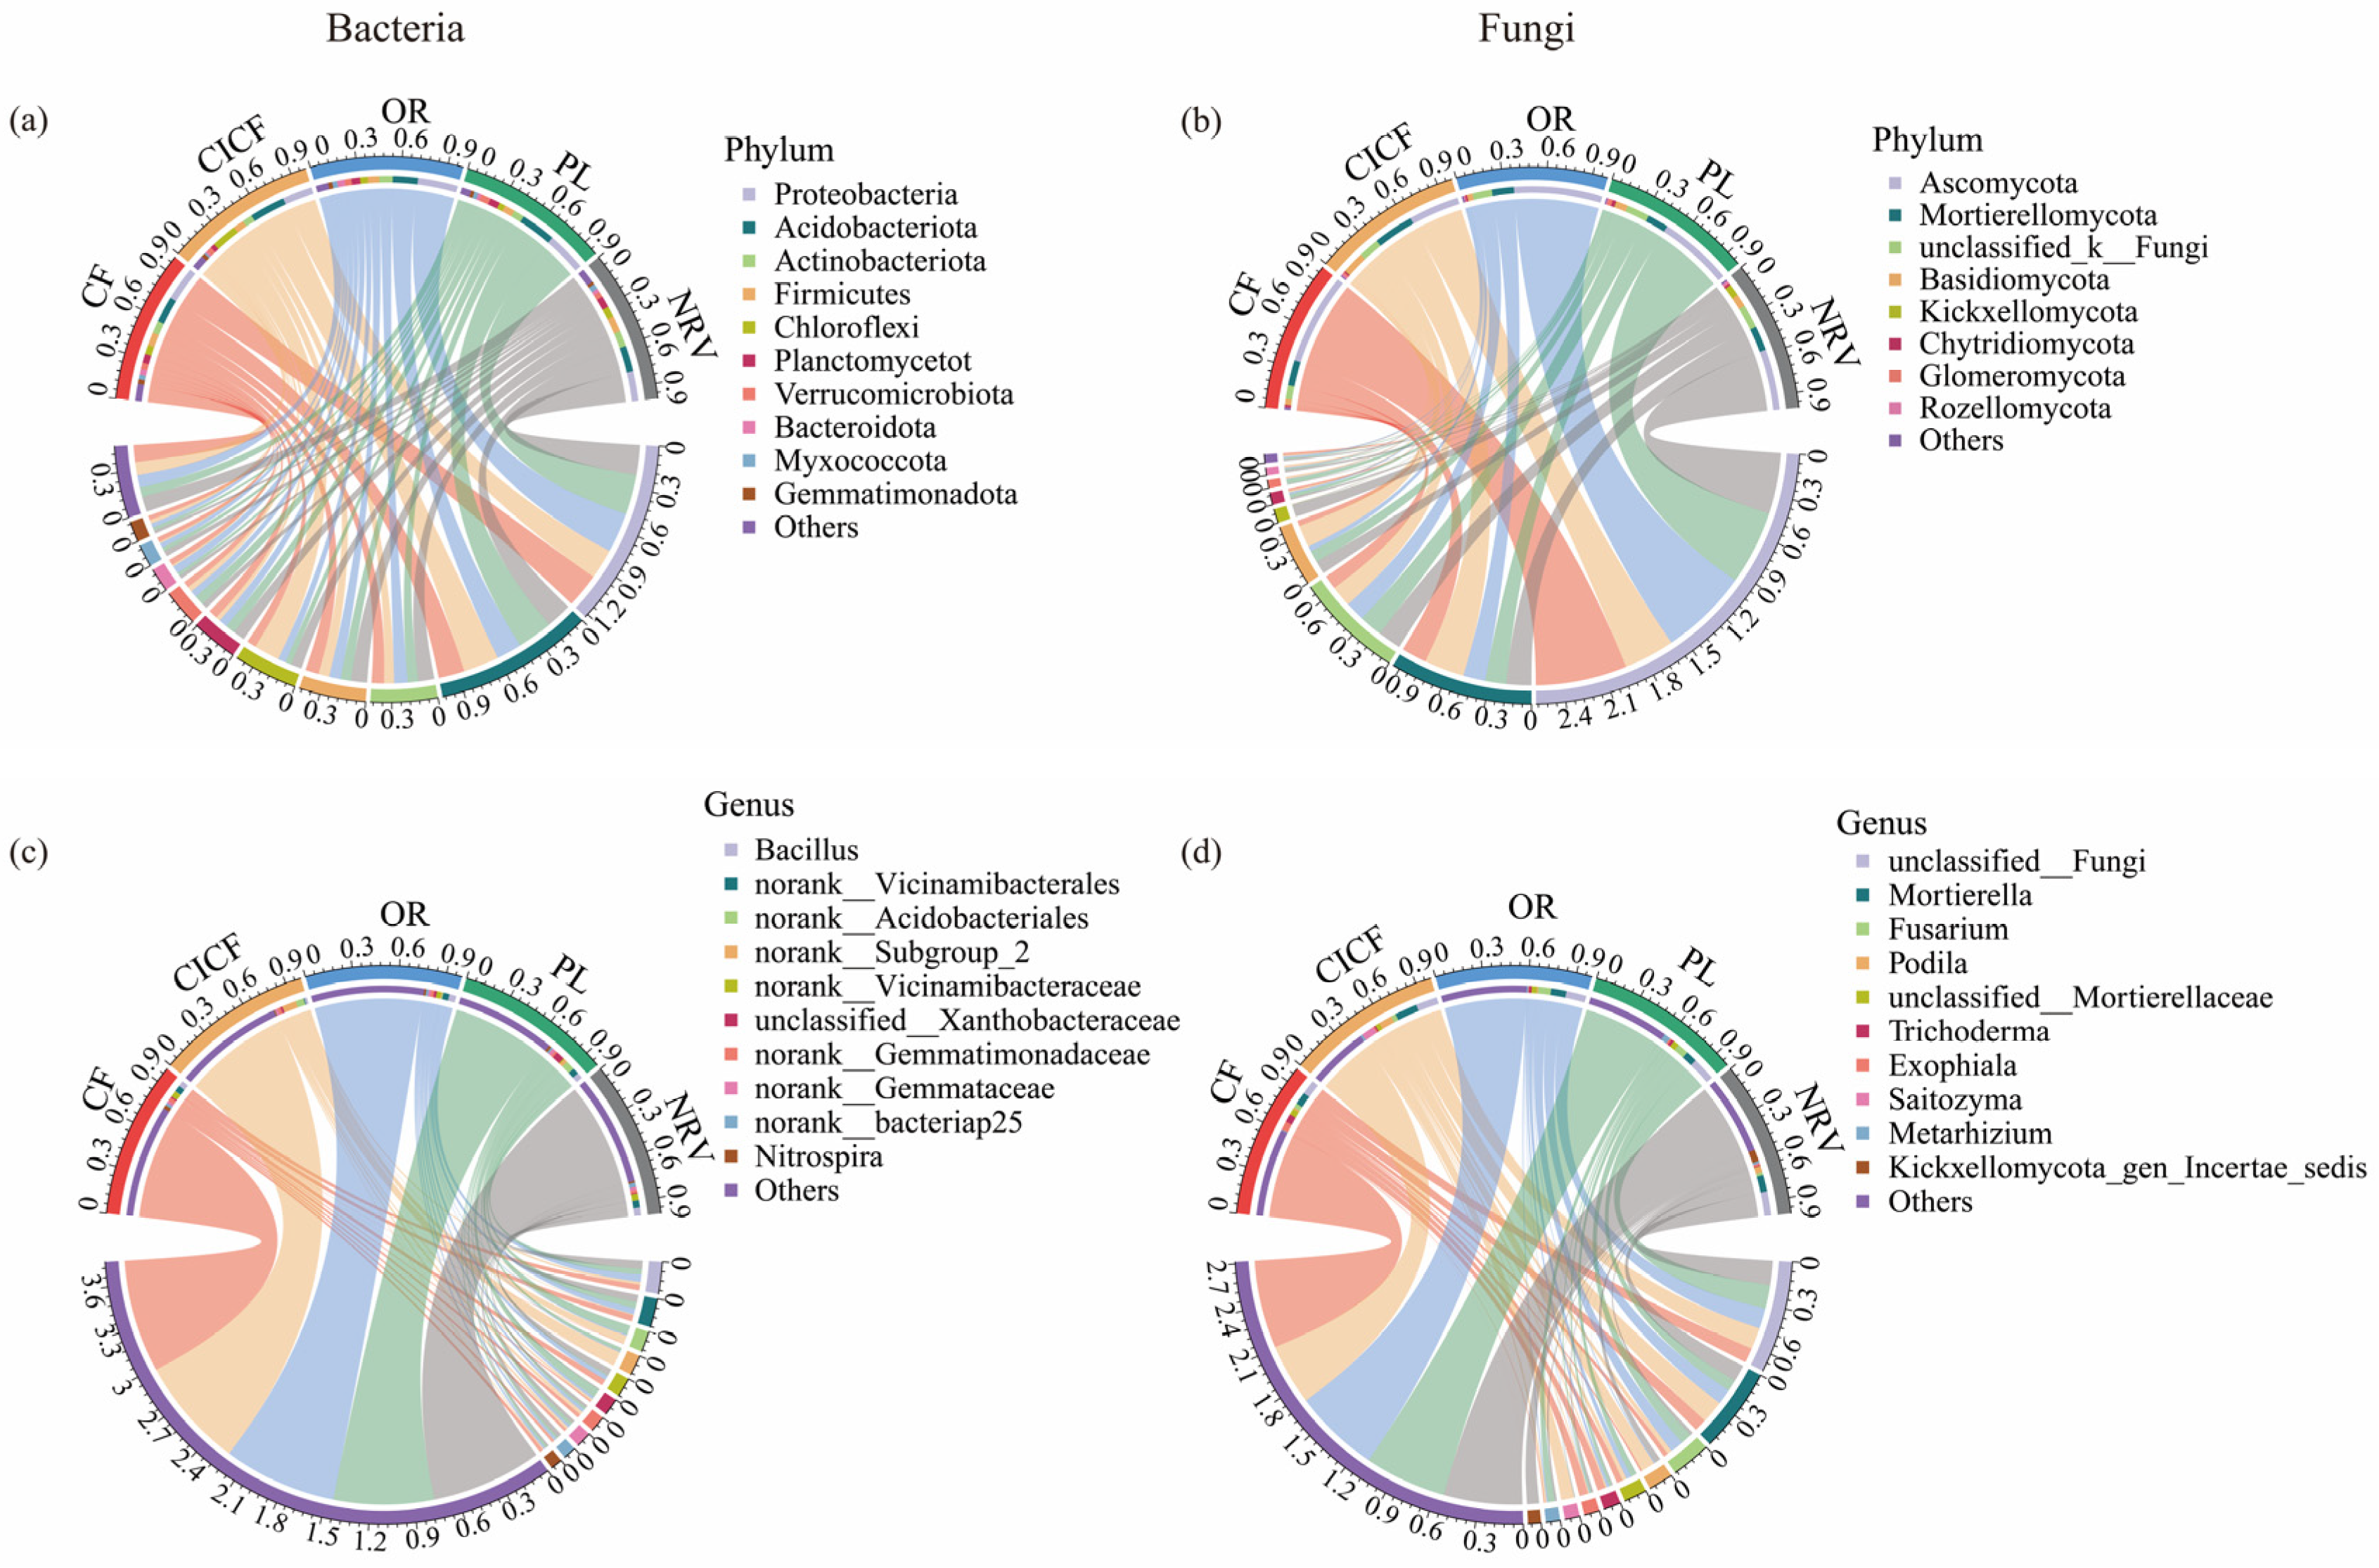
3.2. Effects of Different Land Uses on Microbial Diversity and Community Composition

3.2.1. Microbial Alpha Diversity

The alpha diversity index was calculated based on the OTU level to quantify the diversity and richness of microbial communities (Figure 2). The results showed that NRV had a significantly higher bacterial Chao1 index compared to CF, with an increase of 24.67%. Similarly, the bacterial Shannon index in NRV was 7.11% higher than in OR, and the number of bacterial OTUs was 20.21% higher than in CF, showing no significant difference compared to PL (Figure 2a–c). In contrast, fungal diversity, as reflected by the Chao1 index, Shannon index, and OTUs, showed no significant variation across the different land uses (Figure 2d–f). In conclusion, bacterial diversity indices were significantly influenced by land use, while fungal diversity remained unaffected.

3.2.2. Microbial Community Composition

At the phylum level, the dominant bacterial phyla across the different land uses were Proteobacteria (24.41%), Acidobacteriota (20.78%), Actinobacteriota (8.76%), Firmicutes (8.74%), Chloroflexi (8.35%), Planctomycetota (6.14%), and Verrucomicrobiota (4.72%), accounting for more than 80% of all sequences (Figure 3a). The relative abundance of different bacterial phylum levels (Acidobacteriota, Actinobacteriota, Verrucomicrobiota, and Planctomycetota) in NRV and PL was significantly higher than that of CF, CICF, and OR. However, land use did not significantly affect the relative abundance of Proteobacteria, Firmicutes, and Chloroflexi. For fungal communities, the dominant phyla were Ascomycota (51.89%), Mortierellomycota (18.93%), unclassified_k__Fungi (14.32%), and Basidiomycota (8.17%), accounting for more than 90% of all sequences (Figure 3b). The relative abundance of different fungal phylum levels (Ascomycota, Basidiomycota) was significantly higher in NRV and PL compared to CF, CICF, and OR. In contrast, Mortierellomycota showed a significantly lower relative abundance in NRV and PL. No significant differences in the relative abundance of unclassified_k__Fungi were observed among the different land uses.
At the genus level, the dominant bacterial genera across the different land uses were Bacillus (4.06%), norank__Vicinamibacterales (3.69%), norank__Acidobacteriales (2.65%), norank__Subgroup_2 (2.60%), norank__Vicinamibacteraceae (2.46%), unclassified__Xanthobacteraceae (2.17%), norank__Gemmatimonadaceae (2.07%), and norank__ Gemmataceae (1.99%), accounting for more than 20% of all sequences (Figure 3c). In NRV and PL, the relative abundances of Bacillus, norank__Acidobacteriales, unclassified__Xanthobacteraceae, norank__Vicinamibacterales, and norank__Vicinamibacteraceae were significantly higher compared to the CF, CICF, and OR. In contrast, the relative abundance of norank__Subgroup_2 was significantly lower in NRV and PL compared to the other land uses. No significant differences were observed in the relative abundances of norank__Gemmatimonadaceae and norank__Gemmataceae across the land uses. For fungal communities, the dominant genera were unclassified__Fungi (14.32%), Mortierella (10.78%), Fusarium (5.04%), Podila (3.13%), unclassified__Mortierellaceae (2.94%), Trichoderma (2.20%), and Exophiala (1.96%), accounting for over 40% of all sequences (Figure 3d). The relative abundance of Fusarium was significantly higher in NRV and PL compared to the CF, CICF, and OR. Conversely, the relative abundances of Trichoderma, Exophiala, Mortierella, and Podila were significantly lower in NRV and PL. No significant differences were observed in the relative abundances of unclassified__Fungi and unclassified__Mortierellaceae across land uses.

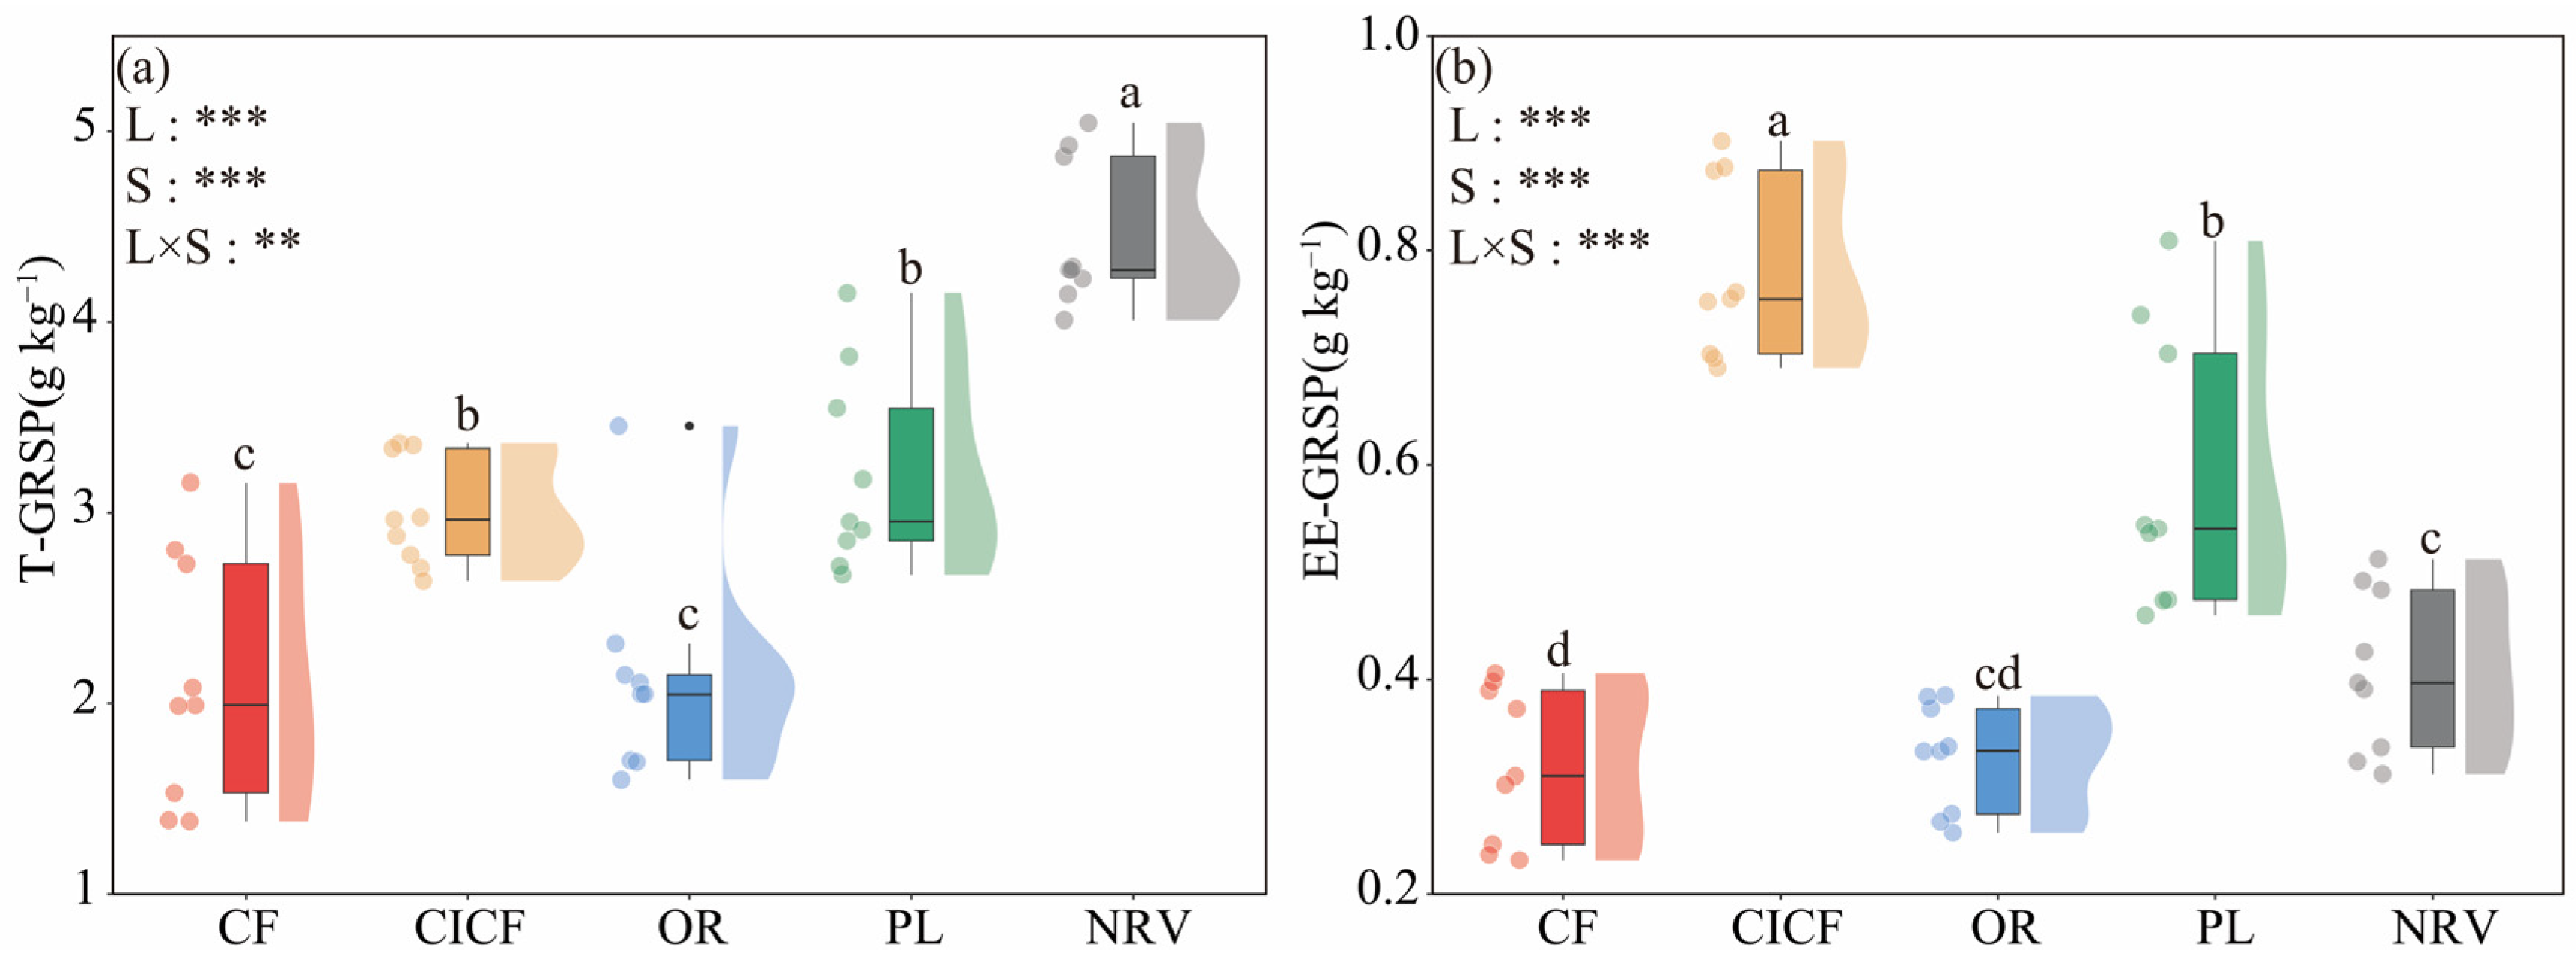
3.3. Effects of Different Land Uses on GRSP Content

Land use, soil depth, and their interactions all had significant effects on T-GRSP and EE-GRSP (p < 0.05). At the 0–30 cm soil depth, the CF exhibited the lowest T-GRSP (2.12 g kg−1) and EE-GRSP (0.32 g kg−1) contents. In contrast, NRV and PL showed the highest T-GRSP and EE-GRSP values, which were 48.33~110.23% and 6.66~51.18% higher, respectively, compared to the CF, CICF, and OR. Additionally, T-GRSP and EE-GRSP contents decreased with increasing soil depth across all sample sites (Figure 4). Land use significantly affected the ratio of EE-GRSP to T-GRSP (p < 0.05), while soil depth did not significantly influence this ratio (p > 0.05).

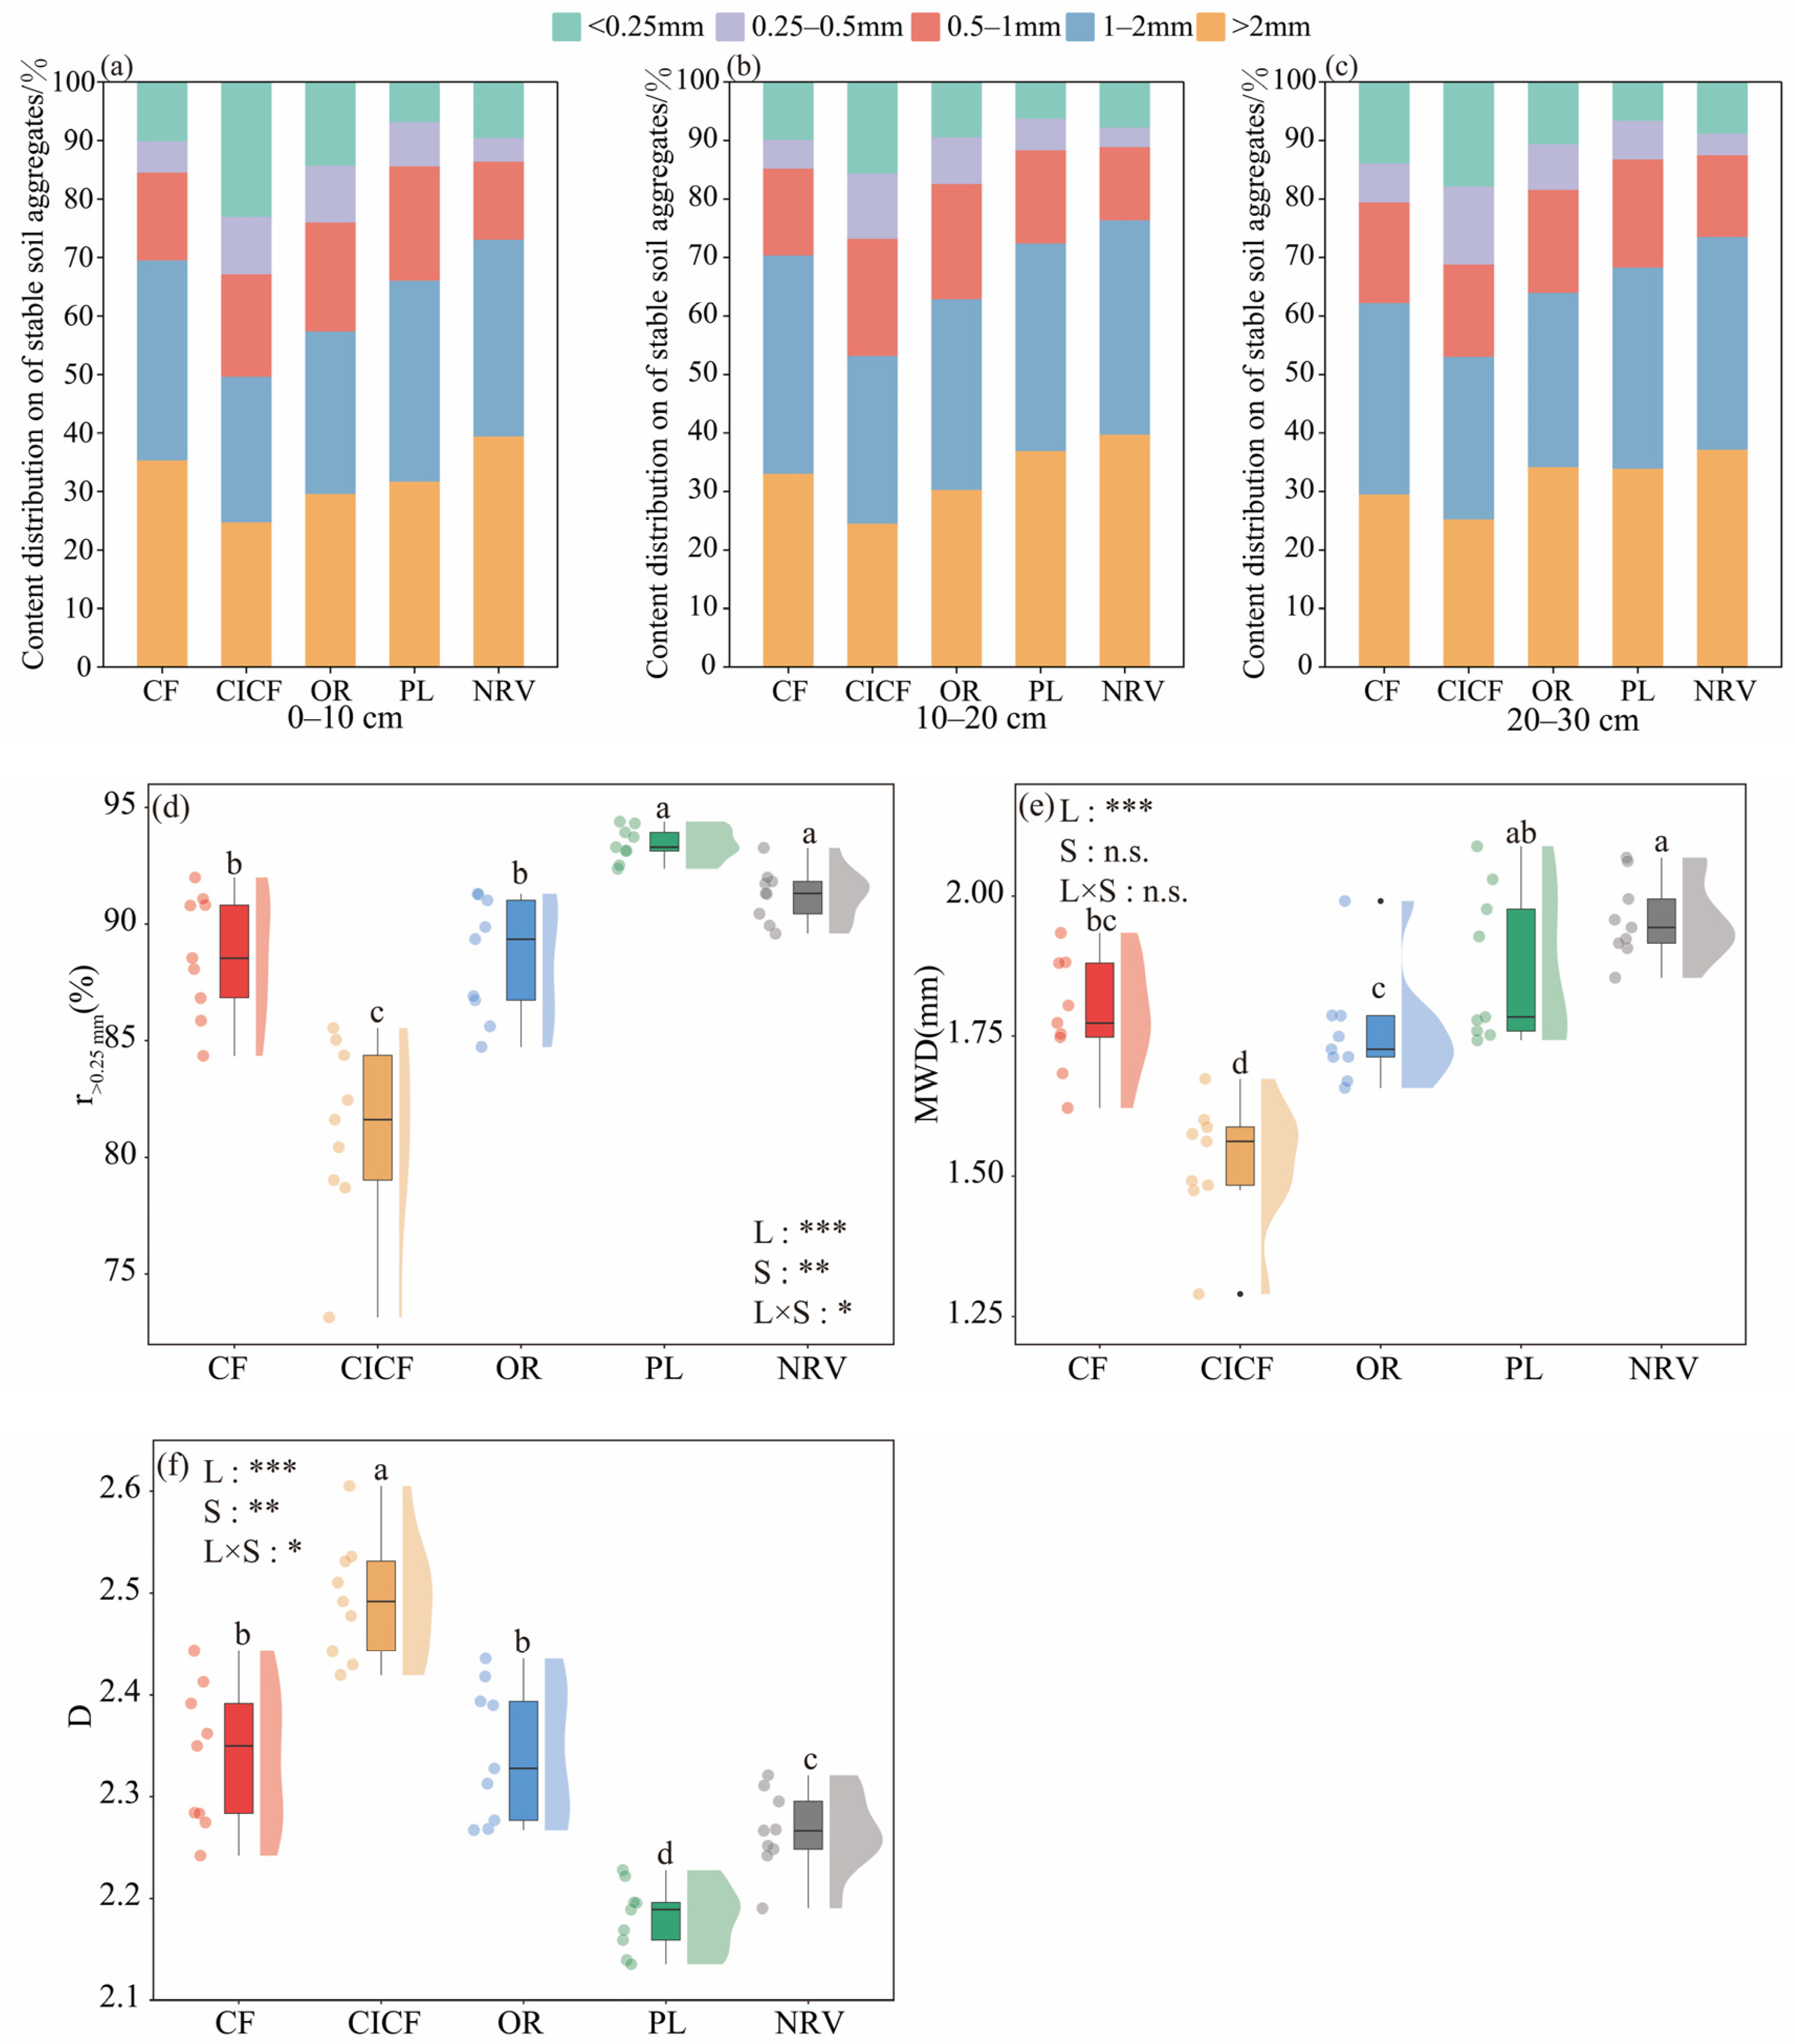
3.4. Effects of Different Land Uses on the Distribution of Soil Aggregate Content and Its Stability

At the 0–30 cm soil depth, soil aggregates were predominantly >0.25 mm, accounting for over 80% of total aggregates, while microaggregates (<0.25 mm) represented only 6.58–18.85% (Figure 5). r>0.25mm was significantly higher in both NRV and PL compared to CF, CICF, and OR, with increases ranging from 2.89% to 15.12% (Figure 5d). MWD was significantly higher in NRV and PL than in CF (4.71% and 9.62%), CICF (22.57% and 28.31%), and OR (6.63% and 11.62%), respectively (Figure 5e). However, no significant differences in r>0.25mm and MWD were observed between NRV and PL (p > 0.05). The D was significantly lower in NRV and PL than in CF, CICF, and OR (3.09~12.52%) (Figure 5f). Soil depth significantly affected r>0.25mm and D (p < 0.05), but had no significant effect on MWD (p > 0.05). At the 0–30 cm soil depth, the soil aggregate stability followed the order: PL > NRV > CF > OR > CICF.

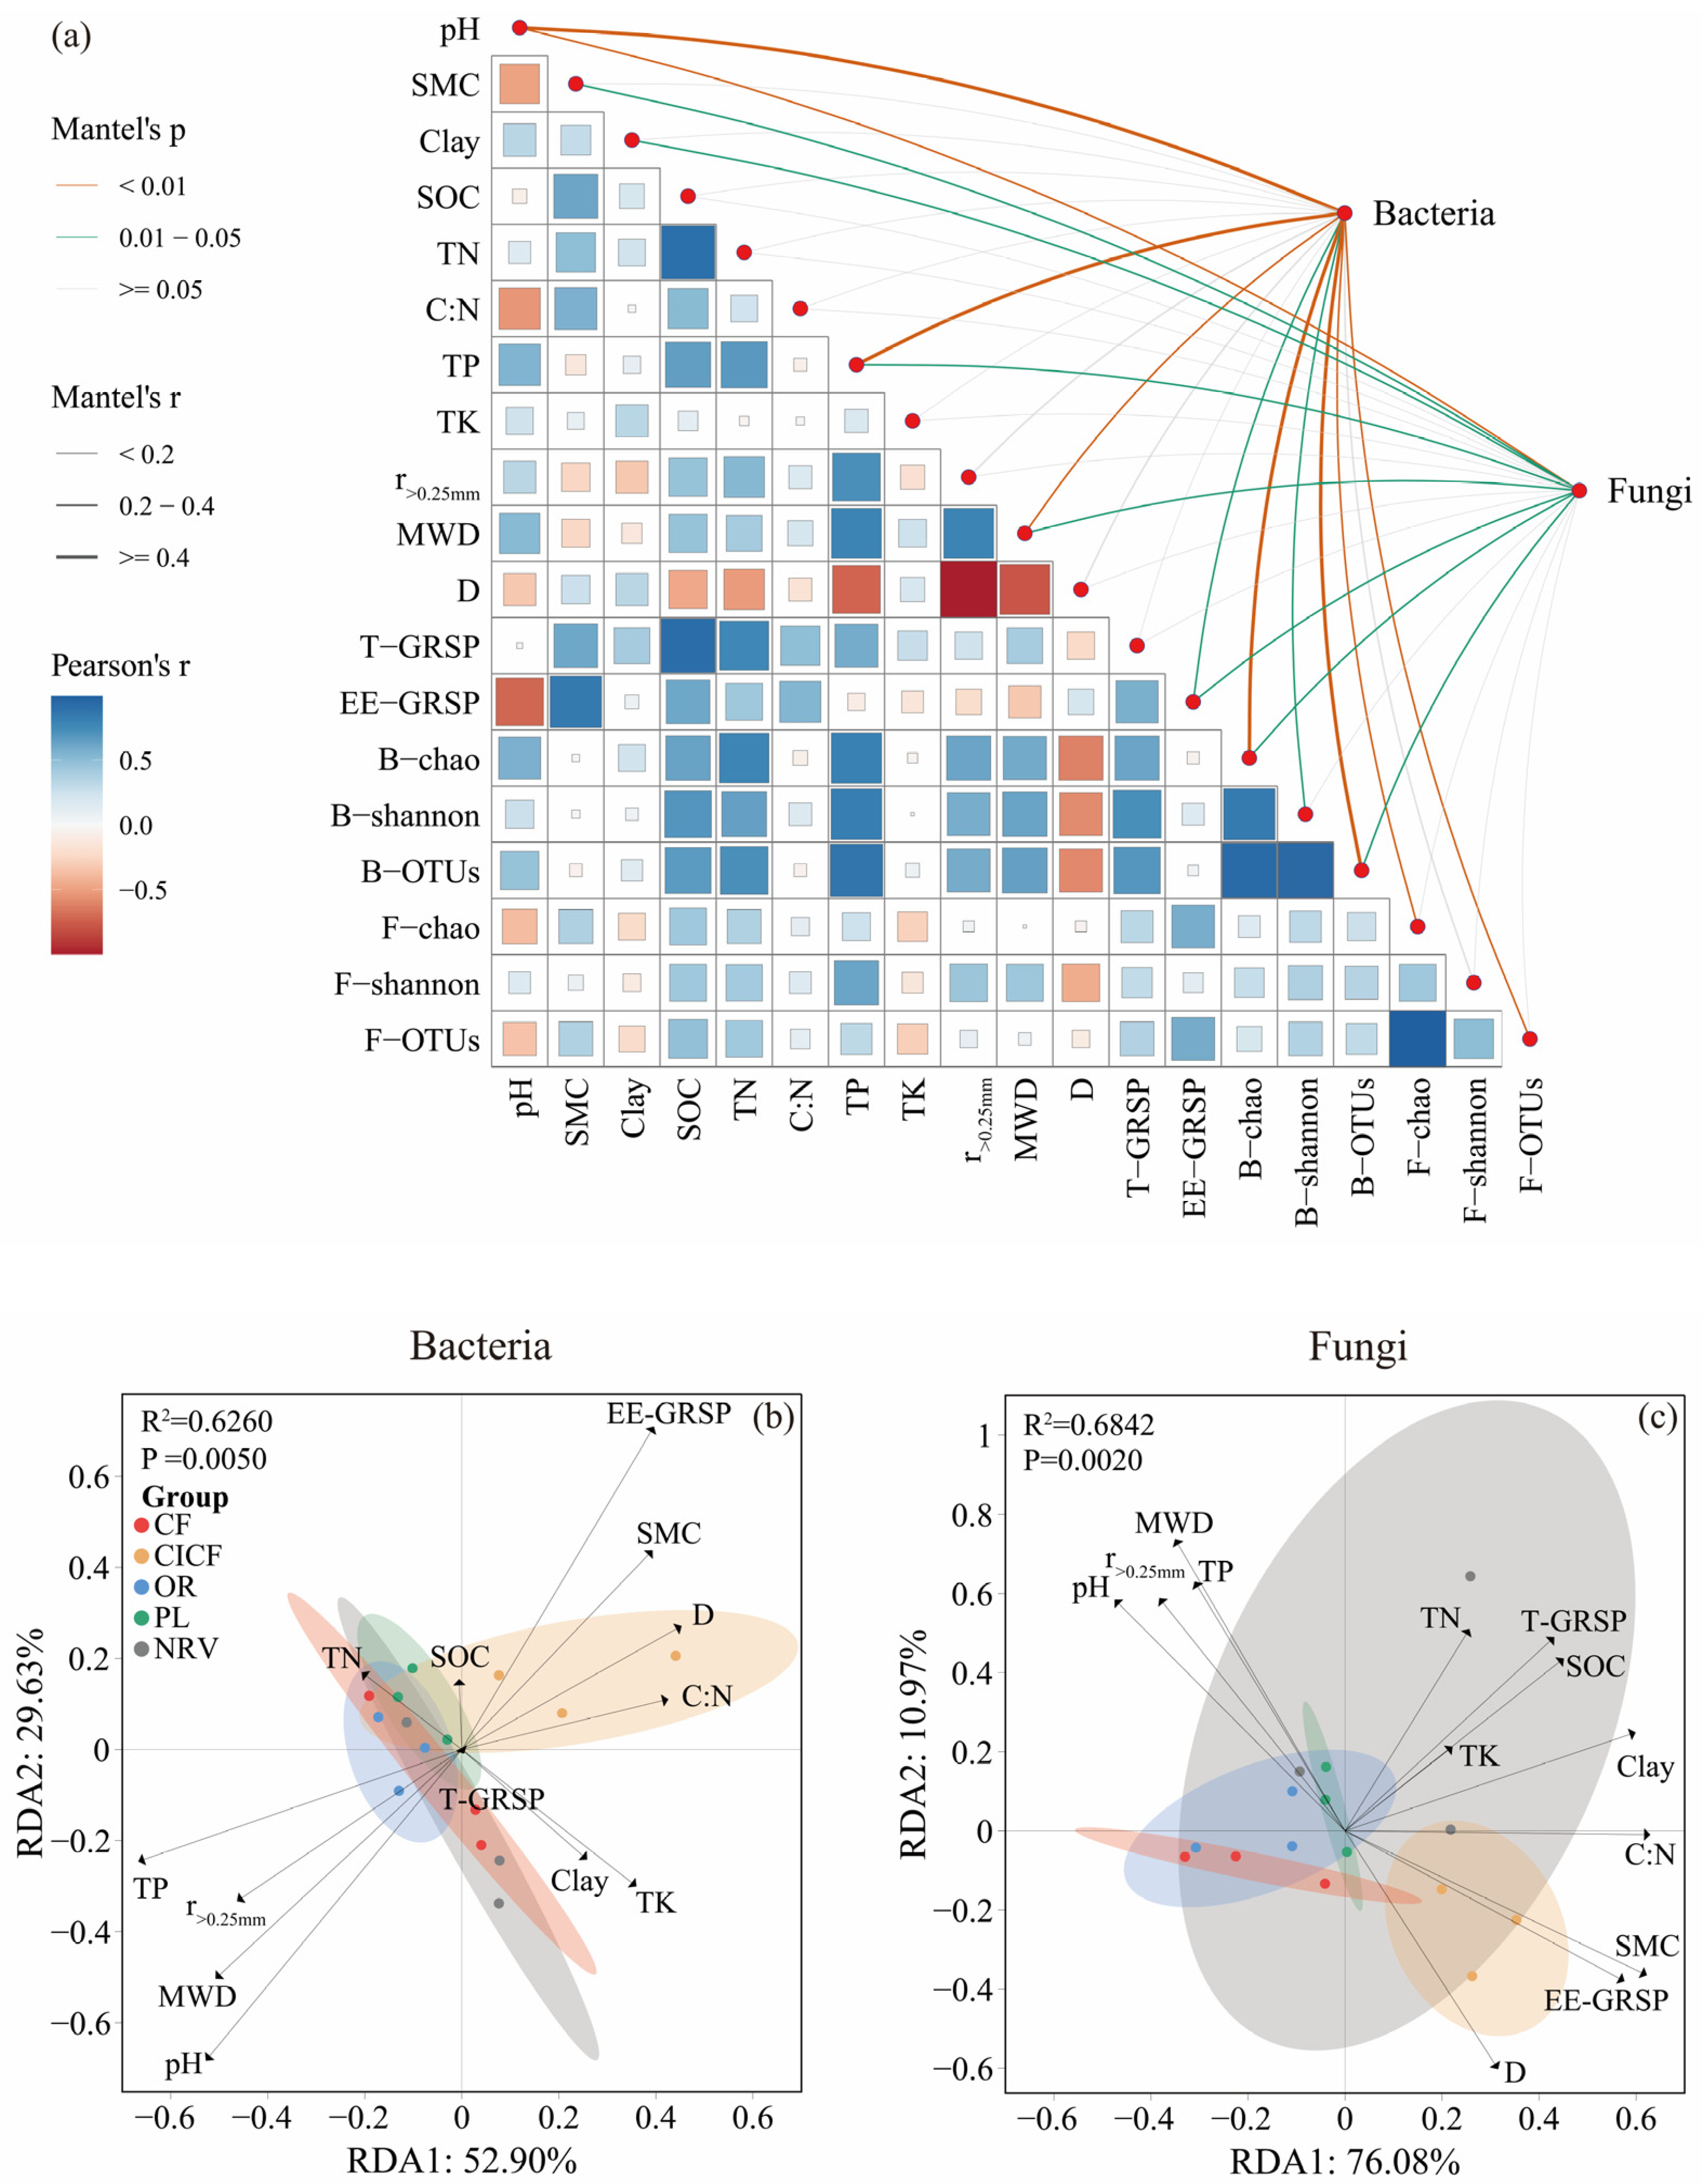
3.5. Correlation Between Microbial Diversity and Community Composition with Environmental Factors

Correlation analysis revealed significant relationships between soil physicochemical properties, GRSP, aggregate stability, and microbial communities (Figure 6a, left). In particular, r>0.25mm and MWD showed strong positive correlations with SOC, TN, TP, T-GRSP, and microbial diversity. T-GRSP was positively associated with r>0.25mm, MWD, SMC, SOC, TN, TP, and bacterial α-diversity. SOC exhibited significant positive correlations with SMC, TN, TP, C:N, r>0.25mm, MWD, T-GRSP, EE-GRSP, and bacterial and fungal α-diversity. Mantel test results indicated that pH, TP, MWD, EE-GRSP, bacterial Chao1 index, and OTUs significantly influenced bacterial and fungal communities at the phylum level (p < 0.05, Figure 6a, right). Specifically, the bacterial Shannon index, fungal Chao1 index, and OTUs had a greater impact on bacterial communities, while SMC and clay content affected fungal communities.
RDA was performed to further analyze the relationship between bacterial and fungal community composition and soil physicochemical properties, GRSP, and aggregate stability (Figure 6b,c). The RDA biplot for bacterial communities (Figure 6b) showed that the first two axes, RDA1 and RDA2, explained 52.90% and 29.63% of the variation, respectively, capturing the majority of the effects of soil physicochemical properties on bacterial community composition. Key factors regulating bacterial communities included TP, D, pH, and SMC (p < 0.05). The relationship between fungal communities and soil physicochemical properties (Figure 6c) explained 87.05% of the variance across both axes, with RDA1 accounting for 76.08% and RDA2 accounting for 10.97%. EE-GRSP contributed the most significant explanatory power for fungal community variance, followed by clay content and SMC, which showed significant correlations with fungal community composition and abundance.

3.6. Contribution of Soil Environmental Factors to SOC

Through PLS-PM, we elucidated how different land uses regulate SOC through direct or indirect effects on soil properties, soil bacteria and fungi, GRSP, and aggregate stability. Land use influences microbial characteristics by altering soil physicochemical properties, which subsequently affect GRSP accumulation and aggregate stability, ultimately contributing to SOC accumulation and stability (Figure 7a). Further analysis revealed that land use, soil physicochemical properties, fungal diversity, bacterial community, GRSP, and aggregate stability exerted positive total effects on SOC. In contrast, bacterial diversity and fungal composition exhibited weak negative total effects on SOC (Figure 7b). Among them, land use emerged as the primary driver of SOC, with a total effect of 0.78.

4. Discussion

4.1. Response of Soil Physicochemical Properties as Well as Microbial Diversity and Community Composition to Different Land Uses

Our results demonstrated significant differences in soil physicochemical properties across the five land uses. The SMC in NRV and PL was significantly higher than in CF and OR, with increases ranging from 10.97% to 19.97% (Figure 1a). This increase can be attributed to greater land cover and root abundance in NRV and PL, which enhance soil water-holding capacity and subsequently increase SMC [8]. The pH in NRV (6.88) was significantly higher than in CF (6.14) and CICF (4.50) (Figure 1b). The difference can be attributed to the long-term application of chemical fertilizers, such as urea, on sloping cultivated land, which leads to nutrient accumulation and soil acidification [12], thereby reducing soil pH. These findings are consistent with the results of Bai et al. [11]. Our study also showed that the TN, TP, and TK contents of NRV and PL were significantly higher than those of CF, CICF, and OR, with increases ranging from 23.32% to 194.49% (Figure 1). In NRV and PL, high vegetation cover and no anthropogenic disturbance enhance soil carbon inputs, reduce soil erosion caused by rainfall and wind, and reduce nutrient loss, thereby enhancing soil nutrient content [39,40].
As the predominant and most diverse microbial community in soil, bacteria are essential for driving nutrient cycles, maintaining soil structure, and enhancing vegetation development [41]. Our results indicated that the different land uses significantly influenced the α-diversity of soil bacteria. Both the bacterial Chao1 index and OTUs were significantly higher in NRV compared to CF (Figure 2). This difference can be attributed to the strong relationship between soil microbial diversity and soil properties [33]. For instance, the TN content in the NRV was found to be considerably higher than in the CF (Figure 1e) and exhibited a significant positive correlation with the bacterial diversity index (Figure 6a). These findings suggest that soil TN content directly influences microbial communities, consistent with previous studies [42,43]. On the other hand, changes in soil pH can affect bacterial growth and metabolic activities. Most soil microorganisms have an intracellular pH near neutral, and therefore exhibit higher activity in neutral soil environments (such as NRV) [44]. In contrast, fungal α-diversity was not significantly influenced by different land uses (Figure 2). Bacterial communities showed faster succession during vegetation restoration compared to fungal communities, reflecting an adaptive strategy to environmental changes. Bacteria are more sensitive to variations in environmental factors such as soil pH, temperature, and moisture than fungi [45].
In this study, different land uses directly or indirectly affected the community composition and abundance of soil microorganisms (Figure 3). The relative abundance of the bacterial Actinobacteria in NRV and the fungal Ascomycota in PL was significantly higher than that in sloping cropland. This increase can be attributed to the enhanced inputs of litter and root secretions resulting from higher vegetation cover and reduced soil erosion in NRV and PL. These secretions provide additional energy for soil microorganisms [46,47,48], leading to an increase in eutrophic taxa such as Actinobacteria and Ascomycota with vegetation restoration. These findings align with the study by Pei et al. [49] in the karstic desertification area of Guangxi. RDA analysis and Mantel test results showed that soil pH and TP content significantly influenced the community composition of bacteria and fungi (Figure 6). pH is a critical determinant of microbial composition, as most microbial taxa exhibit narrow growth tolerances [50]. Extremes in pH are unfavorable for microbial activity. Additionally, fertilizer application increases soil PL content, lowering soil pH and promoting the development of acidic-adapted microbial phyla such as Acidobacteriota, Actinobacteria, and Ascomycota. These findings are consistent with studies by George et al. [51] at the national scale in the UK and Bai et al. [11] in the forest–steppe transition zone of the western Daxinganling foothills in China. Therefore, in this study, we found that soil microbial diversity and community composition in response to land use likely consist of two aspects. On the one hand, differences in vegetation cover and inputs of litter under land use directly affect the survival environment of soil microorganisms. On the other hand, land use indirectly affects microbial activity by influencing soil physicochemical properties (e.g., pH and TP).
Land use had a smaller impact on the α-diversity of bacteria and fungi compared to their community composition. This observation aligns with previous findings that soil microbial richness is less sensitive to environmental changes than species composition [52]. Changes in microbial community composition do not necessarily alter richness or diversity, as univariate metrics often obscure relationships between taxa. Adjustments in some taxonomic units may compensate for changes in others [53]. Consequently, microbial community structure in response to land use did not result in significant differences in microbial α-diversity.

4.2. Differences in Land Use Affect GRSP Accumulation and Aggregate Stability

This study demonstrates that GRSP content is highly sensitive to different land uses. GRSP, a glycoprotein secreted by AMF mycelium, plays a crucial role in soil structure and function [7]. AMF forms symbiotic relationships with approximately 80% of terrestrial plants, exchanging nutrients for plant-derived carbon sources [54]. T-GRSP content in NRV and PL was 48.33% to 110.23% higher than in CF, CICF, and OR (Figure 4a). This difference may be attributed to the negative impact of tillage activities on sloping croplands, which disrupt AMF mycelial growth [6] and GRSP production [55]. Tillage disrupts root and fungal networks, reducing soil aggregate stability and releasing aggregate-encapsulated GRSP, which becomes readily available to microorganisms. Soil pH also influences GRSP secretion and accumulation by directly affecting AMF formation [56]. The CF exhibited a significantly higher pH (6.11) compared to PL (5.31) (Figure 1b), yet the T-GRSP content and the relative abundance of Glomeromycota were significantly lower than that of the PL at 51.18% and 95.74% (Figure 3b and Figure 4a). The lower T-GRSP content may result from higher AMF activity and the relative abundance of Glomeromycota in acidic soils, which promotes GRSP secretion and accumulation [17]. The content of GRSP decreased in proportion to the depth of the soil and exhibited significant positive correlations with SOC, TN, TP, and SMC (Figure 6a). Soil properties, including SOC, TN, TP, and SMC, play a crucial role in regulating GRSP characteristics and explaining differences between surface and deeper soils. These findings align with those of Wang et al. [57] in poplar shelterbelt forests on the Songnen Plain, northeastern China, at depths of 0–100 cm, and Engelhardt et al. [58] in ungrazed grasslands in St. Germain-Varennes, France, at depths of 0–5 cm, 10–15 cm, and 30–35 cm. The vertical distribution of GRSP was strongly influenced by soil properties. SOC, TN, TP, and SMC significantly decreased with increasing soil depth, reducing microbial diversity and abundance. This reduction likely inhibited GRSP secretion and accumulation, resulting in consistently lower GRSP levels in deeper soils compared to surface soils.
Soil aggregate stability has been shown to serve as an indicator of soil structural quality [59], and r>0.25mm and MWD have been identified as significant indicators for assessing soil aggregate stability [60]. In the current study, macroaggregate content across five land uses followed the order: PL > NRV > CF > OR > CICF (Figure 5d), and MWD exhibited a similar trend (Figure 5e). This pattern can be attributed to higher ground cover, such as litter, and increased vegetation diversity and abundance in NRV and PL. These factors enhanced soil water infiltration, attenuated rainfall impacts, reduced soil dispersion or surface runoff, and improved root growth conditions, leading to more stable soil structures and favoring macroaggregate formation and stability. In addition to r>0.25mm and MWD, D is also an important index for assessing aggregate stability. Lower D values correspond to better soil structure and higher stability [37]. In this study, D in NRV and PL were significantly lower than those in CF, CICF, and OR (Figure 5f), with D showing significant negative correlations with r>0.25mm and MWD (Figure 6a). Compared to CF, CICF, and OR, the proportion of macroaggregates increased under the land use practices of NRV and PL, while the D decreased. In contrast, CF, CICF, and OR displayed weaker physical structures, which hindered macroaggregate formation and stabilization. Prolonged cultivation and raindrop impacts caused decomposition of macroaggregates and microaggregates, compromising soil structure [61,62,63]. These findings are consistent with results reported by Zolfaghari et al. [21]. Overall, NRV and PL are more conducive to macroaggregate formation and aggregate stabilization.
SOC and GRSP, as key cementing agents in soil aggregates, play crucial roles in improving aggregate stability. The distribution of SOC within aggregates influences not only their capacity to stabilize and store SOC but also the overall stability of the aggregates [1]. In this study, SOC was significantly positively correlated with the r>0.25mm and MWD, and significantly negatively correlated with D (Figure 6a). This correlation can be attributed to the role of SOC in producing resistant binding agents, such as humic compounds, polysaccharides, and root exudates, which improve the formation of soil aggregates [18,20]. Similarly, GRSP content showed a significant positive correlation with r>0.25mm and MWD (Figure 6a). As a persistent binder [6], GRSP binds fine soil particles into microaggregates, which then combine to form macroaggregates, resulting in stable structural units [64]. The greater aggregate stability observed in NRV and PL compared to CF, CICF, and OR may be explained by the increased content of cementing substances, such as SOC and GRSP, in these land uses.

4.3. Regulatory Factors of Soil SOC Under Different Land Uses

The PM analysis results indicated that land use, soil physicochemical properties, microorganisms, GRSP, and aggregate stability all affected SOC accumulation. Among them, land use was the most critical driver of SOC. Land use affected SOC accumulation by regulating soil physicochemical properties, microbial activity, GRSP levels, and soil aggregate stability (Figure 7a). SOC content was significantly higher in NRV and PL compared to CF, CICF, and OR (Figure 1d).
Land use influences SOC accumulation indirectly by altering soil physicochemical properties. One contributing factor is the extensive removal of biomass during crop harvesting in CF, CICF, and OR [65]. In orchards, management practices such as removing pruned branches, leaves, and fruits reduce the input of energy-rich substances and nutrients to the soil. Similarly, in sloping cropland, the harvesting of crops and straw prevents organic matter from being returned to the soil and reduces carbon input. Additionally, anthropogenic tillage depletes soil nutrients and water, alters soil properties, destroys soil structure, causes soil erosion, and accelerates SOC mineralization [22]. Consequently, both land use types lead to reduced SOC content. In contrast, NRV and PL with high vegetation cover (76% and 68%, respectively) contribute to SOC accumulation. Large amounts of organic material from plant apoptosis and root secretions enrich the surface soil with nutrients through decomposition and transformation, increasing SOC levels. These findings align with those of Bai et al. [11].
Meanwhile, SOC is a major substrate for microbial metabolism, and microbial metabolites contribute to the soil carbon pool. Our study showed that microbial diversity and community abundance indirectly regulated SOC by influencing GRSP secretion and soil aggregate stability (Figure 7a). Soil fungal diversity, bacterial communities, GRSP, and aggregate stability all exhibited positive total effects on SOC (Figure 7b). Favorable conditions for microbial growth and activity in NRV and PL enhance GRSP production and accumulation in the soil. The viscous properties of GRSP strengthen aggregate stability [7], while aggregates, through encapsulation, serve as key sites for SOC immobilization, reducing its decomposition [66]. These findings are consistent with those reported by Li et al. [67]. In summary, carbon inputs increase microbial diversity and abundance, and microorganisms promote soil particle aggregation and maintain aggregate stability by entangling fine roots and microbial hyphae [68] and secreting adhesive substances, such as polysaccharides and GRSP [69]. These processes protect SOC from decomposition [34], promoting its accumulation and sequestration in the soil.
In summary, land use indirectly regulates SOC mainly by affecting soil physicochemical properties, soil microorganisms, GRSP, and aggregate stability. Among the five land uses, both natural restoration of vegetation and plantation are the most effective for enhancing carbon sequestration and reducing soil erosion, making them the preferred choices for sustainable soil management. We should enhance the protection of native vegetation in karst areas by limiting excessive logging and land reclamation. Additionally, it should promote initiatives such as the ‘Returning Farmland to Forests and Grasslands’ project to restore vegetation on degraded lands and enhance carbon sequestration potential. However, there was no significant difference (p > 0.05) in soil aggregate stability and SOC content between plots NRV and PL in this study, which may be attributed to the similar duration of restoration and afforestation in the two sample plots (7 and 8 years, respectively). While natural restoration of vegetation is slower since there are no anthropogenic management practices, it may be more sustainable in terms of long-term ecological benefits. In contrast, plantation can quickly increase soil aggregate stability and SOC accumulation in the near term (7–8 years). Because of monoculture and human disturbance, the long-term benefits of plantation (for example, over 18 years) might not be as great as those of natural restoration of vegetation [62]. Therefore, further research is necessary to investigate the long-term effects (e.g., 30 years or more) of various land use practices on soil aggregate stability and soil organic carbon (SOC) sequestration in different karst regions. This research is essential to assess how the impacts of these measures evolve over time.

5. Conclusions

Different land uses in subtropical karst regions influence soil physicochemical properties, microbial α-diversity and community composition, GRSP accumulation, and soil aggregate stability, further affecting SOC accumulation and stability. Land use significantly altered microbial α-diversity and community composition, although the effect on microbial α-diversity was comparatively smaller. Among the five land uses studied, NRV and PL were more effective in promoting GRSP accumulation and enhancing soil aggregate formation and stability than CF, CICF, and OR. Soil SMC, SOC, TN, TP, T-GRSP, and EE-GRSP contents consistently declined with increasing soil depth. Notably, land use, soil physicochemical properties, fungal diversity, bacterial communities, GRSP, and aggregate stability all had positive total effects on SOC, with land use identified as the most critical driver. Natural restoration of vegetation and plantation were particularly effective in enhancing SOC accumulation and sequestration by improving soil properties, increasing microbial diversity and abundance, promoting GRSP secretion, and stabilizing soil aggregates. These findings suggest that natural restoration of vegetation and plantation represent optimal strategies for enhancing soil aggregate stability and carbon sequestration capacity in the karst regions of southwest China.

Supplementary Materials

The following supporting information can be downloaded at https://www.mdpi.com/article/10.3390/agriculture15111220/s1. Table S1: Basic information on sample sites; Table S2: Amount of fertilizer applied to the sample plots; Figure S1: Distribution of sampling sites in the southwestern karst region; Figure S2: Differences in the physical properties of soils under different land uses. CF (corn field), CICF (corn intercropped with cabbage field), OR (orchard), PL (plantation), and NRV (natural restoration of vegetation). Box plots show the median (black line), 25% and 75% (box edges), and 10% and 90% of the data set (error bars). L, land use effect; S, soil depth effect; L × S, interaction effect of land use and soil depth. * indicates significant difference at the p < 0.05 level, ** indicates significant difference at the p < 0.01 level, and *** indicates significant difference at the p < 0.001 level. n.s., not significant (p > 0.05). Different lowercase letters indicate significant differences between different land uses (n = 9). BD: bulk density.

Author Contributions

Conceptualization, H.S. and Y.S.; data curation, H.S. and M.L.; formal analysis, H.S. and X.L.; funding acquisition, Y.S.; Investigation, M.L.; methodology, H.S.; project administration, Y.S.; resources, H.S., X.L., L.Z. and W.Z.; software, H.S.; Supervision, Y.S.; validation, H.S.; visualization, H.S.; writing—original draft, H.S.; writing—review and editing, H.S., L.H. and Y.S. All authors have read and agreed to the published version of the manuscript.

Funding

This research was supported by the Science and Technology Project of Yunnan Province (202203AC100001-03), the National Natural Science Foundation of China (42067005), the First-Class Discipline Construction Project of Yunnan Province ([2022] No. 73), the First-Class Discipline in Soil and Water Conservation and Desertification Prevention in Yunnan Province (SBK20240044), and the National Undergraduate Innovation and Entrepreneurship Training Program (202310677012).

Data Availability Statement

Data are contained within the article and Supplementary Materials.

Acknowledgments

The authors thank the following people for their help with this research, Hongyun Xu, Yunxian Mo, Xiangwei Bu and Yuxi Zhou, who provided field assistance.

Conflicts of Interest

The authors declare no competing interest.

References

  1. Luo, X.; Wang, Z.; Lu, C.; Huang, R.; Wang, F.; Gao, M. Effects of land use practices on soil aggregate stability and organic carbon content. Environ. Sci. 2019, 40, 3816–3824. [Google Scholar] [CrossRef]
  2. Morris, E.K.; Morris, D.J.P.; Voget, S.; Gleber, S.C.; Bigalke, M.; Wilcke, W.; Rillig, M.C. Visualizing the dynamics of soil aggregation as affected by arbuscular mycorrhizal fungi. ISME J. 2019, 13, 1639–1646. [Google Scholar] [CrossRef]
  3. Bhattacharyya, R.; Rabbi, S.M.F.; Zhang, Y.; Young, I.M.; Jones, A.R.; Dennis, P.G.; Menzies, N.W.; Kopittke, P.M.; Dalal, R.C. Soil organic carbon is significantly associated with the pore geometry, microbial diversity and enzyme activity of the macro-aggregates under different land uses. Sci. Total Environ. 2021, 778, 146286. [Google Scholar] [CrossRef] [PubMed]
  4. Liu, S.; Six, J.; Zhang, H.X.; Zhang, Z.B.; Peng, X.H. Integrated aggregate turnover and soil organic carbon sequestration using rare earth oxides and 13C isotope as dual tracers. Geoderma 2023, 430, 116313. [Google Scholar] [CrossRef]
  5. Zhao, Z.H.; Mao, Y.L.; Gao, S.F.; Lu, C.Y.; Pan, C.J.; Li, X.Y. Organic carbon accumulation and aggregate formation in soils under organic and inorganic fertilizer management practices in a rice-wheat cropping system. Sci. Rep. 2023, 13, 12. [Google Scholar] [CrossRef]
  6. Agnihotri, R.; Sharma, M.P.; Prakash, A.; Ramesh, A.; Bhattacharjya, S.; Patra, A.K.; Manna, M.C.; Kurganova, I.; Kuzyakov, Y. Glycoproteins of arbuscular mycorrhiza for soil carbon sequestration: Review of mechanisms and controls. Sci. Total Environ. 2022, 806, 150571. [Google Scholar] [CrossRef] [PubMed]
  7. Wright, S.F.; Upadhyaya, A. A survey of soils for aggregate stability and glomalin, a glycoprotein produced by hyphae of arbuscular mycorrhizal fungi. Plant Soil 1998, 198, 97–107. [Google Scholar] [CrossRef]
  8. An, W.; Li, Z.; Wang, S.; Wu, X.; Lu, Y.; Liu, G.; Fu, B. Exploring the effects of the “Grain for Green” program on the differences in soil water in the semi-arid Loess Plateau of China. Ecol. Eng. 2017, 107, 144–151. [Google Scholar] [CrossRef]
  9. Huang, L.; Bai, J.; Chen, B.; Zhang, K.; Huang, C.; Liu, P. Two-decade wetland cultivation and its effects on soil properties in salt marshes in the Yellow River Delta, China. Ecol. Inform. 2012, 10, 49–55. [Google Scholar] [CrossRef]
  10. Schneider, D.; Engelhaupt, M.; Allen, K.; Kurniawan, S.; Krashevska, V.; Heinemann, M.; Nacke, H.; Wijayanti, M.; Meryandini, A.; Corre, M.D.; et al. Impact of Lowland Rainforest Transformation on Diversity and Composition of Soil Prokaryotic Communities in Sumatra (Indonesia). Front. Microbiol. 2015, 6, 1339. [Google Scholar] [CrossRef]
  11. Bai, Z.; Zheng, L.; Bai, Z.; Jia, A.; Wang, M. Long-term cultivation alter soil bacterial community in a forest-grassland transition zone. Front. Microbiol. 2022, 13, 1001781. [Google Scholar] [CrossRef] [PubMed]
  12. Zhang, S.; Li, X.; Chen, K.; Shi, J.; Wang, Y.; Luo, P.; Yang, J.; Wang, Y.; Han, X. Long-term fertilization altered microbial community structure in an aeolian sandy soil in northeast China. Front. Microbiol. 2022, 13, 979759. [Google Scholar] [CrossRef] [PubMed]
  13. Liu, Y.; Ge, T.; van Groenigen, K.J.; Yang, Y.; Wang, P.; Cheng, K.; Zhu, Z.; Wang, J.; Li, Y.; Guggenberger, G.; et al. Rice paddy soils are a quantitatively important carbon store according to a global synthesis. Commun. Earth Environ. 2021, 2, 2662–4435. [Google Scholar] [CrossRef]
  14. Zhang, X.; Xu, M.; Shi, F. Impact of typical agricultural land use on the characteristics of soil microbial communities in the Nyingchi region of southeastern Tibet. J. Agro-Environ. Sci. 2020, 39, 331–342. [Google Scholar] [CrossRef]
  15. Gu, R.; Xiao, K.; Zhu, Z.; He, X.; Li, D. Afforestation enhances glomalin-related soil protein content but decreases its contribution to soil organic carbon in a subtropical karst area. J. Environ. Manag. 2024, 356, 120754. [Google Scholar] [CrossRef]
  16. Zhang, M.; Che, R.; Cheng, Z.; Zhao, H.; Wu, C.; Hu, J.; Zhang, S.; Liu, D.; Cui, X.; Wu, Y. Decades of reforestation significantly change microbial necromass, glomalin, and their contributions to soil organic carbon. Agric. Ecosyst. Environ. 2023, 346, 108362. [Google Scholar] [CrossRef]
  17. Wang, Q.; Wu, Y.; Wang, W.; Zhong, Z.; Pei, Z.; Ren, J.; Wang, H.; Zu, Y. Spatial Variations in Concentration, Compositions of Glomalin Related Soil Protein in Poplar Plantations in Northeastern China, and Possible Relations with Soil Physicochemical Properties. Sci. World J. 2014, 2014, 160403. [Google Scholar] [CrossRef]
  18. Li, Y.; Ma, Z.M.; Liu, Y.T.; Cui, Z.L.; Mo, Q.Y.; Zhang, C.; Sheng, H.Y.; Wang, W.; Zhang, Y.K. Variation in Soil Aggregate Stability Due to Land Use Changes from Alpine Grassland in a High-Altitude Watershed. Land 2023, 12, 393. [Google Scholar] [CrossRef]
  19. Yu, P.; Liu, J.; Tang, H.; Ci, E.; Tang, X.; Liu, S.; Ding, Z.; Ma, M. The increased soil aggregate stability and aggregate-associated carbon by farmland use change in a karst region of Southwest China. Catena 2023, 231, 107284. [Google Scholar] [CrossRef]
  20. Novara, A.; Gristina, L.; La Mantia, T.; Rühl, J. Carbon dynamics of soil organic matter in bulk soil and aggregate fraction during secondary succession in a Mediterranean environment. Geoderma 2013, 193, 213–221. [Google Scholar] [CrossRef]
  21. Zolfaghari, A.A.; Taghizadeh-Mehrjardi, R.; Asadzadeh, F.; Hajabbasi, M.-A. Soil structure changes due to different land-use practices in the central Zagruos region, Iran. Arch. Agron. Soil Sci. 2015, 62, 163–175. [Google Scholar] [CrossRef]
  22. Shepherd, T.; Saggar, S.; Newman, R.; Ross, C.; Dando, J. Tillage included changes in soil structure and soil organic matter fractions. Aust. J. Soil Res. 2001, 39, 465–489. [Google Scholar] [CrossRef]
  23. Dong, S.K.; Zhang, J.; Li, Y.Y.; Liu, S.L.; Dong, Q.N.M.; Zhou, H.K.; Yeomans, J.; Li, Y.; Li, S.; Gao, X.X. Effect of grassland degradation on aggregate-associated soil organic carbon of alpine grassland ecosystems in the Qinghai-Tibetan Plateau. Eur. J. Soil Sci. 2020, 71, 69–79. [Google Scholar] [CrossRef]
  24. Garland, G.; Bünemann, E.K.; Oberson, A.; Frossard, E.; Snapp, S.; Chikowo, R.; Six, J. Phosphorus cycling within soil aggregate fractions of a highly weathered tropical soil: A conceptual model. Soil Biol. Biochem. 2018, 116, 91–98. [Google Scholar] [CrossRef]
  25. Gunina, A.; Kuzyakov, Y. Pathways of litter C by formation of aggregates and SOM density fractions: Implications from 13C natural abundance. Soil Biol. Biochem. 2014, 71, 95–104. [Google Scholar] [CrossRef]
  26. Wen, L.; Li, D.; Xiao, K.; Tang, H.; Li, C.; Xiao, X. Dynamics of aggregate-associated organic carbon after long-term cropland conversion in a karst region, southwest China. Sci. Rep. 2023, 13, 50759–50771. [Google Scholar] [CrossRef]
  27. Xiao, L.; Zhang, W.; Hu, P.; Xiao, D.; Yang, R.; Ye, Y.; Wang, K. The formation of large macroaggregates induces soil organic carbon sequestration in short-term cropland restoration in a typical karst area. Sci. Total Environ. 2021, 801, 149588. [Google Scholar] [CrossRef]
  28. Lan, J.; Long, Q.; Huang, M.; Jiang, Y.; Hu, N. Afforestation-induced large macroaggregate formation promotes soil organic carbon accumulation in degraded karst area. For. Ecol. Manag. 2022, 505, 119884. [Google Scholar] [CrossRef]
  29. Rillig, M.C.; Mummey, D.L. Mycorrhizas and soil structure. New Phytol. 2006, 171, 41–53. [Google Scholar] [CrossRef]
  30. Li, Z.W.; Xu, X.L.; Wang, K.L. Effects of distribution patterns of karst landscapes on runoff and sediment yield in karst watersheds. Catena 2023, 223, 11. [Google Scholar] [CrossRef]
  31. Jianhua, C.; Daoxian, Y.; Liqiang, T.; Mallik, A.; Hui, Y.; Fen, H. An overview of karst ecosystem in Southwest China: Current state and future management. J. Resour. Ecol. 2015, 6, 247–256. [Google Scholar] [CrossRef]
  32. Yang, L.Y.; Li, Y.B.; Yu, L.M.; Chen, M.; Yu, M.; Zhang, Y.Y. Theory and case of land use transition promoting ecological restoration in karst mountain areas of Southwest China. Ecol. Indic. 2024, 158, 13. [Google Scholar] [CrossRef]
  33. Stefan, L.; Hartmann, M.; Engbersen, N.; Six, J.; Schöb, C. Positive Effects of Crop Diversity on Productivity Driven by Changes in Soil Microbial Composition. Front. Microbiol. 2021, 12, 16. [Google Scholar] [CrossRef] [PubMed]
  34. Mustafa, A.; Xu, M.G.; Shah, S.A.A.; Abrar, M.M.; Sun, N.; Wang, B.R.; Cai, Z.J.; Saeed, Q.; Naveed, M.; Mehmood, K.; et al. Soil aggregation and soil aggregate stability regulate organic carbon and nitrogen storage in a red soil of southern China. J. Environ. Manag. 2020, 270, 11. [Google Scholar] [CrossRef]
  35. IUSS Working Group WRB. World Reference Base for Soil Resources. International Soil Classification System for Naming Soils and Creating Legends for Soil Maps, 4th ed.; International Union of Soil Sciences (IUSS): Vienna, Austria, 2022. [Google Scholar]
  36. Six, J.; Elliott, E.; Paustian, K.; Doran, J.W. Aggregation and Soil Organic Matter Accumulation in Cultivated and Native Grassland Soils. Soil Sci. Soc. Am. J. 1998, 62, 1367–1377. [Google Scholar] [CrossRef]
  37. Shi, K.; Liao, J.; Zou, X.; Chen, H.Y.H.; Delgado-Baquerizo, M.; Wanek, W.; Ni, J.; Ren, T.; Zhang, C.; Yan, Z.; et al. Forest development induces soil aggregate formation and stabilization: Implications for sequestration of soil carbon and nitrogen. Catena 2024, 246, 108363. [Google Scholar] [CrossRef]
  38. Tyler, S.W.; Wheatcraft, S.W. Fractal scaling of soil particle-size distributions: Analysis and Limitations. Soil Sci. Soc. Am. J. 1992, 56, 362–369. [Google Scholar] [CrossRef]
  39. Yu, P.J.; Liu, S.W.; Han, K.X.; Guan, S.C.; Zhou, D.W. Conversion of cropland to forage land and grassland increases soil labile carbon and enzyme activities in northeastern China. Agric. Ecosyst. Environ. 2017, 245, 83–91. [Google Scholar] [CrossRef]
  40. Briedis, C.; Baldock, J.; Sá, J.C.D.; dos Santos, J.B.; McGowan, J.; Milori, D. Organic carbon pools and organic matter chemical composition in response to different land uses in southern Brazil. Eur. J. Soil Sci. 2021, 72, 1083–1100. [Google Scholar] [CrossRef]
  41. Gans, J.; Wolinsky, M.; Dunbar, J. Computational improvements reveal great bacterial diversity and high metal toxicity in soil. Science 2005, 309, 1387–1390. [Google Scholar] [CrossRef]
  42. Treseder, K.K. Nitrogen additions and microbial biomass: A meta-analysis of ecosystem studies. Ecol. Lett. 2008, 11, 1111–1120. [Google Scholar] [CrossRef] [PubMed]
  43. Serna-Chavez, H.M.; Fierer, N.; van Bodegom, P.M. Global drivers and patterns of microbial abundance in soil. Glob. Ecol. Biogeogr. 2013, 22, 1162–1172. [Google Scholar] [CrossRef]
  44. Madigan, M.T.; Martinko, J.M.; Dunlap, P.V.; Clark, D.P. Brock Biology of Microorganisms, 12th ed.; Pearson Benjamin Cummings: Hoboken, NJ, USA, 2008. [Google Scholar]
  45. Liu, S.E.; Wang, H.; Tian, P.; Yao, X.; Sun, H.; Wang, Q.K.; Delgado-Baquerizo, M. Decoupled diversity patterns in bacteria and fungi across continental forest ecosystems. Soil Biol. Biochem. 2020, 144, 9. [Google Scholar] [CrossRef]
  46. Holden, S.R.; Treseder, K.K. A meta-analysis of soil microbial biomass responses to forest disturbances. Front. Microbiol. 2013, 4, 163. [Google Scholar] [CrossRef]
  47. Zhao, F.Z.; Ren, C.J.; Han, X.H.; Yang, G.H.; Wang, J.; Doughty, R.; Wang, Z.T. Trends in soil microbial communities in afforestation ecosystem modulated by aggradation phase. For. Ecol. Manag. 2019, 441, 167–175. [Google Scholar] [CrossRef]
  48. Wang, Y.; Chen, L.; Xiang, W.H.; Ouyang, S.; Zhang, T.D.; Zhang, X.L.; Zeng, Y.L.; Hu, Y.T.; Luo, G.W.; Kuzyakov, Y. Forest conversion to plantations: A meta-analysis of consequences for soil and microbial properties and functions. Glob. Change Biol. 2021, 27, 5643–5656. [Google Scholar] [CrossRef]
  49. Pei, G.; Li, X.; He, T.; Li, J.; Pang, Y.; Hu, B.; Zhang, W.; Sun, J. Characterization and driving factors of soil microbial diversity and community structure under different vegetation restoration modes in the karst desertification area of Guangxi. Geoscience 2024, 44, 1630–1642. [Google Scholar] [CrossRef]
  50. Zhou, J.; Guan, D.W.; Zhou, B.K.; Zhao, B.S.; Ma, M.C.; Qin, J.; Jiang, X.; Chen, S.F.; Cao, F.M.; Shen, D.L.; et al. Influence of 34-years of fertilization on bacterial communities in an intensively cultivated black soil in northeast China. Soil Biol. Biochem. 2015, 90, 42–51. [Google Scholar] [CrossRef]
  51. George, P.B.L.; Lallias, D.; Creer, S.; Seaton, F.M.; Kenny, J.G.; Eccles, R.M.; Griffiths, R.I.; Lebron, I.; Emmett, B.A.; Robinson, D.A.; et al. Divergent national-scale trends of microbial and animal biodiversity revealed across diverse temperate soil ecosystems. Nat. Commun. 2019, 10, 1107. [Google Scholar] [CrossRef]
  52. Luo, X.Z.; Wen, D.Z.; Hou, E.Q.; Zhang, L.L.; Li, Y.; He, X.J. Changes in the composition of soil microbial communities and their carbon-cycle genes following the conversion of primary broadleaf forests to plantations and secondary forests. Land Degrad. Dev. 2022, 33, 974–985. [Google Scholar] [CrossRef]
  53. Hartmann, M.; Widmer, F. Community structure analyses are more sensitive to differences in soil bacterial communities than anonymous diversity indices. Appl. Environ. Microbiol. 2006, 72, 7804–7812. [Google Scholar] [CrossRef] [PubMed]
  54. Soudzilovskaia, N.A.; van Bodegom, P.M.; Terrer, C.; van’t Zelfde, M.; McCallum, I.; McCormack, M.L.; Fisher, J.B.; Brundrett, M.C.; de Sá, N.C.; Tedersoo, L. Global mycorrhizal plant distribution linked to terrestrial carbon stocks. Nat. Commun. 2019, 10, 10. [Google Scholar] [CrossRef] [PubMed]
  55. Yang, M.; Yang, N.; Liu, H.; Huang, W. Effect of Different Land Use Type on Distribution of Glomalin-related Soil Protein on Hilly Slope with Purple Soils in Hengyang of Hunan Province, China. Acta Agrestia Sin. 2020, 28, 1260–1265. [Google Scholar]
  56. Tang, H.-L.; Liu, L.; Wang, L.; Ba, C.-J. Effect of land use type on profile distribution of glomalin. Chin. J. Eco-Agric. 2009, 17, 1137–1142. [Google Scholar] [CrossRef]
  57. Wang, Q.; Wang, W.; Zhong, Z.; Wang, H.; Fu, Y. Variation in glomalin in soil profiles and its association with climatic conditions, shelterbelt characteristics, and soil properties in poplar shelterbelts of Northeast China. J. For. Res. 2020, 31, 279–290. [Google Scholar] [CrossRef]
  58. Engelhardt, I.C.; Welty, A.; Blazewicz, S.J.; Bru, D.; Rouard, N.; Breuil, M.-C.; Gessler, A.; Galiano, L.; Miranda, J.C.; Spor, A.; et al. Depth matters: Effects of precipitation regime on soil microbial activity upon rewetting of a plant-soil system. ISME J. 2018, 12, 1061–1071. [Google Scholar] [CrossRef] [PubMed]
  59. Qiao, X.X.; Wang, C.; Feng, M.C.; Zhang, M.J.; Song, X.Y.; Xiao, L.J.; Li, G.X.; Jin, X.L.; Anwar, S.; Yang, W.D. Hyperspectral response and quantitative estimation on soil aggregate characters. Catena 2021, 202, 11. [Google Scholar] [CrossRef]
  60. Dou, Y.; Yang, Y.; An, S.; Zhu, Z. Effects of different vegetation restoration measures on soil aggregate stability and erodibility on the Loess Plateau, China. Catena 2020, 185, 104294. [Google Scholar] [CrossRef]
  61. An, J.; Wu, Y.; Wu, X.; Wang, L.; Xiao, P. Soil aggregate loss affected by raindrop impact and runoff under surface hydrologic conditions within contour ridge systems. Soil Tillage Res. 2021, 209, 104937. [Google Scholar] [CrossRef]
  62. Zhong, Z.K.; Wu, S.J.; Lu, X.Q.; Ren, Z.X.; Wu, Q.M.; Xu, M.P.; Ren, C.J.; Yang, G.H.; Han, X.H. Organic carbon, nitrogen accumulation, and soil aggregate dynamics as affected by vegetation restoration patterns in the Loess Plateau of China. Catena 2021, 196, 9. [Google Scholar] [CrossRef]
  63. Dorji, T.; Field, D.J.; Odeh, I.O.A. Soil aggregate stability and aggregate-associated organic carbon under different land use or land cover types. Soil Use Manag. 2020, 36, 308–319. [Google Scholar] [CrossRef]
  64. Gan, J.; Han, X.; Zou, W. Globularin and its role in soil ecosystems. Soil Crops 2022, 11, 41–53. [Google Scholar] [CrossRef]
  65. Mendez-Millan, M.; Tu, T.T.N.; Balesdent, J.; Derenne, S.; Derrien, D.; Egasse, C.; M’Bou, A.T.; Zeller, B.; Hatté, C. Compound-specific 13C and 14C measurements improve the understanding of soil organic matter dynamics. Biogeochemistry 2014, 118, 205–223. [Google Scholar] [CrossRef]
  66. Six, J.; Bossuyt, H.; Degryze, S.; Denef, K. A history of research on the link between (micro)aggregates, soil biota, and soil organic matter dynamics. Soil Tillage Res. 2004, 79, 7–31. [Google Scholar] [CrossRef]
  67. Li, T.; Yuan, Y.; Mou, Z.; Li, Y.; Kuang, L.; Zhang, J.; Wu, W.; Wang, F.; Wang, J.; Lambers, H.; et al. Faster accumulation and greater contribution of glomalin to the soil organic carbon pool than amino sugars do under tropical coastal forest restoration. Glob. Change Biol. 2022, 29, 533–546. [Google Scholar] [CrossRef] [PubMed]
  68. Rillig, M.C.; Muller, L.A.H.; Lehmann, A. Soil aggregates as massively concurrent evolutionary incubators. ISME J. 2017, 11, 1943–1948. [Google Scholar] [CrossRef]
  69. Nichols, K.A.; Halvorson, J.J. Roles of biology, chemistry, and physics in soil macroaggregate formation and stabilization. Open Agric. J. 2013, 7, 107. [Google Scholar] [CrossRef]
Figure 1. Distribution characteristics of soil physicochemical properties ((a) SWC; (b) pH; (c) Clay; (d) SOC; (e) TN; (f) C:N; (g) TP; (h) TK) under different land uses. CF (corn field), CICF (corn intercropped with cabbage field), OR (orchard), PL (plantation), NRV (natural restoration of vegetation). Box plots show the median (black line), 25% and 75% (box edges), and 10% and 90% of the data set (error bars). L, land use effect; S, soil depth effect; L × S, interaction effect of land use and soil depth. A significant difference is shown at the p < 0.05 level by the symbol *, at the p < 0.01 level by the symbol **, and at the p < 0.001 level by the symbol ***. Not significant, n.s. (p > 0.05). Significant variations between various land uses are indicated by different lowercase letters (n = 9). SMC: soil moisture content; SOC: soil organic carbon; TN: total nitrogen; TP: total phosphorus; TK: total potassium.
Agriculture 15 01220 g001
Figure 2. Effect of different land uses on bacterial (ac) and fungal (df) α-diversity. CF (corn field), CICF (corn intercropped with cabbage field), OR (orchard), PL (plantation), and NRV (natural restoration of vegetation). The horizontal line within the box denotes the median, while the whiskers extend to 1.5 times the interquartile range (IQR). Significant variations between various land uses are indicated by different lowercase letters (n = 3).
Agriculture 15 01220 g002
Figure 3. Relative abundance of dominant bacterial phyla (a), fungal phyla (b), bacterial genera, and (c) fungal genera (d) under different land uses. CF (corn field), CICF (corn intercropped with cabbage field), OR (orchard), PL (plantation), and NRV (natural restoration of vegetation).
Agriculture 15 01220 g003
Figure 4. Effects of different land uses on T-GRSP (a) and EE-GRSP (b) content. CF (corn field), CICF (corn intercropped with cabbage field), OR (orchard), PL (plantation), NRV (natural restoration of vegetation). Box plots show the median (black line), 25% and 75% (box edges), and 10% and 90% of the data set (error bars). L, land use effect; S, soil depth effect; L × S, interaction effect of land use and soil depth. A significant difference is shown at the p < 0.01 level by the symbol ** and at the p < 0.001 level by the symbol ***. Significant variations between various land uses are indicated by different lowercase letters (n = 9). T-GRSP: total GRSP; EE-GRSP: readily extractable GRSP.
Agriculture 15 01220 g004
Figure 5. Distribution characteristics (ac) and differences in the stability (df) of soil aggregate content under different land uses. CF (corn field), CICF (corn intercropped with cabbage field), OR (orchard), PL (plantation), NRV (natural restoration of vegetation). Box plots show the median (black line), 25% and 75% (box edges), and 10% and 90% of the data set (error bars). L, land use effect; S, soil depth effect; L × S, interaction effect of land use and soil depth. A significant difference is shown at the p < 0.05 level by the symbol *, at the p < 0.01 level by the symbol **, and at the p < 0.001 level by the symbol ***. Not significant, n.s. (p > 0.05). Significant variations between various land uses are indicated by different lowercase letters (n = 9). r> 0.25 mm: aggregate content of >0.25 mm; MWD: mean weight diameter; D: fractal dimension.
Agriculture 15 01220 g005
Figure 6. ((a), (left)) Spearman’s correlation analysis between environmental factors such as soil physicochemical properties, GRSP and ASI, and α-diversity of bacteria and fungi; ((a), (right)) Mantel’s test results exploring the relationship between bacterial and fungal communities (phylum level) and soil environmental factors, GRSP and ASI; (b) bilinear plot of RDA showing the relationship between the bacterial communities (phylum level) and soil environmental factors; (c) bilinear plot of RDA showing the relationship between fungal communities (phylum level) and soil environmental factors; Circles represent individual sampling sites. CF (corn field), CICF (corn intercropped with cabbage field), OR (orchard), PL (plantation), NRV (natural restoration of vegetation). SMC: soil moisture content; SOC: soil organic carbon; TN: total nitrogen; TP: total phosphorus; TK: total potassium. r>0.25mm: aggregate content of >0.25 mm; MWD: mean weight diameter; D: fractal dimension. T-GRSP: total GRSP; EE-GRSP: readily extractable GRSP.
Agriculture 15 01220 g006
Figure 7. Partial least-squares path modeling (PLS-PM) showing causal relationships (a) between land use, soil physicochemical properties, bacterial and fungal diversity and communities, GRSP, aggregate stability, and SOC (*, p < 0.05; ***, p < 0.001). The standardized total effects (direct + indirect effects) obtained from the soil organic carbon PM analysis are also shown in the bar chart (b). Red and blue arrows (direct effects) indicate positive and negative effects, respectively, and the standardized path coefficient measures the width of the path. The model was well-fitted (goodness of fit = 0.75, R2 = 0.98). Land: land use; Soil: soil physicochemical properties; Bac-div: bacterial diversity; Bac-com: bacterial community; Fun-div: fungal diversity; Fun-com: fungal community; GRSP: glomalin-related soil protein; Stability: soil aggregate stability; SOC: soil organic carbon.
Agriculture 15 01220 g007
Disclaimer/Publisher’s Note: The statements, opinions and data contained in all publications are solely those of the individual author(s) and contributor(s) and not of MDPI and/or the editor(s). MDPI and/or the editor(s) disclaim responsibility for any injury to people or property resulting from any ideas, methods, instructions or products referred to in the content.

