Article

Fusion of Acoustic and Vis-NIRS Information for High-Accuracy Online Detection of Moldy Core in Apples

1
School of Mechatronics and Vehicle Engineering, East China Jiaotong University, Nanchang 230062, China
2
National and Local Joint Engineering Research Center of Fruit Intelligent Photoelectric Detection Technology and Equipment, East China Jiaotong University, Nanchang 230062, China
3
Weisong Photoelectric Technology Co., Ltd., Hefei 230062, China
*
Authors to whom correspondence should be addressed.
Agriculture 2025, 15(11), 1202; https://doi.org/10.3390/agriculture15111202
Submission received: 25 April 2025 / Revised: 27 May 2025 / Accepted: 28 May 2025 / Published: 31 May 2025
(This article belongs to the Section Agricultural Product Quality and Safety)

Abstract

Moldy core is a common disease of apples, and non-destructive, rapid and accurate detection of moldy core apples is essential to ensure food safety and reduce post-harvest economic losses. In this study, the acoustic method was used for the first time for the online detection of moldy core apples, and we explore the feasibility of integrating acoustic and visible–near-infrared spectroscopy (Vis–NIRS) technologies for precise, real-time detection of moldy core in apples. The sound and Vis–NIRS signals of apples were collected using a novel acoustic online detection device and a traditional Vis–NIRS online sorter, respectively. Based on this, traditional machine learning and deep learning classification models were developed for the prediction of healthy, mild, moderate, and severe moldy apples. The results show that the acoustic detection method significantly outperforms the Vis–NIRS method in terms of moldy apple identification accuracy, and the fusion of acoustic and Vis–NIRS data can further improve the model prediction performance. The MLP-Transformer shows the best prediction performance, with the overall classification accuracies for the fusion of Vis–NIRS, acoustic, Vis–NIRS and acoustic reached 89.66%, 96.55%, and 98.62%, respectively. This study demonstrates the excellent performance of acoustic online detection for intra-fruit lesion identification and shows the potential of the fusion of acoustics and Vis–NIRS.

1. Introduction

Apple mold is an internal disease caused by fungi, which is highly contagious. The lesions usually occur inside the fruit and are not easily detected on the surface, making them easy to overlook and enter the processing process, becoming a food safety hazard. Additionally, an infected apple can synthesize a variety of mycotoxins; these toxins have a strong toxic effect—rod trichothecenes not only exhibit genotoxicity, mutagenicity and immunotoxicity [1], in animal experiments they showed neurotoxicity, and also lead to gastrointestinal discomfort, vomiting, gastrointestinal bleeding and other symptoms in human beings. These toxins can continue to accumulate during fruit storage, and even under low-temperature refrigeration certain fungi can still survive and produce toxins [2]; as a result, mycotoxin contamination has become a major challenge for the fruit industry. Therefore, the establishment of efficient, non-destructive, and accurate ‘mouldymoldy heart disease’ detection technology is not only the key to protecting public health and food safety, but also represents an urgent need to improve the quality of apple deep-processing products and promote the sustainable development of the industry. To this end, researchers have developed a variety of non-destructive detection techniques for the internal quality of fruits, including electronic nose [3], acoustic vibration [4,5,6], nuclear magnetic resonance [7], and Vis–NIRS [8,9,10]. Among these, acoustic vibration and Vis–NIRS stand out for their simplicity, rapid analysis, low cost, and suitability for online detection, making them the most widely used methods for assessing the internal quality of fruits.
Vis–NIRS is a technique that is highly sensitive to the presence of C–H, N–H, and O–H functional groups in various compounds such as soluble solids, water, and acids [11,12]. These functional groups undergo changes in their frequency components and absorption intensities in the Vis–NIRS when apples are affected by moldy core disease. By analyzing these spectral differences, researchers can identify physiological diseases within the fruit [13]. Consequently, Vis–NIRS has gained widespread application in detecting physiological and biochemical components, physiological disorders, and internal defects in fruits [14]. Zhang, Huang, Wang, Wu and Li [9] constructed a three-classification model (BOSS-SPA-PLS-DA) to extract information from Vis–NIRS to detect moldy core in pears, which ultimately achieved an overall accuracy of 94.71%. Tian, Wang, Huang, Fan and Li [8] used visible/near-infrared technology to detect moldy apple cores and constructed a linear discriminant analysis (LDA) model with an overall accuracy of 90.4%. Since moldy core occurs mainly in the fruit core region, Vis–NIRS light penetrates the fruit flesh with exponential attenuation with depth [15]. As a result, it can be challenging to obtain sufficient valid information for accurately identifying moldy core utilizing Vis–NIRS, particularly in cases of mild infection, where detection becomes even more difficult [16].
Tissue defects around the fruit core or in the pulp cavity can affect fruit firmness and elastic modulus, leading to changes in the vibration spectrum curve [17]. As a result, acoustic detection has been widely applied in fruit quality testing, including detecting browning in pears [18], moldy core in apples [4], and core cracking in peaches [19,20]. Existing reports classify excitation sources for fruit acoustic detection into shock vibration and forced vibration types. The shock vibration method applies an instantaneous force using tools such as a pressurized air valve [21] and a pulsed laser [22,23]. This method is considered well-suited for online detection; for instance, AWETA [24] was applied for the online detection of fruit firmness by means of an Acoustic Firmness Sensor (AFS) that taps the surface of the fruit and collects acoustic signals. However, the shock vibration method has some limitations in practical applications. The method usually relies on a transient mechanical shock to excite the signal, but due to the very short duration of the shock and the limited energy applied, the resulting vibration signal is often weak and has a low signal-to-noise ratio. This can lead to a decline in the quality of the acquired signal, especially under complex background or interference conditions, which can easily mask the characteristics of the target response, thus affecting the results of the subsequent data analysis and judgment, and reducing the accuracy and reliability of the detection system. In contrast, forced vibration methods enhance accuracy by inducing fruit vibration through frequency sweeps generated by an excitation source, such as a piezoelectric transducer [25], or a resonance speaker [5]. Zhao, Zha, Li, and Wu [4] used a piezoelectric transducer as an excitation source and employed an Extreme Learning Machine (ELM) model for the detection of apple moldy core disease with an overall classification accuracy of 93.9%. The forced vibration method can achieve better signal quality and hence higher recognition performance, but the long excitation time required by this method is usually considered unsuitable for online detection. Therefore, acoustic vibration detection methods for fruit quality that balance online detection and high detection accuracy need to be further explored. However, to the best of our knowledge, the use of acoustic techniques for on-lineonline detection of internal lesions in fruits has not been reported, regardless of the vibrational excitation method.
Although good results have been achieved with a single technique for fruit quality detection, the integration of acoustic vibration and optical information for the detection of internal fruit quality remains an area for development. The principles of acoustic vibration and spectroscopy are significantly different, and the combination of the two can provide richer information on different levels, both physically and biochemically, leading to more effective fruit quality detection. Recently, Liu et al. [26] demonstrated that combining data from a Laser Doppler Vibrometer (LDV) and a visible–near-infrared spectrometer can significantly improve the accuracy of moldy core detection in apples. However, despite its high sensitivity, the LDV is not suited for online detection, highlighting a valuable opportunity to explore the fusion of acoustic and Vis–NIRS information for real-time, online identification of moldy apple core.
This study is the first to report on the online detection of apple mold cores using acoustic methods. The aim of this study was to test a novel acoustic online detection device designed independently and to assess the feasibility of combining acoustic and Vis–NIRS techniques for the online and accurate detection of apple mold cores. Acoustic and Vis–NIRS data of apples were obtained using an acoustic device and a conventional Vis–NIRS online detection system, respectively. Based on this, several classification models, including traditional machine learning models (PLS-DA [27] and SVM [28]) and deep learning models (MLP-Transformer [29] and ResNet), were developed, which were analyzed by the t-distributed Stochastic Neighbor Embedding (t-SNE) [30]. This algorithm is used for in-depth analysis of the model’s hidden layer features to further validate the superior performance of the MLP-Transformer model in apple mold kernel disease identification, to evaluate the performance of the device, and the accuracy of the model. The objectives of the study were to (1) evaluate the feasibility of using a novel online acoustic detection device for moldy heart apple identification; (2) construct classification models based on deep learning and conventional methods for identifying healthy, mildly moldy-cored, moderately moldy-cored, and severely moldy-cored apples; (3) compare the performance of online detection of acoustic and Vis–NIRS moldy-cored apples and evaluate the feasibility of integrating acoustic and Vis–NIRS techniques.

2. Materials and Methods

2.1. Experimental Sample Preparation

2.1.1. Experimental Apple Samples

A batch of apples was purchased on 18 September 2024 in Nanchang, Jiangxi Province, China. After the apples were delivered to the laboratory, samples damaged in transit were first removed, and then the remaining 730 intact apples were systematically numbered and measured for physical parameters. Referring to the available reports [31,32], following these initial steps, the apples were stored in a cold room set to 0 °C with a relative humidity maintained between 80% and 90%, and the physical parameters are shown in Table 1. The apples were then randomly classified into normal and moldy core samples; the first group contained 180 apples, which is the normal sample. The second group contained 550 apples, and these were treated to induce aapple moldy core.

2.1.2. Sample Preparation of Moldy Core Apples

Referring to the existing literature, we used the pathogen Trichothecium roseum to artificially induce the moldy heart apple samples [33,34]. The pathogen Trichothecium roseum was purchased from the China General Microbiological Culture Collection Center for use in inducing apple moldy core. Lyophilized mycobacterial powder was rehydrated and inoculated onto PDA slants, which were incubated for 7 days in a constant-temperature and humidity chamber (ZP-8, CSZ, Ohio, OH, USA) set to 25 °C with 80–90% relative humidity (RH). After incubation, the mold spores were rinsed into sterile conical flasks using water containing 0.05% Tween 80 (Kermel, He Fei, Anhui, China), and 5 mm glass beads were added to facilitate spore dispersion through shaking. The spore suspension was then filtered using skimmed cotton wool and examined under a microscope (BH200, Sunnyinnova, ShenZhen, China) to assess spore concentration, which was adjusted to 2 × 10⁶ spores mL−1. A microinjector (CRY2110, Crysound, Jia Xing, ZheJiang, China) was used to deliver 50 μL of the spore suspension through the calyxes into the seed cavities of apples. The inoculated apples were then placed back into the controlled temperature and humidity chamber at 25 °C with 80–90% humidity to promote lesion development. Control apples were kept in a separate, identical chamber. Any samples that appeared visually identifiable as diseased were removed to ensure validity. Throughout the experimental period, samples were collected at 3-day intervals for a total of 15 days, resulting in 36 normal samples and 110 moldy core disease samples being collected in batches. After discarding any samples removed during the experiment, 180 normal samples and 545 disease samples were finalized.

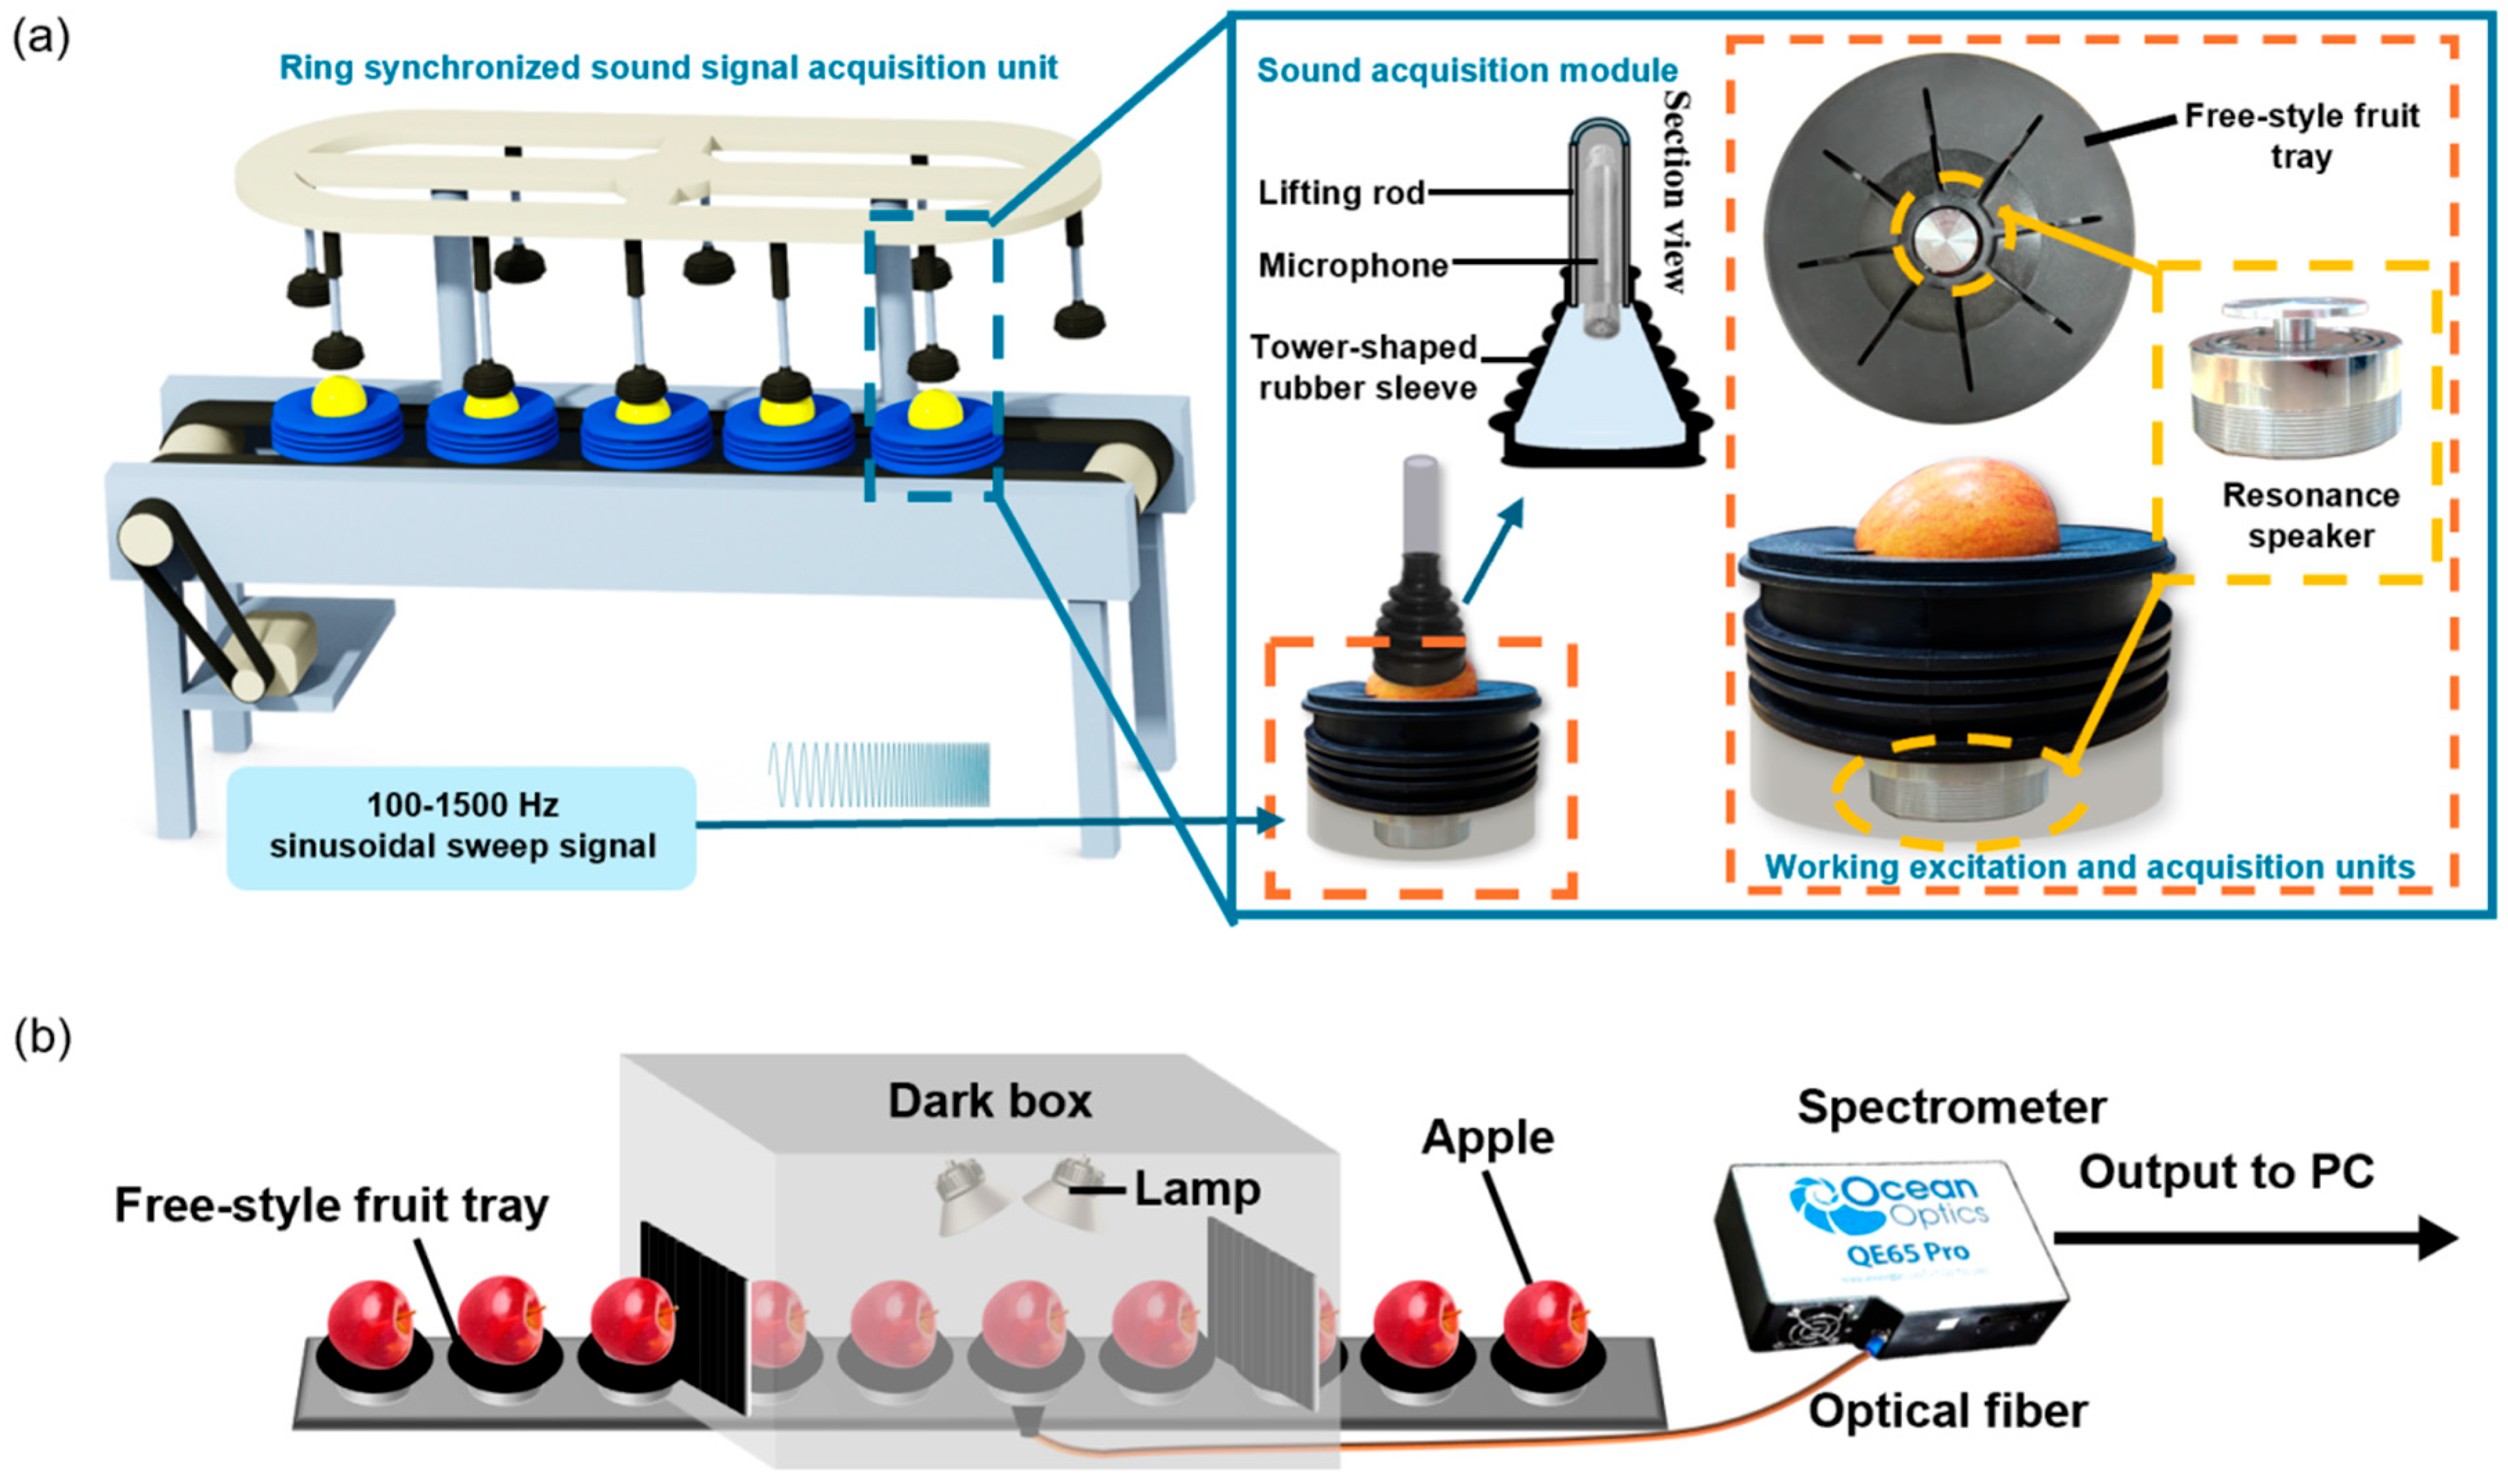
2.2. Collection of Acoustic and Vis–NIRS Signals of Apples

Figure 1a illustrates the compact structure of the acoustic online detection device. This device comprises a ring-synchronized sound capture assembly, a fruit conveyor belt, and an integrated free-style fruit tray vibration excitation module. The sound capture assembly features a ring conveyor, a sound collection sleeve, and a lifting bar, enabling efficient sound signal capture. Meanwhile, the integrated excitation module comprises a flexible fruit tray and a resonance loudspeaker to enhance functionality and efficiency. To gather the sound signals from each apple, an apple is placed gently into the flexible fruit tray on the conveyor belt. The vibration excitation module naturally enters the audio capture area as the conveyor belt automatically moves. Once directly under the capture sleeve, a lifting mechanism is activated, which rapidly lowers the sleeve to the top of the fruit. At this moment, the resonant speaker activated by the amplifier emits a sinusoidal scanning signal ranging from 100 to 1500 Hz over 1 s. This process excites the apple, generating sound signals through forced vibration, which carry valuable information regarding the fruit’s physical properties. To ensure a continuous and efficient acquisition process, while the first acquisition sleeve has not yet finished acquiring the signal from the current apple, the next two acquisition sleeves are ready to drop down to the top of the subsequent fruits within one second, realizing seamless and parallel signal acquisition. This design significantly improves the speed and continuity of the overall acquisition process.
The sound signals are precisely captured by a high-sensitivity sound pressure sensor (CRY2110, Crysound, China) housed within the sound collection sleeve and are transmitted in real-time to a computer. The acoustic pressure sensor has an acquisition sensitivity of −26 ± 1.5 dB (50 mV/Pa), a frequency response range of 20 Hz~20 KHz, and a background noise of less than 2.0 µV. Throughout the detection process, the system of the acoustic online detection device is set up with a 300–1500 Hz band-pass filter for the purpose of filtering the intrinsic frequency of the resonance loudspeaker and the high-frequency background noise. At the same time, the sound collection sleeve is precisely driven by a circular conveyor belt that ensures synchronized movement with the vibration excitation module. This coordination allows for efficient and rapid detection of the fruit. The lifting lever quickly resets the sound collection sleeve after each detection, ready for the next measurement. Once the sound signals from the apples are collected, they are processed into sound spectra using the Fast Fourier Transform (FFT), and then the sound spectrum is smoothed and denoised using Savitzky–Golay smoothing in order to be used for subsequent classification modeling.
The Vis–NIRS data of apples were obtained using an online Vis–NIRS detection device [5], as depicted in Figure 1b. The equipment operates based on the following principle: it utilizes halogen lamps arranged in two rows as the light source, with each containing five independent 12 V, 100 W bulbs of uniform specifications. These halogen lamps are powered by a DC supply with an operating current of 6 A. To collect the Vis–NIRS data from the apples, they are first placed on specialized cups, which then move along a conveyor belt at 0.5 m/s into a dark box. Inside the dark box, the halogen light illuminates the apple’s surface, and as the light penetrates the fruit, the transmitted light carrying internal information about the apple is captured by an optical fiber located at the base of the cup. The Vis–NIRS data were recorded by a spectrometer (QE65Pro, Ocean Optics, FL, USA). The spectrometer operates in transmission mode, with a wavelength range of 350–1150 nm and an integration time of 100 ms.

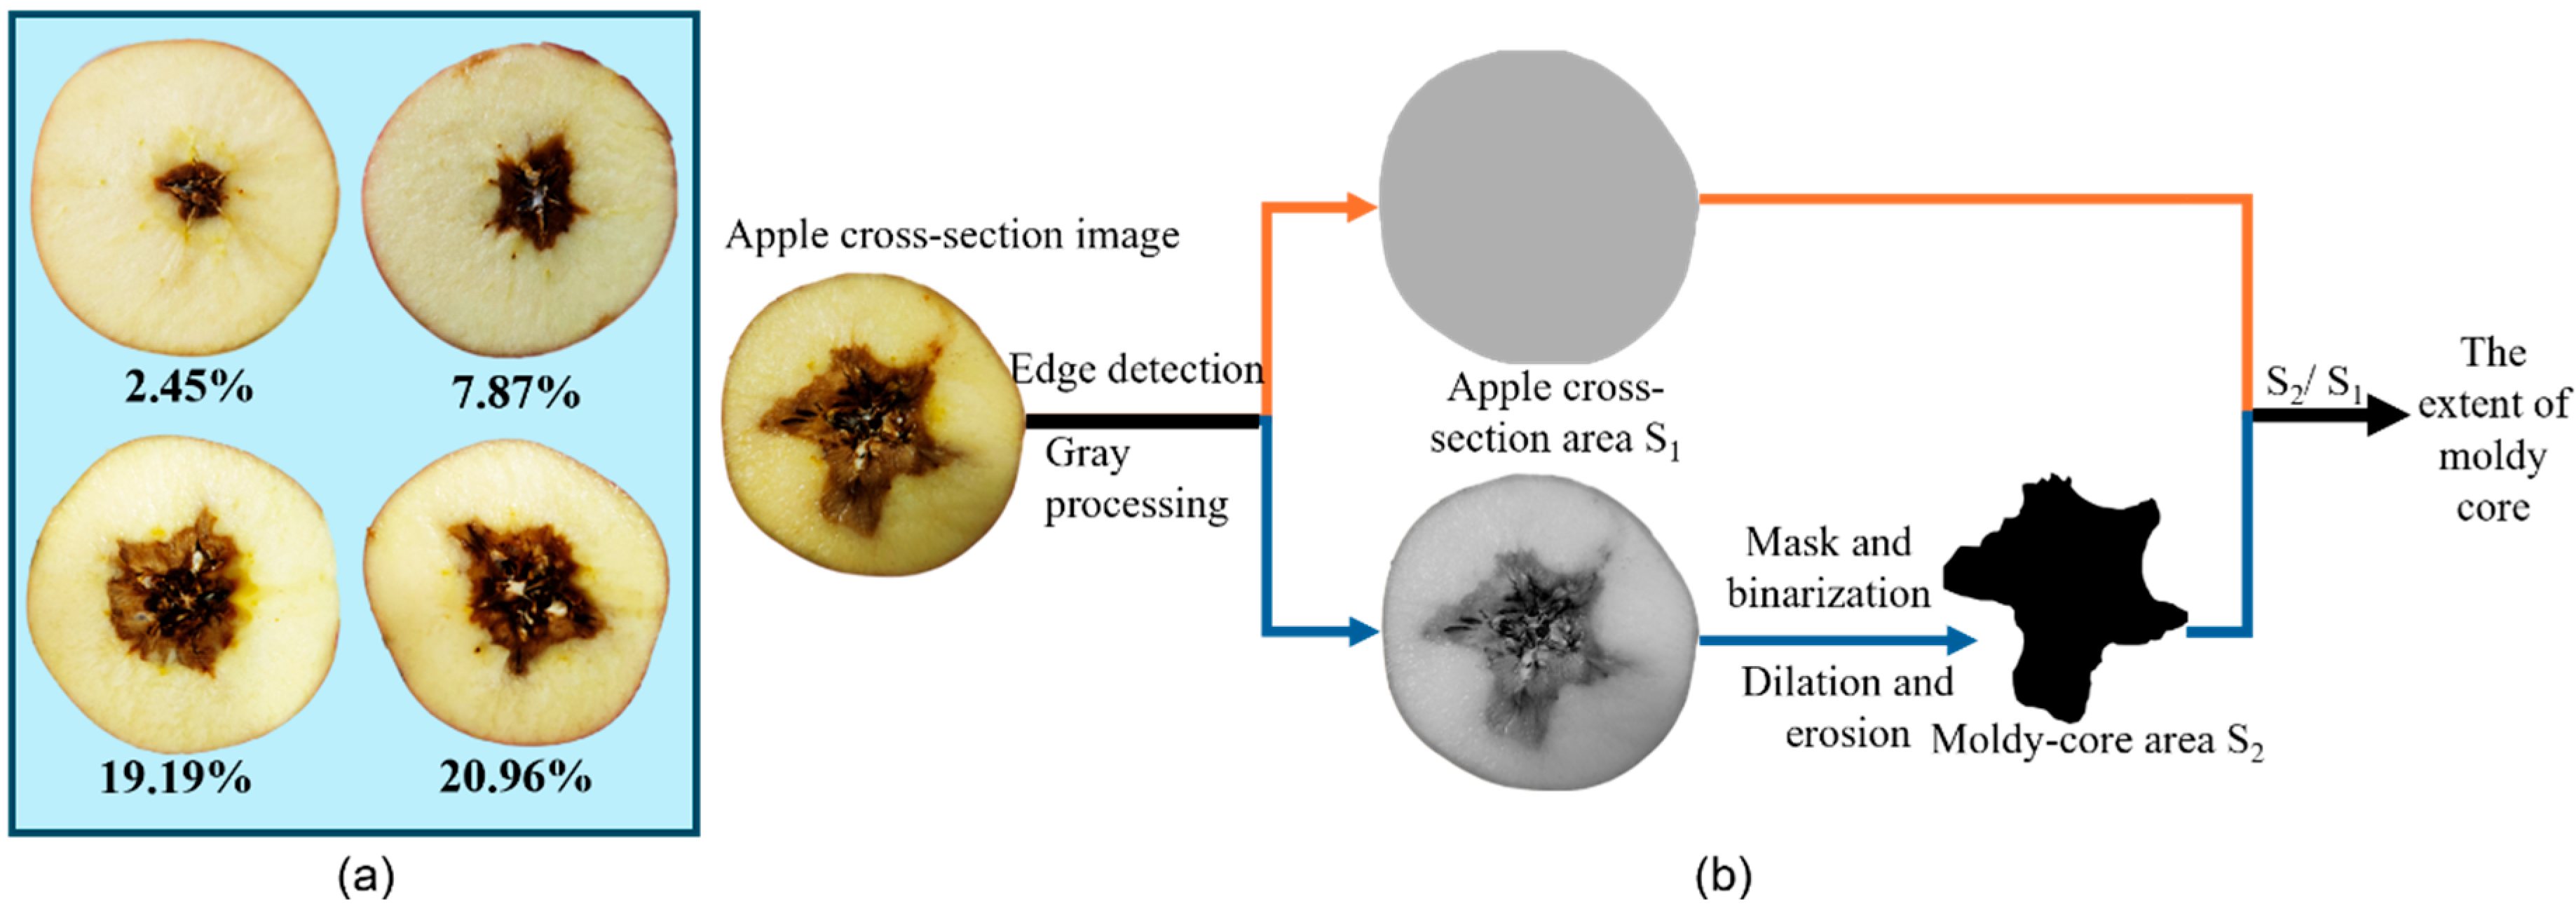
2.3. Classifying the Extent of Apple Moldy Core

Once the sound and Vis–NIRS signals were acquired, the apples were halved according to the equator, and their cross-sectional images were captured using a camera (Z50, Nikon, Japan). The full processing workflow is outlined in Figure 2b. Initially, edge detection was used to identify the contours of the apple cross-section, and the total number of pixel points was counted, denoted as S1 [5]. The cross-section image was then converted to greyscale, and the lesion area was identified through thresholding, dilation [35], and erosion processes, followed by counting the pixel points in the lesion area, labeled as S2 [4]. The ratio S2/S1 was used as a quantitative index to assess the severity of the moldy core in the apples. Figure 2a presents samples with varying levels of moldy core. In order to evaluate the recognition performance of apples with different degrees of mold core, according to prior research [5,35], and the results from this experiment, apples are classified into normal, mild disease, moderate disease, and severe disease. Specifically, mild disease refers to apples with more than 0% but not more than 7% of moldy core; moderate disease refers to apples with more than 7% of moldy core and not more than 15% of moldy core; and as for severe disease, it is defined as apples with more than 15% of moldy core. For each category, the number of samples was 180, 198, 186, and 161, respectively. The samples of each category were randomly divided into a training set, a testing set, and a prediction set in the ratio of 3:1:1.

2.4. Apple Moldy Core Detection Models

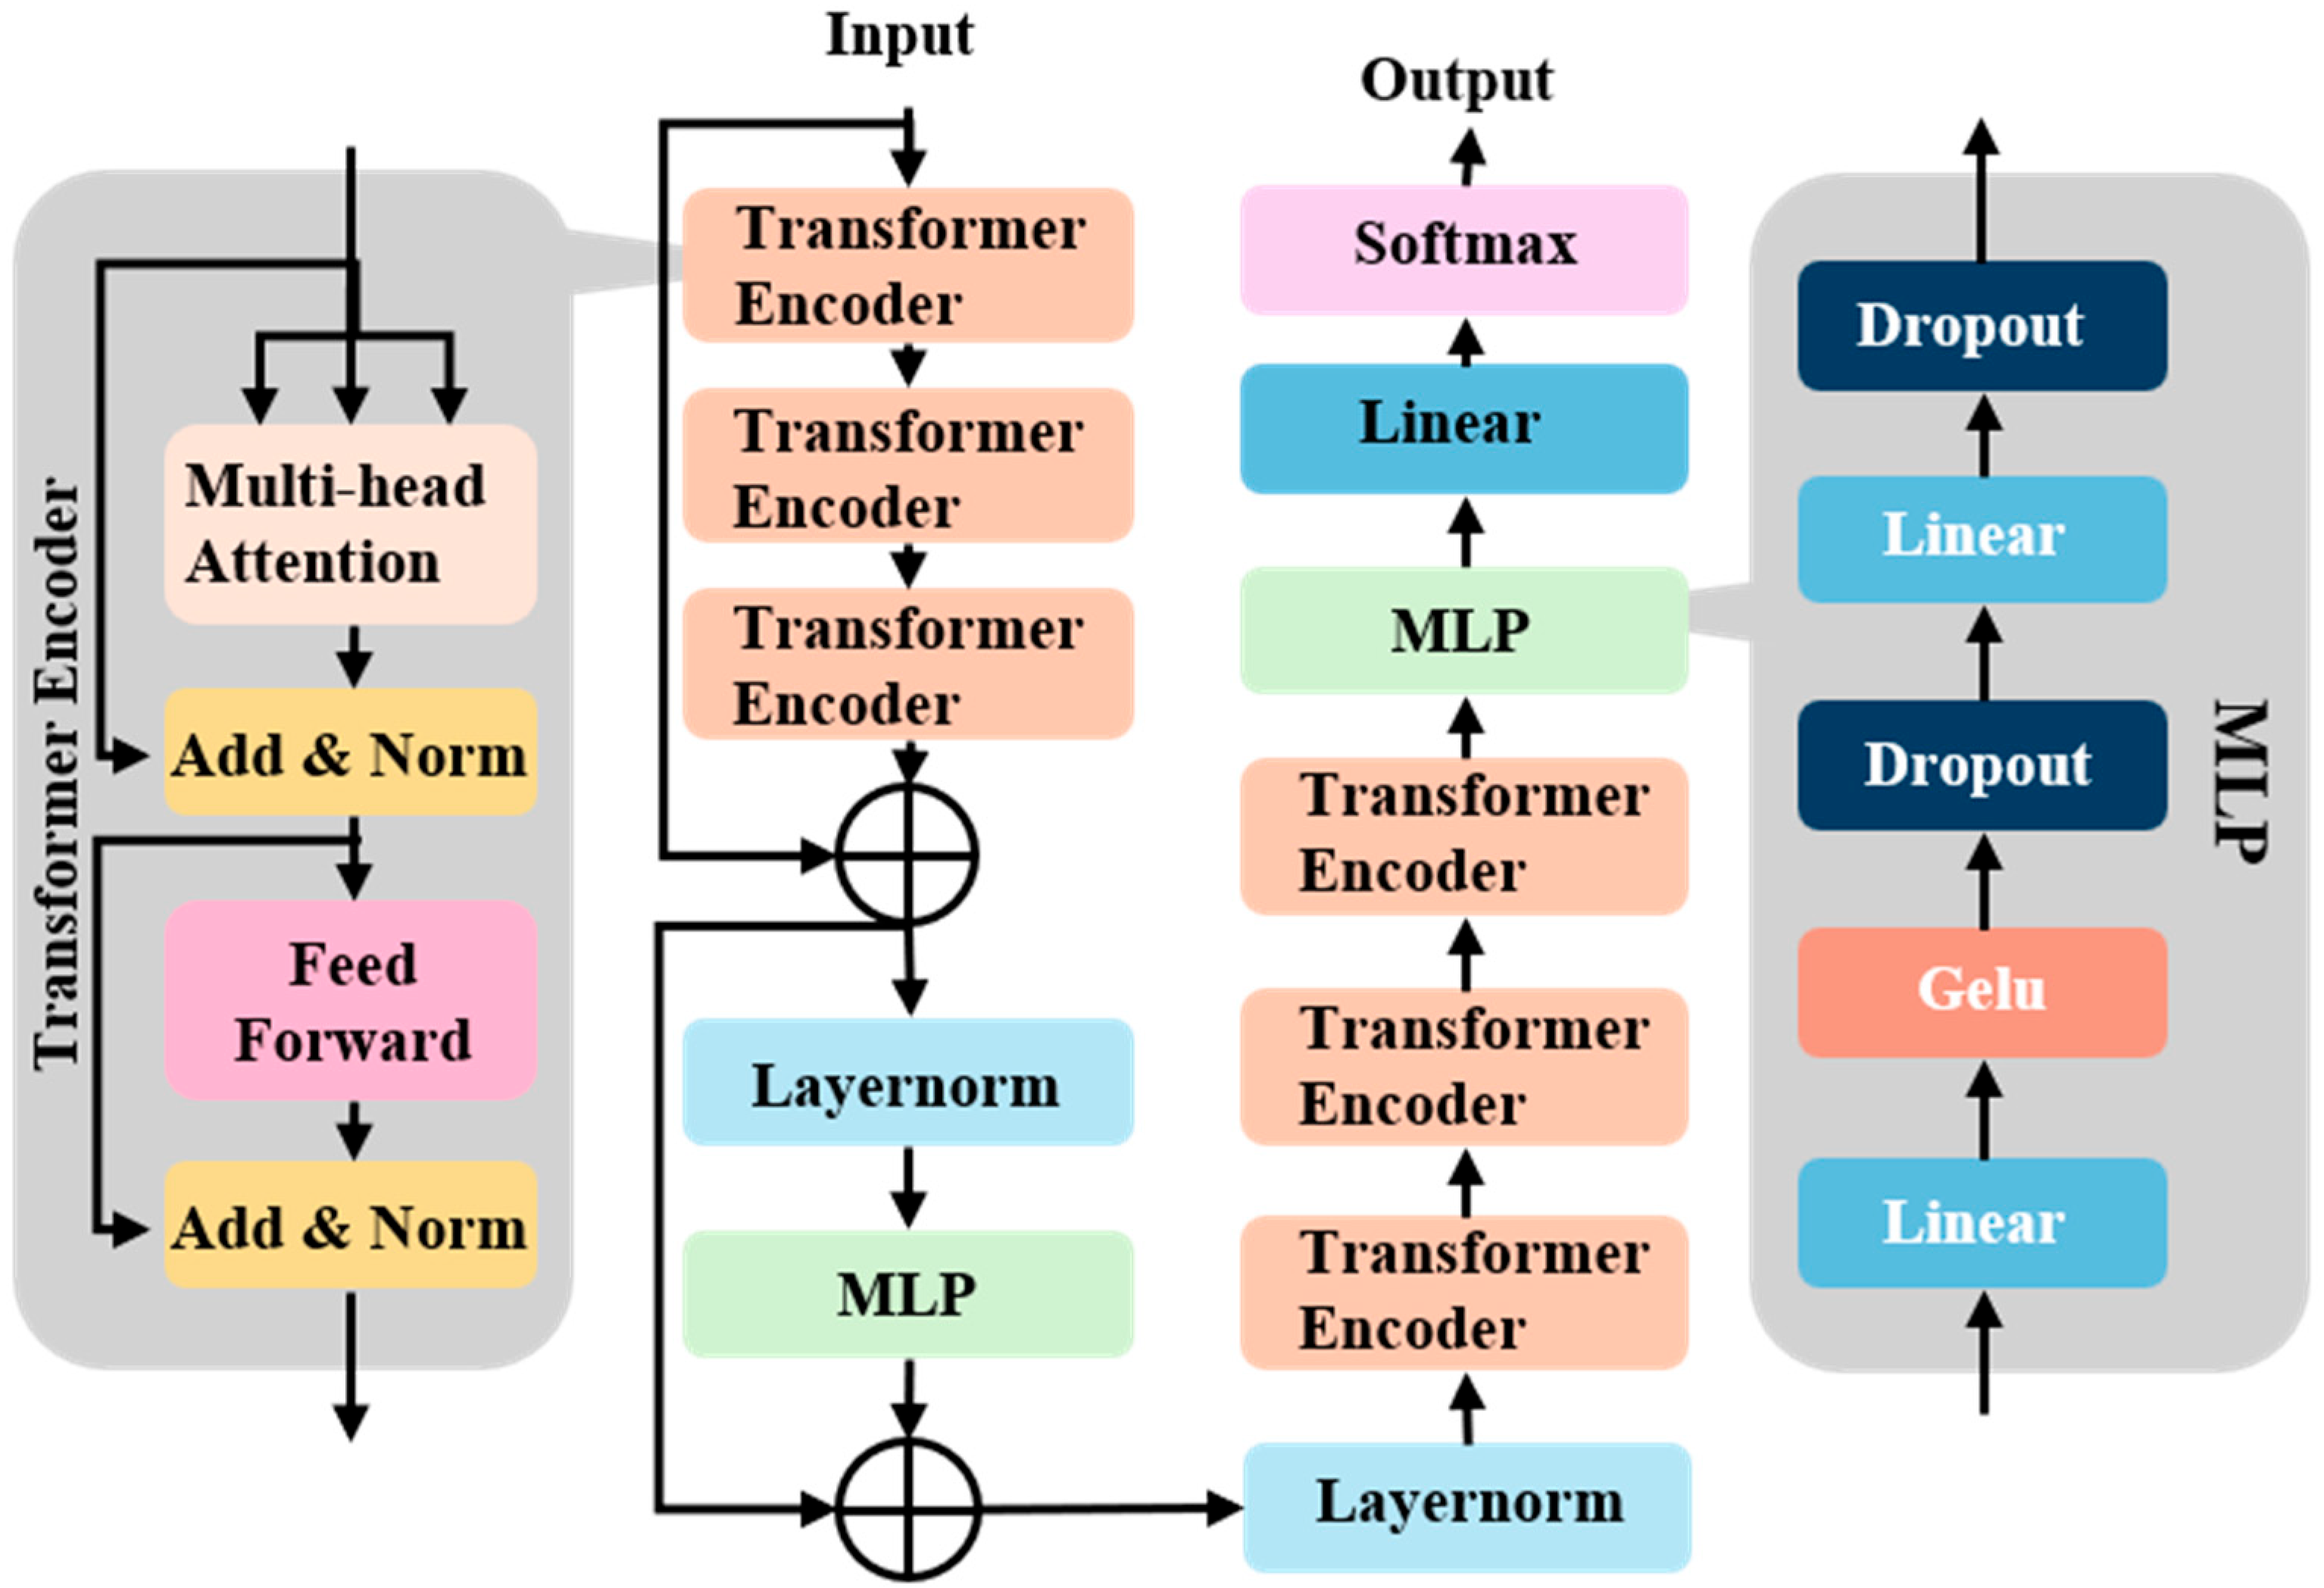
2.4.1. MLP-Transformer Model

The MLP-Transformer model was developed to detect moldy core, as illustrated in Figure 3. Multilayer Perceptron (MLP) is a neural network model capable of modeling complex mathematical functions. It has a powerful nonlinear modeling capability through the connection between multiple neuron layers (combined with activation functions) that can well capture nonlinear relationships in the data rather than just simple linear mapping. At the same time, MLP is able to automatically learn potentially useful features from raw data without explicit manual feature extraction, which makes it excellent in handling data with complex structures or unclear feature representations, and especially suitable for multimodal perception tasks. On the other hand, the Transformer structure is distinguished by its self-attention mechanism, which is able to model the dependencies between features on a global scale and effectively capture long-distance information interactions. Therefore, combining MLP with Transformer can not only fully explore local deep features, but also integrate global contextual information. When processing acoustic data or visible–near-infrared spectral data, the fusion architecture combining MLP and Transformer has significant advantages. Acoustic and spectral data are usually of high dimensionality and complex noise. By automatically extracting the local deep features through MLP, and with the global perception capability of Transformer, the model can understand the patterns and laws in the data in a more comprehensive way, which improves the model’s feature expression capability and classification recognition accuracy.
Initially, the sound spectrum and Vis–NIRS data serve as inputs to the MLP-Transformer. Following this, the data passes through a three-layer TransformerEncoder module, where the extracted semantic information is combined with the input data via residual concatenation before being fed into the MLP. The MLP is capable of capturing complex nonlinear relationships and learning more abstract feature representations. Next, the features generated by the MLP are sent to the TransformerEncoder for global feature extraction after the residual connection. The output features are then passed to the fully-connected layer, where the final predicted values are produced using a Softmax function. The attention mechanism [36,37] in the TransformerEncoder extracts different features from the data as follows:
  A t t e n t i o n i = s o f t m a x Q i K i T d k V i
Z = C o n c a t A t t e n t i o n 1 ,   A t t e n t i o n 2 , , A t t e n t i o n H W o
Here, i represents the index of the attention head, while Q i , K i , and V i are derived by applying transformations to the input X for each attention head. d k indicates the dimension of the key K i . W o denotes the output weight matrix, and the term “Concat” refers to the concatenation operation.
The MLP-Transformer is trained together with ResNet to compare the recognition performance of both to evaluate the classification performance of MLP-Transformer. Both models were trained using the Adam optimizer and a cross-entropy loss function, with a learning rate set to 0.0001 and a total of 200 training epochs.

2.4.2. PLS-DA and SVM Models

To comprehensively evaluate the recognition performance of the proposed MLP-Transformer model, this paper introduces Partial Least Squares Discriminant Analysis (PLS-DA) and a Support Vector Machine (SVM) as a comparison benchmark. For the PLS-DA model, the core idea is to reduce the data dimensionality while retaining the category discriminative information, so as to realize effective classification. To ensure that the model selects the optimal number of latent variables (i.e., the number of scores), we adopt a Monte Carlo cross-validation method for training. This method repeatedly evaluates the classification effect of each number of components by randomly dividing the training and validation sets several times, so as to find out the optimal number of components that corresponds to the highest recognition accuracy, and to improve the robustness and generalization ability of the model. In the process of SVM model construction, in order to optimize the model parameters, we adopt the GridSearch strategy. This method performs an exhaustive search in the set parameter space and systematically evaluates the classification performance of different parameter combinations by means of cross-validation. The optimization includes selecting appropriate kernel functions (e.g., linear, polynomial, or radial basis kernel, etc.), adjusting the penalty parameter C to balance the classification intervals with the error tolerance, setting the order of the polynomial kernel, and adjusting the gamma to control the influence range of the samples in the high-dimensional feature space.

2.5. Performance Parameters of the Models

The performance of each model in distinguishing between different types of apples was measured using accuracy, precision, recall, and F1 score evaluation metrics. These metrics are considered comprehensively by means of weighted average in order to objectively evaluate the overall performance of each model in the mold core detection task. The specific calculation process is as follows:
A c c u r a c y = T P + T N T P + F P + F N + T N
W e i g h t e d _ P = i = 0 m ( W i × P i )
W e i g h t e d _ R = i = 0 m ( W i × R i )
W e i g h t e d _ F 1 = i = 0 m ( W i × F 1 i )
In this context, the metrics W e i g h t e d _ P , W e i g h t e d _ R , and W e i g h t e d _ F 1 correspond to the weighted averages of precision, recall, and F1 score, respectively. W i indicates the weight of category iii samples relative to the total sample size, while P i , R i , and F 1 i represent the precision, recall, and F1 score for category i . All algorithms in this study were implemented in Python 3.8, with the computer featuring an Intel(R) Core(TM) i9-12900HX 2.30 GHz and an RTX 4060 (12 GB) GPU.

3. Results and Discussion

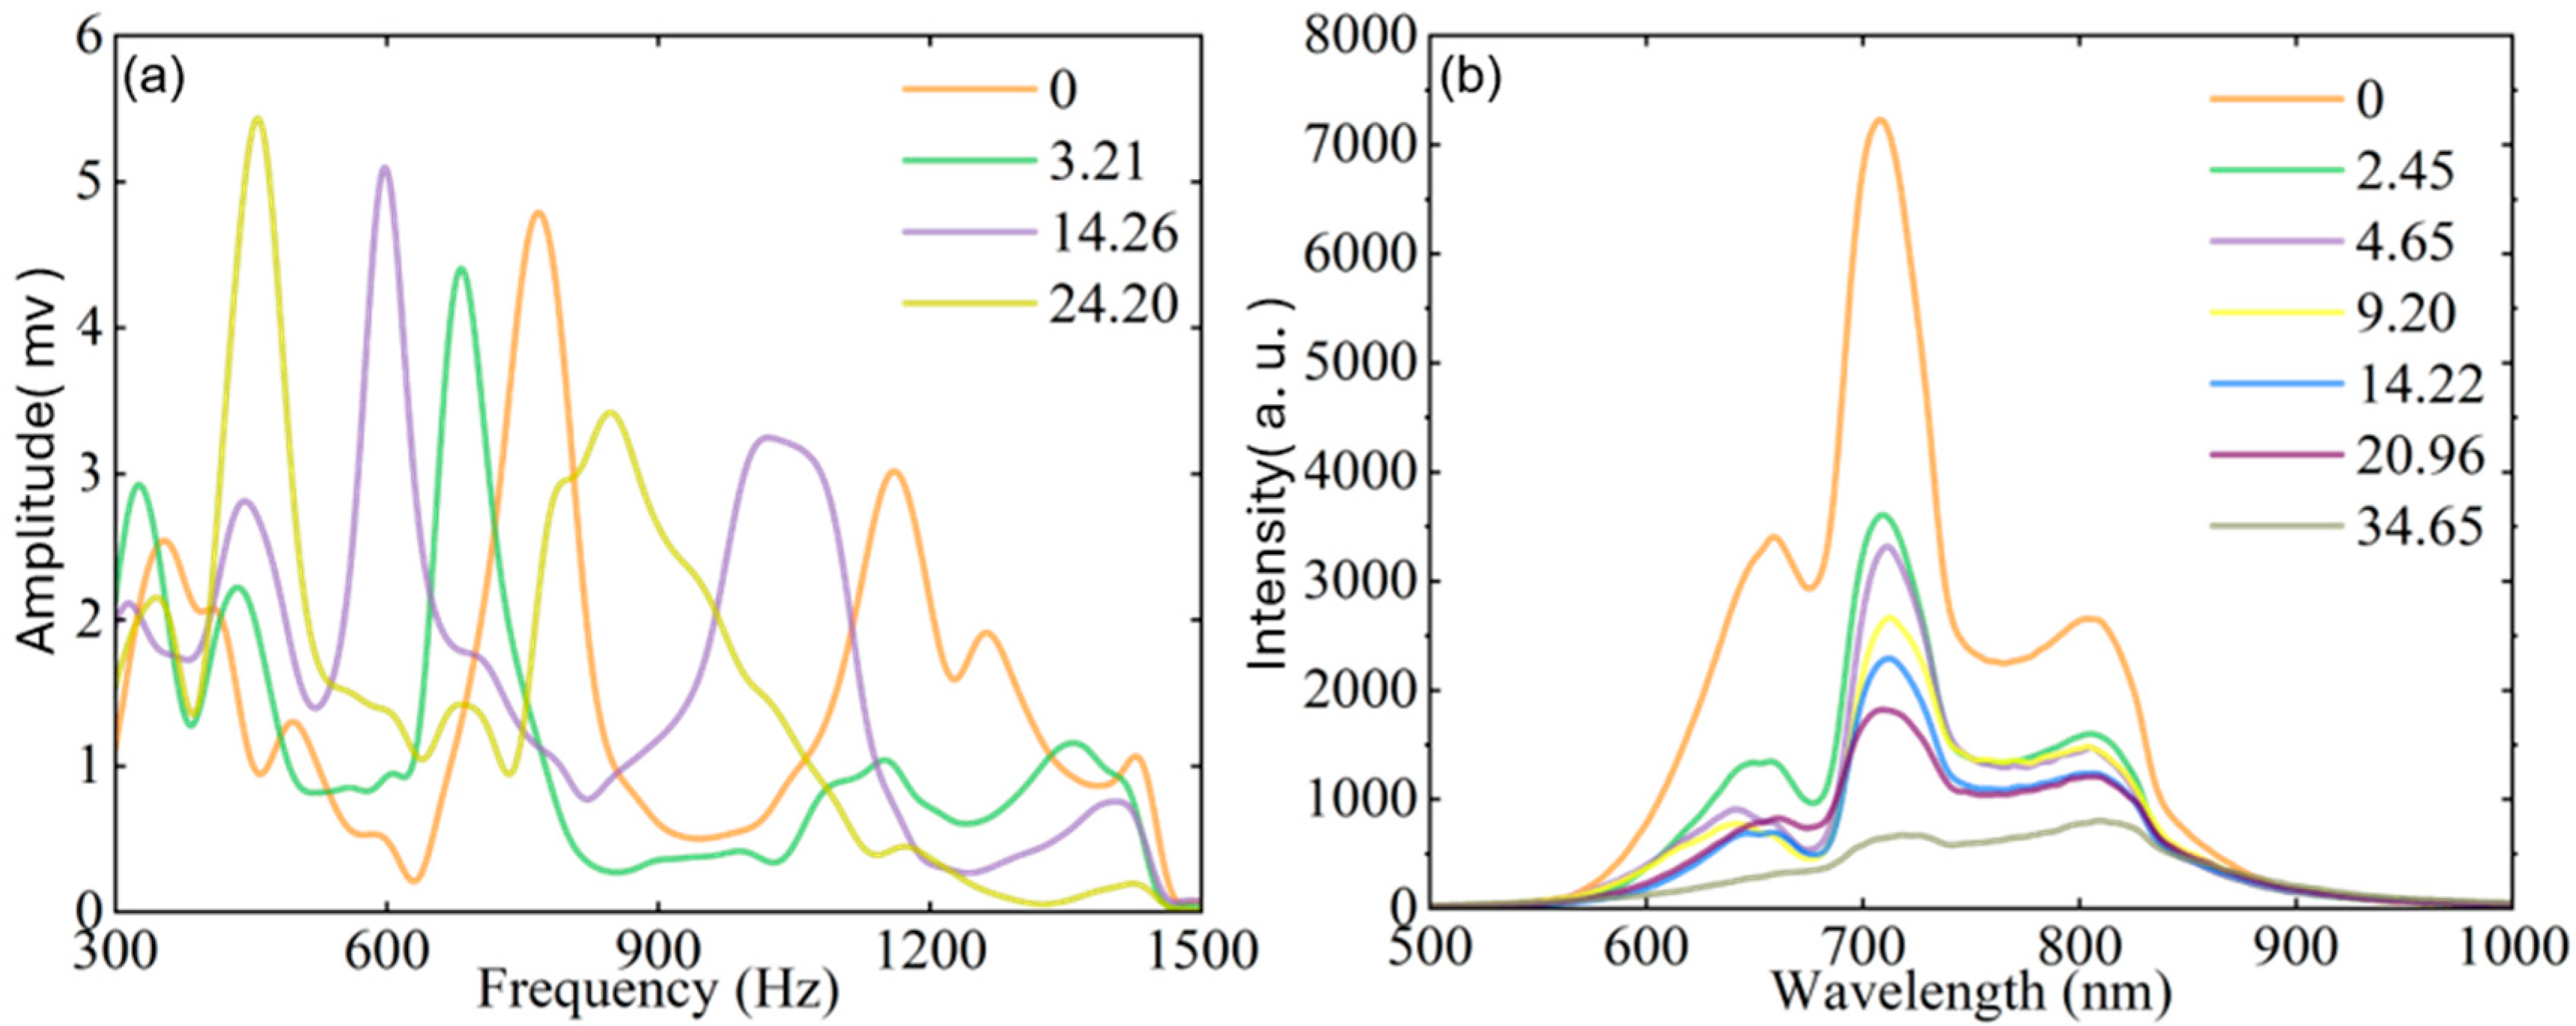
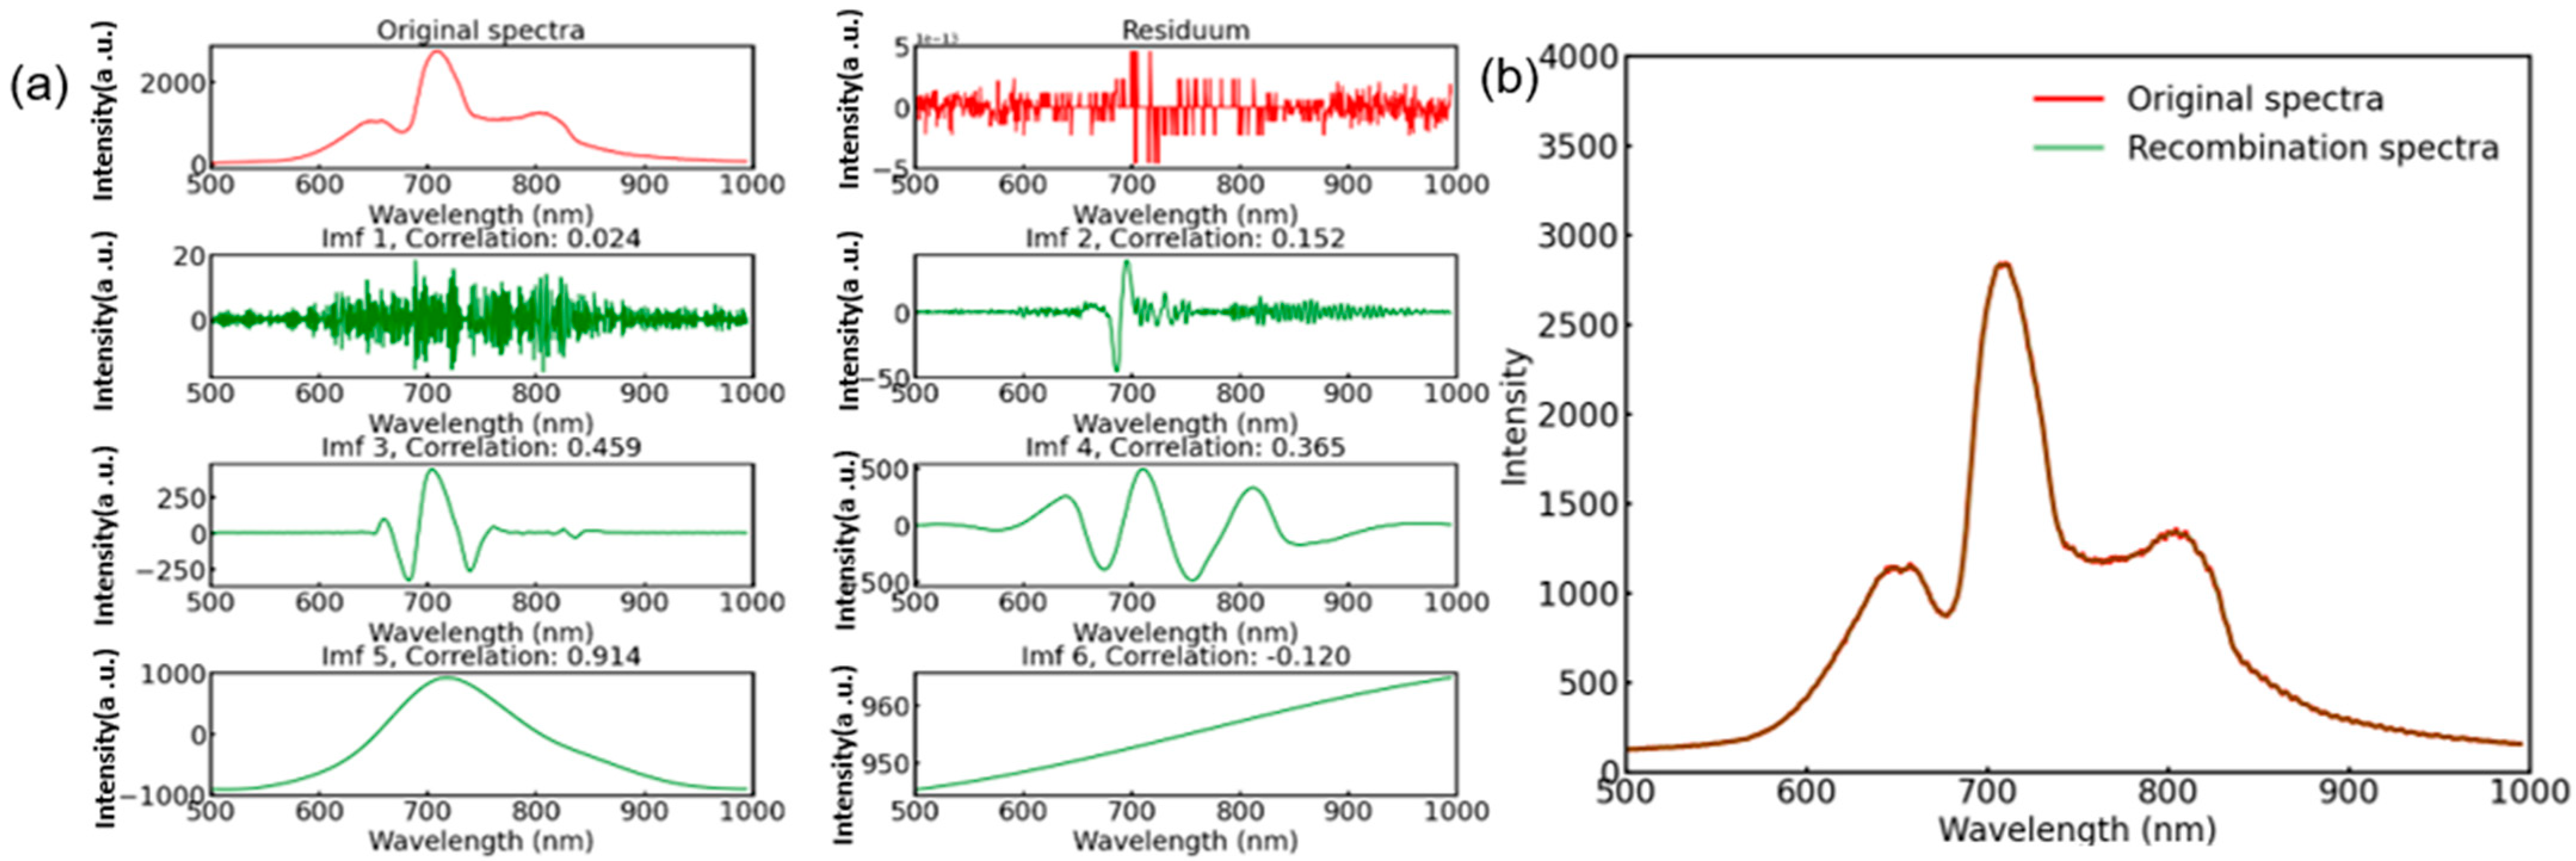
3.1. Sound and Vis–NIRS Data Analysis

Figure 4 displays the sound and Vis–NIRS data of apples at various lesion stages. In Figure 4a, distinct differences can be observed between the sound spectra for varying levels of moldy core. The second resonance frequencies for normal apples ranged from 750 to 850 Hz, while those with mild, moderate, and severe moldy cores had frequencies between 650 and 720 Hz, 550 and 650 Hz, and 400 and 500 Hz, respectively. The resonant frequency shifts towards lower frequencies as the disease grows. The difference between normal and mildly affected apples was minimal. Additionally, factors like size, weight, and shape influence resonance frequencies, making models based solely on these parameters ineffective. In Figure 4b, the Vis–NIRS also changed with lesion progression. Transmittance decreased with increasing severity, especially in the 650–850 nm range. At a moldy core level of 34.65%, the characteristic peaks became less distinct, probably caused by the internal lesion absorbing Vis–NIRS energy.
In order to improve the model performance, it is crucial to preprocess Vis–NIRS data that may contain redundant background noise. The complete ensemble empirical mode decomposition with adaptive noise (CEEMDAN) technique can effectively preprocess the Vis–NIRS to eliminate the background noise. The CEEMDAN method decomposes the Vis–NIRS into six intrinsic mode functions (IMF) components and one residual term, as shown in Figure 5. Pearson correlation is then used to identify and remove components with correlations below 0.1, and the remaining components are summed to reconstruct the spectrum. As seen in Figure 5b, compared with the original spectrum, the reconstructed Vis–NIRS exhibits smoother characteristics.

3.2. Classification Results from Traditional Machine Learning Algorithms

PLS-DA and SVM models were trained using sound data, Vis–NIRS and sound data combined with Vis–NIRS data (Sound–Vis–NIRS). The penalty coefficient ‘c’, gamma value ‘g’, and kernel function (including Linear, Poly, and RBF) of SVM were optimally selected during training using the grid search algorithm and the number of effective variables of PLS-DA was optimized using five-fold cross validation and the results are shown in Table 2. Table 3 shows the accuracy of PLS-DA and SVM models on the prediction set with different data. As can be seen from the table, both the PLS-DA and SVM models trained with Sound–Vis–NIRS exhibit a significant improvement in accuracy on the prediction set compared to the models trained with sound spectrum or Vis–NIRS alone. This suggests that combining sound spectrum data and Vis–NIRS data can improve the classification performance of the models. In addition, the classification performance of the SVM models with all three types of data is better than that of the PLS-DA model. The overall accuracy of the Sound–Vis–NIRS-based SVM model on the prediction set was 95.17%, in which the classification accuracy was better for normal and severe disease samples, but poorer for mild disease and moderate disease samples, which were 90.24% and 94.29%, respectively. This indicates that the conventional machine learning model based on Sound–Vis–NIRS is not effective in detecting mild disease and moderate disease. This may be due to the fact that PLS-DA and SVM cannot extract more effective information from sound and Vis–NIRS data.

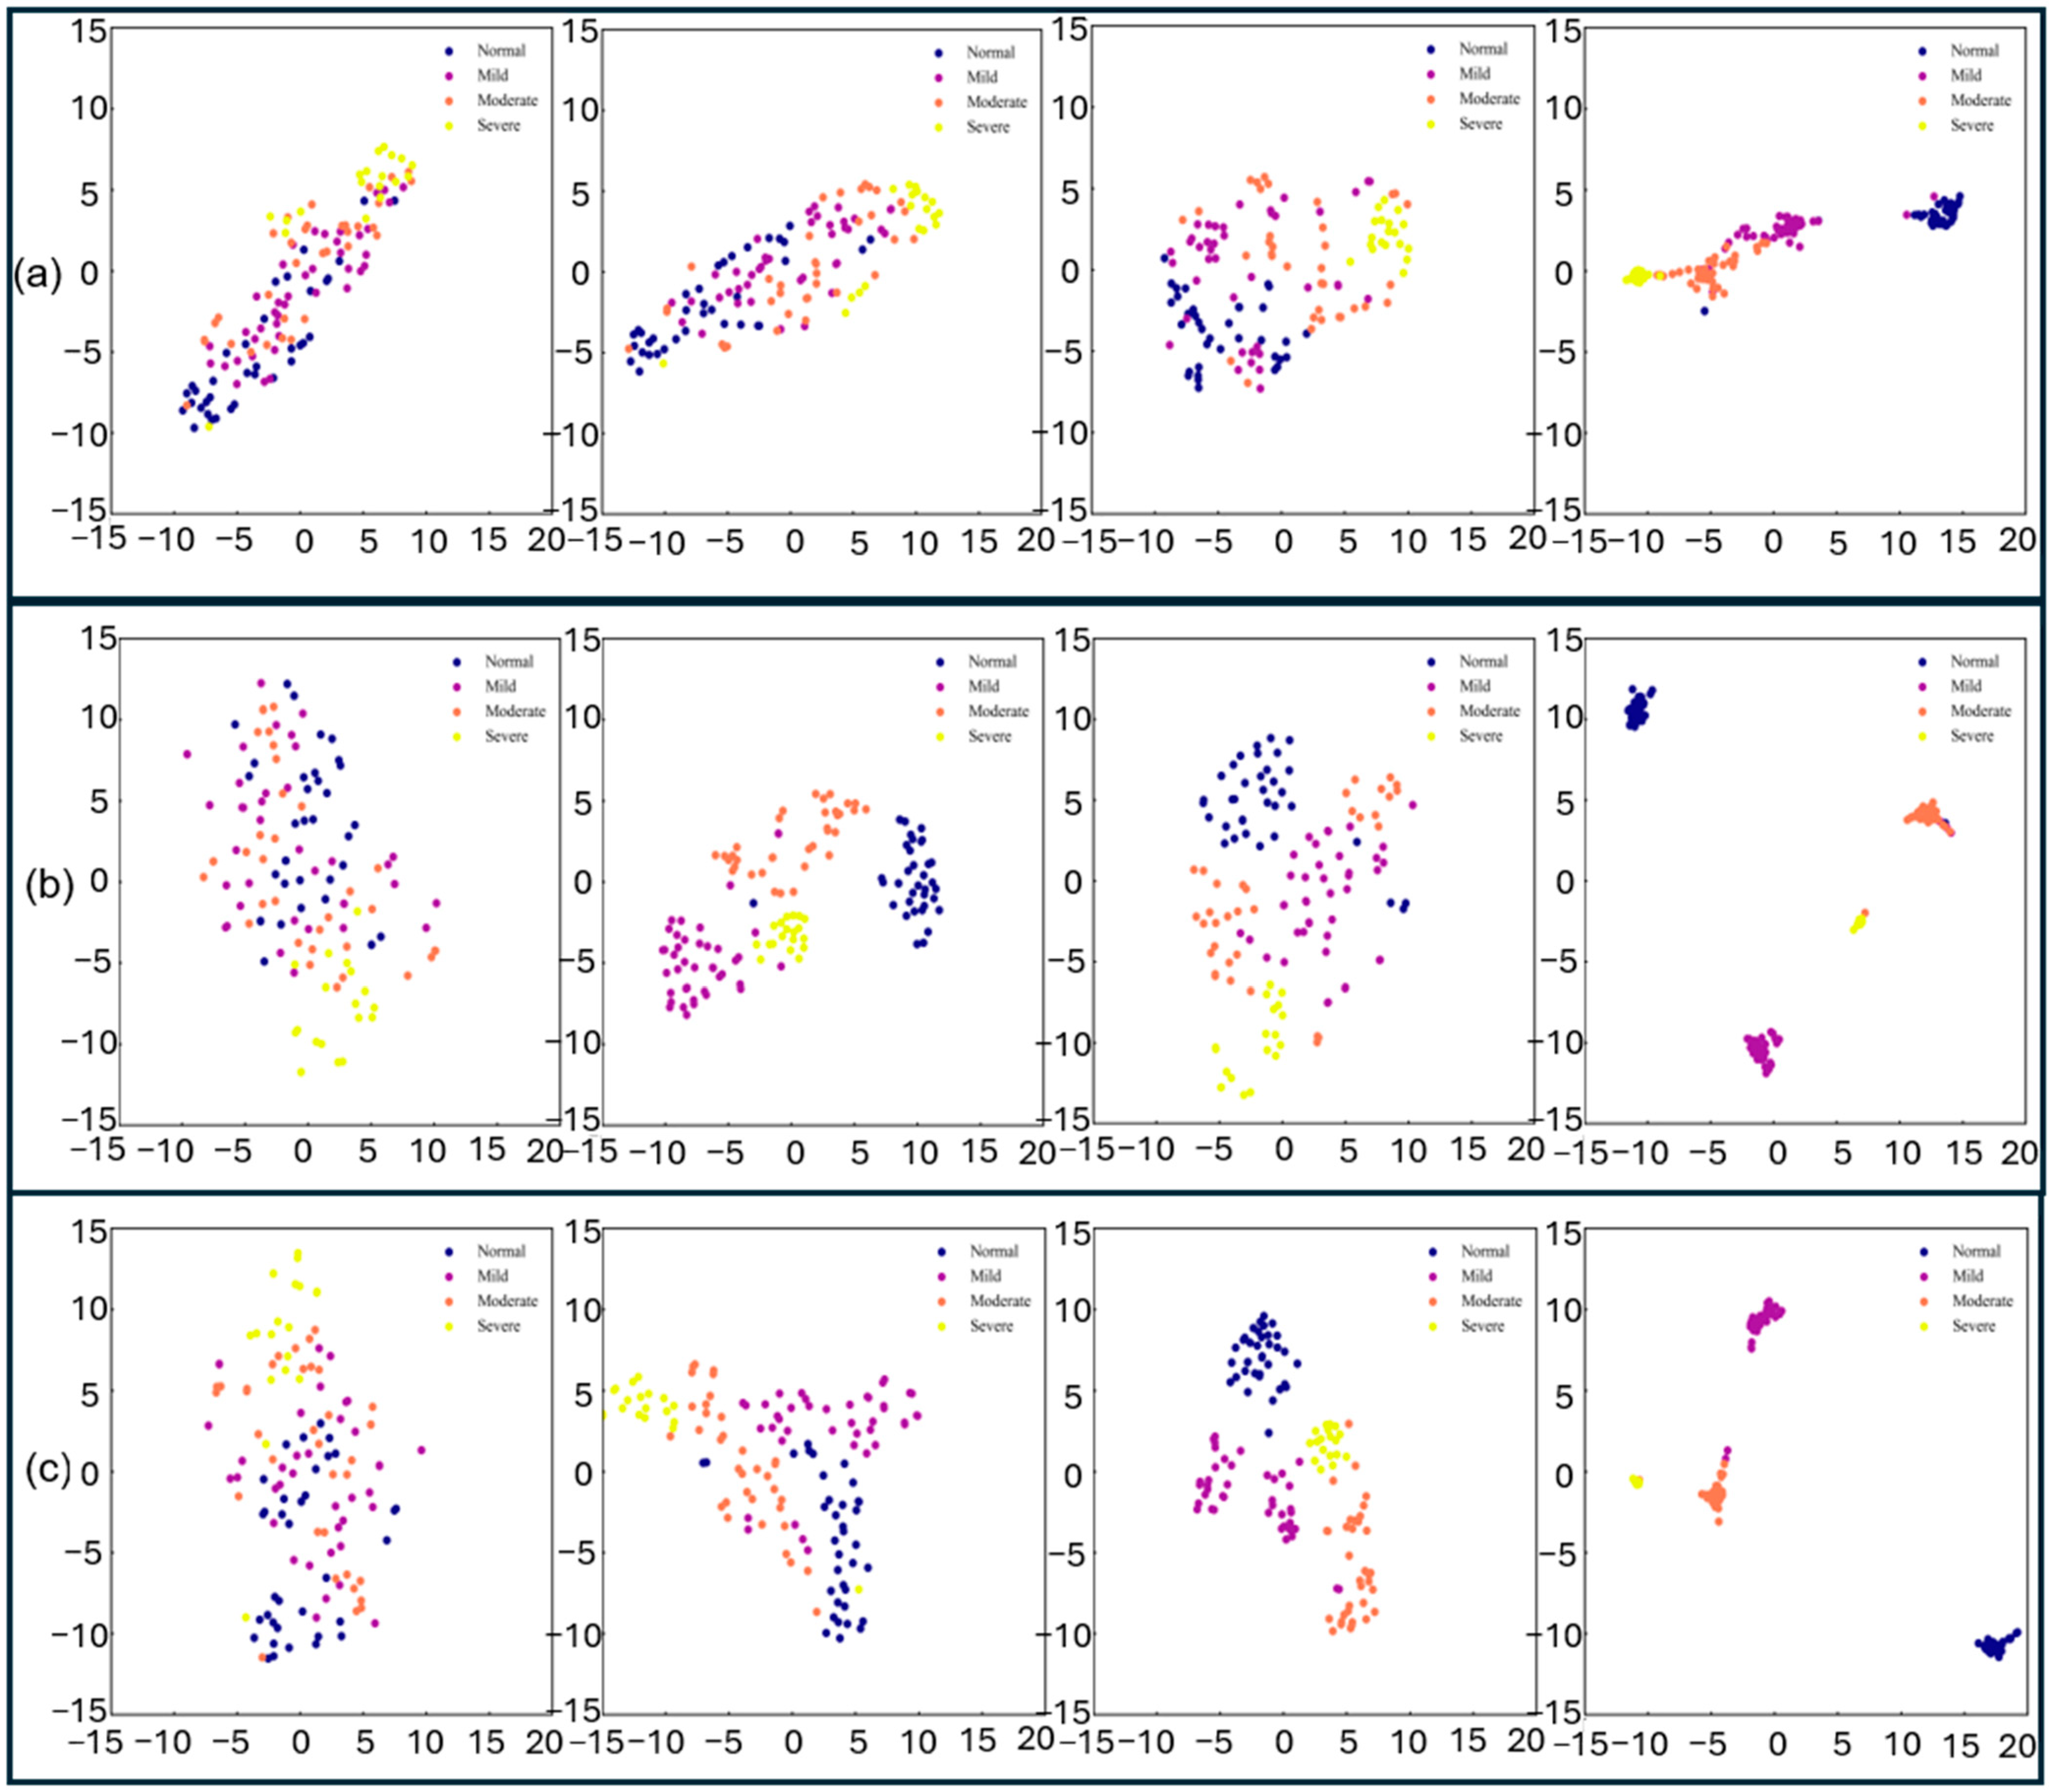
3.3. Visualization of Hidden Layer Features of MLP-Transformer Using T-SNE Algorithm

The visual analysis of the hidden layer features of the MLP-Transformer model using the t-SNE algorithm helps to understand the feature extraction. Figure 6 shows the t-SNE visualization results for the input data, the third TransformerEncoder layer, the first MLP, and finally the Linear layer during the training process. As can be seen from the figure, as the depth of the network increases, the feature samples of the three datasets become more concentrated and easier to distinguish. In the Linear layer using Sound–Vis–NIRS data, the normal and severe lesion samples are clustered the best, and are easier to distinguish compared to the mild lesion and moderate lesion samples. However, there was a small amount of overlap between the mild lesion and moderate lesion samples, suggesting the difficulty of fully distinguishing between the two samples. In the Linear layer using Vis–NIRS data alone, there is a large amount of overlap among the four classes of samples, which is less effective for clustering. Compared to the model using sound data or Vis–NIRS data alone, the model combining the two datasets clustered the four classes of samples best, with fewer mild lesion samples overlapping with normal, moderate lesion, and severe lesion samples. Thus, for the task of classifying the extent of apple moldy core, combining sound and Vis–NIRS data would give better classification results than using sound data or Vis–NIRS data alone. This may be due to the fact that the fused information provides a more comprehensive view, allowing the deep learning model to automatically extract and utilize this information more efficiently. This is consistent with the results of the PLS-DA and SVM models trained with Sound–Vis–NIRS on the prediction set in Section 3.2. For more discussion on acoustic vibration detection principles compared to optical detection principles, see this review paper [38].

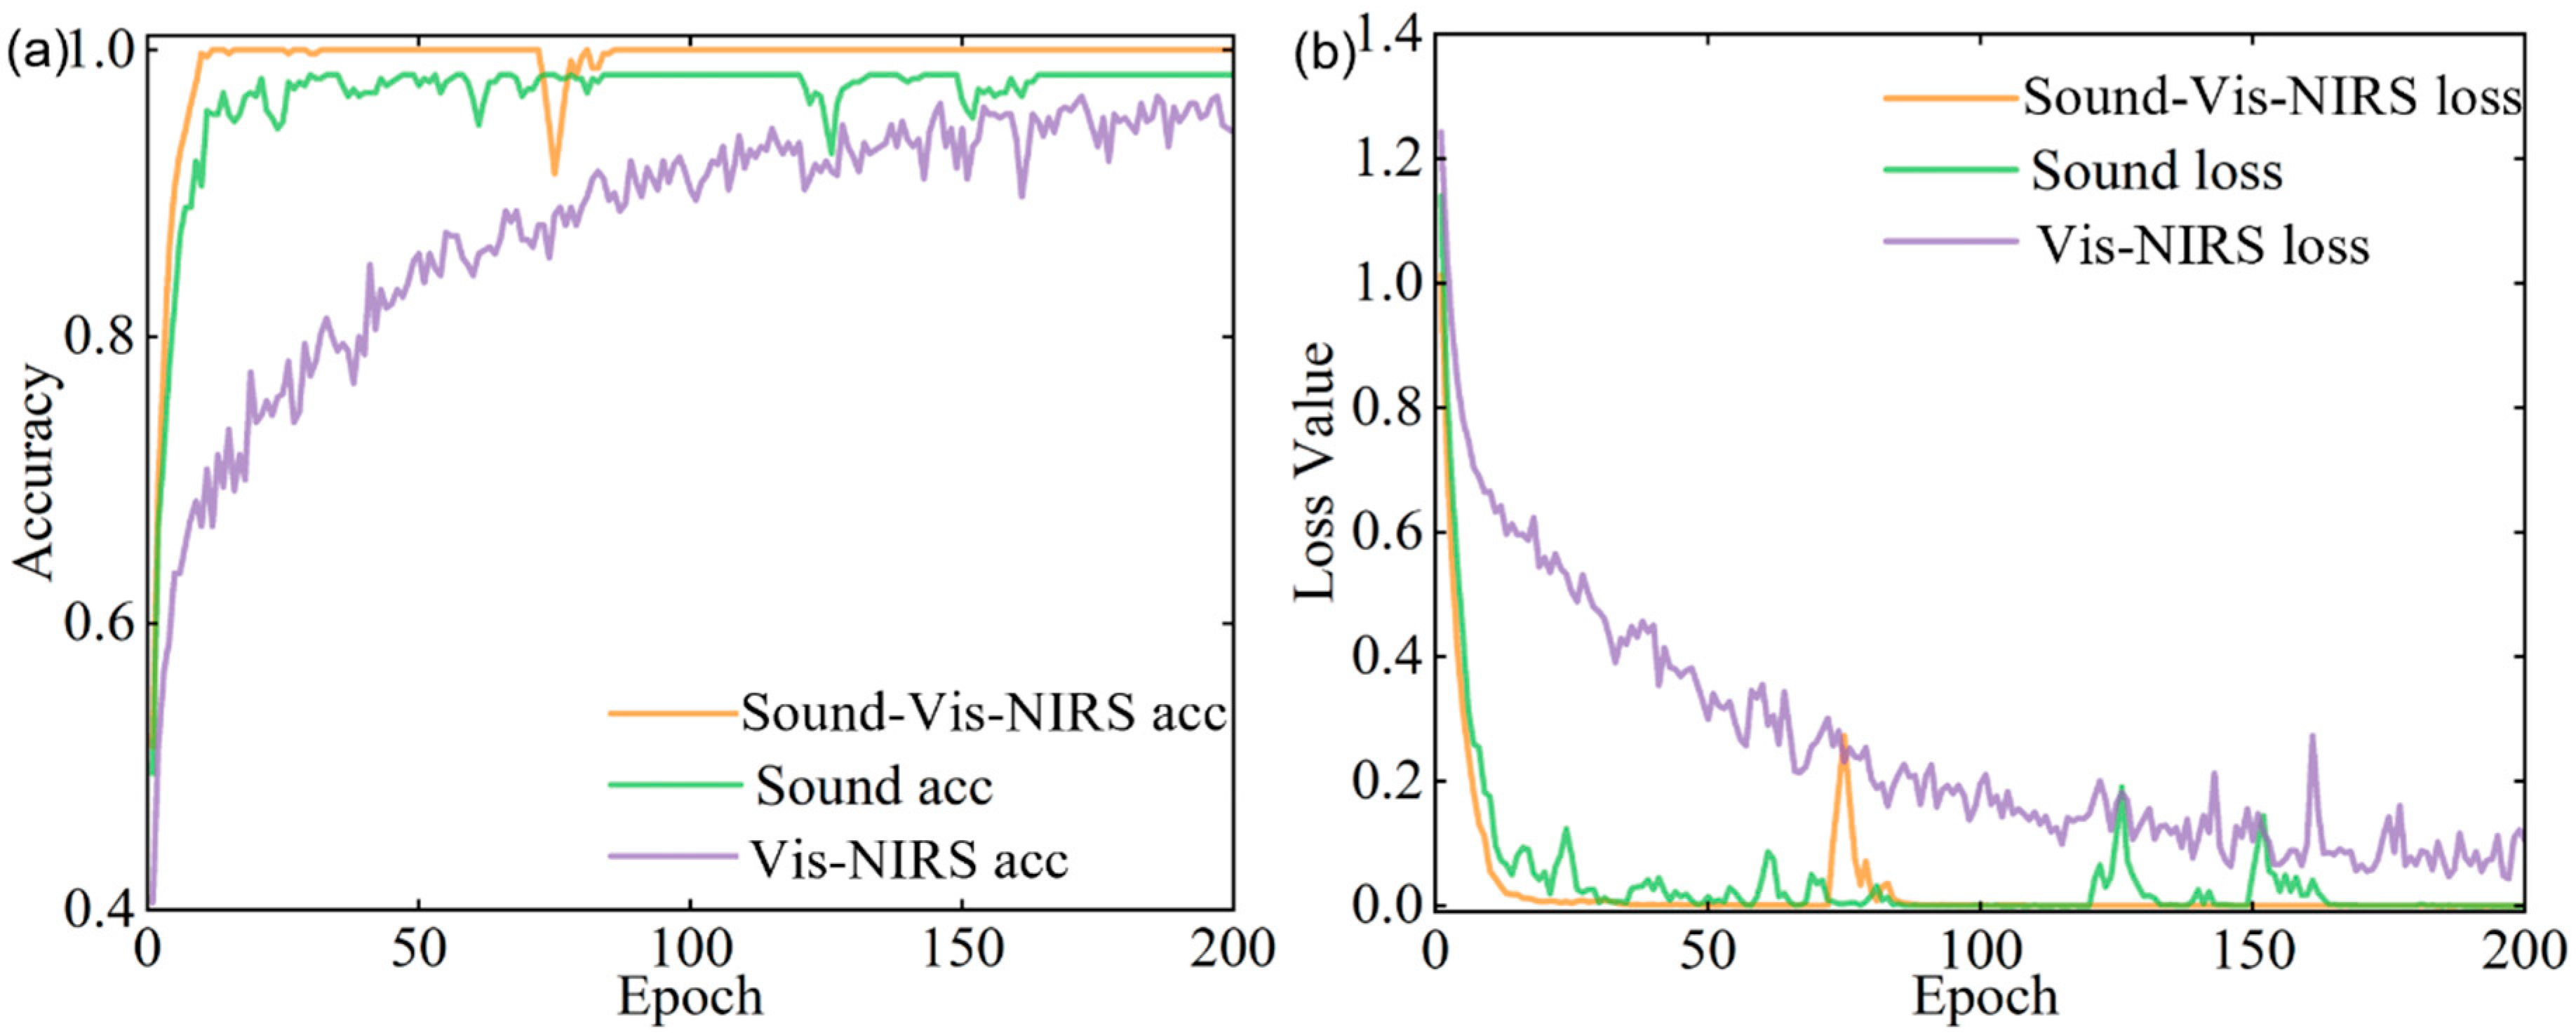
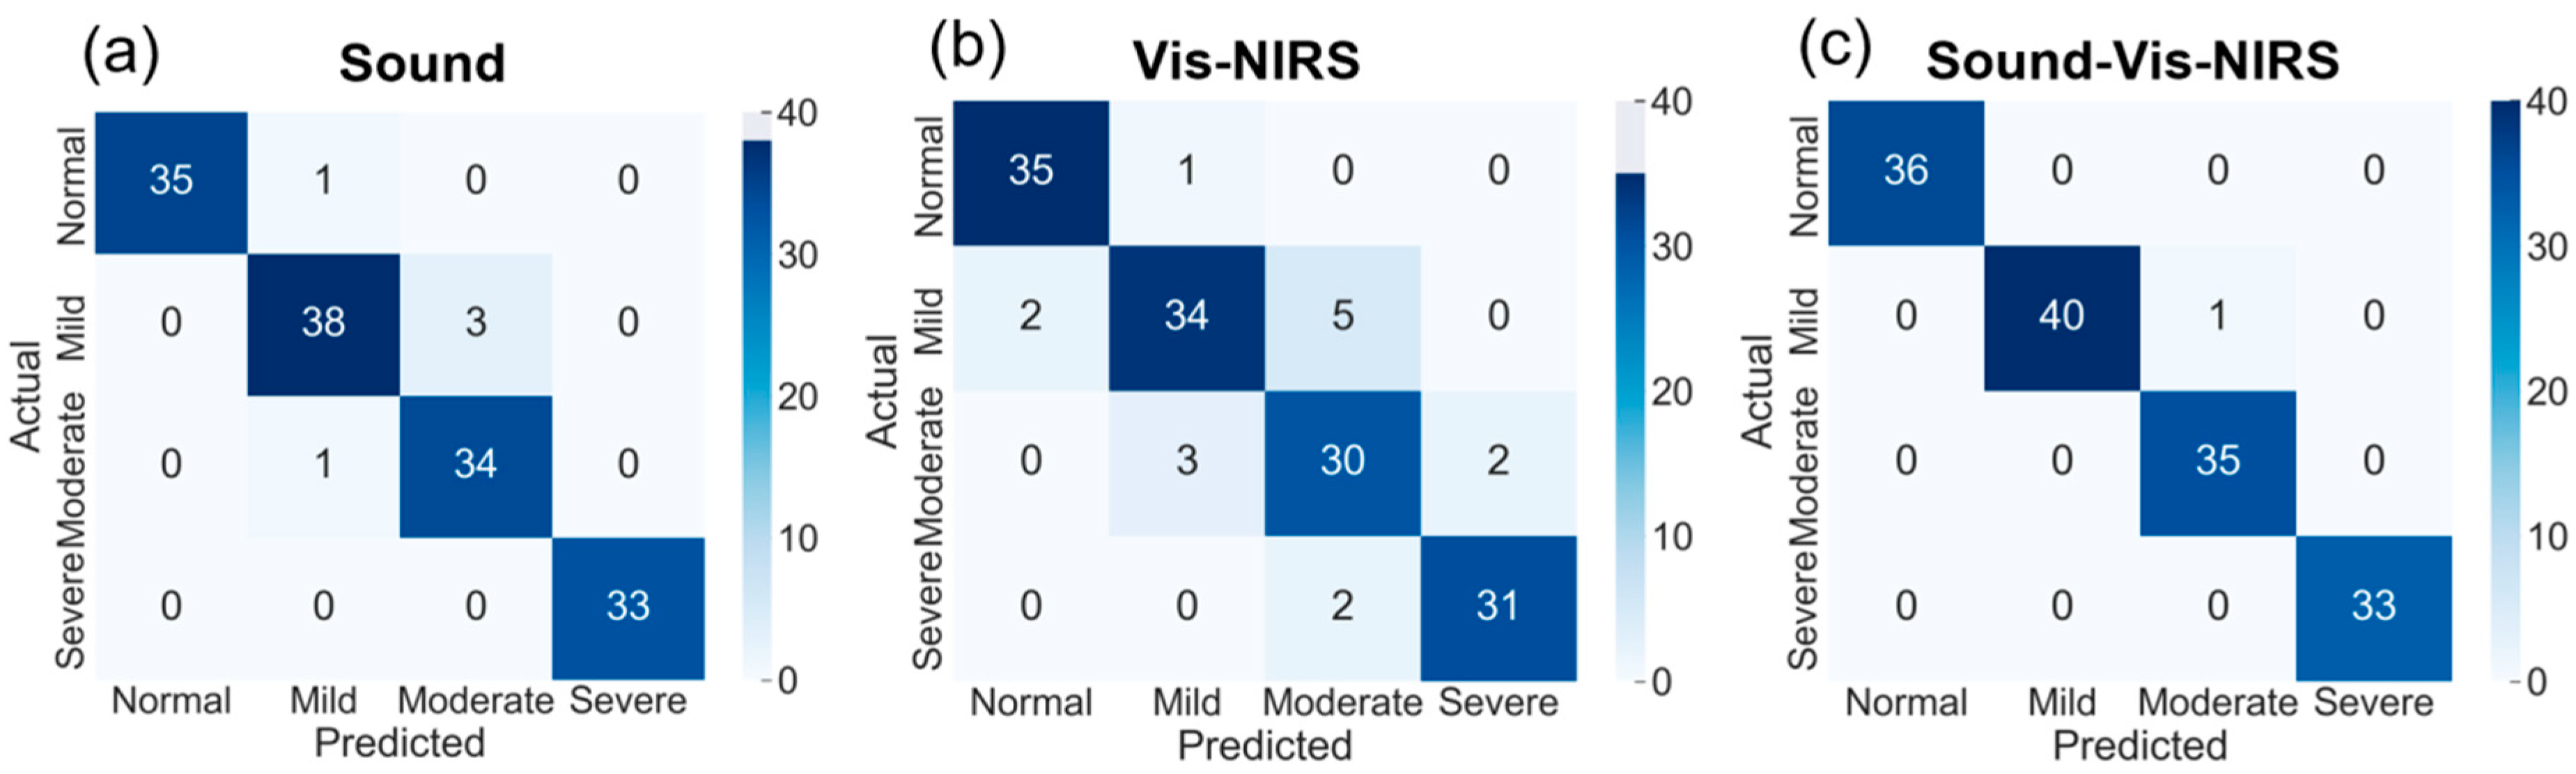
3.4. Classification Results of Deep Learning Models

The results in Section 3.2 and Section 3.3 indicate that the acoustic detection method significantly outperforms the Vis–NIRS method in terms of moldy apple identification accuracy, and the fusion of acoustic and Vis–NIRS data can further improve the model prediction performance. The MLP-Transformer and ResNet models were trained on sound spectrum, Vis–NIRS data, and Sound–Vis–NIRS data, respectively. The ResNet model used a batch size of 8, while the MLP-Transformer model had a batch size of 16, with both models trained for 200 epochs. The training loss and accuracy variations in the MLP-Transformer model are shown in Figure 7. The training loss of the Vis–NIRS-based model decreases the slowest, the training accuracy rises the slowest, and fluctuates. Compared to the models under the other two types of data, the Sound–Vis–NIRS-based model has the fastest convergence of training loss and accuracy, and stabilizes after 30 iterations, with the training set accuracy stabilizing at 100%, which is higher than both of the other two. This indicates that the MLP-Transformer model trained with Sound–Vis–NIRS has good convergence performance. The results of the training and prediction sets are shown in Table 4, from which it can be seen that both ResNet and MLP-Transformer have better results on the training set, and both models based on Sound and Sound–Vis–NIRS have a training set accuracy of 100.00%, while the two models based on Vis–NIRS have a slightly lower training set accuracy of 98.98% and 96.94%. In addition, the ResNet and MLP-Transformer models trained using Sound–Vis–NIRS exhibit higher accuracy on the prediction set compared to their counterparts trained using Sound or Vis–NIRS alone. This suggests that combining sound and Vis–NIRS data results in better classification performance. Although the ResNet models based on the three different datasets have good classification performance on the training set, they have poorer performance on the prediction set, which suggests that the ResNet models based on the three different datasets have poor generalization performance on the prediction set. Compared to the former, the MLP-Transformer model performs better on the prediction set and gives the best result of 98.62% under Sound–Vis–NIRS training. This indicates that MLP-Transformer performs better on apple moldy core detection.
The confusion matrix of the prediction results of the MLP-Transformer model built for various datasets is shown in Figure 8. The Vis–NIRS model is prone to misclassification in the identification of mild moldy apples; this is mainly due to the fact that mildew mainly occurs in the core region, and the Vis–NIRS light decays exponentially with depth after penetrating the fruit flesh, resulting in insufficient effective Vis–NIRS information for mildly mildewed apples. Acoustic vibration signals are highly transmissive and therefore can significantly improve this problem. Only one mild disease sample was misclassified as moderate disease, and one moderate disease sample was misclassified as severe disease in the Sound and Vis–NIRS data fusion model, and none of the moldy-core apples were misidentified as healthy apples. The lesion areas of the misclassified samples were close to the thresholds for moderate and severe disease (15%) and mild and moderate disease (7%), indicating that the MLP-Transformer model has good performance in identifying both mild and moderate disease samples, with misclassifications occurring near the thresholds.
In addition, Table 5 presents the performance of MLP-Transformer and ResNet models trained on Sound–Vis–NIR data on the prediction set. The results indicate that the MLP-Transformer model outperforms the ResNet model in terms of Weighted_P, Weighted_R, and Weighted_F1 by 4.05%, 4.14%, and 4.15%, respectively. This suggests that the MLP-Transformer model has better generalization ability for classifying apple moldy core disease. Notably, the model achieves 100% recall (R) for normal and severe disease samples, demonstrating its ability to accurately identify these categories. However, there is some difficulty in identifying mild and moderate disease samples, with recall values of 97.56% and 97.14%, respectively.

3.5. Comparative Analysis

As shown in Table 6, nondestructive detection of moldy apples using VIS–NIRS or acoustic vibration techniques has been widely reported. For example, Ghooshkhaneh et al. [39] successfully differentiated between healthy and fungus-infected citrus using Vis–NIR spectroscopy with a BPNN model classification accuracy of 93%. Liu et al. [40] achieved three-classification detection of apple moldy core with an overall accuracy of 97.3% using a self-developed Vis–NIR device, and Zhang et al. [41] analyzed apple Vis–NIR spectra using the PLS-DA model, and the accuracy of apple moldy core detection was 89.39%. On the other hand, Zhao, Zha, Li and Wu [4] achieved apple moldy core detection using an acoustic detection technique, and the accuracy of the constructed ELM model was 93.9%. Zhao, Li, Zha, Zhai and Wu [35] constructed a three-classification model for apple moldy core detection based on IResNet50, and the overall accuracy of the model was 96.7%. Although acoustic vibration techniques have been widely reported, however, to the best of our knowledge, the use of acoustic techniques for on-lineonline detection of internal lesions in fruits (including moldy core apples) has not been reported. Therefore, exploring the realization of acoustic on-lineonline detection of moldy apples remains an interesting and worthwhile study.
Although available reports have demonstrated significant results of single techniques in fruit quality assessment, the potential of real-time fusion of acoustic and spectral techniques for online detection has not been explored. In view of this, the acoustic online inspection device designed in this study is capable of detecting fruits in real time, and also fuses acoustic features of apples with spectral data using the MLP-Transformer model to achieve four-classification detection of moldy apple cores with a detection accuracy of 98.62%. Limited by our existing experimental conditions, our study still has some limitations: (1) all apple samples were of the same variety from the same orchard; (2) the moldy heart apple samples were artificially induced to be obtained; and (3) the acoustic system and the Vis–NIRS system are currently separate. Collecting real moldy heart apple samples from different orchards and varieties to evaluate the generalization ability of the model, as well as integrating the acoustic detection system with the Vis–NIRS system, will be our next focus.

4. Conclusions

This study aimed to test a novel acoustic online detection device designed independently and explore the feasibility of integrating acoustic with Vis–NIRS techniques for accurate online detection of moldy apples. Sound signals were collected using the acoustic device, while Vis–NIR spectra were collected by a Vis–NIR online sorter. Subsequently, multiple apple moldy core classification models including traditional machine learning models (PLS-DA and SVM) and deep learning models (MLP-Transformer and ResNet) were constructed based on sound data, Vis–NIRS data, and fused Sound–Vis–NIRS data. The results show that the models trained with Sound–Vis–NIRS data exhibit superior results in identifying moldy core compared to the models trained with only single sound data or Vis–NIRS data. In particular, the recognition ability of the MLP-Transformer model we constructed is particularly outstanding. Through the in-depth analysis of the model’s hidden layer features by the t-SNE algorithm, we further verified the superior performance of the MLP-Transformer model in apple moldy core disease recognition. The model achieved overall accuracies of 96.55% using sound data, and 89.66% using Vis–NIRS data on the prediction set. When combining Sound–Vis–NIRS data, it reached 100% accuracy for normal and severe disease samples, 97.56% for mild cases, 97.14% for moderate cases, and an overall accuracy of 98.62%, demonstrating excellent performance in detecting moldy core apple. Acoustic and Vis–NIRS data provide information about moldy apple cores from two different levels of physical and chemical properties, and the fusion of the two types of information can effectively improve the accuracy and efficiency of detection.
Given that moldy apples, even in small quantities, can quickly lead to widespread infection, integrating acoustic and Vis–NIRS techniques to enhance detection accuracy is highly valuable. Although this study achieved satisfactory results, the acquisition of sound and Vis–NIRS data was conducted using two separate devices. Given that acoustic detection has a unique advantage in the identification of internal lesions in fruits, and Vis–NIRS has been widely used in the field of online sorting, the focus of our next work will be focused on the development of online sorting equipment that integrates both acoustic and Vis–NIRS technologies.

Author Contributions

N.C.: Investigation, software, data curation, writing—original draft. X.Z.: investigation, data curation, writing—review and editing. Z.L.: resources, methodology. T.Z.: resources, validation. Q.L.: resources, software. B.L.: resources, software. Y.L. (Yeqing Lu): writing—review and editing. B.H.: writing—review and editing. X.J.: writing—review and editing, validation. Y.L. (Yande Liu): writing—review and editing, validation. All authors have read and agreed to the published version of the manuscript.

Funding

This research was supported by the Natural Science Foundation of Jiangxi Province (No.20242BAB20060), the National Key Research and Development Program of China (No. 2023YFD2001301, 2024YFD2000603), the Training Program for Academic and Technical Leaders in Key Disciplines in Jiangxi Province (20243BCE51173,) and the National Natural Science Foundation of China (No. 12304447).

Institutional Review Board Statement

Not applicable.

Data Availability Statement

The datasets analyzed during the current research are available from the corresponding author on reasonable request.

Conflicts of Interest

Authors Yeqing Lu and Bo Hu are employed by Weisong Photoelectric Technology Company. The remaining authors declare that there are no business or financial relationships that could be considered a potential conflict of interest in the conduct of this study.

References

  1. Tournas, V.H.; Uppal Memon, S. Internal contamination and spoilage of harvested apples by patulin-producing and other toxigenic fungi. Int. J. Food Microbiol. 2009, 133, 206–209. [Google Scholar] [CrossRef]
  2. Patriarca, A. Fungi and mycotoxin problems in the apple industry. Curr. Opin. Food Sci. 2019, 29, 42–47. [Google Scholar] [CrossRef]
  3. Shen, F.; Wu, Q.F.; Liu, P.; Jiang, X.S.; Fang, Y.; Cao, C.J. Detection of Aspergillus spp. contamination levels in peanuts by near infrared spectroscopy and electronic nose. Food Control 2018, 93, 1–8. [Google Scholar] [CrossRef]
  4. Zhao, K.; Zha, Z.; Li, H.; Wu, J. Early detection of moldy apple core based on time-frequency images of vibro-acoustic signals. Postharvest Biol. Technol. 2021, 179, 111589. [Google Scholar] [CrossRef]
  5. Liu, Z.; Chen, N.; Le, D.; Lai, Q.; Li, B.; Wu, J.; Song, Y.; Liu, Y. Acoustic vibration multi-domain images vision transformer (AVMDI-ViT) to the detection of moldy apple core: Using a novel device based on micro-LDV and resonance speaker. Postharvest Biol. Technol. 2024, 211, 112838. [Google Scholar] [CrossRef]
  6. Han, Q.-L.; Long, B.-X.; Yan, X.-J.; Wang, W.; Liu, F.-R.; Chen, X.; Ma, F. Exploration of using acoustic vibration technology to non-destructively detect moldy kernels of in-shell hickory nuts (Carya cathayensis Sarg.). Comput. Electron. Agric. 2023, 212, 108137. [Google Scholar] [CrossRef]
  7. Srivastava, R.K.; Talluri, S.; Beebi, S.K.; Kumar, B.R. Magnetic Resonance Imaging for Quality Evaluation of Fruits: A Review. Food Anal. Methods 2018, 11, 2943–2960. [Google Scholar] [CrossRef]
  8. Tian, X.; Wang, Q.; Huang, W.; Fan, S.; Li, J. Online detection of apples with moldy core using the Vis/NIR full-transmittance spectra. Postharvest Biol. Technol. 2020, 168, 111269. [Google Scholar] [CrossRef]
  9. Zhang, Q.; Huang, W.; Wang, Q.; Wu, J.; Li, J. Detection of pears with moldy core using online full-transmittance spectroscopy combined with supervised classifier comparison and variable optimization. Comput. Electron. Agric. 2022, 200, 107231. [Google Scholar] [CrossRef]
  10. Tian, S.J.; Zhang, M.S.; Li, B.; Zhang, Z.X.; Zhao, J.; Zhang, Z.J.; Zhang, H.H.; Hu, J. Measurement orientation compensation and comparison of transmission spectroscopy for online detection of moldy apple core. Infrared Phys. Technol. 2020, 111, 103510. [Google Scholar] [CrossRef]
  11. Li, J.B.; Huang, W.Q.; Zhao, C.J.; Zhang, B.H. A comparative study for the quantitative determination of soluble solids content, pH and firmness of pears by Vis/NIR spectroscopy. J. Food Eng. 2013, 116, 324–332. [Google Scholar] [CrossRef]
  12. O’Brien, C.; Falagán, N.; Kourmpetli, S.; Landahl, S.; Terry, L.A.; Alamar, M.C. Non-destructive methods for mango ripening prediction: Visible and near-infrared spectroscopy (visNIRS) and laser Doppler vibrometry (LDV). Postharvest Biol. Technol. 2024, 212, 112878. [Google Scholar] [CrossRef]
  13. Anderson, N.T.; Walsh, K.B. Review: The evolution of chemometrics coupled with near infrared spectroscopy for fruit quality evaluation. J. Near Infrared Spectrosc. 2022, 30, 3–17. [Google Scholar] [CrossRef]
  14. Cruz, S.; Guerra, R.; Brazio, A.; Cavaco, A.M.; Antunes, D.; Passos, D. Nondestructive simultaneous prediction of internal browning disorder and quality attributes in ‘Rocha’ pear (Pyrus communis L.) using VIS-NIR spectroscopy. Postharvest Biol. Technol. 2021, 179, 111562. [Google Scholar] [CrossRef]
  15. Tian, S.J.; Zhang, J.H.; Zhang, Z.X.; Zhao, J.; Zhang, Z.J.; Zhang, H.H. Effective modification through transmission Vis/NIR spectra affected by fruit size to improve the prediction of moldy apple core. Infrared Phys. Technol. 2019, 100, 117–124. [Google Scholar] [CrossRef]
  16. Cortés, V.; Blasco, J.; Aleixos, N.; Cubero, S.; Talens, P. Monitoring strategies for quality control of agricultural products using visible and near-infrared spectroscopy: A review. Trends Food Sci. Technol. 2019, 85, 138–148. [Google Scholar] [CrossRef]
  17. Ding, C.; Feng, Z.; Wang, D.; Cui, D.; Li, W. Acoustic vibration technology: Toward a promising fruit quality detection method. Compr. Rev. Food Sci. Food Saf. 2021, 20, 1655–1680. [Google Scholar] [CrossRef]
  18. Zhang, H.; Zha, Z.; Kulasiri, D.; Wu, J. Detection of Early Core Browning in Pears Based on Statistical Features in Vibro-Acoustic Signals. Food Bioprocess Technol. 2021, 14, 887–897. [Google Scholar] [CrossRef]
  19. Kawai, T.; Matsumori, F.; Akimoto, H.; Sakurai, N.; Hirano, K.; Nakano, R.; Fukuda, F. Nondestructive Detection of Split-pit Peach Fruit on Trees with an Acoustic Vibration Method. Hortic. J. 2018, 87, 499–507. [Google Scholar] [CrossRef]
  20. Nakano, R.T.; Akimoto, H.; Fukuda, F.; Kawai, T.; Ushijima, K.; Fukamatsu, Y.; Kubo, Y.; Fujii, Y.; Hirano, K.; Morinaga, K.; et al. Nondestructive Detection of Split Pit in Peaches Using an Acoustic Vibration Method. Hortic. J. 2018, 87, 281–287. [Google Scholar] [CrossRef]
  21. Blanes, C.; Ortiz, C.; Mellado, M.; Beltrán, P. Assessment of eggplant firmness with accelerometers on a pneumatic robot gripper. Comput. Electron. Agric. 2015, 113, 44–50. [Google Scholar] [CrossRef]
  22. Hosoya, N.; Mishima, M.; Kajiwara, I.; Maeda, S. Non-destructive firmness assessment of apples using a non-contact laser excitation system based on a laser-induced plasma shock wave. Postharvest Biol. Technol. 2017, 128, 11–17. [Google Scholar] [CrossRef]
  23. Arai, N.; Miyake, M.; Yamamoto, K.; Kajiwara, I.; Hosoya, N. Soft Mango Firmness Assessment Based on Rayleigh Waves Generated by a Laser-Induced Plasma Shock Wave Technique. Foods 2021, 10, 323. [Google Scholar] [CrossRef]
  24. AWETA. Avocado Sorting Machine. Available online: https://www.aweta.com/en/produce/avocado (accessed on 27 May 2025).
  25. Wang, D.; Feng, Z.; Ji, S.; Cui, D. Simultaneous prediction of peach firmness and weight using vibration spectra combined with one-dimensional convolutional neural network. Comput. Electron. Agric. 2022, 201, 107341. [Google Scholar] [CrossRef]
  26. Liu, Z.; Le, D.; Zhang, T.; Lai, Q.; Zhang, J.; Li, B.; Song, Y.; Nan, C. Detection of apple moldy core disease by fusing vibration and Vis/NIR spectroscopy data with dual-input MLP-Transformer. J. Food Eng. 2024, 382, 112219. [Google Scholar] [CrossRef]
  27. Barbosa, S.; Saurina, J.; Puignou, L.; Núñez, O. Classification and Authentication of Paprika by UHPLC-HRMS Fingerprinting and Multivariate Calibration Methods (PCA and PLS-DA). Foods 2020, 9, 486. [Google Scholar] [CrossRef] [PubMed]
  28. Chorowski, J.; Wang, J.; Zurada, J.M. Review and performance comparison of SVM- and ELM-based classifiers. Neurocomputing 2014, 128, 507–516. [Google Scholar] [CrossRef]
  29. Cheng, P.; Yu, H.; Liu, C.; Luo, K.; Akhtar, N.; Chen, X. RID-Net: A Hybrid MLP-Transformer Network for Robust Point Cloud Registration. IEEE Robot. Autom. Lett. 2025, 10, 5066–5073. [Google Scholar] [CrossRef]
  30. van de Ruit, M.; Billeter, M.; Eisemann, E. An Efficient Dual-Hierarchy t-SNE Minimization. IEEE Trans. Vis. Comput. Graph. 2022, 28, 614–622. [Google Scholar] [CrossRef]
  31. Thompson, A.K. Recommended CA Storage Conditions for Selected Crops; CABI: Oxon, UK, 2010; pp. 116–191. [Google Scholar] [CrossRef]
  32. Linke, M.; Praeger, U.; Neuwald, D.A.; Geyer, M. Measurement of Water Vapor Condensation on Apple Surfaces during Controlled Atmosphere Storage. Sensors 2023, 23, 1739. [Google Scholar] [CrossRef]
  33. Han, Z.; Wang, Z.; Bi, Y.; Zong, Y.; Gong, D.; Wang, B.; Li, B.; Sionov, E.; Prusky, D. The Effect of Environmental pH during Trichothecium roseum (Pers.:Fr.) Link Inoculation of Apple Fruits on the Host Differential Reactive Oxygen Species Metabolism. Antioxidants 2021, 10, 692. [Google Scholar] [CrossRef] [PubMed]
  34. Gong, D.; Bi, Y.; Jiang, H.; Xue, S.; Wang, Z.; Li, Y.; Zong, Y.; Prusky, D. A comparison of postharvest physiology, quality and volatile compounds of ‘Fuji’ and ‘Delicious’ apples inoculated with Penicillium expansum. Postharvest Biol. Technol. 2019, 150, 95–104. [Google Scholar] [CrossRef]
  35. Zhao, K.; Li, H.; Zha, Z.; Zhai, M.; Wu, J. Detection of sub-healthy apples with moldy core using deep-shallow learning for vibro-acoustic multi-domain features. Meas. Food 2022, 8, 100068. [Google Scholar] [CrossRef]
  36. Vaswani, A.; Shazeer, N.; Parmar, N.; Uszkoreit, J.; Jones, L.; Gomez, A.N.; Kaiser, L.; Polosukhin, I. Attention Is All You Need. arXiv 2017, arXiv:1706.03762. [Google Scholar] [CrossRef]
  37. Dosovitskiy, A.; Beyer, L.; Kolesnikov, A.; Weissenborn, D.; Zhai, X.; Unterthiner, T.; Dehghani, M.; Minderer, M.; Heigold, G.; Gelly, S.; et al. An Image is Worth 16x16 Words: Transformers for Image Recognition at Scale. arXiv 2020, arXiv:2010.11929. [Google Scholar] [CrossRef]
  38. Tian, S.; Xu, H. Mechanical-based and Optical-based Methods for Nondestructive Evaluation of Fruit Firmness. Food Rev. Int. 2022, 39, 4009–4039. [Google Scholar] [CrossRef]
  39. Ghooshkhaneh, N.G.; Golzarian, M.R.; Mollazade, K. VIS-NIR spectroscopy for detection of citrus core rot caused by Alternaria alternata. Food Control 2023, 144, 109320. [Google Scholar] [CrossRef]
  40. Liu, H.; Wei, Z.; Lu, M.; Gao, P.; Li, J.; Zhao, J.; Hu, J. A Vis/NIR device for detecting moldy apple cores using spectral shape features. Comput. Electron. Agric. 2024, 220, 108898. [Google Scholar] [CrossRef]
  41. Zhang, Z.X.; Pu, Y.G.; Wei, Z.C.; Liu, H.L.; Zhang, D.L.; Zhang, B.; Zhang, Z.J.; Zhao, J.; Hu, J. Combination of interactance and transmittance modes of Vis/NIR spectroscopy improved the performance of PLS-DA model for moldy apple core. Infrared Phys. Technol. 2022, 126, 104366. [Google Scholar] [CrossRef]
Figure 1. Acquisition devices for acoustic and Vis–NIRS data. (a) Acoustic device. (b) Sketch of the Vis–NIR online sorter.
Agriculture 15 01202 g001
Figure 2. Apples with varying extents of moldy cores and the computational procedure for assessing apple disease. (a) Displays an apple with various extents of moldy core. (b) Calculation process for assessing the extent of the apple’s moldy core.
Agriculture 15 01202 g002
Figure 3. The MLP-Transformer model structure.
Agriculture 15 01202 g003
Figure 4. Acoustic and Vis–NIRS of apples with various extent of moldy core. (a) Sound data, (b) Vis–NIRS data. The numbers in the legend represent the size of the moldy core.
Agriculture 15 01202 g004
Figure 5. Remove background noise from Vis–NIRS. (a) CEEMDAN decomposition results, (b) comparison of original and reconstructed Vis–NIRS.
Agriculture 15 01202 g005
Figure 6. Visualization plots of MLP-Transformer hidden layer features. (a) visualization of sound data features, (b) visualization of Vis–NIRS data features, (c) visualization of Sound–Vis–NIRS features.
Agriculture 15 01202 g006
Figure 7. Training accuracy curves and loss curves for MPL-Transformer models based on three different datasets. (a) accuracy curves, (b) loss curves.
Agriculture 15 01202 g007
Figure 8. Prediction results of MLP-Transformer (a) sound (b)Vis–NIRS (c) Sound–Vis–NIRS.
Agriculture 15 01202 g008
Table 1. The exact specifications of the apple samples.
ParametersFruit Mass (g)Fruit Diameter (mm)
Minimum204.5978.48
Maximum289.4892.97
Mean248.1384.03
SD23.173.59
Table 2. The best parameters of PLS-DA and SVM models with various training data.
Training DataSVM ParametersPLS-DA Parameters
Kernel FunctionPenalty ParameterPoly OrderComponents
SoundRBF2558
Vis–NIRSPoly7324
Sound–Vis–NIRSPoly4659
Table 3. PLS-DA and SVM model detection results on training and prediction sets.
ModelsTraining DataTraining Set Accuracy (%)Prediction Set Accuracy (%)
NormalMildModerateSevereOverallNormalMildModerateSevereOverall
PLS-DASound97.2783.1971.1784.9183.9791.6780.4974.2978.7981.38
Vis–NIRS82.7377.3163.9688.6876.5975.0058.5462.8684.8569.66
Sound–Vis–NIRS96.3692.4494.5996.2394.6694.4482.9394.2987.8989.66
SVMSound100.00100.00100.0 0100.00100.00100.0092.6888.5793.9493.79
Vis–NIRS97.2784.8788.2996.2390.8494.4480.4982.8684.8585.52
Sound–Vis–NIRS100.00100.00100.0 0100.00100.0097.2290.2494.29100.0095.17
Table 4. Training and prediction results for ResNet and MLP-Transformer models using various data.
ModelsTraining DataTraining Set Accuracy (%)Prediction Set Accuracy (%)
NormalMildModerateSevereOverallNormalMildModerateSevereOverall
MLP-TransformerSound98.1597.2798.1899.0798.1697.2292.6897.14100.0096.55
Vis–NIRS98.1894.1298.2098.1196.9497.2282.9385.7193.9489.66
Sound–Vis–NIRS100.00100.00100.00100.00100.00100.0097.5697.14100.0098.62
ResNetSound100.00100.00100.00100.00100.0088.8992.6882.86100.0090.08
Vis–NIRS98.1899.16100.0098.1198.9891.6778.0585.7190.9186.21
Sound–Vis–NIRS100.00100.00100.00100.00100.0097.2292.6888.57100.0094.48
Table 5. Performance evaluation of ResNet and MLP-Transformer models based on Sound–Vis–NIRS on the prediction set.
ModelsIndicators (%)NormalMildModerateSevereWeighted_PWeighted_RWeighted_F1
MLP-TransformerPrecision100.00100.0097.1497.0698.64
Recall100.0097.5697.14100.00 98.62
F1 Score100.0098.7797.1498.51 98.62
ResNetPrecision94.5991.5792.54100.0094.59
Recall97.2292.6888.57100.00 94.48
F1 Score94.5991.5792.54100.00 94.47
Table 6. Comparison of non-destructive testing reports on moldy apple cores.
ObjectsDetection MethodsAlgorithmAccuracyReferences
Moldy apple coreVis–NIRBPNN93%[39]
Moldy apple coreVis–NIRAdaBoost97.3%[40]
Moldy apple coreVis–NIRPLS-DA89.39%[41]
Moldy apple coreAcousticELM93.9%[4]
Moldy apple coreAcousticIResNet5096.7%[35]
Disclaimer/Publisher’s Note: The statements, opinions and data contained in all publications are solely those of the individual author(s) and contributor(s) and not of MDPI and/or the editor(s). MDPI and/or the editor(s) disclaim responsibility for any injury to people or property resulting from any ideas, methods, instructions or products referred to in the content.

