Article

Colloidal Nutrition Improves Parameters of Pecan Tree (Carya illinoinensis) Soil Health Such as Organic Matter, Available Water, and Electrical Conductivity

by
Rubén Gerardo León-Chan
,
Brandon Estefano Morales-Merida
,
Luis Amarillas
,
Nancy Varela-Bojórquez
and
Luis Alberto Lightbourn-Rojas
*
Instituto de Investigación Lightbourn, Jimenez 33981, Mexico
*
Author to whom correspondence should be addressed.
These authors contributed equally to this study.
Agriculture 2025, 15(11), 1201; https://doi.org/10.3390/agriculture15111201 (registering DOI)
Submission received: 26 April 2025 / Revised: 19 May 2025 / Accepted: 30 May 2025 / Published: 31 May 2025
(This article belongs to the Special Issue Soil Health and Crop Nutrition in Different Soil Management Systems)

Abstract

:
Background: Soil degradation and nutrient depletion critically impact pecan (Carya illinoinensis) production, reducing yield and soil fertility. Colloidal nutrition, a novel approach involving nano-scale nutrient formulations, could offer potential for soil restoration. Aim: This study aimed to assess the impact of colloidal nutrition on key physical, chemical, and biological soil health parameters in pecan tree cultivation. Methods: Soil from two orchards with 30-year-old pecan trees was used where different nutrition treatments were applied: conventional and colloidal. The variables considered included physical, chemical, and biological properties for the assessment of soil health indicators. Results: The colloidal treatment showed low salinity (2020: 2.04; 2021: 0.88 dS/m) and higher levels of humic acids (1.52 g C/100 g soil), available water depth (2020: 305.11, 2021: 350.00 m3/ha), and soil organic matter (2020: 2.10%; 2021: 2.11%). Furthermore, 6 of the 17 phytopathogens that were examined were not detected in the colloidal treatment. Conclusions: This study enhanced our understanding of the improvements that colloidal treatment could potentially provide to the physical, chemical, and biological aspects of soil health in pecan orchards.

1. Introduction

The pecan tree [Carya illinoinensis (Wangenh.) K. Koch] is a plant of the Juglandaceae family and the Carya genus, which comprises 17 species worldwide [1,2]. The native distribution area of pecan trees goes from the southeastern of United States of America (USA) (Indiana, Illinois, Iowa, Kansas, Missouri, Oklahoma, Arkansas, Kentucky, Louisiana, Mississippi, Tennessee, Texas) to the northern of Mexico (Chihuahua, Sonora, Coahuila, Durango, Nuevo León and Tamaulipas) [3]. Globally, the primary pecan producing countries include Mexico, USA, South Africa, Australia, and Peru. Mexico is the world’s leading pecan exporter [4]. In 2023, Mexico reported a total production of 165,151.37 t, with the main producing states being Chihuahua, Sonora, Coahuila, Durango, and Nuevo Leon, contributing to 96.75% of the total production [5].
Declining soil health is a significant challenge that is negatively affecting global agricultural output. This results from several sources, including soil deterioration, nutrient depletion, and inadequate soil management approaches [6,7]. Soil health is determined by its physical, biological, and chemical properties; these characteristics determine the soil’s ability to provide air, water, nutrients, and space for root growth, which is essential for optimal crop health and yield [8,9]. Regarding soil analysis studies, Wells (2009) reported that in the soils of pecan trees in southern Georgia (USA), the nutrients with the highest demand were nitrogen (N), potassium (K), sulfur (S), and copper (Cu) [10]. Researchers have also observed a positive correlation between electrical conductivity (EC), pH, available phosphorus (P), ammonium (NH4-N), nitrates (NO3-N), total N, K, calcium (Ca), iron (Fe), zinc (Zn), and organic matter (OM) with pecan yield, kernel weight, total content of oils, linoleic acid, and linolenic acid [11]. In addition, researchers have identified relationships between major soil properties, such as moisture content and bulk density with Ca, Mg, K, and total carbon (C), as well as EC with NO3-N, and porosity with NH4-N [12]. On the other hand, different types of weed coverage are known to beneficially affect the physical, chemical, and biological properties of soil, such as OM, moisture, nutrients, and plant-beneficial microorganisms [13,14].
Furthermore, low fertilizer efficiency (N: 30–50%, P: 15–20%, K:  ~19%, S: 8–10%, and for micronutrient: 1–2 %) causes a negative nutritional balance in the soil, deteriorating its health [15,16,17]. The history of plant nutrition is divided into three stages or waves. The first is based on traditional practices, including the use of organic nutrition such as manure and compost, along with ashes and crop rotation [18,19,20]. The second wave relies on inorganic fertilizers, resulting in diminished soil fertility and heightened soil salinity and alkalinity [18,19,21]. The third wave focuses on efficient, sustainable, and resilient agriculture based on nanoparticles and colloids as alternatives, which typically act as slow-release fertilizers, enhance the availability, bioavailability, solubility, and distribution of insoluble nutrients to minimize nutrient losses [22,23,24]. In soybean plants (Glycine max), the effect of adding a colloidal solution of metallic nanoparticles (Mn, Cu, Zn, Ag, Fe) to plant nutrition was evaluated, where an increase in yield of 1.5–3 t∙ha−1 was observed [25]. In eggplant (Solanum melongena), the Fusarium oxysporum disease index decreased by 15.62% when Fe2O3 nanoparticles were added. These nanoparticles significantly increased the amounts of total carbohydrates, total soluble proteins, total phenols, antioxidant enzyme activity, chlorophyll a and b, and carotenoids [26]. On the other hand, Rios et al. (2021) found that using nanoencapsulated H3BO3 on almond trees (Prunus dulcis) increased boron levels and improved water absorption and movement by activating aquaporins [27]. In pomegranate (Punica granatum), foliar application of nanoparticles of B and Zn enhanced fruit yield and enriched total anthocyanins and total soluble sugars in fruits [28]. Gu et al., 2021 applied an organic fertilizer based on colloidal biochar to tomato plants (Solanum lycopersicum); they found that it increased soil cation exchange capacity (CEC) value, NO3-N, available K and P content, as well as this fertilizer presented synergy with growth-promoting bacteria [29]. Adding K-incorporated chitosan nanoparticles to corn soils made the soil better physically by making it more porous, better at transferring water, and more friable, all of which helped roots grow [30]. On the other hand, copper oxide nanoparticles had no effect on bacterial communities in pecan rhizospheric soil in microcosms; therefore, there was no change in N and S cycles, but they did improve the soil’s Cu content [31]. Although nanoparticles and colloids have been found to improve soil, fruit, and plant quality, as well as reduce damage from pathogens, there are still few studies evaluating the effects in vivo of nanoparticles on soil health in trees such as pecans. The aim of this study was to assess the impact of colloidal nutrition on key physical, chemical, and biological soil health parameters in pecan tree cultivation.

2. Materials and Methods

2.1. Study Area

The experimental site was in the city of Jimenez, Chihuahua, Mexico (27° 7′ 48” N, 104° 55′ 24” W). The climate is semi-arid, with an average annual temperature of 18.7 °C, an average of 61 rainy days per year, a relative humidity of 45%, and annual rainfall averaging 374.1 mm. The experiment was conducted during the 2020 and 2021 growing seasons. Detailed monthly temperature data are provided in Supplementary Figure S1. The soil at the site is classified as clay loam in texture, according to the USDA soil taxonomy [32].

2.2. Plant Materials and Their Origins

The soil was selected from 30-year-old pecan trees of the Western and Wichita varieties (80:20 ratio), where two completely randomized design treatments had been applied for 20 years: colloidal and conventional. The sites were irrigated with water from different water wells, and the analysis of the parameters of each water is provided in Table S1. The application rates of N, P, K, Ca, Mg, Zn, Fe, Mn, and fulvic and humic acids, as well as the edaphic and foliar application doses of colloidal treatment conducted from January to July annually, are summarized in Table S2. The conventional treatment’s soil received 200 kg of N (NH4)2SO4) and 20 t of cattle manure as fertilizer for hectare each year, which is the traditional management used in the region. Sampling was conducted in August 2020 and April 2021 to evaluate physical, chemical, organic matter and saturated paste extract properties, whereas humic and fulvic acids, heavy metal content, and the detection of bacteria, fungi, and nematodes were analyzed exclusively in August 2020. Sampling included three randomly sampled soil replicates (0–30 cm deep), each consisting of a set of five subsamples taken at one meter from a tree.

2.3. Data Acquisition

The samples included 1000 g of soil that were analyzed for saturation points, field capacity, permanent wilting point, hydraulic conductivity, bulk density (paraffin-clod method), available water content, available water depth, pH (measured using a pH meter, 1:2 water), electrical conductivity (measured using a conductivity meter), total carbonates, cation exchange capacity (CEC), nitrogen as nitrate (NO3-N), phosphorus (P Olsen method [33]), K, Ca, Mg, Na (measured using the ammonium acetate method [34]), Fe, Cu, Zn, Mn (measured using the DTPA method [35]), organic matter (Walkley and Black method [36]), and humic and fulvic acids according to Royal Decree 1110/1991 [37]. For the saturated paste extract, 2000 g of soil was used. Soil respiration was measured using 500 g of sample by the static incubation method with NaOH traps [38]. To identify bacteria, fungi, and nematodes, 10 to 20 subsamples were collected and combined into a 1000 g composite sample. The plant pathogenic bacteria were identified using morphological, physiological, and biochemical tests based on the manual for systematic identification of common bacteria [39]. Fungal identification was performed using isolation techniques with semiselective and selective culture media, along with incubation in a moist chamber. The isolated fungi were subsequently identified according to their morphological characteristics using taxonomic keys [40]. For nematodes, the sieving–centrifugation technique was used [41]. The above analyses were carried out by service in the Fertilab® laboratory (Fertilidad de Suelos S. de R.L.; Celaya, Guanajuato, Mexico). It holds accreditation under the Mexican standard NMX-EC-17025-IMNC-2018, ensuring the quality and reliability of laboratory studies. Heavy metals (Al, As, Ba, Be, Cd, Co, Cr, Hg, Na, and Pb) were quantified using inductively coupled plasma optical emission spectroscopy (ICP-OES) by taking 0.5 g of sample. The Center for Research in Advanced Materials S.C. (CIMAV, Centro de Investigación de Materiales Avanzados S.C.; Chihuahua, Chihuahua, Mexico) provided the service, which has the ISO/IEC 17025 standard that guarantees the precision and reliability of its test and calibration results.

2.4. Data Analysis

All data analyses were performed using resources developed in R language (v.4.4.1). The initial step in the principal component analysis was to perform a data transformation using Log10(x + 1) to reduce dispersion and normalize the data. Subsequently, principal components were calculated (PCA) using the prcomp tool from the Stats package (v.4.4.1), and a plot was generated using the fviz_pca_biplot utility from the factoextra package (v.1.0.7). Data underwent normality assessment via the Shapiro–Wilk test, while homogeneity was evaluated using the Levene test using Car (v.3.1-3) and Stats (v.4.4.1) packages. The chemical, physical, and biological properties of the soil were assessed utilizing the Agricolae (v.1.3-7) and Stats (v.4.4.1) software packages. A t-test (p < 0.10) was employed, considering nutrition type as a variable for the 2020 dataset, while a one-way ANOVA was conducted with nutrition as factors (levels colloidal 2020, colloidal 2021, conventional 2020 and conventional 2021) for the 2020–2021 dataset. Fisher’s LSD test was used to determine significant differences between group comparisons (p < 0.10). Figures were plotted with ggplot2 (v.3.5.1).

3. Results and Discussion

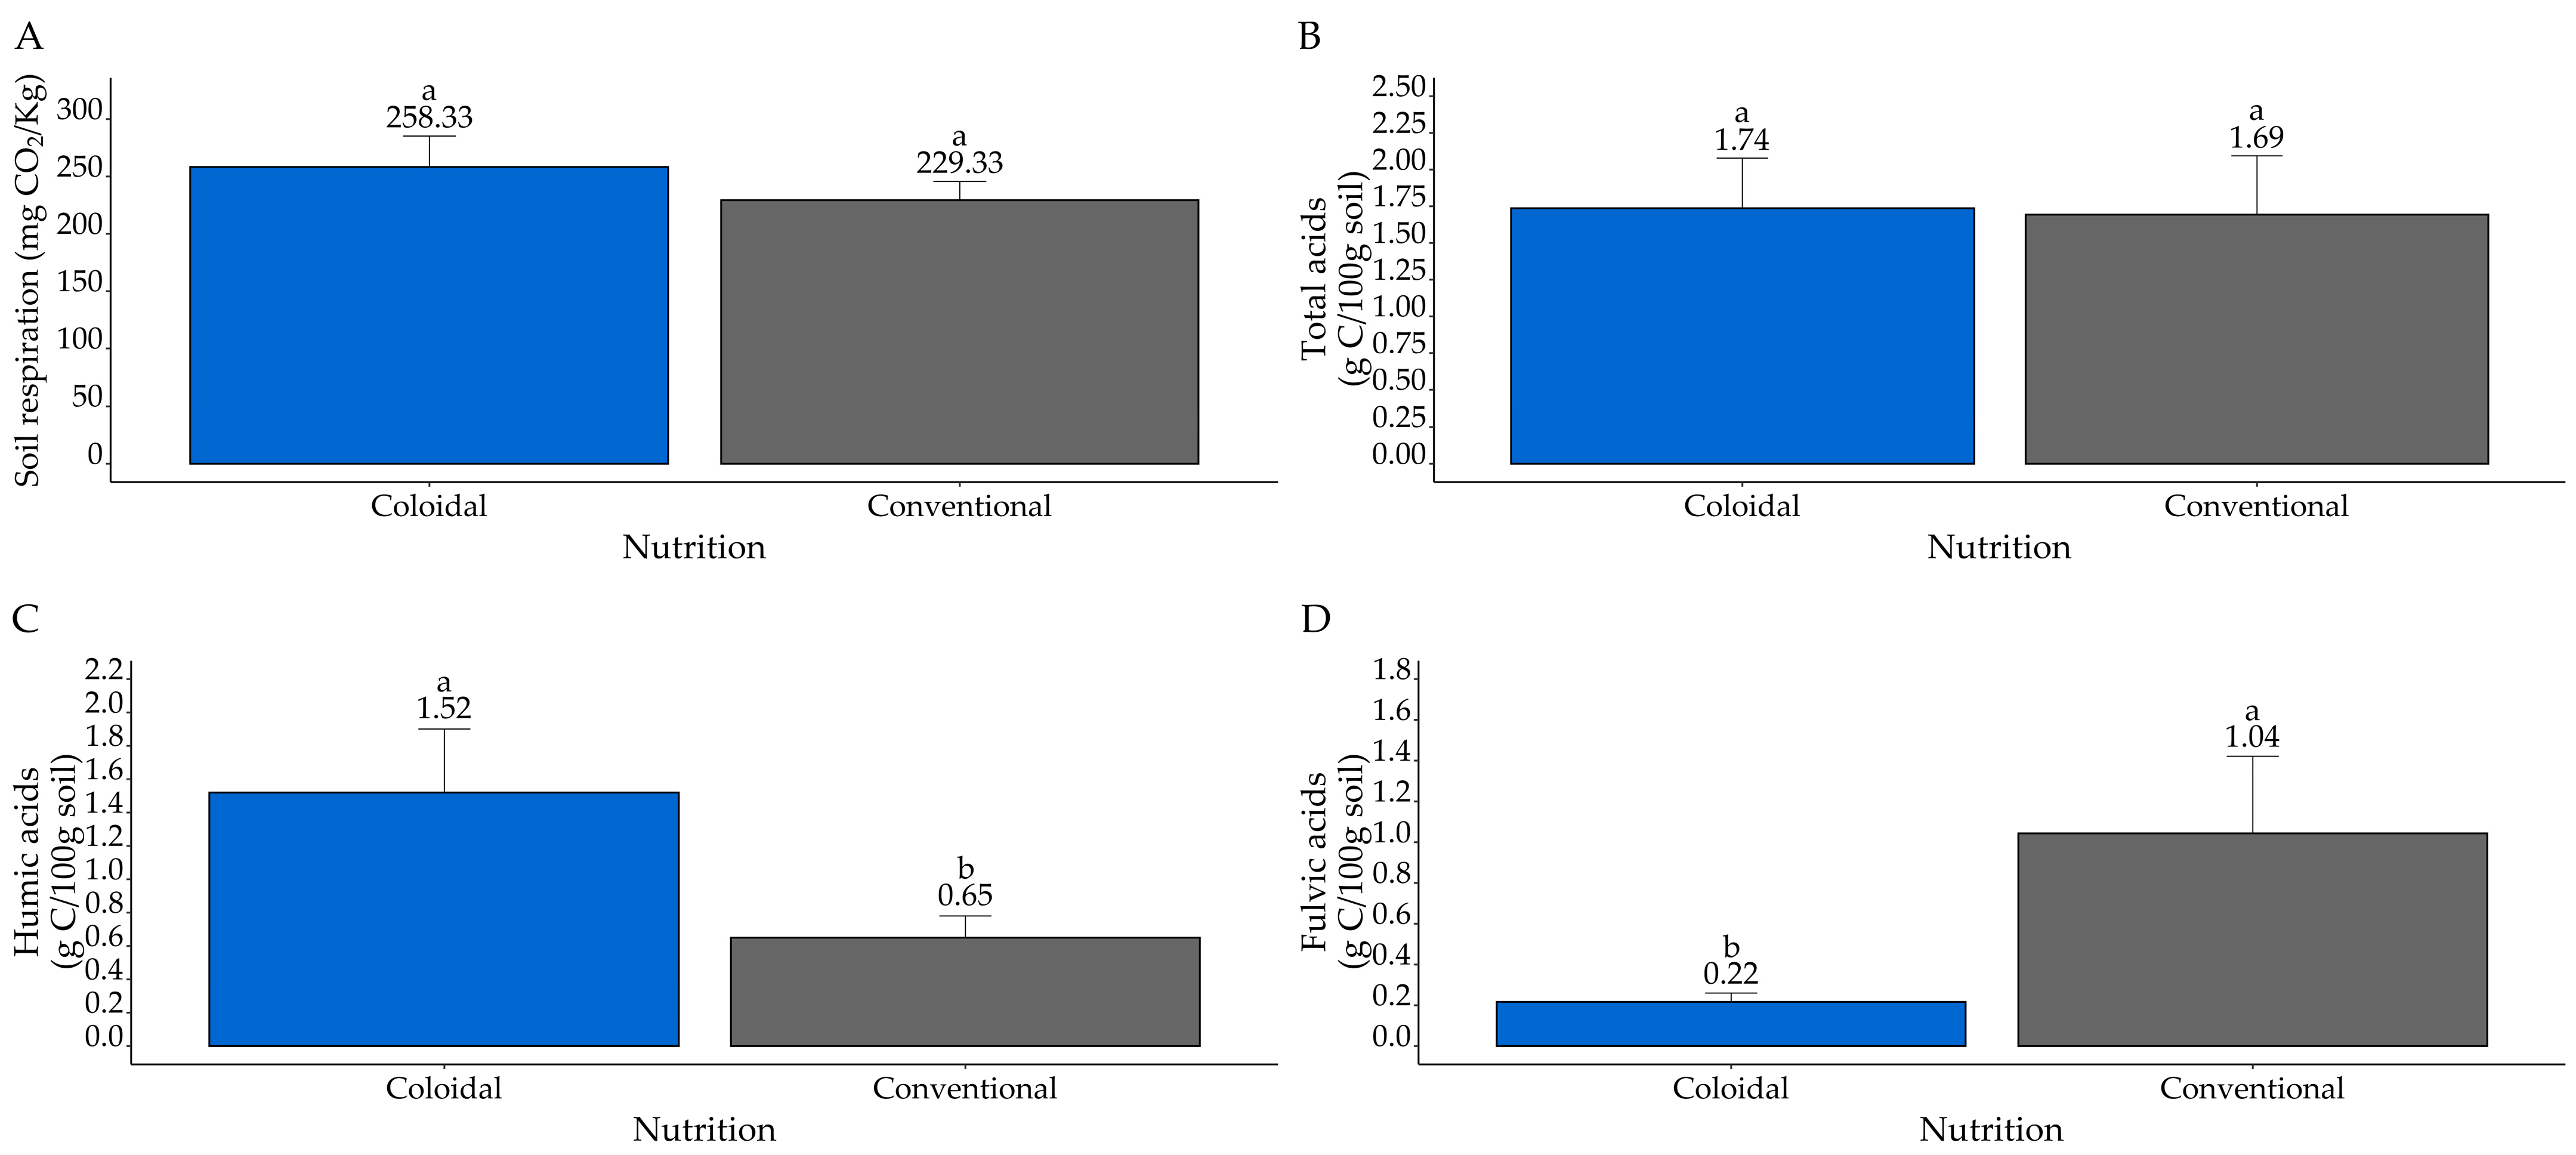
3.1. Soil Health Parameters in 2020

The application of colloidal nutrition can impact the physical, chemical, and biological properties of the soil, which is a fundamental step toward improving nutritional management and soil health [42]. Figure 1 compares soil health metrics, such as soil respiration, total acids, humic acids, and fulvic acids, between two different nutritional treatments. There was no statistically significant difference between the two treatments for the soil respiration rate (Figure 1A), which is a sign of microbial activity. Both nutritional treatments showed similar levels of total acid content in the soils (Figure 1B). The concentration of humic acids is significantly higher in the colloidal treatment than in the conventional treatment (Figure 1C). Researchers have associated humic acids with enhanced plant growth, crop yield, nutrient uptake, and the mitigation of heavy metal contamination [43,44,45,46,47,48]. Conversely, colloidal treatment exhibits a lower content of fulvic acids than the conventional treatment, a difference that is statistically significant (Figure 1D). This might be because fulvic acids are only applied to the leaves for colloidal nutrition, so they absorbed in the leaves, and the soil is likely to have a lower concentration.
Similar levels of Rhizoctonia solani, Verticillium albo-atrum, Fusarium solani, Fusarium oxysporum, and Pythium spp. were identified between treatments, which showed no statistically significant differences. On the other hand, in the soil of conventional treatment, Cylindrocarpon destructans was exclusively detected, while the colloidal treatment exclusively detected Fusarium longipes and Phytophthora spp. Conversely, both treatments detected beneficial fungi, such as Trichoderma spp.; there were no statistically significant differences (Table 1). Researchers have identified Trichoderma spp. as a biocontrol agent against phytopathogens, a growth promoter, and a bioremediation agent in pecan and other crop soils [49,50,51,52].
The abundance of nematode species under two distinct soil treatments, colloidal and conventional, was evaluated (Table 2). The conventional soil treatment contained species such as Meloidogyne spp., Psilenchus spp., Tylenchus spp., Tylenchulus spp., and Tylenchorhynchus spp. Free-living nematodes do not show difference between the colloidal treatment compared to conventional treatment. Free-living nematodes contribute to the release of nutrients, soil structuring, water retention capacity, and the balance of fungi and bacteria, according to observations [53,54]. Several nematodes, including Criconemella spp., Meloidogyne spp., Pratylenchus spp., Tylenchus spp., and Tylenchorhynchus spp., are known to cause severe damage in pecan trees [55,56,57]. Notably, Meloidogyne spp., Tylenchus spp., and Tylenchorhynchus spp. were detected exclusively in the conventional treatment. This suggests a possible shift in nematode community composition between treatments.
Sodium and heavy metal levels in different soil nutritional treatments were compared (Figure 2). The results showed that As, Be, Cd, Co, Hg, and Pb were not detected. Additionally, conventional and colloidal nutrition exhibited similar effects on Al, Ba, Cr, and Na levels, with no statistically significant differences observed. However, for both treatments, Ba and Cr levels remained below the maximum permissible limits established by the World Health Organization (WHO), with Cr < 100 ppm and Ba < 302 ppm [58]. On the other hand, Al is a natural soil component found in concentrations ranging from 10,000 to 300,000 ppm; however, it becomes toxic in acidic soils (pH < 5.5), leading to reduced crop productivity [59,60]. These results suggest that colloidal nutrition contributes to maintaining low levels of certain heavy metals.

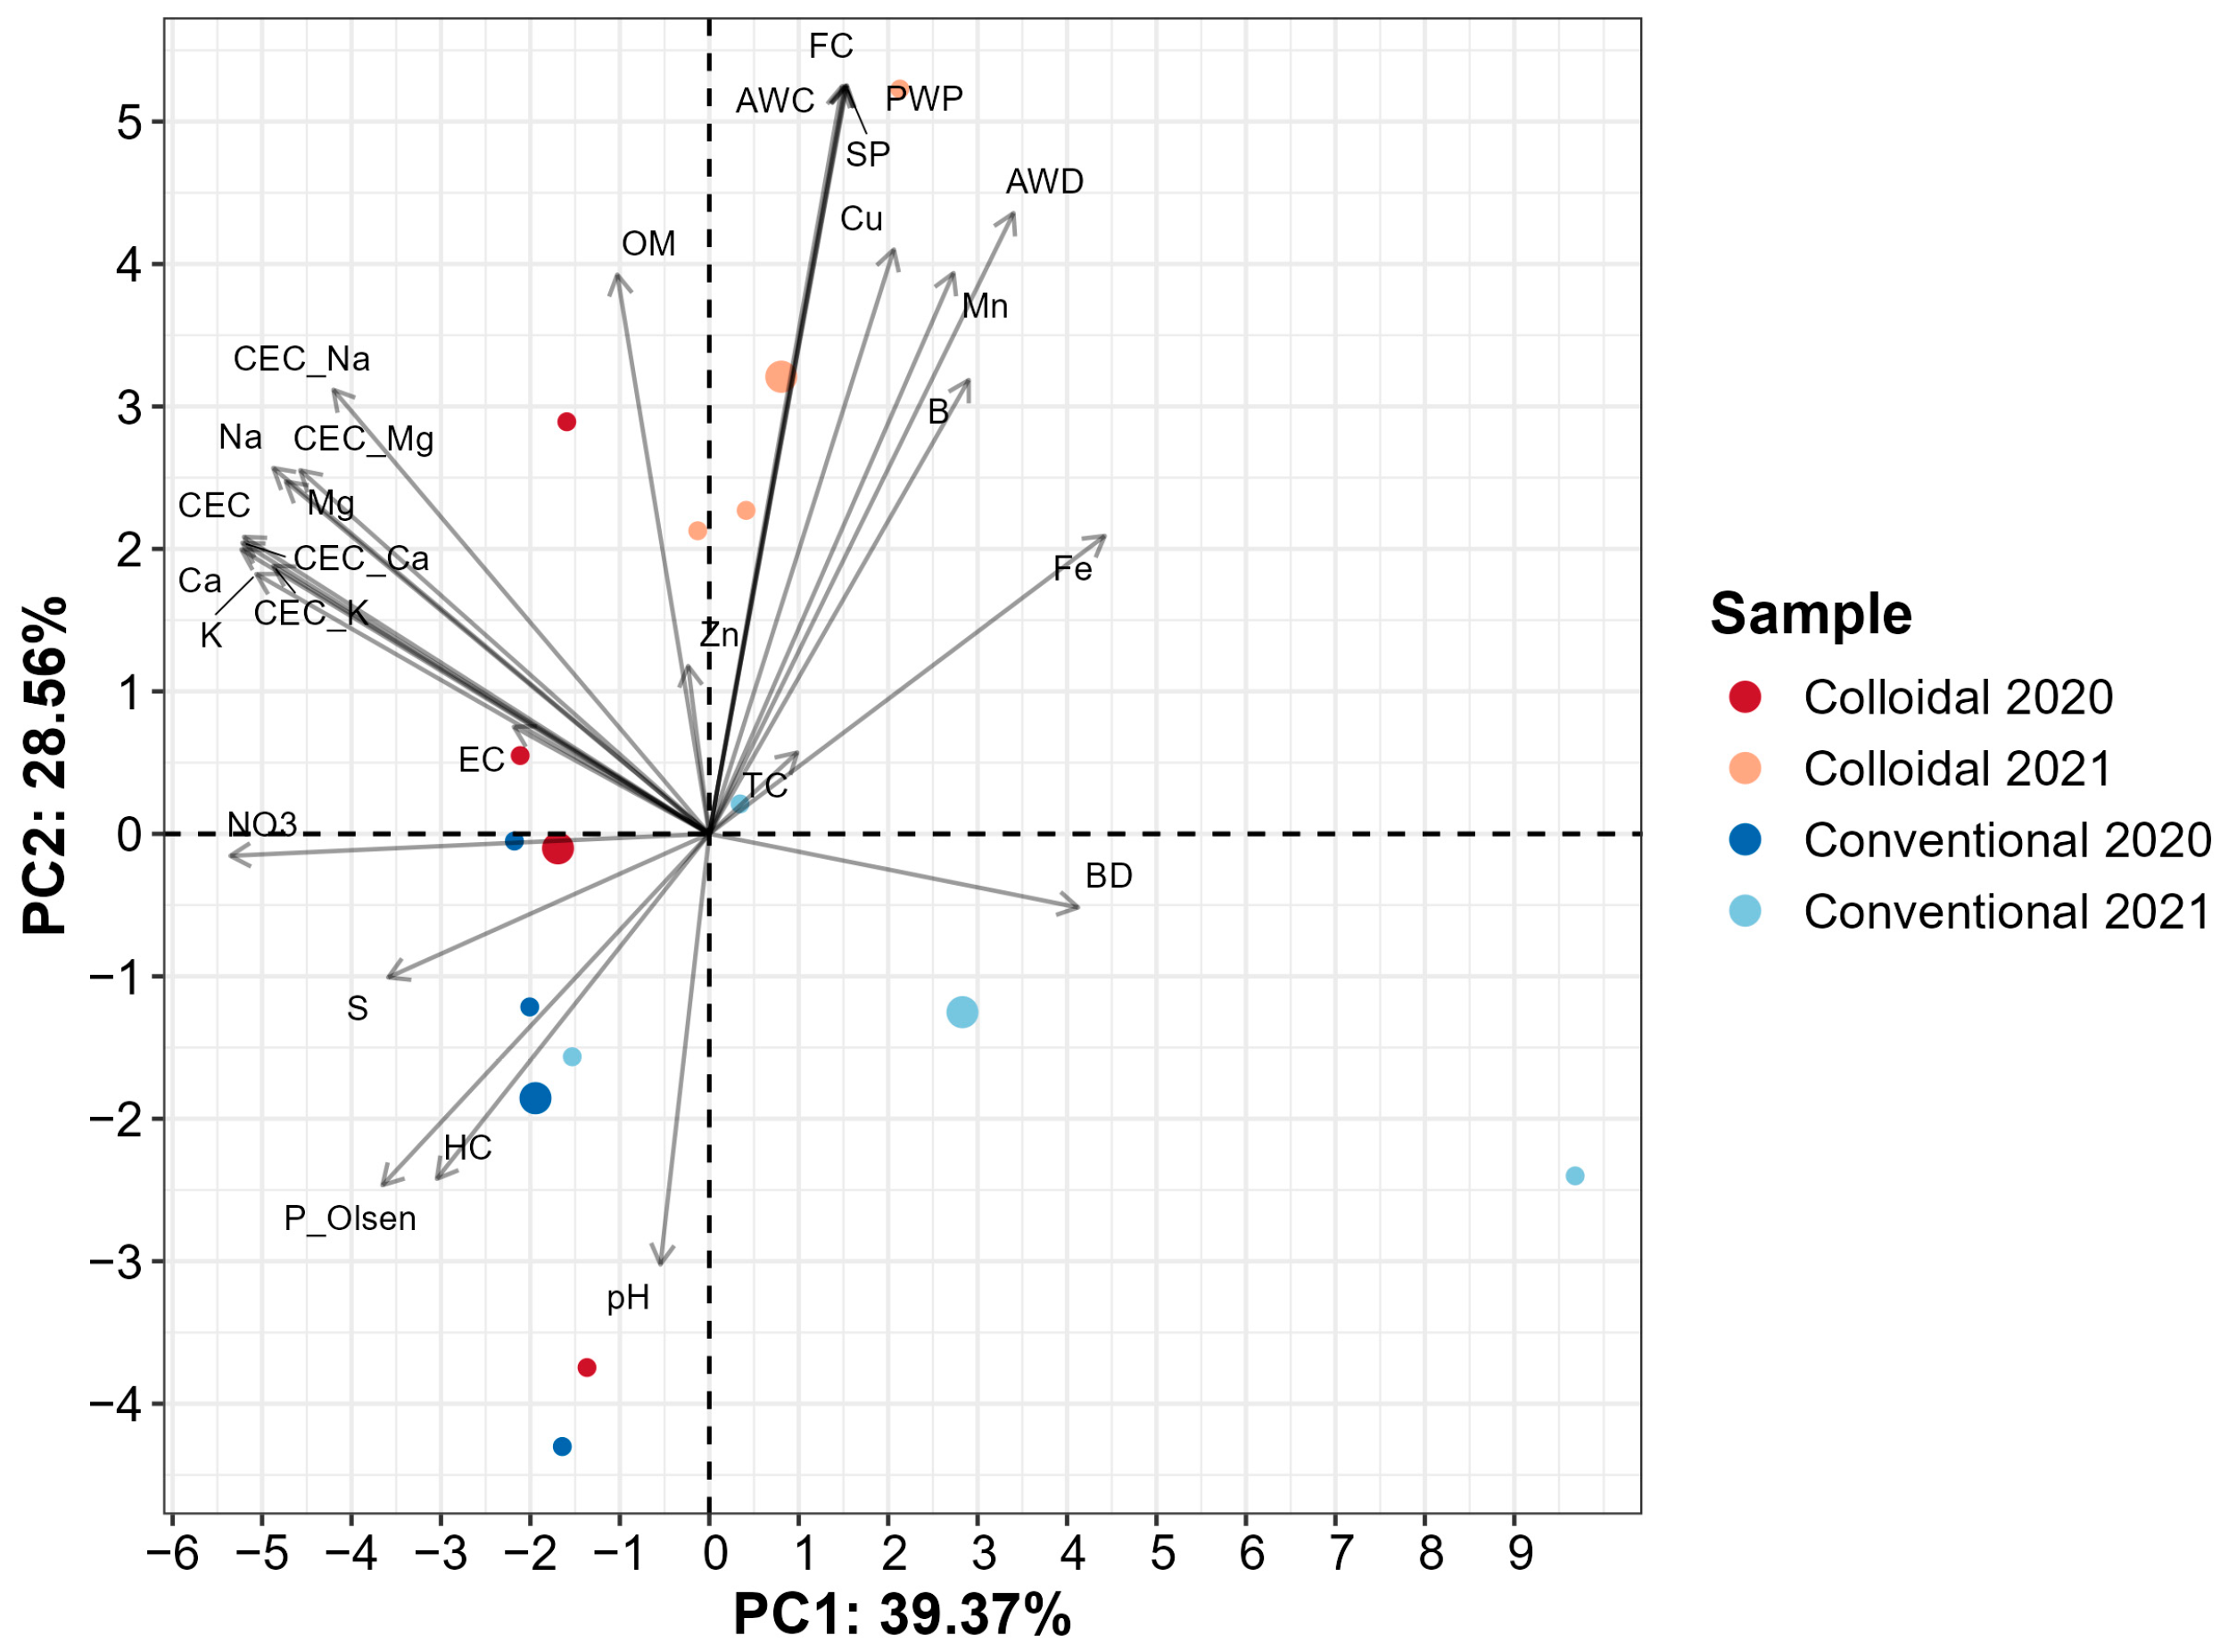
3.2. Soil Health Parameters for theYears 2020 and 2021

Physical, chemical, and biological soil analyses were carried out in August 2020 and April 2021 to determine the parameters before and after the harvest of pecan kernels. Principal Component Analysis was able to show 67.93% of the variation in the data, which was enough to show the complex relationships between variables and observations (Figure 3). Conventional and colloidal management systems show distinct patterns, especially between the years 2020 and 2021, suggesting an effect of both treatment and temporal variation on soil characteristics. The graph clearly shows that colloidal samples are grouped together in the upper quadrant, while conventional samples are spread out in the lower quadrant. The 2021 colloidal treatment stood out more by being grouped away from the other treatments. The variables contributing to PC1 were NO3, Ca, CEC_Ca, CEC, K, CEC_K, Na, Mg, CEC_Mg, Fe, CEC_Na, and BD, while the variables PWP, FC, AWC, SP, AWD, OM, Cu, Mn, B, CEC_Na, and pH contribute to the variation indicated in PC2 (Figure 3).
The effects of colloidal and conventional strategies on a variety of soil physical and chemical properties over a two-year period (2020 and 2021) are illustrated in Figure 4. The saturation point, field capacity, permanent wilting point, and available water did not show significant differences, but the colloidal treatment indicated a tendency toward higher values than the conventional treatment in both years (Figure 4A–D). The depth of available water for colloidal treatment in 2021 was significantly higher than in 2020, but conventional treatment exhibited no variation between 2020 and 2021, signifying an enhancement in water availability for the colloidal treatment (Figure 4E). This meant that the colloidal treatment retained more water when it was saturated, made more water available, and raised the soil moisture level, so plants could still receive enough water to keep their bodies working and attain a higher percentage of plant-accessible water. These water storage parameters provide a direct measure of the improvement in the soil’s capacity to store water [61,62,63]. Hydraulic conductivity displayed no significant differences across treatments or years, suggesting similar water transmission capacity in both treatments (Figure 4F). The conventional treatments had slightly higher bulk density values, but the differences were not statistically significant, indicating comparable soil compaction capacity across treatments (Figure 4G). This has been seen in another study where density did not show differences between soils with high and low fertility [64]. In terms of soil pH, colloidal had a slightly lower value in 2020 compared to conventional treatments, but this difference was not statistically significant in 2021, suggesting stable pH levels (Figure 4H). The pH is a crucial parameter since it allows plants to assimilate nutrients. pH < 6.5 usually causes toxic concentrations of Al and Mn, and pH > 7.5 identified in this study indicates a slight alkalinity [65,66]. Electrical conductivity (EC) had a significant reduction from 2020 to 2021 with colloidal treatment, while conventional treatment showed no changes (Figure 4I). EC indicates the amount of ions (dissolved salts) present in the soil solution. Excessive salt content severely affects plant growth and soil–water balance, where values between 0 and 0.9 dS/m are acceptable for general crop growth [67,68]. This indicates that the colloidal treatment in 2021 was the only one below the desired EC level. Also, the EC level was higher in the irrigation water that was used for colloidal treatment than in the water that was used for conventional nutrition (Table S1). However, the soil that received colloidal nutrition had a lower EC level. This implies that colloidal nutrition maintains a low EC level. Finally, total carbonates did not show significant differences between the two nutrition types (Figure 4J). However, the irrigation method used for colloidal nutrition (Table S1) contains more bicarbonates (464 ppm) than the one used for conventional nutrition (281 ppm). Despite this difference in bicarbonate levels, total carbonates remained stable in soils with colloidal nutrition from 2020 to 2021. Overall, the colloidal treatment showed low salinity and water retention properties better, like available water depth.
The analysis of nutrient concentrations across different treatments and years reveals distinct trends in the nutrient content of samples (Table 3). The concentration of NO3-N exhibited a significant decline from 2020 to 2021 in conventional treatment; however, colloidal treatments appear to offer an advantage in NO3-N retention, as no significant decrease in NO3-N content was observed. This aligns with findings that nitrogen loss via leaching and volatilization is common in conventional practices that may not sustain nitrogen availability effectively [69,70]. P exhibited a decreasing trend over the years, with conventional nutrition showing higher levels in 2020 compared to colloidal nutrition. No significant differences were observed for K, Ca, Mg, Zn, Cu, and Fe across treatments and years, suggesting stable concentrations across conditions. The S concentration showed a significant reduction in both 2021 samples compared to 2020. Notable increases were observed in Mn and B concentrations, with a significant increase in colloidal 2021 compared to the other treatments. In 2021, samples that were treated with colloidal had higher levels of Na compared to conventional nutrition. This might be because irrigation water (Table S1) from the colloidal treatment has 74.50 ppm of Na in it, while water from the conventional treatment only had 25.00 ppm of Na. The results showed no differences in CEC, with values classified as high (25–40 meq/100 g). This parameter indicates that the soils have excellent nutrient retention by binding to soil colloids and avoiding the loss of cations [71]. Statistical differences were observed only in the base saturation of Mg and K, with the conventional treatment in 2021 showing with the highest values recorded. These findings align with the optimal saturation percentages proposed by soil scientists, which are 65% to 75% for calcium, 10% to 15% for magnesium, and 2.5% to 7% for potassium (Table 3) [72]. The Ca:Mg and Ca:K ratios exhibited lower values in the conventional treatment in 2021, suggesting altered nutrient dynamics. The Mg:K and Ca+Mg:K ratios remained relatively stable, indicating a balanced nutrient composition across treatments. The most common cation interactions include those between K, Na, Ca, and Mg, where an excess of one nutrient can interfere with plant uptake of others. The ideal ratios of Ca:Mg, Ca:K, and Mg:K have been established as 6.5, 13, and 2, respectively [73,74,75]. Maintaining the proportions of these cations is ideal for providing useful soils for plant growth and development [76]. A study in peanuts found that high applications of Mg reduced Ca and Zn uptake, impairing seed development [77]. Conversely, excess potassium in sugarcane suppresses the absorption of Ca and Mg, resulting in lower values in the leaves [78]. This highlights the importance of knowing the proportions of cations present in the soil, which in this study were to like the ideal levels reported for fertile soils.
Figure 5 illustrates the impact of two nutrient treatments, colloidal and conventional, on the percentage of organic matter in soil samples over a two-year period (2020 and 2021). In 2021, the data indicate that colloidal treatments consistently maintained higher organic matter levels compared to the conventional. Conventional treatment values (2020: 1.71% and 2021: 1.21%) indicate a medium structural state and stability, whereas colloidal nutrition values (2020: 2.10% and 2021: 2.11%) indicate a high structural state and stability [73]. In addition, the soil typically contains 1–5% organic matter, which serves as a reservoir for N and C inside the soil. Tong et al. (2024) observed that organic matter content is positively correlated with nut mass, kernel weight, nut vertical diameter, oil content, linoleic acid, and alpha-linolenic acid [11]. Higher organic matter content is associated with reduced erosion and runoff, improved soil aggregation and nutrient cycling, and improved water infiltration, movement, and retention [79,80].

3.3. Saturated Paste Extracts for the Years 2020 and 2021

Different properties of the soil paste extract were evaluated; this analysis allows the evaluation of the availability of nutrients and salinity in the soil [81,82]. The results are shown in Table 4. In 2020, the conventional samples exhibited the highest Electrical Conductivity of a saturated soil Extract (ECe) value, indicating statistical differences. The colloidal samples yielded the highest SAR (sodium adsorption ratio) values. In 2021, samples exhibited similar pH behavior, while the conventional sample from 2020 showed a lower pH. ECe, SAR, and pH are values indicating soil salinity or alkalinity where values less than 2 dS/m for Ece, SAR less than 4 dS/m, and pH from 6 to 8 are ideal [83,84,85]. The amounts of NO3-N, SO4-S, Ca, and Mg were all significantly different. These properties behaved similarly, with values decreasing from 2020 to 2021 in the conventional treatment but remaining stable in the colloidal treatment. The evidence suggests that colloidal treatment maintains greater availability of these nutrients, preventing them from being carried away by water to deeper layers of the soil [86]. No differences were observed for PO4-P, CO3, K, Cu, B, and K content. Cl levels increased similarly in both samples from 2020 to 2021, with the highest value in the conventional 2021 treatment. The HCO3 and Na contents showed the same behavior, where the colloidal 2021 treatment displayed the highest value. The high levels of HCO3 (281 ppm vs. 464 ppm colloidal) and Na (26 ppm vs. 74.50 ppm colloidal) in the irrigation water could explain this trend. Studies often link the salinity sources to the quality of irrigation water [87]. Fe and Mn concentrations did not show differences between treatments and years. Finally, the concentration of Zn increased in both samples from 2020 to 2021, with a higher level in the conventional 2021 sample.

4. Conclusions

This study shows the comparison of various physical, chemical, and biological parameters of a pecan orchard soil under conventional and colloidal nutrition treatments. The soil that received colloidal nutrition showed ideal levels of EC, total carbonates, eEC, and SAR, despite having been irrigated with water of elevated salinity. It also showed improvements in organic matter content, humic acids, and water retention. Notably, pathogens such as C. destructans, Meloidogyne spp., Psilenchus spp., Tylenchus spp., Tylenchulus spp., and Tylenchorhynchus spp. were not detected in soils treated with colloidal nutrition. The results suggest that pecan growers should consider colloidal nutrition as a soil management strategy to improve soil health, especially in orchards irrigated with saline-laden water. Furthermore, the importance of conducting studies evaluating these physical, chemical, and biological parameters with a larger number of samples over a period of more than two years to validate the findings is highlighted.

Supplementary Materials

The following supporting information can be downloaded at: https://www.mdpi.com/article/10.3390/agriculture15111201/s1, Figure S1: Monthly climatic conditions recorded at the experimental site from May 2020 to December 2021; Table S1: Water analysis for irrigation of conventional and colloidal treatment; Table S2: The edaphic and foliar plans used in colloidal treatment.

Author Contributions

Conceptualization, R.G.L.-C. and L.A.L.-R.; Data curation, R.G.L.-C. and B.E.M.-M.; Formal analysis, B.E.M.-M.; Funding acquisition, L.A.L.-R.; Investigation, R.G.L.-C., L.A. and N.V.-B.; Methodology, R.G.L.-C., B.E.M.-M., L.A. and N.V.-B.; Project administration, R.G.L.-C.; Resources, R.G.L.-C., B.E.M.-M. and L.A.L.-R.; Software, B.E.M.-M.; Supervision, R.G.L.-C. and L.A.L.-R.; Validation, R.G.L.-C., L.A. and N.V.-B.; Visualization, B.E.M.-M.; Writing—original draft, B.E.M.-M.; Writing—review and editing, R.G.L.-C., L.A., N.V.-B. and L.A.L.-R. All authors have read and agreed to the published version of the manuscript.

Funding

The authors declare that they received financial support from Bioteksa S.A. de C.V. to cover the costs associated with soil analysis services and the publication of this article.

Institutional Review Board Statement

Not applicable.

Data Availability Statement

The original contributions presented in the study are included in the article; further inquiries can be directed to the corresponding author.

Acknowledgments

The authors thank Grupo Real Torio for kindly providing access to the study fields, personnel for managing the orchards, and applying the treatments.

Conflicts of Interest

The authors Rubén Gerardo León-Chan, Brandon Estefano Morales-Merida, Luis Amarillas, and Nancy Varela-Bojórquez are employees of the company Bioteksa S.A. de C.V. Luis Alberto Lightbourn-Rojas is the inventor of the NUBIOTEK® nutrition products used in this study.

References

  1. Rüter, B.; Hamrick, J.L.; Wood, B.W. Genetic diversity within provenance and cultivar germplasm collections versus natural populations of pecan (Carya illinoinensis). J. Hered. 1999, 90, 521–528. [Google Scholar] [CrossRef]
  2. Grauke, L.J.; Wood, B.W.; Harris, M.K. Crop vulnerability: Carya. HortScience 2016, 51, 653–663. [Google Scholar] [CrossRef]
  3. Wetzstein, H.Y.; Rodriguez, A.P.M.; Burns, J.A.; Magner, H.N. Carya illinoensis (Pecan). In Trees IV.; Springer: Berlin/Heidelberg, Germany, 1996; Volume 35, pp. 50–75. ISBN 0934-943X. [Google Scholar]
  4. Orona-Castillo, I.; Sangerman-Jarquín, D.M.; Cervantes-Vázquez, M.G.; Espinoza-Arellano, J.d.J.; Núñez-Moreno, J.H. The production and commercialization of pecan nut in Mexico. Rev. Mex. Cienc. Agric. 2019, 10, 1797–1808. [Google Scholar] [CrossRef]
  5. Servicio de Información Agroalimentaria y Pesquera, S. Anuario Estadístico de La Producción Agrícola. Available online: https://nube.agricultura.gob.mx/cierre_agricola/ (accessed on 3 February 2025).
  6. Osman, K.T. Poorly Fertile Soils; Springer: Cham, Switzerland, 2018; ISBN 9783319755274. [Google Scholar]
  7. Ibragimov, O.; Domuladjanov, I.; Domuladjonova, S. Soil fertility in agriculture: Main tasks. E3S Web Conf. 2023, 431, 01057. [Google Scholar] [CrossRef]
  8. Warudkar, G.; Dorle, S. Review on sensing the fertility characteristics of agriculture soils. In Proceedings of the 2016 International Conference on Information Communication and Embedded Systems (ICICES), Chennai, India, 25–26 February 2016; pp. 1–6. [Google Scholar] [CrossRef]
  9. Chandra, H.; Pawar, P.M.; Elakkiya, R.; Tamizharasan, P.S.; Muthalagu, R.; Panthakkan, A. Explainable Al for soil fertility prediction. IEEE Access 2023, 11, 97866–97878. [Google Scholar] [CrossRef]
  10. Wells, M.L. Pecan nutrient element status and orchard soil fertility in the southeastern coastal plain of the United States. Horttechnology 2009, 19, 432–438. [Google Scholar] [CrossRef]
  11. Tong, Y.; Wang, Z.; Gong, D.; Huang, C.; Ma, X.; Ma, X.; Yuan, F.; Fu, S.; Feng, C. Enhancing soil fertility and elevating pecan fruit quality through combined chemical and organic fertilization practices. Horticulturae 2024, 10, 25. [Google Scholar] [CrossRef]
  12. Wang, Z.; Zhou, M.; Liu, H.; Huang, C.; Ma, Y.; Ge, H.; Ge, X.; Fu, S. Pecan agroforestry systems improve soil quality by stimulating enzyme activity. PeerJ 2022, 10, e12663. [Google Scholar] [CrossRef]
  13. Díaz, G.M. Effect of weeds as coverts in soil fertility and pecanal walnut yield. Rev. Mex. Cienc. Agrícolas Vol. 2019, 10, 123–130. [Google Scholar]
  14. Rodriguez-Ramos, J.C.; Scott, N.; Marty, J.; Kaiser, D.; Hale, L. Cover crops enhance resource availability for soil microorganisms in a pecan orchard. Agric. Ecosyst. Environ. 2022, 337, 108049. [Google Scholar] [CrossRef]
  15. Baligar, V.C.; Fageria, N.K.; He, Z.L. Nutrient use efficiency in plants. Commun. Soil. Sci. Plant Anal. 2001, 32, 37–41. [Google Scholar] [CrossRef]
  16. Adhikari, S.; Anuragi, H.; Chandra, K.; Tarte, S.H.; Dhaka, S.R.; Jatav, H.S.; Hingonia, K. Molecular Basis of Plant Nutrient Use Efficiency—Concepts and Challenges for Its Improvement; Elsevier: Amsterdam, Netherlands, 2022; ISBN 9780443186752. [Google Scholar]
  17. Dhillon, J.S.; Eickhoff, E.M.; Mullen, R.W.; Raun, W.R. World potassium use efficiency in cereal crops. Agron. J. 2019, 111, 889–896. [Google Scholar] [CrossRef]
  18. Priya, E.; Sarkar, S.; Maji, P.K. A review on slow-release fertilizer: Nutrient release mechanism and agricultural sustainability. J. Environ. Chem. Eng. 2024, 12, 113211. [Google Scholar] [CrossRef]
  19. Asadu, C.O.; Ezema, C.A.; Ekwueme, B.N.; Onu, C.E.; Onoh, I.M.; Adejoh, T.; Ezeorba, T.P.C.; Ogbonna, C.C.; Otuh, P.I.; Okoye, J.O.; et al. Enhanced efficiency fertilizers: Overview of production methods, materials used, nutrients release mechanisms, benefits and considerations. Environ. Pollut. Manag. 2024, 1, 32–48. [Google Scholar] [CrossRef]
  20. Larramendy, M.; Soloneski, S. Organic Fertilizers; IntechOpen: Rijeka, Croatia, 2019; ISBN 978-1-78985-148-9. [Google Scholar]
  21. Brown, P.H.; Zhao, F.J.; Dobermann, A. What is a plant nutrient? Changing definitions to advance science and innovation in plant nutrition. Plant Soil. 2022, 476, 11–23. [Google Scholar] [CrossRef]
  22. Zahra, Z.; Habib, Z.; Hyun, H.; Shahzad, H.M.A. Overview on recent developments in the design, application, and impacts of nanofertilizers in agriculture. Sustainability 2022, 14, 9397. [Google Scholar] [CrossRef]
  23. Chugh, G.; Siddique, K.H.M.; Solaiman, Z.M. Nanobiotechnology for agriculture: Smart technology for combating nutrient deficiencies with nanotoxicity challenges. Sustainability 2021, 13, 1781. [Google Scholar] [CrossRef]
  24. Alemayehu, B.; Teshome, H. Soil colloids, types and their properties: A review. Open J. Bioinform. Biostat. 2021, 5, 008–113. [Google Scholar] [CrossRef]
  25. Batsmanova, L.; Taran, N.; Konotop, Y.; Kalenska, S.; Novytska, N. Use of a colloidal solution of metal and metal oxide-containing nanoparticles as fertilizer for increasing soybean productivity. J. Cent. Eur. Agric. 2020, 21, 311–319. [Google Scholar] [CrossRef]
  26. Elbasuney, S.; El-Sayyad, G.S.; Attia, M.S.; Abdelaziz, A.M. Ferric oxide colloid: Towards green nano-fertilizer for tomato plant with enhanced vegetative growth and immune response against Fusarium wilt disease. J. Inorg. Organomet. Polym. Mater. 2022, 32, 4270–4283. [Google Scholar] [CrossRef]
  27. Rios, J.J.; Lopez-Zaplana, A.; Bárzana, G.; Martinez-Alonso, A.; Carvajal, M. Foliar application of boron nanoencapsulated in almond trees allows B movement within tree and implements water uptake and transport involving aquaporins. Front. Plant Sci. 2021, 12, 752648. [Google Scholar] [CrossRef] [PubMed]
  28. Davarpanah, S.; Tehranifar, A.; Davarynejad, G.; Abadía, J.; Khorasani, R. Effects of foliar applications of zinc and boron nano-fertilizers on pomegranate (Punica granatum cv. ardestani) fruit yield and quality. Sci. Hortic. 2016, 210, 57–64. [Google Scholar] [CrossRef]
  29. Gu, S.; Lian, F.; Yang, H.; Han, Y.; Zhang, W.; Yang, F.; Gao, J. Synergic effect of microorganism and colloidal biochar-based organic fertilizer on the growth and fruit quality of tomato. Coatings 2021, 11, 1453. [Google Scholar] [CrossRef]
  30. Kubavat, D.; Trivedi, K.; Vaghela, P.; Prasad, K.; Vijay Anand, G.K.; Trivedi, H.; Patidar, R.; Chaudhari, J.; Andhariya, B.; Ghosh, A. Characterization of a chitosan-based sustained release nanofertilizer formulation used as a soil conditioner while simultaneously improving biomass production of Zea mays L. Land Degrad. Dev. 2020, 31, 2734–2746. [Google Scholar] [CrossRef]
  31. Salas-Leiva, J.; Salas-Leiva, D.E.; Tovar-Ramírez, D.; Herrera-Pérez, G.; Tarango-Rivero, S.; Luna-Velasco, A.; Orrantia-Borunda, E. Copper oxide nanoparticles slightly affect diversity and metabolic profiles of the prokaryotic community in pecan tree (Carya illinoinensis) rhizospheric soil. Appl. Soil. Ecol. 2021, 157, 103772. [Google Scholar] [CrossRef]
  32. Instituto Nacional de Estadística y Geografía (INEGI) Aspectos Geográficos de Chihuahua. 2022. Available online: https://www.inegi.org.mx/contenidos/productos/prod_serv/contenidos/espanol/bvinegi/productos/nueva_estruc/889463913375.pdf (accessed on 19 February 2025).
  33. Olsen, S.R. Estimation of Available Phosphorus in Soils by Extraction with Sodium Bicarbonate; US Department of Agriculture: Washington, DC, USA, 1954.
  34. Chapman, H.D. Cation-exchange capacity. In Methods of Soil Analysis: Part 2 Chemical and Microbiological Properties; Norman, A.G., Ed.; American Society of Agronomy, Soil Science Society of America: Madison, WI, USA, 1965; pp. 891–901. [Google Scholar]
  35. Lindsay, W.L.; Norvell, W.A. Development of a DTPA soil test for zinc, iron, manganese, and copper. Soil. Sci. Soc. Am. J. 1978, 42, 421–428. [Google Scholar] [CrossRef]
  36. Walkley, A.; Black, I.A. Determination of organic matter in the soil by chromic acid digestion. Soil. Sci. 1947, 63, 251–264. [Google Scholar] [CrossRef]
  37. Food and Agriculture Organization of the United Nations (FAO). Analysis of Organic Fertilizer Products. Available online: https://www.fao.org/faolex/results/details/es/c/LEX-FAOC010152 (accessed on 18 November 2024).
  38. Anderson, J.P.E. Soil respiration. In Methods of Soil Analysis; Agronomy Monographs; American Society of Agronomy: Madison, WI, USA, 1982; pp. 831–871. ISBN 9780891189770. [Google Scholar]
  39. Dong, X.Z.; Cai, M.Y. Manual for Systematic Identification of Common Bacteria; Science: Beijing, China, 2001; pp. 348–392. [Google Scholar]
  40. Ibtissem Ben Salem, N.E.A.; Mahmoud M’Hamdi, M.B.K.; M Hamdi, N.B. Isolation and identification of fungal communities in organic and conventional soils. Int. J. Curr. Microbiol. Appl. Sci. 2017, 6, 1111–1123. [Google Scholar] [CrossRef]
  41. McSorley, R.; Frederick, J.J. Effect of Extraction method on perceived composition of the soil nematode community. Appl. Soil. Ecol. 2004, 27, 55–63. [Google Scholar] [CrossRef]
  42. Nongbet, A.; Mishra, A.K.; Mohanta, Y.K.; Mahanta, S.; Ray, M.K.; Khan, M.; Baek, K.H.; Chakrabartty, I. Nanofertilizers: A smart and sustainable attribute to modern agriculture. Plants 2022, 11, 2587. [Google Scholar] [CrossRef]
  43. Wu, S.; Li, R.; Peng, S.; Liu, Q.; Zhu, X. Effect of humic acid on transformation of soil heavy metals. IOP Conf. Ser. Mater. Sci. Eng. 2017, 207, 012089. [Google Scholar] [CrossRef]
  44. He, X.; Zhang, H.; Li, J.; Yang, F.; Dai, W.; Xiang, C.; Zhang, M. The positive effects of humic/fulvic acid fertilizers on the quality of lemon fruits. Agronomy 2022, 12, 1919. [Google Scholar] [CrossRef]
  45. Rasouli, F.; Nasiri, Y.; Asadi, M.; Hassanpouraghdam, M.B.; Golestaneh, S.; Pirsarandib, Y. Fertilizer type and humic acid improve the growth responses, nutrient uptake, and essential oil content on Coriandrum sativum L. Sci. Rep. 2022, 12, 7437. [Google Scholar] [CrossRef]
  46. Jing, J.; Zhang, S.; Yuan, L.; Li, Y.; Lin, Z.; Xiong, Q.; Zhao, B. Combining humic acid with phosphate fertilizer affects humic acid structure and its stimulating efficacy on the growth and nutrient uptake of maize seedlings. Sci. Rep. 2020, 10, 17502. [Google Scholar] [CrossRef] [PubMed]
  47. Zhang, L.; Zhou, J.; Zhao, Y.G.; Zhai, Y.; Wang, K.; Alva, A.K.; Paramasivam, S. Optimal combination of chemical compound fertilizer and humic acid to improve soil and leaf properties, yield and quality of apple (Malus domestica) in the loess plateau of China. Pak. J. Bot. 2013, 45, 1315–1320. [Google Scholar]
  48. Wang, D.; Chen, X.; Tang, Z.; Liu, M.; Jin, R.; Zhang, A.; Zhao, P. Application of humic acid compound fertilizer for increasing sweet potato yield and improving the soil fertility. J. Plant Nutr. 2022, 45, 1933–1941. [Google Scholar] [CrossRef]
  49. Samaniego-Gaxiola, J.A.; Pedroza-Sandoval, A.; Chew-Madinaveitia, Y.; Gaytán-Mascorro, A. Reductive disinfestation, soil desiccation and Trichoderma harzianum to control Phymatotrichopsis omnivora in pecan tree nursery. Mex. J. Phytopathol. 2019, 37, 287–303. [Google Scholar] [CrossRef]
  50. Zin, N.A.; Badaluddin, N.A. Biological functions of Trichoderma spp. for agriculture applications. Ann. Agric. Sci. 2020, 65, 168–178. [Google Scholar] [CrossRef]
  51. Tarango-Rivero, S.H.; Nevárez-Moorillón, V.G.; Orrantia-Borunda, E. Growth, yield, and nutrient status of pecans fertilized with biosolids and inoculated with rizosphere fungi. Bioresour. Technol. 2009, 100, 1992–1998. [Google Scholar] [CrossRef]
  52. Rolim, J.M.; Walker, C.; Mezzomo, R.; Muniz, M.F. Antagonism and effect of volatile metabolites of Trichoderma spp. on Cladosporium spp. Floresta E Ambiente 2019, 26, e20170594. [Google Scholar] [CrossRef]
  53. Schratzberger, M.; Holterman, M.; Van Oevelen, D.; Helder, J. A Worm’s world: Ecological flexibility pays off for free-living nematodes in sediments and soils. Bioscience 2019, 69, 867–876. [Google Scholar] [CrossRef] [PubMed]
  54. Iqbal, S.; Jones, M.G.K. Nematodes. Encycl. Appl. Plant Sci. 2016, 3, 113–119. [Google Scholar] [CrossRef]
  55. von Broembsen, S. Pecan diseases: Prevention and control. Okla. Coop. Ext. Serv. 2016, EPP-7642, 7642–7647. [Google Scholar]
  56. Heerema, R.; Goldberg, N.; Thomas, S. Diseases and Other Disorders of Pecan in New Mexico; New Mexico State University: Las Cruces, NM, USA, 2010; pp. 1–12. [Google Scholar]
  57. Romagna, I.S.; Sobucki, L.; Santos, J.R.P.; Freiberg, J.A.; Meireles, L.A.; Schardong, I.S.; Somavilla, L.M.; dos Santos Rodrigues, G.L.; Kessler, N.C.H.; Antoniolli, Z.I. Plant-parasite nematodes in soils cultivated with pecans in Rio Grande Do Sul, Brazil. Int. J. Environ. Stud. 2024, 81, 1903–1917. [Google Scholar] [CrossRef]
  58. WHO. Permissible Limits of Heavy Metals in Soil and Plants; WHO: Geneva, Switzerland, 1996. [Google Scholar]
  59. Kochian, L.V.; Piñeros, M.A.; Liu, J.; Magalhaes, J.V. Plant adaptation to acid soils: The molecular basis for crop aluminum resistance. Annu. Rev. Plant Biol. 2015, 66, 571–598. [Google Scholar] [CrossRef]
  60. Neenu, S.; Karthika, K.S. Aluminium toxicity in soil and plants. Harit. Dhara 2019, 2, 15–19. [Google Scholar]
  61. Reynolds, W.D.; Bowman, B.T.; Drury, C.F.; Tan, C.S.; Lu, X. Indicators of good soil physical quality: Density and storage parameters. Geoderma 2002, 110, 131–146. [Google Scholar] [CrossRef]
  62. Ummah, M.S. Soil organic matter and water retention. Agron. J. 2020, 112, 3265–3277. [Google Scholar] [CrossRef]
  63. Cassel, D.K.; Nielsen, D.R. Field capacity and available water capacity. Methods Soil. Anal. 1986, 9, 901–926. [Google Scholar]
  64. Mutuku, E.A.; Vanlauwe, B.; Roobroeck, D.; Boeckx, P.; Cornelis, W.M. Physico-chemical soil attributes under conservation agriculture and integrated soil fertility management. Nutr. Cycl. Agroecosyst 2021, 120, 145–160. [Google Scholar] [CrossRef]
  65. Prieto-Méndez, J.; Rubio-Arias, H.; Prieto-García, F.; Roman-Gutiérrez, A.D.; Mendez-Marzo, M.A.; Acevedo-Sandoval, O.A. Soil quality in terms of pyhsical-chemical-metal properties for barely (Hordeum vulgare) production in the state of Hidalgo, Mexico. J. Agric. Environ. Sci. 2011, 10, 230–237. [Google Scholar]
  66. Sumner, M.E.; Noble, A.D. Soil acidification: The world story. In Handbook of Soil Acidity; Rengel, Z., Ed.; CRC Press: Boca Raton, FL, USA, 2003; pp. 1–21. ISBN 0824708903. [Google Scholar]
  67. Arias, M.E.; González-Pérez, J.A.; González-Vila, F.J.; Ball, A.S. Soil health—A new challenge for microbiologists and chemists. Int. Microbiol. 2005, 8, 13–21. [Google Scholar] [PubMed]
  68. Friedman, S.P. Soil properties influencing apparent electrical conductivity: A review. Comput. Electron. Agric. 2005, 46, 45–70. [Google Scholar] [CrossRef]
  69. Roche, J.R.; Ledgard, S.F.; Sprosen, M.S.; Lindsey, S.B.; Penno, J.W.; Horan, B.; Macdonald, K.A. Increased stocking rate and associated strategic dry-off decision rules reduced the amount of nitrate-N leached under grazing. J. Dairy. Sci. 2016, 99, 5916–5925. [Google Scholar] [CrossRef] [PubMed]
  70. Lv, H.; Lin, S.; Wang, Y.; Lian, X.; Zhao, Y.; Li, Y.; Du, J.; Wang, Z.; Wang, J.; Butterbach-Bahl, K. Drip fertigation significantly reduces nitrogen leaching in solar greenhouse vegetable production system. Environ. Pollut. 2019, 245, 694–701. [Google Scholar] [CrossRef]
  71. Ćirić, V.; Prekop, N.; Šeremešić, S.; Vojnov, B.; Pejić, B.; Radovanović, D.; Marinković, D. The implication of cation exchange capacity (CEC) assessment for soil quality management and improvement. Agric. For. 2023, 69, 113–134. [Google Scholar] [CrossRef]
  72. Bryson, G.M.; Mills, H.A. Plants Analysis Handbook IV: A Guide to Plant Nutrition and Interpretationof Plant Analysis for Agronomic and Horticultural Crops; Bryson, G.M., Mills, H.A., Eds.; Micro Macro Publishing: Athens, GA, USA, 2014; ISBN 9781878148032. [Google Scholar]
  73. Hazelton, P.; Murphy, B. Interpreting Soil Test Results; CSIRO Publishing: Melbourne, Australia, 2007; ISBN 978-0-643-09915-9. [Google Scholar]
  74. Haby, V.A.; Russelle, M.P.; Skogley, E.O. Testing soils for potassium, calcium, and magnesium. In Soil Testing and Plant Analysis; SSSA Book Series; Soil Science of America Inc.: Madison, WI, USA, 1990; pp. 181–227. ISBN 9780891188629. [Google Scholar]
  75. Chaganti, V.N.; Culman, S.W. Historical perspective of soil balancing theory and identifying knowledge gaps: A review. Crop Forage Turfgrass Manag. 2017, 3, 1–7. [Google Scholar] [CrossRef]
  76. Ertiftik, H.; Zengin, M. Response of maize for grain to potassium and magnesium fertilizers in soils with high contents. J. Plant Nutr. 2017, 40, 93–103. [Google Scholar] [CrossRef]
  77. Zharare, G.E.; Asher, C.J.; Blamey, F.P.C. Magnesium antagonizes pod-zone calcium and zinc uptake by developing peanut pods. J. Plant Nutr. 2011, 34, 1–11. [Google Scholar] [CrossRef]
  78. Rhodes, R.; Miles, N.; Hughes, J.C. Interactions between potassium, calcium and magnesium in sugarcane grown on two contrasting soils in South Africa. Field Crops Res. 2018, 223, 1–11. [Google Scholar] [CrossRef]
  79. Hatten, J.; Liles, G.A. Healthy balance—The role of physical and chemical properties in maintaining forest soil function in a changing world. Dev. Soil Sci. 2019, 36, 373–396. [Google Scholar] [CrossRef]
  80. Weil, R.; Magdoff, F. Significance of soil organic matter to soil quality and health. In Soil Organic Matter in Sustainable Agriculture; CRC Press: Boca Raton, FL, USA, 2004; pp. 1–43. [Google Scholar]
  81. Kreuser, B.C. Simplifying Soil Test Interpretations for Turf Professionals; University of Nebraska–Lincoln Extension, Institute of Agriculture and Natural Resources: Lincoln, NE, USA, 2015; Volume G2265. [Google Scholar]
  82. Kargas, G.; Chatzigiakoumis, I.; Kollias, A.; Spiliotis, D.; Massas, I.; Kerkides, P. Soil salinity assessment using saturated paste and mass soil:water 1:1 and 1:5 ratios extracts. Water 2018, 10, 1589. [Google Scholar] [CrossRef]
  83. Omar, M.M.; Massawe, B.H.J.; Shitindi, M.J.; Pedersen, O.; Meliyo, J.L.; Fue, K.G. Assessment of salt-affected soil in selected rice irrigation schemes in Tanzania: Understanding salt types for optimizing management approaches. Front. Soil. Sci. 2024, 4, 1372838. [Google Scholar] [CrossRef]
  84. Inzunza-ibarra, M.A.; Monger, H.C. Variation of soil chemical properties in irrigated and non-irrigated areas of the laguna region of Mexico. Terra Latinoam. 2005, 23, 429–436. [Google Scholar]
  85. Abegunrin, T.P.; Awe, G.O.; Idowu, D.O.; Onigbogi, O.O.; Onofua, O.E. Effect of kitchen wastewater irrigation on soil properties and growth of cucumber (Cucumis sativus). J. Soil. Sci. Environ. Manag. 2013, 4, 139–145. [Google Scholar] [CrossRef]
  86. Messiga, A.J.; Dyck, K.; Ronda, K.; van Baar, K.; Haak, D.; Yu, S.; Dorais, M. Nutrients leaching in response to long-term fertigation and broadcast nitrogen in blueberry production. Plants 2020, 9, 1530. [Google Scholar] [CrossRef]
  87. Lehmann, J.; Kleber, M. The contentious nature of soil organic matter. Nature 2015, 528, 60–68. [Google Scholar] [CrossRef]
Figure 1. Effect of colloidal nutrition on soil respiration (A) and organic acid composition, including total (B), humic (C), and fulvic (D) acids. Bars represent mean values ± standard error. Different lowercase letters above bars indicate statistically significant differences (p < 0.10) according to the t-test.
Agriculture 15 01201 g001
Figure 2. Comparison of heavy metal concentrations: Al (A), Ba (B), Cr (C), and Na (D) in colloidal and conventional nutrition treatments. Bars represent mean values ± standard error. Different lowercase letters above bars indicate statistically significant differences (p < 0.10) according to the t-test.
Agriculture 15 01201 g002
Figure 3. Biplot showing the results of a principal component analysis (PCA) of soil fertility parameters. The first two principal components (PC1 and PC2) are the two dashed axes. The percentage of variance explained by each PCA is denoted. Each arrow represents a variable. Each dot represents a replicate of each sample: colloidal 2020 (red dark dots), colloidal 2021 (red light dots), conventional 2020 (blue dark dots), and conventional 2021 (blue light dots). SP: saturation point, FC: field capacity, PWP: permanent wilting point, HC: hydraulic conductivity, BD: bulk density, AWC: available water content, AWD: available water depth, pH: potential of hydrogen, EC: electrical conductivity, TC: total carbonates, OM: organic matter, CEC: cation exchange capacity, CEC_Ca: exchangeable cations Ca2+, CEC_Mg: exchangeable cations Mg2+, CEC_K: exchangeable cations K+, CEC_Na: exchangeable cations Na+, P_Olsen: phosphorus, K: potassium, Ca: calcium, Mg: magnesium, Na: sodium, NO3: nitrate, Fe: iron, Zn: zinc, Mn: manganese, Cu: copper, B: boron, and S: sulfur.
Agriculture 15 01201 g003
Figure 4. Effects of colloidal and conventional soil treatments on physical and chemical soil properties over two years (2020 and 2021). (A) saturation point (%), (B) field capacity (%), (C) permanent wilting point (%), (D) available water content (%), (E) available water depth (m3/ha), (F) hydraulic conductivity (cm3/h), (G) bulk density (g/cm3), (H) pH, (I) electrical conductivity (dS/m), and (J) total carbonates (%). Bars represent mean values ± standard error. Different lowercase letters above bars indicate statistically significant differences (p < 0.10) according to Fisher’s LSD test.
Agriculture 15 01201 g004
Figure 5. Comparison of organic matter content in colloidal and conventional nutrient treatments (2020–2021). Bars represent mean ± standard error values. Different lowercase letters above bars indicate statistically significant differences (p < 0.10) according to Fisher’s LSD test.
Agriculture 15 01201 g005
Table 1. Abundance of fungi (Log10 CFU/g dried soil) identified in soil treated with colloidal and conventional nutrition.
OrganismColloidalConventional
Log10 CFU/g Dried Soil
Rhizoctonia solani2.52 ± 0.14 a2.20 ± 0.10 a
Verticillium albo-atrum2.16 ± 0.16 a1.34 ± 0.67 a
Cylindrocarpon destructans0.00 ± 0.00 a0.67 ± 0.67 a
Fusarium solani1.99 ± 1.00 a2.52 ± 0.26 a
Fusarium oxysporum2.84 ± 0.28 a2.55 ± 0.28 a
Fusarium longipes0.83 ± 0.83 a0.00 ± 0.00 a
Pythium spp.2.91 ± 0.11 a2.65 ± 0.19 a
Phytophthora spp.0.67 ± 0.67 a0.00 ± 0.00 a
Trichoderma spp.2.72 ± 0.24 a2.32 ± 0.16 a
Values represent mean ± standard error. Different lowercase letters indicate statistically significant differences (p < 0.10) according to the t-test. CFU: Colony Forming Units.
Table 2. Abundance of nematodes (individuals/100 g dried soil) identified in soil treated with colloidal and conventional nutrition.
OrganismColloidalConventional
Individuals/100 g Dried Soil
Criconemella spp.12.00 ± 7.57 a50.33 ± 27.12 a
Meloidogyne spp.0.00 ± 0.00 a26.00 ± 26.00 a
Psilenchus spp.0.00 ± 0.00 a3.33 ± 3.33 a
Tylenchus spp.0.00 ± 0.00 a5.67 ± 2.96 a
Tylenchulus spp.0.00 ± 0.00 a1.67 ± 1.67 a
Tylenchorhynchus spp.0.00 ± 0.00 a4.67 ± 4.67 a
Acrobeles spp.3.33 ± 3.33 a1.67 ± 1.67 a
Pratylenchus spp.11.33 ± 11.33 a0.00 ± 0.00 a
Gracilicus spp.23.00 ± 23.00 a5.00 ± 5.00 a
Total plant-parasitic nematode49.67 ± 39.67 a98.33 ± 32.99 a
Free-living nematodes45.33 ± 13.30 a26.67 ± 6.17 a
Values represent mean ± standard error. Different lowercase letters indicate statistically significant differences (p < 0.10) according to the t-test.
Table 3. Comparison of soil chemical properties between conventional and colloidal nutrition in 2020 and 2021.
PropertiesConventional 2020Colloidal 2020Conventional 2021Colloidal 2021
NO3-N (ppm)22.47 ± 1.84 a18.57 ± 0.88 ab9.47 ± 3.66 c12.93 ± 1.89 bc
P (ppm)37.53 ± 0.38 a28.63 ± 3.37 b19.00 ± 3.14 c14.10 ± 1.76 c
K (ppm)713.33 ± 67.11 a634 ± 59.08 a571.67 ± 229.90 a707.67 ± 27.53 a
Ca (ppm)4001.00 ± 180.58 a4038.67 ± 208.16 a2783.33 ± 1078.27 a4120.00 ± 113.36 a
Mg (ppm)341.33 ± 39.16 a300.33 ± 31.83 a283.33 ± 89.66 a329.67 ± 22.33 a
S (ppm)32.23 ± 5.53 a25.07 ± 6.23 a2.90 ± 1.45 b5.80 ± 4.35 b
Zn (ppm)0.84 ± 0.58 a1.24 ± 0.25 a1.03 ± 0.27 a1.69 ± 0.31 a
Cu (ppm)0.34 ± 0.04 a0.39 ± 0.05 a0.38 ± 0.03 a0.49 ± 0.10 a
Fe (ppm)2.62 ± 0.17 a2.82 ± 0.37 a4.48 ± 1.60 a4.89 ± 2.10 a
Mn (ppm)1.71 ± 0.12 b2.10 ± 0.03 b2.15 ± 0.14 b2.88 ± 0.34 a
B (ppm)0.11 ± 0.01 c0.18 ± 0.06 c0.98 ± 0.05 b1.38 ± 0.13 a
Na (ppm)104.00 ± 9.45 ab151.33 ± 10.91 a73.97 ± 32.20 b141.67 ± 8.76 a
CEC (meq/100 g)25.05 ± 1.34 a24.89 ± 1.47 a18.03 ± 6.84 a25.70 ± 0.85 a
Ca Saturation (%)73.73 ± 3.40 a74.35 ± 3.87 a75.60 ± 1.87 a80.03 ± 0.43 a
Mg Saturation (%)10.36 ± 1.19 b9.13 ± 0.96 b14.83 ± 2.54 a10.53 ± 0.35 b
K Saturation (%)6.75 ± 0.63 ab5.99 ± 0.56 b7.71 ± 0.56 a7.04 ± 0.18 ab
Na Saturation (%)1.67 ± 0.16 b2.44 ± 0.17 a1.73 ± 0.21 b2.37 ± 0.08 a
Ca:Mg ratio7.23 ± 0.53 a8.26 ± 0.49 a5.41 ± 0.91 b7.63 ± 0.32 a
Ca:K ratio11.13 ± 1.15 ab12.56 ± 0.75 a9.93 ± 0.54 b11.38 ± 0.29 ab
Mg:K ratio1.56 ± 0.20 a1.52 ± 0.09 a1.50 ± 0.52 a2.01 ± 0.07 a
Ca+Mg:K ratio12.69 ± 1.33 a14.08 ± 0.80 a11.93 ± 1.06 a12.87 ± 0.33 a
Values represent mean ± standard error. Different lowercase letters indicate statistically significant differences (p < 0.10) according to the Fisher’s LSD test.
Table 4. Comparative analysis of soil pastes extract properties under conventional and colloidal management practices (2020–2021).
PropertiesConventional 2020Colloidal 2020Conventional 2021Colloidal 2021
ECe (dS/m)2.11 ± 0.36 a0.90 ± 0.04 c1.51 ± 0.20 b1.41 ± 0.16 bc
SAR (dS/m)1.41 ± 0.12 c1.84 ± 0.04 bc2.49 ± 0.24 b3.51 ± 0.61 a
pH8.38 ± 0.07 b8.61 ± 0.03 a8.56 ± 0.02 a8.68 ± 0.05 a
NO3-N (ppm)18.11 ± 5.53 a0.98 ± 0.29 b3.64 ± 2.67 b4.94 ± 2.70 b
PO4-P (ppm)3.29 ± 2.67 a0.41 ± 0.10 a0.31 ± 0.00 a0.93 ± 0.47 a
SO4-S (ppm)463.67 ± 128.24 a143.93 ± 38.35 b112.23 ± 14.26 b73.93 ± 12.44 b
Cl (ppm)62.10 ± 7.61 b30.82 ± 13.48 b210.33 ± 13.48 a172.33 ± 17.52 a
HCO3 (ppm)166.33 ± 10.90 bc156.30 ± 32.02 c287.67 ± 49.74 ab330.33 ± 71.85 a
CO3 (ppm)32.80 ± 14.78 a30.70 ± 03.55 a14.80 ± 3.70 a33.00 ± 0.00 a
Ca (ppm)245.67 ± 49.56 a84.67 ± 3.16 b140.67 ± 27.91 b110.20 ± 9.11 b
Mg (ppm)43.23 ± 9.66 a14.57 ± 1.65 b23.97 ± 2.76 b16.03 ± 1.29 b
K (ppm)49.63 ± 13.71 a28.80 ± 3.85 a40.00 ± 8.32 a36.23 ± 3.89 a
Na (ppm)91.57 ± 16.71 bc69.63 ± 0.30 c119.00 ± 11.53 ab150.00 ± 28.88 a
Fe (ppm)4.38 ± 2.87 ab9.31 ± 3.43 a0.42 ± 0.20 b2.31 ± 1.09 b
Mn (ppm)0.21 ± 0.13 ab0.38 ± 0.15 a0.05 ± 0.03 b0.17 ± 0.10 ab
Zn (ppm)0.00 ± 0.00 b0.00 ± 0.00 b0.37 ± 0.26 a0.11 ± 0.06 ab
Cu (ppm)0.01 ± 0.00 b0.01 ± 0.00 b0.01 ± 0.00 ab0.02 ± 0.01 a
B (ppm)0.37 ± 0.03 a0.38 ± 0.02 a0.28 ± 0.04 a0.49 ± 0.21 a
Values represent mean ± standard error. Different lowercase letters indicate statistically significant differences (p < 0.10) according to Fisher’s LSD test.
Disclaimer/Publisher’s Note: The statements, opinions and data contained in all publications are solely those of the individual author(s) and contributor(s) and not of MDPI and/or the editor(s). MDPI and/or the editor(s) disclaim responsibility for any injury to people or property resulting from any ideas, methods, instructions or products referred to in the content.

