Article

Responses to the Interaction of Selenium and Zinc Through Foliar Fertilization in Processed Grains of Brazilian Upland Rice Genotypes

by
Filipe Aiura Namorato
1,
Patriciani Estela Cipriano
1,
Pedro Antônio Namorato Benevenute
1,
Everton Geraldo de Morais
1,
Felipe Pereira Cardoso
2,
Ana Paula Branco Corguinha
1,
Stefânia Barros Zauza
2,
Gustavo Ferreira de Sousa
1,
Maila Adriely Silva
1,
Eduardo Sobrinho Santos Figueredo
1,
Raphael Felipe Rodrigues Correia
1,
Fábio Aurélio Dias Martins
3,
Flávia Barbosa Silva Botelho
2 and
Luiz Roberto Guimarães Guilherme
1,*
1
Department of Soil Science, Federal University of Lavras, Lavras 37203-202, MG, Brazil
2
Department of Agriculture, School of Agriculture Federal, Federal University of Lavras, Lavras 37203-202, MG, Brazil
3
Agricultural Research Company of Minas Gerais, Aquenta Sol, Lavras 37203-202, MG, Brazil
*
Author to whom correspondence should be addressed.
Agriculture 2025, 15(11), 1186; https://doi.org/10.3390/agriculture15111186
Submission received: 6 March 2025 / Revised: 28 May 2025 / Accepted: 28 May 2025 / Published: 30 May 2025

Abstract

Rice (Oryza sativa L.) is a crucial crop for biofortification that is widely consumed and is cultivated in soils with low levels of selenium (Se) and zinc (Zn). The study evaluated how upland rice genotypes can increase Se and Zn in grains with foliar fertilization and analyzed the impact on agronomic characteristics and protein and amino acid contents. Experiments in Lambari and Lavras used a 5 × 4 factorial design with five genotypes (BRS Esmeralda, CMG 2188, CMG ERF 221-16, CMG ERF 221-19, CMG ERF 85-15) and four treatments (control, without Se; 5.22 g Se ha−1; 1.42 kg Zn ha−1; and combined Zn+Se) with three replicates. The study showed that CMG ERF 85-15, with Se fertilization, increased grain yield in Lambari. In Lavras, adding Zn to CMG 2188 and CMG ERF 85-15 improved grain yield. In Lambari, most variables were grouped with Zn+Se, except grain yield and free amino acids in the grain. In Lavras, variables associated with Se, proteins, free amino acids in the polished grain, hulling in whole and polished grain, and milling yield were grouped under the treatment Zn+Se. We recommend the genotype CMG ERF 85-15 based on the results for foliar biofortification with Zn+Se.

Graphical Abstract

1. Introduction

One of the most critical global issues today is food security. It encompasses adequate quantity, better distribution of produced food, and improved nutritional quality. However, severe socioeconomic problems can arise globally when these factors are overlooked. According to global practices aimed at combating malnutrition, the worldwide population suffering from malnutrition decreased from 23% to 13% between 1990 and 2015 [1]. Nonetheless, these data were based solely on energy malnutrition and did not account for micronutrient deficiencies. An estimated 2 billion people are affected by such shortcomings [2].
Zinc and selenium deficiencies are significant health issues worldwide. These elements play fundamental roles in amplifying the antioxidant capacity of plants in addition to significantly improving photosynthesis processes, thus favoring their growth and productivity. In addition, these components have proven effective in combating stress caused by heavy metals, which can be harmful to the health of plants and soil [3,4]. The balanced presence of Zn and Se not only strengthens the resistance of plants but also creates a healthier environment for their growth and development.
However, approximately 50% of agricultural areas dedicated to cereal cultivation worldwide face a Zn deficiency in the soil [5]. Approximately 20% of global soil is deficient in Se, an element vital for human health and beneficial to plants [6]. These deficiencies can have profound implications for agricultural productivity and global nutrition. Approximately 17.3% of the worldwide population is at risk of inadequate Zn intake, and around 40 countries have soils with low Se levels, directly affecting the health of their populations [7]. Therefore, actions are necessary to reduce malnutrition worldwide and enhance global well-being.
Zinc is essential for both animals and plants, interacting with numerous enzymes and proteins in the human body. It is estimated that around 17% of the global population is at risk of inadequate Zn intake. In comparison, approximately 14% face the same problem regarding Se in their diets, as highlighted in recent studies [8]. Zinc deficiency in soil and plants significantly impacts plant growth and negatively affects essential photosynthetic processes. This deficiency hinders the absorption of nutrients and can cause imbalances in the levels of other elements, compromising the overall health of the plants [9].
Zinc deficiency in humans can cause serious problems, such as metabolic disorders and impaired immune function, increasing the risk of infections and associated with increased mortality from COVID-19 [10]. Consequently, low Zn intake can result in health problems such as growth retardation, impaired brain development, reduced immune system efficiency, pneumonia, diarrhea, stillbirths, decreased physical performance, skin lesions, alopecia, and impaired wound healing [11,12].
Selenium is crucial for maintaining human health as it is part of the selenoproteins that regulate thyroid hormones and contribute to antioxidant and immune defenses. Adequate Se intake can help prevent various health issues, including cardiovascular and degenerative diseases and cancers [7,13]. A lack of Se in the body can reduce the antioxidant substances that need this mineral, seriously impairing the antioxidant functions of cells. This deficit compromises the body’s ability to fight free radicals and can increase the risk of chronic diseases and health problems in the future [14].
Malnutrition impacts millions globally due to micronutrient deficiencies, especially Zn and Se. Biofortification of staple foods has been an effective method to combat this hidden hunger. Rice, due to its accessibility and versatility in a wide range of culinary cultures, stands out as one of the most consumed staple foods in many countries, especially those facing high malnutrition rates. It is important to note that although grains are a vital source of carbohydrates, they often have low levels of essential micronutrients. This deficiency is because many of these nutrients are frequently eliminated during grain processing [15]. Biofortification is a good strategy for improving global well-being. This practice involves techniques and practices such as genetic improvement and agronomic management to increase the nutrient content in edible plant parts [16]. Biofortification is ideal for improving nutrition in rural and poor communities that rely on subsistence agriculture or lack access to fortified foods [17].
Genetic biofortification and agronomic biofortification are two strategies designed to enhance the nutritional value of crops to combat micronutrient deficiencies in human diets, especially in areas where people have limited access to a variety of nutrient-rich foods. These methods focus on improving the nutrient content of staple crops consumed by large populations. Genetic biofortification involves breeding and selecting crop varieties with naturally enhanced nutrient content through traditional breeding or modern biotechnological techniques. The objective is to increase the concentration of specific vitamins, minerals, and other nutrients in the edible parts of plants. Agronomic biofortification entails modifying crops’ growing conditions and practices to boost their nutrient content. This strategy does not involve genetic modification but instead emphasizes optimizing soil conditions, fertilization methods, and agronomic practices to enhance the uptake and accumulation of essential nutrients in crops [18].
Rice is among the most significant crops in biofortification studies. According to the latest estimates, there were roughly 165 million hectares of rice worldwide during the 2022/2023 season, with an estimated grain production of 761 million tons [19]. More than half of the global population relies on rice varieties and cultivars as a staple food, and the average per capita consumption in 2020 was estimated at 78.91 kg per year [20]. Rice is a key crop worldwide. It is an important food source and contributes to the economies and cultures of several nations [21]. It is also a crucial source of energy and nutrients, essential for more than half of the world’s population, and contributes to health and well-being in several regions [22]. Both whole and polished rice grains contain low concentrations of Zn, ranging from 6 to 28 mg kg−1, and even lower Se levels, approximately 0.3 mg kg−1 [23]. Given this nutritional limitation, agronomic biofortification has been an effective strategy for increasing the presence of these two minerals in rice grains [24].
Biofortification through genetic improvement and agronomic practices is highly recommended, especially for rice cultivation. However, it remains an emerging practice at the global level. Additionally, there is an increasing need to better understand how rice genotypes respond to biofortification with Se and Zn, either individually or in combination, particularly under specific regional conditions. Therefore, research development is essential to understand these mechanisms, identify suitable genotypes for future recommendations, and improve the efficiency of biofortification. Innovatively, this study combines agronomic and biochemical assessments to reveal genotype-dependent responses to the biofortification process. Thus, the hypothesis is that the combined foliar application of Se and Zn in upland rice results in higher grain yield as well as increased concentrations of these elements, which are essential to human metabolism, in the grains. Therefore, this study aims to evaluate the effect of foliar application of Se and Zn on different upland rice genotypes, seeking to increase the concentration of these elements in the grains and analyze their impacts on agronomic traits and the biochemical quality of the grains.

2. Materials and Methods

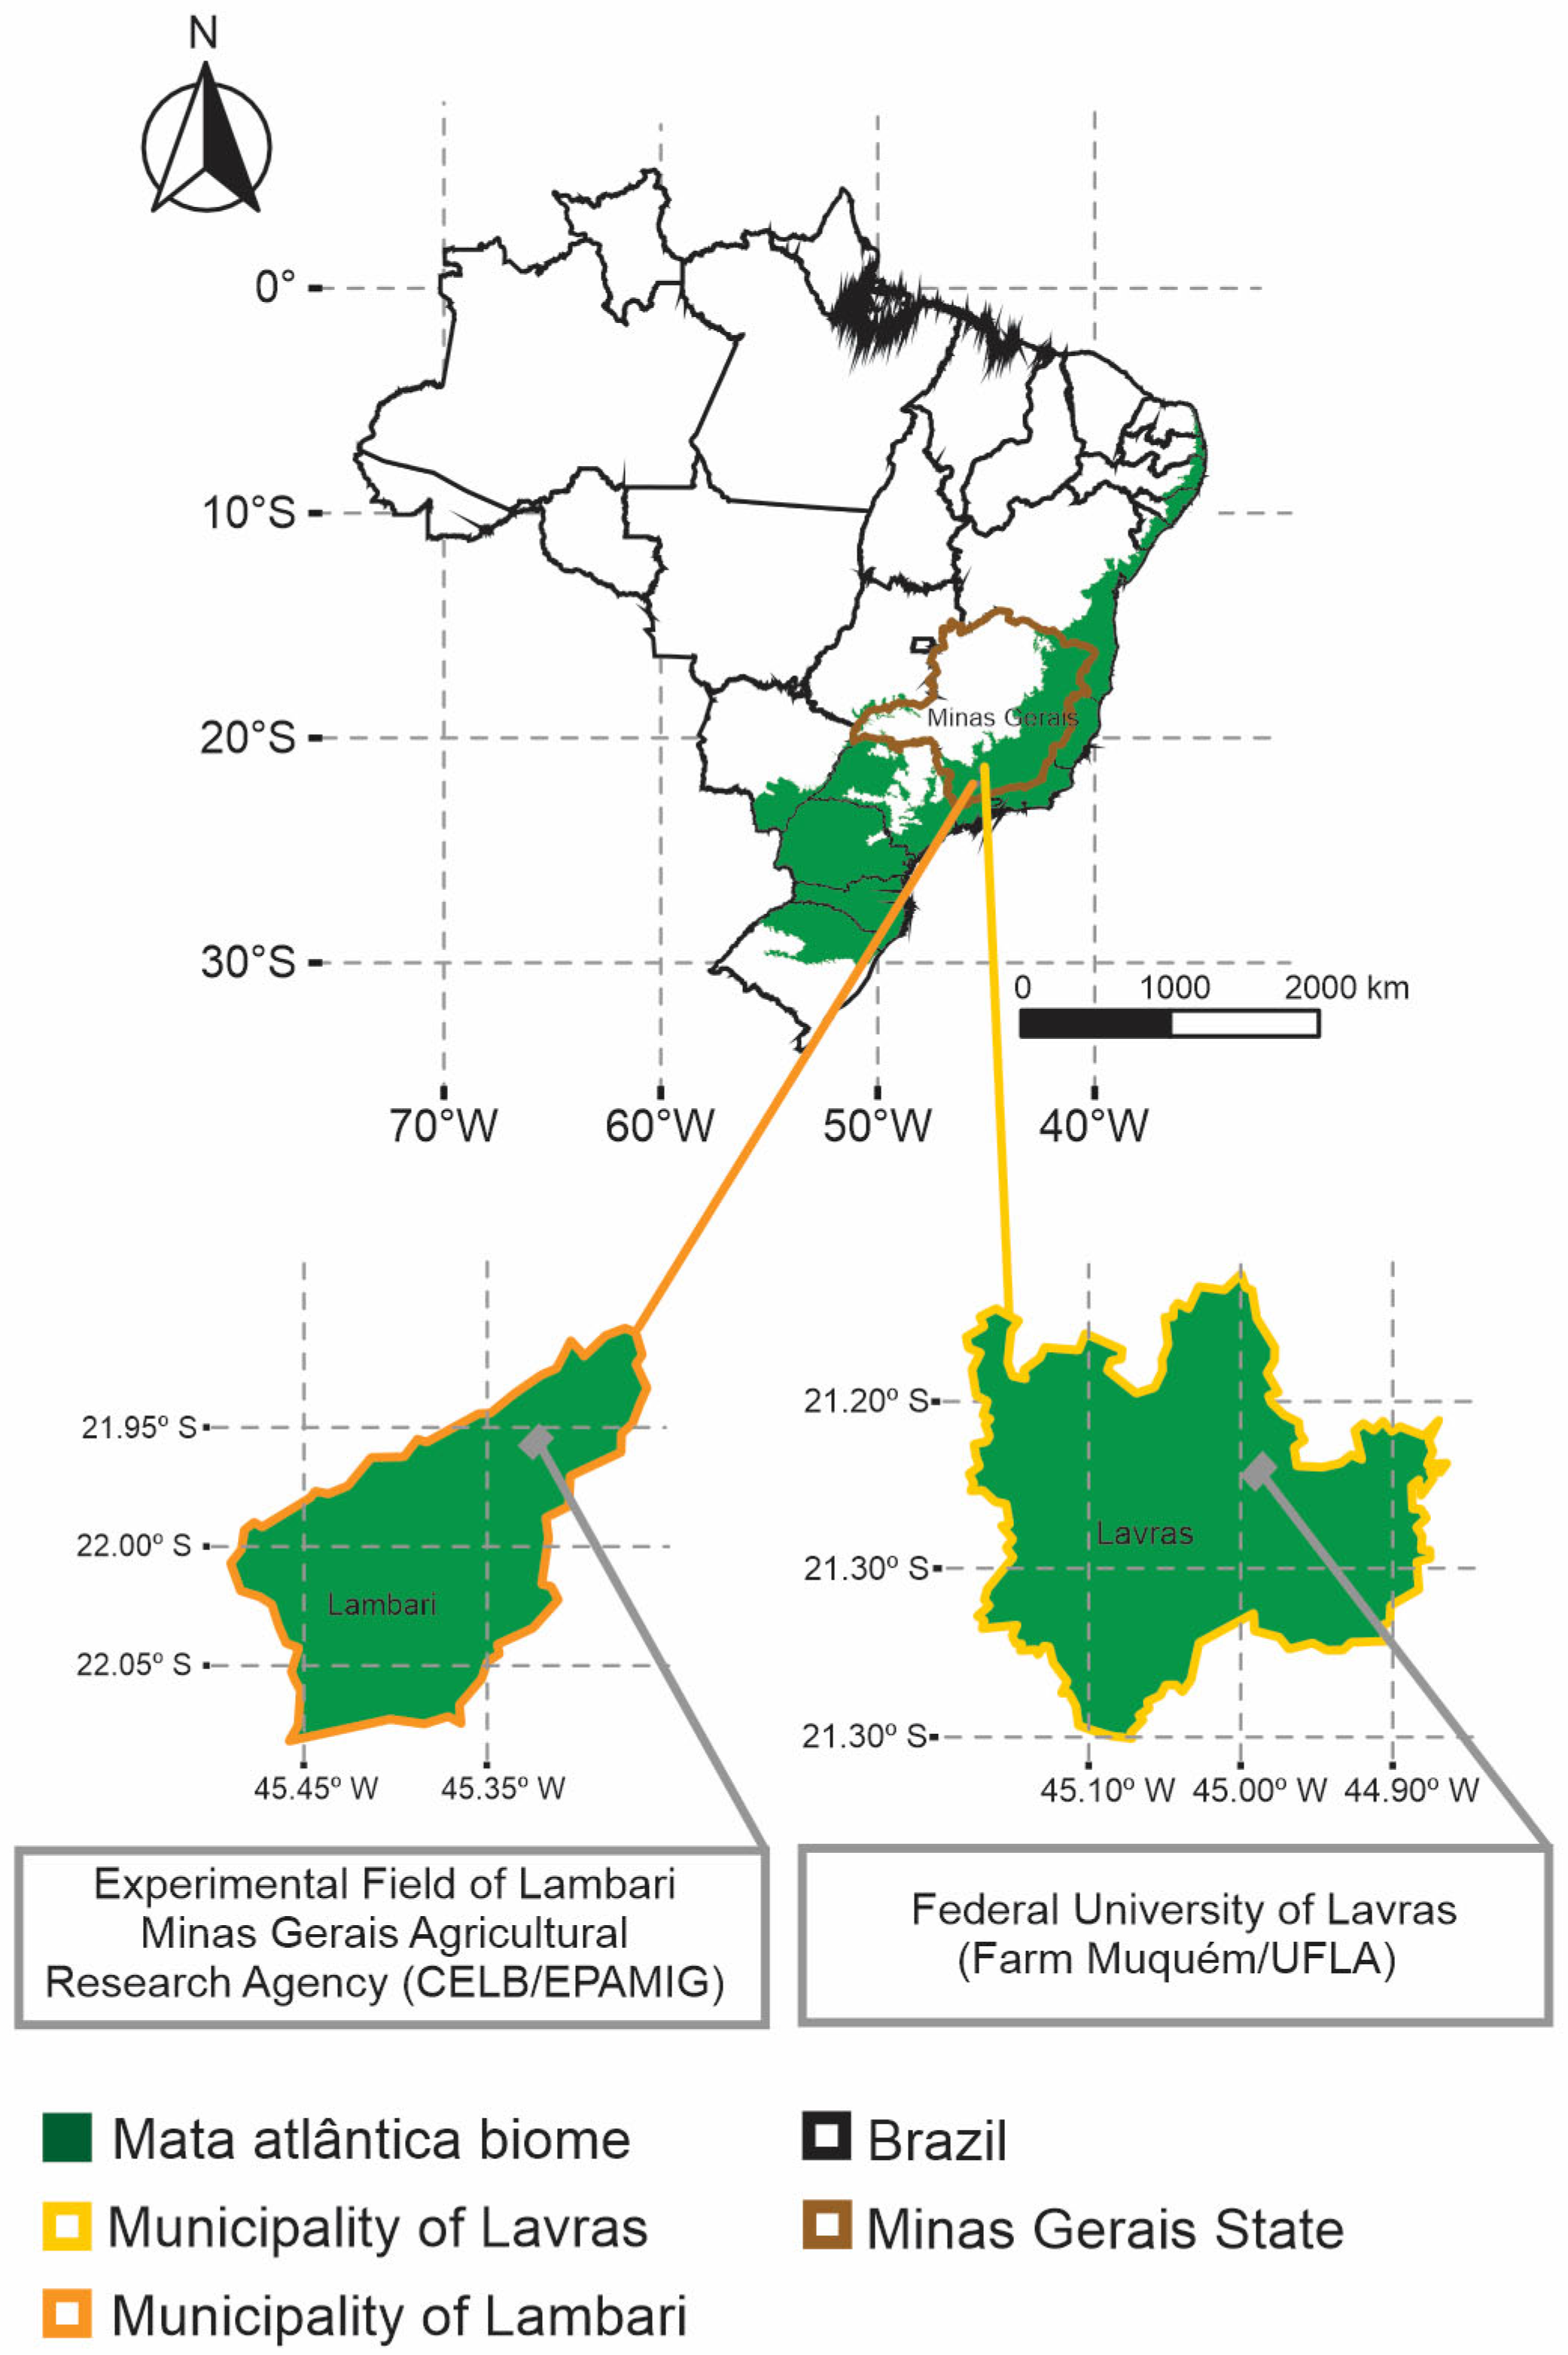
2.1. Field Growing Conditions and Experimental Design

Two similar experiments were conducted during the 2019/2020 crop season, from January to May, in the municipalities of Lavras (21°14′45″ S, 44°59′59″ W; altitude: 919 m) and Lambari (21°58′32″ S, 45°21′32″ W; altitude: 887 m), in the State of Minas Gerais, Brazil (Figure 1). The first experimental area was situated in an experimental field that is part of the Minas Gerais Agricultural Research facility (CELB/EPAMIG) (Latitude: −21.9671, Longitude: −45.3466), at an elevation of 896 m, in the municipality of Lambari. The second area is located at the Center for Scientific and Technological Development in Agriculture at the Federal University of Lavras (Muquém Farm/UFLA), situated at an elevation of 920 m in the municipality of Lavras, with coordinates of Latitude −21.2457 and Longitude −44.9998.
Lambari and Lavras are cities that have a Cwa climate based on the Köppen climate classification [25]. This climate type is characterized by mesothermal conditions, which means it experiences hot temperate or subtropical weather. This region exhibits a winter period of reduced rainfall, with the driest month receiving less than 60 mm of precipitation. During the coldest months, temperatures range from 3 °C to 18 °C, while the summer months are characterized by high temperatures, reaching a maximum of 22 °C.
This experimental area has a long record of agriculture, with soils cultivated for years. The soils in each location are classified as Dystrophic Red-Yellow Latosol in Lambari and Eutrophic Red-Yellow Argisol in Lavras [26]. Before conducting the experiments, soil samples were collected from these specific areas. Soil samples were collected to assess the physicochemical properties of the soils. The soil samples were dried naturally, passed through a 4 mm mesh, and then thoroughly examined to determine their primary physical and chemical characteristics [27] and the latter for total soil Se content [28] (Table 1).
Fertilization was based on recommendations for the State of Minas Gerais [29]. Based on the chemical analysis of the soil, lime was applied to raise the base saturation to 50% using dolomitic limestone in Lavras, as pH corrections were necessary. Sowing was performed using a planting fertilizer consisting of the commercial NPK 8-28-16 formula (N-P2O5-K2O). After 40 days, a top-dressing was applied with ammonium sulfate and potassium chloride (Table 2).
Sodium selenate (Na2SeO4), heptahydrated zinc sulfate (ZnSO4·7H2O), and a mixture of both were diluted in a 0.5% surfactant solution (Assist®, BASF, Ludwigshafen, Germany) to prepare the following Se and Zn doses: 5.22 g ha1 and 1.42 kg ha1, respectively, divided into two applications. The first application of foliar treatment was carried out at the heading stage and the second at the grain-filling stage, following the cycle of each genotype. The control group received only deionized water containing the surfactant. Foliar applications were performed using a pressurized pump connected to a carbon dioxide container.
Each experiment was conducted with 5 genotypes of upland rice, which were selected in a study conducted by Félix et al. [30], where 5 out of 20 genotypes that received urea + Se as top-dressing exhibited the highest levels of Se in polished grains. The experiments were set up in randomized blocks with a 5 × 4 complete factorial design, with 5 genotypes (BRS Esmeralda, CMG 2188, CMG ERF 221-16, CMG ERF 221-19, and CMG ERF 85-15) and 4 treatments (control—without Se and Zn, 5.22 g Se ha−1 (Na2SeO4), 1.42 kg Zn ha−1 (ZnSO4), a combination of Se and Zn) with 3 repetitions totaling 60 experimental plots at each location. Each plot measured 4 × 2 m, with a row spacing of 0.5 m, totaling 5 rows per plot and approximately 60 seeds per linear meter. The usable area of each plot was 4.8 m2, resulting in a total of 120 plots.

2.2. Agronomic Parameters

The grain yield was obtained by harvesting the usable area of the plot and drying it in an oven at 60 °C. The data were presented in kg ha−1, with moisture corrected to 13%. The hulling and milling yield process was conducted according to Normative Instruction 06/2009 of the Brazilian Ministry of Agriculture, Livestock, and Supply establishing Brazil’s official rice grain classification standards [31].

2.3. Processing of Rice Grains (Polished and Whole)

Processed grains were produced using a mini-testing mill, which hulled (whole rice) and milled (polished rice) the grains.

2.4. Proteins and Amino Acids Determination

The whole and polished grains were subsequently ground in a hand mill. For the quantification of free amino acids and free proteins, 0.2 g of the dry mass of the grains was homogenized with a buffer solution (0.1 mol L−1 potassium phosphate, pH 7.8), incubated for 30 min in a water bath at 40 °C, and later centrifuged at 16,770× g for 10 min, and the supernatant was removed [32]. Proteins were determined from the reaction of an aliquot of the supernatant with the solution containing 0.01% Coomassie, 8.5% phosphoric acid, and 4.7% ethanol. For the protein standard curve, bovine serum albumin (BSA, 2.5 mg mL−1) was used as the standard [33]. The results were obtained in a spectrophotometer at 595 nm.
Amino acids were determined according to Yemm and Cocking [34]. After adding an aliquot of the supernatant and the reagents, 0.2 M sodium citrate with pH = 5.0, 5% ninhydrin in ethylene glycol monomethyl ether, and 2% KCN in ethylene glycol monomethyl ether, the mixture was stirred and then placed in a water bath at 100 °C for 20 min. Then, 60% ethanol was added, stirred, and allowed to cool. To obtain the amino acid standard curve, glycine (0.1 µmol mL−1) was used as the standard. The results were obtained in a spectrophotometer at 570 nm.

2.5. Selenium and Zinc: Content, Uptake, Intake

The sample digestion procedure was based on the USEPA 3051a methodology [28]. Approximately 500 mg of ground samples from processed grains was weighed and digested in 5 mL of ≥65% HNO3 within PTFE Teflon® tubes (CEM Corporation, Matthews, NC, USA). The extract was left overnight at room temperature, and digestion was performed the following day. The vials were hermetically sealed and placed in a microwave (CEM brand, Mars-5 model) with a controlled pressure of 0.76 MPa for 15 min. After digestion, the extracts were cooled to room temperature.
Subsequently, the final extract volume was adjusted by adding 5 mL of deionized water. After filtration, the extracts were transferred to smaller vials (30 mL) and stored at 5 °C until analysis. Standard reference materials for Se and Zn (White Clover—BCR 402 and Tomato leaves—NIST SRM 1573a) were included in each batch for quality control during digestion along with a blank sample. The digested extract was analyzed to measure the total content of Se and Zn using Graphite Furnace Atomic Absorption Spectrometry (GFAAS). The average Se content of the CRM was 6.05 mg kg−1 (n = 18), with a recovery rate of 90.31%. This value is based on the certified level of Se in White Clover (CRM BCR—402), which is 6.70 mg kg−1. The average Zn content in the CRM was 30.09 mg kg1 (n = 18), translating to 97.27% compared with the certified value of 30.94 mg kg1 for Zn in Tomato leaves (SRM 1573a).
Based on the Se and Zn content, the uptake of Se and Zn in processed grains (EA) (g ha−1 for Zn and mg ha−1 for Se) was calculated by multiplying the Se and Zn contents (mg kg−1) [35] by the yield in each processing (kg ha−1). Additionally, Selenium and Zn intake were calculated using the data collected by Lessa et al. [36].
EI = [Gr]intake × [E]content
where EI (µg person1 day1 for Se, and g person1 day1 for Zn) represents the estimated daily intake of Se and Zn per person; [Gr]intake (g person1 day1) indicates the average consumption of rice grains per person; [E]content (µg kg1 for Se, and g kg1 for Zn) refers to the Se and Zn contents in rice grains (whole or polished) verified for the studied treatments. According to the Food and Agriculture Organization’s statistical database, the mean global rice consumption over the last decade is 78.91 kg person−1 year−1 (216 g person−1 day−1) [20].

2.6. Statistical Analysis

All statistical analyses were conducted using R software version 4.3.1 [37]. The data were analyzed to ensure normality using the Shapiro–Wilk test (p ≥ 0.05), homoscedasticity using the Bartlett test (p ≥ 0.05), and independence of residuals using the Durbin–Watson test (p ≥ 0.05). The next step involved subjecting them to an analysis of variance (ANOVA) while the data from field experiments were analyzed individually.
Once the assumptions for the joint analysis of experiments were accepted, a joint study of variance was conducted, incorporating the two field experiments and simultaneously considering all the experiments carried out in Lavras and Lambari. Means were compared using the Tukey test with a significance level of p ≤ 0.05. The joint analysis of variance revealed significant differences among the experimental treatments [38]. The Tukey test revealed important differences among several means, proving that the treatments had a noteworthy impact on the variables under investigation.
The data were standardized before clustering because the variables were measured in different units [39]. The standardized data were clustered using the K-means algorithm, which aimed to identify distinct groups by considering similarities in the variables. In the clustering analysis, the K-means algorithm effectively identified distinct groups based on similarities in the standardized variables, offering valuable insights into the underlying patterns and associations within the dataset. Moreover, the principal component analysis (PCA) [40] enabled a thorough evaluation of the variations in treatment among all genotypes, providing insight into the primary factors fueling the variation in this particular aspect of the study.

3. Results

The individual and pooled analysis of the experiments (Table 3 and Table 4) provided a comprehensive overview, revealing significant differences between the growing sites (<7:1) for all variables examined in the studies, indicating that the geographical location of the growing sites had a notable impact on the variables under investigation. The interactions between location, genotypes, and treatments (L × G × T) significantly influenced (p ≤ 0.05) the responses of several variables, with the exception of hulling polished grain and milling yield, which highlights the intricate relationships between location, genotype, and Se sources.
The interaction between location and genotypes (L × G) had a significant impact (p ≤ 0.05) on the variables hulling polished grain and milling yield. The significant interaction between sites and genotypes suggests that the performance of different genotypes may vary across different geographical regions, further emphasizing the importance of adaptive agricultural practices. The results highlight the need for site-specific approaches considering both genotype selection and geographic variations in order to maximize crop nutrient content.

3.1. Agronomic Traits

In Lambari, the genotype CMG ERF 221-16 showed the highest grain yield under Zn fertilization, surpassing the control, Se, and Zn+Se treatments by 44.8%, 39.4%, and 34.2%, respectively. CMG ERF 221-16 also outperformed BRS Esmeralda, CMG 2188, CMG ERF 221-19, and CMG ERF 85-15 under Zn application by 52.2%, 65.0%, 23.6%, and 25.0%, respectively (Figure 2A).
In Lavras, BRS Esmeralda exhibited the highest grain yield under both control and Zn+Se treatments, with increases of 34.9% and 38.8%, respectively. CMG 2188 also responded positively, with grain yield increases of approximately 31% under Zn and Zn+Se fertilization compared with control and Se treatments. The combination of Zn+Se notably improved the performance of CMG ERF 221-19, increasing yield by 37.4% compared with Se alone, which had caused a 40.7% reduction relative to the control. Overall, grain yield varied widely among genotypes and treatments, with up to 46.9% differences observed.
For hulling whole grain (Figure 2B), in Lambari, CMG 2188 with Se fertilization showed a reduction of over 6% compared with Zn and Zn+Se treatments, while CMG ERF 221-16 exhibited increases of around 6.5% with Se and Zn+Se compared with the control. In Lavras, CMG ERF 221-16 with Zn+Se improved hulling by 5.1% relative to the control. Hulling polished grain (Figure 2C) in Lambari decreased by 9.1% and 10.1% in BRS Esmeralda under Zn fertilization compared with the control and Se. In contrast, CMG ERF 221-19 showed 9.6% and 12.1% increases over CMG 2188 and CMG ERF 85-15, respectively, under Se fertilization. The Zn+Se treatment improved the hulling of CMG ERF 221-19 by 7.8% compared with CMG ERF 85-15. No significant differences were observed in Lavras for this variable.
Milling yield (Figure 2D) showed notable genotype–treatment interactions. In Lambari, Se fertilization enhanced milling yield in BRS Esmeralda by 42.1% and 37.3% over CMG 2188 and CMG ERF 85-15, respectively. Under Zn, BRS Esmeralda had a 37.1% advantage over CMG ERF 85-15, and under Zn+Se, a 32.2% advantage over CMG 221-16. In Lavras, Se fertilization increased BRS Esmeralda’s milling yield by 12.8% compared with Zn. CMG ERF 221-19 responded best to Zn+Se, with gains of 24.4% over control and 13.8% over Zn. Selenium also improved BRS Esmeralda’s milling yield by over 21% compared with CMG ERF 221-16, CMG ERF 221-19, and CMG ERF 85-15. Similarly, CMG 2188 under Se showed increases of over 21.7% compared with the same genotypes. Under Zn fertilization, CMG 2188 had the highest milling yields, exceeding BRS Esmeralda and all other genotypes by up to 38.7%. With Zn+Se, both BRS Esmeralda and CMG 2188 outperformed the different genotypes, with gains of up to 27.7% observed.

3.2. Grain Contents of Zn and Se

In Lambari, foliar Zn+Se fertilization significantly increased Zn content in the whole grain, especially in BRS Esmeralda (22.7% and 20.1% higher than the control and Se, respectively) and CMG 2188 (28.3% and 29.2% higher than the control and Se, respectively). CMG ERF 85-15 also responded well to Zn fertilization, with increases of up to 34.5% compared with other genotypes. Similar trends were observed with Zn+Se enhancing Zn content by up to 32.3% over other genotypes (Table 5).
In Lavras, CMG 2188 showed the highest Zn enrichment with Zn+Se (33.7% and 31.0% above control and Se, respectively), followed by CMG ERF 221-16 and CMG ERF 221-19, with increases exceeding 30% in some comparisons. Zinc fertilization alone also improved Zn content in all genotypes, particularly CMG 2188 (27.5% over control). Notably, CMG ERF 85-15 consistently showed higher Zn levels across treatments, while CMG 2188 presented lower Zn content than other genotypes when fertilized with Zn alone.
For polished grains, CMG 2188 responded strongly to Zn and Zn+Se fertilization in both locations, with Zn increases of up to 27.9% in Lambari and 26.6% in Lavras. In contrast, CMG ERF 221-16 showed reduced Zn content under Zn+Se, especially in Lambari, up to 33.3% lower than other genotypes. CMG ERF 85-15 and CMG ERF 221-19 had moderate improvements, while BRS Esmeralda showed limited gains in Lavras.
Regarding selenium content in whole grain, Zn+Se fertilization substantially increased Se across genotypes and locations. In Lambari, CMG ERF 221-19 showed the highest response (up to 68.2% over control), followed by CMG 2188 and CMG ERF 221-16, exceeding 48%. CMG ERF 85-15 also performed well, particularly with Zn fertilization. Comparisons among genotypes under Zn+Se indicated that CMG ERF 221-19 had the highest Se levels, surpassing others by over 30% (Figure 3).
In Lavras, Se fertilization alone significantly increased Se content, especially in BRS Esmeralda (50.0%) and CMG 2188 (44.5%). Combining Zn+Se further enhanced Se accumulation in CMG ERF 221-19 (up to 64.0% over control) and CMG ERF 221-16. CMG ERF 85-15 also had high Se content under all fertilization regimes, outperforming most other genotypes. For polished grain, Zn+Se was again effective in increasing Se content. In Lambari, CMG ERF 221-16 and CMG ERF 221-19 had increases exceeding 40%, while CMG 2188 and BRS Esmeralda also showed notable gains. CMG ERF 85-15 had the greatest relative increase under Se fertilization compared with other genotypes. In Lavras, Se fertilization consistently enhanced Se content across all genotypes, with CMG 2188 (53.8%) and CMG ERF 221-19 (50.0%) showing the most significant increases. Under Zn+Se, CMG ERF 221-16 and CMG ERF 221-19 increased above 45%. In contrast, BRS Esmeralda had the lowest Se content under Zn+Se, with reductions exceeding 60% compared with the other genotypes.

3.3. Grain Uptake of Zn and Se

Zinc uptake in whole grains (Figure 4A) varied across genotypes and locations. In Lambari, BRS Esmeralda showed the highest increase with Zn+Se fertilization, rising by 46.2% and 36.5%, respectively, compared with the control and Se treatments. CMG 2188 responded similarly, with 38.1% and 34.5% increases over the control and Zn alone. CMG ERF 221-16 showed the greatest response to Zn alone, with 55.7% and 27.1% increases over the control and Zn+Se, respectively. CMG ERF 221-19 and CMG ERF 85-15 also benefited from Zn+Se, with gains of up to 27.8% and 28.1%, respectively. CMG ERF 221-16 outperformed CMG 2188 and CMG ERF 85-15 by 56.0% and 6.7%, respectively, under Zn fertilization (Table 6).
In Lavras, BRS Esmeralda showed a decline in Zn uptake with Zn+Se (up to 40.6% lower than the control and Zn treatments). In contrast, CMG 2188 responded best to Zn alone, with increases of 51.3% and 48.3%, respectively, over the control and Zn+Se. CMG ERF 221-16 showed modest increases with Zn, while CMG ERF 221-19 and CMG ERF 85-15 had more pronounced gains with Zn+Se. Selenium fertilization led to the highest Zn uptake in CMG ERF 85-15, with up to 66.0% increases compared with other genotypes. Overall, Zn+Se improved Zn uptake notably in CMG ERF 85-15 and CMG ERF 221-19, outperforming BRS Esmeralda by over 50%.
In polished grains (Figure 4B), similar trends were observed. In Lambari, CMG ERF 221-16 showed the highest response to Zn, with Zn uptake 54.3% and 38.0% higher than the control and Zn+Se, respectively. CMG ERF 221-19 also responded well to Se, while CMG 2188 had marked reductions compared with CMG ERF 85-15 and CMG ERF 221-19 under Zn+Se. In Lavras, Zn+Se reduced uptake in BRS Esmeralda by over 30%. CMG 2188 again showed strong responses to Zn, with an over 50% increase compared with other treatments. Selenium fertilization reduced Zn uptake in CMG ERF 221-19, while Zn+Se hurt CMG ERF 85-15. However, both CMG ERF 85-15 and CMG 2188 showed higher Zn uptake than other genotypes under Zn fertilization. CMG ERF 221-19 showed the greatest improvement with Zn+Se, with gains over 49% compared with BRS Esmeralda.
Selenium uptake in whole grains (Figure 4C) was the highest with Zn+Se across most genotypes in Lambari. BRS Esmeralda showed 50.3% and 43.0% increases over the control and Zn, respectively. CMG 2188 had a 50.3% increase with Se alone. CMG ERF 221-16 and CMG ERF 221-19 responded strongly to Zn+Se, with gains of over 60% (Table 7).
In Lavras, CMG ERF 85-15 had the greatest Se uptake with Zn+Se (up to 43.7% over Zn alone) and responded well to Se alone (36.3%). CMG ERF 85-15 outperformed all other genotypes with Se fertilization, increasing up to 74.5%. CMG ERF 221-19 showed the strongest response to Zn+Se, surpassing BRS Esmeralda by 65.8%.
In polished grains (Figure 4D), BRS Esmeralda showed a 55.8% increase with Zn+Se in Lambari. CMG ERF 221-16 also responded well to Zn+Se and Zn alone, with gains of over 55% and 47%, respectively. CMG ERF 85-15 had similar improvements with Zn+Se and Se alone. CMG 2188 had significantly lower Se uptake than other genotypes under all treatments. However, CMG ERF 221-16 outperformed all others under Zn fertilization, with increases of over 59% compared with CMG 2188. CMG ERF 85-15 had the highest increase with Se, reaching up to 63.7% compared with CMG 2188.
In Lavras, BRS Esmeralda responded better to Se fertilization, increasing up to 80.2% compared with Zn+Se in Lambari. CMG 2188 showed strong responses to both Se and Zn, with increases of over 50%. CMG ERF 221-16 and CMG ERF 221-19 responded best to Zn+Se, with increases exceeding 50% compared with other treatments. CMG ERF 85-15 also showed consistent gains with Se and Zn+Se. Selenium fertilization generally improved Se uptake across genotypes, especially in CMG 2188 and CMG ERF 85-15. Notably, CMG ERF 221-19 had the highest gains with Zn+Se, surpassing BRS Esmeralda by 82.8%. CMG ERF 85-15 showed similarly high increases under Zn+Se, up to 79.7%.

3.4. Grain Intake of Zn and Se

In Lambari, BRS Esmeralda showed 22.7% and 20.1% increases in Zn intake with Zn+Se fertilization compared with the control and Se-only treatments. CMG 2188 exhibited 27.9% and 28.3–29.1% increases with Zn and Zn+Se, respectively. CMG ERF 85-15 had the highest Zn intake when fertilized with Zn, outperforming BRS Esmeralda, CMG ERF 221-16, and CMG ERF 221-19 by 18.4%, 34.0%, and 18.8%, respectively. When fertilized with Zn+Se, it remained superior to CMG 2188 and CMG ERF 221-16 by 20.5% and 32.2%.
In Lavras, CMG 2188 showed the strongest response, with Zn+Se increasing Zn intake by 33.7% and 30.9% over the control and Se treatments, respectively. Zinc alone increased Zn intake by 27.7%. CMG ERF 221-16 responded well to Zn and Zn+Se (22.4% and up to 34.5% increases). CMG ERF 221-19 also benefited from Zn and Zn+Se fertilization, with gains of up to 27.6%. CMG ERF 85-15 consistently outperformed CMG 2188 under Se fertilization, with a 31.1% increase.
In Lambari, Zn+Se significantly enhanced Se uptake in all genotypes. Increases ranged from 30.4% in BRS Esmeralda to 67.5% in CMG ERF 221-19 compared with the control. CMG 2188 and CMG ERF 221-16 also responded well, with Zn+Se increases of ~50% over the control. Selenium alone was effective, especially in CMG ERF 221-16 and CMG ERF 85-15, with increases above 47%. Among genotypes, CMG ERF 221-19 had a higher Se intake than others by up to 46.2%. In Lavras, Se and Zn+Se treatments significantly increased Se intake. BRS Esmeralda and CMG 2188 showed similar gains (~49%). CMG ERF 221-16 and 221-19 increased to 64.7% with Zn+Se. CMG ERF 85-15 had a 42.4% gain with Se alone. Comparatively, CMG ERF 221-19 outperformed all genotypes under Zn+Se, with increases above 43%.
In Lambari, Zn+Se fertilization led to substantial increases in Se intake across genotypes, notably CMG ERF 221-16 (43.9%), ERF 221-19 (44.8%), and ERF 85-15 (up to 52.2%). Selenium fertilization alone also improved Se intake, particularly in CMG ERF 85-15 and CMG ERF 221-19 (≥40%). BRS Esmeralda fertilized with Zn had higher Se intake than most genotypes. In Lavras, Se application was most effective for Se intake, with CMG 2188 and CMG ERF 221-19 showing increases of over 50% compared with the control. Zn+Se boosted CMG 2188 by 55.3%, while CMG ERF 85-15 achieved ~47% with Zn and Zn+Se. CMG ERF 221-19 surpassed all genotypes under Zn+Se, with increases of up to 66.5% over BRS Esmeralda (Figure 5).

3.5. Grain Free Proteins and Free Amino Acids

In Lambari, BRS Esmeralda had higher protein levels under control and Zn treatments, with reductions of 36.9% and 46.0% under Zn+Se. In contrast, CMG ERF 221-16 and CMG ERF 85-15 showed marked increases under Zn+Se, with gains up to 56.0% and 60.3%, respectively. CMG 2188 responded positively to Zn, increasing protein by 23.5% over the control, and surpassed BRS Esmeralda, CMG ERF 221-16, and CMG ERF 221-19 by up to 66.5%. Under Se, CMG 2188 and CMG ERF 85-15 showed increases of ~33% over BRS Esmeralda and ~69% over CMG ERF 221-16 (Figure 6).
In Lavras, BRS Esmeralda had reduced protein content under Zn+Se (−37.8%) compared with Se and a 14.6% decline relative to Zn. CMG ERF 221-16 benefited from Zn+Se, with 48.1% and 31.3% increases over the control and Se, respectively. However, Zn alone reduced protein by over 40% across treatments. Overall, BRS Esmeralda had lower protein than other genotypes, while CMG ERF 85-15 and CMG 2188 had gains of over 40%. CMG 2188 responded strongly to Se, with increases of 30.6% over BRS Esmeralda and 41.8% over CMG ERF 221-16.
In Lambari, BRS Esmeralda showed higher protein contents with Zn+Se (40.3%), Zn (27.7%), and Se (34.2%) compared with the control. CMG 2188 improved protein content by ~33% under Zn+Se and ~27% under Zn. However, CMG ERF 221-19 and CMG ERF 85-15 had lower proteins with Zn+Se and Se. Notably, Zn+Se increased protein in BRS Esmeralda compared with CMG ERF 221-16 (30.4%) and CMG ERF 85-15 (22.6%). CMG ERF 221-19 fertilized with Zn had the highest increases, outperforming all other genotypes by up to 51.6%. Selenium application in CMG ERF 85-15 was also effective, with increases of over 50% relative to CMG 2188 and over 20% compared with other genotypes. In Lavras, BRS Esmeralda had 31.5% more protein under Se than Zn. CMG ERF 221-16 had the lowest levels under control, with gains of over 40% when fertilized. Zn+Se fertilization promoted significant increases in CMG ERF 85-15 (up to 58.7%) and CMG ERF 221-19 (up to 55.3%) over other genotypes. Zinc and Se individually also improved protein in both genotypes by more than 30%.
In Lambari, CMG 2188 had the highest amino acid content under control conditions, decreasing by 28.2% under Zn+Se. Conversely, CMG ERF 221-16 and 221-19 had strong positive responses to Zn+Se, with increases of over 30% compared with control or Se. CMG ERF 85-15 consistently increased with Se, reaching 41.8% over Zn and 69.2% over other genotypes. CMG ERF 221-19 also responded well to Se, surpassing BRS Esmeralda by 45.6%. In Lavras, CMG 2188 responded positively to Zn and Se, with ~33% increases over the control. CMG ERF 221-16 improved slightly under Se. However, CMG ERF 85-15 had substantial reductions under all fertilizations. Still, under Se, CMG ERF 221-16 surpassed CMG ERF 85-15 by 24.8%.
In Lambari, CMG 2188 had the highest amino acid content under Zn+Se, with gains of ~40% over all other treatments. In contrast, CMG ERF 221-16 decreased under Zn+Se. CMG ERF 85-15 responded strongly to all fertilizations, with Zn+Se increasing amino acid content by up to 65.4% over CMG ERF 221-16. Selenium also promoted significant gains, with increases of over 66% relative to BRS Esmeralda and over 45% compared with other genotypes. In Lavras, CMG 2188 showed increases of nearly 50% under Zn+Se. CMG ERF 221-19 and CMG ERF 85-15 also benefited, with 25–70% amino acid gains across treatments. CMG ERF 85-15 consistently outperformed other genotypes under Zn+Se and Se, with increases of over 60% relative to BRS Esmeralda and CMG 2188.

3.6. Principal Component Analysis

Figure 7 illustrates the results of the principal component analysis, which helps us understand the impact of different genotypes and treatments on the variables under study. These results have led to clusters categorized by genotype and treatment. The first two principal components explained 49.1% of the total variance in Lambari and 47.91% in Lavras. Our research revealed that CMG ERF 85-15 fertilized with Se positively influenced grain yield in Lambari. In Lavras, CMG 2188 and CMG ERF 85-15, which were fertilized with Zn, also impacted grain yield. In Lambari, most variables were grouped with the Zn+Se treatment, except for grain yield and free amino acids in whole grain. In Lavras, the variables related to Se, proteins, free amino acids in polished grain, hulling polished grain, hulling whole grain, and milling yield were grouped with the Zn+Se treatment.

4. Discussion

4.1. Agronomic Traits

Previous research has shown that organic Se addition improves yield and quality and fills the gaps in Zn addition [41]. However, later studies indicated meticulous zinc application significantly improves rice quality despite restricted yield growth [42]. Therefore, subsequent research has analyzed the synergistic impacts of biofortification of Zn+Se interaction on rice yield and quality, showing significant improvement [43].
The analysis of local crop variables revealed significant variations. This study assessed the stability of the results obtained from genotype and foliar treatment interactions by validating performance in the experimental areas. Genotype performance is inherently variable, particularly when evaluated across diverse environments. Genotype × environment interactions are crucial in advancing biofortification initiatives [30]. Understanding this interaction is essential for creating specific nutrient management strategies to enhance biofortification in various agricultural settings.
The hulling and milling characteristics of the grains were similar to findings in other studies, confirming the consistency of these observations across different research settings [30]. In some cases, fertilization with Se and Se + Zn resulted in a decrease in grain yield. The response of rice to foliar fertilization with Se may vary depending on the availability of Se in the soil, the genetic characteristics of each rice variety, and specific agricultural practices. Scientific studies suggest that excessive use of Se in foliar fertilization may reduce plant productivity, potentially due to factors such as nutrient imbalances, Se-related foliar toxicity, and complex interactions with other nutrients [44,45,46].
A study conducted with soybeans showed that exclusive fertilization with Se, at all tested doses, resulted in a reduction in grain yield, likely due to phytotoxicity and decreased leaf area. However, the mentioned study used four doses of Se (0.5; 1.0; 1.5; 2.0 kg ha−1) [47]. However, studies with different genotypes and Se sources showed that fertilization with low doses of Se increases grain yield [48]. This study made two applications of 0.125 mg Se plant−1, equivalent to a Se rate of 10 g Se ha−1.
Additionally, research conducted with rice cultivation revealed that soil fertilization with Se at doses ranging from 12 to 120 g Se ha−1 was adequate in translocating Se to the grains. However, no significant effects were observed on grain yield [49]. Another study on rice evaluated fertilization with urea enriched with Se via soil (80 g ha−1), and no difference in grain yield was observed [30]. Foliar fertilization with 30 g Se ha−1 in a Chinese rice variety using various forms (organic and inorganic) such as selenite, fermented Se, and potassium selenocyanate, did not show a significant change in grain yield [50]. Another study involving a Chinese variety showed that foliar fertilization with 75 g Se ha−1 using selenate and selenite sources resulted in a significant increase of 5.1% in rice grain yield regardless of the growth stage when the treatments were applied.
The fertilization with Zn in conjunction with Se reduced the adverse effects on grain yield in one of the genotypes. Zinc plays essential roles in various physiological processes in plants, including activating enzymes, repairing damage to Photosystem II, and participating in DNA transcription [51,52]. It is also reported that Zn enhances tolerance to various stresses, such as drought, salinity, heavy metal stress, and biotic stresses [53,54].

4.2. Grain Contents of Zn and Se

Foliar fertilization with the tested doses of Se and Zn in this study effectively increased the content and accumulation of these elements in whole and polished grains in all evaluated genotypes. However, overall, the content and accumulation of Zn and Se were higher in whole grains compared with polished grains. The performance of these variables in grains was influenced by industrial processing, the type of foliar fertilization, and the genotype. The combination of Zn+Se primarily benefited the Se content. The dose of Se used in this study had been evaluated previously, showing similar Se content in polished grains [49].
Additionally, comparable concentrations of Se were found in earlier studies on whole and polished rice grains for rates of 1000 L ha−1 with 0.8% Zn, 1250 L ha−1 with 0.2% Zn, and 500–600 L ha−1 with 0.2% Zn applied during the tillering + heading, panicle initiation + flowering, and booting + milking growth stages, respectively [55,56]. The primary storage sites of Zn in cereals are the protein storage vacuole of the embryo and the aleurone layer, where this mineral is stored along with phytate [57]. A study found that whole grains also had a greater capacity to retain Zn than polished grains [58]. Another research indicated that 25% to 30% of Zn was lost during polishing [59].
For selenium, a study on rice revealed that this element is generally present in all regions of the rice grains, including the hull, aleurone layer, and endosperm, regardless of the Se fertilization method. This result indicates a higher Se content in the endosperm, particularly near the edge of the polished grain. The central region of the grain and the embryo exhibited the lowest Se levels [49]. A lower accumulation of Se in the endosperm of rice grains (the predominant part of the polished grain) was reported with a 1 mg Se kg−1 soil dose compared with other parts [60].

4.3. Grain Uptake of Zn and Se

For zinc, some genotypes exhibited a negative response in Zn accumulation in processed grains when foliar fertilization was combined with Se compared with the isolated fertilization with Zn, resulting in an overall decrease in the Zn accumulation response in the Zn + Se treatment. The presence of Se in plants leads to competition among cations. Several studies have shown that adding Se significantly affects metal cations’ absorption and translocation, such as Fe, Cu, Hg, and Cd [61,62]. Due to chemical or physical similarities, these cations compete with Zn for absorption at transporters and biotic binding sites, reducing Zn uptake when multiple cations are present simultaneously [63,64].
In the case of Se accumulation, both positive and negative effects were observed in processed grains when foliar fertilization was used alongside Zn. Zinc can also positively influence Se accumulation in plants. For instance, Se enhances antioxidant activity through the biosynthesis of antioxidant enzymes like superoxide dismutase, with Zn acting as a cofactor. Therefore, an increase in Zn indirectly affects the rise in Se and vice versa [65,66]. One study assessed the combined fertilization with zinc sulfate, sodium selenite, and ferrous sulfate, finding no interaction effect between Zn and Fe on Se content [67]. However, it is essential to note that a different source of Se was utilized.
Another greenhouse study involving rice found that specific doses of soil-applied Zn can increase Se content in the grains [68]. Indeed, previous research has shown an antagonistic relationship between Se and Zn when applied foliar or through soil in crops like peas and wheat. This antagonism means that an increase in one element’s concentration may reduce the uptake or availability of the other component. Therefore, careful consideration should be given to the simultaneous fertilization with Se and Zn to avoid potential negative interactions and ensure optimal plant nutrient uptake [69,70].
The interaction between Zn and Se is complex and can affect the concentration of these elements in the body differently. This condition is due to the interaction between the genotype and the environment, which can increase or decrease the absorption and use of minerals. The interaction between these factors can lead to different Zn and Se levels depending on the conditions of the plant. Over time, research has shown how elements interact, revealing their interrelationships and the dynamics that support them.
Selenium, an essential trace element, plays a significant role in plants by improving photosynthesis and increasing mitochondrial respiration. These are essential for energy production and the proper functioning of several metabolic functions [71]. Similarly, Zn is widely recognized and valued for its crucial and multifaceted role in regulating photosynthesis. This process is fundamental to plant life and sustains the entire food chain [72]. Adequate Zn concentrations are essential for stomatal function, as they regulate transpiration and carbon dioxide uptake and improve electron transport in plant cells. This improvement optimizes photosynthesis and increases the efficiency of rice leaves, improving agricultural production. Gao et al. [42] highlight the importance of Zn, showing how this essential micronutrient affects plant growth and development. Therefore, ensuring adequate Zn concentrations is beneficial and necessary to maximize rice crop productivity. The interaction between Zn and Se amplifies photosynthesis in rice leaves by regulating stomatal variations, increasing pigment content, and improving electron transport. It is especially effective in the intermediate growth phase [43].
Furthermore, Zn and Se play a fundamental and indispensable role in protecting against free radicals. Free radicals are highly reactive and unstable molecules that, when in excess, can cause significant damage to cells. These minerals are essential for preserving cellular integrity in an environment full of oxidative stressors. Zinc plays a crucial role in reducing MDA levels, an indicator of oxidative stress, and it contributes significantly to maintaining cell membrane integrity. This beneficial effect is similar to that observed with Se, another important mineral for cellular health and protection against oxidative damage [73].
Both minerals are essential for plant function. They regulate antioxidant enzymes that neutralize free radicals and increase antioxidant levels, which are necessary for preserving cellular health and preventing oxidative damage. A lack of these minerals can considerably reduce the body’s ability to defend itself against oxidative stress, which can cause cellular damage. Therefore, ensuring an adequate supply of these minerals in sufficient quantities is essential, as this helps preserve cell membranes’ stability and reduces non-photochemical quenching.
Zinc plays a crucial role in photosynthesis, pigment production, and enzyme activation, while Se contributes to increased thylakoid accumulation [74,75]. These elements play an essential role in significantly increasing the efficiency of electron and light transport in rice leaves, leading to a considerable improvement in photosynthesis. With this optimization, plants can convert more sunlight into chemical energy, enhancing their growth and development. Thus, the presence of these elements becomes essential to maximize the productivity of rice crops.
Stomatal movement of leaves is essential to increasing photosynthetic efficiency in rice leaves, helping plants optimize gas exchange and the absorption of light and CO2. This efficiency is further enhanced by the beneficial interaction between Zn and Se, which act synergistically to improve the health and functioning of plant cells [43]. Photosynthesis is the primary chemical process worldwide, responsible for converting sunlight into chemical energy, which is essential for biomass production. This process provides a vital energy source for living beings and plays a crucial role in maintaining ecological balance by generating oxygen and absorbing carbon dioxide. In particular, photosynthesis significantly influences crops, affecting productivity and crop quality [76].

4.4. Grain Intake of Zn and Se

The minimum recommended intake for adults is estimated to be 11 mg daily for Zn and 55 μg day−1 for Se [77,78]. In the case of Zn, none of the techniques used for processing the grains, treatments, or genotypes met the minimum recommendation. However, it is essential to note that the values were close to the recommendation. Regarding Se in polished grains, only the genotype CMG ERF 85-15 with Zn + Se fertilization exceeded the recommendation. All genotypes that underwent Se fertilization for whole grains demonstrated the ability to surpass the minimum recommended intake. Two genotypes showed improved performance with combined fertilization with Se and Zn.

4.5. Grain Free Proteins and Free Amino Acids

Structures with high Se levels are lost in whole grains during polishing, decreasing the Se content. These differences relate to the roles of Zn and Se in protein synthesis. In Se-sensitive plant species, a high accumulation of Se has been linked to the non-specific substitution of sulfur-containing amino acids with their corresponding Se analogs. As a result, Se-sensitive plants exhibit higher levels of Se in their proteins than Se-tolerant plants, which have limitations in incorporating this element into proteins. Furthermore, it is essential to note that the non-protein amino acids methyl-selenocysteine and selenocystathionine, which contain Se, are rarely found in Se-sensitive plant species [79]. Zinc is crucial for determining protein structure and catalytic function, as it acts as a highly active Lewis’s acid that lacks redox activity under environmental and cellular conditions. This nutrient accounts for approximately 10% of protein functions in most eukaryotic proteomes [80].
These factors also clarify the effect of foliar treatments on proteins and amino acids in the examined genotypes. Generally, a more remarkable ability to accumulate Zn and Se was linked to a higher content of proteins and amino acids. However, based on the results presented, it can be inferred that the studied genotypes exhibited differing capacities to accumulate these compounds in their grain structures. This condition accounts for the variations observed in the results of foliar fertilizations related to genotypes and industrial grain processing. Zinc and Se, together with their interactions, have the potential to increase the protein content and improve the protein composition of rice, significantly contributing to improving its nutritional quality [43].

5. Conclusions

The application of 5.22 g ha1 of selenium (Se) and 1.42 kg ha1 of zinc (Zn) at different developmental stages increased the Se and Zn concentrations in both polished and brown rice across all evaluated genotypes. However, the grain yield varied depending on genotype and associated environmental conditions. Therefore, it is necessary to establish genotype- and environment-specific strategies for efficient biofortification. The consumption of brown rice is strongly recommended due to its higher Se and Zn contents, which enhances the benefits of biofortification, even though its current consumption remains limited. Moreover, Se and Zn fertilization can increase the levels of proteins and amino acids in rice grains, thereby improving the intake of these essential nutrients and proteins, which is critical in the fight against hidden hunger. This highlights the importance of biofortification in enhancing the protein composition of rice.
Zn and Se mutually influence each other’s content and uptake. Depending on the genotype × environment interaction, their relationship during uptake and translocation can be either synergistic or antagonistic. In this context, the genetic variability present in upland rice leads to significant differences in both micronutrient content and response to Zn and Se application. Specifically, the genotypes CMG ERF 221-19 and CMG ERF 85-15 exhibited efficient metabolism and positive synergistic effects when Zn and Se were applied in combination, with results significantly superior to individual applications. These findings emphasize the importance of appropriate biofortification management to optimize both the nutritional quality and productivity of rice. The results of this study contribute to a better understanding of the role of Se and Zn fertilization in the biofortification of upland rice, especially in nutrient-poor soils. Future research integrating the use of agrochemicals with these micronutrients is crucial to optimize application efficiency, reduce isolated interventions, and lower labor costs.

Author Contributions

Conceptualization, F.A.N., S.B.Z., P.A.N.B., A.P.B.C., F.A.D.M., F.B.S.B. and L.R.G.G.; validation, F.A.D.M., F.B.S.B. and L.R.G.G.; formal analysis, F.A.N., F.P.C., E.S.S.F. and R.F.R.C.; investigation, F.A.N., S.B.Z., P.A.N.B., G.F.d.S., M.A.S. and A.P.B.C.; resources, L.R.G.G.; data curation, F.A.N., and L.R.G.G.; writing—original draft, F.A.N., P.E.C., S.B.Z., P.A.N.B., E.G.d.M., F.A.D.M., F.B.S.B. and L.R.G.G.; writing—review and editing, F.A.N., P.E.C., S.B.Z., P.A.N.B., E.G.d.M., F.A.D.M., F.B.S.B. and L.R.G.G.; visualization, F.A.D.M., F.B.S.B. and L.R.G.G.; supervision, F.A.D.M., F.B.S.B. and L.R.G.G.; project administration, L.R.G.G.; and funding acquisition, L.R.G.G. All authors have read and agreed to the published version of the manuscript.

Funding

The authors declare that this study received funding from the Coordination for the Improvement of Higher Education Personnel (CAPES) (Grant Code-001) and the National Institute of Science and Technology (INCT) on Soil and Food Security, CNPq grant #406577/2022-6. The funder was not involved in the study design, collection, analysis, interpretation of data, the writing of this article, or the decision to submit it for publication.

Institutional Review Board Statement

Not applicable.

Data Availability Statement

The data presented in this study are available on request from the corresponding author.

Acknowledgments

The authors are grateful to the Coordination for the Improvement of Higher Education Personnel (CAPES), the National Council for Scientific and Technological Development (CNPq), and the Minas Gerais State Research Foundation (FAPEMIG) for their financial support and scholarships. Special thanks to CNPq grant #406577/2022-6—National Institute of Science and Technology on Soil and Food Security.

Conflicts of Interest

The authors declare no conflicts of interest. The funders had no role in the study’s design, data collection, analysis, interpretation, manuscript writing, or decision to publish the results. The author, Fábio Aurélio Dias Martins, was employed by the Agricultural Research Company of Minas Gerais. The remaining authors declare that the research was conducted without commercial or financial relationships that could be construed as a potential conflict of interest.

References

  1. USDA (United States Department of Agriculture). Food Data Central: United States Department of Agriculture; United States Department of Agriculture: Washington, DC, USA, 2019. Available online: https://fdc.nal.usda.gov/ (accessed on 2 February 2024).
  2. Muthayya, S.; Rah, J.H.; Sugimoto, J.D.; Roos, F.F.; Kraemer, K.; Black, R.E. The Global Hidden Hunger Indices and Maps: An Advocacy Tool for Action. PLoS ONE 2013, 8, e67860. [Google Scholar] [CrossRef] [PubMed]
  3. Feng, R.; Wei, C.; Tu, S. The roles of selenium in protecting plants against abiotic stresses. Environ. Exp. Bot. 2013, 87, 58–68. [Google Scholar] [CrossRef]
  4. Zheng, S.; Xu, C.; Lv, G.; Shuai, H.; Zhang, Q.; Zhu, Q.; Zhu, H.; Huang, D. Foliar zinc reduced Cd accumulation in grains by inhibiting Cd mobility in the xylem and increasing Cd retention ability in roots1. Environ. Pollut. 2023, 333, 122046. [Google Scholar] [CrossRef] [PubMed]
  5. Cakmak, I. Plant nutrition research: Priorities to meet human needs for food in sustainable ways. Plant Soil 2002, 247, 3–24. [Google Scholar] [CrossRef]
  6. Fordyce, F.M. Selenium Deficiency and Toxicity in the Environment. In Essentials of Medical Geology; Selinus, O., Ed.; Springer: Dordrecht, The Netherlands, 2013. [Google Scholar] [CrossRef]
  7. Newman, R.; Waterland, N.; Moon, Y.; Tou, J.C. Selenium Biofortification of Agricultural Crops and Effects on Plant Nutrients and Bioactive Compounds Important for Human Health and Disease Prevention—A Review. Plant Foods Hum. Nutr. 2019, 74, 449–460. [Google Scholar] [CrossRef]
  8. Lowe, N.M.; Hall, A.G.; Broadley, M.R.; Foley, J.; Boy, E.; Bhutta, Z.A. Preventing and Controlling Zinc Deficiency Across the Life Course: A Call to Action. Adv. Nutr. 2024, 15, 100181. [Google Scholar] [CrossRef]
  9. Cai, Y.; Xu, W.; Wang, M.; Chen, W.; Li, X.; Li, Y.; Cai, Y. Mechanisms and uncertainties of Zn supply on regulating rice Cd uptake. Environ. Pollut. 2019, 253, 959–965. [Google Scholar] [CrossRef]
  10. Chen, Y.; Ma, Z.F.; Yu, D.; Jiang, Z.; Wang, B.; Yuan, L. Geographical distribution of trace elements (selenium, zinc, iron, copper) and case fatality rate of COVID-19: A national analysis across conterminous USA. Environ. Geochem. Health 2022, 44, 4423–4436. [Google Scholar] [CrossRef]
  11. Krebs, N.F.; Miller, L.V.; Michael Hambidge, K. Zinc deficiency in infants and children: A review of its complex and synergistic interactions. Paediatr. Int. Child Health 2014, 34, 279–288. [Google Scholar] [CrossRef]
  12. Terrin, G.; Berni Canani, R.; Di Chiara, M.; Pietravalle, A.; Aleandri, V.; Conte, F.; De Curtis, M. Zinc in Early Life: A Key Element in the Fetus and Preterm Neonate. Nutrients 2015, 7, 10427–10446. [Google Scholar] [CrossRef]
  13. Rayman, M.P. Food-chain selenium and human health: Emphasis on intake. Br. J. Nutr. 2008, 100, 254–268. [Google Scholar] [CrossRef] [PubMed]
  14. Zhu, Y.; Wu, W.; Zhao, G.; Guo, Y. Progress of selenium biological transformation in animals, plants, and microorganisms. JARE 2018, 35, 189–198. [Google Scholar] [CrossRef]
  15. Roda, F.A.; Marques, I.; Esquível, M.G.; Ndayiragije, A.; Lidon, F.C.; Swamy, B.P.; Ramalho, J.C.; Ribeiro-Barros, A.I. Rice Biofortification With Zinc and Selenium: A Transcriptomic Approach to Understand Mineral Accumulation in Flag Leaves. Front. Genet. 2020, 11, 520396. [Google Scholar] [CrossRef] [PubMed]
  16. Blomberg, S.B. The Copenhagen Consensus: Perspective Paper on Transnational Terrorism Policies. JSTOR 2008. Available online: https://www.jstor.org/stable/resrep25503 (accessed on 12 July 2024).
  17. Bouis, H.E.; Saltzman, A. Improving nutrition through biofortification: A review of evidence from HarvestPlus, 2003 through 2016. Glob. Food Sec. 2017, 12, 49–58. [Google Scholar] [CrossRef]
  18. Garg, M.; Sharma, N.; Sharma, S.; Kapoor, P.; Kumar, A.; Chunduri, V.; Arora, P. Biofortified Crops Generated by Breeding, Agronomy, and Transgenic Approaches Are Improving Lives of Millions of People around the World. Front. Nutr. 2018, 5, 12. [Google Scholar] [CrossRef]
  19. USDA ERS (United States Department of Agriculture Economic Research Service). Rice Yearbook; United States Department of Agriculture: Washington, DC, USA, 2019. Available online: https://www.ers.usda.gov/data-products/rice-yearbook/ (accessed on 20 August 2023).
  20. FAOSTAT (Food and Agriculture Organization of the United Nations). Crops and Livestock Products; Food and Agriculture Organisation of the United Nations: Rome, Italy, 2020; Available online: https://www.fao.org/faostat/en/#data/QCL (accessed on 12 July 2024).
  21. FAO. The State of Food and Agriculture—Climate Change, Agriculture and Food Security; Food and Agriculture Organization of the United Nations: Rome, Italy, 2016. [Google Scholar]
  22. Muthayya, S.; Sugimoto, J.D.; Montgomery, S.; Maberly, G.F. An overview of global rice production, supply, trade, and consumption. Ann. N. Y. Acad. Sci. 2014, 1324, 7–14. [Google Scholar] [CrossRef]
  23. Walter, M.; Marchezan, E.; Avila, L.A. Arroz: Composição e características nutricionais. Cienc. Rural. 2008, 38, 1184–1192. [Google Scholar] [CrossRef]
  24. Ramalho, J.C.; Roda, F.A.; Pessoa, M.F.G.; Reboredo, F.H.; Pais, I.P.; Ndayiragije, A.; Lindo, F.C.; Ribeiro-Barros, A.I. Selenium agronomic biofortification in rice: Improving crop quality against malnutrition. In The Future of Rice Demand: Quality Beyond Productivity; Oliveira, A.C., Pegoraro, C., Viana, V.E., Eds.; Springer Nature: Cham, Switzerland, 2020; Chapter 8; pp. 179–203. [Google Scholar] [CrossRef]
  25. Martins, F.B.; Gonzaga, G.; Santos, D.F.; Reboita, M.S. Classificação climática de KÖPPEN e de THORNTHWAITE para Minas Gerais: Cenário atual e projeções futuras. Rev. Bras. Climatol. 2018, 1, 129–156. [Google Scholar] [CrossRef]
  26. Dos Santos, H.G.; Jacomine, P.K.T.; Anjos, L.H.C.D.; de Oliveira, V.A.; Lumbreras, J.F.; Coelho, M.R.; de Almeida, J.A.; de Araújo Filho, J.C.; de Oliveira, J.B.; Cunha, T.J.F. Sistema Brasileiro de Classificação de Solos; Embrapa Solos: Brasília, Brazil, 2018. [Google Scholar]
  27. Teixeira, P.C.; Donagemma, G.K.; Fontana, A.; Teixeira, W.G. Manual de Métodos de Análise de Solo, 3rd ed.; Embrapa: Brasília, Brazil, 2017. [Google Scholar]
  28. USEPA (United States Environmental Protection Agency). Microwave Assisted Acid Digestion of Sediments Sludge, Soils, and Oils; EPA SW 846:3051A; United States Environmental Protection Agency: Washington, DC, USA, 2007.
  29. Sousa, D.M.G.; Lobato, E. Cerrado: Correção do Solo e Adubação; Embrapa Informação Tecnológica: Planaltina, Brazil, 2004. [Google Scholar]
  30. Félix, M.R.; Zauza, S.B.; Namorato, F.A.; Castro, D.G.; Martins, F.A.D.; de Lima Lessa, J.H.; Guilherme, L.R.G.; Botelho, F.B.S. Biofortification of Upland Rice Using Selenium-Enriched Urea: Evaluation of Potential Genotypes. J. Food Compos. Anal. 2023, 122, 105409. [Google Scholar] [CrossRef]
  31. MAPA (Ministério da Agricultura, Pecuária e Abastecimento). Regras para Análises de Sementes; MAPA/ACS: Brasília, Brazil, 2009. [Google Scholar]
  32. Zanandrea, I.; Alves, J.D.; Deuner, S.; Goulart, P.F.P.; Henrique, P.C.; Silveira, N.M. Tolerance of Sesbania virgata plants to flooding. Aust. J. Bot. 2010, 57, 661–669. [Google Scholar] [CrossRef]
  33. Bradford, M.M. A rapid and sensitive method for the quantitation of microgram quantities of protein utilizing the principle of protein-dye binding. Anal. Biochem. 1976, 72, 248–254. [Google Scholar] [CrossRef]
  34. Cocking, E.C.; Yemm, E.W. Estimation of amino acids by ninhydrin. Biochem. J. 1954, 58, 12. [Google Scholar]
  35. Ducsay, L.; Ložek, O.; Marček, M.; Varényiová, M.; Hozlár, P.; Lošák, T. Possibility of selenium biofortification of winter wheat grain. Plant Soil Environ. 2016, 62, 379–383. [Google Scholar] [CrossRef]
  36. Lessa, J.H.L.; Raymundo, J.F.; Corguinha, A.P.B.; Martins, F.A.D.; Araujo, A.M.; Santiago, F.E.M.; Carvalho, H.W.P.; Guilherme, L.R.G.; Lopes, G. Strategies for applying selenium for biofortification of rice in tropical soils and their effect on element accumulation and distribution in grains. J. Cereal Sci. 2020, 96, 103125. [Google Scholar] [CrossRef]
  37. R Core Team. R: A Language and Environment Statistical Computing; R Foundation for Statistical Computing: Vienna, Austria, 2024. [Google Scholar]
  38. Pimentel-Gomes, F. Curso de Estatística Experimental, 15th ed.; Fealq: Piracicaba, Brazil, 2009. [Google Scholar]
  39. Cao, Y.; Williams, D.D.; Williams, N.E. Data transformation and standardization in the multivariate analysis of river water quality. Ecol. Appl. 1999, 9, 669–677. [Google Scholar] [CrossRef]
  40. Hair Junior, J.F.; Black, W.C.; Babin, B.J.; Anderson, R.E.; Tatham, R.L. Análise Multivariada de Dados, 6th ed.; Bookman: Porto Alegre, Brazil, 2009. [Google Scholar]
  41. Shang, G.; Meng, Z.; Qinyue, Z.; Feng, X.; Zhang, W. Effects of exogenous zinc (ZnSO4·7H2O) on photosynthetic characteristics and grain quality of hybrid rice. Plant Physiol. Biochem. 2023, 205, 108049. [Google Scholar] [CrossRef]
  42. Gao, S.; Zhou, M.; Xu, J.; Xu, F.; Zhang, W. The application of organic selenium (SeMet) improve the photosynthetic characteristics, yield and quality of hybrid rice. Plant Physiol. Biochem. 2024, 208, 108457. [Google Scholar] [CrossRef]
  43. Gao, S.; Tang, X.; Zhang, J.; Zhou, Q.; Peng, T.; Liu, A.; Xue, Y.; Xu, F.; Li, P. Zinc-selenium interaction regulates leaf photosynthesis and mediates grain sugar metabolism to improve the yield and quality of hybrid rice: A physiological perspective. Plant Physiol. Biochem. 2025, 221, 109611. [Google Scholar] [CrossRef] [PubMed]
  44. Cardoso, A.A.S.; Gomes, F.T.L.; Antonio, J.R.R.; Guilherme, L.R.G.; Liu, J.; Li, L.; Silva, M.L.S. Sulfate availability and soil selenate adsorption alleviate selenium toxicity in rice plants. Environ. Exp. Bot. 2022, 201, 104971. [Google Scholar] [CrossRef]
  45. Gui, J.-Y.; Rao, S.; Huang, X.; Liu, X.; Cheng, S.; Xu, F. Interaction between selenium and essential micronutrient elements in plants: A systematic review. Sci. Total Environ. 2022, 853, 158673. [Google Scholar] [CrossRef]
  46. Kolbert, Z.; Molnár, Á.; Feigl, G.; Van Hoewyk, D. Plant Selenium Toxicity: Proteome in the Crosshairs. J. Plant Physiol. 2019, 232, 291–300. [Google Scholar] [CrossRef] [PubMed]
  47. Martinez, R.A.S.; Rezende, P.M.; Alvarenga, A.A.; Andrade, M.J.B.; Passos, A.M.A. Doses and forms of selenium application on the culture of soybean. Cienc. E Agrotecnol. 2009, 33, 698–704. [Google Scholar] [CrossRef]
  48. Cipriano, P.E.; da Silva, R.F.; de Oliveira, C.; de Lima, A.B.; Martins, F.A.D.; Celante, G.; dos Santos, A.A.; Archilha, M.V.L.R.; Pinatto Botelho, M.F.; Faquin, V.; et al. Sodium Selenate, Potassium Hydroxy-Selenide, Acetylselenide and Their Effect on Antioxidant Metabolism and Plant Nutrition and Yield in Sorghum Genotypes. Foods 2023, 12, 2034. [Google Scholar] [CrossRef] [PubMed]
  49. Lessa, J.H.L.; Araujo, A.M.; Ferreira, L.A.; da Silva Júnior, E.C.; de Oliveira, C.; Corguinha, A.P.B.; Martins, F.A.D.; de Carvalho, H.W.P.; Guilherme, L.R.G.; Lopes, G. Agronomic Biofortification of Rice (Oryza sativa L.) with Selenium and Its Effect on Element Distributions in Biofortified Grains. Plant Soil 2019, 444, 331–342. [Google Scholar] [CrossRef]
  50. Yuan, Z.; Long, W.; Liang, T.; Zhu, M.; Zhu, A.; Luo, X.; Fu, L.; Hu, Z.; Zhu, R.; Wu, X. Effect of foliar spraying of organic and inorganic selenium fertilizers during different growth stages on selenium accumulation and speciation in rice. Plant Soil 2023, 486, 87–101. [Google Scholar] [CrossRef]
  51. Hänsch, R.; Mendel, R.R. Physiological functions of mineral micronutrients (Cu, Zn, Mn, Fe, Ni, Mo, B, Cl). Curr. Opin. Plant Biol. 2009, 12, 259–266. [Google Scholar] [CrossRef]
  52. Palmer, C.M.; Guerinot, M.L. Facing the challenges of Cu, Fe, and Zn homeostasis in plants. Nat. Chem. Biol. 2009, 5, 333–340. [Google Scholar] [CrossRef]
  53. Al-Zahrani, H.S.; Alharby, H.F.; Hakeem, K.R.; Rehman, R.U. Exogenous Application of Zinc to Mitigate the Salt Stress in Vigna radiata (L.) Wilczek—Evaluation of Physiological and Biochemical Processes. Plants 2021, 10, 1005. [Google Scholar] [CrossRef]
  54. Hussein, M.M.; Abou-Baker, N.H. The contribution of nano-zinc to alleviate salinity stress on cotton plants. R. Soc. Open Sci. 2018, 5, 171809. [Google Scholar] [CrossRef]
  55. Mabesa, R.L.; Impa, S.M.; Grewal, D.; Johnson-Beebout, S.E. Contrasting grain-Zn response of biofortification rice (Oryza sativa L.) breeding lines to foliar Zn application. F. Crop. Res. 2013, 149, 223–233. [Google Scholar] [CrossRef]
  56. Phattarakul, N.; Rerkasem, B.; Li, L.J.; Wu, L.H.; Zou, C.Q.; Ram, H.; Sohu, V.S.; Kang, B.S.; Surek, H.; Kalayci, M.; et al. Biofortification of rice grain with zinc through zinc fertilization in different countries. Plant Soil 2012, 361, 131–141. [Google Scholar] [CrossRef]
  57. Brinch-Pedersen, H.; Borg, S.; Tauris, B.; Holm, P.B. Molecular genetic approaches to increasing mineral availability and vitamin content of cereals. J. Cereal Sci. 2007, 46, 308–326. [Google Scholar] [CrossRef]
  58. Boonchuay, P.; Cakmak, I.; Rerkasem, B.; Prom-U-Thai, C. Effect of different foliar zinc application at different growth stages on seed zinc concentration and its impact on seedling vigor in rice. Soil Sci. Plant Nutr. 2013, 59, 180–188. [Google Scholar] [CrossRef]
  59. Rao, S.D.; Neeraja, C.N.; Babu, P.M.; Nirmala, B.; Suman, K.; Rao, L.V.S.; Surekha, K.; Raghu, P.; Longvah, T.; Surendra, P.; et al. Zinc biofortified rice varieties: Challenges, possibilities, and progress in India. Front Nutr. 2020, 7, 26. [Google Scholar] [CrossRef]
  60. Farooq, M.U.; Zhu, J. The paradox in accumulation behavior of cadmium and selenium at different planting times in rice. Environ. Sci. Pollut. Res. 2019, 26, 22421–22430. [Google Scholar] [CrossRef]
  61. Ismael, M.A.; Elyamine, A.M.; Moussa, M.G.; Cai, M.; Zhao, X.; Hu, C. Cadmium in plants: Uptake, toxicity, and its interactions with selenium fertilizers. Metallomics 2019, 11, 255–277. [Google Scholar] [CrossRef]
  62. Zhou, X.; Yang, J.; Kronzucker, H.J.; Shi, W. Selenium Biofortification and Interaction with Other Elements in Plants: A Review. Front. Plant Sci. 2020, 11, 586421. [Google Scholar] [CrossRef]
  63. Barwinska-Sendra, A.; Waldron, K.J. The Role of Intermetal Competition and Mis-Metalation in Metal Toxicity. In Advances in Microbial Physiology; Poole, R.K., Ed.; Academic Press: London, UK, 2017; pp. 315–379. [Google Scholar] [CrossRef]
  64. Huang, S.; Sasaki, A.; Yamaji, N.; Okada, H.; Mitani-Ueno, N.; Ma, J.F. The ZIP Transporter Family Member OsZIP9 Contributes to Root Zinc Uptake in Rice under Zinc-Limited Conditions. Plant Physiol. 2020, 183, 1224–1234. [Google Scholar] [CrossRef]
  65. Ulhassan, Z.; Huang, Q.; Gill, R.A.; Ali, S.; Mwamba, T.M.; Ali, B.; Hina, F.; Zhou, W. Protective mechanisms of melatonin against selenium toxicity in Brassica napus: Insights into physiological traits, thiol biosynthesis and antioxidant machinery. BMC Plant Biol. 2019, 19, 507. [Google Scholar] [CrossRef]
  66. Wu, M.; Cong, X.; Li, M.; Rao, S.; Liu, Y.; Guo, J.; Zhu, S.; Chen, S.; Xu, F.; Cheng, S.; et al. Effects of different exogenous selenium on Se accumulation, nutrition quality, elements uptake, and antioxidant response in the hyperaccumulation plant Cardamine violifolia. Ecotoxicol. Environ. Saf. 2020, 204, 111045. [Google Scholar] [CrossRef]
  67. Fang, Y.; Wang, L.; Xin, Z.; Zhao, L.; An, X.; Hu, Q. Effect of Foliar Application of Zinc, Selenium, and Iron Fertilizers on Nutrients Concentration and Yield of Rice Grain in China. J. Agric. Food Chem. 2008, 56, 2079–2084. [Google Scholar] [CrossRef] [PubMed]
  68. Ei, H.H.; Zheng, T.; Farooq, M.U.; Zeng, R.; Su, Y.; Zhang, Y.; Liang, Y.; Tang, Z.; Ye, X.; Jia, X.; et al. Impact of selenium, zinc and their interaction on key enzymes, grain yield, selenium, zinc concentrations, and seedling vigor of biofortified rice. Environ. Sci. Pollut. Res. 2020, 27, 16940–16949. [Google Scholar] [CrossRef]
  69. Germ, M.; Pongrac, P.; Regvar, M.; Vogel-Mikuš, K.; Stibilj, V.; Jaćimović, R.; Kreft, I. Impact of double Zn and Se biofortification of wheat plants on the element concentrations in the grain. Plant, Soil Environ. 2013, 59, 316–321. [Google Scholar] [CrossRef]
  70. Poblaciones, M.J.; Rengel, Z. Combined foliar selenium and zinc biofortification in field pea (Pisum sativum): Accumulation and bioavailability in raw and cooked grains. Crop Pasture Sci. 2017, 68, 265. [Google Scholar] [CrossRef]
  71. Germ, M.; Kreft, I.; Stibilj, V.; Urbanc-Berčič, O. Combined effects of selenium and drought on photosynthesis and mitochondrial respiration in potato. Plant Physiol. Biochem. 2007, 45, 162–167. [Google Scholar] [CrossRef]
  72. Adamczyk-Szabela, D.; Wolf, W.M. The Influence of Copper and Zinc on Photosynthesis and Phenolic Levels in Basil (Ocimum basilicum L.), Borage (Borago officinalis L.), Common Nettle (Urtica dioica L.) and Peppermint (Mentha piperita L.). Int. J. Mol. Sci. 2024, 25, 3612. [Google Scholar] [CrossRef] [PubMed]
  73. Jain, R.; Verma, R.; Singh, A.; Chandra, A.; Solomon, S. Influence of selenium on metallothionein gene expression and physiological characteristics of sugarcane plants. Plant Growth Regul. 2015, 77, 109–115. [Google Scholar] [CrossRef]
  74. Gao, S.; Cai, L.P.; Shan, C.J. Effect of selenomethionine on photosynthetic characteristics and chlorophyll fluorescence parameters of strawberries. J. Irrig. Drain. 2020, 39, 16–23. [Google Scholar]
  75. Qiao, X.; He, Y.; Wang, Z.; Li, X.; Zhang, K.; Zeng, H. Effect of foliar spray of zinc on chloroplast β-carbonic anhydrase expression and enzyme activity in rice (Oryza sativa L.) leaves. Acta Physiol. Plant 2014, 36, 263–272. [Google Scholar] [CrossRef]
  76. Ren, D.; Ding, C.; Qian, Q. Molecular bases of rice grain size and quality for optimized productivity. Sci. Bull. 2023, 68, 314–350. [Google Scholar] [CrossRef]
  77. Monsen, E.R. Dietary Reference Intakes for The Antioxidant Nutrients. J. Am. Diet. Assoc. 2000, 100, 637–640. [Google Scholar] [CrossRef] [PubMed]
  78. Trumbo, P.; Yates, A.A.; Schlicker, S.; Poos, M. Dietary Reference Intakes. J. Am. Diet. Assoc. 2001, 101, 294–301. [Google Scholar] [CrossRef] [PubMed]
  79. Brown, T.A.; Shrift, A. Selenium: Toxicity and tolerance in higher plants. Biol. Rev. 1982, 57, 59–84. [Google Scholar] [CrossRef]
  80. Stanton, C.; Sanders, D.; Krämer, U.; Podar, D. Zinc in plants: Integrating homeostasis and biofortification. Mol. Plant 2022, 15, 65–85. [Google Scholar] [CrossRef]
Figure 1. Experiment localization.
Agriculture 15 01186 g001
Figure 2. Grain yield (A), hulling whole grain (B), hulling polished grain (C), and milling yield (D). Capital letters compare treatments for the same genotype. Lowercase letters compare genotypes for the same treatment. Means followed by the same letter do not differ according to the Tukey test at 5% probability. The bars show the means, and the vertical error bars refer to the standard errors (n = 3).
Agriculture 15 01186 g002
Figure 3. Zinc content in whole grain (A), Zn content in polished grain (B), Se content in whole grain (C), Se content in polished grain (D). Capital letters compare treatments for the same genotype. Lowercase letters compare genotypes for the same treatment. Means followed by the same letter do not differ, according to the Tukey test at 5% probability. The bars show the means, and the vertical error bars refer to the standard errors (n = 3).
Agriculture 15 01186 g003
Figure 4. Zinc uptake in whole grain (A), Zn uptake in polished grain (B), Se uptake in whole grain (C), and Se uptake in polished grain (D). Capital letters compare treatments for the same genotype. Lowercase letters compare genotypes for the same treatment. Means followed by the same letter do not differ, according to the Tukey test at 5% probability. The bars show the means, and the vertical error bars refer to the standard errors (n = 3).
Agriculture 15 01186 g004
Figure 5. Zinc intake in whole grain (A), Zn intake in polished grain (B), Se intake in whole grain (C), and Se intake in polished grain(D). Capital letters compare treatments for the same genotype. Lowercase letters compare genotypes for the same treatment. Means followed by the same letter do not differ, according to the Tukey test at 5% probability. The bars show the means, and the vertical error bars refer to the standard errors (n = 3).
Agriculture 15 01186 g005
Figure 6. Free proteins in whole grain (A), free proteins in polished grain (B), free amino acids in whole grain (C), and free amino acids in polished grain (D). Capital letters compare treatments for the same genotype. Lowercase letters compare genotypes for the same treatment. Means followed by the same letter do not differ, according to the Tukey test at 5% probability. The bars show the means, and the vertical error bars refer to the standard errors (n = 3).
Agriculture 15 01186 g006
Figure 7. Principal component analyses for (A) Lambari e (B) Lavras. Abbreviations: free amino acids in polished grain (ATSPG), free amino acids in whole grain (ATSWG), grain yield (GY), hulling polished grain (HPG), hulling whole grain (HWG), milling yield (MY), free proteins in polished grain (PTSPG), free proteins in whole grain (PTSWG), Se content in polished grain (SeCPG), Se content in whole grain (SeCWG), Se intake in polished grain (SeIPW), Se intake in whole grain (SeIWG), Se uptake in polished grain (SeUPG), Se uptake in whole grain (SeUWG), Zn content in polished grain (ZnCPG), Zn content in whole grain (ZnCWG), Zn intake in polished grain (ZnIPG), Zn intake in whole grain (ZnIWG), Zn uptake in polished grain (ZnUPG), and Zn uptake in whole grain (ZnUWG).
Agriculture 15 01186 g007
Table 1. Chemical and physical attributes of the studied soils.
Attributes (0–20 cm)LavrasLambari
pH—active acidity4.94.7
Potassiumavailable (mg dm−3)86.8562.07
Phosphorusavailable (mg dm−3)20.6412.49
Calciumavailable (cmolc dm−3)2.261.55
Magnesiumavailable (cmolc dm−3)0.590.21
Aluminumavailable (cmolc dm−3)0.301.10
H+Al—potential acidity (cmolc dm−3)7.508
SB—Sum of bases (cmolc dm−3)3.071.92
t—Effective cation exchange capacity (cmolc dm−3)3.373.02
T—Total cation exchange capacity (cmolc dm−3)10.579.92
V—base saturation (%)29.0719.35
m—Aluminum saturation (%)8.9036.42
OM—Organic matter (dag kg−1)2.642.63
Zincavailable (mg dm−3)2.701.20
Ironavailable (mg dm−3)30.6066.90
Manganeseavailable (mg dm−3)1217.10
Copperavailable (mg dm−3)0.4069.50
Boronavailable (mg dm−3)0.080.01
Sulfuravailable (mg dm−3)5.304.80
Clay (dag kg−1)4636
Silt (dag kg−1)1332
Sand (dag kg−1)4132
Seleniumtotal (mg kg−1)0.290.18
Table 2. Fertilization and soil amendments in the studied soils.
Soil Amendment Before Planting (60 Days Before Sowing).
NutrientsLavrasLambariSources
Calcium and magnesiumV% = 50Not applied CaCO3/MgCO3
Dolomitic limestone
Fertilization at planting
Nitrogen20 kg ha−120 kg ha−1*8-28-16 (Urea—Simple
superphosphate—
potassium chloride)
Phosphorus35 kg ha−170 kg ha−1
Potassium20 kg ha−140 kg ha−1
Top-dressing fertilization (40 days after sowing)
Nitrogen50 kg ha−150 kg ha−1Ammonium sulfate
Potassium20 kg ha−120 kg ha−1Potassium chloride
*8-28-16 = commercial formulation with respective percentages of nitrogen, phosphorus, and potassium.
Table 3. Analysis of variance individual.
F-Test
Source of Variation LambariLavras
BGTG × TCVBGTG × TCV
Milling yield3.26 *22.20 **1.93 ns3.86 **10.871.01 ns48.26 **4.95 **1.01 ns9.03
Grain yield5.17 *25.19 **3.33 *6.06 **14.152.44 ns15.52 **5.60 **3.92 **16.38
Whole Grain
Hulling 1.27 ns4.02 **3.69 *5.31 **2.560.71 ns1.33 ns2.12 ns1.27 ns2.23
Se content 1.55 ns7.59 **59.36 **3.50 **18.031.48 ns29.57 **131.68 **7.35 **12.15
Zn content 12.69 **20.49 **52.34 **2.57 *8.471.72 ns16.88 **39.08 **2.29 *8.25
Se uptake 0.23 ns48.92 **82.51 **8.87 **16.001.84 ns50.20 **55.46 **20.25 **13.82
Zn uptake 3.25 *25.11 **38.72 **5.08 **12.885.17 *49.56 **51.51 **17.78 **9.64
Se intake 1.26 ns16.23 **128.79 **7.76 **12.25 1.79 ns54.87 **241.68 **13.66 **8.90
Zinc intake 10.42 **13.63 **34.76 **1.71 ns10.39 4.16 *15.66 **36.30 **2.13 *8.56
Free proteins 1.32 ns23.28 **3.12 *4.47 **19.190.09 ns22.35 **3.01 *9.23 **11.41
Free amino acids 0.15 ns38.63 **5.64 **13.34 **11.040.70 ns4.74 **4.83 **4.89 **13.77
Polished Grain
Hulling 0.19 ns9.74 **0.59 ns1.89 ns3.730.17 ns2.49 ns0.80 ns1.47 ns2.59
Se content 1.95 ns6.96 **52.35 **2.21 *13.962.58 ns2.74 *54.29 **11.23 **12.96
Zn content 15.77 **16.34 **20.20 **2.73 **9.803.07 ns7.37 **22.96 **1.42 ns9.08
Se uptake 1.28 ns43.08 **68.31 **8.95 **13.004.61 *23.99 **19.48 **23.29 **14.15
Zn uptake 0.37 ns23.12 **17.45 **3.59 **17.501.59ns9.90 **14.18 **5.54 **17.27
Se intake 2.04 ns22.29 **172.89 **7.56 **7.622.22 ns7.46 **151.76 **32.48 **7.67
Zn intake 15.23 **21.90 **27.14 **3.65 **8.463.07 ns7.37 **22.99 **1.42 ns9.08
Free proteins 0.51 ns28.02 **4.15 *7.69 **12.801.02 ns109.31 **11.34 **2.83 **11.28
Free amino acids 0.69 ns75.94 **28.34 **13.60 **12.801.31 ns72.03 **72.16 **24.12 **10.51
B—block; G—genotype; T—Treatment; G × T—genotype × treatment; ns—not significant by F-test; *—significant by F-test at p < 0.05; **—significant by F-test at p < 0.01. CV—coefficient of variation (%). Degrees of freedom: block (B)—2; genotypes (G)—4; treatment (T)—3.
Table 4. Joint variance analysis.
Source of VariationFMaxF-Test
BGTLB × LG × TL × GL × TL × G × TCV (%)
Milling yield0.262.48 ns56.62 **6.36 **1913.26 **0.48 ns1.67 ns29.03 **2.29 ns1.54 ns10.07
Grain yield0.486.04 **12.53 **6.75 **57.44 **0.63 ns3.15 **24.82 **2.98 *6.08 **15.63
Whole Grain
Hulling 0.940.10 ns4.33 **5.23 **598.56 **1.90 ns3.18 **1.10 ns0.63 ns3.53 **2.39
Se content 0.702.94 ns24.24 **175.54 **64.38 **0.10 ns7.48 **9.08 **2.88 *2.69 **14.83
Zn content 0.673.50 *30.28 **86.02 **212.34 **8.76 **1.37 ns6.38 **2.80 *3.44 **8.39
Se uptake 0.491.66 ns53.60 **124.90 **328.30 **0.96 ns24.78 **45.96 **3.84 *8.24 **14.87
Zinc uptake 0.616.67 **52.16 **70.10 **697.79 **2.22 ns10.42 **28.48 **23.25 **15.54 **10.91
Se intake 0.812.97 ns48.18 **353.65 **126.62 **0.02 ns14.73 **18.91 **5.12 **6.08 **10.41
Zinc intake 0.942.46 ns24.23 **68.87 **169.80 **11.93 **1.09 ns5.12 **2.24 ns2.75 **9.38
Free proteins 0.360.83 ns39.64 **3.65 *0.07 ns1.16 ns7.84 **6.42 **2.53 ns3.62 **15.76
Free amino acids 0.770.14 ns29.69 **6.79 **15.02 **0.78 ns5.65 **9.18 **3.58 *11.46 **12.37
Polished Grain
Hulling 0.590.64 ns9.33 **0.53 ns334.64 **0.30 ns2.00 *4.75 **0.81 ns1.46 ns3.15
Se content 0.920.30 ns5.04 **102.96 **21.91 **4.26 *7.46 **4.48 **3.76 *6.35 **13.44
Zn content 0.943.14 *15.29 **42.05 **37.47 **15.33 **1.90 *8.15 **1.18 ns2.21 *9.42
Se uptake 0.333.78 *15.90 **54.28 **312.10 **3.78 *20.41 **41.61 **90.06 **19.00 **14.19
Zn uptake 0.391.53 ns11.82 **23.71 **212.86 **0.97 ns5.18 **15.40 **6.48 **4.80 **17.82
Se intake 0.792.06 ns14.06 **310.81 **65.32 **2.22 ns23.59 **13.92 **11.33 **19.42 **7.66
Zn intake 0.702.46 ns17.45 **48.05 **42.80 **13.72 **2.17 *9.29 **1.36 ns2.51 **8.82
Free amino acids 0.391.69 ns138.29 **67.59 **155.85 **0.04 ns29.74 **11.40 **13.52 **3.33 **12.13
Free proteins 0.441.31 ns96.91 **2.56 ns158.52 **0.02 ns6.14 **8.59 **10.12 **6.28 **12.40
B—block; G—genotype; T—Treatment; B × L—block × local; G × T—genotype × treatment; L × G—local × genotype; L × T—local × treatment; L × G × T—local × genotype × treatment. ns—not significant by F-test; *—significant by F-test at p < 0.05; **—significant by F-test at p < 0.01; CV—coefficient of variation (%). Degrees of freedom: block (B)—2; genotypes (G)—4; treatment (T)—3; Local (L)—1; B × L—2; G × T—12; L × G—4; L × T—3; L × G × T—12.
Table 5. Main increases and decreases (%) in Zn and Se contents in whole and polished grains of different rice genotypes under different foliar fertilization treatments in Lambari and Lavras.
BRS EsmeraldaCMG 2188CMG ERF 85-15CMG ERF 221-16CMG ERF 221-19
Zn Whole
(Lambari)
↑22.7%
(Zn+Se vs. Ctrl)
↑28.3%
(Zn+Se vs. Ctrl)
↑34.5%
(Zn vs. ERF 221-16)
Zn Whole
(Lavras)
↑16.0%
(Zn+Se vs. Se)
↑33.7%
(Zn+Se vs. Ctrl)
↑34.5%
(Zn+Se vs. Se)
↑27.6%
(Zn+Se vs. Se)
Zn Polished
(Lambari)
↑27.9%
(Zn vs. Ctrl)
↑30.6%
(Zn vs. ERF 221-16)
↓33.3%
(Zn+Se vs. others)
Zn Polished
(Lavras)
↑26.6%
(Zn+Se vs. Ctrl)
↑24.2%
(Zn+Se vs. Se)
↑23.7%
(Zn+Se vs. Se)
Se Whole
(Lambari)
↑30.4%
(Zn+Se vs. Zn)
↑48.0%
(Zn+Se vs. Ctrl)
↑55.0%
(Zn vs. Ctrl)
↑50.0%
(Zn+Se vs. Ctrl)
↑68.2%
(Zn+Se vs. Ctrl)
Se Whole
(Lavras)
↑50.0%
(Se vs. Ctrl)
↑46.4%
(Zn+Se vs. Ctrl)
↑52.3%
(Se vs. ERF 221-16)
↑46.9%
(Zn+Se vs. Ctrl)
↑64.0%
(Zn+Se vs. Ctrl)
Se Polished
(Lambari)
↑39.2%
(Zn+Se vs. Ctrl)
↑33.3%
(Zn+Se vs. Ctrl)
↑40.0%
(Se vs. ERF 221-16)
↑43.0%
(Zn+Se vs. Zn)
↑47.2%
(Zn+Se vs. Ctrl)
Se Polished
(Lavras)
↓66.7%
(Zn+Se vs. others)
↑55.6%
(Zn+Se vs. Ctrl)
↑46.2%
(Zn+Se vs. Zn)
↑45.8%
(Zn+Se vs. Zn)
↑50.0%
(Zn+Se vs. Ctrl)
Table 6. Variation in Zn uptake in whole and polished rice grains under different foliar fertilization treatments by genotype and location.
GenotypeBetter
Treatment
% Increase over
Control/Compared Treatment
Whole grain (Lambari)BRS EsmeraldaZn+Se+46.2% (vs. control); +36.5% (vs. Se)
CMG 2188Zn+38.1% (vs. control); +34.5% (vs. Zn+Se)
CMG ERF 221-16Zn+55.7% (vs. control); +27.1% (vs. Zn+Se)
Polished Grain (Lambari)CMG ERF 221-16Zn+54.3% (vs. controle); +38.0% (vs. Zn+Se)
CMG ERF 221-19Sesignificant increase (no exact value mentioned)
Whole grain (Lavras)CMG 2188Zn+51.3% (vs. control); +48.3% (vs. Zn+Se)
CMG ERF 85-15Se+66.0% (vs. other genotypes)
Polished Grain (Lavras)CMG ERF 221-19Zn+Se+49% (vs. BRS Esmeralda)
Table 7. Variation in Se uptake in whole and polished rice grains under different foliar fertilization treatments by genotype and location.
GenotypeBetter
Treatment
% Increase over
Control/Compared Treatment
Whole grain (Lambari)BRS EsmeraldaZn+Se+50.3% (vs. control); +43.0% (vs. Zn)
CMG ERF 221-19Zn+Se+61.7% (vs. control)
CMG 2188Se+50.3% (vs. control)
Polished Grain (Lambari)BRS EsmeraldaZn+Se+55.8% (vs. control)
CMG ERF 221-16Zn+Se+55.8% (vs. control)
CMG ERF 85-15Se+63.7% (vs. CMG 2188)
Whole grain (Lavras)CMG ERF 221-19Zn+Se+65.8% (vs. BRS Esmeralda)
CMG ERF 85-15Se+74.5% (vs. other genotypes)
Polished Grain (Lavras)CMG ERF 221-19Zn+Se+82.8% (vs. BRS Esmeralda)
CMG ERF 85-15Zn+Se+79.7% (vs. BRS Esmeralda)
Disclaimer/Publisher’s Note: The statements, opinions and data contained in all publications are solely those of the individual author(s) and contributor(s) and not of MDPI and/or the editor(s). MDPI and/or the editor(s) disclaim responsibility for any injury to people or property resulting from any ideas, methods, instructions or products referred to in the content.

