Article

Synergistic Effects of Fertilization on Maize Yield and Quality in Northeast China: A Meta-Analysis

1
Key Laboratory of Sustainable Utilization of Soil Resources in the Commodity Grain Bases in Jilin Province, College of Resources and Environmental Sciences, Jilin Agricultural University, Changchun 130118, China
2
Key Laboratory of Straw Coprehensive Utilization and Black Soil Conservation/Ministry of Education, Jilin Agricultural University, Changchun 130118, China
*
Author to whom correspondence should be addressed.
These authors contributed equally to this work.
Agriculture 2025, 15(13), 1371; https://doi.org/10.3390/agriculture15131371
Submission received: 26 May 2025 / Revised: 18 June 2025 / Accepted: 24 June 2025 / Published: 26 June 2025

Abstract

Northeast China is a key grain production region yet achieving coordinated improvements in maize yield and quality across diverse environments remains challenging. This study conducted a meta-analysis to evaluate maize yield and quality responses to chemical fertilizer inputs under varying natural (climate, soil) and anthropogenic (fertilization, planting) conditions. The results indicated that fertilizer application increased yield by 20.0%, and protein, fat, and starch contents by 12.6, 1.4, and 1.2%, respectively, compared to no fertilization. Yield response was highest under precipitation <450 mm and temperatures >7 °C, while protein and fat gains were favored by >600 mm precipitation and 5–7 °C temperatures. Soils with pH <6.5 and saline–alkaline properties supported greater yield gains, while brown and black soils promoted protein and fat accumulation, respectively. Moderate nutrient inputs (N 180–240, P2O5 75–120, K2O 90–135 kg ha−1) outperformed lower or higher levels in improving both traits, with planting density also affecting response magnitude. Yield gains were primarily driven by soil fertility, whereas quality improvements were influenced by climate and management. Moderate fertilization facilitated the simultaneous enhancement of yield and quality. Tailored nutrient strategies based on soil and climate conditions can support regional maize productivity and contribute to food security.

1. Introduction

Northeast China is one of the most important commercial grain-producing regions in the country, contributing over 40% of the national maize output and serving as a key maize production zone [1]. In recent years, the pursuit of high yields has not been matched by corresponding improvements in maize nutritional quality, making the coordinated enhancement of yield and quality a limiting factor in the sustainable development of China’s maize industry [2]. Improving maize quality while maintaining high yields has therefore become a pressing challenge. Since the Industrial Revolution, the use of chemical fertilizers has been the most decisive factor driving global increases in grain production. In China, there is a strong correlation between grain yield growth and fertilizer input, with fertilizers once accounting for up to 56.8% of the yield increase and still contributing more than 40% today [3]. However, excessive fertilizer use in recent years has led to a range of agronomic and environmental problems. While fertilization can significantly enhance maize yield, improper practices—such as over-application and nutrient imbalances in nitrogen (N), phosphorus (P), and potassium (K)—have markedly diminished the yield response and now pose significant constraints to further yield gains [4,5].
Excessive fertilization leads to nutrient oversupply, reduced fertilizer use efficiency, and degradation of soil fertility and productivity, while potentially compromising crop quality [6]. Moreover, long-term chemical fertilizer application often results in soil acidification, a decline in the proportion and organic carbon content of large soil aggregates, increased greenhouse gas emissions, and water pollution, thereby posing growing environmental risks [7]. Improper fertilizer inputs can also negatively affect the nutritional quality of crops, as reflected in decreased protein concentrations and imbalanced amino acid profiles requiring dietary supplementation. Although nitrogen (N) fertilization can enhance crop yields, excessive N application has been shown to hinder the accumulation of essential amino acids in grains [8]. Field trials across different genotypes and environments have reported that phosphorus (P) application does not significantly affect fatty acid composition or tocopherol content in maize kernels [9]. In contrast, potassium (K) application was found to reduce protein content while increasing oil concentration in soybean seeds [10]. Unbalanced or excessive fertilizer use can thus impair crop quality, whereas appropriate fertilization strategies can improve the nutritional value of maize [11]. As a crucial component in maize production, chemical fertilizers have historically played a central role in yield enhancement. However, the growing negative consequences of their misapplication can no longer be overlooked. Optimizing nutrient management to sustain high yields while improving crop quality is essential for achieving high-quality maize production in Northeast China [12,13].
Although numerous studies have explored the relationship between fertilization and maize yield and quality in Northeast China, most of these are based on individual field experiments, which tend to reflect only localized patterns and findings [14,15]. Given the vast expanse of the primary maize production areas in Northeast China—spanning from east to west and north to south—there exists considerable variability in natural conditions. As such, results from single-location trials are insufficient to generalize fertilization effects at the regional scale, and comprehensive studies addressing the overall relationship between fertilization, yield, and quality in this region remain limited. Meta-analysis is a quantitative statistical method that integrates and synthesizes results from multiple independent but comparable studies and has been widely applied in agricultural research [16,17]. Numerous meta-analyses on fertilization have been conducted. For instance, Guo et al. demonstrated that nitrogen application has a positive effect on crop yield and global warming potential, while increasing greenhouse gas emissions [18]. Zhang et al. reported that a nitrogen input of 215 kg ha−1 was most effective in enhancing both yield and water use efficiency [19]. However, few studies have systematically evaluated the synergistic effects of fertilization—namely, the simultaneous improvement of both maize yield and grain quality—across diverse environmental and management contexts.
Random Forest (RF), an ensemble learning algorithm, has been increasingly applied in agricultural research to assess the relative importance of multiple factors and to model complex, nonlinear interactions among environmental, management, and biological variables. When integrated with meta-analysis, RF provides a complementary tool for gaining deeper insights into the drivers of crop yield and quality responses across diverse conditions. It has proven effective in quantifying the contributions of individual variables to crop performance [20,21,22]. In this study, we integrated meta-analysis with random forest modeling to: (1) quantitatively assess the effects of fertilization on maize yield and major quality traits in Northeast China; (2) identify the key factors influencing yield and quality responses; and (3) explore the synergies between maize yield and quality under different fertilization input rate. Our findings aim to provide a theoretical basis for nutrient management strategies that support the coordinated improvement of maize productivity and grain quality in Northeast China.

2. Materials and Methods

2.1. Data Collection

2.1.1. Data Sources

In this study, we conducted a comprehensive literature search across the China National Knowledge Infrastructure (CNKI) and Web of Science with the following specific keywords: “maize fertilization”, “maize yield”, “maize AND nitrogen fertilizer”, “maize AND phosphate fertilizer”,” maize AND potash fertilizer”, “maize quality”. The document types were articles and dissertations in both Chinese and English. The literature was published from 1990 to 2021, and secondary screening was applied based on the following criteria: (1) Data were field measurements; (2) The experimental site was in Northeast China (Heilongjiang, Jilin, and Liaoning); (3) Inclusion of paired experimental and control group data on maize yield or quality, with replicated trials.
Through the above screening criteria, a total of 230 articles were screened to meet the conditions, including 219 studies on yield, 22 on protein, 15 on fat, and 17 on starch. There are 2020 pairs of yield test data, 213 pairs of protein, 179 pairs of fat, and 186 pairs of starch that can be analyzed.

2.1.2. Data Organization and Supplementation

The following data were extracted from the literature that met the criteria: mean values of maize yield, protein, fat, and starch content, number of experiment replications, and standard deviation corresponding to the test and control groups. Data presented in tables and letters in the literature were directly extracted, while numerical values from figures (e.g., line graphs, bar charts) were digitally extracted using GetData Graph Digitizer 2.20 software. For literature lacking climate or soil metadata, missing information was supplemented using analogous regional experimental data or retrieved from the China Soil Science Database (http://vdb3.soil.csdb.cn/ (accessed on 20 June 2023)) and the China Meteorological Data Network (http://data.cma.cn (accessed on 19 June 2023)) based on reported latitude and longitude coordinates.
If the data provided in the literature was the standard error corresponding to each mean, the standard deviation can be converted by the formula (1). The formula is as follows:
S D = S E × n ,
where SD is the standard deviation of the indicator, SE is the standard error, and n is the sample size.
For data sets in the literature where both standard deviation and standard error were missing, 1/10th of the mean was taken uniformly to calculate the estimated missing standard deviation [23].

2.1.3. Data Classification

Firstly, the information in the article closely related to the study was extracted, including study background, experimental design, and analytical metrics. Given the large differences in the influencing factors of each independent experiment study, it was considered that maize yield, protein, fat, and starch content under fertilizer application may be affected by different factors. Therefore, in this study, the collected and organized data will be classified and grouped based on previous research foundations, as follows:
(1)
Natural factors: mean annual precipitation (MAP), mean annual temperature (MAT), soil type, soil pH, soil organic matter content (SOM), soil total nitrogen content (TN), soil available nutrient content (soil alkaline nitrogen (Alk-N), soil available phosphorus (P), and soil available potassium (K)).
(2)
Human management practices: planting density and nutrient inputs (N rate, P2O5 rate, K2O rate).
Specific subgroup groupings were shown in Table 1.

2.2. Data Calculation

There was a certain degree of variability between different experimental data, therefore, a unified variable needed to be constructed as a prerequisite for meta-analysis, making each independent variable comparable with each other. In this study, the natural logarithm of the response ratio (lnR) was used as the effect size to quantify fertilization impacts, calculated as follows [24]:
l n R = l n x t x c = l n x t l n x c ,
where Xt and Xc represent the mean values of the dependent variables (yield, protein, fat and starch) under test and control groups, respectively.
To evaluate the overall test effect across studies, the weight of the effect size of each group of data was calculated to derive the combined effect size (lnR+). This required determining the variance (vi) and weight (wi) of each independent study, which was given in the following formula:
v i = S D t 2 n t + x t 2 + S D c 2 n c + x c 2 ,
w i = 1 v i ,
l n R + = ( l n R i × w i ) w i ,
where nt and nc are the sample size of the test and control groups, respectively; xt and xc are the standard deviation of the test and control groups, respectively.
The significance of the results of the meta-analysis can be determined using the 95% confidence interval (95% CI), if the 95% CI contained a value of 0, it means that the results were not significant, the effect of the experiment group on the indicator was not significant, and there was no significant difference with the control group. Conversely, if the 95% CI did not contain a value of 0 and was greater than (less than) 0, it means that the results of the study were significant, and the experiment group increased (decreased) the value of the indicator. Also, to better describe the extent of the effect of the experiment test group on an indicator, the combined effect size was converted to a percentage change (E):
E = e l n R + 1 × 100 % .
The choice of statistical model in meta-analysis depended on the results of the heterogeneity test. If the result was not significant (PQ-val > 0.05), this indicated that there was no heterogeneity, and a fixed effects model should be chosen. On the contrary, if PQ-val < 0.05, this proves that there was significant heterogeneity, and the random effects model should be used [19]. In this study, significant heterogeneity was observed across experiments (Table 2). Therefore, the mean effect size was calculated using the random effects model. Meta-analysis was performed using the “metafor” package in R software 4.0.0 [25].
Q-val means the statistic value of heterogeneity; df is the degree of freedom PQ-val is P value of heterogeneity test; I2 is the proportion of variance between study.
In order to determine the relative contribution of human management practices (N rate, P2O5 rate, K2O rate, planting density), climatic factors (mean annual temperature and precipitation), and soil properties (soil type, soil pH, soil organic carbon, soil total nitrogen, soil alkaline nitrogen, soil available phosphorus, and soil available potassium), which primarily affect maize growth and development, to the yields and the protein, fat, starch contents of maize. Random forest model (RF) was used to calculate the importance of different influencing factors, which is constructed by using the “randomForest” package in R software 4.0.0. The main parameter “num.trees” was set to 500.
This study utilized Microsoft Excel 2019 for data organization and graphing through Origin 2021 software plotting.

3. Results

3.1. Natural Factors

3.1.1. Climatic Conditions

Different natural climatic conditions (mean annual temperature and precipitation) significantly influenced the yield-increasing and quality-improving effects of fertilization on maize. Under arid conditions (<450 mm), fertilization induced the highest growth rates for maize yield (28.5%, 24.6–32.6%) and starch content (6.3%, 2.0–10.8%) in Northeast China (Figure 1a,d). In contrast, under humid conditions (>600 mm), fertilization significantly enhanced protein (p < 0.001) and fat (p < 0.001) contents (Figure 1b,c), with the maximum improvements of 16.3% (11.8–20.9%) and 4.0% (2.1–5.9%), respectively. The yield increase rate was highest when the mean annual temperature was above 7 °C (28.40%, 25.19–31.53%); however, the growth rate of starch content was highest when the mean annual temperature was below 5 °C (1.92%, 1.00–2.83%) (Figure 1a,d). Both protein and fat content improvements followed a similar trend: initial increases followed by decreases with rising temperatures. The peak enhancements occurred at mean annual temperatures of 5–7 °C, reaching 14.00% (10.1–18.0%) for protein and 2.5% (0.5–4.6%) for fat (Figure 1b,c).

3.1.2. Soil Properties

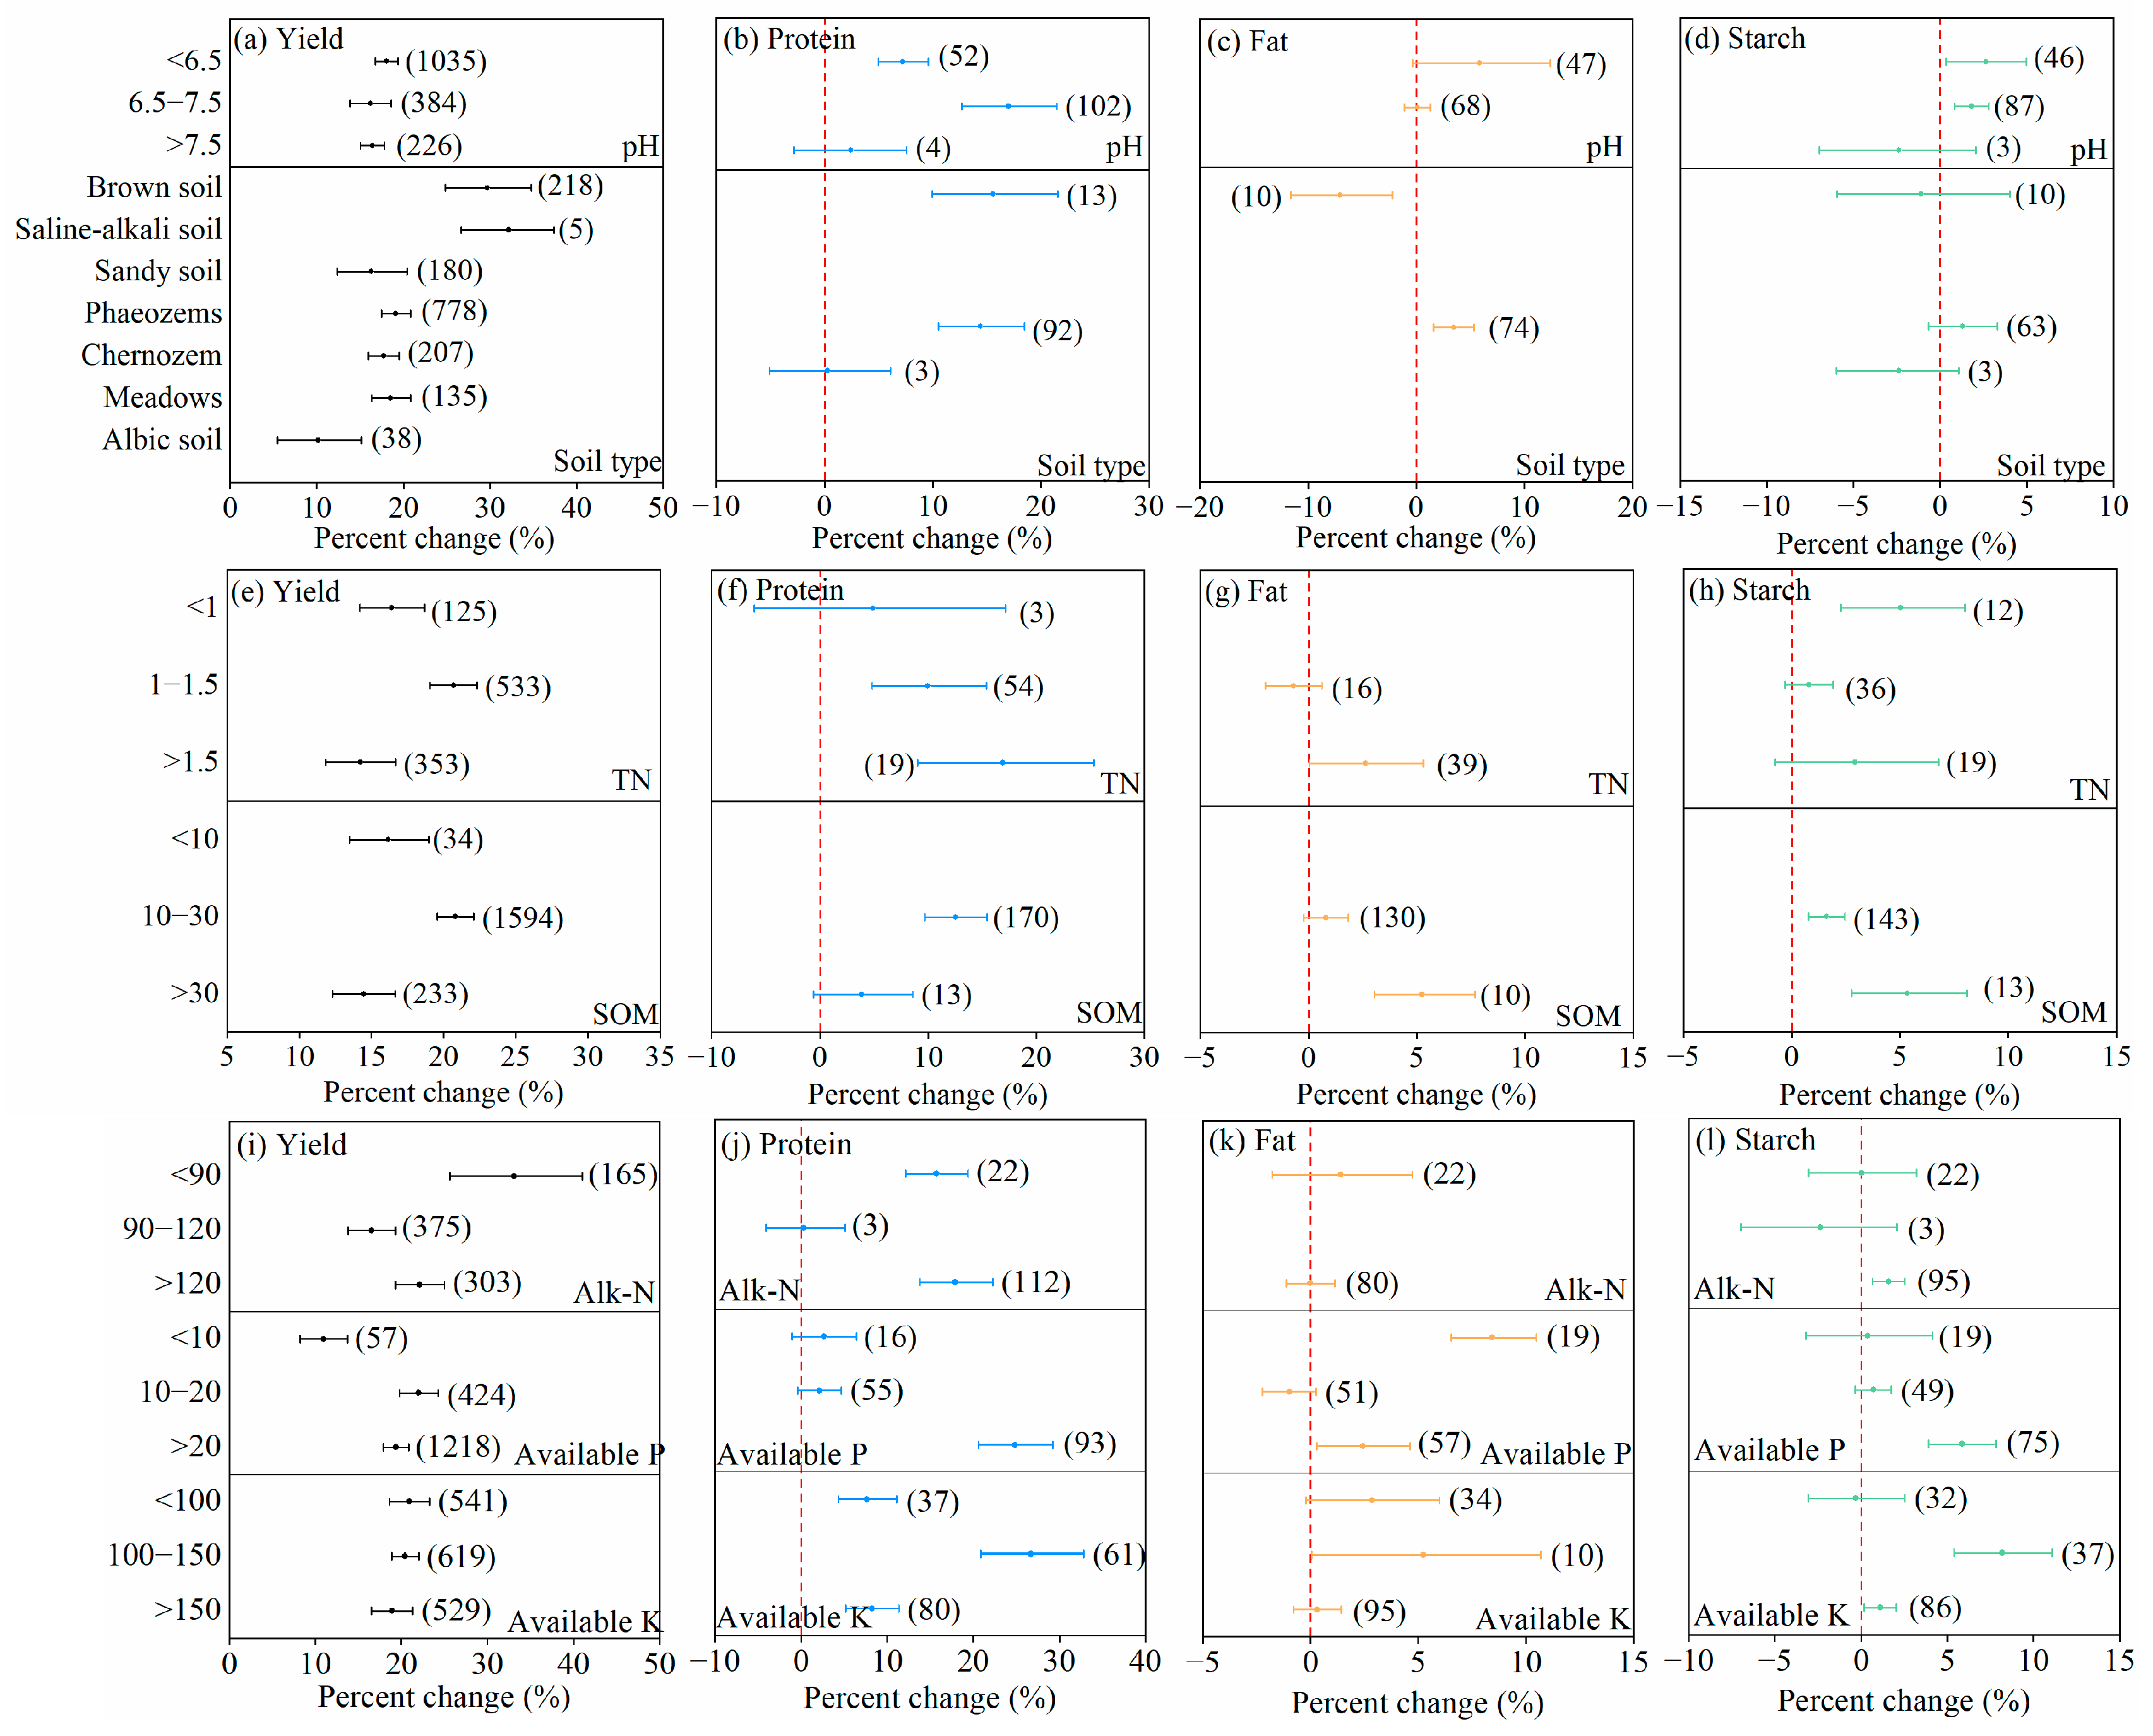
Soil properties strongly modulated the fertilization effects on maize yield and quality. As shown in (Figure 2a,b), the greatest yield increase (18.1%, 16.8–19.4%) occurred when soil pH was <6.5, while the highest protein enhancement (16.2%, 13.8–18.6%) appeared at pH 6.5–7.5. Soil pH was negatively correlated with fat and starch content responses (Figure 2c,d). Yield response varied by soil type, with saline–alkali soils showing the highest increase (32.2%, 14.7–52.4%). Protein improvement was greatest in brown soils (15.6%), and fat content rose most in phaeozems (3.5%). No significant starch response was detected across soil types. Yield increased most (20.7%, 19.1–22.3%) at TN of 1–1.5 g kg−1 (Figure 2e). Protein and fat contents rose with increasing TN, while starch content peaked at TN <1 g kg−1 (5.0%, 2.3–8.0%) (Figure 2f–h). At SOM of 10–30 g kg−1, the highest yield (20.8%) and protein (9.7%) gains were observed, whereas SOM> 30 g kg−1 favored fat (5.2%, 3.0–7.7%) and starch (5.3%, 2.8–8.1%) accumulation. Yield increased most (33.1%, 25.6–41.0%) when alkali-hydrolyzed nitrogen was <90 mg kg−1 (Figure 2i). A higher alkali-N (>120 mg kg−1) enhanced protein (17.9%, 13.8–22.3%) and starch (1.6%, 0.7–2.6%) but not fat (Figure 2j–l). Available phosphorus showed a unimodal effect on yield, peaking at 10–20 mg kg−1 (22.0%, 19.8–24.3%). Under available P <10 mg kg−1, fat content increased most (8.4%, 6.5–10.5%), while available P >20 mg kg−1 maximized protein (24.9%, 20.6–29.2%) and starch (5.9%, 3.9–7.8%). Yield response declined with rising available K, but protein (26.7%, 20.9–32.9%) and starch (8.2%, 5.2–11.3%) peaked at 100–150 mg kg−1; fat content was unaffected.

3.2. Human Management Practices

3.2.1. Nutrient Inputs

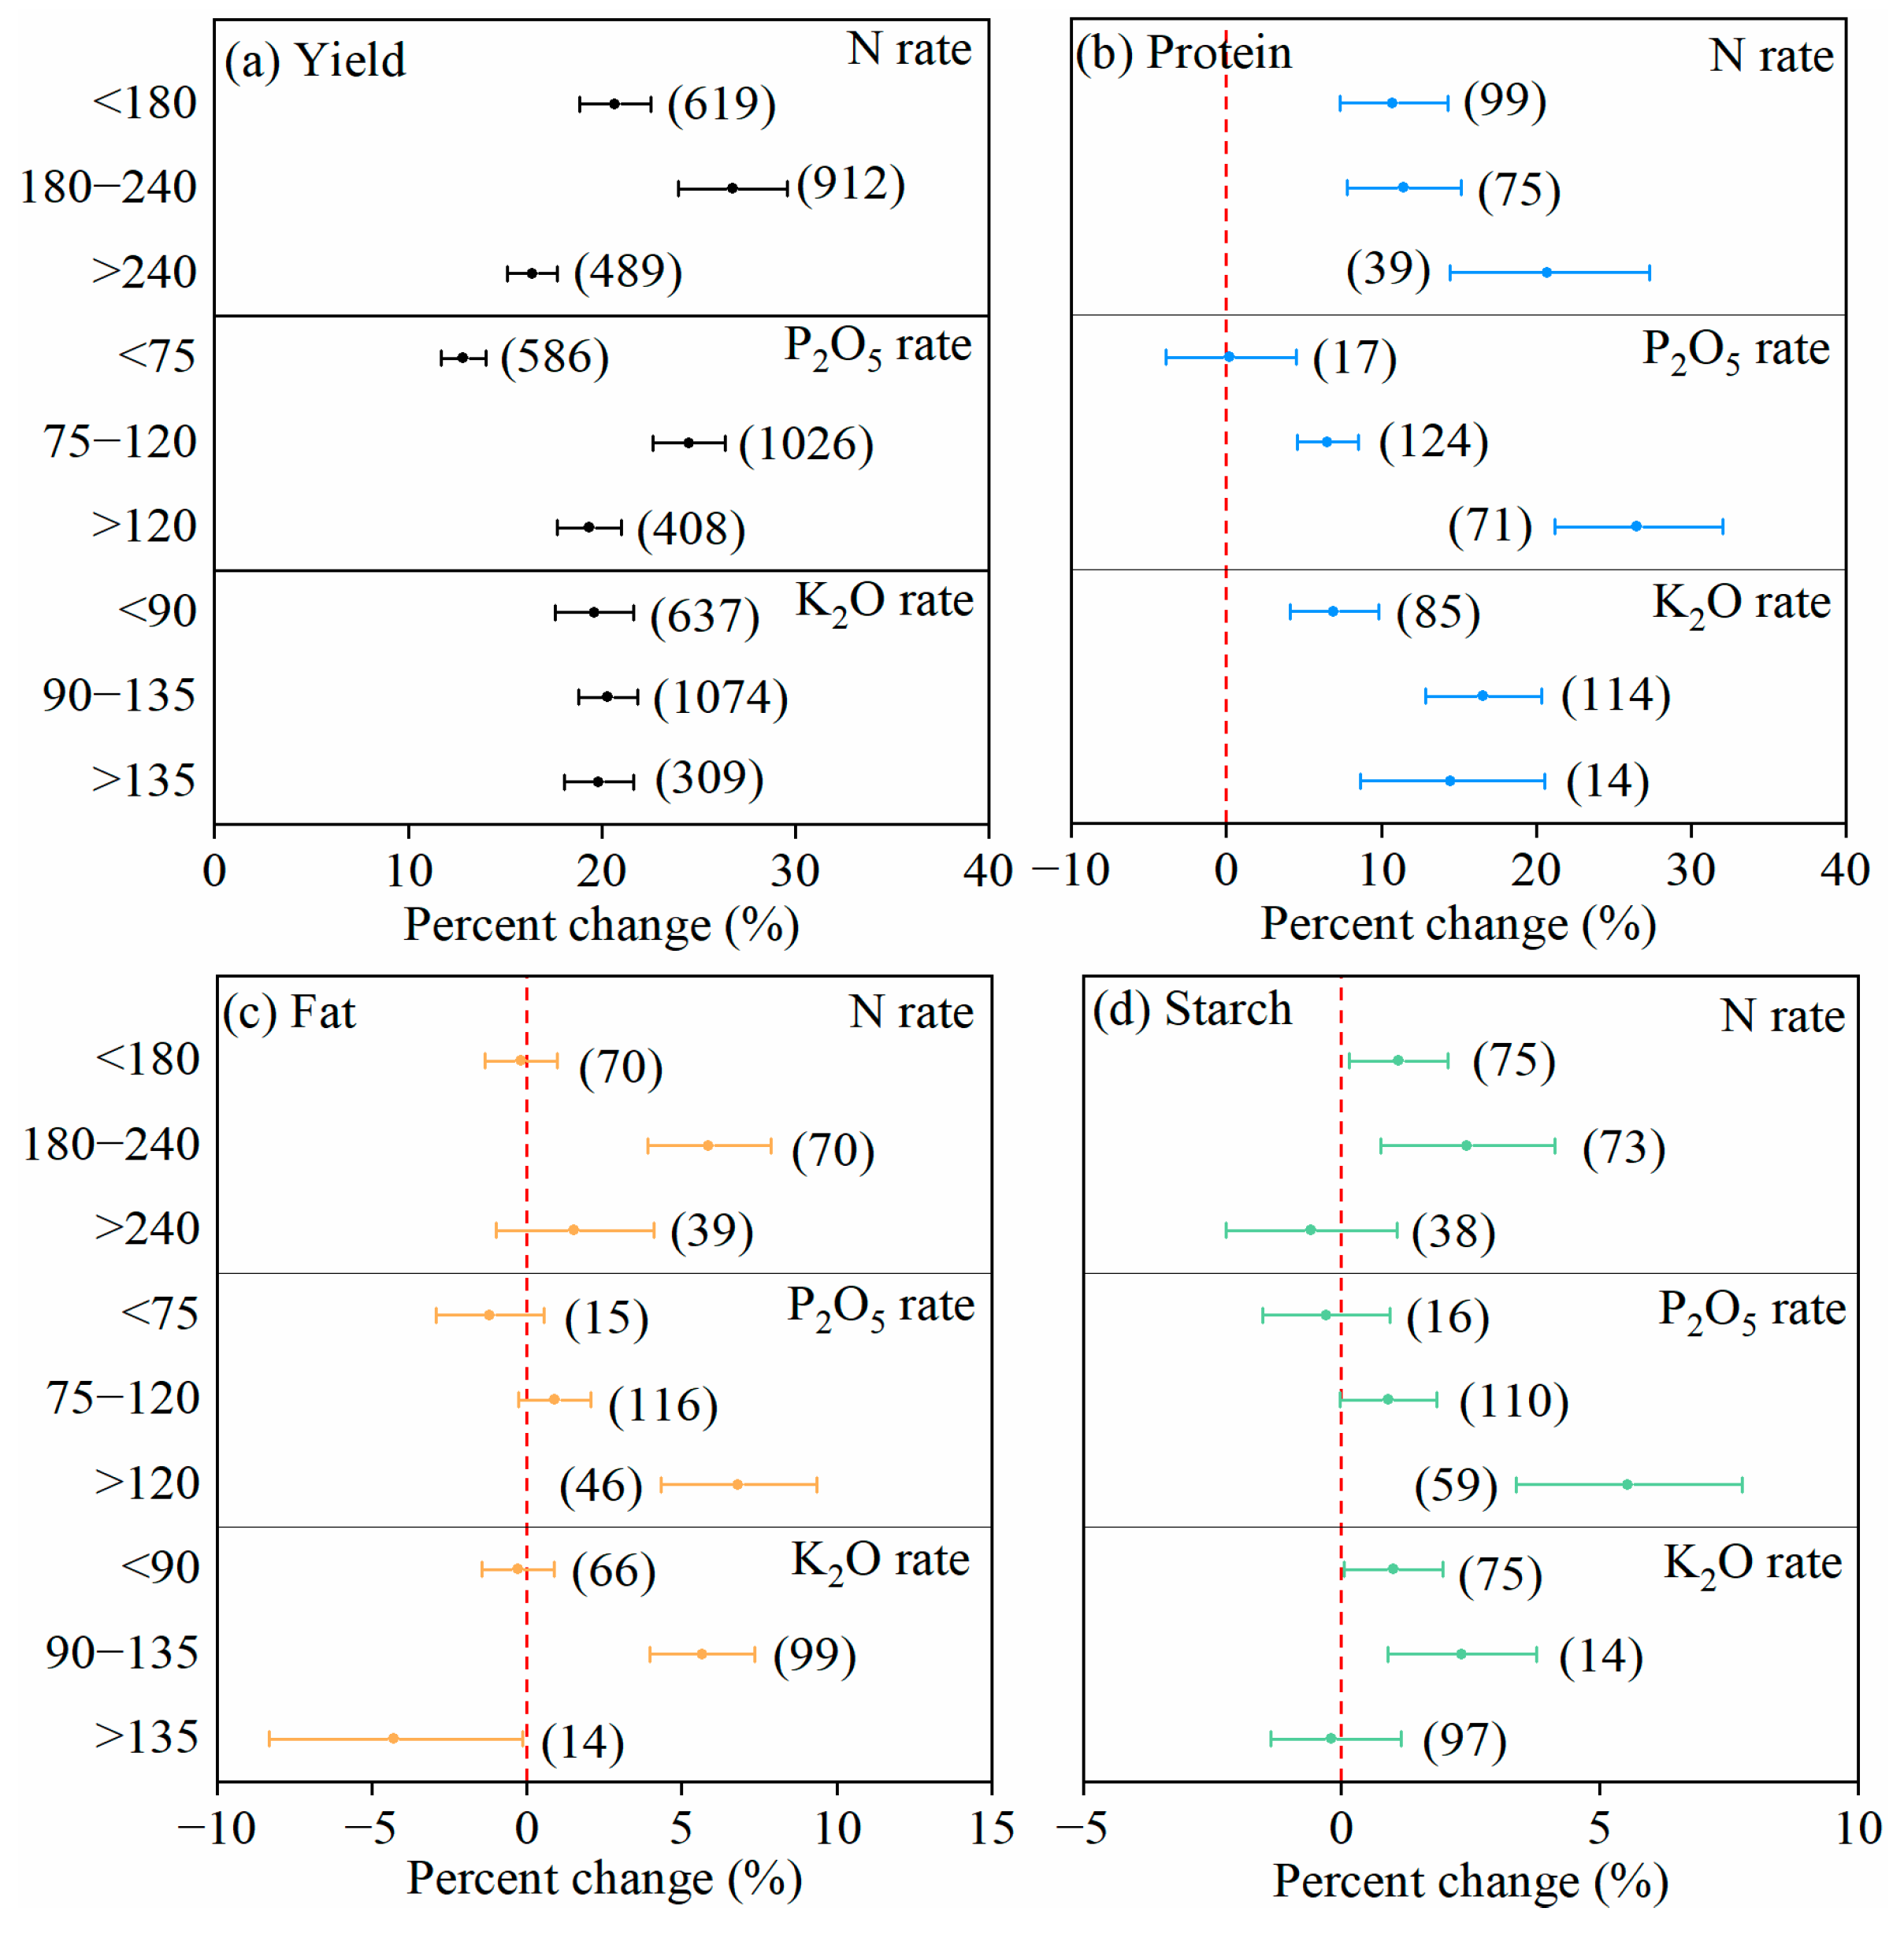
The input levels of soil nutrients (N rate, P2O5 rate, K2O rate) significantly influenced the yield-increasing effects of fertilization on maize. As shown in Figure 3, nitrogen, phosphorus, and potassium fertilization exhibited similar unimodal trends in maize yield enhancement compared to non-fertilized conditions, with all treatments showing an initial increase followed by a decrease in yield improvement. Specifically, the highest yield increase rates were achieved at N rates of 180–40 kg ha−1 (26.7%, 24.0–29.6%), P2O5 rates of 75–120 kg ha−1 (24.5%, 22.6–26.4%), and K2O rates of 90–135 kg ha−1 (20.3%, 18.8–21.8%). Under high N inputs (>240 kg ha−1), the maximum improvement in protein content (20.7%, 14.4–27.3%) was observed. At medium N rate levels (180–240 kg ha−1), fertilization induced the largest increases in fat (5.9%, 3.4–7.9%) and starch (2.4%, 0.8–4.1%) contents. For P and K fertilization, similar patterns were observed in quality parameter improvements. The highest growth rates for protein, fat, and starch were achieved at high P2O5 rate (>120 kg ha−1) rate and medium K2O rate (90–135 kg ha−1). The growth rates of maize protein content were 6.5% (4.5–8.5%) and 16.5% (12.8–20.4%), the growth rates of fat content were 6.8% (4.3–9.4%) and 5.7% (4.0–7.47%), and the growth rates of starch content were 5.6% (3.4–7.8%) and 2.3% (0.9–3.8%).

3.2.2. Planting Density

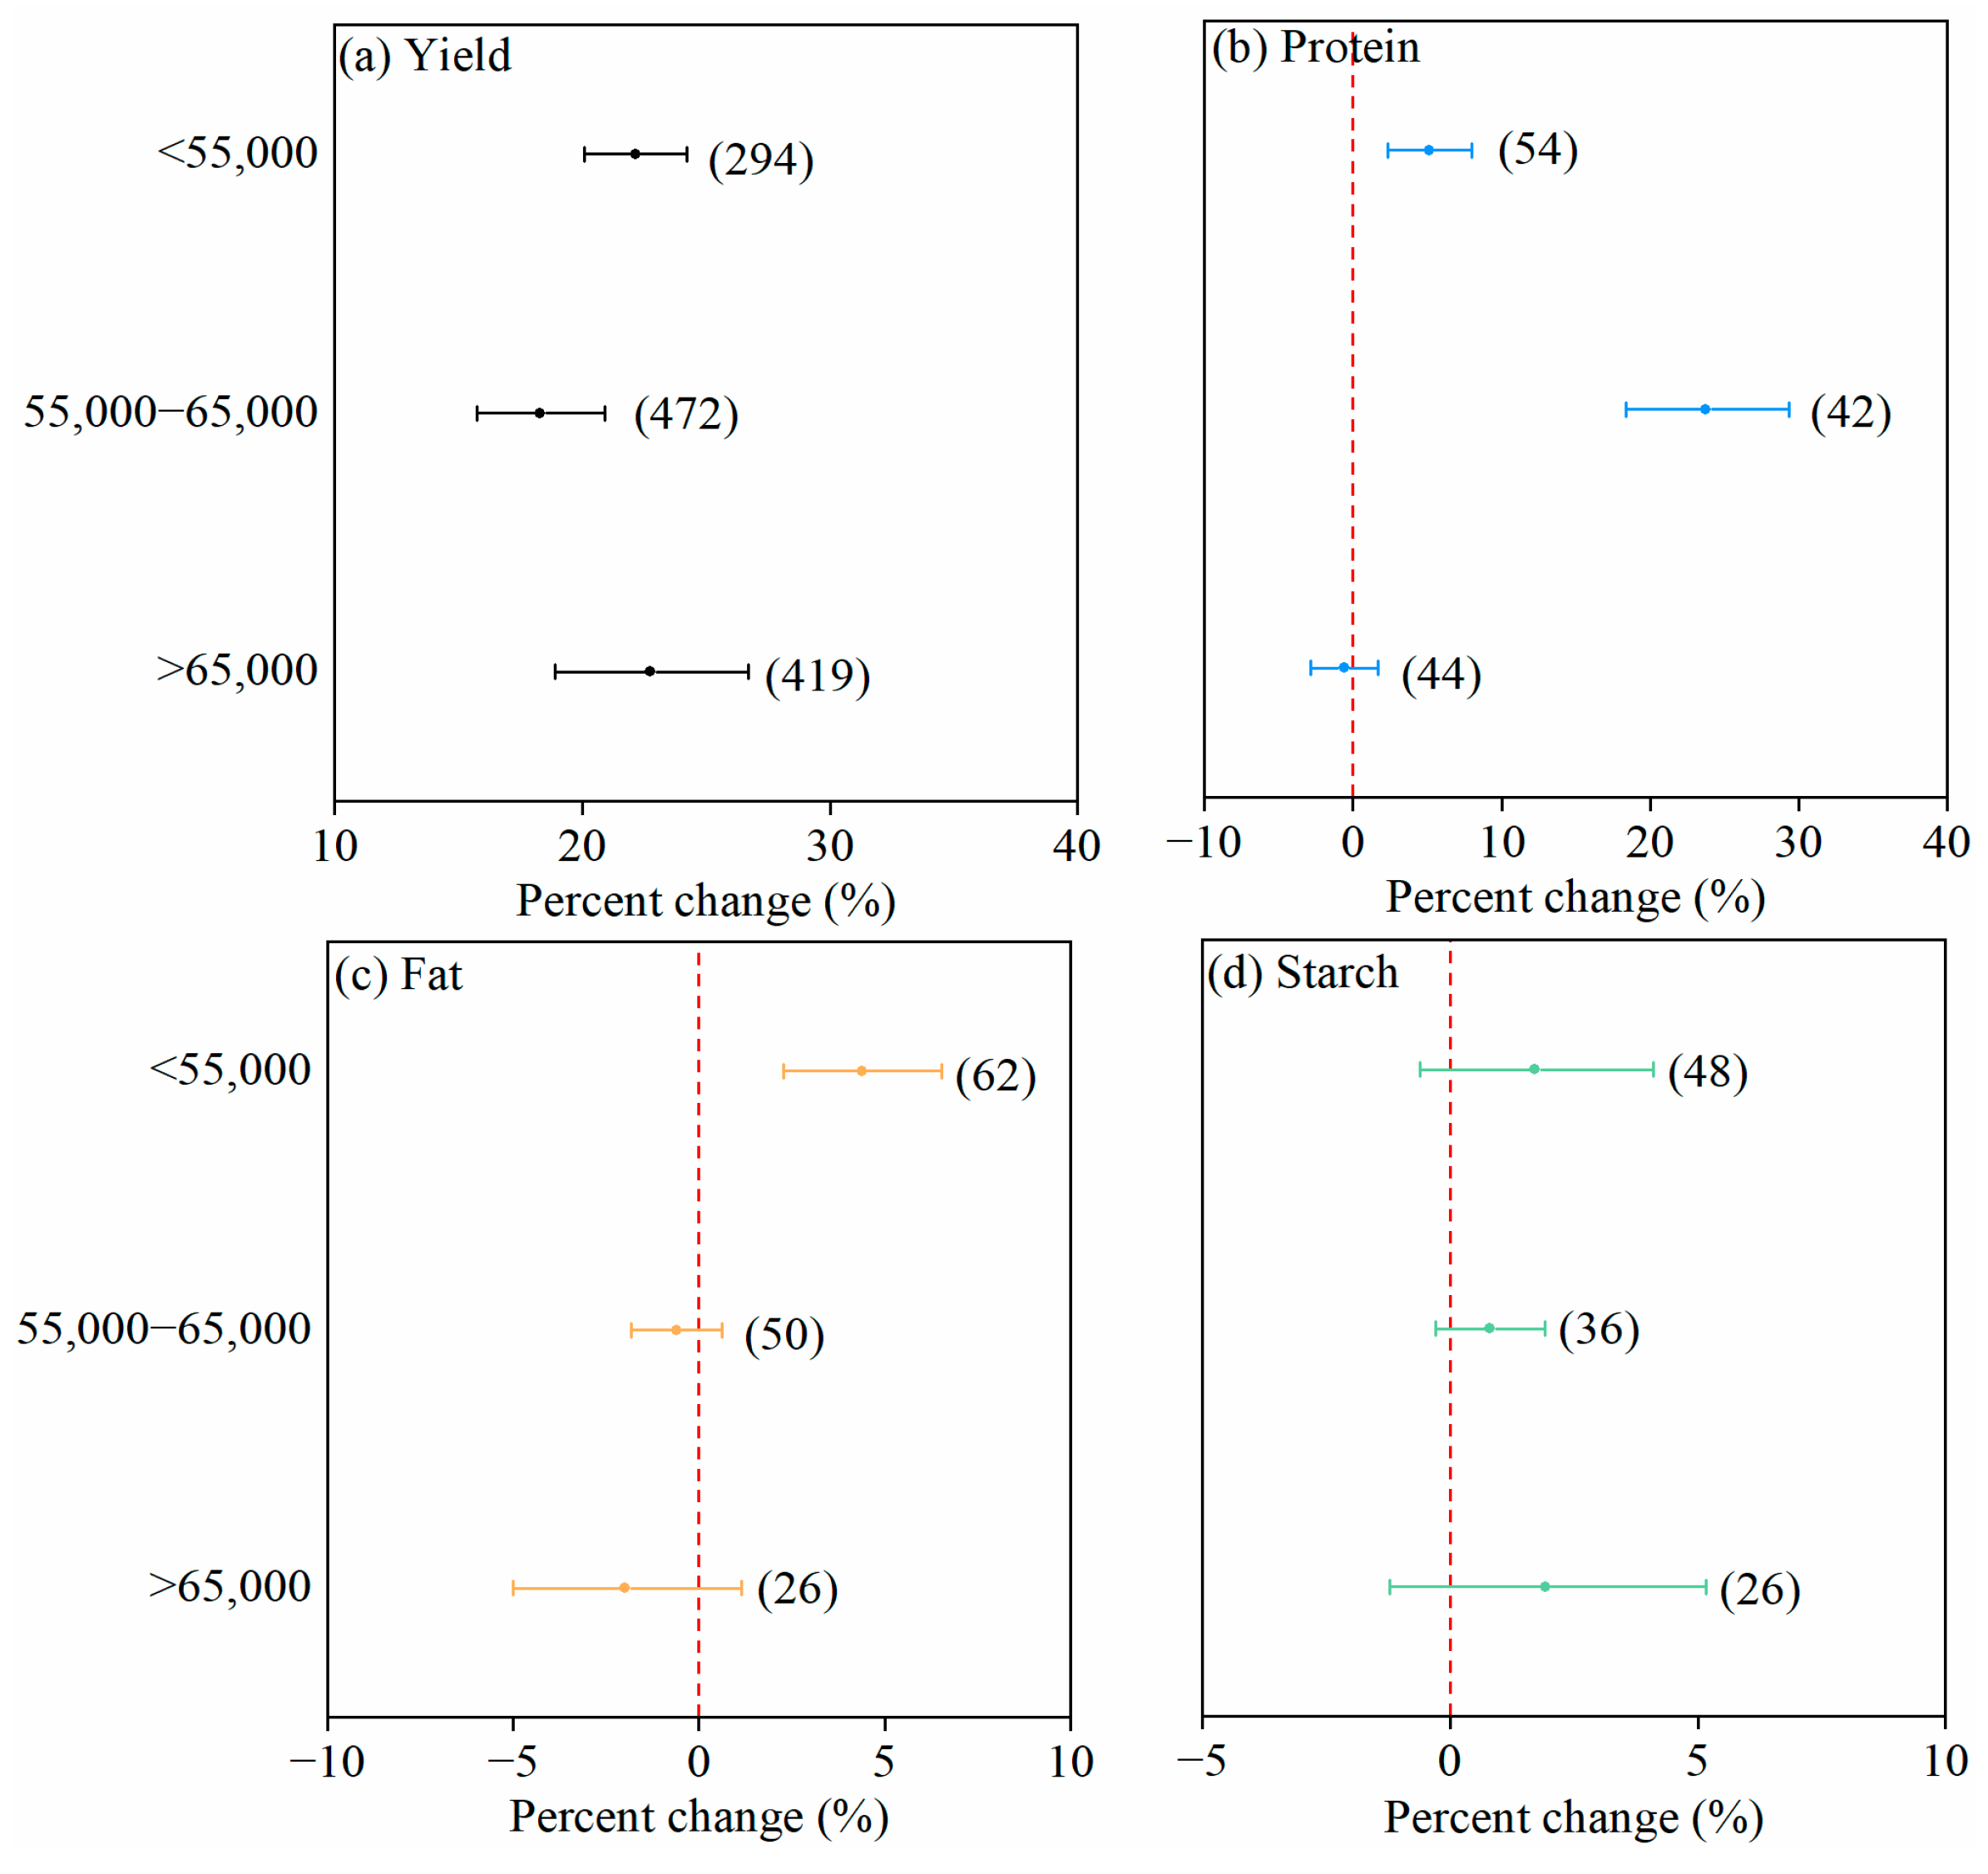
Different maize planting densities significantly affected the yield-increasing effects of fertilization. The yield-increasing effect of fertilization on maize in Northeast China exhibited an initial increase followed by a decrease with rising planting densities compared to non-fertilized conditions. At high planting densities (>65,000 plants ha−1), fertilization achieved the highest yield increase rate of 22.8% (18.9–24.2%) (Figure 4a). Under medium-density conditions (55,000–65,000 plants ha−1), the largest improvement in protein content (23.7%, 18.4–29.4%) was observed (Figure 4b). Conversely, low planting densities (<55,000 plants ha−1) resulted in the highest fat enhancement (4.4%, 2.3–6.5%) (Figure 4c).

3.3. Relative Importance of Explanatory Variables

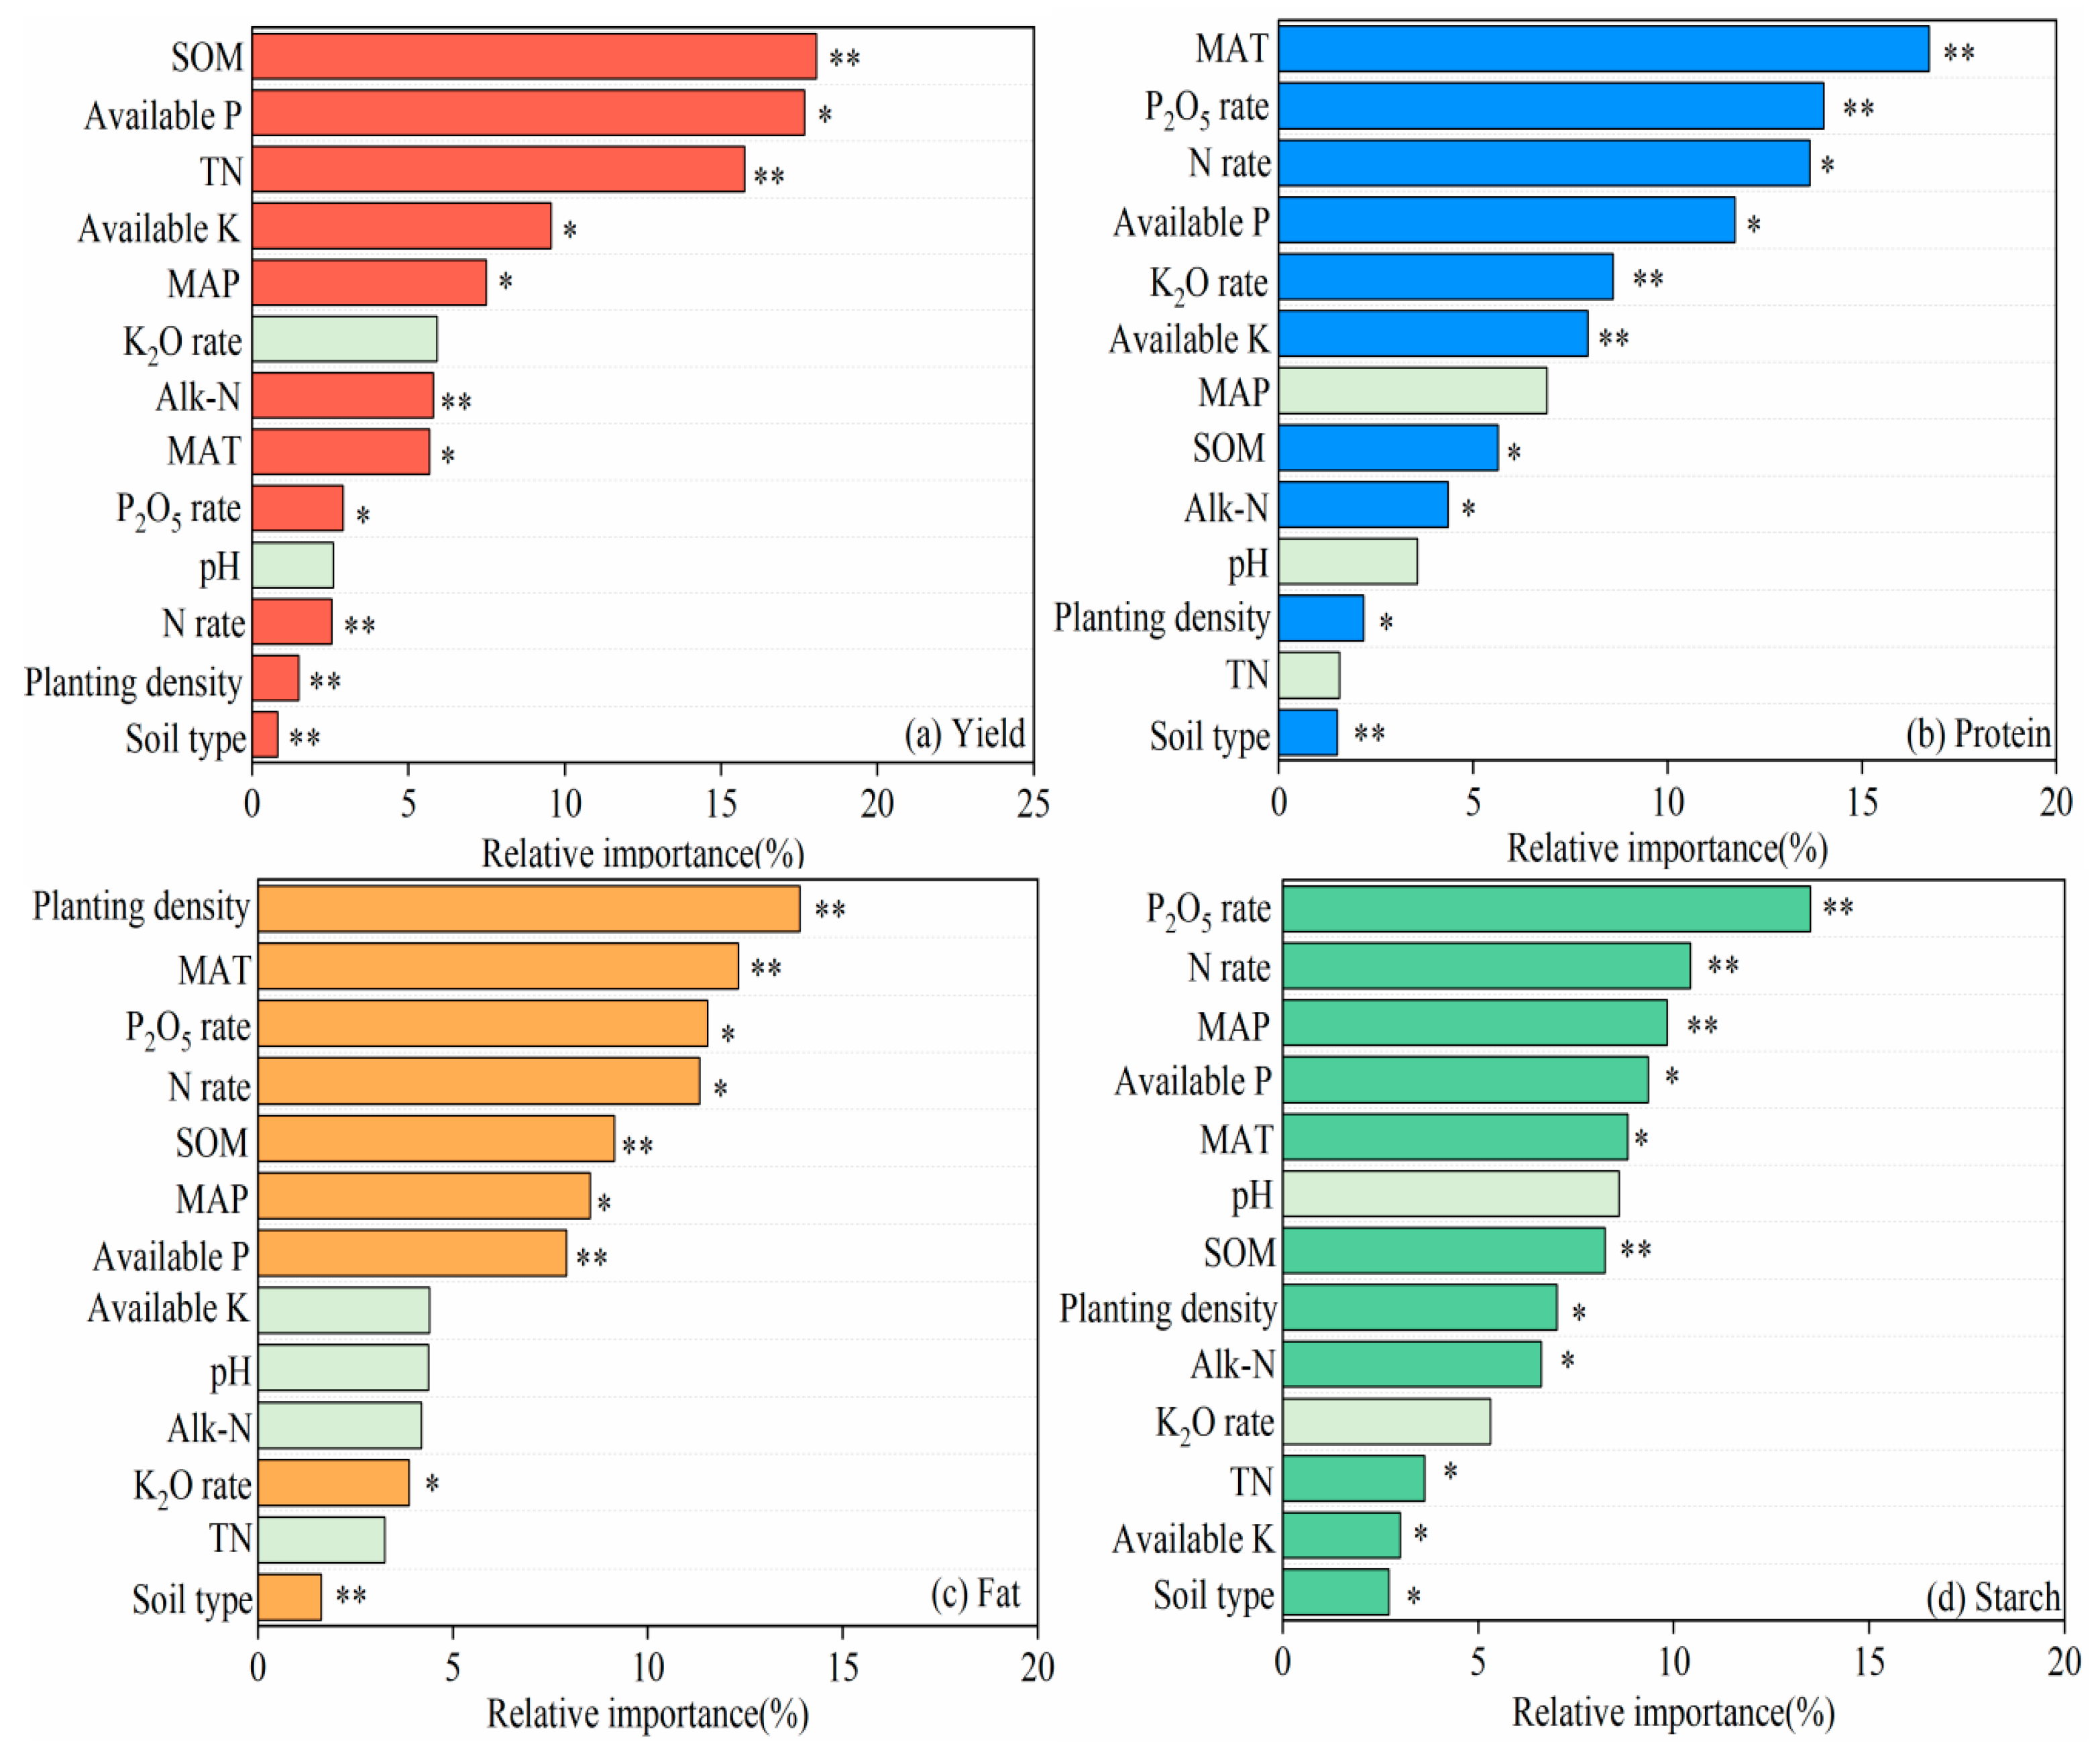
The random forest model was applied to analyze the explanatory variables included in this study, which comprised natural factors (mean annual precipitation, mean annual temperature, soil pH, soil type, soil organic matter content, total nitrogen, alkali nitrogen, available P, and available K) and human management practices (N rate, P2O5 rate, K2O rate, and planting density). The relative importance of each variable was calculated using the %IncMSE method (Figure 5a). The results demonstrated that the 13 explanatory variables investigated in this study accounted for 96.20% of the heterogeneity sources in maize yield variation under fertilization. The top five critical influencing factors, identified based on variable importance ranking, were soil organic matter (18.05%), available P (17.66%), total nitrogen (15.74%), available K (9.56%), and mean annual precipitation (7.48%). Collectively, soil nutrient status emerged as the predominant determinant of yield-increasing effects in maize cultivation across Northeast China.
The 13 explanatory variables included in this study accounted for 98.33% of the heterogeneity sources in maize protein variation (Figure 5b). The top five variables in relative importance were mean annual temperature (16.7%), P2O5 rate (14.0%), N rate (13.7%), soil available P (11.7%), and K2O rate (8.6%) (Figure 5a). For fat variation, the 13 variables explained 96.3% of the heterogeneity sources (Figure 5c). The five most influential factors were planting density (13.9%), mean annual temperature (12.3%), P2O5 rate (11.5%), N rate (11.3%), and soil organic matter content (9.1%) (Figure 5b). Regarding starch, the variables collectively explained 97.1% of the heterogeneity sources. The top contributors included P2O5 rate (13.5%), N rate (10.4%), mean annual precipitation (9.8%), soil available P (9.4%), and mean annual temperature (8.8%) (Figure 5d). To sum up, the maize quality improvement under fertilization in Northeast China was driven by climatic factors and human management practices.

3.4. Synergistic Effects of Fertilization on Maize Yield and Quality in Northeast China

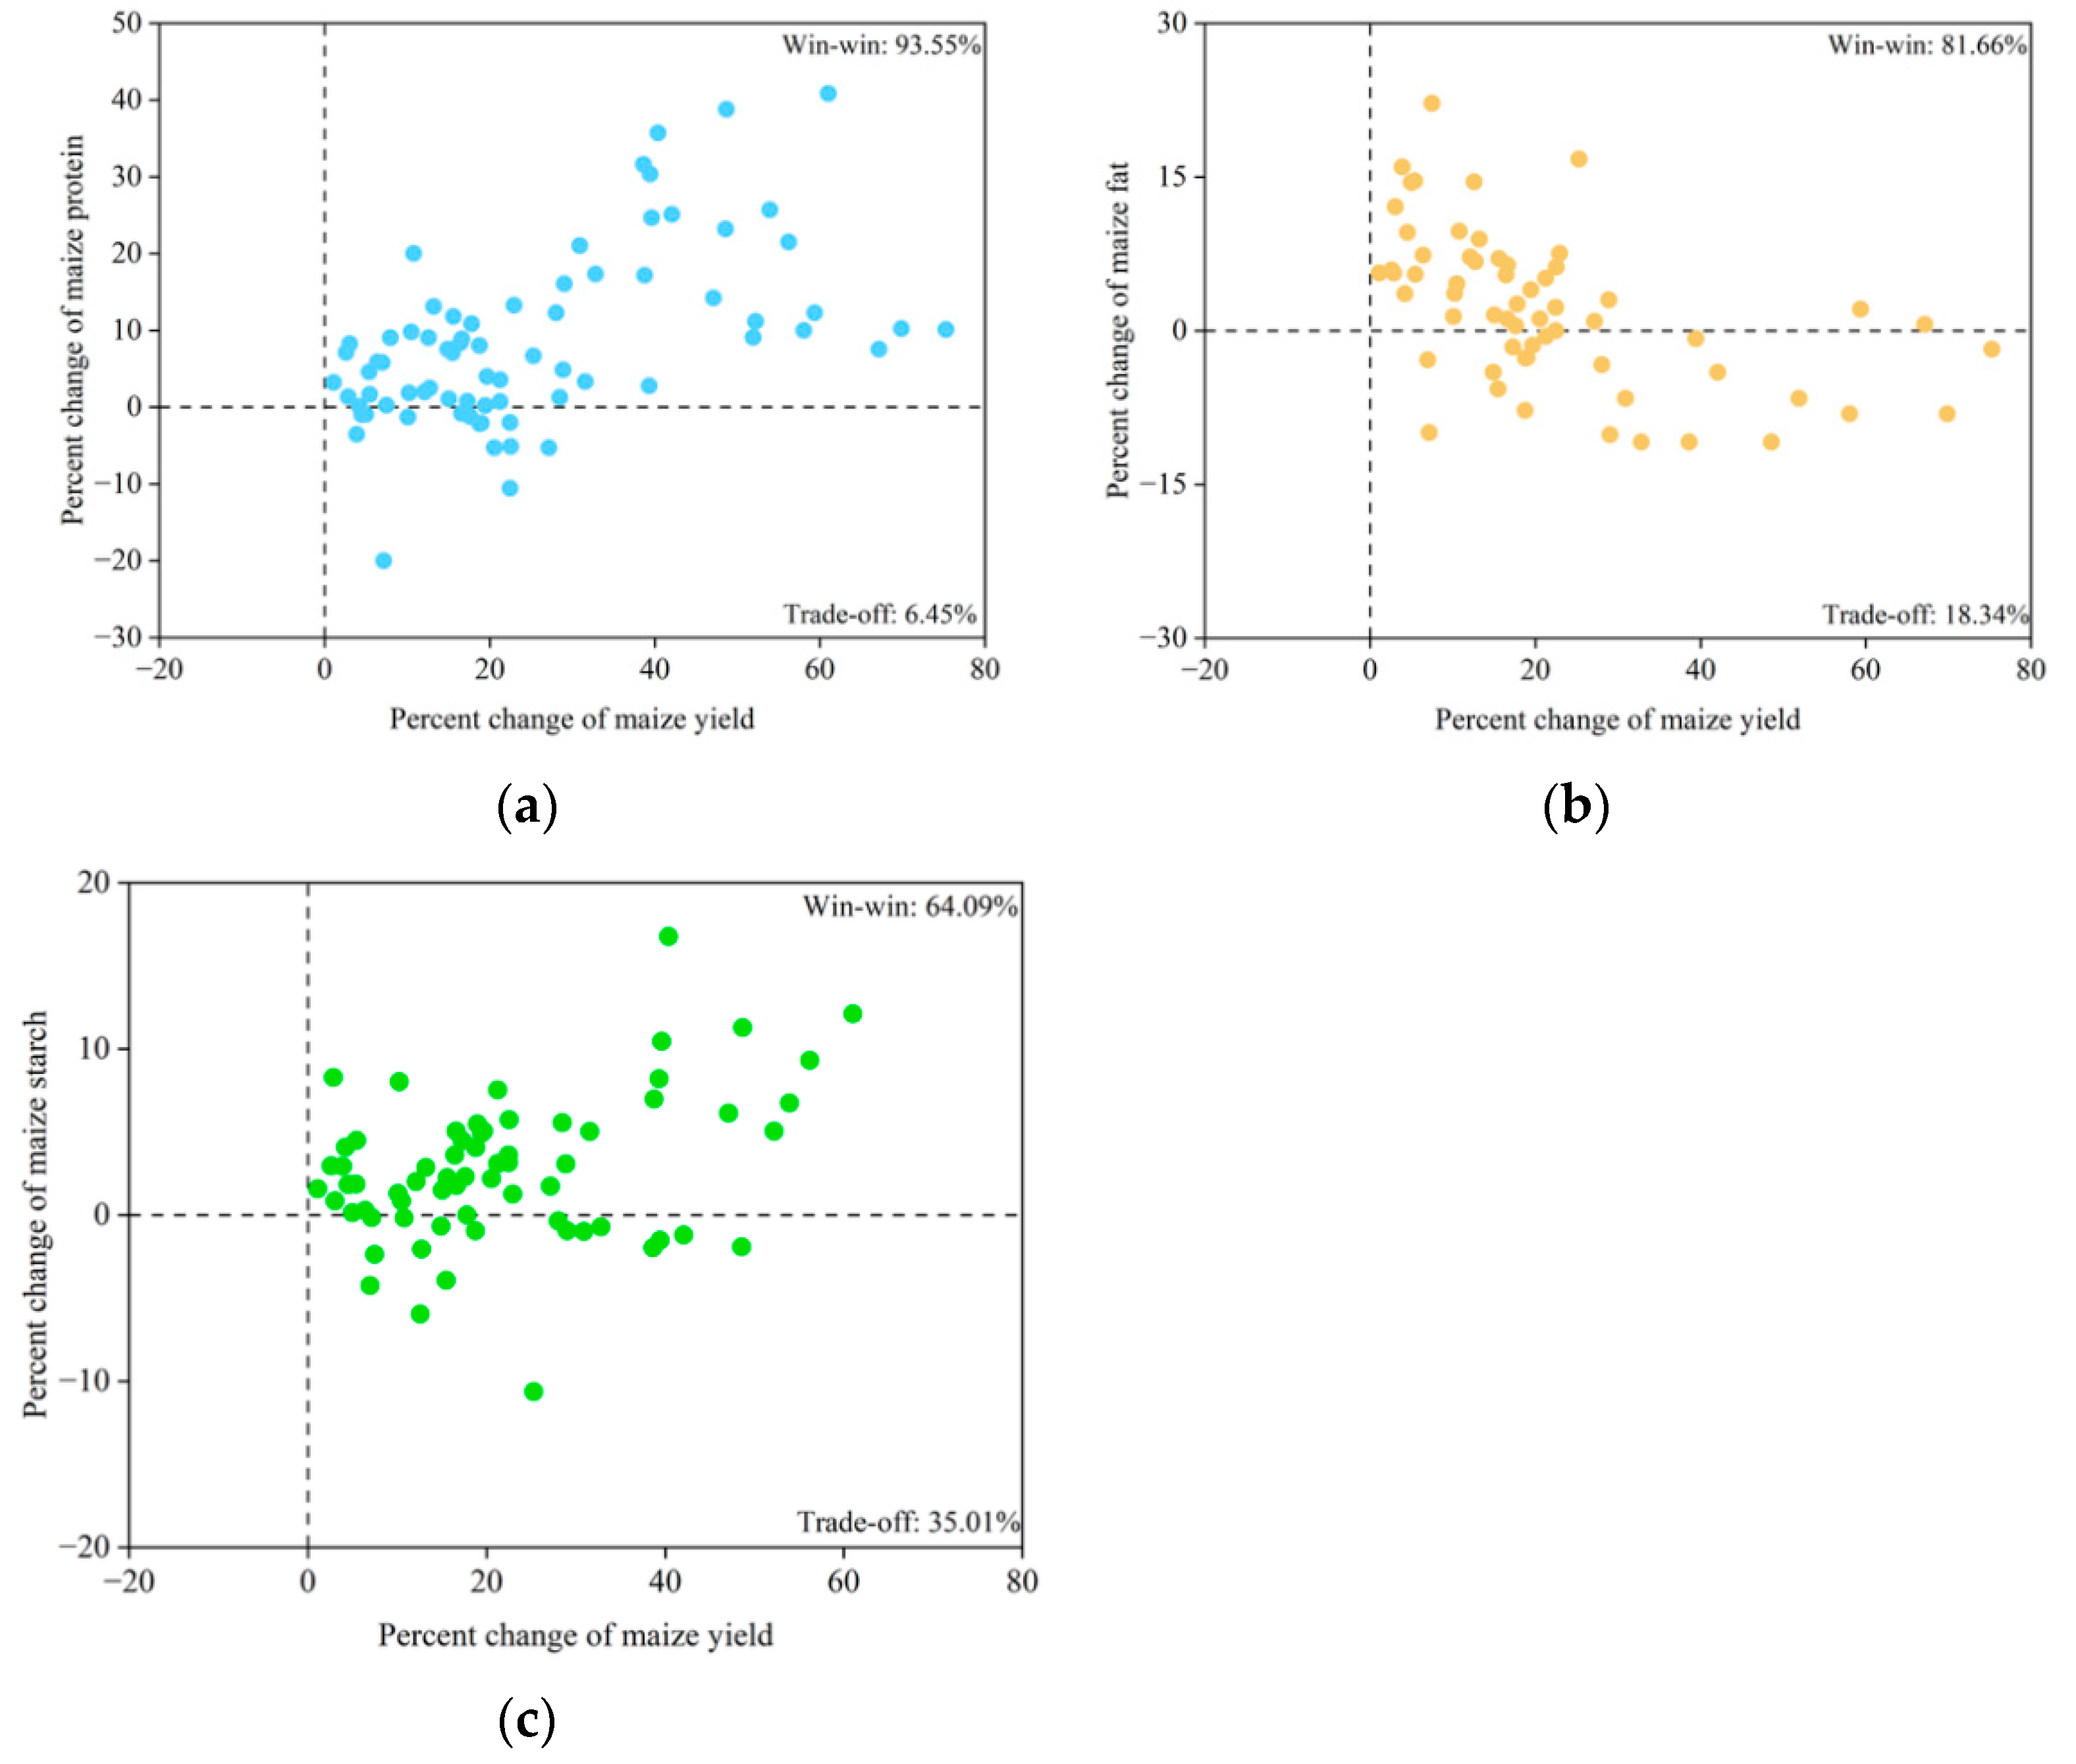
As shown in Figure 6, a weighted analysis was conducted on paired data in which both maize yield and quality traits were simultaneously measured (protein: 74 pairs; fat: 59 pairs; starch: 67 pairs). The results revealed two types of outcomes under fertilization: win–win scenarios, where both yield and quality improved, and trade-off scenarios, where yield increased at the expense of quality. In all trade-off cases identified in this study, fertilization enhanced yield while reducing quality traits. Specifically, 93.6% of the data pairs exhibited a synergistic increase in yield and protein content, while 6.4% showed increased yield but decreased protein concentration. For fat, 81.7% of the data pairs indicated a win–win outcome, whereas 18.3% reflected a trade-off. Regarding starch, 64.1% of the data pairs achieved coordinated improvements, while 35.9% exhibited an increase in yield accompanied by a decrease in starch content.
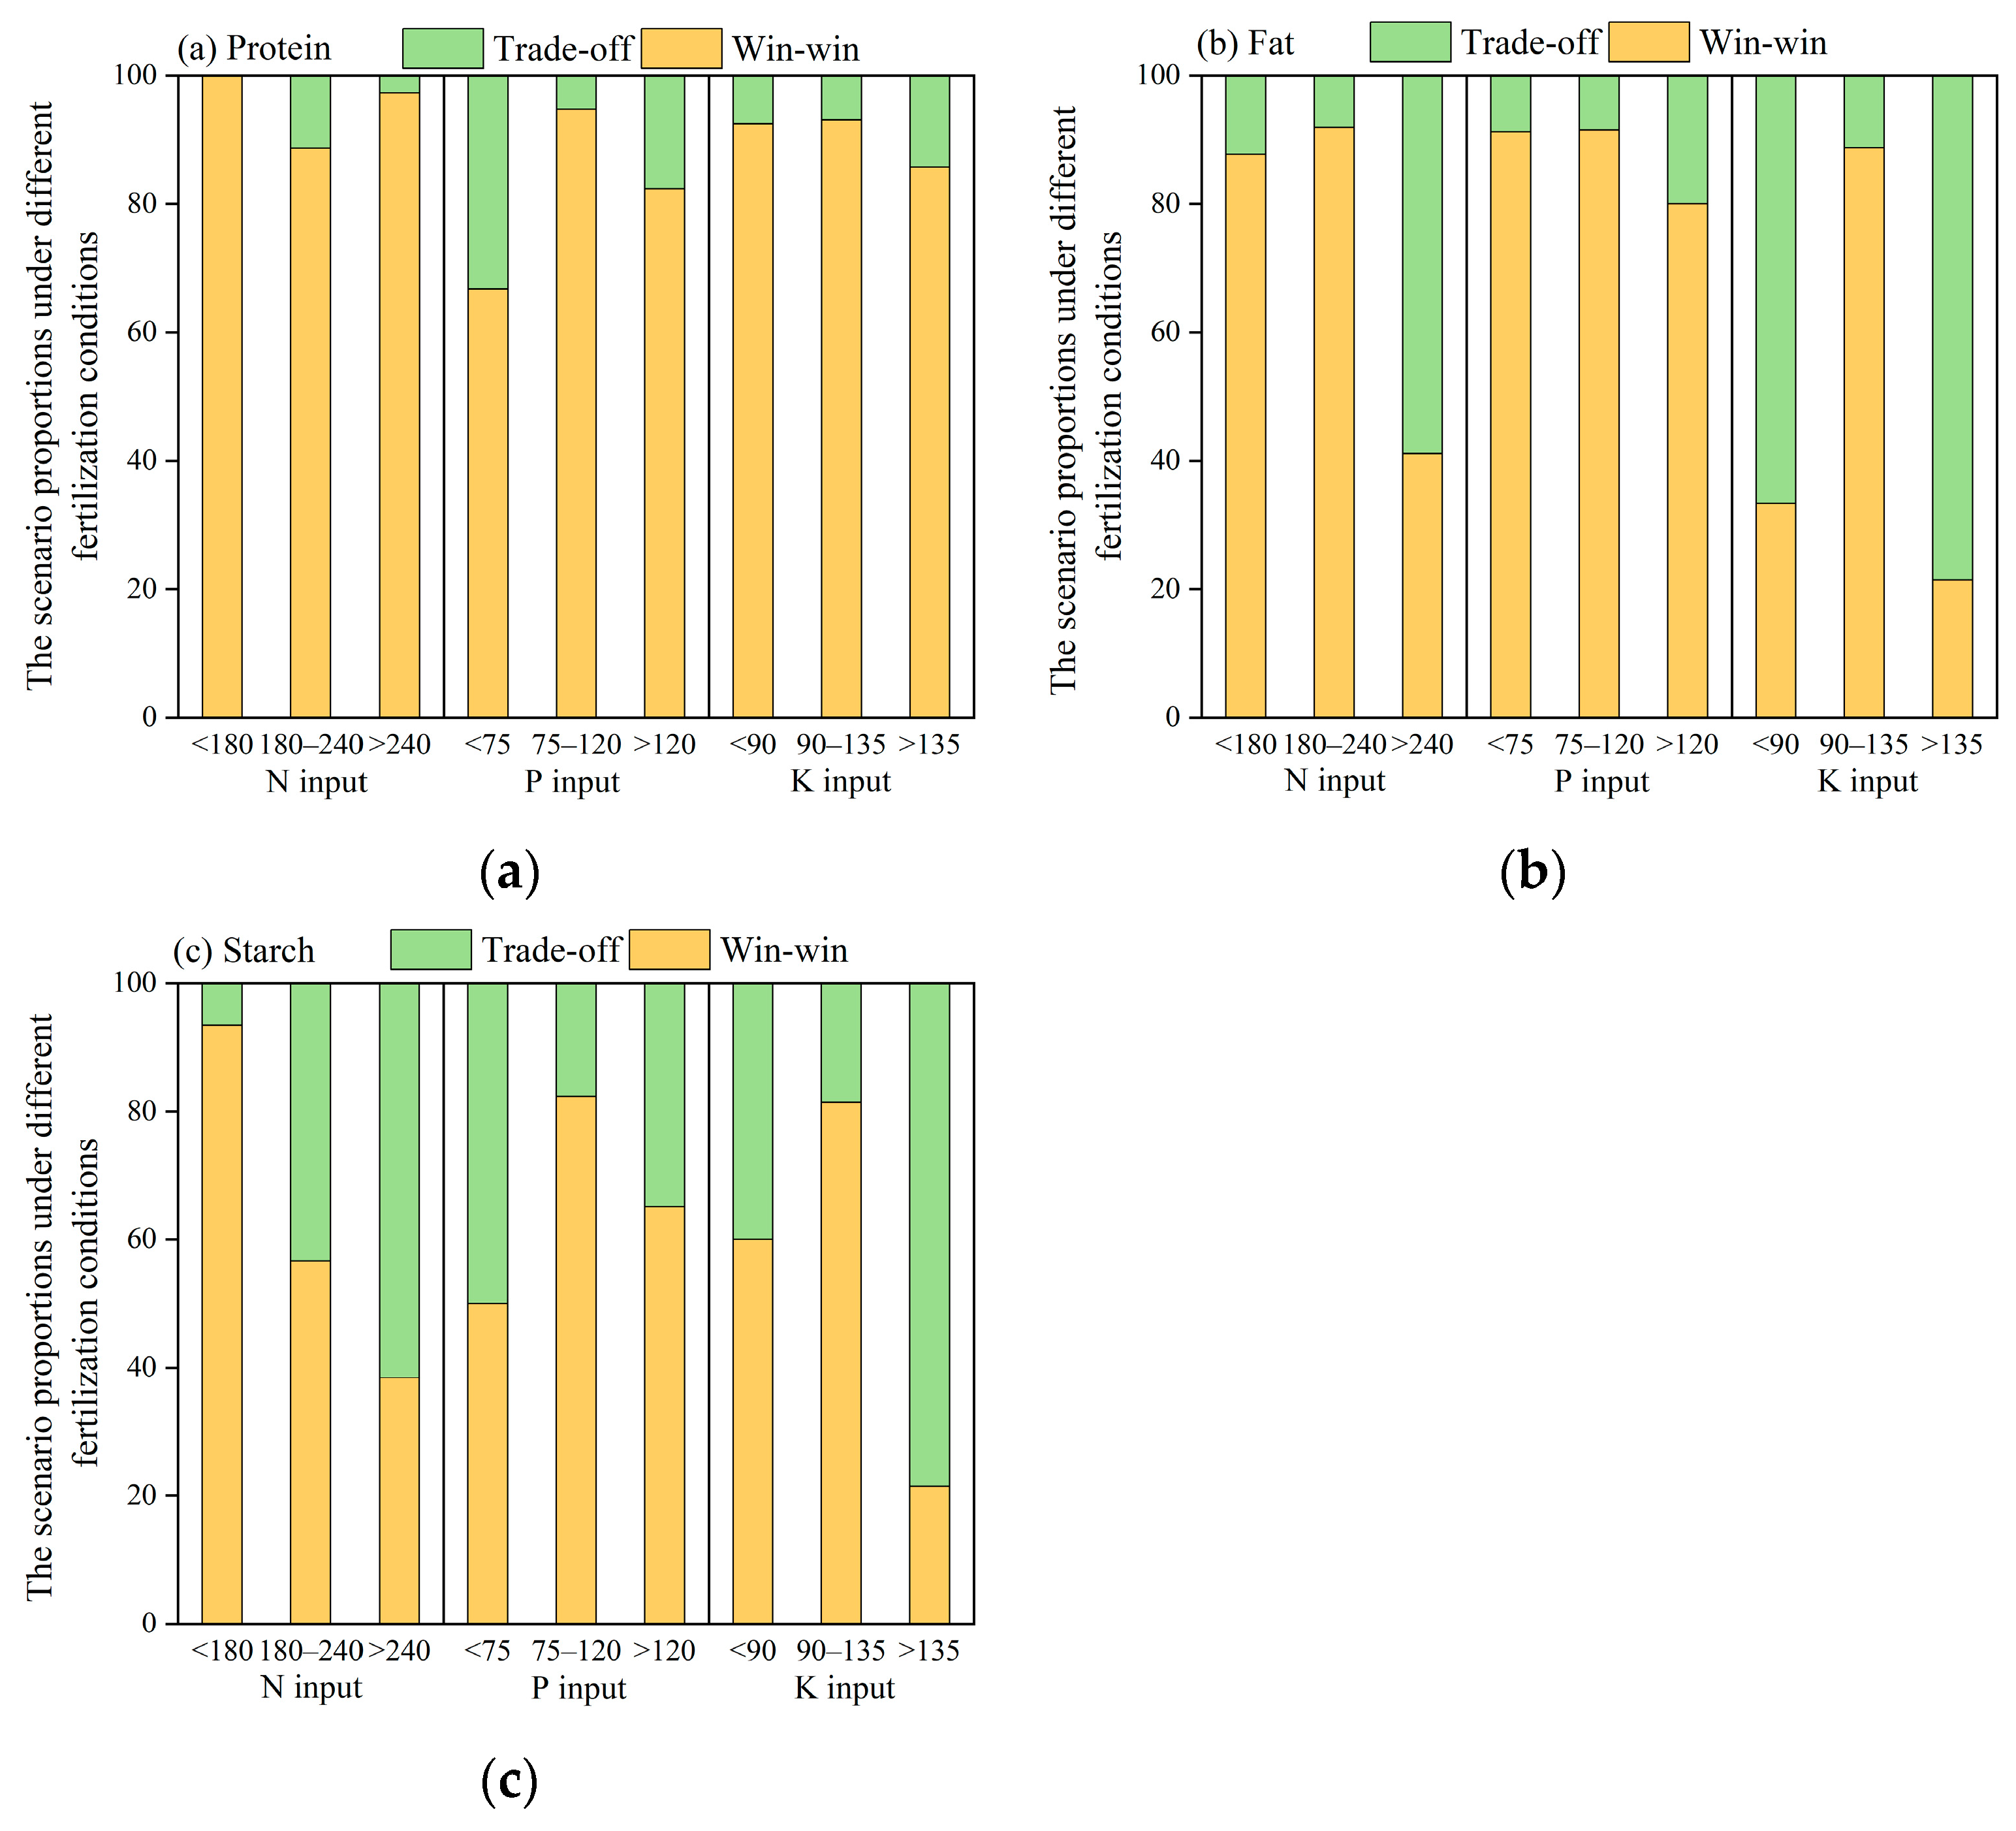
Further analysis of different fertilization levels (Figure 7) revealed that under nitrogen inputs <180 kg ha−1, the highest proportions of win–win outcomes were observed between yield and protein (100%) and between yield and starch (93.4%). At nitrogen application levels of 180–240 kg ha−1, the proportion of win–win scenarios were highest between yield and fat (91.9%). Similarly, when phosphorus application ranged from 75 to 120 kg ha−1, the highest win–win proportions were found between yield and protein (94.8%), fat (91.5%), and starch (82.4%). Under potassium application rates of 90–135 kg ha−1, win–win outcomes between yield and protein (94.9%), fat (88.7%), and starch (81.4%) were also maximized. These results suggest that moderate fertilization levels are more conducive to achieving synergistic improvements in maize yield and quality, whereas excessive fertilizer inputs do not promote such coordination and may even hinder quality enhancement.

4. Discussion

4.1. Effects of Environmental Factors on Yield and Quality Improvement Under Fertilization in Northeast China

Subgroup meta-analysis revealed that, compared with no fertilization, the yield increase in maize under fertilization was highest when the annual precipitation was below 450 mm (Figure 1). The greatest improvements in protein and fat were observed under precipitation >600 mm, whereas starch content increased most when precipitation was <450 mm. Previous studies have reported that maize water requirements during the growing season in Northeast China range from 550 to 650 mm [26]. In relatively dry environments with limited precipitation, maize growth is often subject to water stress, leading to yield reduction. Fertilization can enhance root development and improve root water uptake capacity, thereby alleviating drought stress to some extent and resulting in higher yield gains [27]. Starch content is positively correlated with kernel weight, and its synthesis is closely associated with the grain filling process and dry matter accumulation [28,29]. In contrast, protein and fat showed greater improvements under high precipitation conditions. Previous research has indicated a trade-off between starch and protein or fat accumulation in maize kernels [30]. These grain quality traits originate from glucose, the primary product of photosynthesis, which is further converted into starch, protein, and fat. In the case of an equal amount of glucose produced by photosynthesis, higher starch content results in heavier kernels compared to those with higher protein or fat content [31].
In terms of temperature, the enhancement of starch content was greatest when the mean annual temperature was <5 °C, whereas protein and fat responded best to temperatures between 5 and 7 °C (Figure 1). These differences are likely related to the distinct temperature sensitivities of enzymes involved in starch and protein deposition in the endosperm [32]. Rising mean annual temperatures promoted yield increases, since temperature strongly influences maize development, yield formation, harvest index, and grain weight [33,34,35]. The primary maize-producing region in Northeast China spans warm temperate, middle temperate, and cold temperate zones, leading to large climatic gradients. In the northern areas, maize often suffers from spring cold spells in early growth and insufficient heat and light in the later stages. Therefore, relatively higher mean annual temperatures are beneficial for efficient utilization of thermal resources and yield enhancement [36]. Our analysis further showed that maize yield improvement was highest in saline–alkaline soils (32.2%) and brown soils (29.7%) (Figure 2). Saline–alkaline soils are mainly distributed in the Songnen Plain, one of the largest such regions in China and globally, covering more than 3 million hectares. These soils are characterized by high exchangeable sodium and low organic matter content, which hinder soil aggregation and reduce fertility. As a result, maize yield in unfertilized control plots is often low, making the yield gain from fertilization relatively large [37,38]. Brown soils, widely distributed across the eastern slopes of the Greater Khingan Mountains, the Lesser Khingan Mountains, and the Changbai Mountains [39], typically have high organic matter and total nitrogen content, as well as favorable soil structure and nutrient-holding capacity, which contribute to enhanced maize growth [40]. Regarding quality traits, brown and black soils significantly enhanced crude protein content, with black soils also contributing most to fat accumulation, while fat increased most in black soils. Loamy soils with moderate texture provide favorable conditions for root development and nutrient uptake, thereby promoting nutrient accumulation in aboveground tissues [41].
Soils with pH <6.5 produced the greatest yield and starch improvements under fertilization, while pH levels between 6.5 and 7.5 promoted the highest protein accumulation (Figure 2). Soil pH affects nutrient availability. Studies have shown a significant negative correlation between soil pH and total nitrogen content; lower pH helps retain more total nitrogen, supporting crop growth and protein formation [42]. The greatest yield increase occurred when total soil nitrogen was 1–1.5 g ha−1 and organic matter ranged from 10 to 30 g ha−1. The soil C/N ratio directly affects nitrogen availability: a high ratio drives microbial nitrogen immobilization for decomposition, limiting crop uptake; in contrast, a low ratio often causes nitrogen oversupply, increasing the risk of nutrient imbalance and environmental loss [43]. Thus, maintaining moderate soil C and N levels helps ensure a balanced C/N ratio conducive to maize growth. Protein increase was highest when total soil nitrogen exceeded 1.5 g ha−1, whereas starch increase peaked at nitrogen levels below 1 g ha−1. Higher nitrogen availability is essential for protein biosynthesis in maize [44]. Protein was most enhanced when soil organic matter was 10–30 g ha−1, while fat and starch increased most at organic matter levels >30 g ha−1. These results underscore the importance of maintaining optimal soil C and N contents and C/N ratios for improving maize nutritional quality [45].
Subgroup analyses of available nutrients revealed that protein and starch increases were greatest under high levels of alkali-hydrolyzable nitrogen and available phosphorus. Adequate levels of these nutrients enhance nitrogen uptake and promote protein and starch accumulation [46]. For available potassium, protein and starch improvements were greatest at moderate levels, as both deficiency and excess potassium may interfere with uptake and metabolism, ultimately affecting grain quality [47]. While phosphorus is a key element in lipid biosynthesis, our study found that fat increased more at lower phosphorus input levels, likely due to initially low-fat content in control treatments [48]. Finally, maize yield increases were highest under low alkali-hydrolyzable nitrogen, medium available phosphorus, and low available potassium conditions, where the control yields were relatively low and fertilization produced a greater magnitude of yield gain [49].

4.2. Effects of Management Practices on Maize Yield and Quality Improvement

In this study, the highest yield increase was observed under moderate fertilization levels, specifically nitrogen application of 180–240 kg ha−1, phosphorus at 75–120 kg ha−1, and potassium at 90–135 kg ha−1 (Figure 3). These results align with the pattern of absolute yield values, indicating that appropriate fertilization levels optimize nutrient use efficiency and promote maize growth and yield formation. Both insufficient and excessive fertilization were detrimental to yield improvement. Except for protein, which showed the highest increase under high nitrogen input, most quality components—including fat and starch—responded best to moderate nitrogen, high phosphorus, and moderate potassium inputs. Quality improvements were more pronounced under moderate to high nutrient levels, a pattern that does not fully match that of yield, likely due to the stimulation of key enzyme activities involved in nutrient biosynthesis at higher fertilization levels [50].
Increasing plant density is another effective strategy for enhancing future maize yield potential [51] (Figure 4). When all other growth conditions are met, plant density becomes a direct limiting factor for yield. In the present study, the yield improvement due to fertilization first increased and then decreased with rising planting density, with the maximum effect observed at densities exceeding 65,000 plants ha−1. As the foundation of population structure, plant density shapes the crop canopy and resource competition, especially for water and nutrients [52]. Dense planting enhances carbon fixation per unit leaf area and reduces the proportion of assimilates allocated to non-productive organs such as stems. Under adequate water and nutrient supply, this strategy can significantly enhance yield [53]. In contrast, the highest increases in protein and fat were achieved at medium and low planting densities, respectively. High densities may intensify vegetative metabolism, adversely affecting nutrient accumulation in kernels [54]. Previous research has shown that moderate planting densities help ensure both yield enhancement and the maintenance of desirable grain composition [55,56].

4.3. Synergistic Relationship Between Yield and Quality in the Major Maize-Producing Region of Northeast China

Random forest analysis revealed that soil nutrient content was the most important factor influencing yield response to fertilization in Northeast China, whereas climatic conditions and management practices were the primary determinants of quality improvement (Figure 5). Achieving a coordinated enhancement of yield and quality requires integrated nutrient resource management and the optimization of both soil and crop systems to maximize resource-use efficiency [57]. Trade-off analysis between yield and major quality traits showed that moderate-to-low fertilization levels were more favorable for achieving synergistic improvements (Figure 6 and Figure 7). Currently, excessive fertilization remains a widespread issue in maize production, leading to environmental pollution and nutrient waste, while failing to promote coordinated gains in yield and quality [58]. As living standards rise, the expectations for staple crops have shifted from yield alone to include nutritional quality, to better meet human dietary needs [59]. Findings from this study suggest that by considering regional climatic and soil conditions, optimizing fertilization and planting practices can effectively enhance both maize yield and grain quality, thereby contributing to national food security.
It should be noted, however, that this meta-analysis did not include genotype as a moderator variable due to the limited availability of genotypic data across studies. Since maize yield and grain quality are strongly influenced by genetic background and its interaction with fertilization, particularly with nitrogen input, the absence of genotypic stratification may limit the precision of conclusions regarding yield–quality coordination [60]. Future meta-analyses should consider integrating genotype or hybrid type to improve the robustness of yield–quality synergy assessments.

5. Conclusions

This study employed a meta-analysis to quantitatively assess the effects of fertilization on maize yield and grain quality in Northeast China. The results showed that, compared with no fertilization, fertilizer application significantly increased maize yield, protein, fat, and starch contents by 20.0, 12.6, 1.4, and 1.2%, respectively. Climatic and soil conditions were identified as key environmental factors influencing the effectiveness of fertilization, with appropriate levels of precipitation, temperature, and soil pH substantially enhancing both yield and quality. Moderate nitrogen, phosphorus, and potassium inputs most effectively enhanced yield, whereas higher nitrogen levels contributed to protein accumulation but may compromise the balance between yield and quality. The contributions of planting density to yield and quality varied: high planting density promoted yield improvement, whereas low to moderate densities were more conducive to increasing protein and fat content, respectively. Further analysis indicated that yield improvement was primarily driven by soil nutrient status, while quality enhancement was largely influenced by climate and management practices. This study highlights the trade-off between maize yield and quality under different fertilization intensities, suggesting that moderate input levels offer the best strategy for achieving coordinated improvements in both traits. Future research should focus on the yield–quality responses of different maize genotype to better support synergistic enhancement of yield and grain quality.

Author Contributions

Conceptualization, and writing—review and editing, X.L.; Funding acquisition, Q.G.; methodology and data curation, X.G.; methodology and data curation, L.Z.; writing—original draft, Y.A.; formal analysis, S.W. and G.F.; software, J.L. All authors have read and agreed to the published version of the manuscript.

Funding

This research was funded by the National Key Research and Development Program of China, grant number 2025YFD1700202.

Institutional Review Board Statement

This study did not involve humans or animals, and therefore, ethical review and approval were not applicable.

Data Availability Statement

The data presented in this study are available on request from the corresponding author.

Acknowledgments

We thank the anonymous reviewers and editors for their constructive comments on this manuscript.

Conflicts of Interest

The authors declare no conflicts of interest.

References

  1. Wang, S.; Huang, X.; Zhang, Y.; Yin, C.; Richel, A. The effect of corn straw return on corn production in Northeast China: An integrated regional evaluation with meta-analysis and system dynamics. Resour. Conserv. Recycl. 2021, 167, 105402. [Google Scholar] [CrossRef]
  2. Ishfaq, M.; Wang, Y.; Xu, J.; Hassan, M.; Yuan, H.; Liu, L.; He, B.; Ejaz, I.; White, P.; Cakmak, I.; et al. Improvement of nutritional quality of food crops with fertilizer: A global meta-analysis. Agron. Sustain. Dev. 2023, 43, 74. [Google Scholar] [CrossRef]
  3. He, R.; Shao, C.; Shi, R.; Zhang, Z.; Zhao, R. Development trend and driving factors of agricultural chemical fertilizer efficiency in China. Sustainability 2020, 12, 4607. [Google Scholar] [CrossRef]
  4. Ren, C.; Jin, S.; Wu, Y.; Zhang, B.; Kanter, D.; Wu, B.; Xi, X.; Zhang, X.; Chen, D.; Xu, J.; et al. Fertilizer overuse in Chinese smallholders due to lack of fixed inputs. J. Environ. Manag. 2021, 293, 112913. [Google Scholar] [CrossRef]
  5. Ren, J.; Liu, X.; Yang, W.; Yang, X.; Li, X.; Xia, Q.; Li, J.; Gao, Z.; Yang, Z. Rhizosphere soil properties, microbial community, and enzyme activities: Short-term responses to partial substitution of chemical fertilizer with organic manure. J. Environ. Manag. 2021, 299, 113650. [Google Scholar] [CrossRef]
  6. Li, J.; Yang, W.; Guo, A.; Yang, X.; Li, W.; Xia, Q.; Gao, Z.; Yang, Z. Combined foliar and soil selenium fertilizer increased the grain yield, quality, total Se, and organic Se content in naked oats. J. Cereal Sci. 2021, 100, 103265. [Google Scholar] [CrossRef]
  7. Li, X.; Wen, Q.; Zhang, S.; Li, N.; Yang, J.; Han, X. Long-term rotation fertilisation has differential effects on soil phosphorus. Plant Soil Environ. 2020, 66, 543–551. [Google Scholar] [CrossRef]
  8. Liu, S.; Cui, S.; Zhang, X.; Wang, Y.; Mi, G.; Gao, Q. Synergistic regulation of nitrogen and sulfur on redox balance of maize leaves and amino acids balance of grains. Front. Plant Sci. 2020, 11, 576718. [Google Scholar] [CrossRef]
  9. Lux, P.E.; Schneider, J.; Müller, F.; Wiedmaier-Czerny, N.; Vetter, W.; Weiß, T.M.; Würschum, T.; Frank, J. Location and variety but not phosphate starter fertilization influence the profiles of fatty acids, carotenoids, and tocochromanols in kernels of modern corn (Zea mays L.) hybrids cultivated in Germany. J. Agric. Food Chem. 2021, 69, 2845–2854. [Google Scholar] [CrossRef]
  10. Anthony, P.; Malzer, G.; Sparrow, S.; Zhang, M. Soybean yield and quality in relation to soil properties. Agron. J. 2012, 104, 1443–1458. [Google Scholar] [CrossRef]
  11. Improved Crop Quality by Nutrient Management; Springer Science & Business Media: Berlin/Heidelberg, Germany, 2007.
  12. Kushwah, N.; Billore, V.; Sharma, O.P.; Singh, D.; Chauhan, A.P.S. Integrated Nutrient management for optimal plant health and crop yield. Plant Sci. Archit. 2024, 8, 10–12. [Google Scholar] [CrossRef]
  13. Zhang, F.; Shen, J.; Zhang, J.; Zuo, Y.; Li, L.; Chen, X. Rhizosphere processes and management for improving nutrient use efficiency and crop productivity: Implications for China. Adv. Agron. 2010, 107, 1–32. [Google Scholar]
  14. Shi, T.S.; Collins, S.L.; Yu, K.; Peñuelas, J.; Sardans, J.; Li, H.; Ye, J.S. A global meta-analysis on the effects of organic and inorganic fertilization on grasslands and croplands. Nat. Commun. 2024, 15, 3411. [Google Scholar]
  15. Young, M.D.; Ros, G.H.; de Vries, W. Impacts of agronomic measures on crop, soil, and environmental indicators: A review and synthesis of meta-analysis. Agric. Ecosyst. Environ. 2021, 319, 107551. [Google Scholar] [CrossRef]
  16. Borenstein, M.; Hedges, L.V.; Higgins, J.P.T.; Rothstein, H.R. Introduction to Meta-Analysis; John Wiley & Sons: Hoboken, NJ, USA, 2021. [Google Scholar]
  17. Makowski, D.; Piraux, F.; Brun, F. From Experimental Network to Meta-Analysis; Springer: Dordrecht, The Netherlands, 2019. [Google Scholar]
  18. Guo, C.; Liu, X.; He, X. A global meta-analysis of crop yield and agricultural greenhouse gas emissions under nitrogen fertilizer application. Sci. Total Environ. 2022, 831, 154982. [Google Scholar] [CrossRef]
  19. Zhang, L.; Meng, F.; Zhang, X.; Gao, Q.; Yan, L. Optimum management strategy for improving maize water productivity and partial factor productivity for nitrogen in China: A meta-analysis. Agric. Water Manag. 2024, 303, 109043. [Google Scholar] [CrossRef]
  20. Basha, S.M.; Rajput, D.S.; Somula, R.S.; Ram, S. Principles and practices of making agriculture sustainable: Crop yield prediction using Random Forest. Scalable Comput-Prac. 2020, 21, 591–599. [Google Scholar] [CrossRef]
  21. Li, Y.; Chen, J.; Drury, C.F.; Liebig, M.; Johnson, J.M.; Wang, Z.; Feng, H.; Abalos, D. The role of conservation agriculture practices in mitigating N2O emissions: A meta-analysis. Agron. Sustain. Dev. 2023, 43, 63. [Google Scholar] [CrossRef]
  22. Guo, Y.; Fu, Y.; Hao, F.; Zhang, X.; Wu, W.; Jin, X.; Bryant, C.R.; Senthilnath, J. Integrated phenology and climate in rice yields prediction using machine learning methods. Ecol. Indic. 2021, 120, 106935. [Google Scholar] [CrossRef]
  23. Wang, Y.; Wu, P.; Mei, F.; Ling, Y.; Qiao, Y.; Liu, C.; Leghari, S.J.; Guang, X.; Wang, T. Does continuous straw returning keep China farmland soil organic carbon continued increase? A meta-analysis. J. Environ. Manag. 2021, 288, 112391. [Google Scholar] [CrossRef]
  24. Hedges, L.V.; Gurevitch, J.; Curtis, P.S. The meta-analysis of response ratios in experimental ecology. Ecology 1999, 80, 1150–1156. [Google Scholar] [CrossRef]
  25. Viechtbauer, W. Conducting meta-analyses in R with the metafor package. J. Stat. Softw. 2010, 36, 1–48. [Google Scholar] [CrossRef]
  26. Xiao, X.; Zhang, J.; Liu, Y. Impacts of crop type and climate changes on agricultural water dynamics in Northeast China from 2000 to 2020. Remote Sens. 2024, 16, 1007. [Google Scholar] [CrossRef]
  27. Oikeh, S.O.; Kling, J.G.; Horst, W.J.; Chude, V.O.; Carsky, R.J. Growth and distribution of maize roots under nitrogen fertilization in plinthite soil. Field Crops Res. 1999, 62, 1–13. [Google Scholar] [CrossRef]
  28. Yue, K.; Li, L.; Xie, J.; Liu, Y.; Xie, J.; Anwar, S.; Fudjoe, S.K. Nitrogen supply affects yield and grain filling of maize by regulating starch metabolizing enzyme activities and endogenous hormone contents. Front. Plant Sci. 2022, 12, 798119. [Google Scholar] [CrossRef] [PubMed]
  29. Yang, B.; Wu, S.; Yan, Z. Effects of climate change on corn yields: Spatiotemporal evidence from geographically and temporally weighted regression model. ISPRS Int. J. Geo-Inf. 2022, 11, 433. [Google Scholar] [CrossRef]
  30. Wang, L.; Yu, X.; Gao, J.; Ma, D.; Guo, H.; Hu, S. Patterns of influence of meteorological elements on maize grain weight and nutritional quality. Agronomy 2023, 13, 424. [Google Scholar] [CrossRef]
  31. Yang, H.; Gu, X.; Ding, M.; Lu, W.; Lu, D. Heat stress during grain filling affects activities of enzymes involved in grain protein and starch synthesis in waxy maize. Sci. Rep. 2018, 8, 15665. [Google Scholar] [CrossRef]
  32. Lu, D.; Sun, X.; Yan, F.; Wang, X.; Xu, R.; Lu, W. Effects of high temperature during grain filling under control conditions on the physicochemical properties of waxy maize flour. Carbohyd. Polym. 2013, 98, 302–310. [Google Scholar] [CrossRef]
  33. Liu, Y.; Hou, P.; Xie, R.; Li, S.; Zhang, H.; Ming, B.; Ma, D.; Liang, S. Spatial adaptabilities of spring maize to variation of climatic conditions. Crop Sci. 2013, 53, 1693–1703. [Google Scholar] [CrossRef]
  34. Hou, P.; Liu, Y.; Xie, R.; Ming, B.; Ma, D.; Li, S.; Mei, X. Temporal and spatial variation in accumulated temperature requirements of maize. Field Crops Res. 2014, 158, 55–64. [Google Scholar] [CrossRef]
  35. Long, N.V.; Assefa, Y.; Schwalbert, R.; Ciampitti, I.A. Maize yield and planting date relationship: A synthesis-analysis for US high-yielding contest-winner and field research data. Front. Plant Sci. 2017, 8, 2106. [Google Scholar] [CrossRef] [PubMed]
  36. Wu, W.; Yue, W.; Bi, J.; Zhang, L.; Xu, D.; Peng, C.; Chen, X.; Wang, S. Influence of climatic variables on maize grain yield and its components by adjusting the sowing date. Front. Plant Sci. 2024, 15, 1411009. [Google Scholar] [CrossRef]
  37. Yang, F.; An, F.; Ma, H.; Wang, Z.; Zhou, X.; Liu, Z. Variations on soil salinity and sodicity and its driving factors analysis under microtopography in different hydrological conditions. Water 2016, 8, 227. [Google Scholar] [CrossRef]
  38. Chen, X.; Yaa, O.K.; Wu, J. Effects of different organic materials application on soil physicochemical properties in a primary saline-alkali soil. Eurasian Soil Sci. 2020, 53, 798–808. [Google Scholar] [CrossRef]
  39. Wu, H.; Guo, Z.; Peng, C. Distribution and storage of soil organic carbon in China. Glob. Biogeochem. Cycles 2003, 17, 1–11. [Google Scholar] [CrossRef]
  40. Sun, Q.; Yang, X.; Bao, Z.; Gao, J.; Meng, J.; Han, X.; Liu, Z.; Lan, Y.; Chen, W. Responses of microbial necromass carbon and microbial community structure to straw-and straw-derived biochar in brown earth soil of Northeast China. Front. Microbiol. 2022, 13, 967746. [Google Scholar] [CrossRef]
  41. Giuliani, L.M.; Hallett, P.D.; Loades, K.W. Effects of soil structure complexity to root growth of plants with contrasting root architecture. Soil Till. Res. 2024, 238, 106023. [Google Scholar] [CrossRef]
  42. Zhou, W.; Han, G.; Liu, M.; Li, X. Effects of soil pH and texture on soil carbon and nitrogen in soil profiles under different land uses in Mun River Basin, Northeast Thailand. Peer. J. 2019, 7, e7880. [Google Scholar] [CrossRef]
  43. Mangisoni, J.H.; Jayne, T.S.; Chigowo, M. Effects of Nitrogen and Carbon Application on Maize Output in Ntcheu and Dedza Districts of Central Malawi. J. Econ. Sustain. Dev. 2020, 11, 37–50. [Google Scholar]
  44. Lu, T.; Lu, Z.; Shi, J.; Liu, Y.; Wang, Y.; Yang, J.; Li, X.; Han, X.; Wang, Y. Long-term application of manure increased soil amino acid pool under maize-maize-soybean rotation system. J. Soil. Sediment. 2024, 24, 3572–3584. [Google Scholar]
  45. D’Hose, T.; Cougnon, M.; De Vliegher, A.; Vandecasteele, B.; Viaene, N.; Cornelis, W.; Bockstaele, E.; Reheul, D. The positive relationship between soil quality and crop production: A case study on the effect of farm compost application. Appl. Soil Ecol. 2014, 75, 189–198. [Google Scholar] [CrossRef]
  46. Blumenthal, J.M.; Baltensperger, D.D.; Cassman, K.G.; Mason, S.C.; Pavlista, A.D. Importance and effect of nitrogen on crop quality and health. In Nitrogen in the Environment; Academic Press: Cambridge, MA, USA, 2008; pp. 51–70. [Google Scholar]
  47. Hussain, S.; Maqsood, M.; Ijaz, M.; Ul-Allah, S.; Sattar, A.; Sher, A.; Nawaz, A. Combined application of potassium and zinc improves water relations, stay green, irrigation water use efficiency, and grain quality of maize under drought stress. J. Plant Nutr. 2020, 43, 2214–2225. [Google Scholar] [CrossRef]
  48. Ma, J.; Wang, G.; Liu, X.; Lei, B.; Xing, G. Effects of Phosphorus Application Levels on Its Uptake and Utilization in Foxtail Millet. Agronomy 2024, 14, 2078. [Google Scholar] [CrossRef]
  49. Zou, H.; Li, D.; Ren, K.; Liu, L.; Zhang, W.; Duan, Y.; Lu, C. Response of maize yield and nitrogen recovery efficiency to nitrogen fertilizer application in field with various soil fertility. Front. Plant Sci. 2024, 15, 1349180. [Google Scholar] [CrossRef] [PubMed]
  50. Feng, W.; Xue, W.; Zhao, Z.; Shi, Z.; Wang, W.; Bai, Y.; Wang, H.; Qiu, P.; Xue, J.; Chen, B. Nitrogen fertilizer application rate affects the dynamic metabolism of nitrogen and carbohydrates in kernels of waxy maize. Front. Plant Sci. 2024, 15, 1416397. [Google Scholar] [CrossRef] [PubMed]
  51. Jun, X.U.E.; Xie, R.Z.; Zhang, W.F.; Wang, K.R.; Hou, P.; Ming, B.; Gou, L.; Shaokun, L.I. Research progress on reduced lodging of high-yield and-density maize. J. Integr. Agric. 2017, 16, 2717–2725. [Google Scholar]
  52. Li, H.; Wang, X.; Brooker, R.W.; Zhang, F.; Davies, W.J.; Shen, J. Root competition resulting from spatial variation in nutrient distribution elicits decreasing maize yield at high planting density. Plant Soil 2019, 439, 219–232. [Google Scholar] [CrossRef]
  53. Zhang, Y.; Xu, Z.; Li, J.; Wang, R. Optimum planting density improves resource use efficiency and yield stability of rainfed maize in semiarid climate. Front. Plant Sci. 2021, 12, 752606. [Google Scholar] [CrossRef]
  54. Meng, C.; Wang, Z.; Cai, Y.; Du, F.; Chen, J.; Xiao, C. Effects of planting density and nitrogen (n) application rate on light energy utilization and yield of maize. Sustainability 2022, 14, 16707. [Google Scholar] [CrossRef]
  55. Wang, F.; Wang, L.; Yu, X.; Gao, J.; Ma, D.; Guo, H.; Zhao, H. Effect of planting density on the nutritional quality of grain in representative high-yielding maize varieties from different eras. Agriculture 2023, 13, 1835. [Google Scholar] [CrossRef]
  56. Sun, S.; Huang, Z.; Liu, H.; Xu, J.; Zheng, X.; Xue, J.; Li, S. Response of grain yield to planting density and maize hybrid selection in high latitude China—A multisource data analysis. Agronomy 2023, 13, 1333. [Google Scholar] [CrossRef]
  57. Cui, Z.; Dou, Z.X.; Ying, H.; Zhang, F. Producing more with less: Reducing environmental impacts through an integrated soil-crop system management approach. Front. Agric. Sci. Eng. 2020, 7, 14–20. [Google Scholar] [CrossRef]
  58. Huang, S.; Zhang, W.; Yu, X.; Huang, Q. Effects of long-term fertilization on corn productivity and its sustainability in an Ultisol of southern China. Agric. Ecosyst. Environ. 2010, 138, 44–50. [Google Scholar] [CrossRef]
  59. Rouf Shah, T.; Prasad, K.; Kumar, P. Maize—A potential source of human nutrition and health: A review. Cogent Food Agric. 2016, 2, 1166995. [Google Scholar] [CrossRef]
  60. Katsenios, N.; Sparangis, P.; Chanioti, S.; Giannoglou, M.; Leonidakis, D.; Christopoulos, M.V.; Katsaros, G.; Efthimiadou, A. Genotype × environment interaction of yield and grain quality traits of maize hybrids in Greece. Agronomy 2021, 11, 357. [Google Scholar] [CrossRef]
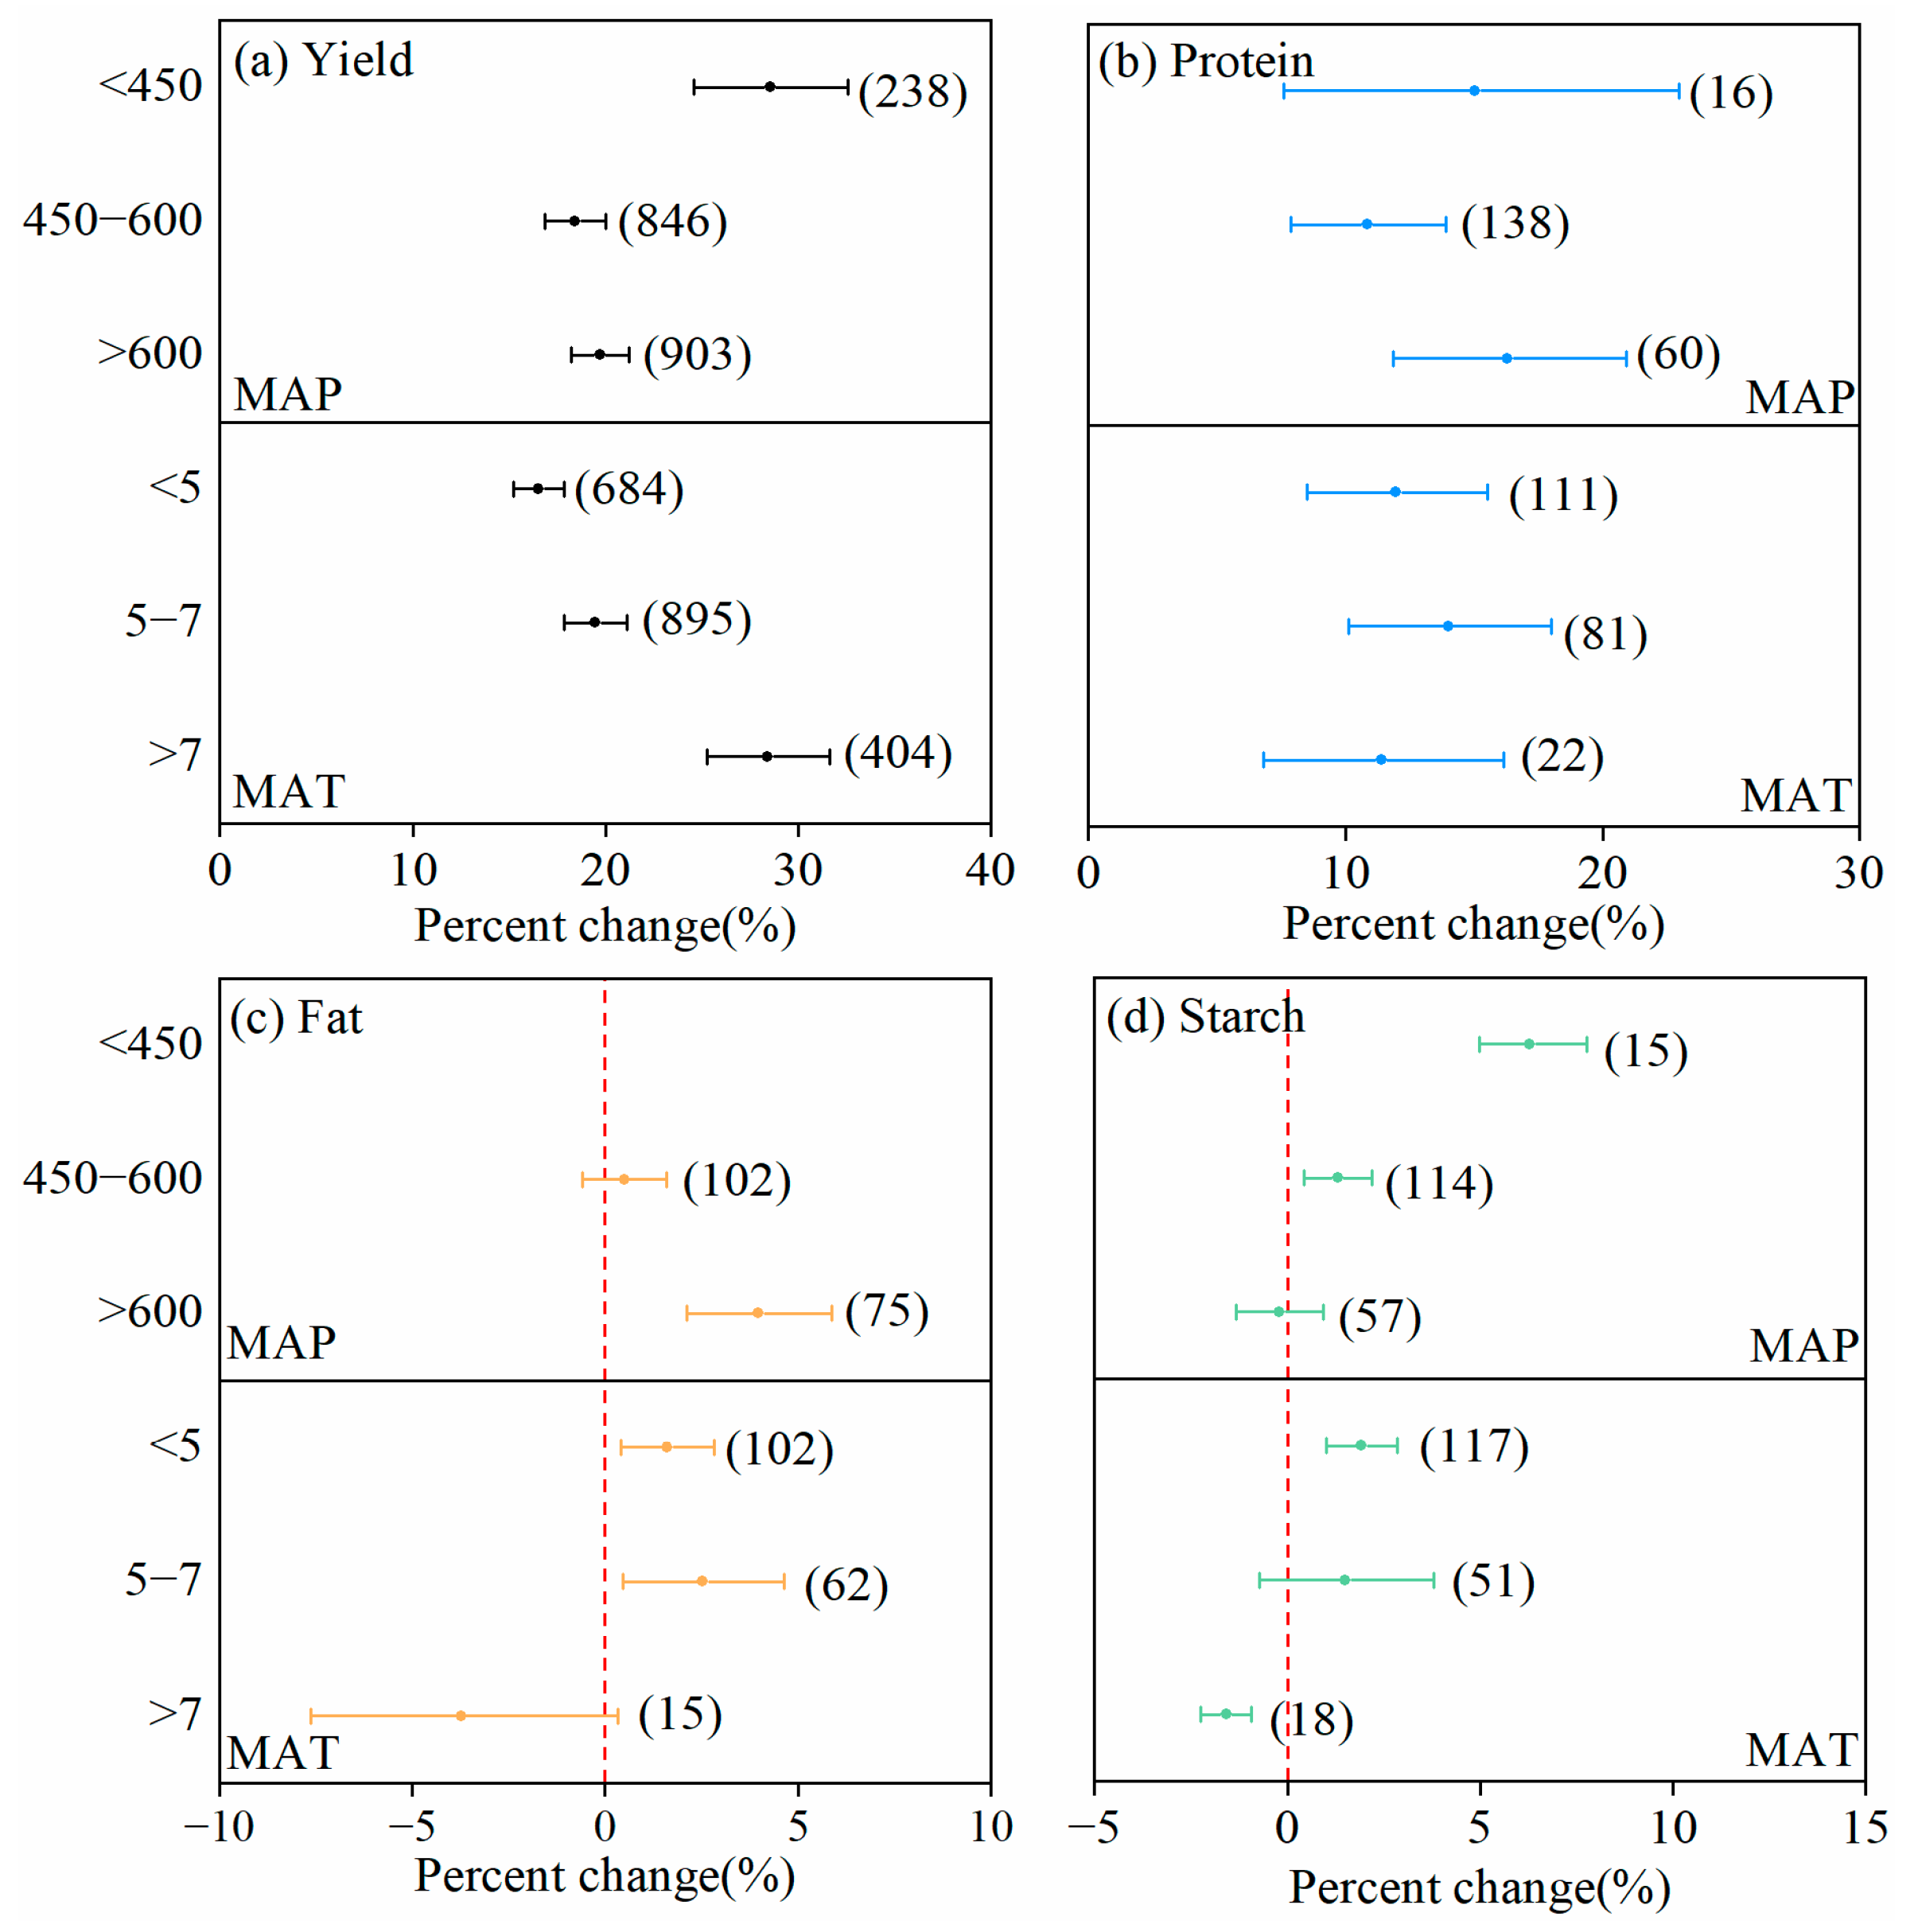
Figure 1. The influence of climate conditions on the yield and quality increasing effects of maize fertilization in Northeast China. The numbers in parentheses represent the sample size.
Agriculture 15 01371 g001
Figure 2. The influence of soil properties on the yield and quality increasing effects of maize fertilization in northeast China. The numbers in parentheses represent the sample size.
Agriculture 15 01371 g002
Figure 3. The influence of nutrient input on the yield and quality increasing effects of maize fertilization in Northeast China. The numbers in parentheses represent the sample size.
Agriculture 15 01371 g003
Figure 4. The influence of plant destiny on the yield and quality increasing effects of maize fertilization in Northeast China. The numbers in parentheses represent the sample size.
Agriculture 15 01371 g004
Figure 5. Variable relative importance of effect of fertilization on maize yield and quality. ** Significant at p < 0.01. * Significant at p < 0.05.
Agriculture 15 01371 g005
Figure 6. The trade-off between maize yield and quality improvement: (a) yield and protein; (b) yield and fat; (c) yield and starch. Colors represent different yield–quality trait combinations: blue = yield vs. protein, yellow = yield vs. fat, green = yield vs. starch.
Agriculture 15 01371 g006
Figure 7. Scenario distribution of yield and quality effects on maize with different fertilization levels: (a) yield and protein; (b) yield and fat; (c) yield and starch.
Agriculture 15 01371 g007
Table 1. Subgroup grouping.
FactorsSubgroup
Mean annual precipitation (℃)<450; 450–600; >600
Mean annual temperature (mm)<5; 5–7; >7
Soil typeSaline–alkali soil > Brown soil > Phaeozems > Meadows > Chernozem > Sandy soil > Albic soil
Soil pH<6.5; 6.5–7.5; >7.5
Soil organic matter (g kg−1)<10; 10–30; >30
Soil total nitrogen (g kg−1)<1; 1–1.5; >1.5
Soil alkaline nitrogen (mg kg−1)<90; 90–120; >120
Soil available phosphorus (mg kg−1)<10; 10–20; >20
Soil available potassium (mg kg−1)<100; 100–150; >150
Planting density (plants ha−1)<55,000; 55,000–65,000; >65,000
N rate (kg ha−1)<180; 180–240; >240
P2O5 rate (kg ha−1)<75; 75–120; >120
K2O rate (kg ha−1)<90; 90–135; >135
Table 2. Descriptive statistical analysis of the effects of fertilization on maize yield and quality.
IndicatornEQ-valdfPQ-valI2
Yield202020.0%69,8002019<0.00198.8
Protein21312.6%1888.3212<0.00188.0
Fat1791.4%243.64178<0.0180.7
Starch1861.2%205.49185<0.0190.3
Disclaimer/Publisher’s Note: The statements, opinions and data contained in all publications are solely those of the individual author(s) and contributor(s) and not of MDPI and/or the editor(s). MDPI and/or the editor(s) disclaim responsibility for any injury to people or property resulting from any ideas, methods, instructions or products referred to in the content.