Article

Optimizing Phosphorus Fertilization Management Is Conducive to Improving Alfalfa Yield and Quality: A Meta-Analysis

College of Water Conservancy and Hydrpower Engineering, Gansu Agricultural University, Lanzhou 730070, China
*
Authors to whom correspondence should be addressed.
Agriculture 2025, 15(8), 797; https://doi.org/10.3390/agriculture15080797
Submission received: 28 February 2025 / Revised: 4 April 2025 / Accepted: 5 April 2025 / Published: 8 April 2025

Abstract

:
The addition of phosphorus fertilizer plays a critical role in improving alfalfa yield and quality. However, improper application may lead to resource waste and environmental pollution, and its effects are influenced by multiple factors. This study quantitatively analyzed the effects of phosphorus fertilization on alfalfa yield, crude protein (CP) content, acid detergent fiber (ADF) content, and neutral detergent fiber (NDF) content and their major influencing factors using a meta-analysis method by integrating data from published field experiments. The results showed that, compared to no phosphorus application, phosphorus fertilization increased alfalfa yield, CP content, and NDF content by 19.0% (confidence interval [CI]: 15.4–22.6%), 7.2% (CI: 0.1–14.9%), and 7.2% (CI: 0.1–14.9%), respectively, while reducing ADF content by 3.3% on average (CI: 0.9–3.3%). In Shandong, Jilin, and Hebei, where the soil pH is 7–8, annual precipitation is 200–400 mm, annual mean temperature is above 4 °C, and altitude is 500–1000 m, alfalfa yield improved after applying calcium phosphate or single superphosphate with a P2O5 content of 0–20% at a rate of 100–200 kg·ha−1, along with nitrogen > 100 kg·ha−1, and when both the test and establishment periods were 2 years. In Xinjiang, in regions with an annual mean temperature of 6–8 °C and an establishment duration of 3 years, phosphorus fertilization improved alfalfa quality. This study provides references for enhancing alfalfa productivity and efficient utilization of phosphorus nutrition.

1. Introduction

Alfalfa (Medicago sativa L.), one of the world’s most important perennial legume forages, is known for its high protein content and richness in vitamins, minerals, and other nutrients [1]. It has a significant positive effect on improving the growth rate and meat quality of livestock, and enjoys a reputation as the “King of Pastures” [2], being widely grown worldwide [3]. In recent years, China has attached great importance to the development of the alfalfa industry, and has successively issued policy documents such as the 14th Five-Year Plan and the 14th Five-Year Plan Action Program for Improving the Competitiveness of the Dairy Industry. The plan is to reach 80% self-sufficiency in high-quality alfalfa by 2025, which will mean doubling the domestic planting area and yields [4]. However, despite significant progress in China’s alfalfa production, it still requires large-scale imports from countries such as the United States, South Africa, and Spain. Data show that from January to April 2024, China’s total imports of grass products amounted to 50.68 × 10⁴ t, an increase of 10% year-on-year, continuing a large-scale import trend [5]. At present, the development of China’s alfalfa industry still faces many challenges. Among them, farmers’ lack of knowledge about the alfalfa growing environment and management requirements leads to sloppy field management, which severely limits the full realization of alfalfa production performance. In particular, the problem of phosphorus fertilizer deficiency has a significant negative impact on alfalfa growth, dry matter production, quality parameters, digestibility, and ultimately, animal performance [6]. The solution of these problems is of great significance to enhance the competitiveness of China’s alfalfa industry.
Phosphorus, as a key element for plant growth and development and nutrient accumulation [7], plays a crucial role in the composition of important organic compounds such as nucleic acids, phospholipids, phytin, and adenosine phosphate in plants [8]. At the same time, there are complex interactions with various environmental factors, fertilizers, and soil texture [9]. For legumes, phosphorus directly affects the number of nodules and nitrogen-fixing enzyme activity by regulating the symbiotic nitrogen fixation efficiency of rhizobia [10], and they show significant advantages in the symbiotic relationship between rhizobia and plants. Studies have shown that the rhizome biomass of alfalfa can significantly increase, by 40–60%, when the nitrogen–phosphorus (N:P) ratio in the soil is lower than 10:1, because rhizobia are able to convert atmospheric nitrogen into plant-available ammonia, which improves the nitrogen supply to the plant [11]. Alfalfa is able to activate organic phosphorus in the soil through the secretion of purple acid phosphatase, thereby increasing phosphorus availability. This mechanism is particularly important in soils with low phosphorus content, as plants need to obtain sufficient phosphorus in this way to support their growth and development [12]. It has been found that changes in the nitrogen–phosphorus ratio in soil affect plant growth rate and nutrient uptake efficiency. At low nitrogen–phosphorus ratios, plants are more inclined to increase the biomass of rhizomes to improve the efficiency of nitrogen fixation and utilization [13]. Appropriate phosphorus nutrition not only favors the formation of nucleic acids and nuclear proteins, accelerates cell division and proliferation, and promotes the growth of nutrients [14,15], but it also enhances plant root development, expands root absorption area, and improves water and nutrient uptake efficiency [16]. In addition, phosphorus fertilizers are involved in the development of the plant reproductive system and hormone synthesis, regulating the differentiation and formation of flower buds and promoting the process of flowering and pollination, as well as improving the quality and yield of fruit [17]. Under adverse conditions, phosphorus fertilizer enhances crop respiration, improves nutrient and water uptake efficiency, and enhances drought and cold resistance [18]. For cash crops, phosphorus fertilizer can significantly increase the sugar content of sugar beet, sugar cane, watermelon, and other crops [19,20,21], and increase the oil content of rapeseed and improve the yield and quality of oilseed crops [22]. In the case of alfalfa, the application of appropriate amounts of phosphorus fertilizer has a positive effect on its yield, quality, growth and development, and stress resistance [23]. It has been shown that after mowing, alfalfa preferentially allocates phosphorus to regeneration sites, which allows the phosphorus concentration of new shoots to reach 2.3 times that of old leaves within 7 days of mowing. This mechanism of preferential allocation helps the plant to rapidly resume growth after experiencing stressful conditions such as mowing [1]. However, the soil quick-acting phosphorus content of about 50% of cultivated land in China is less than 5 mg·kg−1, which is much lower than the effective phosphorus requirement of alfalfa of 10 to 15 mg·kg−1. In addition, the plant’s conversion rate of soil effective phosphorus is only 5–25% [24], which makes phosphorus fertilizer application a key measure for achieving high-quality and high-yield in alfalfa. However, the over-application of phosphorus fertilizers prevalent in traditional agriculture has resulted in the coexistence of soil phosphorus accumulation and insufficient plant-available phosphorus content [25]. This inefficient fertilizer application not only causes waste of resources, but also increases the risk of phosphorus loss through leaching and soil erosion, posing a potential threat to the ecological environment [26]. Therefore, it is important to develop scientific and rational phosphorus application strategies to enhance alfalfa production potential, improve soil quality, increase crop resistance, and promote sustainable agricultural development.
Although a large number of studies have investigated the effects of phosphorus fertilization on alfalfa yield and quality, the conclusions of these studies are often inconsistent due to the differences in planting regions, fertilization strategies and management modes. Meta-analysis can effectively compensate for the limitations of the limited sample sizes and inconsistent results of individual studies by systematically collecting and analyzing the data from multiple sources. In this study, we propose to use meta-analysis to systematically integrate data from different studies, and explore the effects of region, phosphorus fertilizer, nitrogen fertilizer, and time on alfalfa yield and quality through subgroup analysis. The results of this study will not only help to quantify the effect of phosphorus fertilizer, reveal the optimal fertilization strategy, elucidate the phosphorus and nitrogen interactions, and promote the sustainability of phosphorus fertilizer application, but also provide an important theoretical basis and practical guidance for the scientific, standardized, and sustainable development of alfalfa cultivation.

2. Materials and Methods
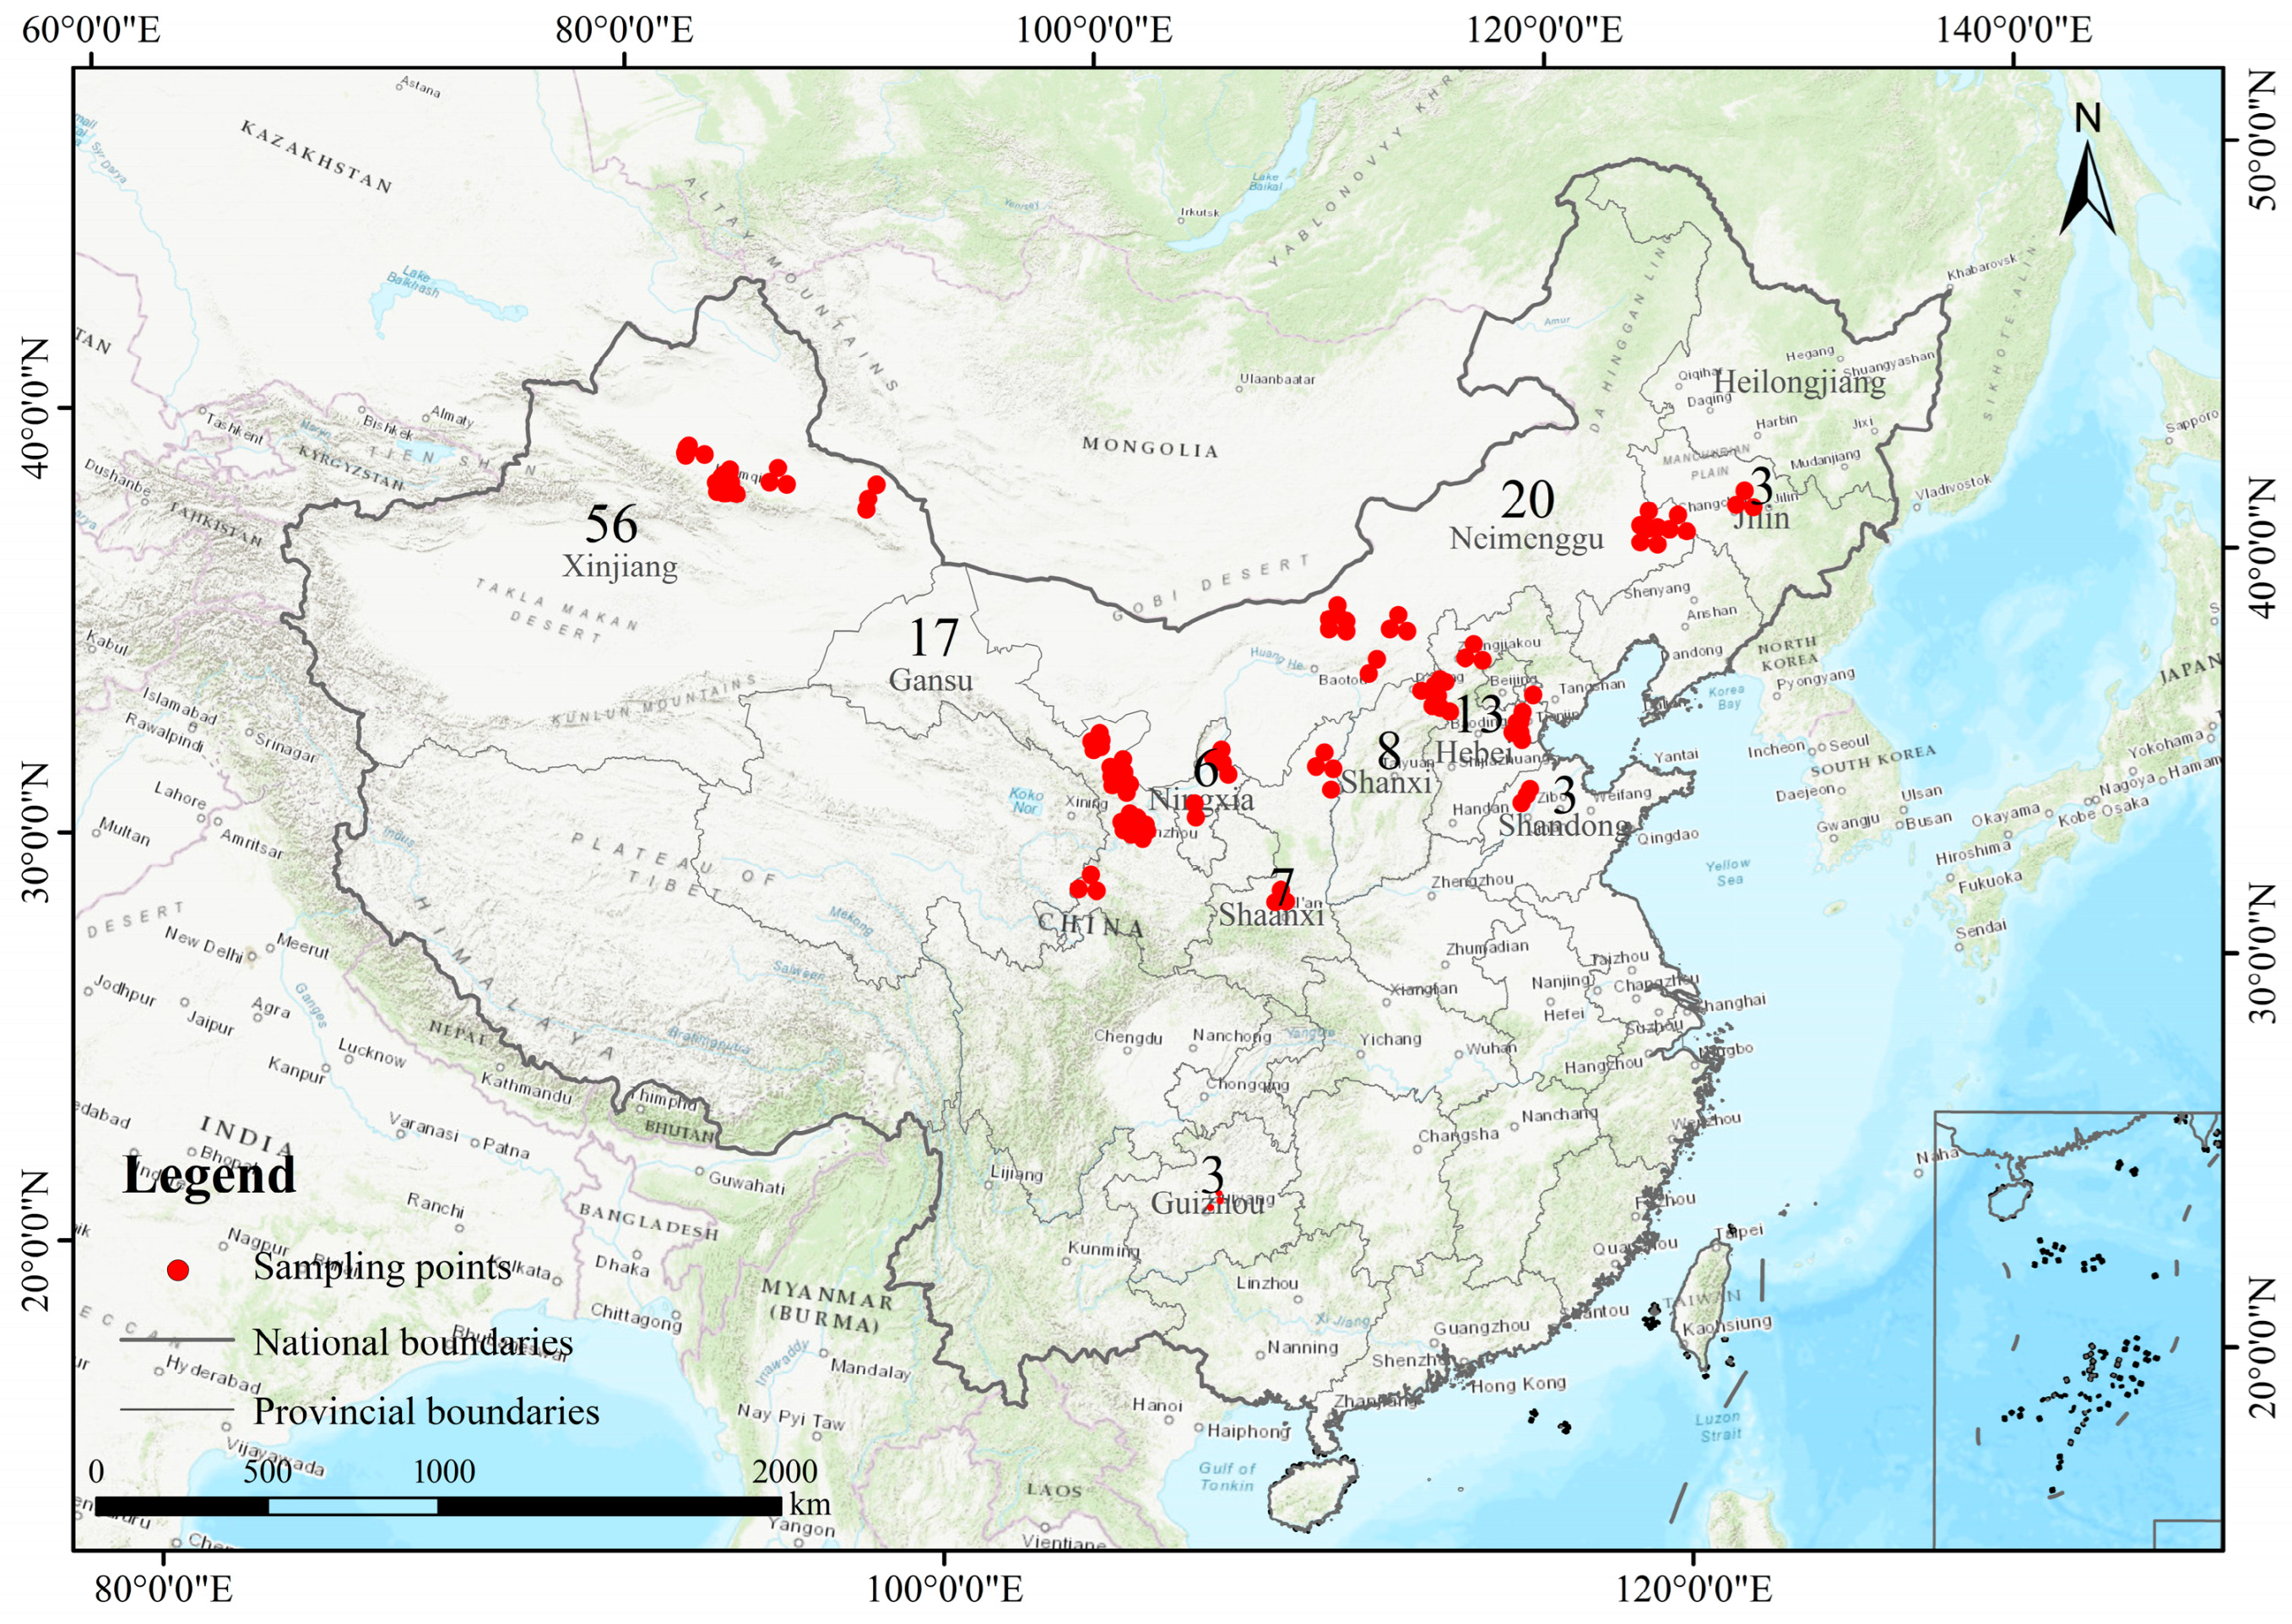
2.1. Data Sources

We searched the Chinese and English databases, such as China Knowledge Network and Web of Science, for published research papers on the effects of phosphorus fertilization on alfalfa yield and quality up to 30 April 2023, both at home and abroad. The keywords of Chinese search were “phosphorus”, “alfalfa”, “yield”, and “quality”, and the keywords of English search were “phosphorus”, “quality”, “yield”, and “quality”. The keywords were “phosphorus”, “alfalfa”, “yield”, and “quality”. In order to reduce the analysis bias, the following criteria were established: (1) the trial area was located in China, and it was a field trial (Figure 1); (2) the trial was set up with both treatments of added phosphorus fertilizer and no added phosphorus fertilizer; (3) one or more indexes of alfalfa yield and quality crude protein (CP) content, acidic, and neutral detergent fiber [NDF] content) were listed in the literature, and the mean and standard deviation of these indexes were provided, or they could be calculated based on the existing data obtained; (4) the type of phosphorus fertilizer, dosage, application method, and soil and meteorological conditions of the study area were clearly described. After screening by the above criteria, 31 studies were finally obtained, including 150 sets of yield data, 52 sets of CP content data, and 30 sets of acidic and NDF content data. The extracted data came from tables, text or graphs in the literature, from which the graph data were extracted using GetData Graph Digitizer software v2.26 (Moscow, Russia, developed by S. Fedorov).

2.2. Data Classification

In order to finely analyze the main factors influencing the effect of phosphorus fertilizer addition on alfalfa yield and quality, the indicators collected in this study were grouped according to the following types, taking into account the amount and distribution of data (Table 1).

2.3. Data Analysis

2.3.1. Calculation of Effect Size

The present study used log response ratios to calculate the effect size lnR [27], which is:
lnR = ln ( X T / X C )
where R is the response ratio, XT is the yield (kg·ha−1) or quality (%) of alfalfa with added phosphorus fertilizer, and Xc is the yield (kg·ha−1) or quality (%) of alfalfa without added phosphorus fertilizer.
The variance (v) of the effect size (lnR) was calculated as [27]:
v = S E 2 / N E X E 2 + S C 2 / N C X C 2
where Sc is the standard deviation of alfalfa yield or quality without the addition of phosphorus fertilizer; Se is the standard deviation of alfalfa yield or quality with the addition of phosphorus fertilizer; Nc is the sample size of alfalfa yield or quality without the addition of phosphorus fertilizer; Ne is the sample size of alfalfa yield or quality with the addition of phosphorus fertilizer.
The weighted effect sizes (lnR*) and their confidence intervals (CI) were calculated [27] as:
w = 1 / ν
lnR = i = 1 K w i ln R i / i = 1 K w i
S ln R * = 1 / i = 1 K w i
95 % CI = ln R * ± 1.96 S ln R *
where K is the number of samples, wi is the weight of the ith sample, lnRi is the effect amount of the ith sample, and S is the standard deviation.
In order to more intuitively reflect the effect of phosphorus fertilizer addition on alfalfa yield and quality, the effect amount was transformed into the rate of increase Ha and the rate of decrease Hb [28].
H a % = exp lnR - 1 × 100
H b % = 1 - exp lnR × 100
where Ha is the rate of increase in alfalfa yield and quality, and Hb is the rate of decrease in alfalfa yield and quality.
If the 95% confidence intervals of Ha (Hb) are all greater than 0, it indicates that phosphorus fertilizer addition has a significant positive effect on improving alfalfa yield and CP content (reducing acidic and NDF content); if the 95% confidence intervals of Ha (Hb) are all less than 0, it indicates that phosphorus fertilizer addition has a significant negative effect on improving alfalfa yield and CP content (reducing acidic and NDF content); and if the 95% confidence intervals of Ha (Hb) 95% confidence interval contains 0, then it indicates that phosphorus fertilizer addition has no significant effect on enhancing alfalfa yield and CP content (reducing acidic and NDF content).

2.3.2. Heterogeneity Test

In order to analyze whether there were statistically significant differences in the results of different studies, this study used heterogeneity analysis. The formula for calculating the Q statistic for the heterogeneity test [29] was:
  Q = i = 1 K Z v i ( ln R i ) 2 ( i = 1 K w i ln R i ) 2 / i = 1 K w i
When PQ (p-value of the test of significance of the Q-statistic) < 0.05, a random effects model was chosen; when PQ ≥ 0.05, a fixed effects model was chosen.
In this study, the effect of external factors such as region, fertilizer application, and time on the experimental results needed to be considered along with heterogeneity, so the random effects model was used to calculate the random effects value, which not only considers the variation of each case, but also the variation between cases, which can reflect the overall benefits more accurately [27].

2.3.3. Analysis of Influencing Factors

Based on the grouping of the indicators in Table 1, meta-analysis was performed separately to find the main reasons for the differences in the results of the different studies.

2.3.4. Data Processing

Data were analyzed using R (v.4.10) programming software and plotted using Origin2021 software at a significance level of p < 0.05.

3. Results and Analysis

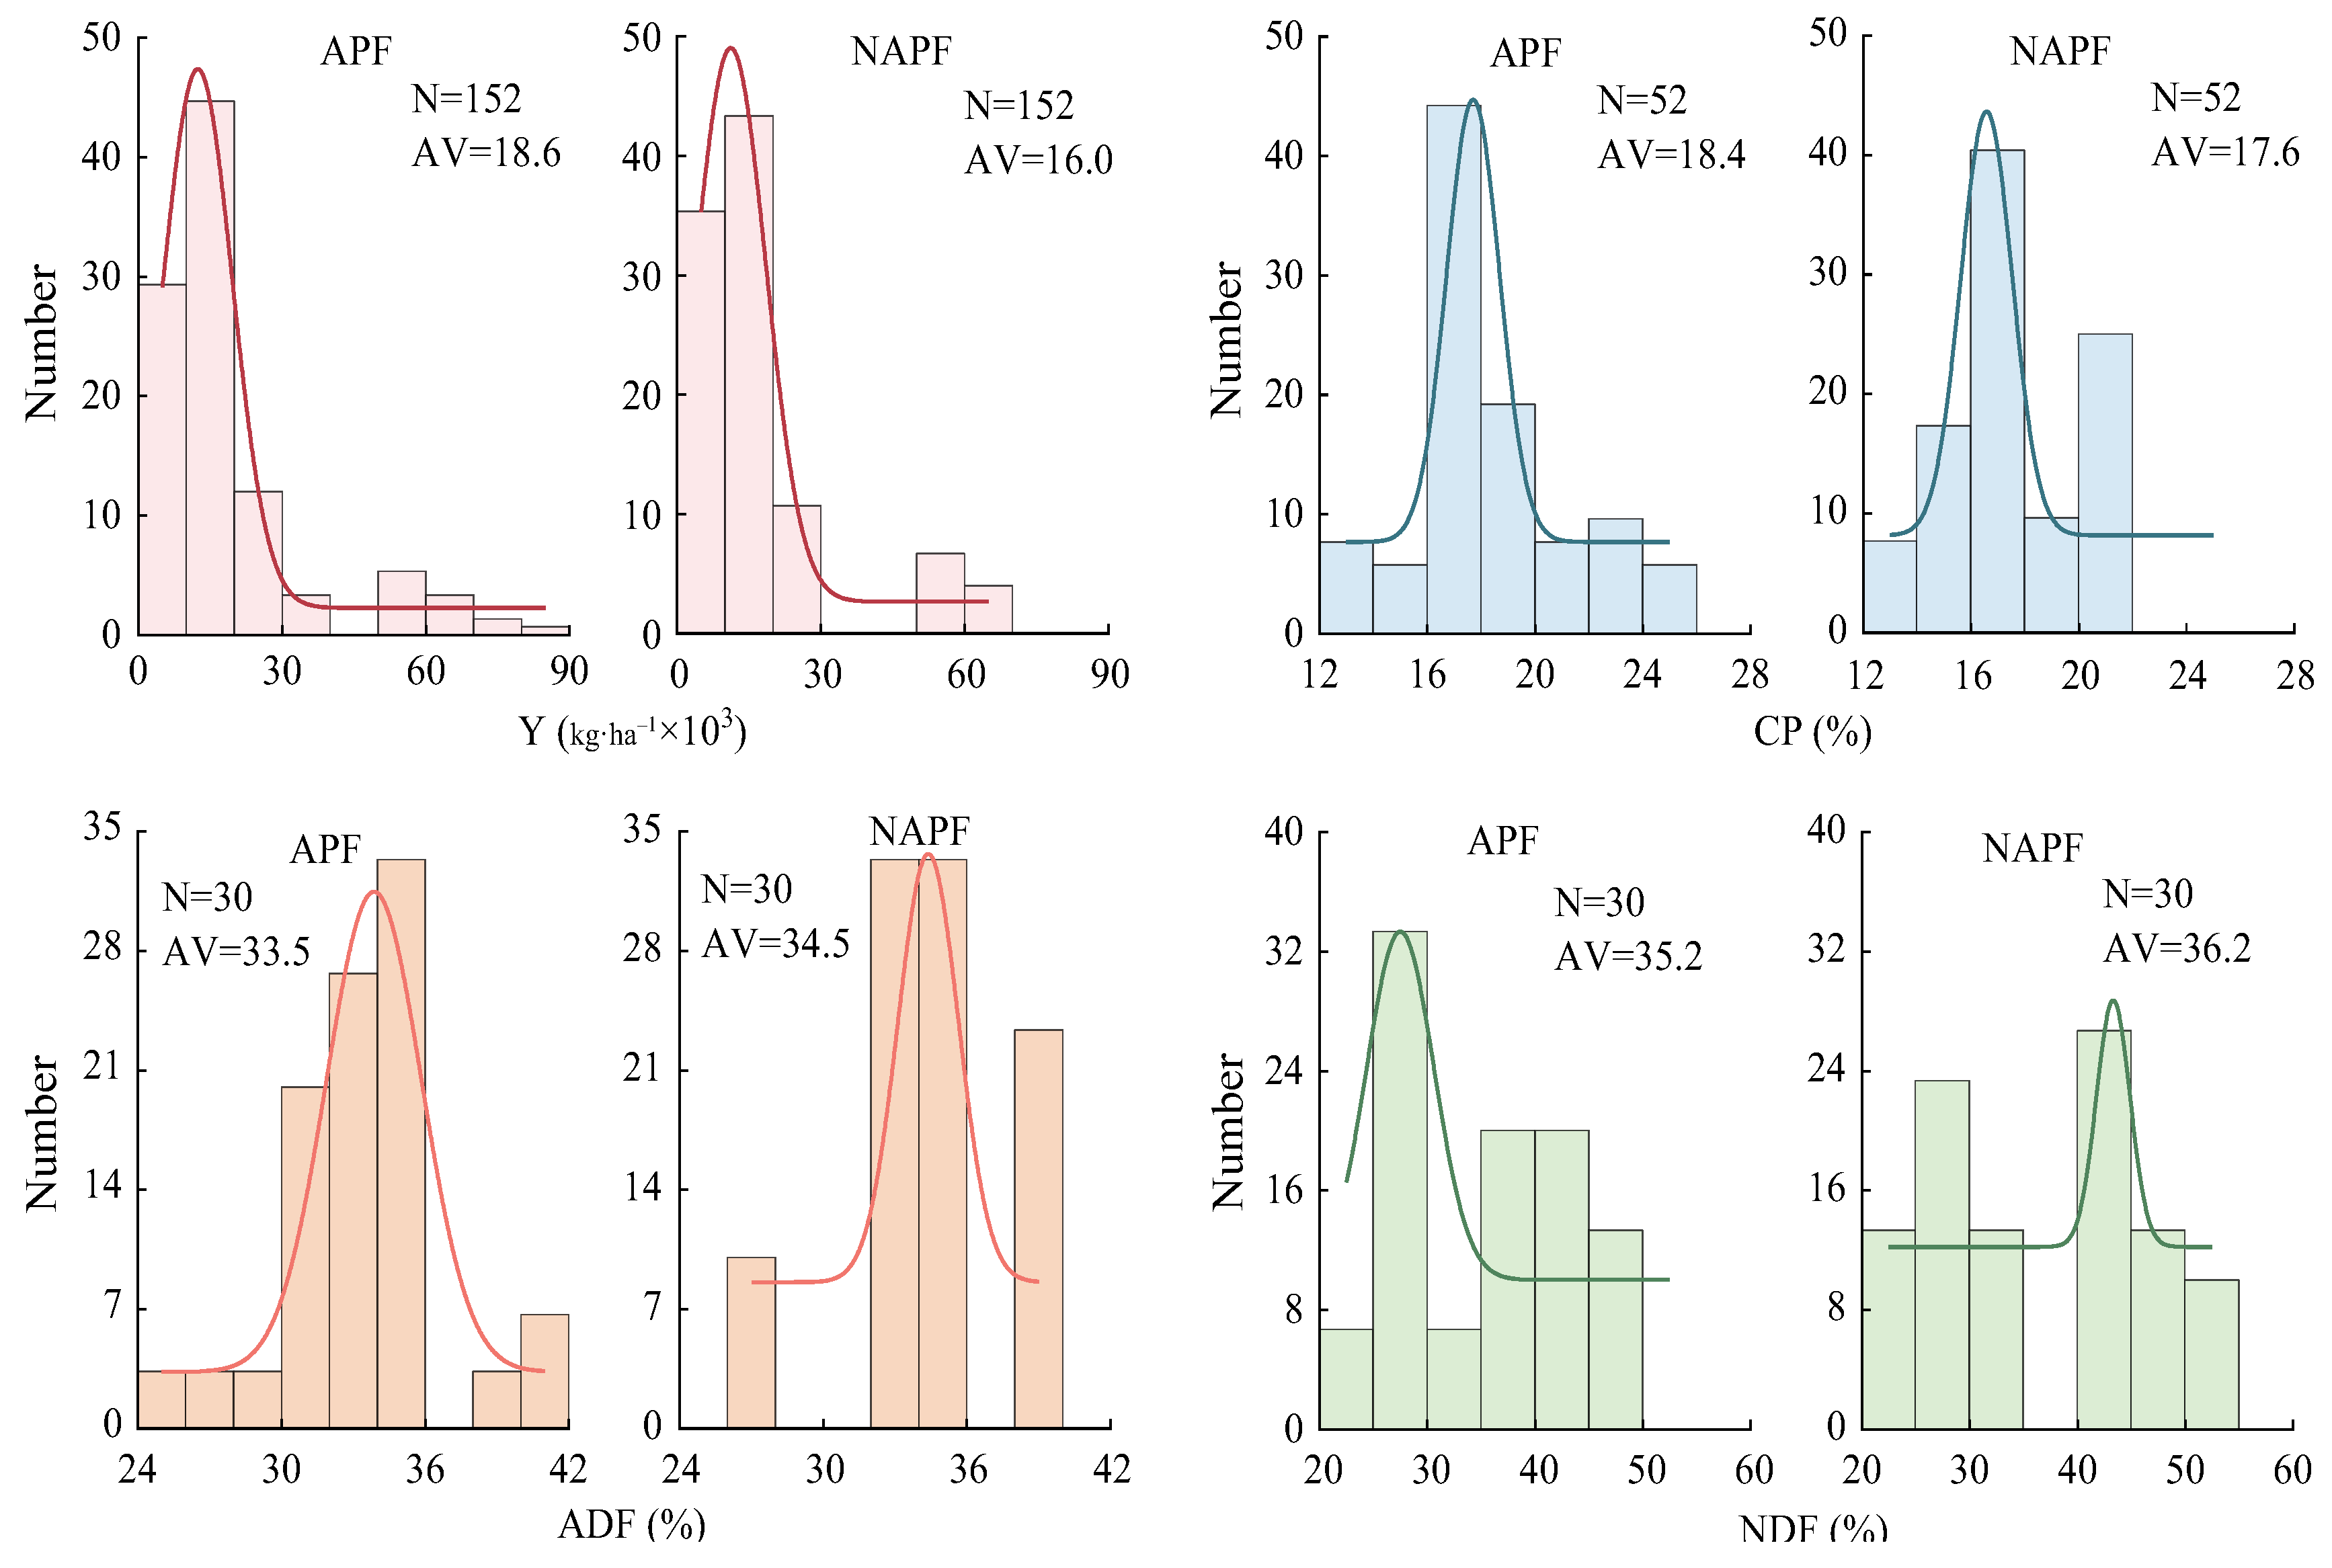
3.1. Data Distribution and Overview

Significant differences were observed in alfalfa yield and quality between phosphorus fertilization and no phosphorus fertilization treatments (Figure 2). Specifically, the yield, CP content, acid detergent fiber (ADF) content, and NDF content of alfalfa with phosphorus fertilization ranged from 1.7 × 10³ to 8.4 × 10⁴ kg·ha−1 (mean 1.9 × 10⁴ kg·ha−1), 12.7% to 25.3% (mean 18.4%), 24.4% to 41.4% (mean 33.5%), and 22.8% to 49.7% (mean 36.1%), respectively. In contrast, for alfalfa without phosphorus fertilization, these values were 1.4 × 10³ to 6.8 × 10⁴ kg·ha−1 (mean 1.6 × 10⁴ kg·ha−1), 12.4% to 21.1% (mean 17.6%), 27.9% to 38.8% (mean 34.5%), and 23.2% to 50.6% (mean 37.1%), respectively. These results demonstrate that phosphorus fertilization improved alfalfa yield and overall quality compared to treatments without phosphorus fertilization.

3.2. Comprehensive Effects of Phosphorus Fertilization on Alfalfa Yield and Quality

The heterogeneity test results for phosphorus fertilization effects on alfalfa yield and quality showed PQ < 0.05, thus a random effects model was applied (Table 2). Compared to treatments without phosphorus fertilization, the addition of phosphorus fertilization significantly increased alfalfa yield and CP content by 19.0% (CI: 15.5–22.6%) and 7.2% (CI: 0.1–14.9%), respectively. The ADF content was significantly reduced by 3.3% (CI: 0.8–3.3%), while the NDF content significantly increased by 7.2% (CI: 0.1–14.9%).

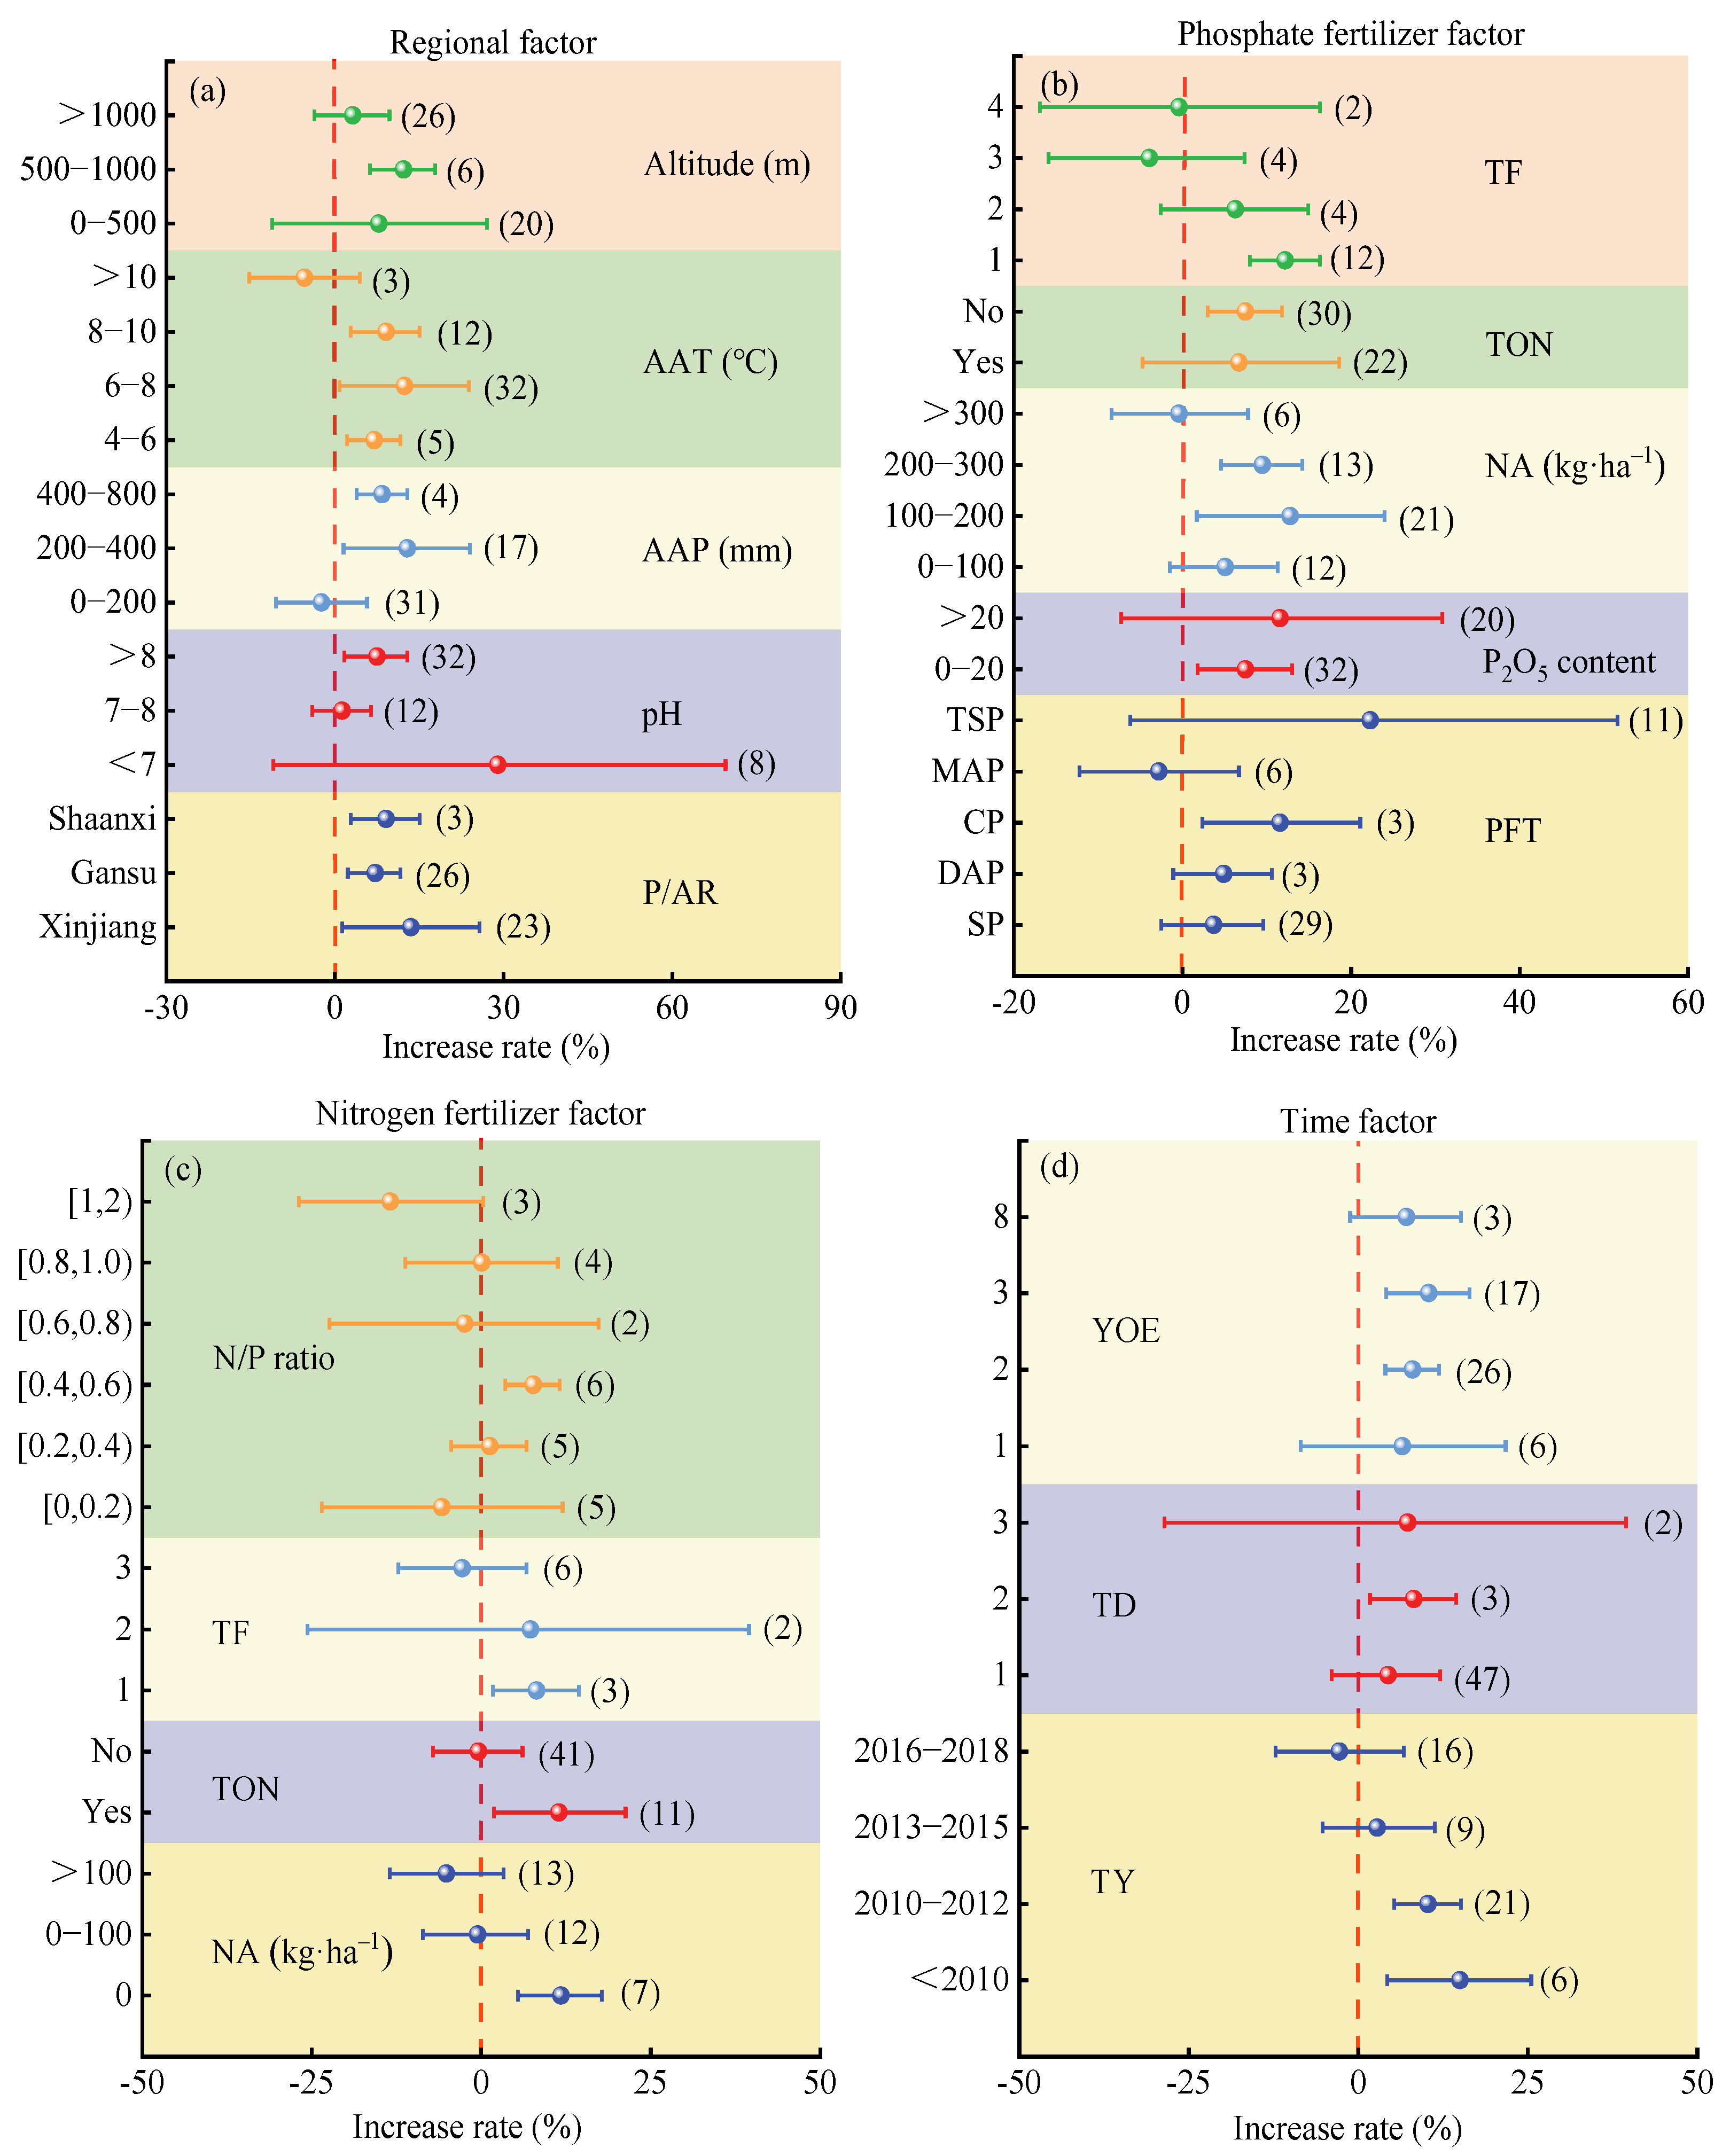
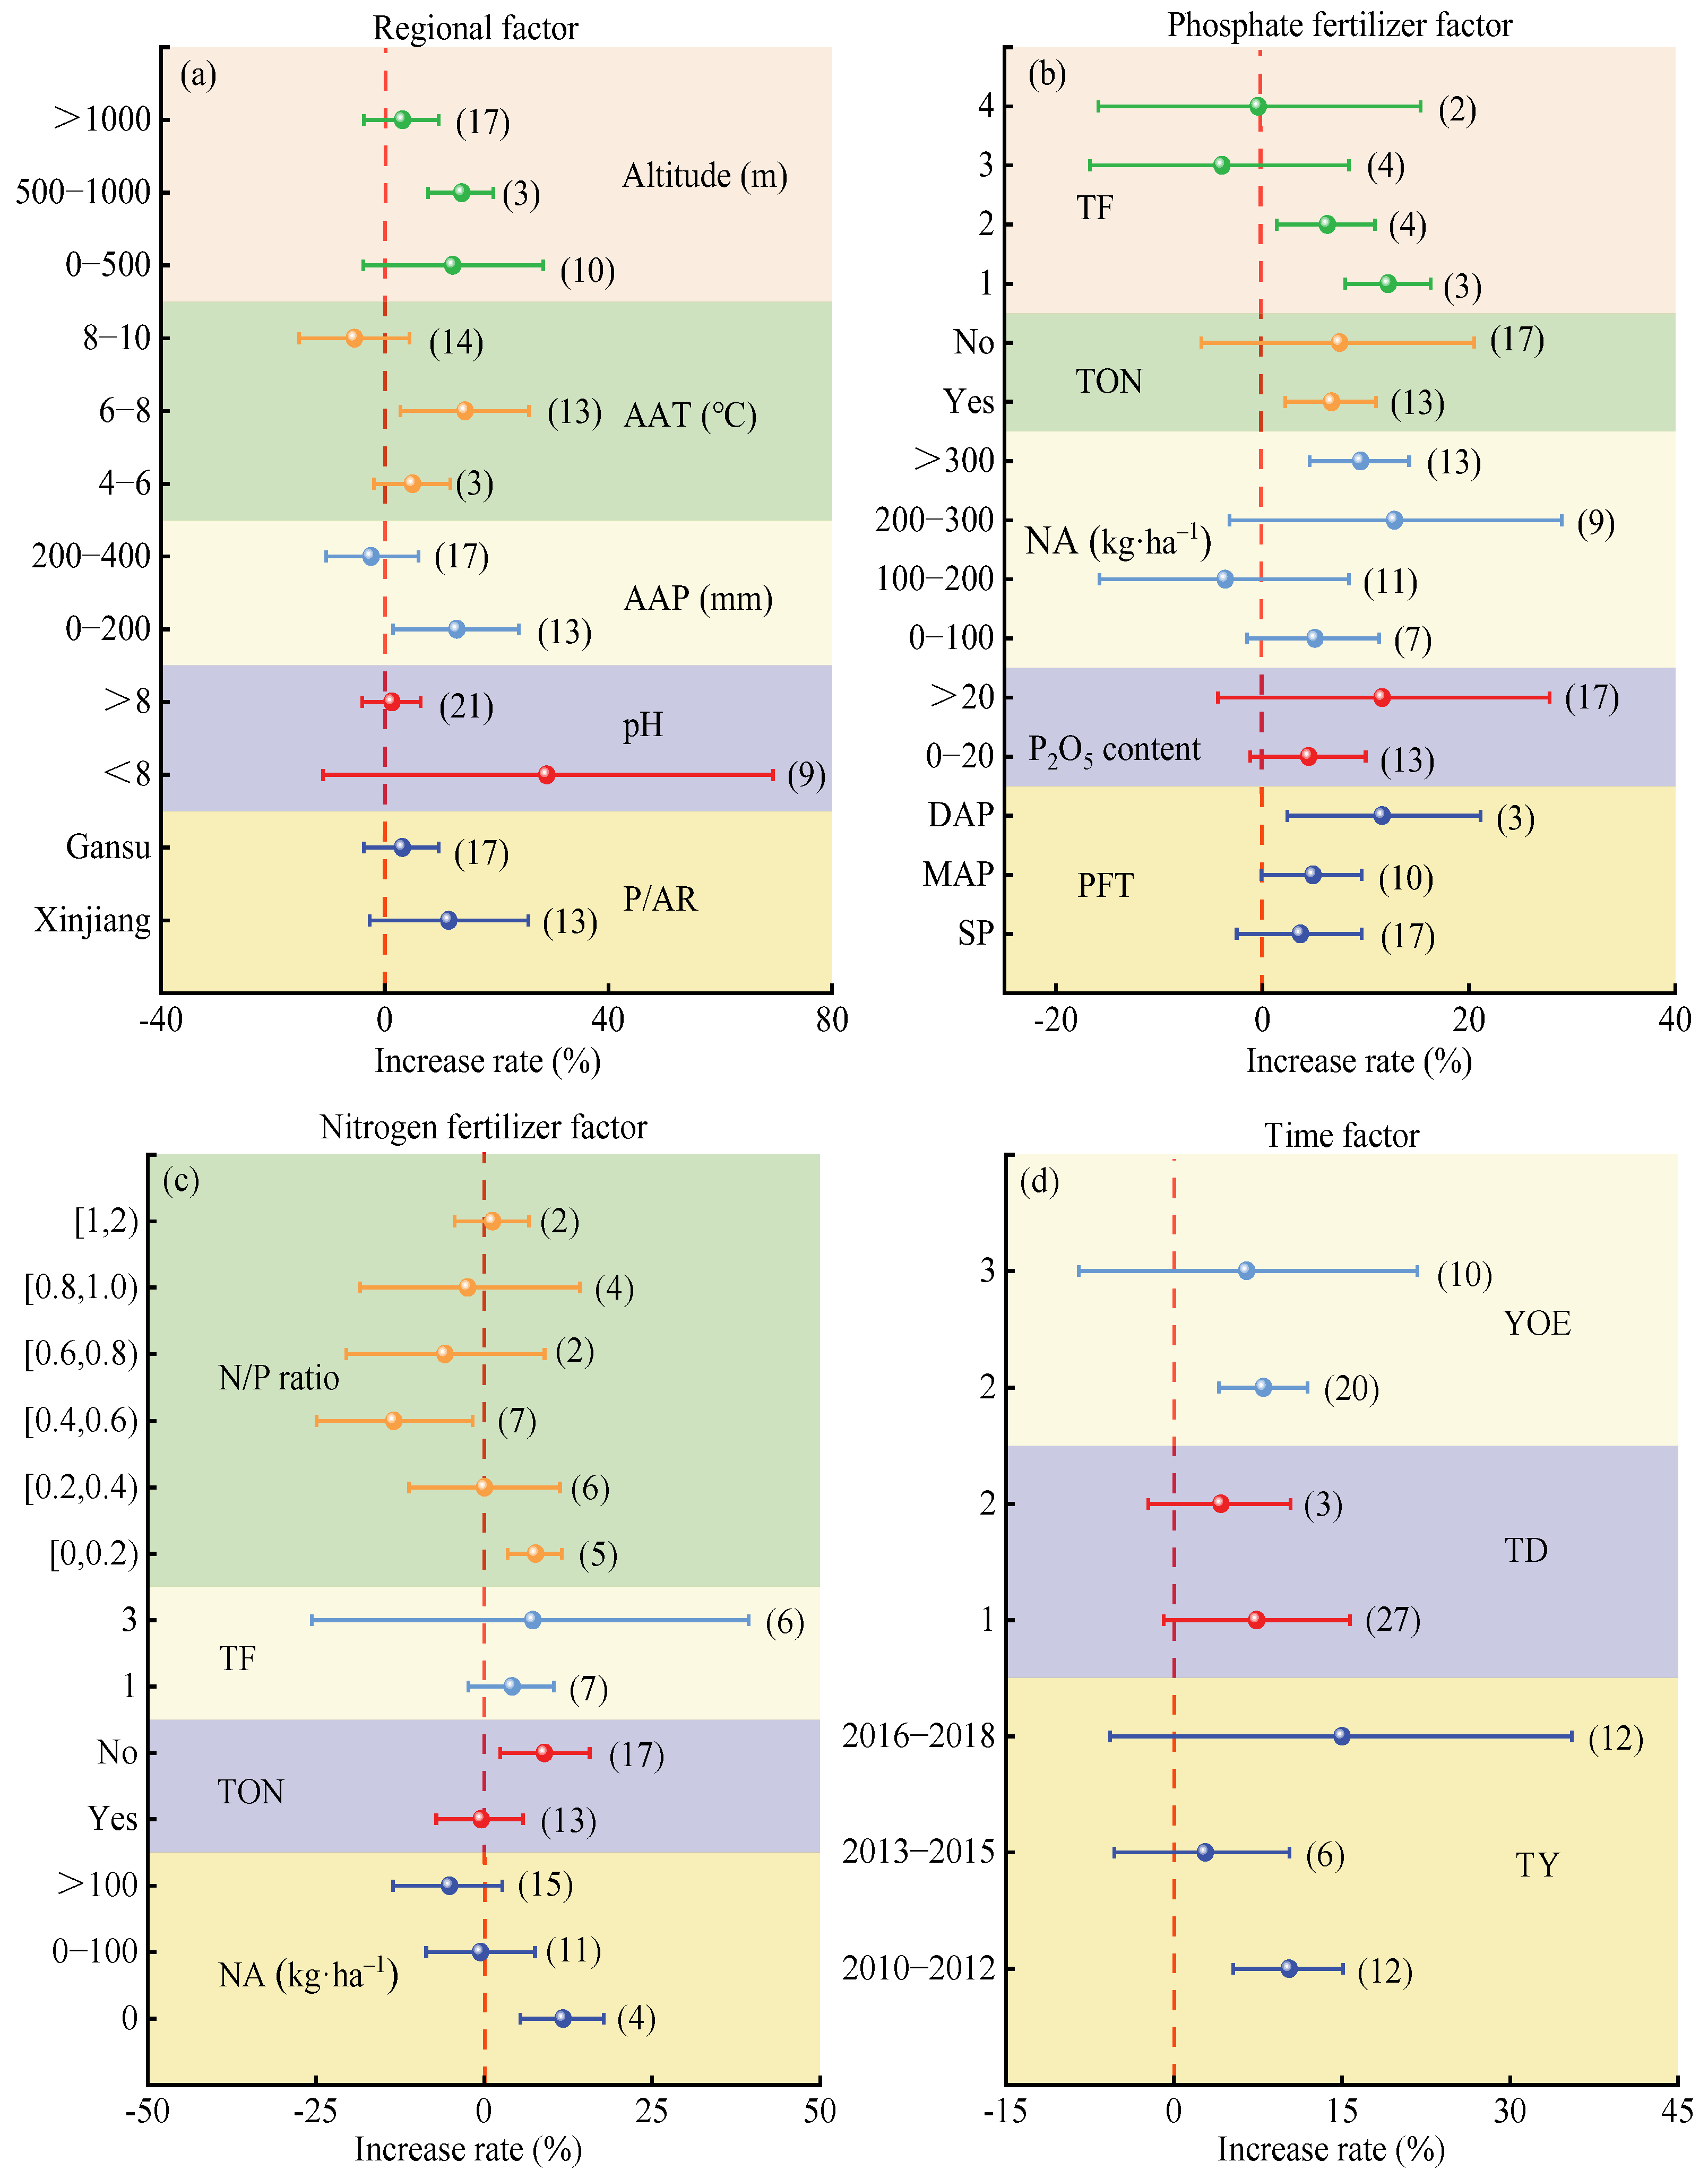
3.3. Analysis of Factors Influencing Alfalfa Yield with Phosphorus Fertilization

3.3.1. Regional Factors

The yield-increasing effect of phosphorus fertilization on alfalfa was highest in Shandong (average 57.2%, CI: 47.1–67.9%, Figure 3a), but showed no significant difference when compared to that in Jilin (average 39.1%) and Hebei (average 37.7%). Guizhou (average 23.6%), Gansu (average 18.3%), Xinjiang (average 17.6%), Shanxi (average 10.3%), Shaanxi (average 12.9%), and Inner Mongolia (average 13.6%) showed comparatively lower effects. The yield-increasing effect was not significant in Ningxia (average 7.4%). As soil pH, annual precipitation, and altitude increased, the yield-increasing effect of phosphorus fertilization followed a trend of increasing and then decreasing. The highest effect was observed under the conditions of soil pH 7–8 (average 25.0%, CI: 36.0–14.9%), annual precipitation of 200–400 mm (average 24.3%, CI: 17.4–31.6%), and altitude of 500–1000 m (average 24.3%, CI: 28.9–19.8%). However, there were no significant differences compared to other conditions. As the average annual temperature increased, the yield-increasing effect of phosphorus fertilization on alfalfa showed a decreasing-then-increasing trend. When the average annual temperature exceeded 4 °C, the average yield increases gradually increased (from 14.6% to 22.1%).

3.3.2. Phosphorus Application Factors

The yield improvement effect was largest when calcium phosphate (average 25.6%, CI: 20.5–30.9%, Figure 3b) and superphosphate (average 23.9%, CI: 18.7–29.3%) were applied, with no significant difference between them. The effect was smaller with ammonium phosphate (average 7.4%) and triple superphosphate (average 14.5%), while it was not significant when diammonium phosphate was applied. The yield increase rate decreased as the P2O5 content increased. The maximum yield increase rate (average 22.4%, CI: 17.5–27.6%) occurred when P2O5 content was 0–20%. The yield increase rate showed a trend of increasing and then decreasing as the phosphorus fertilizer application rate increased. The highest yield increase rate (average 23.5%, CI: 17.6–29.6%) was observed with an application rate of 100–200 kg·ha−1. Alfalfa crops with no topdressing phosphorus fertilizer showed a significantly higher yield improvement (average 21.5%, CI: 17.0–26.1%) than those with topdressing phosphorus fertilizer (average 13.2%, CI: 8.7–17.9%). When topdressing phosphorus fertilizer was applied, the yield increase was highest after a single topdressing (average 20.9%, CI: 14.6–20.5%), and no significant effect was observed after more than one topdressing.

3.3.3. Nitrogen Application Factors

The yield increase rate showed a decreasing-then-increasing trend as the nitrogen fertilizer application rate increased. At nitrogen application rates of 0 kg·ha−1 (Figure 3c) and >100 kg·ha−1, the average yield increase rates were 27.6% and 15.2%, respectively. The average yield increase with topdressing nitrogen fertilizer (average 19.7%, CI: 15.8–23.7%) was higher than that without topdressing nitrogen fertilizer (average 15.2%, CI: 8.1–22.8%), but the difference was not significant. When nitrogen fertilizer was top-dressed, the yield increase after one topdressing was 19.2% (CI: 8.8–30.5%), while after two or three topdressings, the yield increase effect was not significant. The yield increase rate showed a trend of increasing and then decreasing as the nitrogen-to-phosphorus ratio increased. The highest yield increase rate (30.1%, CI: 6.9–58.3%) was observed when the nitrogen-to-phosphorus ratio was 0.6–0.8.

3.3.4. Time Factors

The yield-increasing effect of phosphorus fertilization on alfalfa followed a decreasing-then-increasing trend over the years. After 2016 (Figure 3d), the yield increase rate gradually increased (on average). The yield-increasing effect also followed a trend of increasing and then decreasing as the experiment duration and planting years increased. The highest yield increase rate occurred when both the experiment duration and planting years reached two years, with an average increase of 30.9% (CI: 14.6–49.5%) and 22.2% (CI: 16.1–28.5%), respectively.

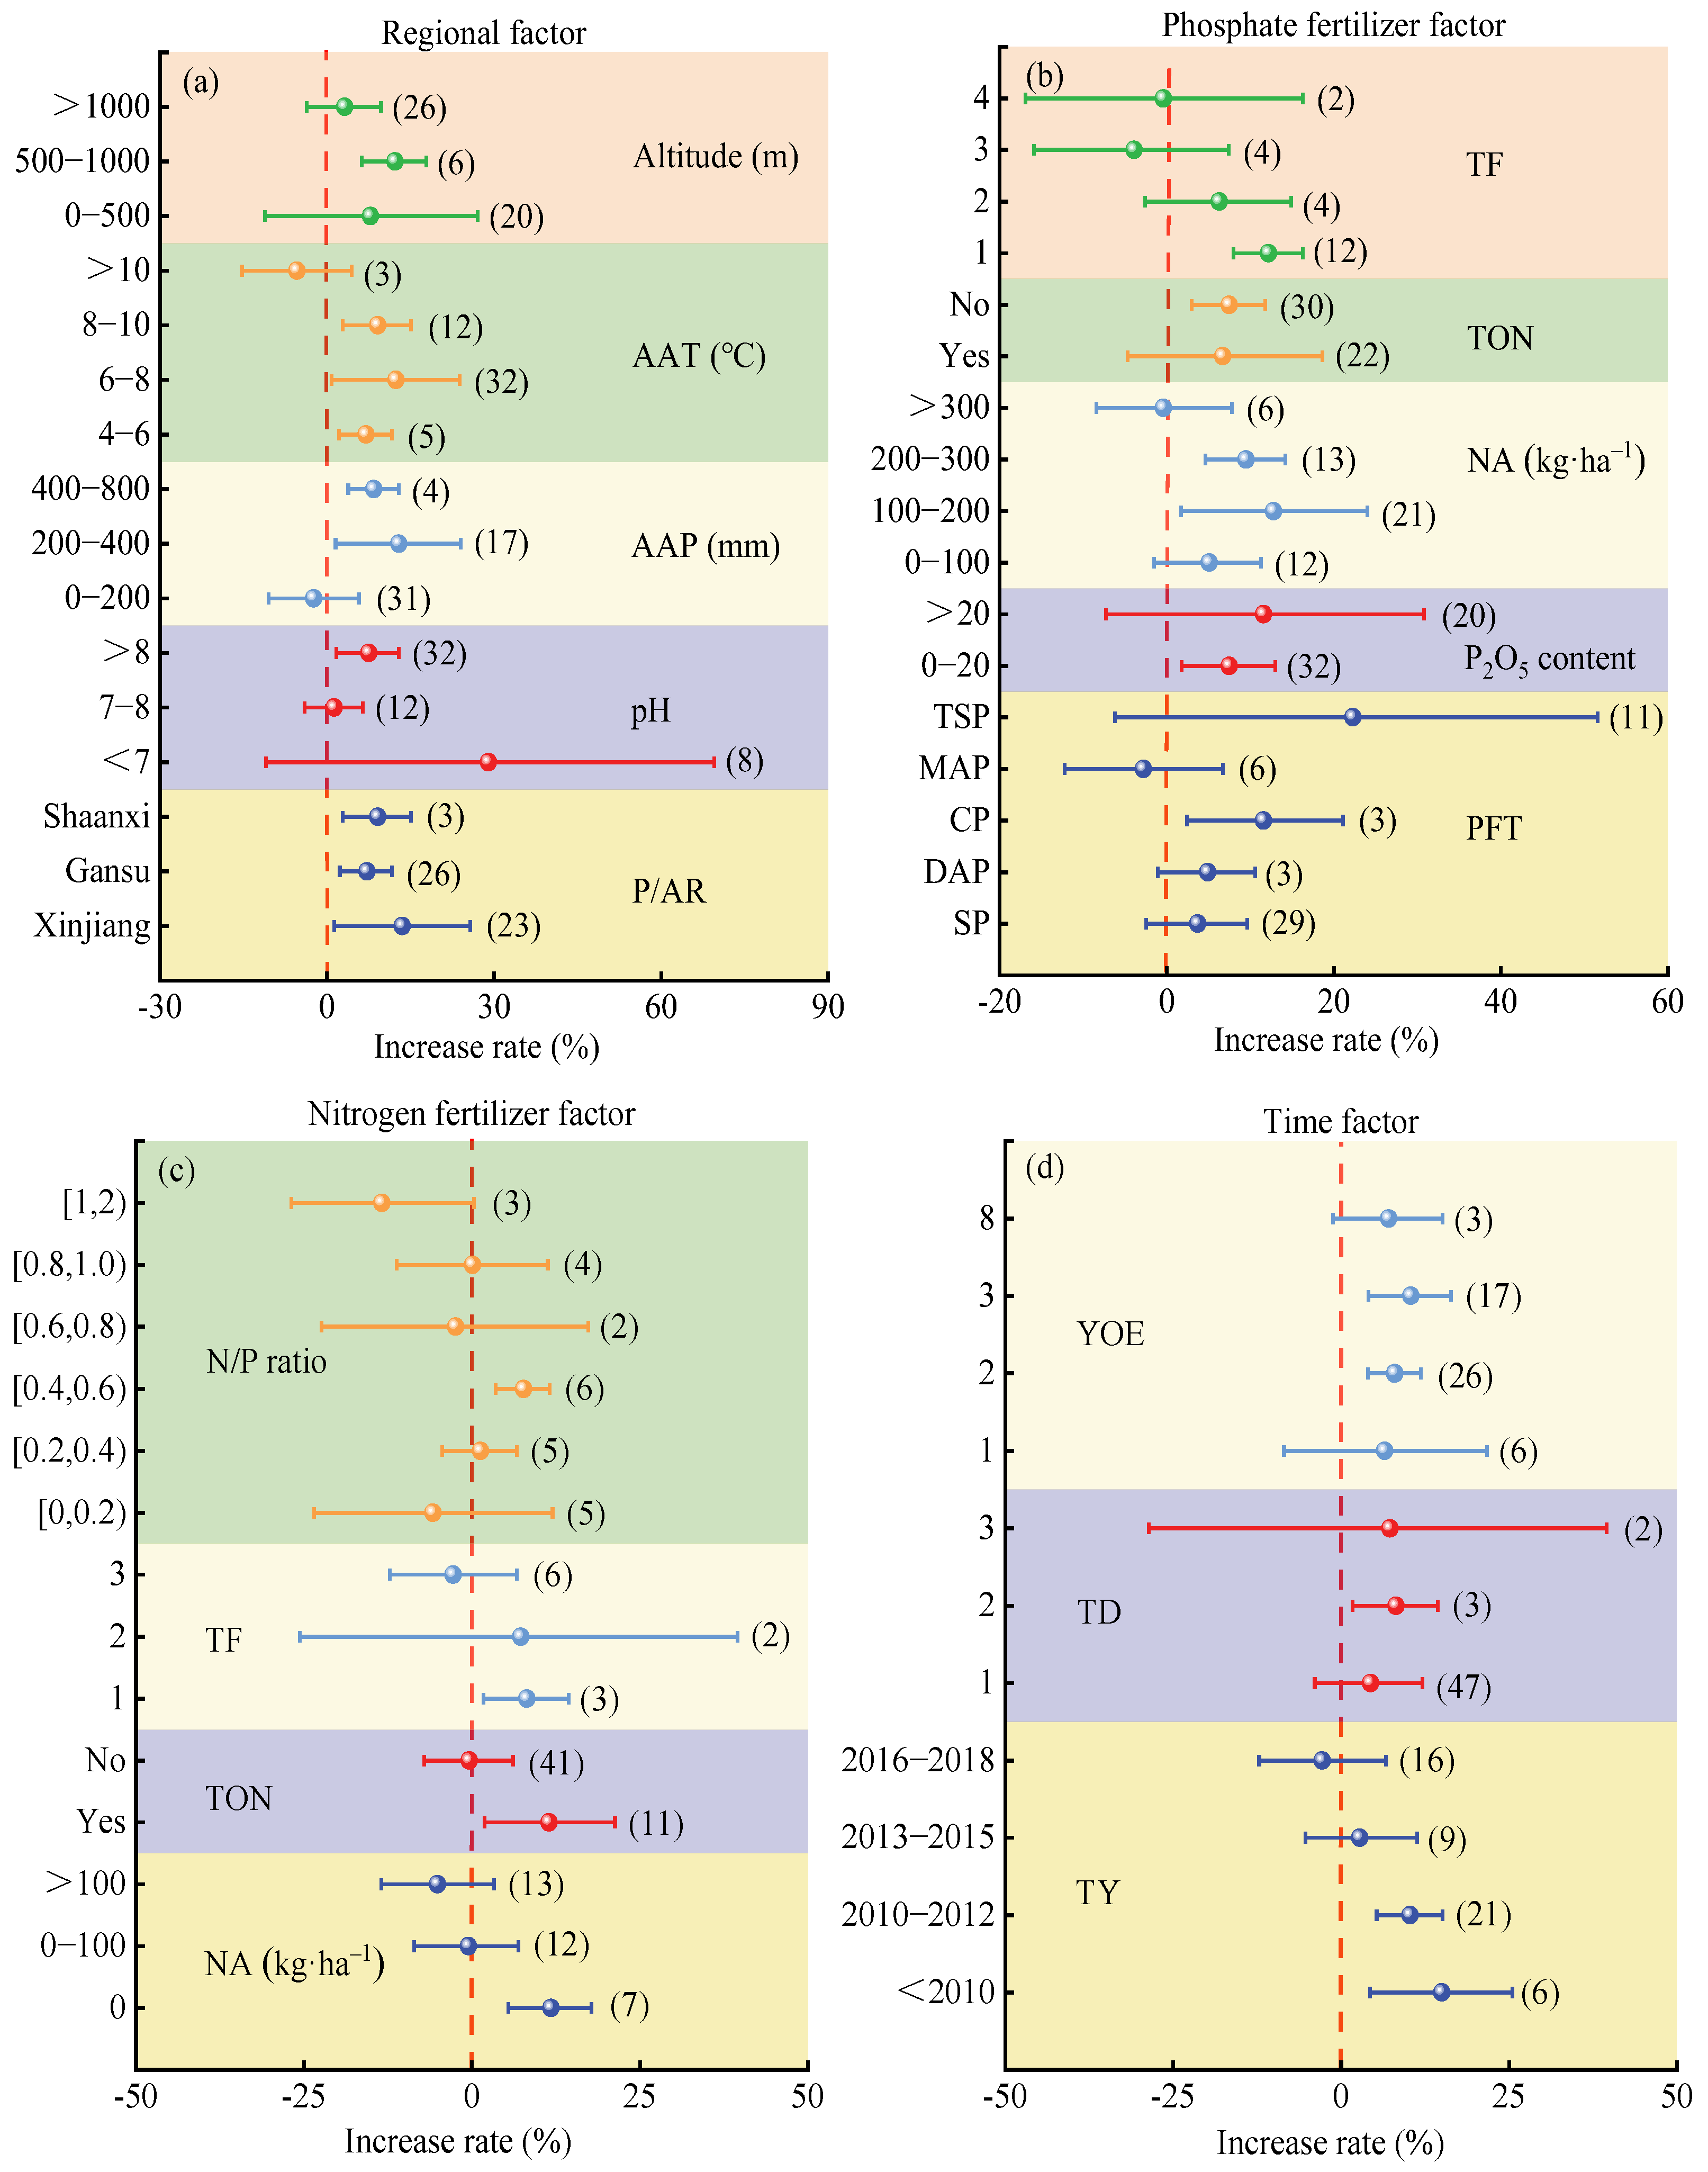
3.4. Analysis of Factors Affecting the Quality of Alfalfa by Phosphorus Fertilizer Addition

3.4.1. Crude Protein Content

(1)
Regional Factors
The increase in CP content in alfalfa due to phosphorus addition was highest in Xinjiang (average 11.5%, 95% CI 2.7% to 22.7%, Figure 4a), but there was no significant difference compared to Gansu (average 3.2%, 95% CI 3.3% to 10.1%) and Shaanxi (average 9.1%, 95% CI 3.1% to 15.4%). In soils with pH greater than 8 and altitudes between 500 and 1000 m, phosphorus addition significantly increased CP content by 4.5% (95% CI 0.9% to 10.3%) and 7.8% (95% CI 2.2% to 13.8%), respectively. Under other conditions, the increase was not significant. When the average annual precipitation was greater than 200 mm, the CP content in alfalfa increased significantly by 8.4% to 12.9%; however, when the average annual precipitation was less than 200 mm, the increase effect was not significant. As the average annual temperature increased, the CP content increase rate first rose and then declined, with the highest increase rate (average 12.4%, 95% CI 2.0% to 24.0%) observed at 6–8 °C. However, no significant difference was found between 4–6 °C and 8–10 °C.
(2)
Phosphorus Application Factors
When calcium phosphate was applied, the CP content in alfalfa increased significantly by 22.3% on average (95% CI −7.0% to 60.8%, Figure 4b), but the increase effect was not significant when other types of phosphorus fertilizers were applied. When the phosphorus fertilizer’s P2O5 content was between 0% and 20%, the CP content in alfalfa increased significantly by 4.5% on average (95% CI 1.0% to 8.2%). However, when the P2O5 content was greater than 20%, the increase effect was not significant. The increase rate in CP content of alfalfa followed a trend of first increasing and then decreasing with the application amount of phosphorus fertilizer. The maximum increase rate occurred when the application amount was 100–200 kg·ha−1 (average 12.8%, 95% CI 3.4% to 24.9%), but there was no significant difference compared to 200–300 kg·ha−1 (average 9.5%, 95% CI 4.8% to 14.4%). For alfalfa without topdressing phosphorus fertilizer, the average increase rate in CP content was 7.5% (95% CI 2.4% to 11.2%), and no significant increase was observed with topdressing phosphorus fertilizer. When phosphorus fertilizer was top-dressed once, the CP content in alfalfa significantly increased (average 12.2%, 95% CI 8.1% to 16.4%), but no significant effect was observed after 2–4 applications of topdressing.
(3)
Nitrogen Application Factors
When no nitrogen fertilizer was applied, the CP content in alfalfa increased significantly, by 11.8% on average (95% CI 5.8% to 18.2%, Figure 4c), but the increase effect was not significant when nitrogen fertilizer was applied. When nitrogen fertilizer was applied, topdressing nitrogen fertilizer resulted in a significant increase in CP content by 9.0% on average (95% CI 0.2% to 18.6%), while no significant increase was observed without topdressing nitrogen fertilizer. When nitrogen fertilizer was top-dressed, applying it once resulted in a significant increase in CP content, of 9.2% on average (95% CI 2.0% to 14.7%), but no significant effect was observed with 2–3 topdressings.
The increase rate in CP content of alfalfa followed a trend of first increasing and then decreasing as the nitrogen-to-phosphorus ratio increased. The nitrogen-to-phosphorus ratio of 0.4–0.6 resulted in a significant increase of 11.7% on average (95% CI 5.6% to 18.1%).
(4)
Time Factors
The increase rate in CP content of alfalfa with phosphorus application showed a decreasing trend over the experimental years, with the average increase rate ranging from 10.3% to 15.0% before 2012 (Figure 4d). As the experiment duration and establishment years increased, the increase rate in CP content of alfalfa followed a trend of first increasing and then decreasing. When the experiment duration was 2 years and the establishment years were 2–3 years, the average increase rates were 6.2% (95% CI 2.0% to 10.2%) and 6.5% to 7.4% (95% CI 1.4% to 13.7%), respectively.

3.4.2. Acid Detergent Fiber (ADF) Content

(1)
Regional Factors
The addition of phosphorus fertilizer significantly decreased the ADF content in alfalfa by 6.0% on average (CI 3.1% to 8.8%, Figure 5a) in Xinjiang, while no significant reduction effect was observed in Gansu. When the soil pH was less than 8 and greater than 8, the ADF content of alfalfa decreased by 4.5% (CI 0.1% to 8.7%) and 2.7% (CI −0.3% to 5.7%), respectively. When the average annual precipitation was between 0 to 200 mm and 200 to 400 mm, the ADF content decreased by 5.1% (CI 2.3% to 7.9%) and 1.9% (CI −1.3% to 5.5%), respectively, with the latter not showing a significant decrease. The effect of phosphorus addition on the reduction of ADF content followed a trend of increasing and then decreasing with increasing average annual temperature. The highest reduction rate (6.0%, CI 3.1–8.8%) occurred at an average temperature of 6–8 °C. The reduction in ADF content followed a trend of first decreasing and then increasing with increasing altitude, with the highest reduction rate (7.3%, CI 5.3% to 9.3%) occurring at an altitude of 0 to 500 m.
(2)
Phosphorus Application Factors
The ADF (ADF) content of alfalfa significantly decreased by 7.3% on average (CI 5.3% to 9.3%, Figure 5b) when ammonium dihydrogen phosphate was applied, while no significant reduction effect was observed when single superphosphate and diammonium phosphate were applied. When the P2O5 content in the phosphorus fertilizer was greater than 20% and less than 20%, the ADF content of alfalfa decreased by 5.1% (CI 2.3% to 7.9%) and 1.9% (CI −1.9% to 5.5%) on average, respectively, with the latter not showing a significant reduction. As the phosphorus application rate increased, the ADF content reduction rate showed a trend of first increasing and then decreasing. When the phosphorus application rate was between 100 and 300 kg·ha−1, the average reduction rate was 4.4% to 5.4%. Without topdressing phosphorus fertilizer, the ADF content of alfalfa decreased by 6.0% on average (CI 3.1% to 8.8%), while no significant reduction effect was observed with topdressing phosphorus fertilizer. When topdressing phosphorus fertilizer, the ADF content of alfalfa decreased by 8.0% (CI 5.0% to 10.9%) when applied twice and by 1.2% (CI −13.8% to 14.3%) when applied once.
(3)
Nitrogen Application Factors
When nitrogen fertilizer was applied and when it was not, the ADF (ADF) content of alfalfa decreased by 2.1% to 2.3% on average, which was not significant, and decreased significantly by 10.7% when no nitrogen fertilizer was applied (Figure 5c). When nitrogen fertilizer was applied, the ADF content of alfalfa decreased significantly by 6.0% on average (CI 3.1% to 8.8%) with topdressing, while no significant reduction effect was observed without topdressing nitrogen fertilizer. When topdressing nitrogen fertilizer, the ADF content of alfalfa decreased significantly by 0.1% to 9.8% with one application and by 3.0% to 9.5% with three applications. The reduction effect on ADF content showed a trend of first decreasing and then increasing as the nitrogen–phosphorus ratio increased, but the reduction effects were not significant.
(4)
Time Factors
The reduction effect of phosphorus addition on the ADF (ADF) content of alfalfa showed a trend of first decreasing and then increasing with the experimental years. The highest reduction rate was observed during 2016–2018, with an average of 7.1% (CI 5.3% to 8.8%, Figure 5d). When the experimental duration was 1 year and the establishment duration was 3 years, the ADF content of alfalfa significantly decreased by 3.5% (CI 1.1% to 5.9%) and 7.3% (CI 5.3% to 9.3%) on average, respectively. The reduction effects for other experimental and establishment durations were not significant.

3.4.3. Neutral Detergent Fiber (NDF) Content

(1)
Regional Factors
The NDF content of alfalfa with phosphorus addition showed no significant reduction in Gansu (−10.1% to 3.3%) and Xinjiang (−27.7% to 2.7%) (Figure 6a). When the soil pH was greater than 8 and less than 8, the NDF content decreased insignificantly by −6.6% to 3.8% and −88.0% to 11.5%, respectively. When the average annual precipitation was between 0 and 200 mm and between 200 and 400 mm, the NDF content of alfalfa significantly decreased by −25.3% to −1.8% and decreased insignificantly by −5.7% to 9.9%, respectively. With increasing average annual temperature and altitude, the reduction effect of phosphorus addition on NDF content first decreased and then increased. However, the effects were either insignificant or significantly reduced.
(2)
Phosphorus Application Factors
When single superphosphate, mono-ammonium phosphate, and diammonium phosphate were applied, the NDF content of alfalfa decreased insignificantly by −9.9% to 2.2%, −9.9% to −0.2%, and increased significantly by −20.8% to −3.1%, respectively (Figure 6b).When the P2O5 content in the phosphorus fertilizer was greater than 20% and less than 20%, the average NDF content of alfalfa decreased insignificantly by −11.6% (CI −20.8% to −3.1%) and by −4.5% (CI −10.2% to 1.0%), respectively. As the phosphorus application rate increased, the reduction rate of NDF content showed a trend of first increasing and then decreasing. The average reduction rate was 3.6% (CI −8.6% to 12.2%) when the phosphorus application rate was 100 to 200 kg·ha−1. The NDF content of alfalfa without topdressing phosphorus fertilizer decreased insignificantly by −20.9% to 4.4%, while topdressing phosphorus fertilizer significantly increased the NDF content by 2.4% to 11.2%. When phosphorus fertilizer was top-dressed, the reduction effect on NDF content of alfalfa showed a trend of first increasing and then decreasing as the number of topdressings increased. However, the effects were either insignificant or significantly reduced.
(3)
Nitrogen Application Factors
The reduction effect of phosphorus addition on the NDF content of alfalfa increased with increasing nitrogen application rates (Figure 6c), and the highest average reduction rate was observed when the nitrogen application rate exceeded 100 kg·ha−1. When nitrogen fertilizer was applied, the NDF content of alfalfa with topdressing nitrogen fertilizer decreased insignificantly by −6.3% to 6.6%, while the NDF content of alfalfa without topdressing nitrogen fertilizer increased significantly by 2.3% to 18.6%. When nitrogen fertilizer was top-dressed, the NDF content of alfalfa decreased insignificantly by −10.7% to 2.0% with one topdressing and by −53.2% to 24.8% with three topdressings. The reduction effect on NDF content showed a trend of first increasing and then decreasing as the nitrogen-to-phosphorus ratio increased. The highest reduction effect (average 13.4%, CI −0.1% to 25.1%) was observed at a nitrogen-to-phosphorus ratio of 0.4 to 0.6, but the effects were not significant.
(4)
Time Factors
The reduction effect of phosphorus addition on the NDF content of alfalfa showed a trend of first increasing and then decreasing with experimental years. The highest reduction effect was observed during 2013–2015, with an insignificant decrease of −10.9% to 4.7% (Figure 6d). When the experimental duration was 1 year and 2 years, the NDF content of alfalfa with phosphorus addition decreased insignificantly by −15.7% to −0.3% and by −10.7% to 2.0%, respectively. When the establishment duration was 2 years and 3 years, the NDF content of alfalfa with phosphorus addition significantly decreased by −12.0% to −41% and decreased insignificantly by −21.5% to 6.7%, respectively.

4. Discussion

4.1. Effect of Regional Factors on Yield and Quality of Phosphorus-Applied Alfalfa

Improvement of alfalfa yield and quality by appropriate addition of phosphorus fertilizer has significant economic and ecological synergistic benefits for sustainable development of agroecosystems [25]. However, due to the heterogeneity of soil physicochemical properties (e.g., pH) and climatic factors (mean annual precipitation, mean annual temperature, and elevation) among regions, the effect of phosphorus fertilizer added to alfalfa to increase yield and improve quality showed significant spatial differentiation characteristics [30]. In this study, it was found that alfalfa in Shandong Province had the most significant yield-enhancing effect, which may be attributed to its temperate monsoon climatic conditions, characterized by rain and heat at the same time and soil pH values mostly ranging from 6.5 to 7.5, which are in the slightly acidic to neutral range. This range is not only conducive to the activation of soil effective phosphorus, but also promotes the absorption efficiency of phosphorus by the root system, which in turn enhances the biomass accumulation of alfalfa through the regulation of carbon and nitrogen metabolic pathways [31]. In addition, alfalfa in Xinjiang had the most significant quality enhancement effect, probably because, while the soil phosphorus effectiveness was lower in Xinjiang, its unique light and heat resources with significant diurnal temperature difference provided ideal conditions for efficient synthesis and distribution of photosynthetic products. High light intensity promotes carbohydrate synthesis, while low nighttime temperatures inhibit dark respiration rates and reduce nonstructural carbohydrate consumption, thereby significantly increasing CP and decreasing fiber fractions (ADF, NDF) [32,33]. In this study, we found that alfalfa with added phosphorus fertilizer had the highest yield increase at a soil pH of 6–7, while alfalfa quality was relatively better at a soil pH of about 8. This phenomenon may be related to the dual regulatory mechanism of pH on nutrient bioavailability: the high solubility of phosphorus in neutral soils promotes root uptake, while the complexation of calcium ions under slightly alkaline conditions stabilizes the cell wall structure and retards the excessive deposition of cellulose [31,34]. This is consistent with the findings of Jianfeng Li et al. [35] that nutrient effectiveness is high, alfalfa root system is well developed, and yield and quality are optimal in neutral to slightly alkaline soils (pH 6.5–7.5). Altitude and precipitation are the key to alfalfa yield and quality. Altitude affects alfalfa growth cycle and metabolic efficiency mainly through temperature changes, while precipitation directly determines water availability, which in turn affects nutrient uptake and cell wall development [36,37]. Wang et al. [38] found that in areas 1000–2000 m above sea level, the moderate temperature and large temperature difference between day and night are favorable for alfalfa dry matter accumulation and nitrogen metabolism, so the yield is higher and the CP content is significantly increased. Meanwhile, if the average annual precipitation was maintained at 750–800 mm and evenly distributed, it could further promote the growth and protein synthesis of alfalfa, and at the same time maintain the moderate level of ADF and NDF, so as to improve the digestibility and nutritional value of the forage [39]. The results of the study indicated that alfalfa yield increase and CP content were highest at average annual precipitation of 200–800 mm and altitude of 500–1500 m. However, ADF content and NDF content decreased more significantly at average annual precipitation of 0–200 mm and altitude of 0–500 m. The reason for this may be that the temperature is higher in low altitude areas, especially under drought conditions, which accelerates transpiration and increases water loss. This may be due to the fact that higher temperatures at lower altitudes, especially under drought conditions, accelerate alfalfa transpiration and exacerbate water loss [40]. Under the dual stress of drought and heat, alfalfa prioritizes the allocation of limited resources to life-sustaining activities (e.g., protein synthesis and photosynthesis) [41,42], instead of cell wall construction. This prioritization of resource allocation may result in reduced fiber synthesis and decreased ADF and NDF content. The effect of mean annual temperature on yield and quality showed a significant threshold effect [43]. Its action is mainly through the regulation of photosynthesis, respiration, nutrient uptake, and metabolic processes. Although [44] found that 15~25 °C is the optimum temperature range for alfalfa growth, this study found that the yield and quality improvement of alfalfa was more significant at an annual mean temperature of 6~8 °C. The reason for this may be that the effective cumulative temperature in the main alfalfa production areas in northern China is concentrated in April to October (mean daily temperature > 10 °C), and the calculation of the mean annual temperature includes the period of low temperature in winter, which leads to the overall low value. In fact, the growing season temperatures highly coincided with the optimum range reported by [44], indicating that the mean annual temperature was not a direct limiting factor, and the precise quantification of the thermodynamic parameters during the growing season was more agronomically significant.

4.2. Effect of Phosphorus Fertilizer Factors on Yield and Quality of Phosphorus-Applied Alfalfa

Phosphorus fertilizer, as an essential nutrient for plant growth, significantly affects the biomass accumulation and forage quality of alfalfa by regulating the root system configuration, enhancing its water and nutrient uptake capacity, and promoting the distribution of photosynthetic assimilates [45]. In this study, we found that the application of water-soluble phosphorus fertilizers (e.g., calcium phosphate, calcium superphosphate, and mono-ammonium phosphate) significantly enhanced alfalfa yield and CP content, probably due to their high solubility rate and phosphorus effectiveness, which can be rapidly absorbed by the root system through the exoplasmic pathway [23]. However, in alkaline or highly calcareous soils, phosphate is readily immobilized by combining with Ca2+, resulting in reduced phosphorus bioavailability [46]. There is a close relationship between phosphorus fertilizer application rate and alfalfa production performance. This study showed that the yield increase of alfalfa increased and then decreased with the increase of phosphorus fertilizer application, with the highest yield increase when the application rate was 100–200 kg·ha−1 and the yield of alfalfa decreased when the application rate of phosphorus fertilizer was more than 300 kg·ha−1, which was probably due to the fact that excessive phosphorus fertilizer would lead to an imbalance of phosphorus in the soil in the proportion of phosphorus and other nutrients (e.g., nitrogen, potassium, zinc, etc.), which would inhibit the uptake of other nutrients by alfalfa [47]. This is consistent with Abdala et al. [48], who found that the addition of excessive phosphorus fertilizer may cause soil environmental problems such as phosphorus fixation or acidification, which indirectly inhibits alfalfa growth and leads to a significant reduction in yield; i.e., there is a “phosphorus threshold effect” of phosphorus addition, and the agronomic benefits of phosphorus fertilizers are regulated by the dynamics of the feedback mechanism of the soil–plant system. The agronomic benefits of phosphorus fertilizer are dynamically regulated by soil–plant system feedback mechanisms. In terms of quality indexes, it was found that the CP content and ADF content of alfalfa increased and decreased significantly when phosphorus fertilizer was applied at a dosage of 100–300 kg·ha−1, and there was negative feedback on alfalfa when phosphorus fertilizer was applied at a dosage of >300 or <100, which was in agreement with the results of the study of An Xiaoxia et al. [49] and other researchers. In contrast, NDF content did not significantly decrease at phosphorus fertilizer application rates of 100–200 kg·ha−1 and increased at application rates >200 kg·ha−1 or <100 kg·ha−1. The abnormal response of NDF may stem from a resource allocation strategy at the reproductive growth stage: high phosphorus supply accelerates the conversion of alfalfa from nutrient to reproductive growth, resulting in increased lignin and hemicellulose deposition in the stalks [50,51]. In addition, the optimization of the follow-up fertilizer strategy needs to be combined with the soil background phosphorus level and mowing system. In this study, it was found that the yield and quality of alfalfa were relatively better when phosphorus fertilizer was not applied retroactively, and if it was chosen to be applied retroactively, fertilizing once was the best. The reason may be that the experimental soils collected in this study are rich in phosphorus fertilizer or the one-time basal application of phosphorus fertilizer can satisfy the demand of alfalfa for the whole growing season, and the supplementary application of fertilizer may lead to the excess of phosphorus and trigger the imbalance of nutrients. The better effect of one-time application may be due to the fact that the first basal application of phosphorus fertilizer is not much, and as alfalfa grows and is mowed, the effective phosphorus in the soil gradually decreases, leading to insufficient supply of phosphorus in the later stage, thus limiting the nitrogen metabolism and lowering the yield and quality of alfalfa [23]. Fertilizer at this time can supplement phosphorus, promoting the middle and late growth stages, to ensure significantly improved yield and quality throughout the growth stages of alfalfa.

4.3. Effect of Nitrogen Fertilizer Factors on Yield and Quality of Phosphorus-Applied Alfalfa

Ecological stoichiometry suggests that plants have relatively stable carbon, nitrogen, and phosphorus ratios, and that changes in the ratios can be studied to characterize the plant’s response to the soil microenvironment and nutrient element fluxes, and to determine the types of elements limiting its growth and development [52]. In a study carried out in the Horqin sand lands, it was found that the hay yield of alfalfa peaked at 52.5 kg·ha−1 of nitrogen application, which was significantly higher than that of the unapplied nitrogen treatment [53]. This suggests that the photosynthetic efficiency of alfalfa was significantly enhanced under moderate nitrogen application conditions, resulting in increased yield [54]. In the Yellow Huaihai region, the CP content of alfalfa reached 22.45% and the relative feeding value was also optimal when nitrogen application was 4.10 kg·ha−1 and phosphorus fertilizer was 48.47 kg·ha−1 [47]. However, over- or under-application of nitrogen fertilizer can adversely affect the growth of alfalfa: under-application of nitrogen will lead to short plants and slow growth, while over-application of nitrogen will inhibit the nitrogen fixation ability of rhizobium, reduce the number of rhizomes, and lower the efficiency of symbiotic nitrogen fixation, and in addition, over-application of nitrogen will lead to the accumulation of nitrate-nitrogen in the soil, and reduce the nitrogen fertilizer utilization rate [55,56,57]. In this study, it was found that the yield, CP content, and ADF content of alfalfa reached the optimum level when no nitrogen fertilizer was applied, and it is noteworthy that the average reduction rate of NDF content reached the highest value when nitrogen application was >100 kg·ha−1. This suggests that in the absence of nitrogen, phosphorus fertilization alone can effectively promote the growth and quality improvement of alfalfa, especially in terms of CP accumulation and fiber fraction optimization [58]. However, high nitrogen fertilizer application had a significant effect on the reduction of NDF content, probably because nitrogen fertilizer promotes plant cell wall synthesis and decomposition and cellulose production, which in turn increases NDF content [59,60]. Significant synergistic effects between nitrogen and phosphorus fertilizers as key nutrients affect alfalfa growth and quality [61]. Nitrogen is an important component of plant proteins, chlorophyll and nucleic acids, while phosphorus is involved in the energy metabolism of plants, and their synergistic effect can significantly improve the efficiency of photosynthesis, which in turn promotes the accumulation of dry matter and quality enhancement [62]. This study showed that alfalfa yield increase was highest when the nitrogen–phosphorus ratio was 0.6–0.8; the CP content and NDF content of alfalfa were optimal when the nitrogen–phosphorus ratio was 0.4–0.6; and the ADF was relatively better when the nitrogen–phosphorus ratio was 1–2. Excessive use of a single fertilizer during alfalfa growth can have negative effects; excessive nitrogen fertilizer can lead to impeded phosphorus uptake and soil nutrient imbalance, while excessive phosphorus fertilizer can inhibit nitrogen uptake and accelerate cell wall lignification, ultimately leading to a decrease in alfalfa yield and quality [63]. Therefore, the optimization of nitrogen and phosphorus fertilizer ratios should be emphasized in practical agricultural production. A scientific and rational fertilization strategy should be adopted to achieve high-yield, high-quality, and sustainable production of alfalfa.

4.4. Effect of Time Factor on Yield and Quality of Phosphorus-Applied Alfalfa

The regulatory effects of phosphorus application on alfalfa yield and quality were significantly time-dependent, and the short-term and long-term response mechanisms were qualitatively different [23]. In this study, it was found that alfalfa with phosphorus fertilizer added before 2012 had higher yield, CP content and NDF content, while ADF content was lower from 2016 to 2018. This phenomenon may be attributed to the fact that alfalfa grows vigorously in years with sufficient precipitation and suitable temperature, and phosphorus application has a significant effect, resulting in higher yield and quality. In contrast, in years of drought or extreme high/low temperatures, alfalfa growth is inhibited, phosphorus application is less effective, and yield and quality are reduced. In the short term, phosphorus application could significantly increase hay yield and CP content of alfalfa [40]. This study also found that the best yield and quality of alfalfa was obtained with the addition of phosphorus fertilizer when a test lasted two years. Long-term phosphorus application may lead to the accumulation of phosphorus in the soil, and excessive phosphorus accumulation may occur nutrient imbalance, inhibit the absorption of other elements, but reduce the yield [63]. In addition, soil pH, organic matter content, and microbial activity may change in long-term experiments, affecting phosphorus effectiveness, and long-term phosphorus application may accelerate cell wall lignification, leading to increased ADF and NDF content [64]. The results of Luo Xinyi et al. [65] indicated that alfalfa yield and quality reached its best in the 2nd–3rd year after establishment, when the root system was well developed and the nutrient uptake capacity was high. The addition of phosphorus fertilizer can significantly improve the yield and quality of alfalfa, especially in phosphorus-deficient soils [66]. This is also consistent with the results of this study. The effect of experimental length on alfalfa yield and quality was mainly reflected in the time effect of fertilization strategies. Gong H et al. [30] showed that the nitrogen and phosphorus content, photosynthetic pigment content, and stomatal opening of alfalfa leaves increased significantly after 3 years of continuous phosphorus application, which indicated that the appropriate annual phosphorus application could improve the photosynthetic physiological characteristics of alfalfa, and then enhance its quality. However, too long an experimental period may lead to excessive depletion of soil fertility, and it is necessary to reasonably adjust the amount and frequency of fertilization to achieve the sustainable improvement of alfalfa yield and quality.

5. Conclusions

(1)
Compared with no phosphorus fertilization, the yield, CP content, and NDF content of alfalfa with phosphorus addition increased significantly by 19.0%, 7.2%, and 7.2% on average, respectively, while the acid detergent fiber (ADF) content decreased significantly by 3.3% on average.
(2)
In regions such as Shandong, Jilin, and Hebei, with soil pH 7–8, annual precipitation of 200–400 mm, average annual temperature > 4 °C, and altitude of 500–1000 m, applying calcium phosphate or single superphosphate with a P2O5 content of 0–20% at a rate of 100–200 kg·ha−1 as a basal application, nitrogen application > 100 kg·ha−1, and one topdressing during an experimental and establishment duration of 2 years was conducive to increasing alfalfa yield with phosphorus addition.
(3)
In Xinjiang, with soil pH > 8, annual precipitation > 200 mm, average annual temperature 6–8 °C, and altitude of 500–1000 m, applying calcium phosphate with a P2O5 content of 0–20% at a rate of 100–200 kg·ha−1 as a basal application without nitrogen fertilization during a 2-year experimental period and 2–3 years of establishment was conducive to increasing CP content in alfalfa with phosphorus addition.
(4)
In Xinjiang, with soil pH <8, annual precipitation 0–200 mm, average annual temperature 6–8 °C, and altitude of 0–500 m, applying mono-ammonium phosphate with a P2O5 content > 20% at a rate of 200–300 kg·ha−1 with one topdressing and no nitrogen fertilization during a 1-year experimental period and 3 years of establishment was conducive to reducing the ADF content in alfalfa with phosphorus addition.
(5)
A nitrogen-to-phosphorus ratio of 0.4–0.6 was conducive to reducing the NDF content in alfalfa with phosphorus addition.
In conclusion, phosphorus fertilization significantly increases alfalfa yield and moderately improves alfalfa quality. The superiority of phosphorus addition is more pronounced in regions with an average annual temperature of 6–8 °C.

Author Contributions

Conceptualization, G.Q. and Y.M.; methodology, H.L., L.Z. and M.Y.; software, Y.K. and Y.J.; validation, Y.W.; formal analysis, Y.J., L.Z. and M.Y.; investigation, Y.G. and C.Y.; resources, M.Y. and Y.M.; data curation, L.Z.; writing—original draft preparation, L.Z.; writing—review and editing, L.Z., Y.L. and Y.J.; visualization, M.Y.; supervision, L.Z.; project administration, Y.J.; funding acquisition, G.Q. All authors have read and agreed to the published version of the manuscript.

Funding

This study was funded by National Natural Science Regional Foundation of China (Grant Nos. 52069001 and 52269009); Gansu Agricultural University, the fifth batch of “Fuxi Young Talents” project (Grant No. Gaufx-05Y11); Gansu Agricultural University, Youth Tutor Support Fund (Grant Nos. GAU-QDFC-2023-12), Gansu Provincial Science and Technology Key R&D Program (Grant Nos. 22YF7NA110), Gansu Agricultural University “Innovation of Efficient Utilization of Soil and Water Resources for Specialty Crops in Northwest Arid Regions” Discipline Team Building Special Project (Grant No. GAU-XKTD-2022-09).

Data Availability Statement

All data supporting this study are included in the article.

Acknowledgments

We thank all the researchers whose data were used in this meta-analysis. We also gratefully acknowledge the editors and reviewers who put forward constructive comments on this article.

Conflicts of Interest

The authors declare no conflicts of interest.

References

  1. Zhang, T.C.; Wan, W.F.; Sun, Z.; Li, H.G. Phosphorus uptake and rhizosphere properties of alfalfa in response to phosphorus fertilizer types in sandy soil and saline-alkali soil. Front. Plant Sci. 2024, 15, 1377626. [Google Scholar]
  2. Liu, H.; Xu, M.; Guo, Y.; Dan, Z.; Liu, X.; Zhang, J.; Li, C.; Jia, S.; Jia, L.; Yu, A.; et al. Combined Transcriptome and Metabolome Analysis of Alfalfa Responses to Aphid Infestation. Agriculture 2024, 14, 1545. [Google Scholar] [CrossRef]
  3. Li, Y.; Wang, X.-B.; Ma, J.; Yang, X.; Lu, X.; Feng, Q.; Hou, F. Effects of planting year of alfalfa on rhizosphere bacterial structure and function. Rhizosphere 2024, 29, 100839. [Google Scholar]
  4. Xie, H.L.; Yang, Y.P.; Dong, Y.; Wang, T. Analysis of the International Development Trends of Alfalfa. Chin. Bull. Bot. 2021, 56, 740–750. [Google Scholar]
  5. Ni, Y.F.; Wang, M.L. Trends and comparative analysis of pasture production in China from a cost-benefit perspective. Chin. J. Grassl. 2024, 46. [Google Scholar]
  6. Rahman, M.A.; Humayan, K.A.; Yowook, S.; SangHoon, L.; Mirza, H.; KiWon, L. Nitric Oxide Prevents Fe Deficiency-Induced Photosynthetic Disturbance, and Oxidative Stress in Alfalfa by Regulating Fe Acquisition and Antioxidant Defense. Antioxidants 2021, 10, 1556. [Google Scholar] [CrossRef]
  7. Lu, E.; Li, C.; Geng, Y.; Liang, T.; Zhang, J. Effects of Long-Term Fertilization on Phosphorus Form and Availability in Black Soil. Appl. Sci. 2024, 14, 11673. [Google Scholar] [CrossRef]
  8. Padmanabhan, P.; Sahi, S.V. Influence of phosphorus nutrition on growth and metabolism of Duo grass (Duo festulolium). Plant Physiol. Biochem. 2008, 47, 31–36. [Google Scholar]
  9. Ghorbani, M.; Amirahmadi, E. Biochar and soil contributions to crop lodging and yield performance—A meta-analysis. Plant Physiol. Biochem. 2024, 215, 109053. [Google Scholar]
  10. Schulze, J.; Temple, G.; Temple, S.J.; Beschow, H.; Vance, C.P. Nitrogen Fixation by White Lupin under Phosphorus Deficiency. Ann. Bot. 2006, 98, 731–740. [Google Scholar] [CrossRef]
  11. Ke, X.; Xiao, H.; Peng, Y.; Wang, J.; Lv, Q.; Wang, X. Phosphoenolpyruvate reallocation links nitrogen fixation rates to root nodule energy state. Science 2022, 378, 971–977. [Google Scholar] [CrossRef] [PubMed]
  12. Ma, X.; Li, H.; Zhang, J.; Shen, J. Spatiotemporal Pattern of Acid Phosphatase Activity in Soils Cultivated With Maize Sensing to Phosphorus-Rich Patches. Front. Plant Sci. 2021, 12, 650436. [Google Scholar] [CrossRef] [PubMed]
  13. Murray, J.D.; Liu, C.W.; Chen, Y.; Miller, A.J. Nitrogen sensing in legumes. J. Exp. Bot. 2017, 68, 1919–1926. [Google Scholar] [CrossRef]
  14. Hewitt, M.M.; Carr, J.M.; Williamson, C.L.; Slocum, R.D. Effects of phosphate limitation on expression of genes involved in pyrimidine synthesis and salvaging in Arabidopsis. Plant Physiol. Biochem. 2005, 43, 91–99. [Google Scholar] [CrossRef] [PubMed]
  15. Plaxton, W.C.; Tran, H.T. Metabolic adaptations of phosphate-starved plants. Plant Physiol. 2011, 155, 1006–1015. [Google Scholar] [CrossRef] [PubMed]
  16. Guo, Y.; Wang, Z.; Li, J. Effects of phosphorus fertilizer type and dripline depth on root and soil nutrient distribution, nutrient uptake, and maize yield under subsurface drip fertigation. Field Crops Res. 2024, 318, 109585. [Google Scholar] [CrossRef]
  17. Zhou, C.; Cai, Y.; Yang, Z.; Wang, H.; Deng, F.; Bai, Z.; Gong, W.; Wang, J. Nitrogen, phosphorus and potassium fertilization promotes Zanthoxylum armatum ‘Hanyuan Putao Qingjiao’ flower bud differentiation in Sichuan, China. Hort. Environ. Biotechnol. 2020, 61, 651–661. [Google Scholar] [CrossRef]
  18. El Mazouni, N.; Mesnaoui, M.; Labbita, T.; El Mokhtar, M.A.; Khouloud, M.; Meddich, A. Formulating a Fertilizer Based On Vitreous Fertilizers and Arbuscular Mycorrhizal Fungi to Improve Wheat Growth and Yield Under Water Stress. J. Crop Health 2024, 77, 13. [Google Scholar]
  19. Bouas, H.; Bouaziz, A.; Bouazzama, B.; Hirich, A.; Choukrallah, R. How Phosphorus Fertilization Alleviates the Effect of Salinity on Sugar Beet (Beta vulgaris L.) Productivity and Quality. Agronomy 2021, 11, 1491. [Google Scholar] [CrossRef]
  20. Lima, G.S.; Silva, S.S.; Soares, L.A.A.; Silva, A.A.R.; Gheyi, H.R.; Nobre, R.G.; Souza, W.B.B.; Silva, S.T.A.; Guedes, M.A.; Oliveira, V.K.N. Irrigation with saline water in the cultivation of mini watermelon under phosphate fertilization. Braz. J. Biol. 2023, 83, e274991. [Google Scholar] [CrossRef]
  21. Zambrosi, F.C.B.; Mesquita, G.L. Foliar phosphorus application enhances nutrient balance and growth of phosphorus deficient sugarcane. J. Agric. Rural Dev. Trop. Subtrop. 2016, 117, 203–210. [Google Scholar]
  22. Jinyao, Y.; Tao, R.; Kunkun, W.; Huizhi, L.; Xiaokun, L.; Rihuan, C.; Jianwei, L. Improved crop yield and phosphorus uptake through the optimization of phosphorus fertilizer rates in an oilseed rape-rice cropping system. Field Crops Res. 2022, 286, 108614. [Google Scholar]
  23. Wang, Y.; Xie, J.; Fan, F.; Sun, Z.; Yuan, F.; Wang, Q.; Yu, L.; Liu, Y.; Li, J.; Cui, L. Phosphorus fertilization enhanced overwintering, root system and forage yield of late-seeded alfalfa in sodic soils. Sci. Rep. 2024, 14, 18090. [Google Scholar] [CrossRef] [PubMed]
  24. Zhang, Q.; Liu, J.; Liu, X.; Li, S.; Sun, Y.; Lu, W.; Ma, C. Optimizing water and phosphorus management to improve hay yield and water- and phosphorus-use efficiency in alfalfa under drip irrigation. Food Sci. Nutr. 2020, 8, 2406–2418. [Google Scholar] [CrossRef]
  25. Li, S.; Chen, X.; Wang, Z.; Wu, D.; Wang, M.; Mueller, T.; Zou, C.; Chen, X.; Zhang, W. Phosphorus fertilizer management for high yields in intensive winter wheat-summer maize rotation system: Integrating phosphorus budget and soil available phosphorus. Field Crops Res. 2024, 313, 109410. [Google Scholar]
  26. Li, X.; Tian, J.; Chen, X.; Liao, H. Bioengineering and management for efficient and sustainable utilization of phosphorus in crops. Curr. Opin. Biotechnol. 2024, 90, 103180. [Google Scholar]
  27. Hedges, L.V.; Gurevitch, J. The Meta-Analysis of Response Ratios in Experimental Ecology. Ecology 1999, 10, 123. [Google Scholar] [CrossRef]
  28. Yin, M.H.; Ma, Y.L.; Kang, Y.X.; Jia, Q.; Qi, G.P.; Wang, J.H. Meta-analysis of the effects of nitrogen addition on yield and quality of alfalfa in China. Acta Pratacult. Sin. 2022, 31, 9. [Google Scholar]
  29. Maindonald, J.H. Applied Meta-Analysis for Social Science Research. Int. Stat. Rev. 2013, 81, 165–166. [Google Scholar]
  30. Gong, H.Q.; Yin, Y.L.; Chen, Z.; Zhang, Q.S.; Tian, X.S.; Wang, Z.H.; Wang, Y.C.; Cui, Z.L. A dynamic optimization of soil phosphorus status approach could reduce phosphorus fertilizer use by half in China. Nat. Commun. 2025, 16, 976. [Google Scholar]
  31. Hou, J.J.; Yi, G.W.; Hao, Y.F.; Li, L.T.; Shen, L.C.; Zhang, Q.Z. The effect of combined application of biochar and phosphate fertilizers on phosphorus transformation in saline-alkali soil and its microbiological mechanism. Sci. Total Environ. 2024, 951, 175610. [Google Scholar]
  32. Mou, R.; Jian, Y.; Zhou, D.J.; Li, J.H.; Yan, Y.; Tan, B.; Xu, Z.F.; Cui, X.L.; Li, H.; Zhang, L.; et al. Divergent responses of woody plant leaf and root non-structural carbohydrates to nitrogen addition in China: Seasonal variations and ecological implications. Sci. Total Environ. 2024, 950, 175425. [Google Scholar] [PubMed]
  33. Jones, S.; Mercado, L.M.; Bruhn, D.; Raoult, N.; Cox, P.M. Night-time decline in plant respiration is consistent with substrate depletion. Commun. Earth Environ. 2024, 5, 148. [Google Scholar]
  34. Duan, S.L.; Yan, W.H.; Feng, Y.; Zhang, L. Carbon and Phosphorus Mutualism Mechanism of Nutrient Acquisition by Plant Roots and Mycorrhizal Pathways. Plant Nutr. Fertil. Sci. 2023, 29, 1160–1167. [Google Scholar]
  35. Li, J.F.; Shi, S.L.; Zhang, S.Q. Effects of environmental acidity on the early growth and physiology of alfalfa. Acta Pratacult. Sin. 2010, 19, 47–54. [Google Scholar]
  36. He, X.; Liu, F.; Ma, T.; Ma, A.; Wang, Y.; Li, Y.; Gao, W.; Yang, Z.; Ke, J.; Xiao, Y.; et al. Temperature and microbial metabolic limitations govern microbial carbon use efficiency in the Tibetan alpine grassland. Appl. Soil Ecol. 2025, 206, 105880. [Google Scholar]
  37. Varol, I.S.; Ünlükar, A.; Kaplan, M. Water productivity, yield response factors, yield and quality of alfalfa cultivars in semi-arid climate conditions. Environ. Exp. Bot. 2024, 224, 105826. [Google Scholar]
  38. Wang, Y.; Liu, Y.; Chen, P.; Song, J.; Fu, B. Interannual precipitation variability dominates the growth of alpine grassland above-ground biomass at high elevations on the Tibetan Plateau. Sci. Total Environ. 2024, 931, 172745. [Google Scholar]
  39. Li, X.L.; Hou, X.Y.; Mu, H.B. The Impact of Irrigation Patterns under Different Precipitation Regimes on Alfalfa Yield and Soil Moisture Dynamics. Chin. J. Grassl. 2013, 35, 46–52. [Google Scholar]
  40. Wang, X.; Hu, Z.; Zhang, Z.; Tang, J.; Niu, B. Altitude-Shifted Climate Variables Dominate the Drought Effects on Alpine Grasslands over the Qinghai–Tibetan Plateau. Sustainability 2024, 16, 6697. [Google Scholar] [CrossRef]
  41. Wang, J.; Zhang, X.; Wang, R.; Yu, M.; Chen, X.; Zhu, C.; Shang, J.; Gao, J. Climate Factors Influence Above- and Belowground Biomass Allocations in Alpine Meadows and Desert Steppes through Alterations in Soil Nutrient Availability. Plants 2024, 13, 727. [Google Scholar] [CrossRef]
  42. Li, X.; Zuo, X.; Yue, P.; Zhao, X.; Hu, Y.; Guo, X.; Guo, A.; Xu, C.; Yu, Q. Drought of early time in growing season decreases community aboveground biomass, but increases belowground biomass in a desert steppe. BMC Ecol. Evol. 2021, 21, 106. [Google Scholar]
  43. Hussain, H.A.; Men, S.; Hussain, S.; Chen, Y.; Ali, S.; Zhang, S.; Zhang, K.; Li, Y.; Xu, Q.; Liao, C.; et al. Interactive effects of drought and heat stresses on morpho-physiological attributes, yield, nutrient uptake and oxidative status in maize hybrids. Sci. Rep. 2019, 9, 3890. [Google Scholar]
  44. Li, J.Q.; Liu, X.J.; Yun, X.K.; Han, Y.L. Response to Low Temperature and Cold Resistance Study of Alfalfa at Different Growth Stages. Acta Agrestia Sin. 2021, 29, 2505–2512. [Google Scholar]
  45. Li, S.Y.; Sun, Y.L.; Liu, X.S.; Zhao, J.W.; Zhao, J.T.; Ma, C.H.; Zhang, Q.B. Effects of phosphorus fertilizer on rhizosphere soil microenvironment and hay yield of drip-irrigated alfalfa. Acta Agrestia Sin. 2022, 30, 495–502. [Google Scholar]
  46. Fan, B.; Ding, J.; Fenton, O.; Daly, K.; Chen, S.; Chen, Q. Investigation of differential levels of phosphorus fixation in dolomite and calcium carbonate amended red soil. J. Sci. Food Agric. 2021, 102, 740–749. [Google Scholar]
  47. Zhang, T.J.; Zhao, Z.X.; Long, R.C.; Lv, H.G.; Yang, Q.C.; Kang, J.M. Effects of Nitrogen, Phosphorus, and Potassium Fertilizers on Alfalfa in the Huang-Huai-Hai Region and Recommended Fertilizer Application Rates. Acta Agrestia Sin. 2019, 27, 243–249. [Google Scholar]
  48. Abdala, D.B.; Ghosh, A.K.; Silva, I.R.; Novais, R.F.; Venegas, V.H.A. Phosphorus saturation of a tropical soil and related P leaching caused by poultry litter addition. Agric. Ecosyst. Environ. 2012, 162, 15–23. [Google Scholar]
  49. An, X.L.; Zhang, Y.S.; Ma, C.H.; Li, M.; Zhang, Q.B. Effects of Phosphorus Application and Arbuscular Mycorrhizal Fungus Inoculation on Alfalfa Yield and Phosphorus Use Efficiency. Acta Pratacult. Sin. 2023, 32, 71–84. [Google Scholar]
  50. Peng, W.; Cai, W.; Pan, J.; Su, X.; Dou, L. Molecular Mechanisms of Alfalfa Response to Abiotic Stresses. Plants 2025, 14, 487. [Google Scholar] [CrossRef]
  51. Liu, X.; Wu, Y.; Zhang, M.; Gao, P.; Li, J.; Ding, H.; Sun, X.; Lu, L.; Iqbal, A.; Yang, Y. Phosphorus-Mediated Transition from Vegetative to Reproductive Growth in Dwarf Coconut (Cocos nucifera L.). Int. J. Mol. Sci. 2024, 25, 12040. [Google Scholar] [CrossRef] [PubMed]
  52. Lu, J.Y.; Yang, H.M.; Tian, L.; Zhang, H.S.; Xie, J.B.; Liu, Y. Effects of Water on Carbon, Nitrogen, and Phosphorus Content and Stoichiometric Characteristics of Medicago sativa Stems and Leaves at Different Growth Stages. Chin. J. Grassl. 2021, 43, 25–34. [Google Scholar]
  53. Liu, Z.Y.; Sui, K.; Shan, X.H.; Gao, Q.F.; Zhang, Y.X.; Zhang, Y.L.; Sun, T.N.; Wang, X.G. Effects of Different Nitrogen Application Rates on Photosynthetic Characteristics and Yield of Medicago sativa in the Horqin Sandy Land. Acta Agrestia Sin. 2024, 32, 3973–3979. [Google Scholar]
  54. Shan, L.W.; Zhang, Q.; Zhu, R.F.; Kong, X.L.; Chen, J.S. Effects of AMF on Growth and Photosynthetic Physiological Characteristics of Leymus chinensis and Alfalfa under Nitrogen and Phosphorus Addition. Acta Pratacult. Sin. 2020, 29, 46–57. [Google Scholar]
  55. Fawzy, L.F.; Negm, A.H.; Hassan, S.E.; Azab, E.; Gobouri, A.A.; Hewidy, M. Nitrogen, Phosphorous, and Potassium Application Rate on the Young Seedling Growth of Salvadora persica. Agriculture 2021, 11, 291. [Google Scholar] [CrossRef]
  56. McDonald, I.; Baral, R.; Doohong, M. Effects of alfalfa and alfalfa-grass mixtures with nitrogen fertilization on dry matter yield and forage nutritive value. J. Anim. Sci. Technol. 2021, 63, 305–318. [Google Scholar] [CrossRef] [PubMed]
  57. Liu, J.; Lu, F.; Zhu, Y.; Wu, H.; Ahmad, I.; Dong, G.; Zhou, G.; Wu, Y. The Effects of Planting Density and Nitrogen Application on the Growth Quality of Alfalfa Forage in Saline Soils. Agriculture 2024, 14, 302. [Google Scholar] [CrossRef]
  58. Miao, X.R.; Sun, Y.M.; Yu, L.; Ma, C.H.; Zhang, Q.B. Effects of nitrogen and phosphorus fertilizer rate on hay yield and nutritional quality of alfalfa under drip irrigation. J. Agric. Sci. 2019, 28, 9. [Google Scholar]
  59. Chai, J.; Yang, H.; Chen, Z.; Li, W.; Li, D.; Yu, X. Biochar and Nitrogen Fertilizer Promote Alfalfa Yield by Regulating Root Development, Osmoregulatory Substances and Improve Soil Physicochemical Properties. Agriculture 2025, 15, 239. [Google Scholar] [CrossRef]
  60. Zhang, W.J.; Li, G.H.; Yang, Y.M.; Li, Q.; Zhang, J.; Liu, J.Y.; Wang, S.H.; Tang, S.; Ding, Y.F. Effective of Nitrogen Application Rate and Ratio on Lodging Resistance of Super Rice with Different Genotypes. J. Integr. Agric. 2014, 13, 63–72. [Google Scholar] [CrossRef]
  61. Li, X.; Marlos, D.; Wang, P.; Zhang, W.; Jin, W.; Wang, S.; Scopa, A.; Liu, Z.; Shao, C.; Sun, G.; et al. The divergent accumulation mechanisms of microbial necromass C in paddy soil under different long-term fertilization regimes. Geoderma 2023, 439, 116688. [Google Scholar]
  62. Zhao, J.; Huang, R.; Yang, K.; Ma, C.H.; Zhang, Q.B. Effects of Nitrogen and Phosphorus Fertilization on Photosynthetic Properties of Leaves and Agronomic Characters of Alfalfa over Three Consecutive Years. Agriculture 2022, 12, 1187. [Google Scholar] [CrossRef]
  63. Colombo, F.; Pesenti, M.; Araniti, F.; Piliu, S.R.; Nocito, F.F. An Integrated and Multi-Stakeholder Approach for Sustainable Phosphorus Management in Agriculture. Agronomy 2024, 14, 780. [Google Scholar] [CrossRef]
  64. Srivastava, R.; Basu, S.; Kumar, R. Phosphorus starvation response dynamics and management in plants for sustainable agriculture. J. Plant Biochem. Biotechnol. 2021, 30, 829–847. [Google Scholar]
  65. Luo, B.Y.; Li, H.; Wang, F.G. Yield correlation and throughput analysis of different environmental conditions and years in the first jubilee. In Proceedings of the International Conference on Architecture (Building), Hailar, China, 7 July 2001; pp. 378–381. [Google Scholar]
  66. Berg, W.K.; Cunningham, S.M.; Brouder, S.M.; Joern, B.C.; Johnson, K.D.; Santini, J.; Volence, J.J. Influence of Phosphorus and Potassium on Alfalfa Yield and Yield Components. Crop Sci. 2005, 45, 297–304. [Google Scholar]
Figure 1. The distribution of sampling points in this study. The values next to the labels for each province correspond to the frequency of literature in that region, respectively.
Agriculture 15 00797 g001
Figure 2. Frequency distribution of yield and quality with and without phosphorus fertilization. APF represents treatments with phosphorus fertilization, NAPF represents treatments without phosphorus fertilization, AV represents the average value, Y represents yield, CP represents crude protein content, ADF represents acid detergent fiber, and NDF represents neutral detergent fiber.
Agriculture 15 00797 g002
Figure 3. Analysis of the influence of phosphorus addition factors on alfalfa yield. (a) represents the regional factor, (b) represents the phosphorus fertilizer factor, (c) represents the nitrogen fertilizer factor, and (d) represents the time factor, and the numbers in the figure indicate the frequency of occurrence of the sample within that subgroup. LM represents Inner Mongolia; AAT represents average annual temperature; AAP represents average annual precipitation; P/AR represents provincial/autonomous region; TF represents topdressing frequency; TON represents topdressing or not; NA represents net application; PFT represents phosphate fertilizer type; TY represents trial year; TD represents trial duration; YOE represents years of establishment; SP represents superphosphate; DAP represents diammonium phosphate; CP represents calcium phosphate; MAP represents mono-ammonium phosphate; TSP represents triple superphosphate.
Agriculture 15 00797 g003
Figure 4. Analysis of the influencing factors of phosphorus addition on alfalfa crude protein content. (a) represents the regional factor, (b) represents the phosphorus fertilizer factor, (c) represents the nitrogen fertilizer factor, and (d) represents the time factor, and the numbers in the figure indicate the frequency of occurrence of the sample within that subgroup. LMrepresents Inner Mongolia; AAT represents average annual temperature; AAP represents average annual precipitation; P/AR represents provincial/autonomous region; TF represents topdressing frequency; TON represents topdressing or not; NA represents net application; PFT represents phosphate fertilizer type; TY represents trial year; TD represents trial duration; YOE represents years of establishment; SP represents superphosphate; DAP represents diammonium phosphate; CP represents calcium phosphate; MAP represents mono-ammonium phosphate; TSP represents triple superphosphate.
Agriculture 15 00797 g004
Figure 5. Analysis of the influencing factors of phosphorus addition on alfalfa acid detergent fiber content. (a) represents the regional factor, (b) represents the phosphorus fertilizer factor, (c) represents the nitrogen fertilizer factor, and (d) represents the time factor, and the numbers in the figure indicate the frequency of occurrence of the sample within that subgroup. LM represents Inner Mongolia; AAT represents average annual temperature; AAP represents average annual precipitation; P/AR represents provincial/autonomous region; TF represents topdressing frequency; TON represents topdressing or not; NA represents net application; PFT represents phosphate fertilizer type; TY represents trial year; TD represents trial duration; YOE represents years of establishment; SP represents superphosphate; DAP represents diammonium phosphate; CP represents calcium phosphate; MAP represents mono-ammonium phosphate; TSP represents triple superphosphate.
Agriculture 15 00797 g005
Figure 6. Analysis of factors influencing the content of neutral washing fiber in alfalfa with phosphorus addition. (a) represents the regional factor, (b) represents the phosphorus fertilizer factor, (c) represents the nitrogen fertilizer factor, and (d) represents the time factor, and the numbers in the figure indicate the frequency of occurrence of the sample within that subgroup. LM represents Inner Mongolia; AAT represents average annual temperature; AAP represents average annual precipitation; P/AR represents provincial/autonomous region; TF represents topdressing frequency; TON represents topdressing or not; NA represents net application; PFT represents phosphate fertilizer type; TY represents trial year; TD represents trial duration; YOE represents years of establishment; SP represents superphosphate; DAP represents diammonium phosphate; CP represents calcium phosphate; MAP represents mono-ammonium phosphate; TSP represents triple superphosphate.
Agriculture 15 00797 g006
Table 1. Data classification.
Influencing FactorSubcategoriesNormCriteria for Grouping
RegionGeographical distributionP/ARXinjiangGansuLMHebeiShaixiShaaixiNingxiaGuizhouShandongJilin
Soil characteristics pH5~66~77~8>8
Climatic conditions AAP (mm)0~200200~400400~800>800
AAT (°C)<44~66~88~10>10
Topographic characteristics Altitude (m)0~500500~10001000~1500>1500
Phosphate FertilizerFertilizer typesTypologySPDAPCPMAPTSP
Application parameters P2O5 content (%)0~2020~40>40
NA (kg·ha−1)0~100100~200200~300>300
Fertilizer strategy TONYesNo
TF1234
Nitrogenous Fertilizer Application parameters NA (kg·ha−1)00~100>100
Fertilizer strategy TONYesNo
TF123
Nutrient balance N/P ratio[0,0.2)[0.2~0.4)[0.4~0.6)[0.6~0.8)[0.8~1.0)[1~2)>2
Time Trial period TY<20102010~20122013~20152015~20182019~2021
TD123
YOE1238
P/AR represents province/autonomous region; LM represents Inner Mongolia; AAP represents average annual precipitation; AAT represents average annual temperature; NA represents net application rate; TF represents topdressing frequency; TON represents topdressing or not; N/P ratio represents nitrogen-to-phosphorus ratio; TY represents test year; TD represents trial period; YOE represents years of establishment; SP represents superphosphate; DAP represents diammonium phosphate; CP represents calcium phosphate; MAP represents mono-ammonium phosphate; TSP represents triple superphosphate.
Table 2. Combined effect size of phosphate addition on alfalfa yield and quality.
IndicatorModelIncrease
Rate (%)
95% Confidence IntervalEffect Size TestHeterogeneity Test
Upper LimitLower LimitZpQPQ
YieldRandom effects model (REM)19.022.615.511.5400.000210.7120.000
Crude protein content (CP)Random effects model (REM)7.214.90.11.9810.027956.6200.000
Acid detergent fiber (ADF)Random effects model (REM)−3.3−0.8−3.3−2.6240.00961.1240.000
Neutral detergent fiber (NDF)Random effects model (REM)7.214.90.11.9810.027956.6200.000
Disclaimer/Publisher’s Note: The statements, opinions and data contained in all publications are solely those of the individual author(s) and contributor(s) and not of MDPI and/or the editor(s). MDPI and/or the editor(s) disclaim responsibility for any injury to people or property resulting from any ideas, methods, instructions or products referred to in the content.

