1. Introduction
In modern society, agriculture has established itself as one of the core industries, with field horticulture gaining particular prominence. Notably, the three major horticultural fruits—apples, grapes, and citrus—constitute a significant portion of the total horticultural crop production [
1]. These fruits exhibit high global demand due to their distinctive sweetness and texture, as well as their diverse nutritional benefits. Among these, apples stand out as exemplary functional health fruits, abundantly containing various nutrients such as vitamin C, dietary fiber, and antioxidants, which are associated with immune system enhancement, digestive improvement, and cardiovascular health promotion [
2,
3,
4].
Like most fruits, apple quality is determined by several key factors: soluble solids content (SSC) measuring the concentration of dissolved carbohydrates; acidity indicated by pH level, which reflects the intensity of sourness; firmness determining the texture of both skin and flesh; maturity indicating the ripening stage; and starch content, a major caloric source in fruits appearing as a tasteless white powder. Currently, extensive research is being conducted to predict these quality indicators. However, traditional fruit quality assessment has relied primarily on empirical methods, making it difficult to ensure consistent quality that meets consumer expectations. Most horticultural operations, including fruit cultivation, pest management, and harvesting, still depend heavily on manual labor [
5,
6], with mechanization and automation levels reportedly below 20% [
7]. To address this low mechanization rate, recent advancements in digital agricultural technologies have led to continuous efforts to digitize the entire fruit production process, including the creation of yield maps using GPS and the utilization of GIS technology to document moisture content, soil fertility, and harvest volume [
8,
9]. Furthermore, progress in autonomous driving and robotics is accelerating the transition from traditional machine–human collaborative approaches to automated harvesting operations using robotics [
10,
11].
Despite critical quality factors such as size and sugar content determining the commercial value of apples, methods for quantitatively evaluating these characteristics remain inadequate. Consequently, there is an increasing demand for advanced technologies to collect, analyze, and manage morphometric and quality parameters such as sugar content, acidity, and size of horticultural crops. In particular, non-destructive quality assessment technologies based on image information have gained attention, leading to various research initiatives [
12,
13,
14].
Non-destructive measurement and analysis of morphometric parameters and internal quality factors of agricultural products require advanced measurement technologies and automated image processing techniques capable of replacing traditional manual labor [
15,
16,
17,
18]. The remarkable advancement of artificial neural networks integrated with imaging has facilitated extensive research incorporating machine learning technologies across diverse fields. Notably, deep learning technologies employing deep network architectures for rapid and efficient processing of large datasets have become prominent [
19,
20]. The agricultural sector has also rapidly adopted deep learning technologies, implementing them in various ways for crop recognition, morphometric analysis, and non-destructive quality assessment [
17,
18,
21,
22].
Among the various non-destructive inspection techniques for agricultural product quality assessment, methods utilizing optical properties have gained significant importance. Optical measurement techniques include RGB and RGBD imaging, near-infrared (NIR) imaging, thermal infrared (TIR) imaging, and X-ray imaging, with various spectroscopic methods being applied to agricultural product quality evaluation. In particular, RGBD sensors can simultaneously measure both conventional color (RGB) information and depth information (D), primarily used for determining the distance to objects or understanding three-dimensional structures. RGBD sensors typically operate by measuring the time-of-flight (ToF) of light reflected from objects, observing the deformation of structured light, or calculating depth information using stereo vision techniques with images captured from two different positions. These RGBD sensors are applied across various agricultural domains, from precise capture of three-dimensional crop structures to monitoring fruit size and identifying the position of harvestable fruits. Specifically, harvest robots equipped with RGBD sensors can automatically determine the number of fruits to predict yield, as well as estimate various morphometric parameters of each identified fruit to determine appropriate harvest timing based on its morphometric information.
Research on fruit yield prediction and growth monitoring systems using algorithms that combine artificial neural networks with RGB images for fruit detection has been particularly active. Rahnemoonfar et al. [
23] developed a convolutional neural network-based Inception-ResNet network to estimate fruit yield, demonstrating 91% accuracy in tomato detection. While showing accurate detection performance even for tomatoes in shadows or occluded by leaves, limitations were identified in that they synthesized tomato images rather than acquiring data from real environments, and although ripe tomatoes could be counted with high accuracy, green tomatoes at early growth stages could not be detected. Zhang et al. [
24] designed a neural network including 13 hidden layers for efficient classification of fruit categories and improved overall model performance through data augmentation techniques, achieving 94.94% detection precision. This showed significant accuracy improvement compared to conventional machine learning approaches; however, limitations existed in that accuracy decreased for images containing noise as only refined training data with clearly visible fruits were used, and while they verified optimized combinations of convolutional and pooling layers, they did not evaluate performance based on the optimized number of fully connected layers.
Morphometric analysis based on RGBD imaging has also been applied to various agricultural products. Wang et al. [
25] used stereo vision RGBD sensors to measure distances to mangoes, estimating fruit dimensions with RMSE values of 4.9 and 4.3 mm for length and width, respectively. Miranda et al. [
26] employed a ToF-based Azure Kinect DK RGBD camera to estimate apple size and predict weight, achieving high accuracy with an R
2 value of 0.942 and RMSE of 16.0 g. While these studies demonstrated the potential for reliable real-time size and weight estimation in field conditions, they primarily targeted non-occluded fruits, with mean absolute percentage errors exceeding 18% when measuring partially occluded apples.
Through such imaging and deep learning-based studies, which can also contribute to mechanized harvesting processes, agricultural producers can reduce labor requirements while maximizing sales revenue and maintaining market competitiveness. Additionally, harvest robots can continuously collect and analyze detailed morphometric data, such as fruit size, to produce appropriately sized fruit according to changing market demands, thereby reducing resource waste by adjusting production methods and harvest timing. Thus, harvest robots utilizing RGBD imaging technology can contribute to the establishment of sustainable future agriculture by enhancing crop management and harvesting efficiency.
To establish a robotic harvesting system, it is essential to first accurately identify fruit positions based on imagery and analyze individual quality to determine optimal harvest timing, before considering mechanical designs for efficiently harvesting fruits without damage. In particular, a significant challenge in harvest robot technology stems from the fact that even on the same tree, fruit quality varies due to differences in flowering times and fruit positions, making it difficult to determine optimal harvest timing based solely on fruit size or days after flowering.
This study aims to develop an advanced system for non-destructive morphometric analysis of field-grown apples using 3D depth imaging techniques integrated with artificial intelligence. Our research implements and comparatively analyzes multiple deep learning models for apple detection in fluctuating outdoor light conditions that typify orchard environments, applying Faster R-CNN ResNet101, EfficientDet D4, SSD MobileNet V2 for the object detection, and Mask R-CNN ResNet101, YOLOv11, RTMDet, YOLACT ResNet101 for instance segmentation. A novel methodology was developed for estimating apple morphometric parameters by linking two-dimensional detection results with three-dimensional depth information. Additionally, amodal segmentation techniques were introduced to accurately measure morphometric information of partially occluded apples, addressing a common challenge in orchard environments where fruits are frequently obscured by leaves and branches. The proposed methods were validated using a comprehensive dataset collected over three growing seasons in open-field conditions. These findings demonstrate the technical feasibility of using AI-based RGBD imaging for automated, non-destructive assessment of apple morphometric parameters in open-field environments, with significant implications for harvest robotics and precision agriculture applications.
2. Materials and Methods
2.1. Data Acquisition in Fluctuating Light Environment
The experiment was conducted in an open-field apple orchard at the National Institute of Horticultural and Herbal Science located in Wanju-gun, Jeonju, Republic of Korea. Among various apple cultivars, ‘Hongro’ was selected as the experimental subject. Hongro is highly demanded in both domestic and international markets due to its vibrant red color and balanced combination of sweetness and tartness, playing a significant role in the development of the domestic apple industry. The trees in the experimental orchard were trained in a slender spindle system, with an approximate height of 2.3 m and width of 1.5 m. This training system is similar to high-density planting methods but incorporates some trellis elements to guide branches into specific structures. Each tree is known to produce approximately 20 to 30 kg of apples annually.
As shown in
Figure 1, labels were attached to branches bearing apples to distinguish each target apple by number. For all experiments, 20–30 apples free from pest damage or external defects were selected for each data collection session. To collect data, an RGBD camera (D435i, Intel RealSense Inc., Beijing, China) utilizing a stereo vision system was connected to a laptop to acquire RGBD images of apples. Rather than mounting the equipment on a fixed tripod, the system was designed for portability, with the operator carrying both the laptop and camera connected via cable. This mobile setup allowed for capturing images from multiple viewing angles and positions, maximizing the diversity of the dataset by including various perspectives, lighting conditions, and occlusion scenarios that would be encountered in real orchard environments. Considering the need for flexible and efficient image capture in the field environment and portability requirements, a snapshot method was implemented using the Software Development Kit (SDK), allowing for convenient data collection with automatic saving by date and time.
To enhance the training speed and efficiency of the deep learning-based apple detection models, a dedicated deep learning PC (DLPC) equipped with a CPU (i7-7700K, Intel Corp., Santa Clara, CA, USA) and high-performance GPU (RTX A6000, Nvidia Corp., Santa Clara, CA, USA) was utilized. The high-performance GPU, capable of parallel computing, significantly accelerates model training by simultaneously processing large computational tasks. Additionally, it efficiently handles large-scale datasets and provides sufficient resources for training models with complex neural network architectures.
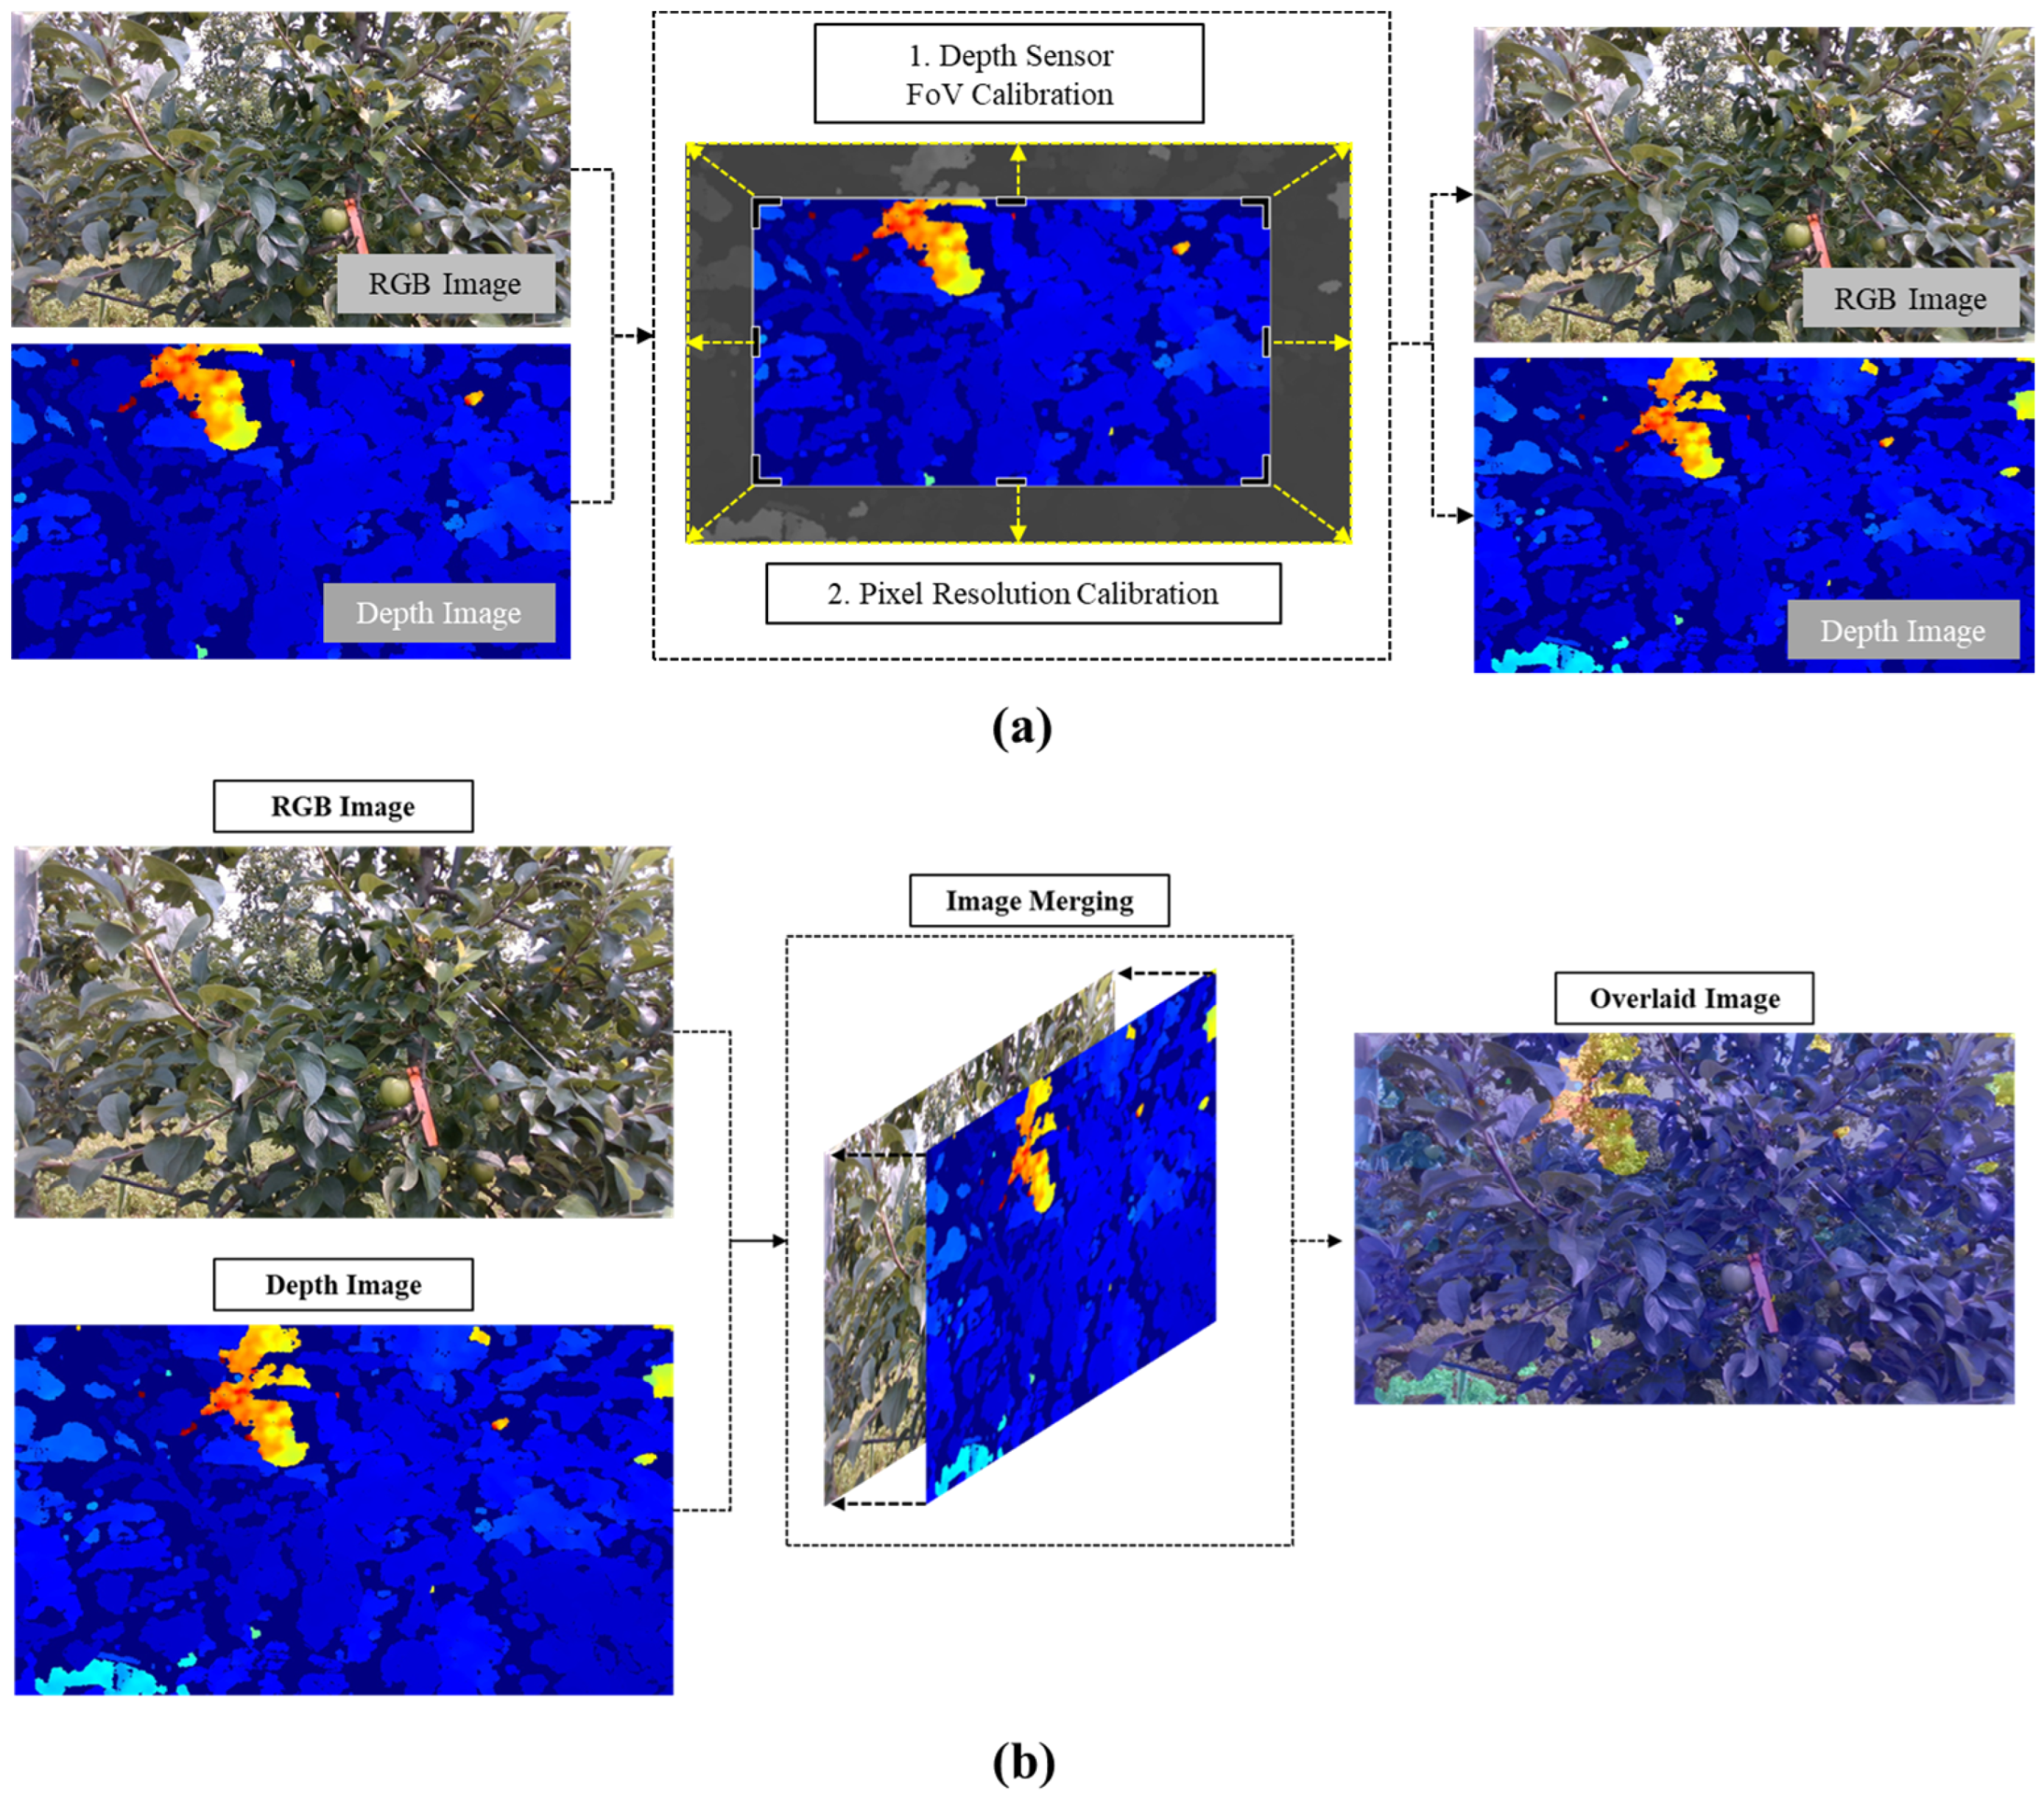
Prior to collecting RGBD images of apples, a calibration process was performed to align the pixel resolution and field-of-view (FoV) between the RGB sensor and 3D depth sensor. The original pixel resolutions of the RGB and 3D depth sensors were 1920 × 1080 and 1280 × 720, respectively, with field-of-view angles of 69.4° × 42.5° × 77° (±3°) and 86° × 57° (±3°), respectively. Since distance information from the 3D depth image is essential for measuring the morphometric information of detected apples, a calibration process was conducted as shown in
Figure 2a to precisely align the pixel coordinates of bounding boxes and masks with the depth image. Consequently, the calibrated pixel resolution and field-of-view for both RGB and depth sensors were set to 1280 × 720 and 69° × 42°, respectively. Furthermore, as illustrated in
Figure 2b, RGB and 3D depth images were merged to create overlaid images, establishing a one-to-one correspondence between each pixel in the RGB image and the 3D depth image to facilitate precise measurement of apple morphometric parameters.
To acquire diverse RGBD images of Hongro apples with various morphometric information, data were collected over three years (2021–2023) at approximately 10-day intervals from early June (about 60 days after full bloom) to mid-September (approaching harvest time), with image capture consistently scheduled between 9:00 and 11:00 AM.
Each apple was labeled with a numbered sticker, designating the sticker side as the back face and the opposite side as the front face, ensuring that the sensor always directly faced the front of the apple during RGBD image capture. By establishing the front face as a consistent reference point, all measurements and data collection were conducted under standardized conditions, minimizing variability between specimens and reducing potential errors in the data collection and analysis processes. Additionally, physical property experiments for diameter measurement and the overall processes of apple detection including morphometric analysis were performed in the same manner to validate the effectiveness of the morphometric parameter measurement algorithm under consistent criteria.
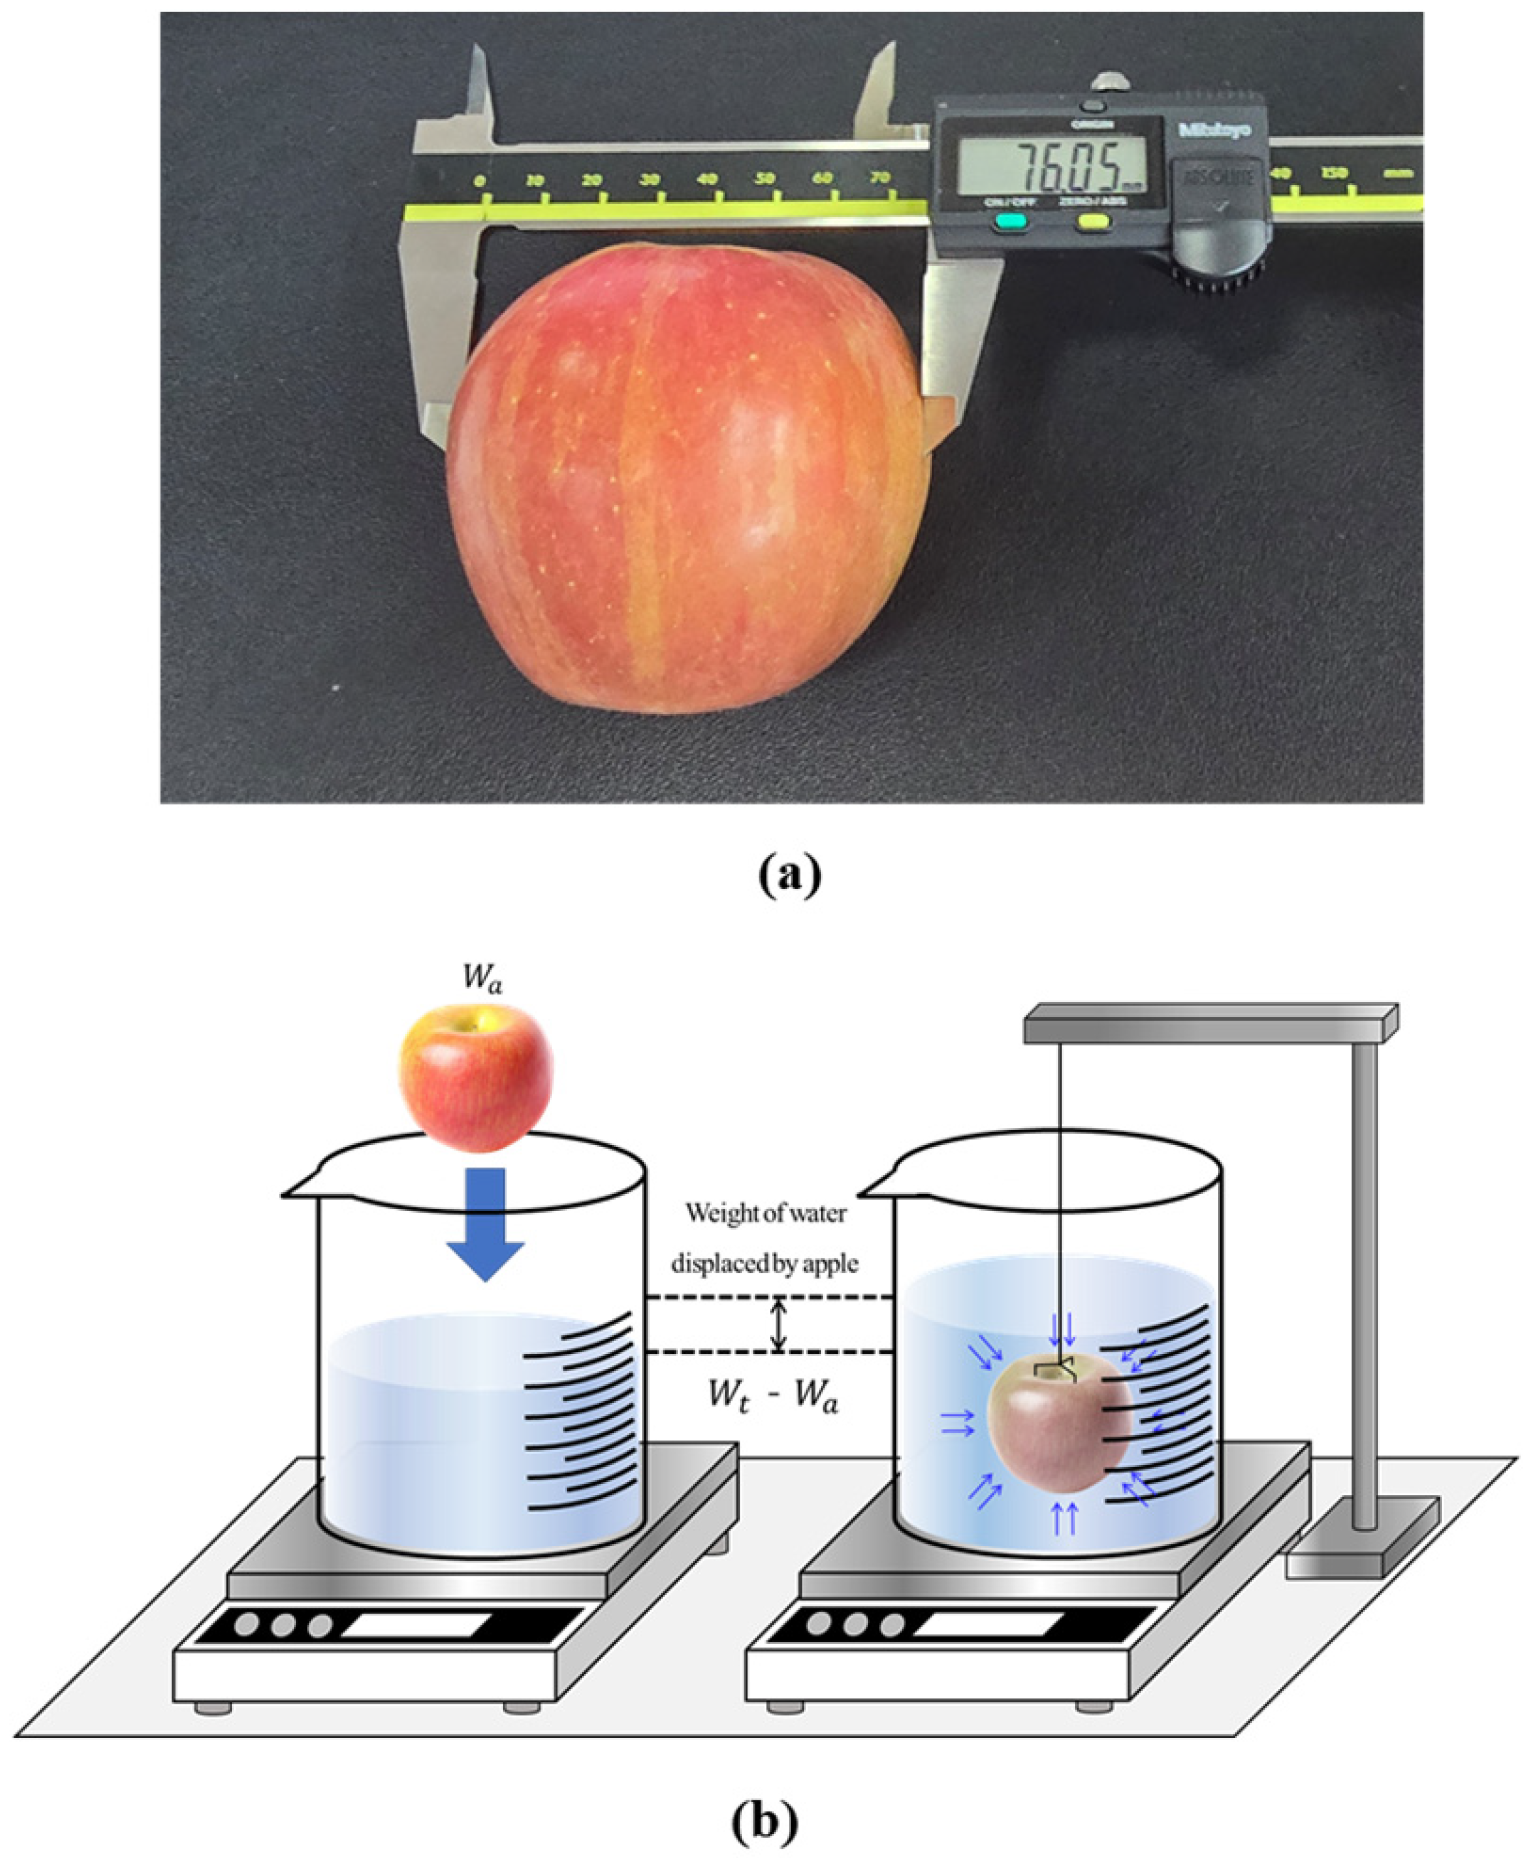
After acquiring RGBD data, 20–30 numbered apples were harvested to obtain reference data through physical property experiments. A vernier caliper (CD-AX/C, Mitutoyo Corp., Kawasaki, Japan) was used to measure the actual diameters (horizontal and vertical) of apples as shown in
Figure 3a, with measurements taken from the front of the apple, opposite to the sticker attached to the back. Additionally, a precision balance was used to collect weight data for each apple by date and number, and as shown in
Figure 3b, water displacement method was applied to obtain volume data. The water displacement method is based on Archimedes’ principle, which states that an object immersed in a fluid experiences a buoyant force equal to the weight of the displaced fluid, and is commonly used to measure the volume of agricultural products with irregular shapes and internal cavities [
27]. First, a precision balance was used to measure the weight of the apple in air (
), and then the scale was tared with a beaker of water. Subsequently, the apple was completely submerged in water using a wire system, and the total weight (
) was measured. To prevent partial cancellation of buoyancy due to contact with the beaker wall, which could result in underestimated measurements, the apple was secured centrally. The volume (V) of each apple was then calculated using Equation (1), assuming a water density (
) of 1 g
.
2.2. Data Preprocessing
Prior to utilizing the acquired RGBD data for deep learning-based detection models, several data preprocessing steps were performed. First, the open-source program Labelimg [
28] was used to designate ground truth for apples, enabling the model to learn the regions of interest for detection. In this study, ground truth for regions of interest was designated in two ways. As shown in
Figure 4a, fruit regions were marked using bounding boxes for training object detection models, and secondly, as illustrated in
Figure 4b, apple ground truth was specified in polygon form for training instance segmentation models.
Additionally, a data splitting process was performed to divide the entire dataset for detection model training. The dataset was divided into training, validation, and test sets in a ratio of approximately 65%, 20%, and 15%, with the training set used for model learning, the validation set for model optimization, and the test set for performance evaluation.
Data augmentation techniques were employed to diversify and expand the dataset. RGBD data of apples captured in open-field environments are susceptible to varying brightness levels, shadow formation, and surface light reflections due to diverse lighting conditions and capture angles. Therefore, as shown in
Figure 5, various augmentation techniques related to lighting environments and image brightness were applied. First, random brightness adjustment methods were utilized to arbitrarily increase or decrease image brightness, simulating various lighting conditions to improve apple detection rates in field environments. Contrast adjustment was employed to enhance or weaken luminance differences, enabling simulation of diverse environments. Color jittering methods were applied to randomly alter the overall color of images, including variations in brightness, contrast, and saturation, allowing the model to learn color changes under different lighting conditions. Additionally, other data augmentation techniques related to lighting environment changes, such as gamma correction and random grayscale conversion, were implemented. Image blurring, which blurs images or reduces resolution, and random scaling, which randomly alters image size, were also applied to enhance detection model performance.
2.3. Detection Modeling for On-Tree Apples
There are various types of deep learning-based fruit detection models using RGB images, with object detection methods based on bounding boxes and image segmentation methods based on masks being the most representative approaches. Object detection methods identify and classify individual objects by designating their positions within images using rectangular bounding boxes. This approach has been implemented through various technologies, ranging from classical algorithms utilizing HOG (Histogram of Oriented Gradients) and SVM (Support Vector Machine) or applying DPM (Deformable Part Models), to contemporary deep learning models such as Region-based Convolutional Neural Network (R-CNN), YOLO (You Only Look Once), and SSD (Single Shot MultiBox Detector).
Mask-based image segmentation approaches are primarily divided into two categories: semantic segmentation and instance segmentation. In this study, instance segmentation was applied rather than semantic segmentation to individually detect and analyze each apple’s growth metrics. Unlike semantic segmentation which only classifies pixels by object type, instance segmentation differentiates between separate objects of the same category, allowing for precise identification and measurement of individual apples even when multiple fruits appear close together in the image. This allowed for independent recognition and analysis of each apple as a discrete object, facilitating the measurement of horizontal diameter, vertical diameter, volume, and weight for individual specimens. For model training and evaluation, this study utilized platforms including Tensorflow (ver. 2.1) object detection API [
29], YOLO [
30] and Detectron2 [
31].
2.3.1. Object Detection Modeling Based on Bounding Boxes
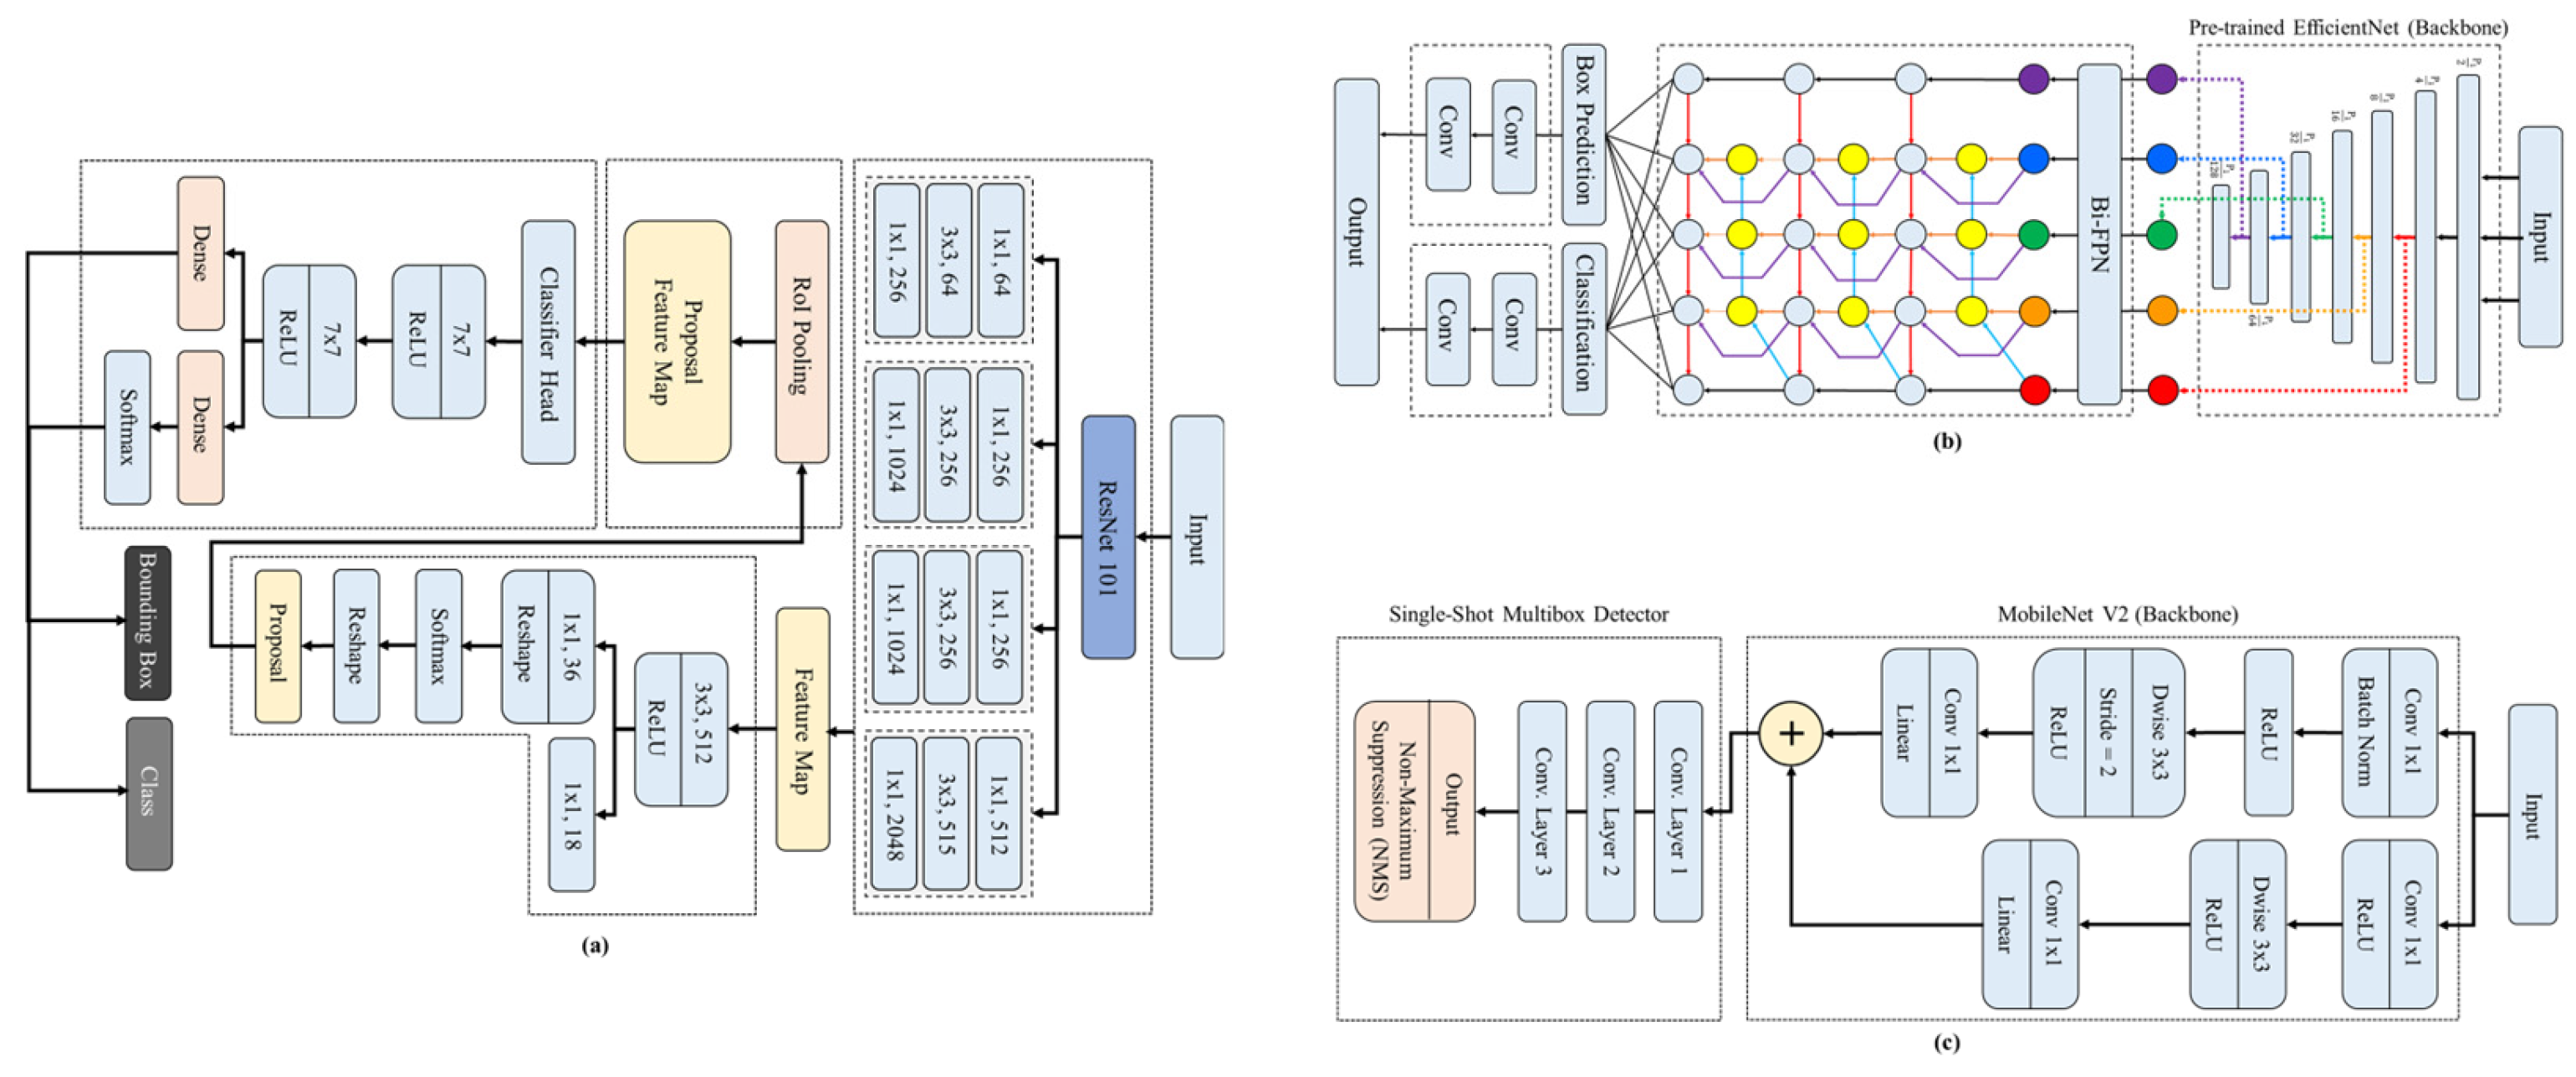
Convolutional neural network-based object detection networks are composed of combinations of meta-architectures such as Faster R-CNN, SSD, and R-FCN, along with feature extractors or backbones such as AlexNet, MobileNet, and ResNet. As model performance varies significantly with different combinations of meta-architectures and feature extractors, it is necessary to compare the performance of various combinations to select the optimal model. Therefore, this study tested diverse meta-architectures and backbones to compare detection accuracy and inference speed, thereby evaluating the performance of each detection model. This study adopted three object detection models: Faster R-CNN ResNet101, EfficientDet D4, and SSD MobileNet V2, and
Figure 6 illustrates the hyperparameter settings and simplified architectures of each model applied in this study.
Faster R-CNN incorporates a Region Proposal Network (RPN) that enables efficient region proposals by directly generating candidate regions from feature maps [
32]. The Region Proposal Network scans feature maps using a sliding window approach and evaluates the possibility of object presence at each position to provide appropriate anchor boxes, allowing Faster R-CNN to perform both region proposals and object detection simultaneously within a single unified network. Additionally, it efficiently detects and distinguishes apples or other fruits of various sizes and shapes with high accuracy, does not require numerous conventional region proposal techniques, and can reduce processing time by rapidly proposing regions through the Region Proposal Network. For these reasons, this study adopted the Faster R-CNN model, with
Figure 6a presenting the hyperparameter settings and overall structure of the model.
The second object detection model applied was the one-stage EfficientDet D4, which uses EfficientNet [
33] as its backbone network, with a brief structure presented in
Figure 6b. EfficientDet was developed with the goal of maximizing performance while reducing model size and proposes a method that easily and quickly fuses features by utilizing a Bi-directional Feature Pyramid Network (BiFPN), an improvement on the conventional feature pyramid structure. In particular, EfficientDet D4 was applied in this study due to its various advantages suitable for applications requiring both fast processing speed and high detection performance.
SSD (Single Shot Multibox Detector), unlike conventional object detection methods, is a one-stage approach that simultaneously performs candidate region generation, classification, and bounding box regression in an image. It detects objects at various scales using different sizes of bounding boxes, which significantly enhances inference speed. MobileNet V2 is a lightweight convolutional neural network model developed for mobile and embedded systems that, as shown in
Figure 6c, reduces computational requirements and improves efficiency by utilizing depthwise separable convolutions (Dwise). Additionally, SSD applies Non-Maximum Suppression (NMS) to enhance the reliability of final detection results by selecting the highest confidence bounding box among detected duplicates and eliminating the rest. Consequently, SSD MobileNet V2 was applied in this study due to its lightweight network architecture, fast inference speed, and ease of implementation in embedded systems.
2.3.2. Instance Segmentation Modeling Based on Masks
Instance segmentation models identify the contours and shapes of objects within images by segmenting them at the pixel level, focusing on specifically determining object shapes beyond merely locating where objects are situated. In this study, four instance segmentation-based models were applied: Mask R-CNN ResNet 101, YOLO v11, RTMDet, and YOLACT ResNet 101.
Figure 7 shows the key hyperparameter settings and simplified architecture of each model applied in this study.
Mask R-CNN is a model based on the structure of Faster R-CNN, and is actively used for instance segmentation research purposes across various fields [
34]. As shown in
Figure 7a, a mask head was added that predicts instance masks in parallel with the bounding box regression branch for regions of interest generated by Faster R-CNN’s Region Proposal Network. In this study, to efficiently detect apple datasets of various morphometric information, adaptive anchor boxes were introduced instead of using conventional fixed anchor boxes. This approach aimed to enhance the detection performance of the Mask R-CNN model by dynamically adjusting the size and ratio of anchor boxes according to the characteristics of the acquired dataset.
YOLACT (You Only Look At Coefficients) is a deep learning model focused on real-time instance segmentation that, as shown in
Figure 7b, uses deep neural networks such as ResNet 101 as its backbone network to extract image features and generate feature maps [
35]. While both YOLO and YOLACT are designed with the goal of real-time object detection, they differ in that YOLO uses a single neural network structure to simultaneously predict bounding boxes and class probabilities, whereas YOLACT performs instance segmentation by predicting coefficients for proton masks. Proton masks, generated by a sub-network called Protonet within the YOLACT model, are a set of basic masks created from the image’s feature map used to refine object shapes. The predicted coefficients for each object combine with the proton masks to form the final instance segmentation mask. This approach was deemed efficient for performing precise instance segmentation on apples of various sizes while maintaining high-speed processing capabilities, thus it was applied in this study to evaluate its performance.
YOLO (You Only Look Once) is a one-stage model that directly analyzes objects from a single image without segmenting it, using a convolutional neural network [
36]. Unlike previous approaches that combine various preprocessing models and artificial neural networks, YOLO employs a unified model capable of detecting objects at real-time speeds. The YOLO series exists in various versions; this study applied the YOLO v11, with its structure and configuration values presented in
Figure 7c.
In
Figure 7c, CBS represents a block consisting of convolution, batch normalization, and Sigmoid linear unit. Batch normalization includes a process that adjusts data using mean and standard deviation for each mini-batch to increase training speed and provide stability [
37], while Sigmoid linear unit (SiLU) represents the activation function used [
38]. Here, k = 3 indicates that the kernel size is 3, meaning the filter size in the convolution operation is 3 × 3. The value s = 2 represents the stride, determining how much to move across the input space when applying convolution, while
p = 1 denotes the padding value, indicating the number of pixels added to the input periphery during convolution operations. C3K2 is a module that helps extract additional features from some feature maps after dividing them into two groups based on CSPNet, and C3k = False indicates that certain operations or default parameter settings within the C3K2 block are ignored [
39]. Additionally, SPFF is a block combining Spatial Pyramid Pooling and Feature Fusion, forming a multi-layered pyramid structure that covers various spaces by generating fixed-size feature maps and pooling images in a segmented form [
40]. Concatenation is an operation that combines multiple tensors, merging various feature maps into a single feature map for use as model input [
41], while Upsampling represents a block that performs operations to increase the spatial resolution of images or feature maps.
The fourth instance segmentation model applied was RTMDet. RTMDet (Real-Time Model for Detection) is designed to maximize computational efficiency through a lightweight network structure while delivering optimal detection performance with minimal resources [
42], as structured in
Figure 7d. Notably, RTMDet provides lightweight precision tuning capabilities to satisfy various precision requirements, allowing users to flexibly adjust the balance between model complexity and performance according to application environments. The backbone network of RTMDet is designed to be suitable for recognizing apples of various shapes and colors, and particularly through the introduction of computation techniques optimized for external environments such as SPD-Conv (Spatially Separable Depthwise Convolution) and CSP-Slim (Cross Stage Partial Slim) [
39,
43], this model was adopted based on the assessment that it could effectively process features under various lighting conditions in field environments.
In this study, the performance of apple instance segmentation was analyzed and compared using these four models. The performance evaluation of each model utilized Average Precision (AP) as a metric. This is calculated by integrating the precision-recall curve, which is universally applied for model performance evaluation, where precision and recall are defined by Equations (2) and (3), respectively. The precision-recall curve illustrates the relationship between precision and recall according to changes in the model’s threshold, where
TP (True Positive) represents the number of correctly detected apples,
FP (False Positive) represents the number of incorrectly detected apples, and
FN (False Negative) represents the number of actual apples that were not recognized. Additionally, the accuracy of detection results is determined based on the threshold value of the Intersection over Union ratio. The Intersection over Union ratio serves as a metric measuring the overlapped region between predicted bounding boxes and masks and actual bounding boxes and masks. In this study, the accuracy of each model was evaluated using average precision when the Intersection over Union ratio threshold values were 0.5 and 0.75.
2.4. Morphometric Analysis of Apples Based on 3D Depth Imaging
2.4.1. Morphometric Analysis Based on Object Detection Models
Among the object detection and instance segmentation models applied in this study, the model with the highest average precision was adopted to estimate the morphometric information of field-grown apples. First, the horizontal and vertical diameters of the fruit were estimated using the bounding boxes acquired through object detection, and analyzed by linking each fruit’s position coordinates with 3D depth information.
During the model evaluation process using the test dataset, the relative coordinates (x, y) of all bounding boxes within the image and the confidence of each bounding box were separately extracted and saved. Only bounding boxes with confidence scores of 0.7 or higher were selected to measure morphometric parameters more accurately. Additionally, each bounding box’s relative coordinates (x, y) were aligned with the 3D depth image to ensure that the bounding boxes were applied at identical positions in the three-dimensional depth map. As shown in
Figure 8, the horizontal and vertical diameters of apples were calculated based on Equations (4) and (5), utilizing the depth information of each bounding box’s center and endpoints, along with the focal length of the RGBD sensor.
Figure 9 illustrates the overall process of the algorithm for calculating apple diameters using object detection results.
Figure 8.
Deriving the actual diameter (horizontal and vertical) of the apple fruit by applying the triangular proportional method of the sensor’s focal length and depth information.
Figure 8.
Deriving the actual diameter (horizontal and vertical) of the apple fruit by applying the triangular proportional method of the sensor’s focal length and depth information.
Figure 9.
Overall process of apple morphometric analysis algorithm using the results of object detection model.
Figure 9.
Overall process of apple morphometric analysis algorithm using the results of object detection model.
In Equations (4) and (5), R (right) represents the x-coordinate of the right end of the bounding box, L (left) represents the x-coordinate of the left end, B (bottom) represents the y-coordinate of the bottom of the bounding box, T (top) represents the y-coordinate of the top of the bounding box, and F (focal length) refers to the focal length of the RGBD sensor.
2.4.2. Morphometric Analysis Based on Instance Segmentation Models
To predict the volume and weight of apples, machine learning-based non-linear regression models were employed, with the horizontal and vertical diameters and area values measured based on instance segmentation masks set as input variables to predict the target variables of volume and weight.
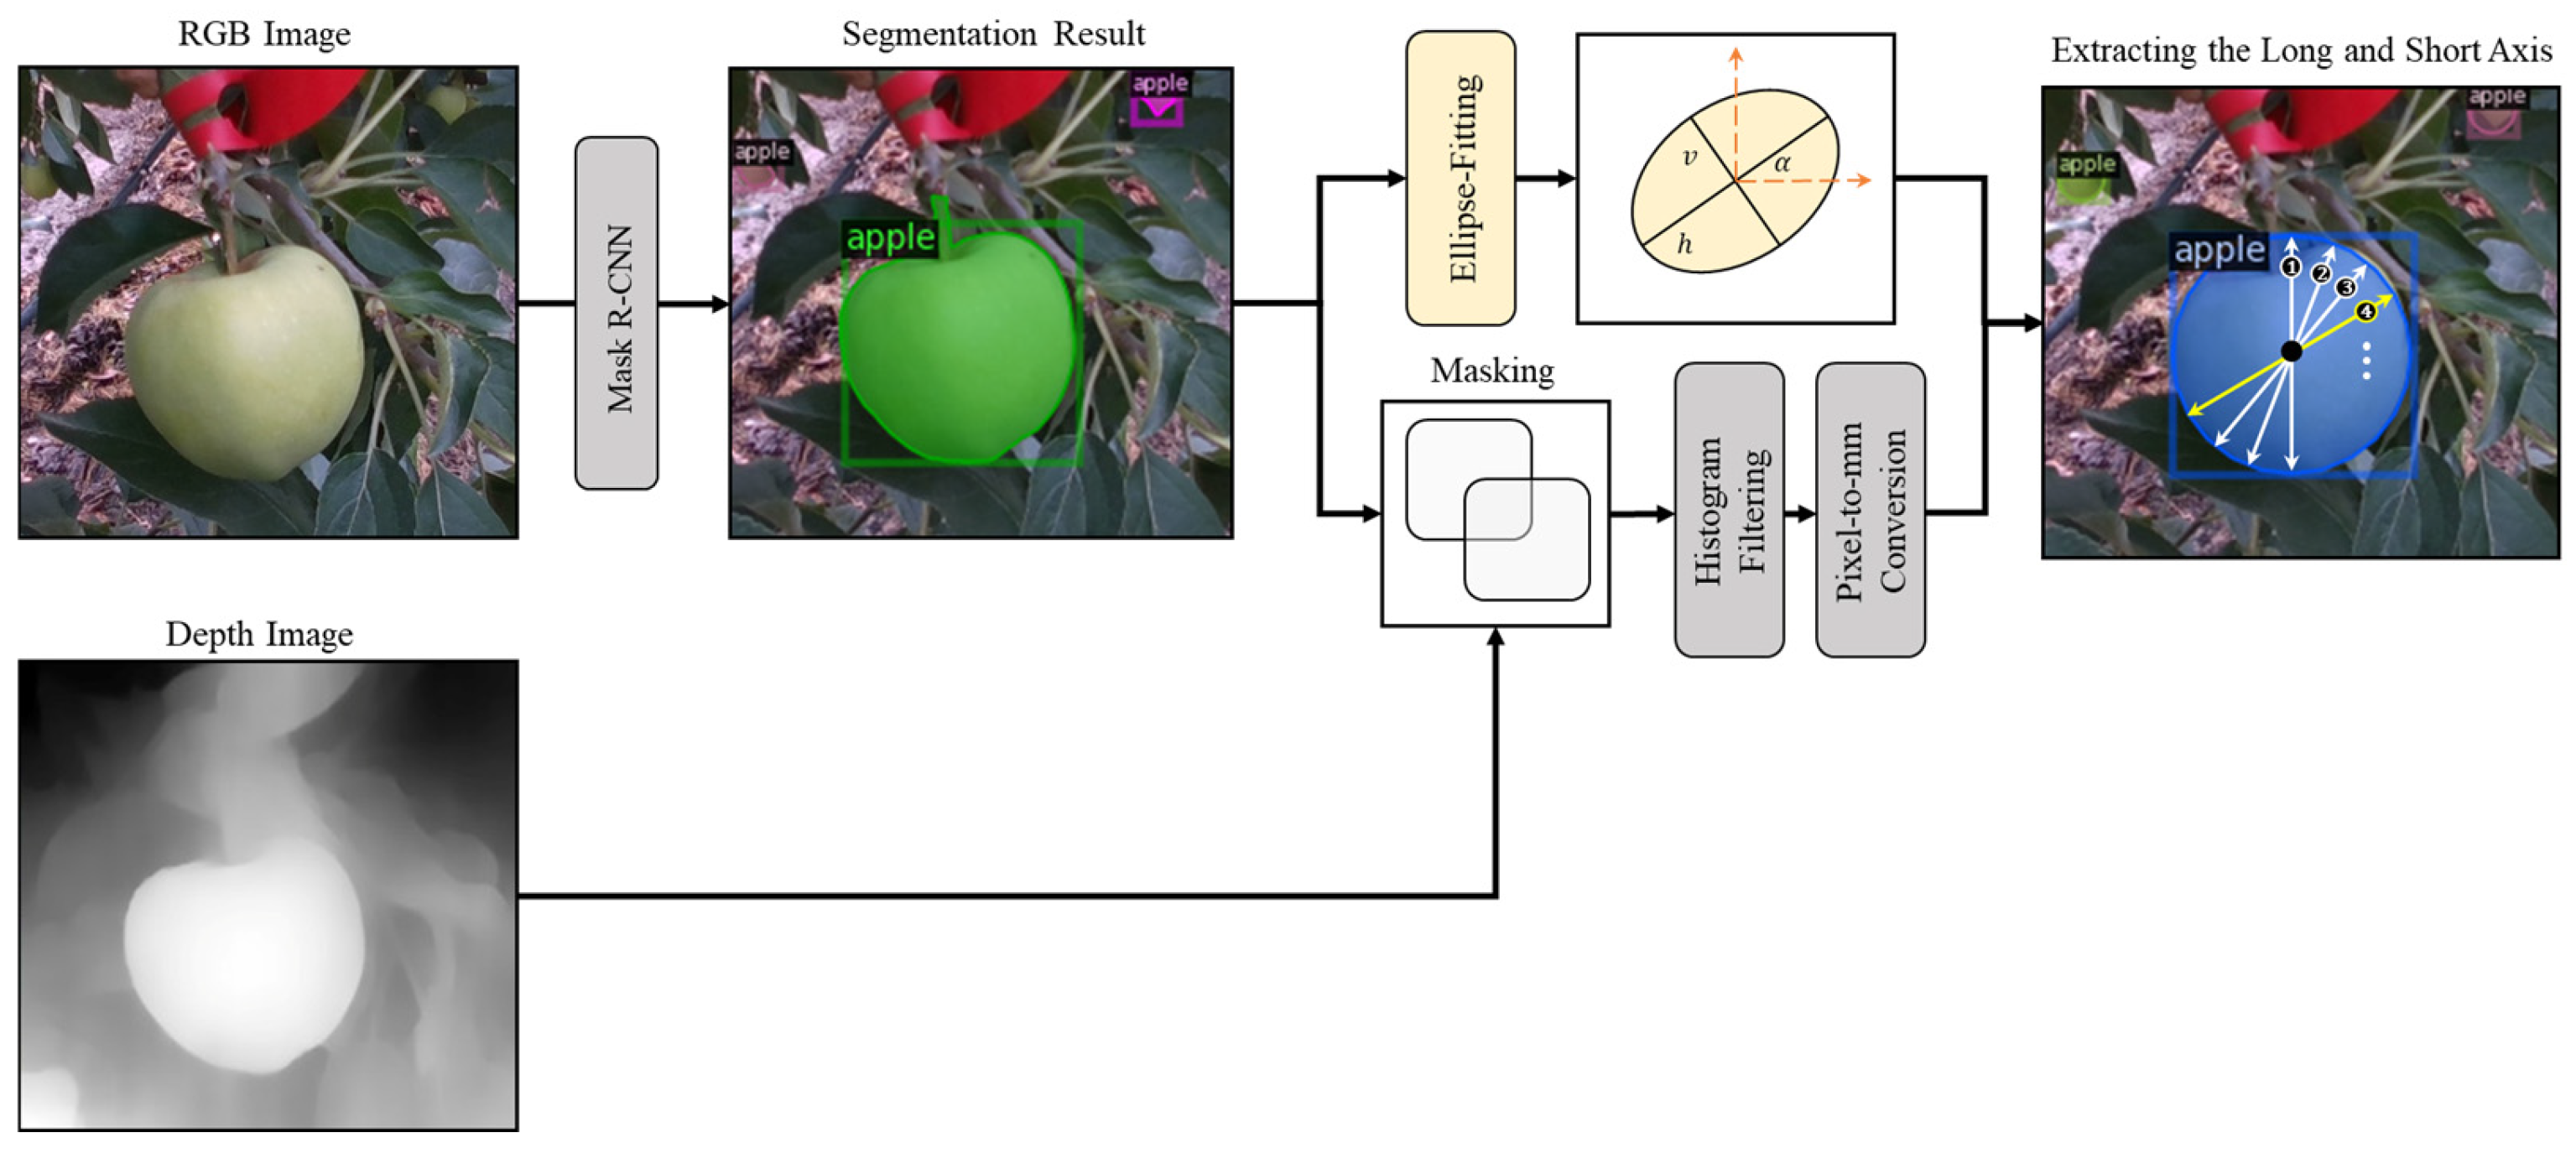
For apple diameter measurement, an ellipse-fitting method was applied, assuming apples are approximately elliptical in shape [
44]. Ellipse-fitting method was chosen because apples typically exhibit elliptical rather than perfectly circular cross-sections when viewed from different angles. This approach accommodates the natural variation in apple shapes while providing a mathematically consistent framework for analysis.
Figure 10 illustrates the overall process of fitting apples to ellipses. First, the pixel contour of the mask produced by the Mask R-CNN ResNet101 model was extracted. From this contour, a convex hull shape—representing the minimal convex polygon enclosing the given mask set’s contour—was obtained. The ellipse-fitting process was then performed by applying the hyper least squares method to these convex hull contour points [
45]. Subsequently, numerous diameters were measured from the center of the ellipse, designating the largest value as the major axis and the smallest value as the minor axis. Additionally, a pixel-to-mm ratio was calculated using the coordinates of the mask and pixel-specific depth information to convert the major and minor axes of the ellipse from pixel units to actual units (mm).
For surface area measurement, apples were not assumed to be elliptical; instead, the actual mask information obtained from the instance segmentation model results was used. This approach was implemented to establish diversity in input variables for the machine learning-based non-linear regression model, enabling complex non-linear relationships between variables. It was determined that this would allow the model to learn more diverse patterns, thereby contributing to enhanced predictive performance. Additionally, the actual mask information was applied to prevent model overfitting to specific datasets, helping to find generalized patterns that would also fit new data, and increasing the likelihood of capturing central patterns while disregarding complex variables and noise present in field environments. In addition, the surface area of apples was defined as the sum of mask pixels obtained from instance segmentation results, and similarly converted to actual units (mm2) using 3D depth information for each pixel.
Machine learning-based non-linear regression models were employed to predict the volume and weight of apples. The previously calculated major axis, minor axis, and surface area values of apples were set as input variables, aiming to estimate non-linear relationships between these variables to obtain appropriate estimates for various shapes and sizes of apples.
Polynomial Kernel Support Vector Regression (SVR) was utilized as the non-linear regression model. The polynomial kernel helps map data to a higher-dimensional space, enabling linear separation of non-linear relationships in the input data. Generally, the kernel function k is given in the form of Equation (6) [
46]. Here,
and
represent input vectors,
denotes the dot product between the two vectors,
is a scaling constant used to adjust non-linear transformations of the dot product, and
represents the degree of the polynomial that determines the complexity of the kernel. In this study, the major axis
, minor axis
, and area
were set as input variables, defined as vector
, and applied to Equation (7) to predict the target output values of volume and weight. The term
represents the vector values of each apple used for model training,
and
are weights indicating how much each data point influences the decision boundary,
represents the total number of apples included in the training dataset, and
denotes the bias term determined during the training process.
Various data preprocessing steps were performed to enhance model performance and learning efficiency. Among feature scaling methods, max-min normalization was applied to adjust the data range between 0 and 1, equalizing the importance of each variable while maintaining the proportions across all input variables. Furthermore, Principal Component Analysis (PCA) was applied to reduce dimensionality and prevent overfitting, and the entire dataset was divided into training, validation, and test sets through data splitting.
GridSearchCV [
47] was utilized during SVR modeling to apply hyperparameters appropriate for the available apple dataset and input variables. In this study, modeling was performed with the polynomial kernel degree
= 3, scaling constant
1, regularization parameter
= 3 (which balances error tolerance and adjusts margin width), and tolerance error
= 11.7 (which sets the degree of error the model can accept). Subsequently, to evaluate model performance, mean absolute error (MAE) and mean absolute percentage error (MAPE) were used as metrics to analyze the accuracy of predicted volume and weight.
2.5. Shape Reconstruction of Occluded Apples
As shown in
Figure 11, when portions of apples are occluded by surrounding branches or leaves, a clear limitation exists in accurately analyzing morphometric parameters because instance segmentation detection only captures the visibly apparent portions of the apple in the image. This limitation applies to both bounding box-based object detection and mask-based instance segmentation models. While this does not pose issues for determining apple counts, the performance of conventional morphometric analysis methods is constrained, making it difficult to obtain reliable dimensional information.
Therefore, this study aimed to measure morphometric information for all detected apples by predicting and reconstructing the shapes of occluded portions of apples. To achieve this, amodal segmentation methods were employed to predict both the visible (modal) regions of occluded apples and their complete shapes (amodal) including occluded areas. The term “amodal” refers to recognizing objects including parts that are occluded or not visible in the field of view. In other words, it is a method of inferring the complete shape of an apple by reasoning not only the visible parts but also the occluded portions [
48]. For this purpose, a convolutional neural network-based ORCNN (Occluded-aware R-CNN) model capable of simultaneously performing modal and amodal instance segmentation was applied [
49].
Figure 12 illustrates the process of detecting apples as near-elliptical shapes and predicting their diameters through the ORCNN model-based amodal segmentation method.
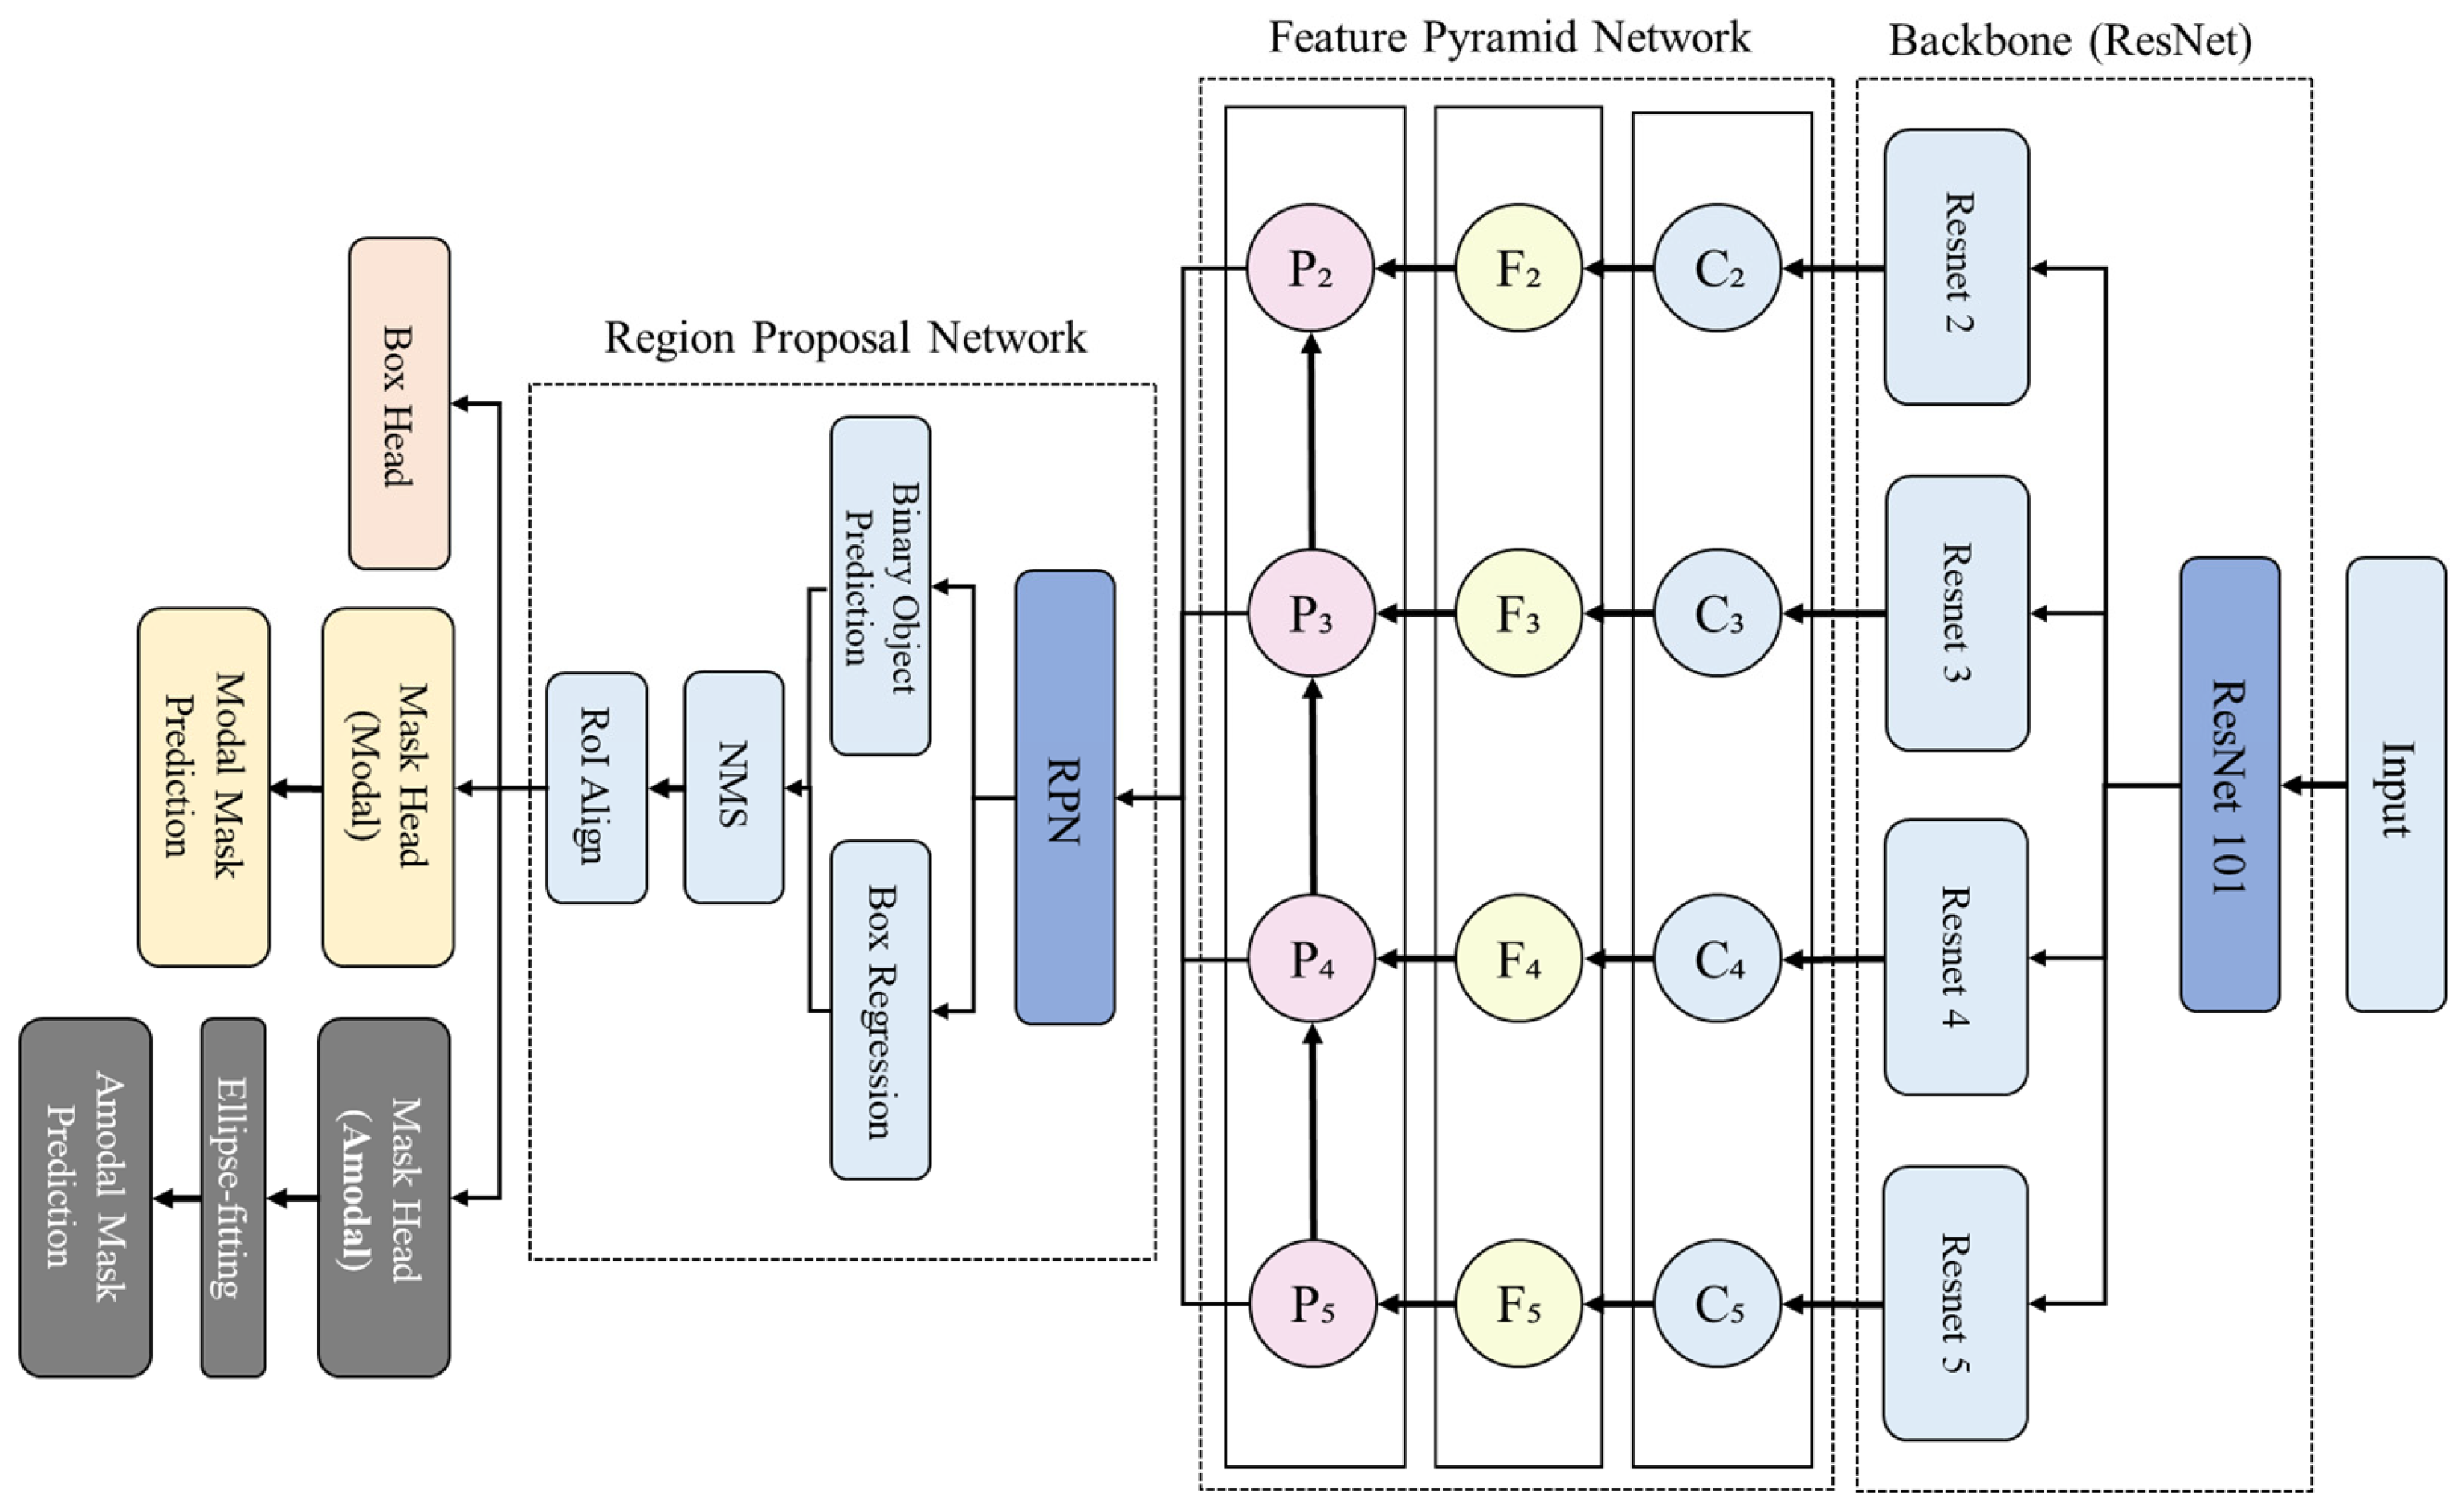
As shown in
Figure 13, ORCNN maintains an identical network structure to the convolutional neural network-based Mask R-CNN, with an additional mask head for performing amodal instance segmentation, enabling simultaneous execution of both modal and amodal segmentation. Furthermore, to measure morphometric parameters using the mask information obtained from amodal segmentation results in the same manner as the conventional method, ellipse-fitting was applied as a pre-output stage for amodal masks, ensuring that the amodal mask shape would be output as a near-circular ellipse.
3. Results and Discussions
3.1. Data Acquisition
An amount of 2900 images were collected for 340 numbered apples in 2021, 3200 images for 440 apples in 2022, and 1220 images for 190 apples in 2023. In total, approximately 7320 RGBD images of 970 apples were acquired. After RGBD image capturing, apples were harvested to measure their actual horizontal and vertical diameters, weight, and volume by date and number. Consequently, reference data for 970 numbered apples were acquired and analyzed by date. The reference data were classified into training, validation, and test sets in a ratio of approximately 65%, 20%, and 15%, respectively, for use in the verification process of deep learning-based apple detection models. The minimum, maximum, mean, and standard deviation of horizontal diameter, vertical diameter, volume, and weight in each dataset were analyzed as presented in
Table 1.
3.2. Development of Apple Detection Models
3.2.1. Object Detection Results Based on Bounding Boxes
Table 2 presents the performance results of the three object detection models used in this study. The EfficientDet D4 model demonstrated the best overall performance with detection accuracies of 98.28% and 92.05% at IoU thresholds of 0.5 and 0.75, respectively, while maintaining a reasonable inference time of 121.08 ms per image. Although the Faster R-CNN ResNet101 model showed slightly higher accuracy (98.46%) at IoU threshold 0.5, its performance decreased at higher IoU threshold (88.90% at IoU 0.75) and required longer processing time (235.10 ms). The SSD MobileNet V2 model achieved the fastest inference speed (51.67 ms) but with lower detection accuracy (95.31% and 87.36% at IoU thresholds of 0.5 and 0.75).
Figure 14 shows detection results from the EfficientDet D4 model, which demonstrates robust apple detection capabilities in field conditions. It was determined that the model’s effective use of the EfficientNet backbone, which optimizes both accuracy and computational efficiency through compound scaling, and the Bi-directional Feature Pyramid Network (BiFPN) that enhances feature fusion across different scales, contributed to the best performance for apple detection.
These findings are consistent with prior agricultural imaging studies where model selection balances detection accuracy with computational efficiency. The 3.69% improvement in AP_75 achieved by EfficientDet D4 over Faster R-CNN has practical significance in automated harvesting systems, potentially reducing missed detections while maintaining sufficient processing speed for real-time applications. Similar studies have reported comparable detection rates [
50,
51,
52], but EfficientDet’s performance in variable lighting conditions makes it particularly valuable for field applications.
3.2.2. Instance Segmentation Results Based on Mask Information
Table 3 presents the performance results of the four instance segmentation models used in this study. The Mask R-CNN ResNet 101 model demonstrated the highest AP_50 accuracy (92.06%) but required the longest processing time (313.30 ms). YOLO v11 achieved the highest AP_75 score (80.91%) with moderate inference speed (185.14 ms). YOLACT ResNet 101 and RTMDet showed lower detection accuracies but faster processing times, with YOLACT achieving 87.21% and 70.42% at IoU thresholds of 0.5 and 0.75, respectively, and RTMDet recording 84.93% and 68.99%.
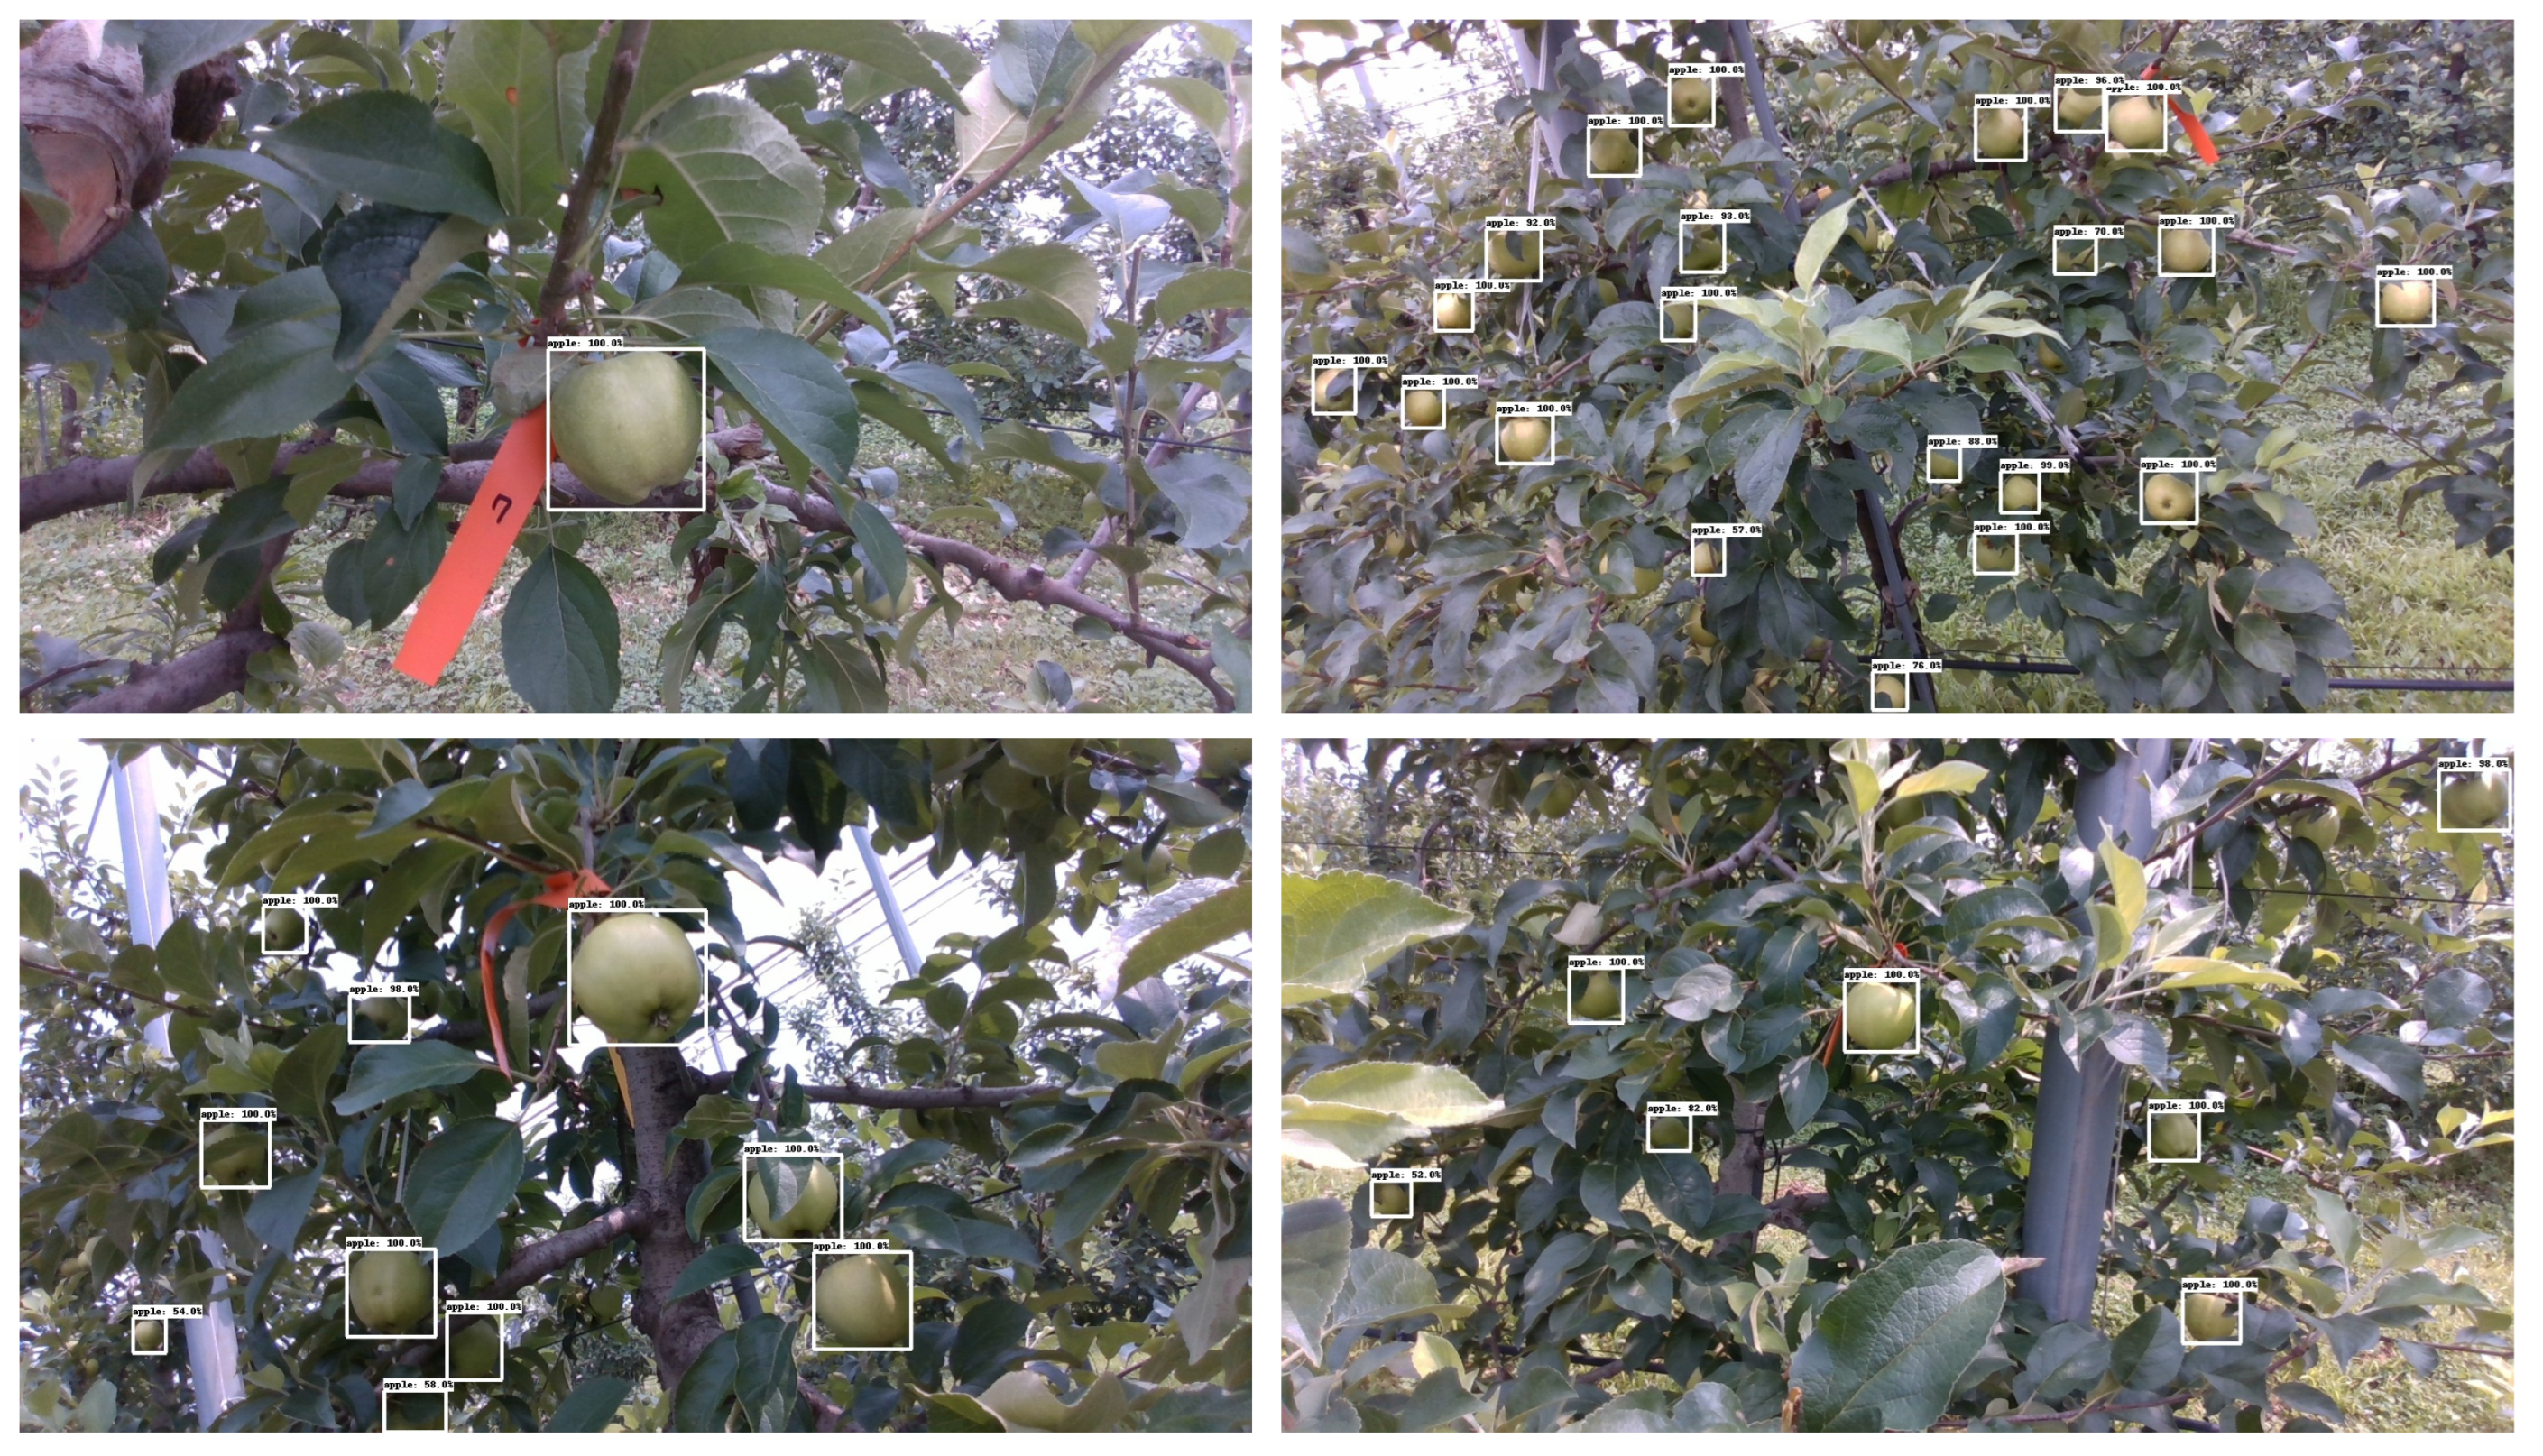
Notably, despite RTMDet’s relatively low detection performance (84.93%), it demonstrated precise extraction of apple contours through effective feature extraction under various lighting conditions, attributed to computation techniques optimized for external environments, such as SPD-Conv and CSP-Slim. YOLO v11 showed excellent robustness against noise and environmental factors, consistently extracting accurate apple contours in challenging field conditions, as shown in
Figure 15. It was determined that YOLO v11’s advanced architectural design incorporated improvements specifically suited for detecting apples with variable sizes and shapes in complex backgrounds. While its AP_50 score was slightly lower than Mask R-CNN ResNet 101, YOLO v11 balanced speed and accuracy more effectively than other models for practical field applications.
3.3. Development of Morphometric Analysis Technique
3.3.1. Morphometric Analysis Based on Object Detection Models
Figure 16 shows an example of horizontal and vertical diameter prediction results, with the apple’s horizontal diameter (width of the bounding box) indicated at the top of the bounding box and the vertical diameter (height of the bounding box) indicated on the left side. However, one limitation exists in predicting the diameter of apples based on bounding boxes. As shown in
Figure 16b, when apples are tilted in images, the predicted horizontal and vertical diameters can show significant errors compared to actual values, as this method measures the apple’s horizontal and vertical diameters using the width and height of the bounding box. Additionally, since other morphometric parameters such as weight or volume cannot be measured using only bounding box information, it was determined that there would be limitations in its application to actual agricultural environments.
For validation of diameter predictions, data from 776 apples without occluded areas were used from among the 970 apple datasets.
Table 4 presents the analysis results of MAE, MAPE, and inference speed by comparing and analyzing the predicted and actual values of horizontal and vertical diameters.
According to
Table 4, the mean absolute error for horizontal diameter prediction was analyzed to be 5.112 mm and 3.363 mm for vertical diameter, with mean absolute percentage errors confirmed at 6.201% and 5.164% for horizontal and vertical diameters, respectively. These results demonstrated somewhat higher performance compared to existing studies related to diameter prediction through deep learning-based apple detection [
52,
53].
3.3.2. Morphometric Analysis Based on Instance Segmentation Models
As shown in
Table 5, MAE and MAPE values were analyzed by comparing the measured and actual values of major axis, minor axis, volume, and weight. For the 776 apples without occluded areas, the mean absolute error for horizontal diameter was 4.570 mm and 3.179 mm for vertical diameter, with mean absolute percentage errors analyzed at 5.667% and 4.921%, respectively. These figures are lower than those for horizontal and vertical diameters measured based on bounding boxes, showing error rates 0.534% and 0.243% lower for horizontal and vertical diameters, respectively. While predicting diameters based on bounding boxes, errors tended to increase with increasing apple tilt, utilizing mask information demonstrated that apple tilt did not affect error, suggesting that masks could provide more detailed information than rectangular bounding boxes by more accurately reflecting the actual shape of apples.
Analysis of volume and weight for all 776 apples showed mean absolute errors of 33.401 mm3 and 27.280 g, respectively, with mean absolute percentage errors analyzed at 7.183% and 6.571%, respectively. For volume and weight estimation, relatively higher MAPE values compared to horizontal and vertical diameter predictions were confirmed, as horizontal and vertical diameter values calculated through the application of ellipse-fitting techniques were set as input variables for the polynomial kernel SVR.
The improved accuracy of mask-based approaches over bounding box methods shown in this study has significant implications for precision agriculture applications. The achieved accuracy levels (MAPE of approximately 5–6% for diameters and 6–7% for volume and weight) represent an improvement over previous research reporting error rates of 8–12% for similar applications. This enhancement is particularly valuable in commercial settings where size-based grading directly impacts market value. The mask-based approach’s resilience to fruit orientation variability also addresses a limitation noted in previous studies that required consistent camera positioning.
3.4. Shape Reconstruction Results of Occluded Areas
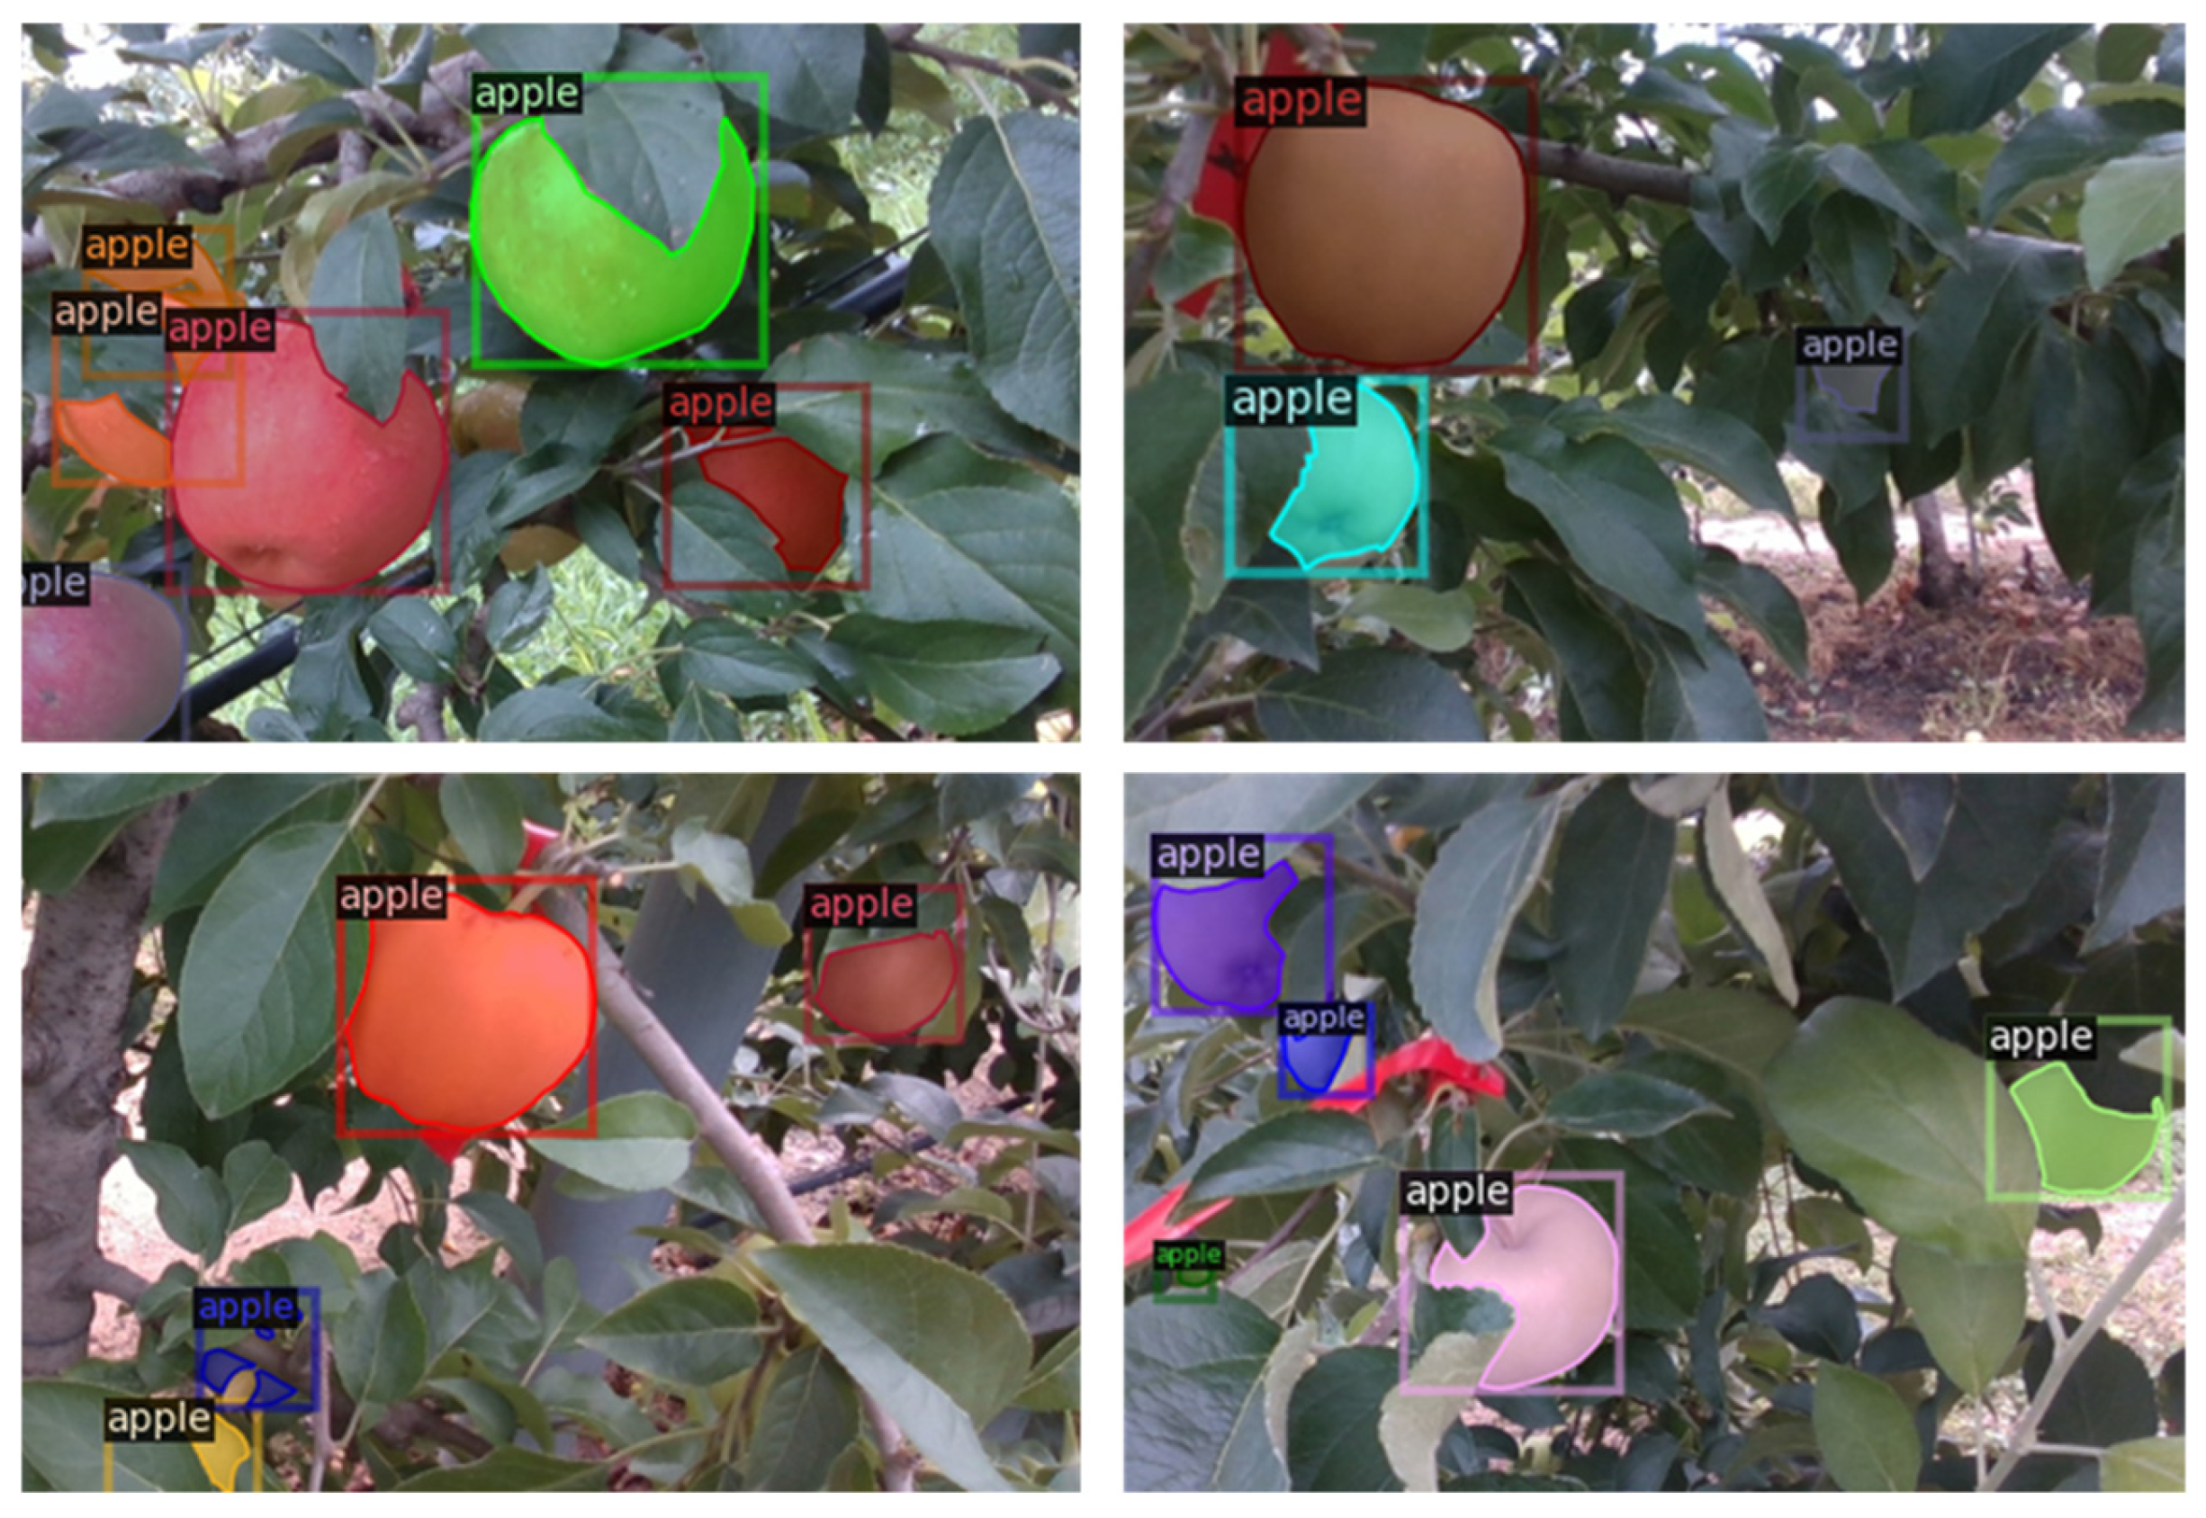
Figure 17 presents the instance segmentation results of the Mask R-CNN ResNet 101 model alongside the amodal segmentation results of the ORCNN model. As shown in
Figure 17, for the image of an apple with occluded areas on the left, instance segmentation results like those in the upper right were obtained by applying the Mask R-CNN model, while amodal segmentation results as shown in the lower right were acquired by applying the ORCNN model. It can be observed that Mask R-CNN generates masks only for visible regions, excluding parts concealed by leaves or branches, whereas ORCNN predicts the shape of apples with occluded portions and generates circular masks that include these occluded areas.
Using RGBD images of 194 apples with occluded areas and available reference data for morphometric information from the total 970 apple dataset as a test set, the performance of the shape restoration model was validated. As shown in
Table 6 and
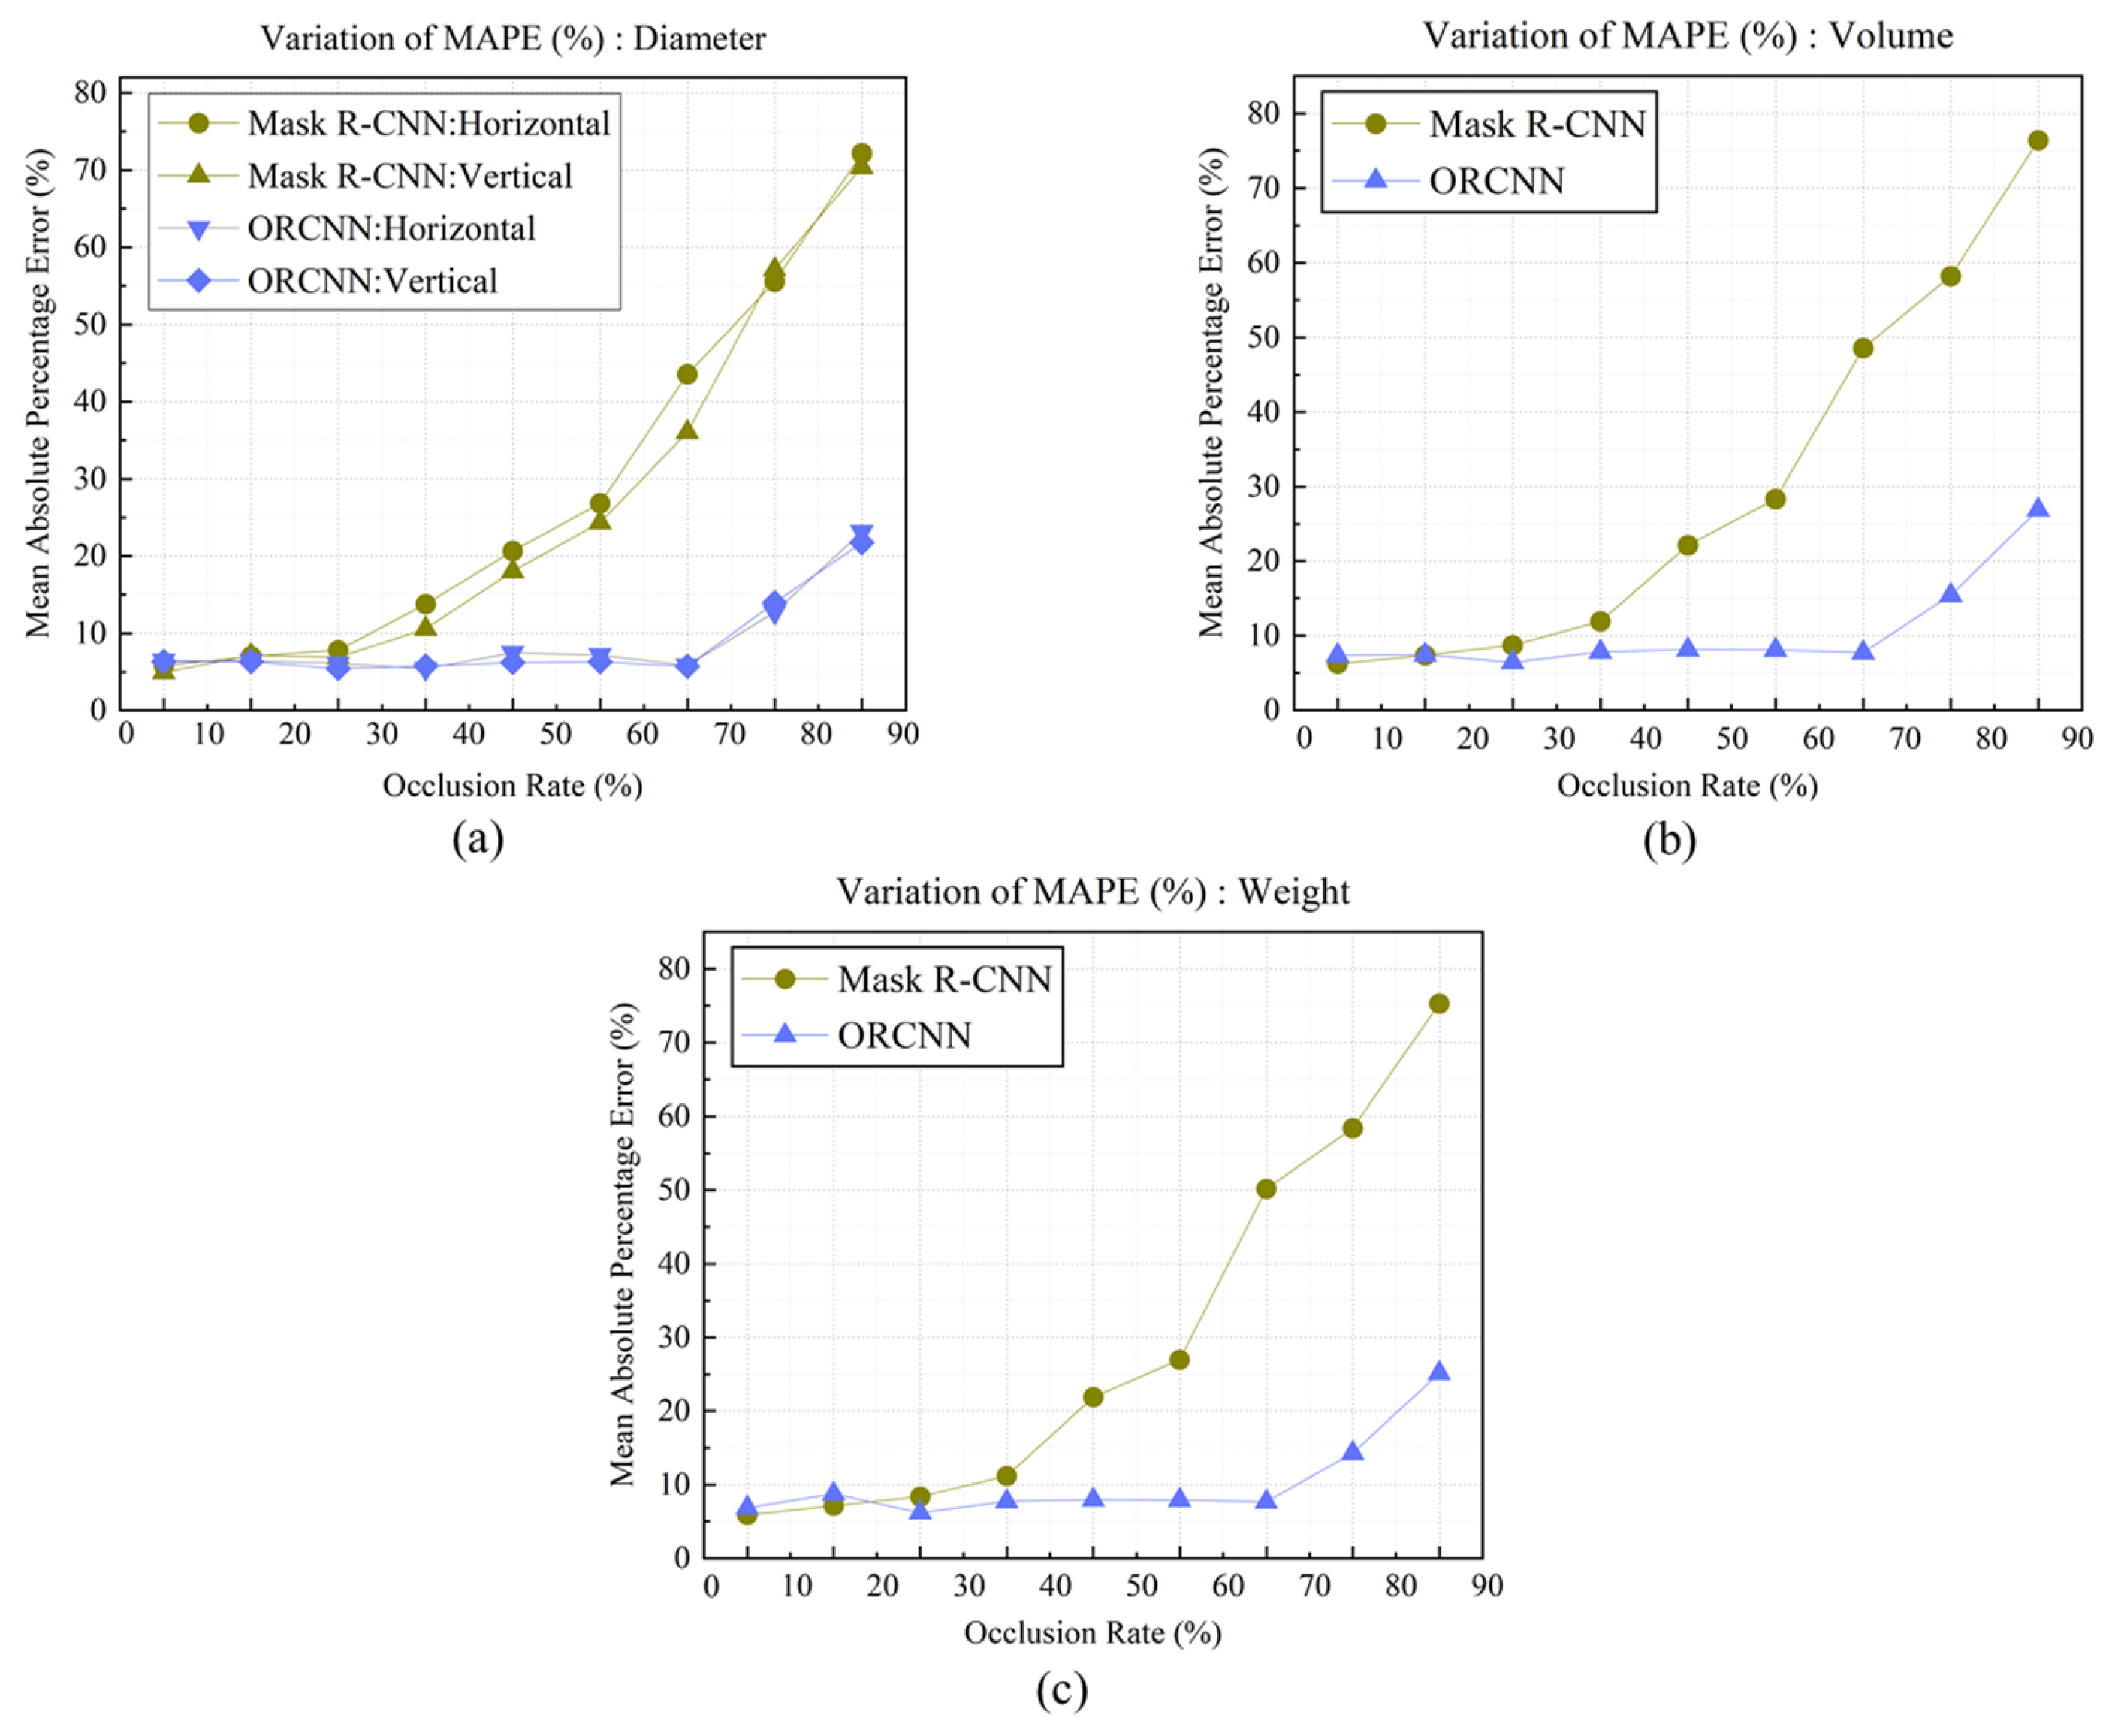
Figure 18, in the case of Mask R-CNN, the mean absolute percentage error for diameter, volume, and weight predictions increased as the occlusion rate increased. For horizontal and vertical diameter predictions shown in
Figure 18a, when the occlusion rate was below 10%, the MAPE was confirmed to be 5.828% and 4.491%, respectively, which was verified to show similar results to the MAPE values of 5.667% and 4.921% for apples without occluded areas. However, as the occlusion rate increased, the mean absolute percentage error also increased, and when the occlusion rate was 80–90%, the MAPE was confirmed to show considerable error rates of 72.159% and 70.387%, respectively. Similarly for volume and weight, as can be seen in
Figure 18b,c, MAPE tended to increase with increasing occlusion rates, with MAPE for volume analyzed to increase from 6.258% to 76.405% and weight from 5.922% to 75.296% as the occlusion rate increased.
When applying shape restoration technology through ORCNN, the mean absolute percentage error increased when the occlusion rate was 10–20% compared to 0–10%; however, for horizontal and vertical diameters, it was found to decrease. As shown in
Figure 18b,c, in the case of ORCNN, the mean absolute percentage error values for volume and weight maintained consistent trends regardless of occlusion rate up to 70%, though error rates tended to increase when the occlusion rate exceeded 70–80%.
Significant differences were confirmed when comparing the mean absolute percentage errors for morphometric analysis between Mask R-CNN and ORCNN. MAPE analysis of all 194 apples revealed that horizontal diameter MAPE was 24.418% and 7.320% when applying Mask R-CNN and ORCNN, respectively, showing a substantial difference of 17.098%. Similarly, for vertical diameter, they were 22.560% and 6.776%, respectively, demonstrating a difference of 15.784%. Likewise, for volume, they were 27.105% and 9.139%, respectively, exhibiting a difference of 17.966%, and for weight, they were analyzed to be 25.817% and 8.554%, respectively, showing a difference of 17.263%.
When measuring morphometric information for apples with occluded areas, it was confirmed that applying shape restoration technology by assuming apples are elliptical enables more accurate prediction. While showing relatively larger values than the mean absolute percentage errors for apples without occluded areas (with some exceptions for certain occlusion rates), there was no significant difference except when the occlusion rate exceeded 70%. This suggests the possibility of measuring morphometric information through shape restoration by assuming apples are elliptical, while simultaneously indicating that more precise measurements will be possible through future advancement of morphometric analysis algorithms.
The implementation of amodal segmentation for occluded fruit analysis represents a significant advancement over conventional approaches that typically excluded or poorly measured occluded fruits. Our ORCNN approach demonstrates remarkable resilience to occlusion, maintaining consistent accuracy up to 70% occlusion rates. This improvement could potentially increase the proportion of assessable fruits by 15–25% in typical orchard conditions where partial occlusion is common, significantly enhancing the economic feasibility of automated assessment and harvesting systems. However, the decreased performance at extreme occlusion rates indicates remaining challenges for future research.
3.5. Implications and Limitations
This study’s integration of 3D depth imaging with deep learning approaches addresses key challenges limiting computer vision applications in orchard environments. The sub-6% MAPE for diameter measurements and sub-8% MAPE for volume and weight predictions meets feasibility thresholds for commercial viability suggested in previous research. Most significantly, the amodal segmentation approach overcomes fundamental limitations in handling partially occluded fruits, enabling more reliable assessment in realistic orchard settings.
Despite these advancements, several limitations exist. The methodology, while promising for other varieties, was validated only on ‘Hongro’ apples. The elliptical shape assumption, though effective, simplifies actual fruit morphology. Additionally, the computational requirements of the more accurate models present challenges for deployment on mobile platforms with processing constraints, necessitating further optimization for integration with real-time harvesting systems.
4. Conclusions
This research set out to develop non-destructive technology for accurate morphometric analysis of field-grown apples to support automated harvest timing decisions. The objectives established at the outset—to detect apples in variable field conditions, measure their morphometric parameters using 3D imaging, and handle partially occluded fruits—have been successfully addressed through the integration of RGBD imaging with advanced artificial intelligence techniques.
The detection challenge in fluctuating light environments was overcome through the evaluation and implementation of multiple deep learning approaches, with EfficientDet D4 and YOLO v11 models proving most effective for detection tasks. These models demonstrated robust performance in the complex orchard environment, establishing a reliable foundation for subsequent morphometric analysis.
The objective of accurate non-destructive measurement was achieved by linking 2D detection results with 3D depth information, enabling precise estimation of apple dimensions without physical contact. The ellipse-fitting method applied to instance segmentation masks provided superior measurement accuracy compared to bounding box approaches, demonstrating how integrating appropriate geometric modeling with AI detection can yield high-precision results in field conditions.
Perhaps most significantly, this research addressed a critical limitation in existing approaches by introducing amodal segmentation techniques for analyzing partially occluded apples. The ORCNN model maintained consistent measurement accuracy regardless of occlusion rates up to 70%, representing a substantial advancement for practical field applications where perfect visibility of fruits is rarely achieved.
These achievements have important implications for agricultural automation, particularly for harvest robotics systems that require reliable size assessment to determine optimal harvest timing. By enabling accurate morphometric analysis even with partial occlusion, this technology helps bridge the gap between laboratory research and practical field implementation.
Future research should address the remaining limitations by exploring multi-angle imaging approaches and applying generative network techniques to further improve occlusion handling across diverse apple varieties and orchard conditions.


 ,
, 


