Article

Effects of Different Planting Years on Soil Physicochemical Indexes, Microbial Functional Diversity and Fruit Quality of Pear Trees

1
Center for Information Technology and Laboratory Management, Wuyi University, Wuyishan 354300, China
2
College of Tea and Food Science, Wuyi University, Wuyishan 354300, China
3
College of Horticulture, Fujian Agriculture and Forestry University, Fuzhou 350002, China
4
College of Resources and Environment, Fujian Agriculture and Forestry University, Fuzhou 350002, China
*
Authors to whom correspondence should be addressed.
Agriculture 2024, 14(2), 226; https://doi.org/10.3390/agriculture14020226
Submission received: 14 January 2024 / Revised: 25 January 2024 / Accepted: 29 January 2024 / Published: 30 January 2024

Abstract

:
This study explores the interaction between pear fruit quality and the soil environment over four different planting years (5, 20, 30, and 40 years), focusing on the fruit’s chemical properties, rhizosphere soil properties, microbial communities, and both microbiomass and functional diversity. The results found that reducing sugar, sucrose, and vitamin C contents in pears initially increased with planting years before declining, while total acidity showed an inverse trend. Analysis of the soil physicochemical index revealed that rhizosphere soil physicochemical indexes were significantly different between different planting years, but there was no obvious regularity. Correlation analysis found that total phosphorus, total potassium, organic matter, and available nitrogen were significantly and positively correlated with pear quality indexes. Soil microbiomass carbon decreased before increasing with increasing planting year, while soil microbial nitrogen was irregular. Results of functional diversity of rhizosphere soil bacterial communities showed that the relationship of carbon source utilization among the six groups was 20 years > 5 years > 30 years > 40 years. Interestingly, the 20-year group had the most core differences in microbial communities. The study suggests that as pear trees age, adequate plant nutrition during peak fruiting periods can improve soil fertility, microbial functional diversity, and ultimately enhance fruit quality.

1. Introduction

Pears have a variety of health benefits, including antimicrobial and anti-inflammatory effects, alleviation of constipation, and reduction of alcoholism, due to their high levels of bioactive compounds [1,2]. The Cuiguan pear (Pomaceae pyrifolia Nakai cv.), a premier hybrid of Xing shui × No. 6 (Hang qing × New century), was bred by the Zhejiang Academy of Agricultural Science and Hangzhou Fruit Research Institute [3]. Over the past several decades, the Cuiguan pear (Pomaceae pyrifolia Nakai cv.) has enjoyed widespread cultivation in southern China, thanks to its advantageous traits, such as early fruiting, rapid growth, high fruit yield, and robust resistance to environmental stressors [4].
In general, many factors can affect pear quality and yield, including water and fertilizer management, floor and canopy management, growing environment, plant health, and planting year, among others [5,6,7,8,9]. Similar to other plants, pear trees release various substances into the soil through their roots, while also absorbing water, minerals, and nutrients. The plant rhizosphere is a zone of active material exchange between roots and soil [10]. This zone hosts a significant rhizosphere microbiome, including microorganisms that inhabit root surfaces and adjacent soil [11]. Recent research has demonstrated that plant root exudate selectively influences the composition of soil-specific microorganisms. Different plants each have unique and representative rhizosphere microbial community structures, with differences attributed to different components and concentrations of root exudate [12,13]. Chaparro et al. [14] revealed that Arabidopsis thaliana root exudate composition and content change significantly at different growth stages and correlate significantly with rhizosphere soil functional gene expression patterns. On the contrary, alterations in the community structure and functional diversity of rhizosphere soil’s microbe can impact plant growth, fruit yield, and quality [15,16]. It is established that the bacterial community in rhizosphere soil serves an indispensable role in root health, nutrient acquisition, and overall plant growth [17,18].
It has been shown that the age of the plant and its physiological status have a significant influence on the composition of rhizosphere bacteria [19,20]. Moreover, by manipulating cultivation techniques that influence the structure of the rhizosphere microbial community, it is possible to regulate the growth and development of fruit trees [21]. However, the interrelationship between rhizosphere soil chemical indexes, microbial communities, and pear quality at different planting years is not known.
In this study, the functional diversity of soil microorganisms, their physicochemical properties, and their relationship with pear quality were investigated in pear trees of different planting years. These results provide a firm scientific foundation for effective soil management strategies to improve pear quality in the future.

2. Materials and Methods

2.1. Experimental Site and Sample Collection

Five healthy “Gui Guan” pear trees were selected from the hilly pear orchard in Xikou Town, Jianning County, Fujian Province, China (116°48′34″ E, 26°50′38″ N), and the rhizosphere soils of the pear trees were collected from different planting years. The management methods of pear trees with different planting years are the same, which are summarized as follows: in addition to regular weeding and localized irrigation (0.5 L/plant/d), soil management applied chemical fertilizers (urea 0.75 kg/plant, potassium sulfate 0.5 kg/plant, fused calcium magnesium phosphate 1 kg/plant) (Stanley Agriculture Group Co., Ltd., Linyi, China) once a year in April, organic fertilizer (waste mushroom tube) 25 kg/plant, and fused calcium magnesium phosphate 2.5 kg/plant in October. The yield of pear trees in different planting years is shown in Table S1.
Samples were collected on 14 July 2022. Five healthy pear trees were randomly selected from different planting years (5, 20, 30, and 40 years). Then, 5–20 cm of soil was dug at the roots of the pear tree, and the rhizosphere soil was collected. The rhizosphere soil samples of 5 pear trees were mixed, divided into two parts, and brought to the laboratory on ice; one part was stored in a freezer (−4 °C) for soil microbiomass carbon and nitrogen determination, and the other part was preserved at −80 °C for Rhizosphere soil microbial community functional diversity determination.

2.2. Determination of the Fruit Quality Index

Fruit was picked in July 2022, and the sampling method was as follows: Five healthy pear trees, each planted in a cardinal direction (east, west, south, north, and central), were selected. Eight fruits were randomly sampled from each tree for quality index determination. The quality indexes included reducing sugar, sucrose, total acid, and vitamin C. Sucrose was determined by the anthrone-based (Sinopharm Chemical Reagent Co., Ltd., Shanghai, China) colorimetric method [22]. The reducing sugar [23] and ascorbic acid [24] were determined by high-performance liquid chromatography (HPLC) (Waters Technology Co., Ltd., Shanghai, China). Total acid was determined by sodium hydroxide (Sinopharm Chemical Reagent Co., Ltd., Shanghai, China) titration [25].

2.3. Soil Physicochemical Index Determination

The soil samples were air-dried and crushed prior to being passed through a 2 mm sieve. Soil physicochemical indexes were determined with reference to Lu [26]. Briefly, available nitrogen included nitrate nitrogen and ammonium nitrogen. Ammonium nitrogen content was determined by Nessler’s reagent (Sinopharm Chemical Reagent Co., Ltd., Shanghai, China), and nitrate nitrogen content was determined by the disulfonic acid reagent (Sinopharm Chemical Reagent Co., Ltd., Shanghai, China). Available phosphorus and total phosphorus contents were determined by molybdenum-antimony colorimetry (Sinopharm Chemical Reagent Co., Ltd., Shanghai, China). The available potassium and total potassium contents were determined by flame photometry. The total nitrogen content was determined by the Kjeldahl method. Organic matter was determined by potassium dichromate-ferrous sulfate titration (Sinopharm Chemical Reagent Co., Ltd., Shanghai, China). The pH was determined by the extraction solution with a water-to-soil ratio of 2.5:1. The soil water content was calculated by drying the soil to constant weight at 100 °C for 48 h. The change in soil weight before and after drying was measured. All measurements were repeated three times.

2.4. Soil Microbiomass Carbon and Nitrogen Determination

Five grams of rhizosphere soil was taken from pear trees of different planting years, and the microbiomass carbon and nitrogen were determined using the chloroform (Sinopharm Chemical Reagent Co., Ltd., Shanghai, China) fumigation/incubation procedure of Li et al. [27].

2.5. Determination of Functional Diversity of Microbial Communities in Rhizosphere Soil

The Biolog EcoPlate method was used to determine the functional diversity of microbial communities in the rhizosphere soil of pear trees [28,29]. The Biolog EcoPlate (BIOLOG, Inc., Hayward, CA, USA) included 31 sole carbon sources, such as carbohydrates, phenolic compounds, carboxylic acids, polymers, amino acids, and amines. The operation method was described in the study of Teng et al. [30]. 10 g of fresh soil was carefully mixed with 90 mL of sterilized 0.85% NaCl solution. The mixture was then thoroughly shaken at a speed of 120 rpm for a duration of 10 min, and then left for 2 min. Next, 5 mL of aqueous supernatant was mixed with 45 mL of sterilized water and diluted to obtain a 1:1000 extract that could be used for subsequent experiments. Using an electronic pipette, 150 μL of aqueous supernatant was meticulously added to each well of the ECO plate, ensuring a uniform distribution. The above BIOLOG microplates were incubated in a culture chamber at 28 ± 2 °C in a dark chamber for 7 days. Each Biolog EcoPlate was assayed for absorbance at 590 nm with an Elisa reader (BIOLOG Company, Hayward, CA, USA) at 0 h of incubation and then every 24 h of incubation. The AWCD (590 nm) values, which represented the metabolic activity of the microbial community, were calculated using the formula established by Choi and Dobbs [28]. The calculations were based on the data from the 72 h incubation period and aimed to provide information about the average well color development [AWCD (590 nm)] of carbohydrates, amino acids, amines, polymers, carboxylic acids, and phenolic compounds for further analysis.

2.6. Data Availability

All data were represented as the mean ± standard error (SE). The SPSS 20.0 program was used to analyze the variance (ANOVA) and the significance of experimental data using the LSD test. Simpson index, Shannon index, and Chao1 were calculated using DPS7.0.5.8. R 2.13.2 (R Development Core Team) software was OPLS-DA (orthogonal partial least-squares discrimination analysis) simulation (ropls and mixOmics), heat map (linkET 0.0.7.1), RDA, and principal component analysis (vegan version 2.6.4).

3. Results

3.1. Fruit Quality Analysis

The content of sucrose, reducing sugar, and vitamin C in the fruits of 20- and 30-year-old pear trees were significantly greater than those of 5- and 40-year-old pear trees (p < 0.05), but the difference between 20- and 30-year-old pear trees was not significant (Table 1). Furthermore, the content of sucrose, reducing sugar, and vitamin C was significantly higher in the fruits of 40-year-old pear trees than in 5-year-old pear trees. On the contrary, 20- and 30-year-old pear trees had significantly lower total acid content compared to 5- and 40-year-old pear trees, and total acid content was significantly lower (p < 0.05) in 40-year-old pear trees compared with 5-year-old pear trees. Overall, sucrose (sweetness) content was higher in mature pear trees (20- and 30-year-old pear trees) than in young or old pear trees (5- and 40-year-old pear trees).

3.2. Soil Physicochemical Index Analysis

Table 2 shows that the physicochemical indexes of pear tree rhizosphere soil at different planting years varied significantly. Total nitrogen content and pH in the rhizosphere soil of 20-year-old pear trees were significantly greater than those of other planting years (p < 0.05). However, the total phosphorus and water contents in the rhizosphere soil of 40-year-old pear trees were significantly greater than those of other planting years (p < 0.05). The available nitrogen content was significantly greater in the rhizosphere soil of 5-year-old pear trees than in other planting years (p < 0.05). The available potassium content in the rhizosphere soil of 30-year-old pear trees was significantly greater than that of other planting years (p < 0.05). However, soil nutrient effectiveness was significantly lower in 20-year-old pear trees than in the other planting years (p < 0.05), suggesting the need for increased fertilization at this growth stage.

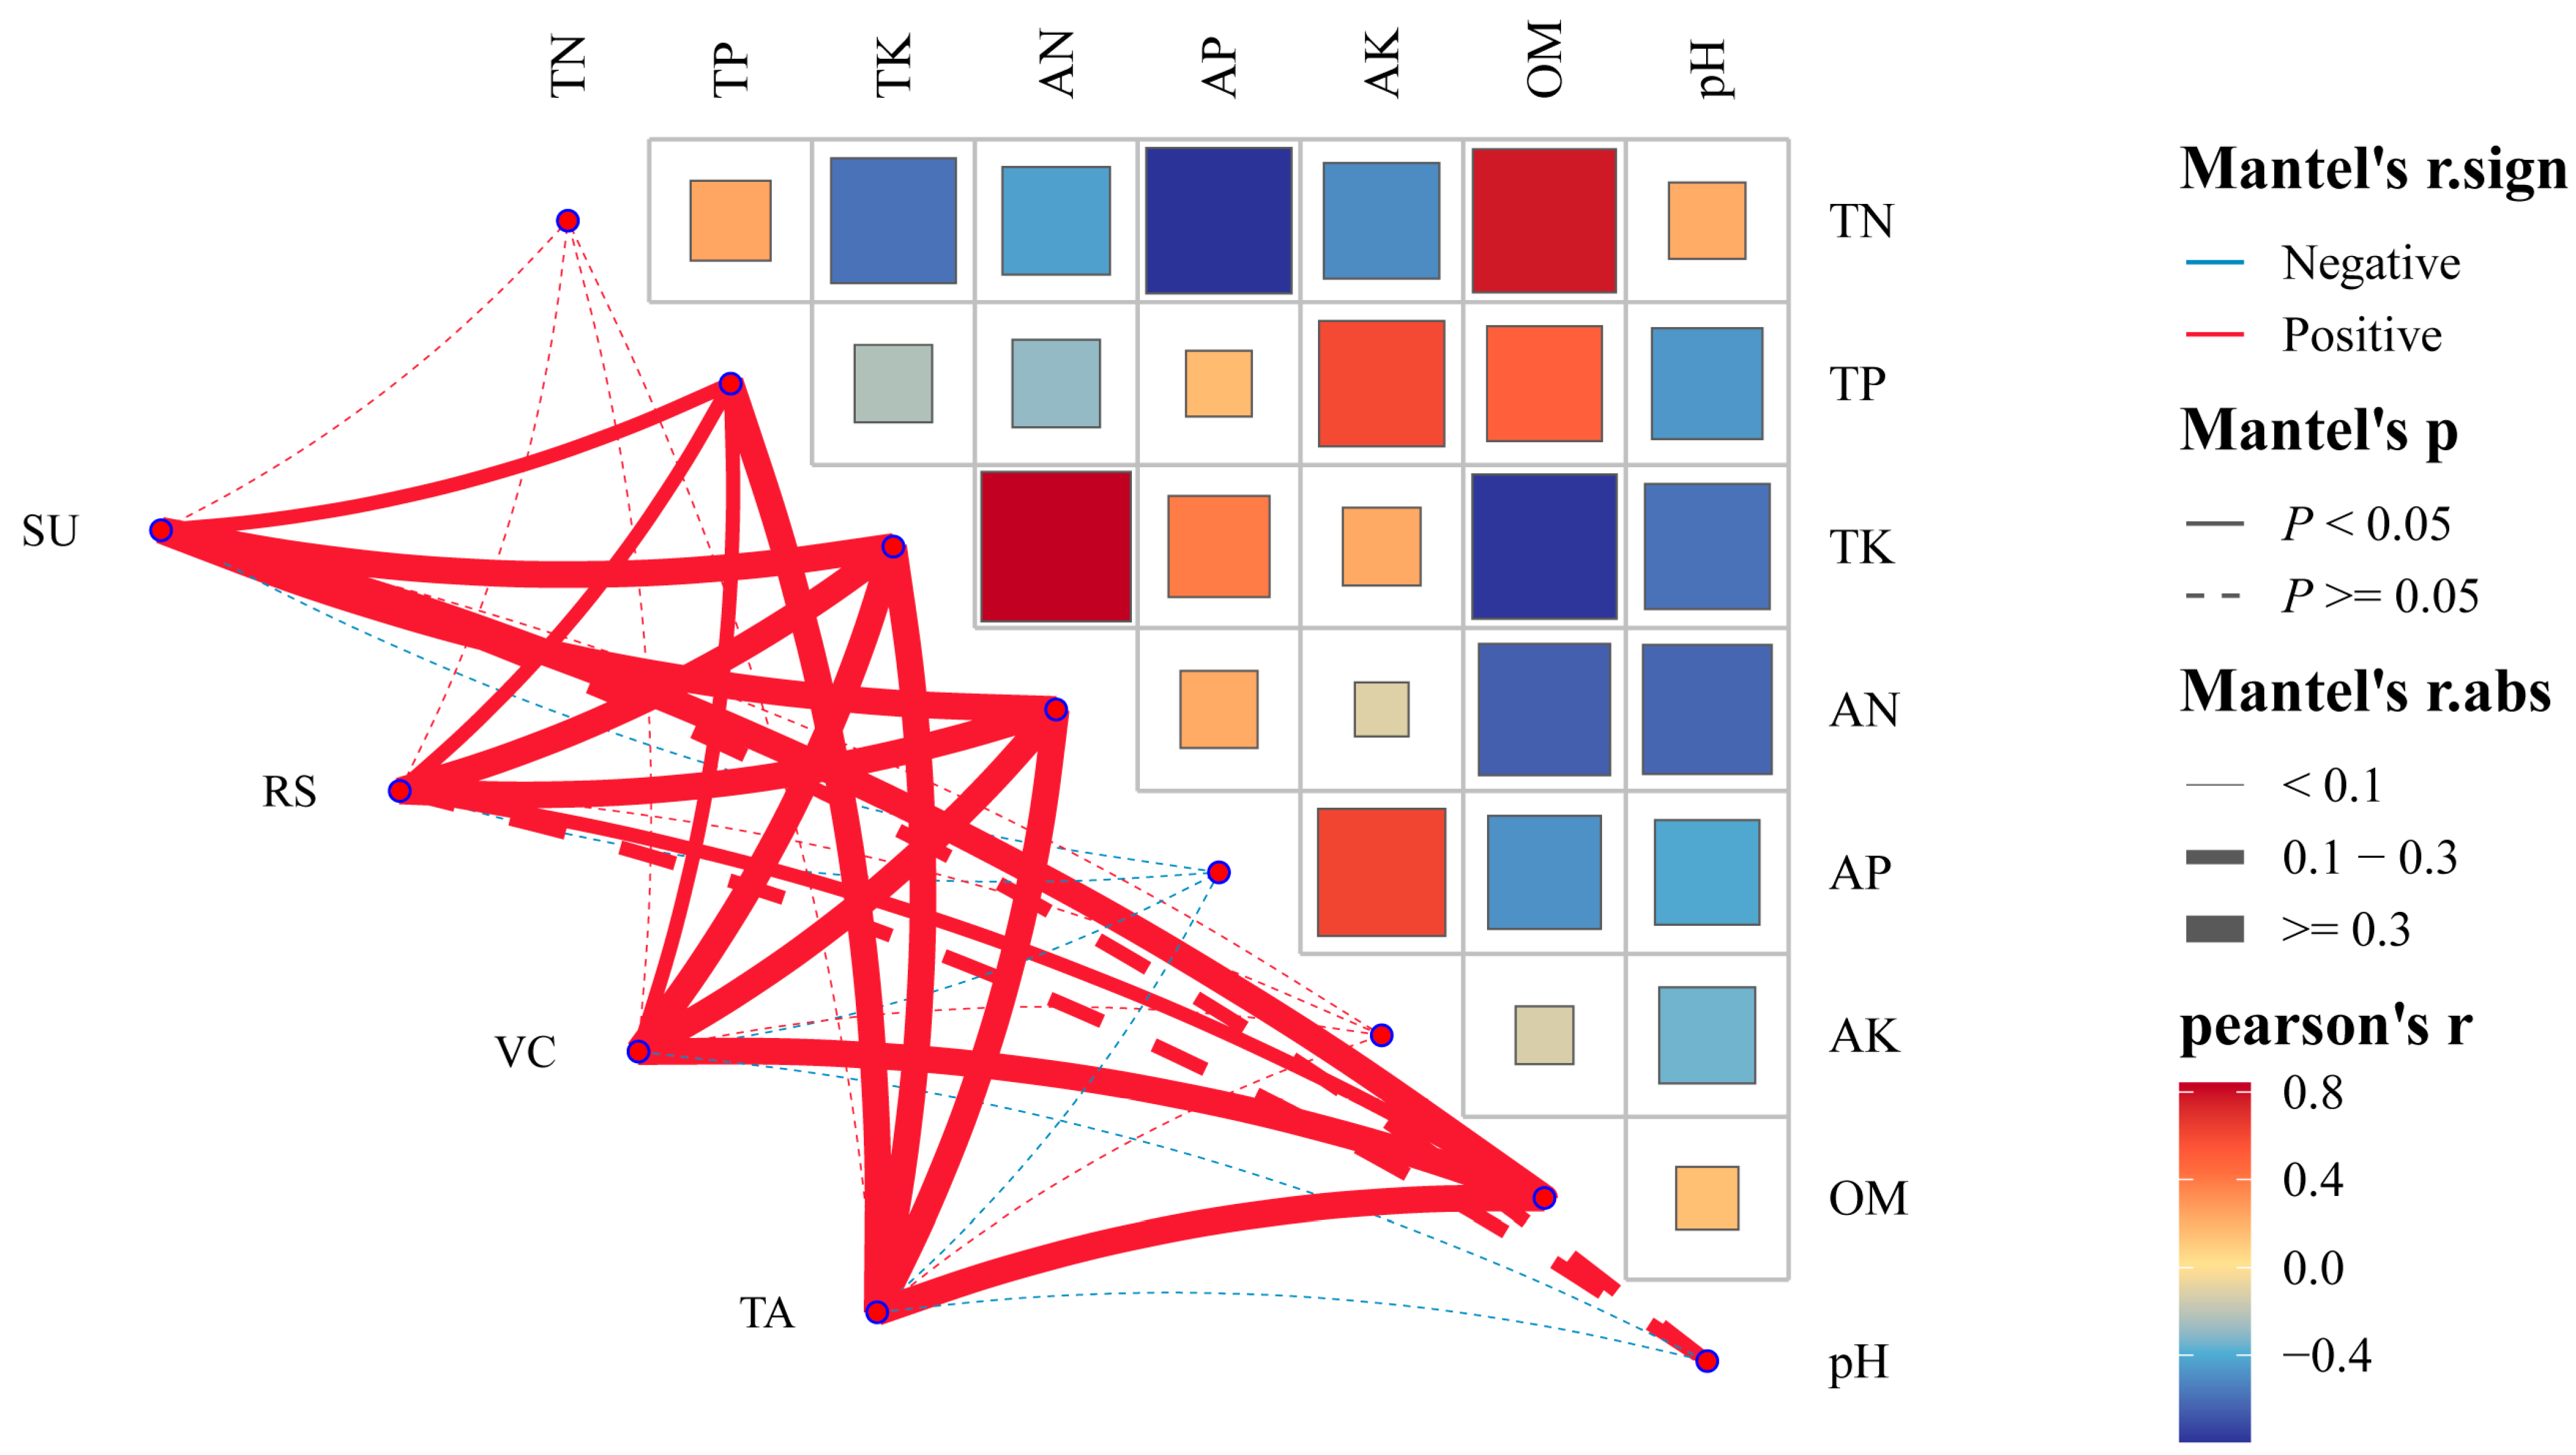
3.3. Correlation Network Heat Map Analysis

Correlation analysis of soil physicochemical indexes of pear trees with different planting years showed that total nitrogen was significantly positively correlated with organic matter (p < 0.05), and total potassium was significantly positively correlated with available nitrogen (p < 0.05). Total nitrogen was significantly and negatively correlated with available nitrogen (p < 0.05), and total potassium was significantly and negatively correlated with organic matter (p < 0.05). Further, correlation analysis between soil physicochemical indexes and pear quality indexes showed that total phosphorus, organic matter, total potassium, and available nitrogen were significantly and positively correlated with the four quality indexes (sucrose, reducing sugar, vitamin C, and total acid) (p < 0.05) (Figure 1).

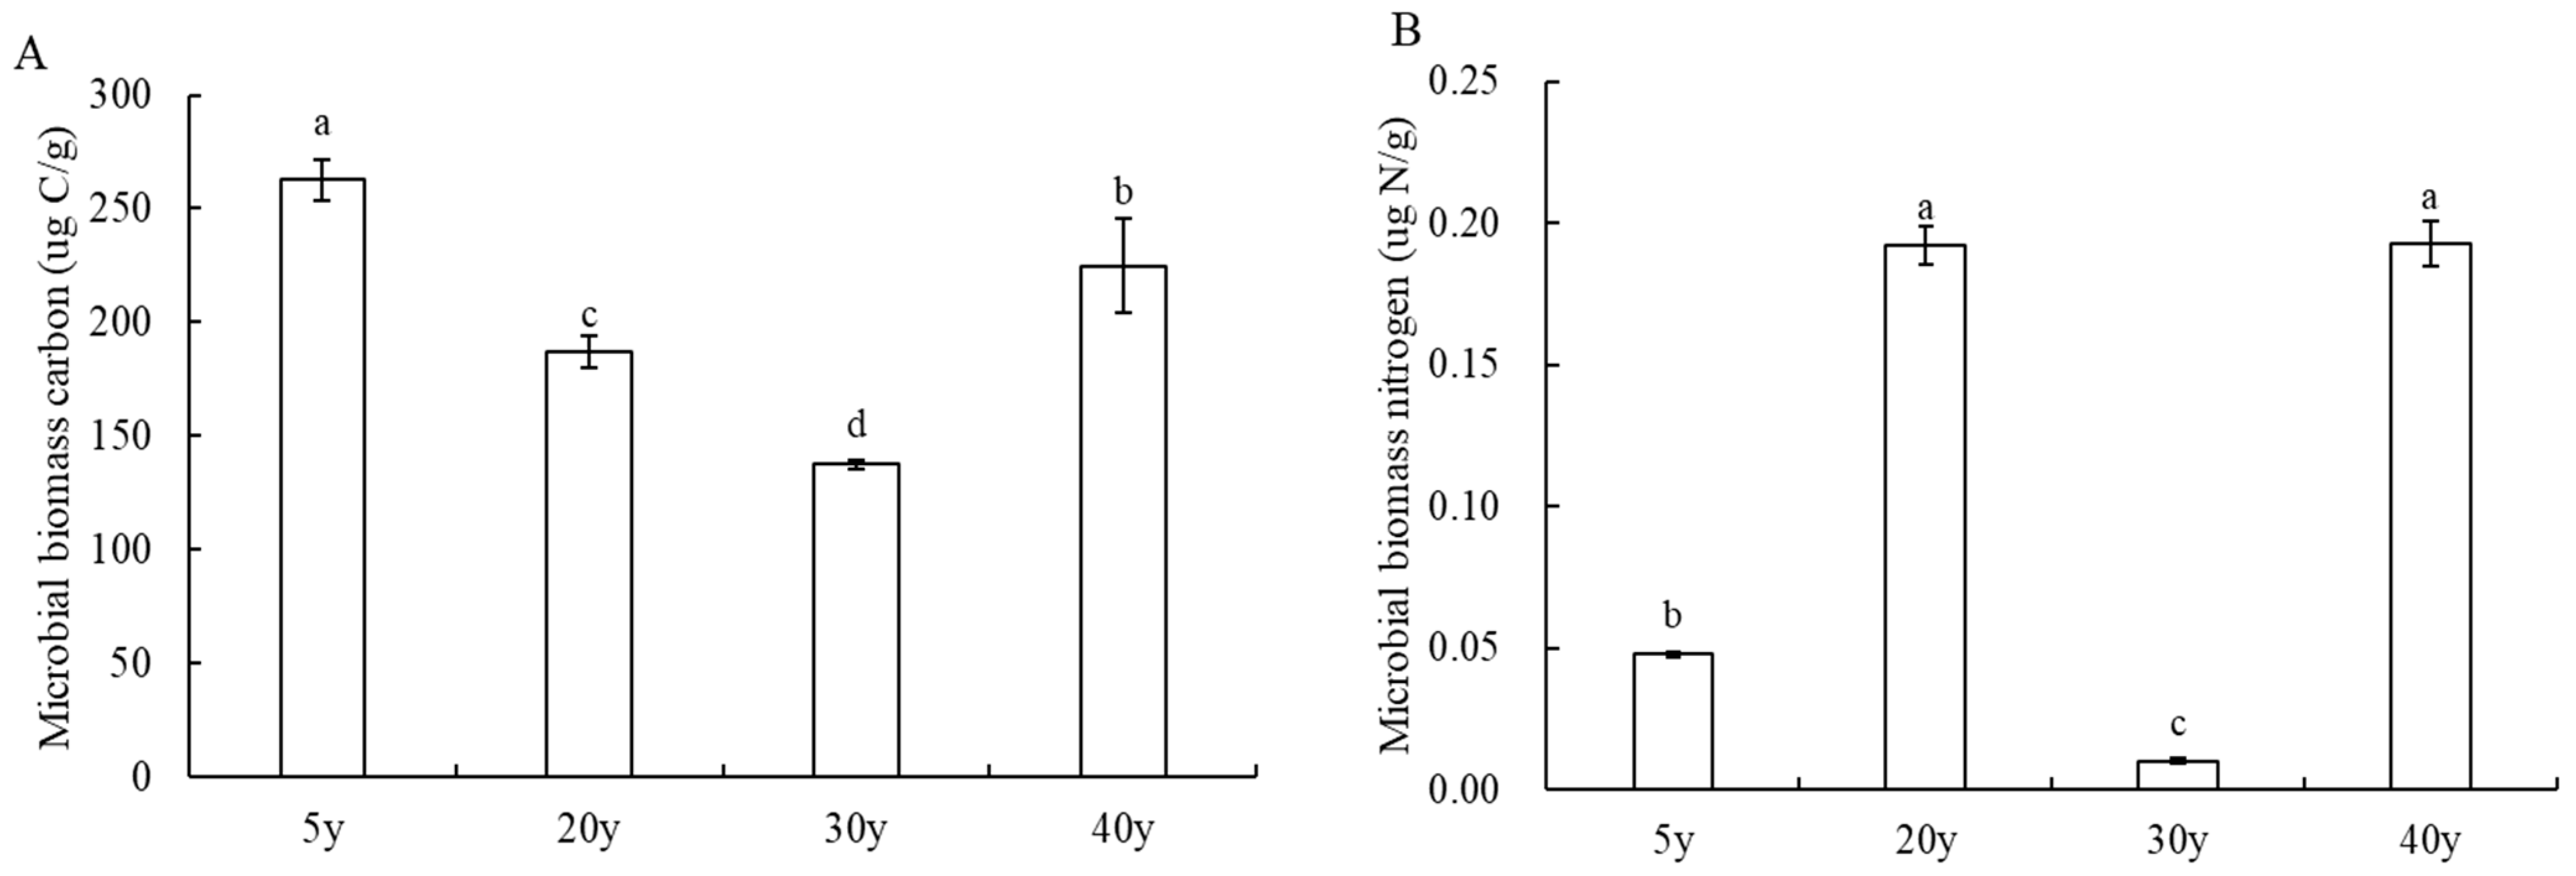
3.4. Analysis of Microbiomass Carbon and Nitrogen Content of Pear Trees in Different Planting Years

The microbiomass carbon content in the rhizosphere soil of 30-year-old pear trees was the least, which was significantly different from the other planting years (p < 0.05). With the increase in planting year, the microbiomass nitrogen content in the rhizosphere soil of pear tree increased first, then decreased and then increased, and the microbiomass nitrogen content in the rhizosphere soil of 30-year-old pear trees was the least (Figure 2).

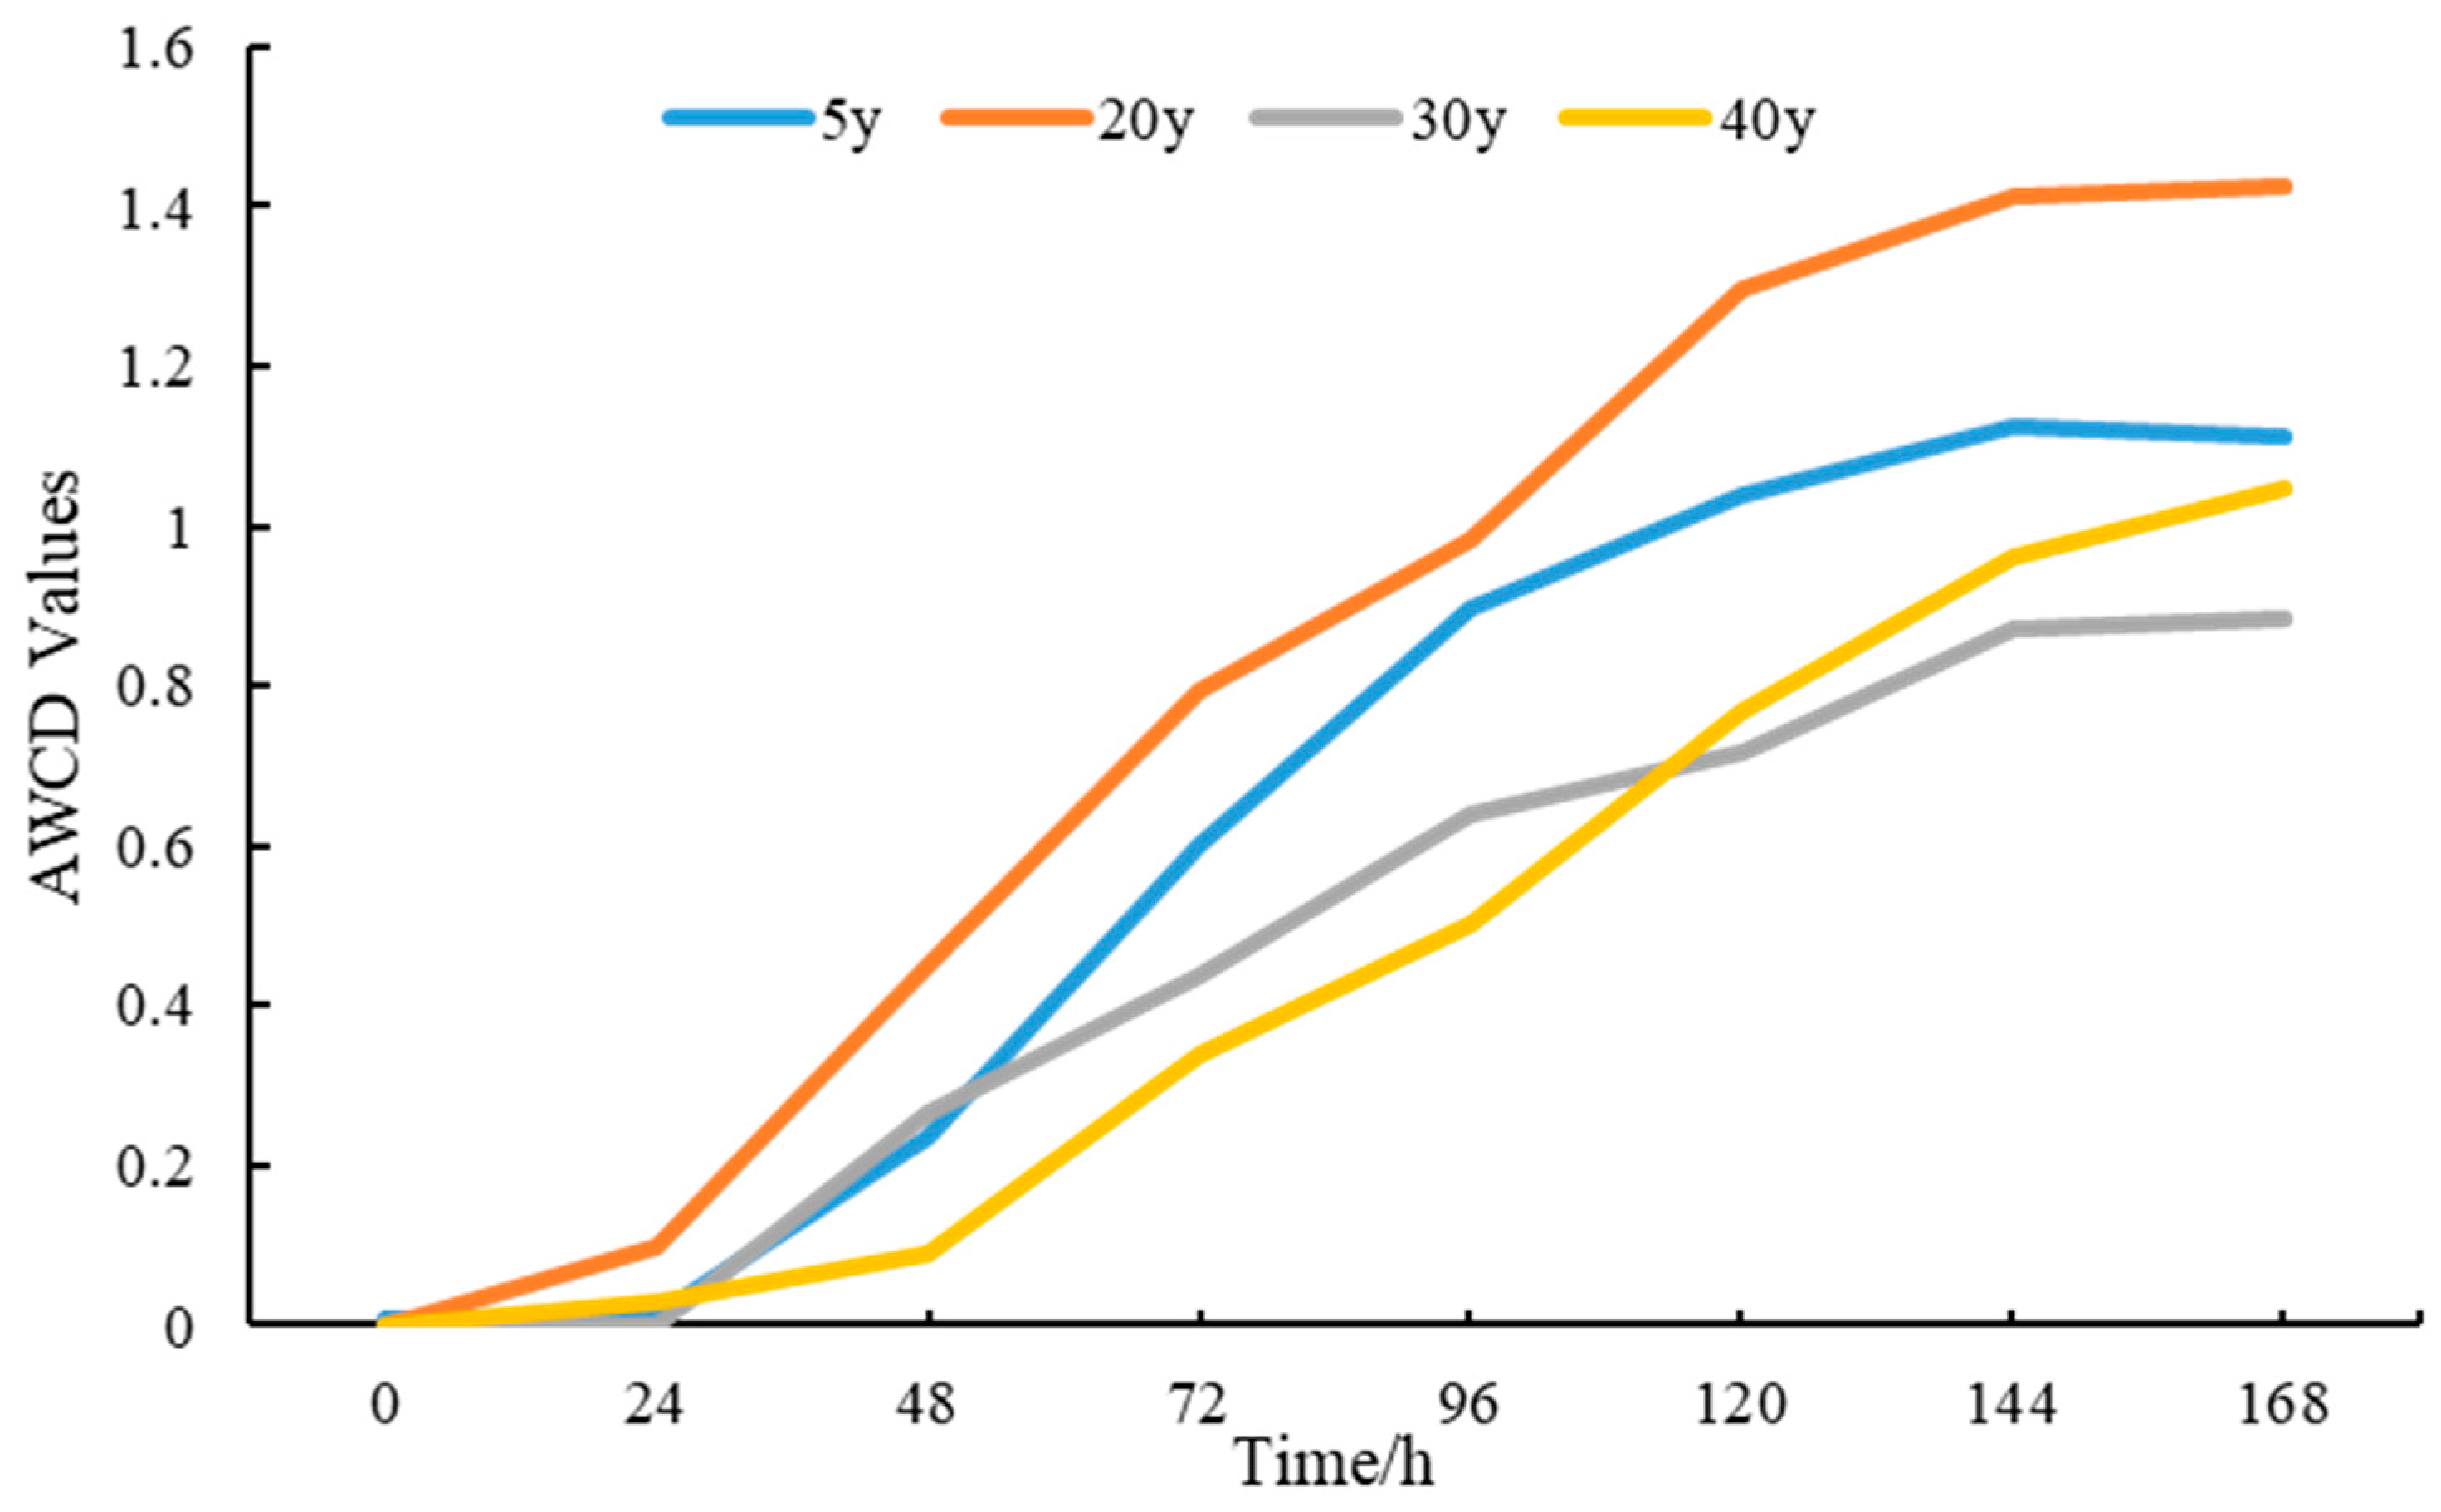
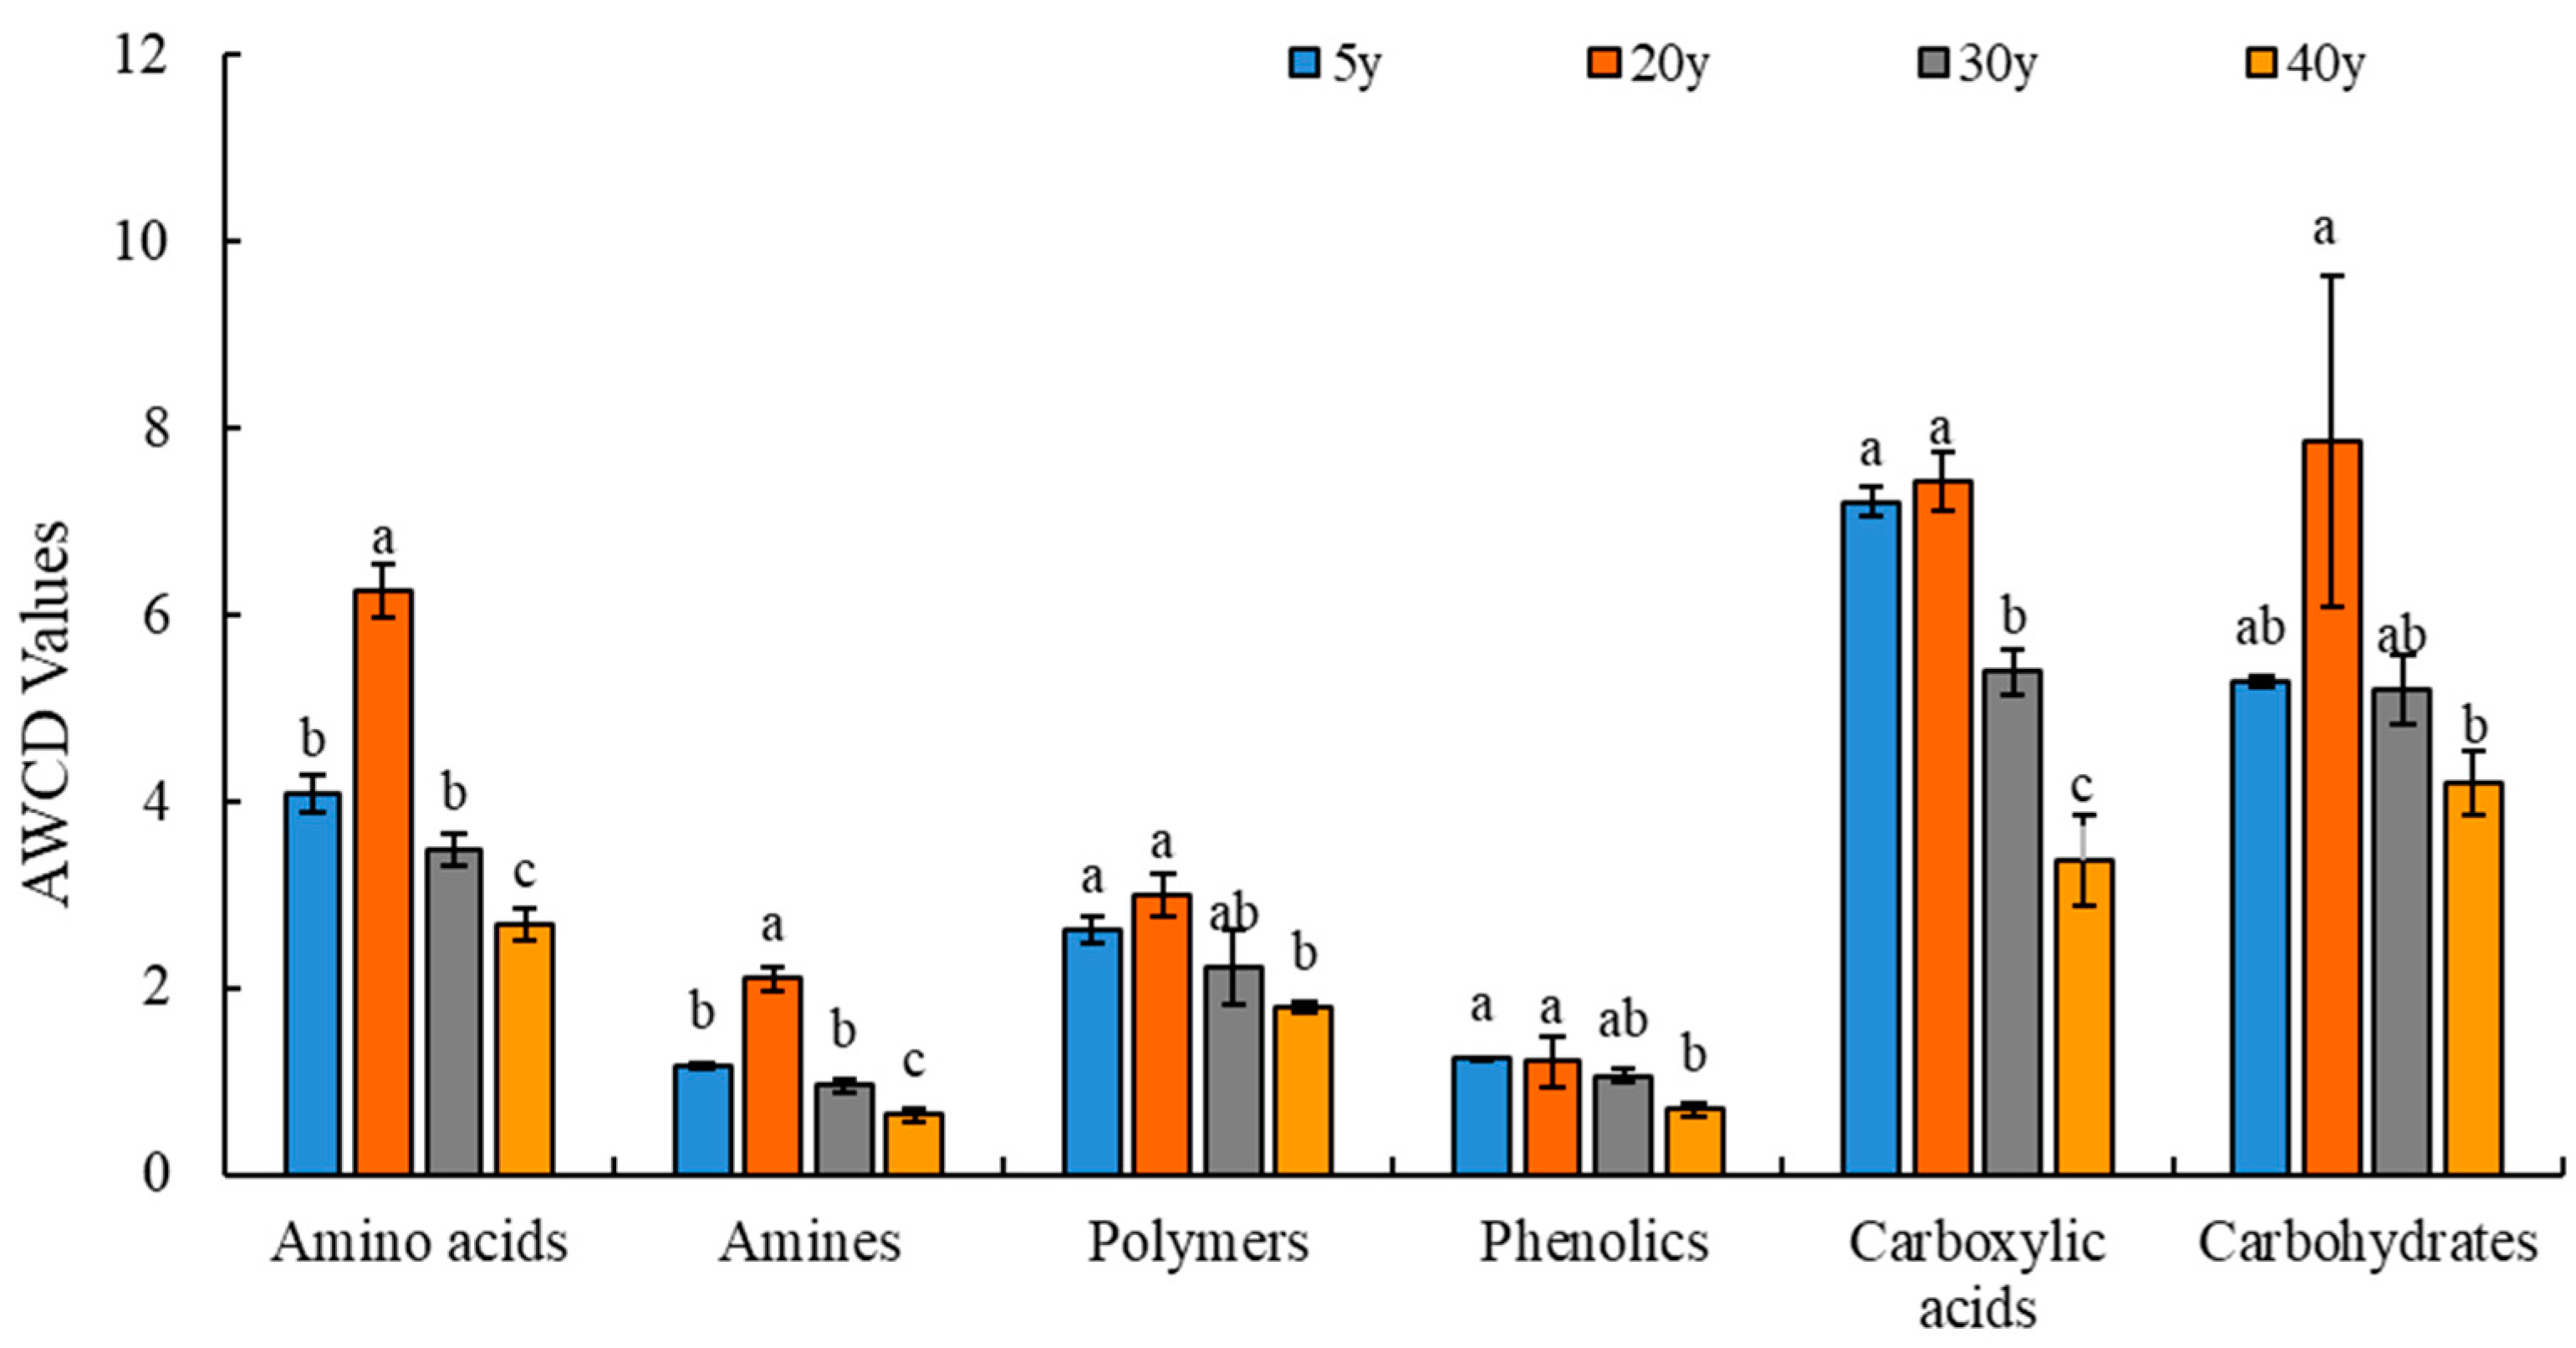
3.5. Functional Diversity Analysis of Rhizosphere Soil Bacterial Communities in Pear Trees of Different Planting Years

The results of carbon source utilization by microorganisms showed (Figure 3) that, as planting years increased, the utilization rate of carbon sources by rhizosphere soil microorganisms of pear trees increased gradually. At 72 h, the fastest carbon source utilization rate was found in each treatment, as evidenced by 20-year-old pear trees > 5-year-old pear trees > 30-year-old pear trees > 40-year-old pear trees.
The effect of planting years on the functional diversity of soil bacterial communities in pear trees was investigated using Biolog EcoPlates. The results showed that the relationship between utilization in six groups of carbon sources was 20-year-old pear trees > 5-year-old pear trees > 30-year-old pear trees > 40-year-old pear trees (Figure 4). Notably, the utilization rate of amines and amino acids by rhizosphere soil microorganisms associated with 20-year-old pear trees was significantly greater (p < 0.05) compared with other planting years. The utilization rate of carboxylic acids by rhizosphere soil microorganisms in 5-year-old pear trees was significantly greater (p < 0.05) than that in 30-year-old pear trees, and the utilization rate of the other five groups of carbon sources was not significantly different from that in 30-year-old pear trees. The utilization rate of amino acids, carboxylic acids, and amines by rhizosphere soil microorganisms in 30-year-old pear trees was significantly greater than that in 40-year-old pear trees.
Soil microbial functional diversity analysis (Table 3) showed that 40-year-old pear trees had the highest Simpson diversity index, which was significantly greater than other planting years (p < 0.05). Shannon diversity index and Chao1 diversity index of 30-year-old pear trees were the highest, and both showed significant differences compared to 5- and 40-year-old pear trees (p < 0.05).

3.6. Differential Carbon Source Screening

The results of OPLS-DA (orthogonal partial least-squares discrimination analysis) and clustering using the data from 31 carbon sources are shown in Figure 5. OPLS-DA model analysis indicated that the goodness of fit R2Y value of the model for rhizosphere soil samples of pear trees with different planting years was 0.964 (p < 0.005), and the predictive Q2 value was 0.834 (p < 0.005) (Figure 5A). The evaluation metrics of the model have indicated that both R2Y and Q2 values are significant, which indicates the model’s high degree of fitting and reliability. This model could serve as a valuable tool for further analysis. The analysis of the OPLS-DA scoring chart (Figure 5B) showed that the OPLS-DA could effectively distinguish pear tree samples with different planting years in different regions. It can be seen that there were significant differences in the utilization rate of carbon sources by rhizosphere soil microorganisms in pear trees with different planting years. S-plot analysis (Figure 5C,D) showed that 13 key carbon sources (VIP > 1) were distinguished among pear tree samples with different planting years. Among them, the utilization rate of two carbon sources increased in 5-year-old pear trees, namely, amino acids and carboxylic acids. The utilization rate of eight carbon sources increased in 20-year-old pear trees, including three amino acids, three carbohydrates, one amine, and one polymer. The utilization rate of two key carbon sources increased in 30-year-old pear trees, namely polymers and carbohydrates. The utilization rate of one carbon source increased in 40-year-old pear trees, which was carbohydrate.

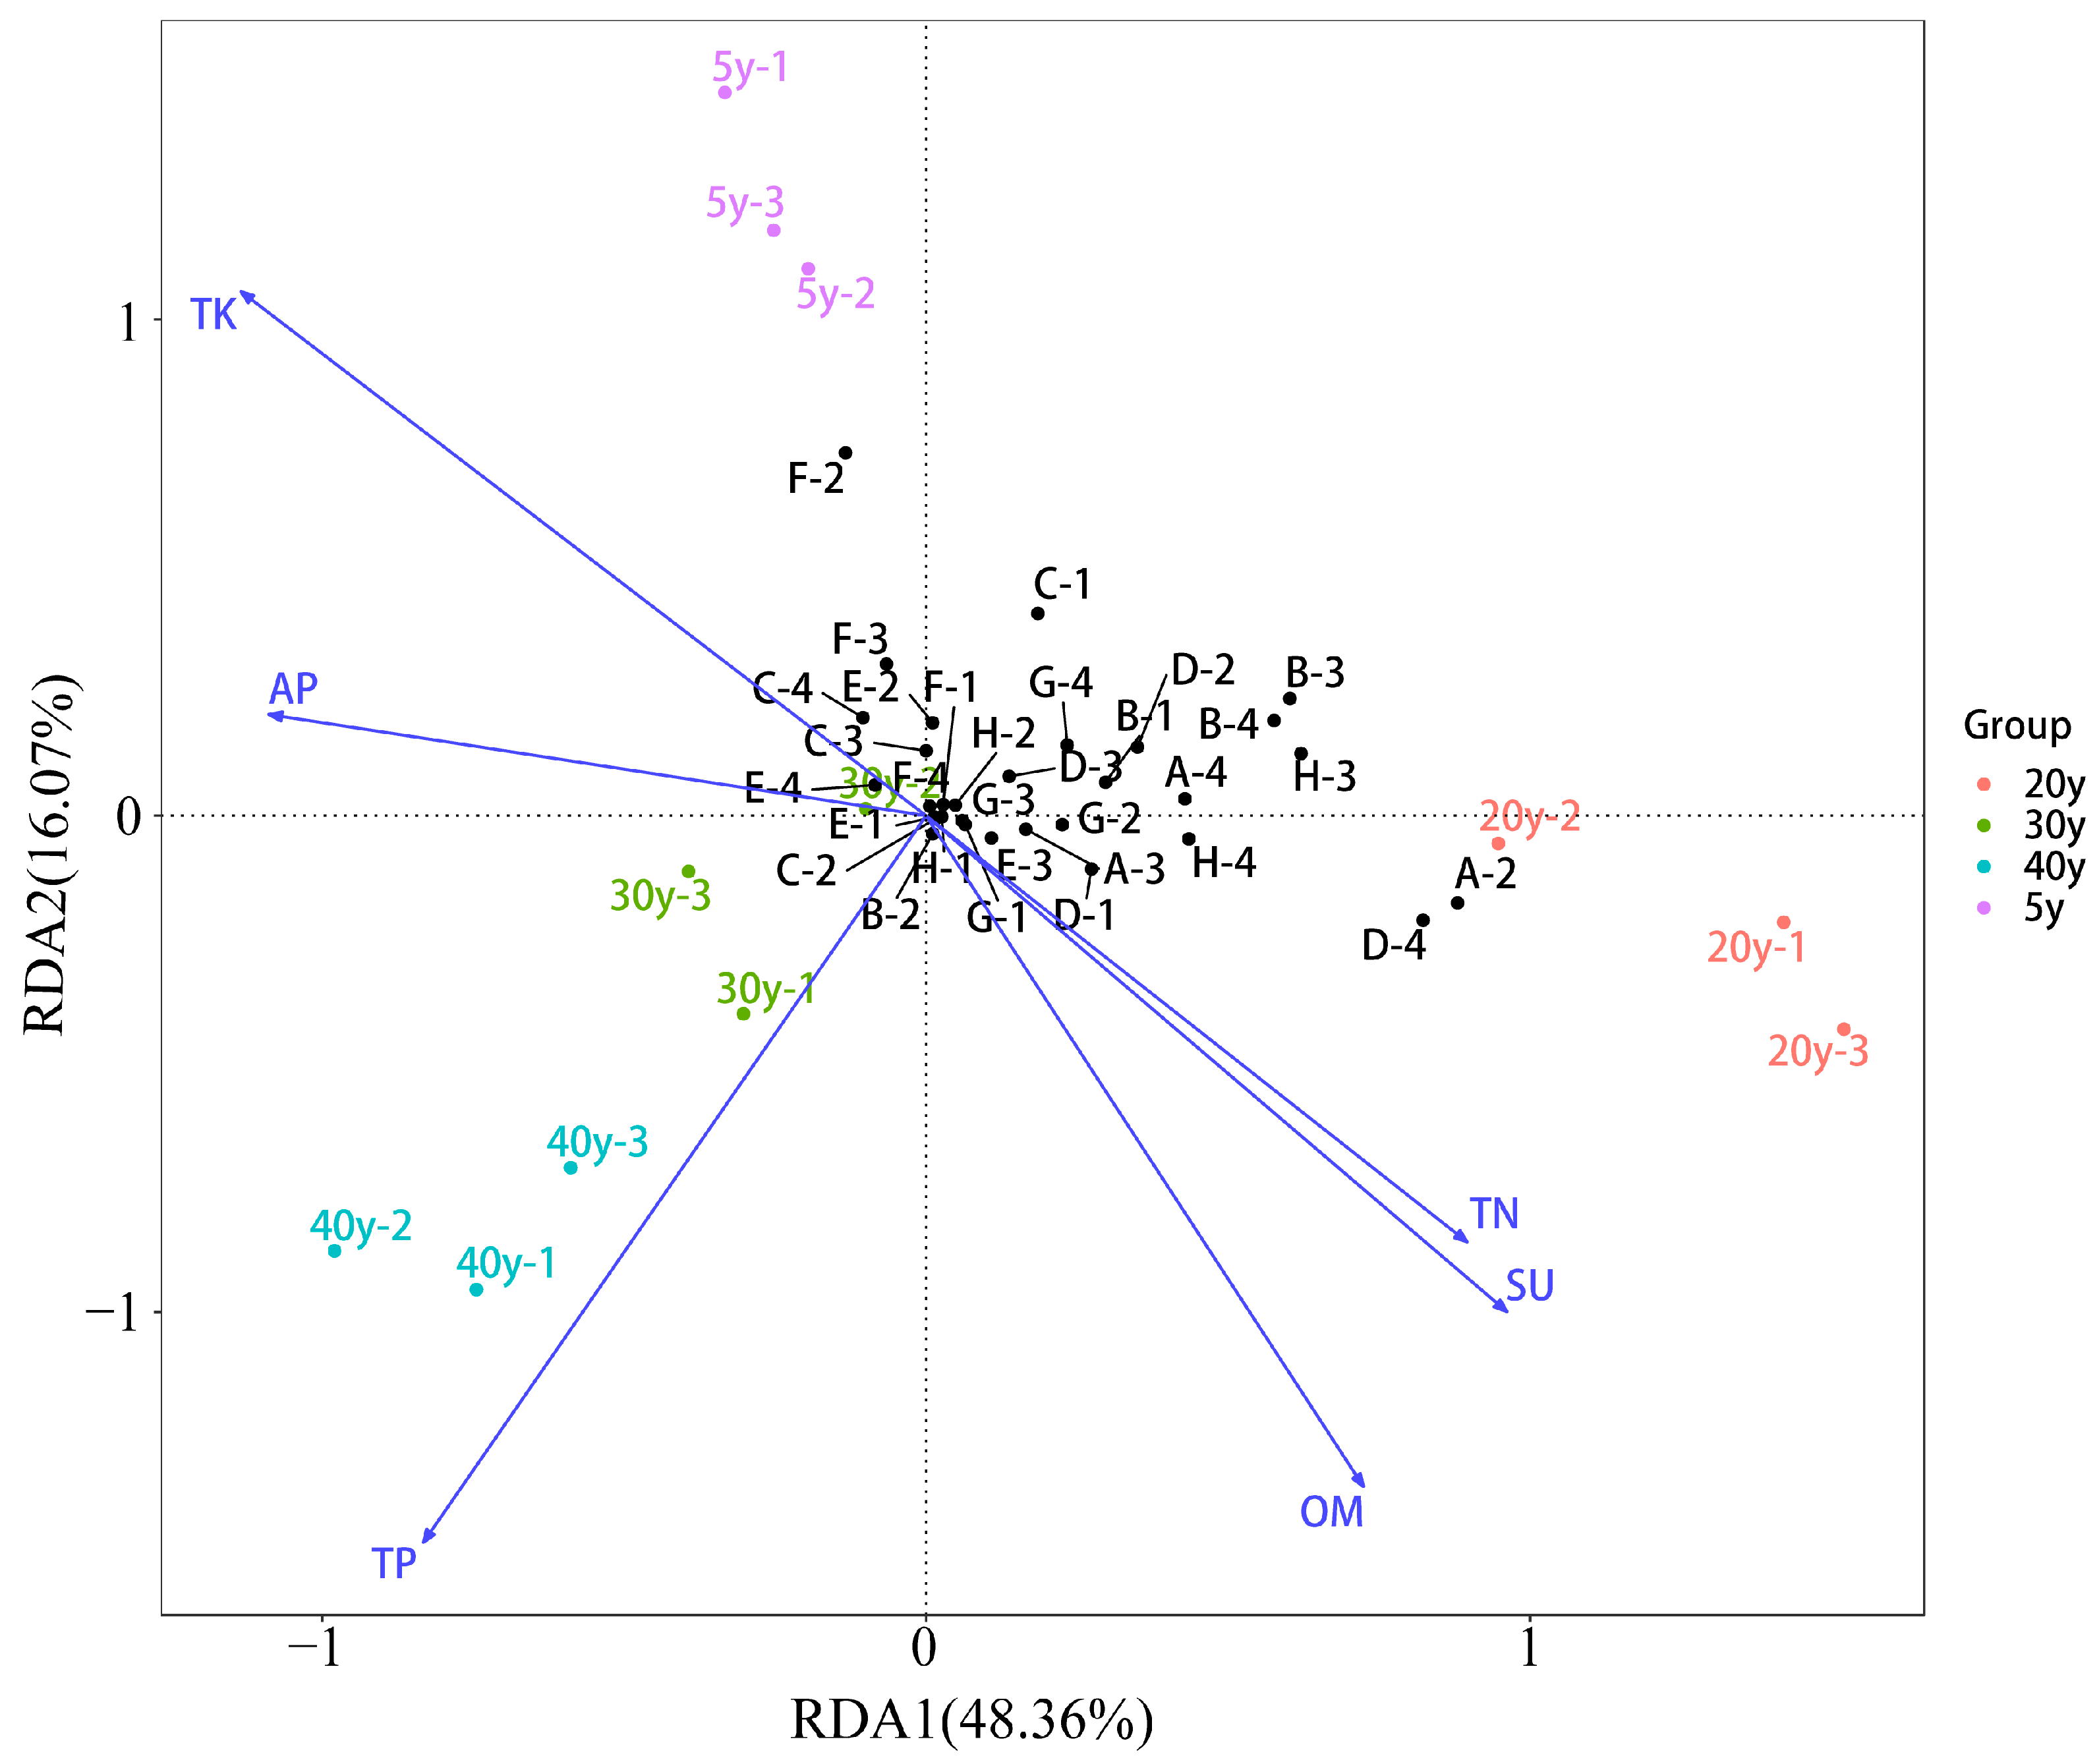
3.7. Redundancy Analysis

The redundancy analysis (RDA) of Biolog data, soil physicochemical indexes, and pear fruit quality indexes showed that RDA1 accounted for 48.36% of the variation, and RDA2 accounted for 16.07% of the variation (Figure 6). The results of the RDA showed that the variance inflation factor (VIF) for total nitrogen, total potassium, total phosphorus, available phosphorus, sucrose, and organic matter was more than 2 with multicollinearity. Further correlation analysis showed that organic matter, sucrose, and total nitrogen were positively correlated with 20-year-old pear trees. Total phosphorus was positively correlated with both 30-year-old pear trees and 40-year-old pear trees, whereas total potassium and available phosphorus were positively correlated with 5-year-old pear trees.

4. Discussion

The pear tree is a typical perennial fruit tree that can be more than 300 years old. However, as pear trees continue to grow on the same land, yield is adversely affected by the accumulation of deleterious factors in the soil [31,32]. This necessitates regrafting and replanting to maintain high-quality pear production for fresh markets. Pear yield showed an increasing-stabilizing-decreasing trend as the planting year increased [33]. Generally, pear trees planted for 6–7 years reach the peak fruit period, the yield is relatively stable from 10 to 30 years, and the yield decreases after 40 years. Therefore, the selection of ‘Cuiguan’ pear trees from 5 to 40 years old in this study is reasonable and representative. Numerous studies have reported that fruit quality shows an upward and then downward trend with the increase in planting year [34,35,36]. The study of Ahmed and Dennis [37] indicated that the fruits of young trees contained higher levels of anti-senescence hormones (gibberellins and auxins), which may have delayed the utilization of organic acids during the ripening, making the fruits of young trees more acidic than those of fruit trees of other planting years. Meena and Asrey [34] found that differences in the fruit sucrose content among young, middle, and late age groups showed a trend to increase and then decrease. This study also found that as the planting years of Cuiguan pear increased, the fruit’s sweetness initially increased but later declined, while the opposite was true for acidity. The above results are consistent with previous studies.

4.1. Physicochemical Indexes of Rhizosphere Soil in Pear Trees of Different Years

Researchers constantly explore the composition of soil fertility factors, trying to prove the law of soil fertility changes. Soil nutrient content can directly indicate the fertility of cultivated soil [38]. Compared with other crops, fruit trees have higher requirements for nutrients, and the long-term planting of fruit trees has a significant impact on soil fertility. Studies have shown that, compared with farmland, fruit trees cause soil nutrient depletion faster. With the increase in orchard age, the soil nutrient content of the orchard decreased significantly, which was the main reason for the decline of orchard productivity, but also led to the decline in yield and quality of the orchard [39,40]. Our findings reveal that the available nutrients in the rhizosphere soil of 20-year-old pear trees were significantly lower than in other planting years. This indicated that, under the same field management model, the requirement of soil-available nutrients for 20-year-old pear trees was higher than that for other trees. The consumption of available nutrients is closely related to the growth and yield of pear trees. The faster the growth rate, the more nutrients are consumed. Therefore, it is suggested that more available nutrients should be properly supplemented during the peak fruiting period of pear trees. The study identified a direct relationship between soil physicochemical properties and fruit quality. The four quality indexes were positively associated with the soil’s total nitrogen, total phosphorus, total potassium, available nitrogen, organic matter, and available potassium. A large number of studies have established that the application of organic fertilizer positively impacts fruit quality [41,42,43,44]. Therefore, it is advisable to supplement organic fertilizer in orchards for enhanced fruit quality.

4.2. Specific Microbial Communities in Pear Trees of Different Years

Extensive scientific studies substantiate that older fruit trees typically yield superior fruit quality compared to their younger counterparts [45,46,47]. Despite that, there are several factors that can hinder a fruit tree from reaching its dream planting year. These include microorganisms that grow in association with the root rhizosphere, which can have a substantial impact on the plant’s growth, nutrition, and overall health [48]. The changes in rhizosphere microorganisms are an important factor affecting the growth of fruit trees [49]. The plant growth-promoting rhizobacteria (PGPR) within the rhizosphere contribute to plant growth by producing beneficial substances and facilitating the uptake of nutrients [50]. Tree species and age play an important role in shaping rhizosphere environments. This is due to variations in the composition of root exudates, which, in turn, select specific microorganisms for growth and development in the rhizosphere. This selection process results in the formation of unique and active microbial communities [51]. This fluctuation may be attributed to the enhanced metabolism of pear trees during peak fruiting, which more readily aggregates bacteria. The Biolog EcoPlates method has proven effective in assessing soil microbial community functional diversity [52]. This study suggested that the age of pear trees has a great influence on the functional diversity of the rhizosphere bacterial community. The metabolic activity and functional diversity of the soil microbial communities based on the utilization rate of different carbon sources increased, followed by a decline with the increase in pear planting year. Furthermore, there were differences in the microorganisms of different planting years, with 20-year-old pear trees exhibiting a greater variety of differential microorganisms. The root exudates of pear trees, which change across growth stages, provide diverse carbon sources that distinctly influence the colonization patterns of rhizosphere bacterial communities [53]. The results of the RDA analysis showed that soil microbial specificity affected soil physicochemical indexes in different planting years. These findings are consistent with other studies, showing that the fruit planting year has an impact on the soil transformation process of an orchard by influencing rhizosphere microorganisms [54,55].

5. Conclusions

In summary, pear quality initially improved but gradually decreased over an increasing number of planting years. The effect of soil carbon source composition on the functional diversity of pear rhizosphere bacteria with different planting years. The microbial functional diversity in the soil was also closely related to pear quality. The degree of functional diversity of rhizosphere microorganisms was higher in 20-year-old pear trees than that of pear trees of other planting years. Therefore, during the vigorous growth period of pear trees, supplementing the soil with additional nutrients and organic matter, enhancing the soil’s microbial activity and diversity, and encouraging the exchange of soil substances can stimulate the growth of pear trees and enhance the quality of the fruit.

Supplementary Materials

The following supporting information can be downloaded at: https://www.mdpi.com/article/10.3390/agriculture14020226/s1, Table S1: Pear yields in different planting years.

Author Contributions

Conceptualization, X.P. and M.C.; data curation, W.C. and M.C.; formal analysis, P.M. and Z.Z.; investigation, Y.Z.; methodology, X.P. and J.Y.; project administration, Q.Z.; supervision, X.P. and H.W.; visualization, X.P., M.C. and X.J.; writing—original draft, X.P., M.C. and H.W.; writing—review and editing, X.P., M.C. and X.J. All authors have read and agreed to the published version of the manuscript.

Funding

This research was funded by the Scientific Research Project of Introducing Talents, Wuyi University (YJ201909); the Innovation and Entrepreneurship Training Program for College Students (S202210397033); the construction of a first-class undergraduate specialty (tea science) in Fujian Province (SJZY2019004); the Fujian Province Young and Middle-Aged Teacher Education Research Project (Science and Technology) (JAT200664); the Faculty and Students Co-Creation Team of Wuyi University (2021-SSTD-05); and the Special Science and Technology Commissioner System of Nanping City (NP2021KTS05).

Data Availability Statement

All data generated or analyzed during this study are included in this published article.

Conflicts of Interest

The authors declare no conflicts of interest.

References

  1. Hong, S.Y.; Lansky, E.; Kang, S.S.; Yang, M. A review of pears (Pyrus spp.), ancient functional food for modern times. BMC Complement. Med. Ther. 2021, 21, 219. [Google Scholar] [CrossRef]
  2. Attanzio, A.; Tesoriere, L.; Vasto, S.; Pintaudi, A.M.; Livrea, M.A.; Allegra, M. Short-term cactus pear [Opuntia ficus-indica (L.) Mill] fruit supplementation ameliorates the inflammatory profile and is associated with improved antioxidant status among healthy humans. Food Nutr. Res. 2018, 62, 1262. [Google Scholar] [CrossRef]
  3. Wang, T.; Chen, W.; Chen, D.; Huang, X.; Jin, W. Study the Changes of Light intensities and Temperatures and the Rules of Growth and Development of ‘Cui Guan’ Pear Cultivated in Plastic House. Anhui Agric. Sci. Bull. 2007, 13, 78–80. [Google Scholar]
  4. Gao, Y.; Yang, Q.; Yan, X.; Wu, X.; Yang, F.; Li, J.; Wei, J.; Ni, J.; Ahmad, M.; Bai, S.; et al. High-quality genome assembly of ‘Cuiguan’ pear (Pyrus pyrifolia) as a reference genome for identifying regulatory genes and epigenetic modifications responsible for bud dormancy. Hortic. Res. 2021, 8, 197. [Google Scholar] [CrossRef] [PubMed]
  5. Liu, Y.; Bai, M.; Li, Y.; Zhang, B.; Wu, X.; Shi, Y.; Liu, H. Evaluating the Combined Effects of Water and Fertilizer Coupling Schemes on Pear Vegetative Growth and Quality in North China. Agronomy 2023, 13, 867. [Google Scholar] [CrossRef]
  6. Zhang, Q.; Pang, X.; Chen, X.; Ye, J.; Lin, S.; Jia, X. Rain-shelter cultivation influence rhizosphere bacterial community structure in pear and its relationship with fruit quality of pear and soil chemical properties. Sci. Hortic. 2020, 269, 109419. [Google Scholar] [CrossRef]
  7. Zargar, M.; Tumanyan, A.; Ivanenko, E.; Dronik, A.; Tyutyuma, N.; Pakina, E. Impact of foliar fertilization on apple and pear trees in reconciling productivity and alleviation of environmental concerns under arid conditions. Commun. Integr. Biol. 2019, 12, 1–9. [Google Scholar] [CrossRef] [PubMed]
  8. Zhang, M.; Bai, B.; Chen, L.; Liu, H.; Jin, Q.; Wang, L.; Feng, T. Comparative analysis of the quality in ripe fruits of cuiguan pear from different regions. Molecules 2023, 28, 1733. [Google Scholar] [CrossRef] [PubMed]
  9. Musacchi, S.; Iglesias, I.; Neri, D. Training systems and sustainable orchard management for European pear (Pyrus communis L.) in the Mediterranean area: A review. Agronomy 2021, 11, 1765. [Google Scholar] [CrossRef]
  10. Qu, Q.; Zhang, Z.; Peijnenburg, W.J.; Liu, W.; Lu, T.; Hu, B.; Chen, J.; Chen, J.; Lin, Z.; Qian, H. Rhizosphere microbiome assembly and its impact on plant growth. J. Agric. Food Chem. 2020, 68, 5024–5038. [Google Scholar] [CrossRef]
  11. Jiménez-Gómez, A.; Celador-Lera, L.; Fradejas-Bayón, M.; Rivas, R. Plant probiotic bacteria enhance the quality of fruit and horticultural crops. AIMS Microbiol. 2017, 3, 483–501. [Google Scholar] [CrossRef]
  12. Alawiye, T.T.; Babalola, O.O. Bacterial diversity and community structure in typical plant rhizosphere. Diversity 2019, 11, 179. [Google Scholar] [CrossRef]
  13. Akinola, S.A.; Babalola, O.O. The fungal and archaeal community within plant rhizosphere: A review on their contribution to crop safety. J. Plant Nutr. 2021, 44, 600–618. [Google Scholar] [CrossRef]
  14. Chaparro, J.M.; Badri, D.V.; Bakker, M.G.; Sugiyama, A.; Manter, D.K.; Vivanco, J.M. Root exudation of phytochemicals in Arabidopsis follows specific patterns that are developmentally programmed and correlate with soil microbial functions. PLoS ONE 2013, 8, e55731. [Google Scholar] [CrossRef]
  15. Wang, Y.; Li, W.; Du, B.; Li, H. Effect of biochar applied with plant growth-promoting rhizobacteria (PGPR) on soil microbial community composition and nitrogen utilization in tomato. Pedosphere 2021, 31, 872–881. [Google Scholar] [CrossRef]
  16. Pang, Z.; Dong, F.; Liu, Q.; Lin, W.; Hu, C.; Yuan, Z. Soil metagenomics reveals effects of continuous sugarcane cropping on the structure and functional pathway of rhizospheric microbial community. Front. Microbiol. 2021, 12, 627569. [Google Scholar] [CrossRef] [PubMed]
  17. Bahram, M.; Netherway, T.; Hildebrand, F.; Pritsch, K.; Drenkhan, R.; Loit, K.; Anslan, S.; Bork, P.; Tedersoo, L. Plant nutrient-acquisition strategies drive topsoil microbiome structure and function. New Phytol. 2020, 227, 1189–1199. [Google Scholar] [CrossRef]
  18. Shi, Y.; Pan, Y.; Li, X.; Zhu, Z.; Fu, W.; Hao, G.; Geng, Z.; Chen, S.; Li, Y.; Han, D. Assembly of rhizosphere microbial communities in Artemisia annua: Recruitment of plant growth-promoting microorganisms and inter-kingdom interactions between bacteria and fungi. Plant Soil 2021, 470, 127–139. [Google Scholar] [CrossRef]
  19. Ji, W.; Han, K.; Cai, Y.; Mu, Y.; Zhao, L.; Zhang, M.; Hou, C.; Gao, M.; Zhao, Q. Characterization of rhizosphere bacterial community and berry quality of Hutai No. 8 (Vitis vinifera L.) with different ages, and their relations. J. Sci. Food Agric. 2019, 99, 4532–4539. [Google Scholar] [CrossRef] [PubMed]
  20. Zhou, Y.; Tang, Y.; Hu, C.; Zhan, T.; Zhang, S.; Cai, M.; Zhao, X. Soil applied Ca, Mg and B altered phyllosphere and rhizosphere bacterial microbiome and reduced Huanglongbing incidence in Gannan Navel Orange. Sci. Total Environ. 2021, 791, 148046. [Google Scholar] [CrossRef] [PubMed]
  21. Xie, B.; Chen, Y.; Cheng, C.; Ma, R.; Zhao, D.; Li, Z.; Li, Y.; An, X.; Yang, X. Long-term soil management practices influence the rhizosphere microbial community structure and bacterial function of hilly apple orchard soil. Appl. Soil Ecol. 2022, 180, 104627. [Google Scholar] [CrossRef]
  22. Laurentin, A.; Edwards, C.A. Amicrotiter modification of theanthrone-sulfuric acid colorimetric assay for glucose-based carbohydrates. Anal. Biochem. 2003, 315, 143–145. [Google Scholar] [CrossRef]
  23. Ghnimi, S.; Al-Shibli, M.; Al-Yammahi, H.R.; Al-Dhaheri, A.; Al-Jaberi, F.; Jobe, B.; Kamal-Eldin, A. Reducing sugars, organic acids, size, color, and texture of 21 Emirati date fruit varieties (Phoenix dactylifera, L.). NFS J. 2018, 12, 1–10. [Google Scholar] [CrossRef]
  24. Valente, A.; Albuquerque, T.G.; Sanches-Silva, A.; Costa, H.S. Ascorbic acid content in exotic fruits: A contribution to produce quality data for food composition databases. Food Res. Int. 2011, 44, 2237–2242. [Google Scholar] [CrossRef]
  25. Mohammed, S.; Edna, M.; Siraj, K. The effect of traditional and improved solar drying methods on the sensory quality and nutritional composition of fruits: A case of mangoes and pineapples. Heliyon 2020, 6, e04163. [Google Scholar] [CrossRef] [PubMed]
  26. Lu, R.S. Soil Agrochemical Analysis Methods; China Agricultural Science and Technology Press: Beijing, China, 2000. [Google Scholar]
  27. Li, F.D.; Yu, Z.N.; He, S.J. Agricultural Microbiology Laboratory Manual; China Agricultural Press: Beijing, China, 1996. [Google Scholar]
  28. Choi, K.H.; Dobbs, F.C. Comparison of two kinds of Biolog microplates (GN and ECO) in their ability to distinguish among aquatic microbial communities. J. Microbiol. Meth. 1999, 36, 203–213. [Google Scholar] [CrossRef] [PubMed]
  29. Chinthalapudi, D.P.; Pokhrel, S.; Kingery, W.L.; Shankle, M.W.; Ganapathi Shanmugam, S. Exploring the Synergistic Impacts of Cover Crops and Fertilization on Soil Microbial Metabolic Diversity in Dryland Soybean Production Systems Using Biolog EcoPlates. Appl. Biosci. 2023, 2, 328–346. [Google Scholar] [CrossRef]
  30. Teng, Z.; Fan, W.; Wang, H.; Cao, X.; Xu, X. Monitoring soil microorganisms with community-level physiological profiles using Biolog EcoPlates™ in Chaohu lakeside wetland, East China. Eurasian Soil Sci. 2020, 53, 1142–1153. [Google Scholar] [CrossRef]
  31. Kovács, C.; Balling, P.; Bihari, Z.; Nagy, A.; Sándor, E. Incidence of grapevinetrunk diseases is influenced by soil, topology and vineyard age, but not by Diplodia seriata infection rate in the Tokaj wine region, Hungary. Phytoparasitica 2017, 45, 21–32. [Google Scholar] [CrossRef]
  32. Cheng, Y.; Yang, S.; Xie, Y.; Chen, W.L. Control of Antagonistic bacteria FJ1 on Pear Scab. J. Anhui Agri. Sci. 2012, 40, 17567–17568+17574. [Google Scholar]
  33. Chalmers, D.J.; Mitchell, P.D.; Jerie, P.H. The physiology of growth control of peach and pear trees using reduced irrigation. Acta Horticul. 1984, 146, 143–150. [Google Scholar] [CrossRef]
  34. Meena, N.K.; Asrey, R. Tree age affects physicochemical, functional quality and storability of Amrapali mango (Mangifera indica L.) fruits. J. Sci. Food Agri. 2018, 98, 3255–3262. [Google Scholar] [CrossRef]
  35. Nakorn, S.; Chalumpak, C. Effect of tree age and fruit age on fruit development and fruit quality of Pummelo var. Tabtimsiam. J. Agric. Technol. 2016, 12, 637–645. [Google Scholar]
  36. Asrey, R.; Pal, R.K.; Sagar, V.R.; Patel, V.B. Impact of tree age and canopy position on fruit quality of guava. Acta Hortic. 2007, 735, 259–262. [Google Scholar] [CrossRef]
  37. Ahmed, I.; Dennis, F.G. Effect of apple tree age and flower position on cell size and cell number. Pak. J. Agric. Res. 1992, 13, 161–164. [Google Scholar]
  38. Bhatt, M.K.; Labanya, R.; Joshi, H.C. Influence of long-term chemical fertilizers and organic manures on soil fertility—A review. Univers. J. Agric. Res. 2019, 7, 177–188. [Google Scholar]
  39. Zhang, M.; Zhang, L.; Riaz, M.; Xia, H.; Jiang, C. Biochar amendment improved fruit quality and soil properties and microbial communities at different depths in citrus production. J. Clean. Prod. 2021, 292, 126062. [Google Scholar] [CrossRef]
  40. Singh, S.R.; Sharma, A.K.; Sharma, M.K. Influence of NPK combinations at different altitudes and aspects on fruit yield, quality and leaf nutrient status of apple cv. Red Delicious. Indian J. Hortic. 2009, 66, 175–182. [Google Scholar]
  41. Ye, L.; Zhao, X.; Bao, E.; Li, J.; Zou, Z.; Cao, K. Bio-organic fertilizer with reduced rates of chemical fertilization improves soil fertility and enhances tomato yield and quality. Sci. Rep. 2020, 10, 177. [Google Scholar] [CrossRef] [PubMed]
  42. Ye, S.; Liu, T.; Niu, Y. Effects of organic fertilizer on water use, photosynthetic characteristics, and fruit quality of pear jujube in northern Shaanxi. Open Chem. 2020, 18, 537–545. [Google Scholar] [CrossRef]
  43. Zhang, M.; Sun, D.; Niu, Z.; Yan, J.; Zhou, X.; Kang, X. Effects of combined organic/inorganic fertilizer application on growth, photosynthetic characteristics, yield and fruit quality of Actinidia chinesis cv ‘Hongyang’. Glob. Ecol. Conserv. 2020, 22, e00997. [Google Scholar] [CrossRef]
  44. Milošević, T.; Milošević, N.; Mladenović, J. The influence of organic, organo-mineral and mineral fertilizers on tree growth, yielding, fruit quality and leaf nutrient composition of apple cv.‘Golden Delicious Reinders’. Sci. Hortic. 2022, 297, 110978. [Google Scholar] [CrossRef]
  45. Grigg, D.; Methven, D.; De Bei, R.; Rodríguez López, C.M.; Dry, P.; Collins, C. Effect of vine age on vine performance of Shiraz in the Barossa Valley, Australia. Aust. J. Grape. Wine R 2018, 24, 75–87. [Google Scholar] [CrossRef]
  46. Rahman, M.M.; Rahman, M.M.; Hossain, M.M.; Khaliq, Q.A.; Moniruzzaman, M. Effect of planting time and genotypes growth, yield and quality of strawberry (Fragaria × ananassa Duch.). Sci. Hortic. 2014, 167, 56–62. [Google Scholar] [CrossRef]
  47. Del Bubba, M.; Giordani, E.; Ancillotti, C.; Petrucci, W.A.; Ciofi, L.; Morelli, D.; Marinelli, C.; Checchini, L.; Furlanetto, S. Morphological, nutraceutical and sensorial properties of cultivated Fragaria vesca L. berries: Influence of genotype, plant age, fertilization treatment on the overall fruit quality. Agric. Food Sci. 2016, 25, 187–201. [Google Scholar] [CrossRef]
  48. Hakim, S.; Naqqash, T.; Nawaz, M.S.; Laraib, I.; Siddique, M.J.; Zia, R.; Mirza, M.S.; Imran, A. Rhizosphere engineering with plant growth-promoting microorganisms for agriculture and ecological sustainability. Front. Sustain. Food Syst. 2021, 5, 617157. [Google Scholar] [CrossRef]
  49. Franke-Whittle, I.H.; Manici, L.M.; Insam, H.; Stres, B. Rhizosphere bacteria and fungi associated with plant growth in soils of three replanted apple orchards. Plant Soil 2015, 395, 317–333. [Google Scholar] [CrossRef]
  50. Basu, A.; Prasad, P.; Das, S.N.; Kalam, S.; Sayyed, R.Z.; Reddy, M.S.; El Enshasy, H. Plant growth promoting rhizobacteria (PGPR) as green bioinoculants: Recent developments, constraints, and prospects. Sustainability 2021, 13, 1140. [Google Scholar] [CrossRef]
  51. Doornbos, R.F.; Van Loon, L.C.; Bakker, P.A. Impact of root exudates and plant defense signaling on bacterial communities in the rhizosphere. A review. Agron. Sustain. Dev. 2012, 32, 227–243. [Google Scholar] [CrossRef]
  52. Rutgers, M.; Wouterse, M.; Drost, S.M.; Breure, A.M.; Mulder, C.; Stone, D.; Creamer, R.E.; Winding, A.; Bloem, J. Monitoring soil bacteria with community-level physiological profiles using Biolog™ ECO-plates in the Netherlands and Europe. Appl. Soil Ecol. 2016, 97, 23–35. [Google Scholar] [CrossRef]
  53. Philippot, L.; Raaijmakers, J.M.; Lemanceau, P.; Van der Putten, W.H. Going back to the roots: The microbial ecology of the rhizosphere. Nat. Rev. Microbiol. 2013, 11, 789–799. [Google Scholar] [CrossRef] [PubMed]
  54. Holland, T.C.; Bowen, P.A.; Bogdanoff, C.P.; Lowery, T.D.; Shaposhnikova, O.; Smith, S.; Hart, M.M. Evaluating the diversity of soil microbial communities in vineyards relative to adjacent native ecosystems. Appl. Soil Ecol. 2016, 100, 91–103. [Google Scholar] [CrossRef]
  55. Rodrigo-Comino, J.; Brevik, E.C.; Cerdà, A. The age of vines as a controlling factor of soil erosion processes in Mediterranean vineyards. Sci. Total Environ. 2018, 616, 1163–1173. [Google Scholar] [CrossRef] [PubMed]
Figure 1. Analysis of the correlation network heat map between pear fruit quality and soil physicochemical indexes in different planting years. TN: total nitrogen; TK: total potassium; TP: total phosphorus; AN: available nitrogen; AK: available potassium; AP: available phosphorus; OM: organic matter; SU: sucrose; VC: vitamin C; RS: reducing sugar; TA: total acid.
Agriculture 14 00226 g001
Figure 2. Soil microbiomass carbon (A) and microbial biomass nitrogen (B) in pear of different ages. Different letters above the bars indicate significant differences (p < 0.05). 5y: 5 planting year; 20y: 20 planting year; 30y: 30 planting year; 40y: 40 planting year.
Agriculture 14 00226 g002
Figure 3. Changes in AWCD values of carbon sources utilized by rhizosphere soil microorganisms of pear trees with different planting years. 5y: 5 planting year; 20y: 20 planting year; 30y: 30 planting year; 40y: 40 planting year.
Agriculture 14 00226 g003
Figure 4. Utilization rate of carbon sources by rhizosphere soil microorganisms of pear trees with different planting years. Data are represented as means and standard errors (n = 3). Different letters above the bars indicate significant differences (p < 0.05). 5y: 5 planting year; 20y: 20 planting year; 30y: 30 planting year; 40y: 40 planting year.
Agriculture 14 00226 g004
Figure 5. OPLS-DA model and S-plot of Biolog data of the rhizosphere soil bacterial community functional diversity in pear trees of different ages. (A) OPLS-DA models of the fitting degree test of pear trees of different ages; (B) analysis of carbon source utilization of pear trees of different ages by the OPLS-DA model; (C) OPLS-DA loading diagram for carbon source utilization of pear trees of different ages; red dots represent different substances in pear trees of different ages, and the green dots represent no difference in substances in pear trees of different age; p[1] represents the correlation coefficient between the principal component and the index; p(corr)[1] represents the correlation coefficient between the principal component and the index; (D) heat maps for carbon source utilization of pear trees of different ages; the red is up-regulated and the blue is down-regulated; the darker the color, the greater the utilization rate. 5y: 5 planting year; 20y: 20 planting year; 30y: 30 planting year; 40y: 40 planting year.
Agriculture 14 00226 g005
Figure 6. Redundancy analysis (RDA) of Biolog data and soil physicochemical indexes, pear fruit quality. 5y: 5 planting year; 20y: 20 planting year; 30y: 30 planting year; 40y: 40 planting year. TN: total nitrogen; TK: total potassium; TP: total phosphorus; OM: organic matter; AP: available phosphorus; SU: sucrose. The black letters indicate 31 different carbon sources.
Agriculture 14 00226 g006
Table 1. Effect of different planting years on pear quality.
TreatmentSucrose (g/kg)Reducing Sugar (g/kg)Vitamin C (mg/kg)Total Acid (g/kg)
5 years5.53 ± 0.70 c40.1 ± 1.45 c51.67 ± 0.21 c1.77 ± 0.01 a
20 years16.67 ± 0.75 a69.67 ± 1.00 a70.43 ± 0.70 a1.13 ± 0.06 c
30 years16.07 ± 0.87 a70.23 ± 2.33 a70.00 ± 1.95 a1.14 ± 0.02 c
40 years10.1 ± 0.75 b55.2 ± 1.15 b65.90 ± 2.12 b1.26 ± 0.02 b
Note: Data are represented as means and standard errors (n = 3). Different lowercase letters represent significant differences at p < 0.05.
Table 2. Soil physicochemical indexes in the rhizosphere soil of pear trees with different planting years.
Index5 Years20 Years30 Years40 Years
pH4.57 ± 0.09 c5.49 ± 0.15 a4.93 ± 0.06 b4.14 ± 0.06 d
Total N (g/kg)5.00 ± 0.50 c8.83 ± 0.17 a4.33 ± 0.17 c7.67 ± 0.17 b
Total P (g/kg)0.05 ± 0.01 d0.07 ± 0.01 c0.10 ± 0.01 b0.13 ± 0.01 a
Total K (g/kg)7.15 ± 0.84 a3.99 ± 0.11 c5.87 ± 0.21 ab5.65 ± 0.17 b
Available N (mg/kg)39.67 ± 2.33 a11.67 ± 2.33 c18.2 ± 2.65 bc25.67 ± 2.33 b
Available P (mg/kg)13.03 ± 2.00 a6.50 ± 0.23 b15.75 ± 2.27 a11.67 ± 9.95 ab
Available K (mg/kg)132.14 ± 5.33 c116.49 ± 5.33 d228.82 ± 1.33 a186.67 ± 2.02 b
Organic matter (%)12.75 ± 0.79 b21.85 ± 0.79 a15.93 ± 0.46 b20.94 ± 0.79 a
Water (%)14.32 ± 0.76 c18.36 ± 0.38 b20.61 ± 0.74 b23.32 ± 0.69 a
Note: Data are represented as means and standard errors (n = 3). Different lowercase letters represent significant differences at p < 0.05.
Table 3. Microbial diversity index in the rhizosphere soil of pear trees with different planting years.
TreatmentSimpson IndexShannon IndexChao1
5 years0.990 ± 0.001 c4.270 ± 0.017 b0.861 ± 0.003 b
20 years0.982 ± 0.001 c4.383 ± 0.050 a0.884 ± 0.010 a
30 years1.007 ± 0.005 b4.413 ± 0.034 a0.890 ± 0.007 a
40 years1.036 ± 0.013 a4.304 ± 0.030 b0.868 ± 0.006 b
Data are represented as means and standard errors (n = 3). Different letters above the bars indicate significant differences (p < 0.05).
Disclaimer/Publisher’s Note: The statements, opinions and data contained in all publications are solely those of the individual author(s) and contributor(s) and not of MDPI and/or the editor(s). MDPI and/or the editor(s) disclaim responsibility for any injury to people or property resulting from any ideas, methods, instructions or products referred to in the content.

