Abstract
Accurate extraction of cropland distribution information using remote sensing technology is a key step in the monitoring, protection, and sustainable development of black soil. To obtain precise spatial distribution of cropland, an information extraction method is developed based on a fractal algorithm integrating temporal and spatial features. The method extracts multi-seasonal fractal features from the Landsat 8 OLI remote sensing data. Its efficiency is demonstrated using black soil in Lishu County, Northeast China. First, each pixel’s upper and lower fractal signals are calculated using a blanket covering method based on the Landsat 8 OLI remote sensing data in the spring, summer, and autumn seasons. The fractal characteristics of the cropland and other land-cover types are analyzed and compared. Second, the ninth lower fractal scale is selected as the feature scale to extract the spatial distribution of cropland in Lishu County. The cropland vector data, the European Space Agency (ESA) WorldCover data, and the statistical yearbook from the same period are used to assess accuracy. Finally, a comparative analysis of this study and existing products at different scales is carried out, and the point matching degree and area matching degree are evaluated. The results show that the point matching degree and the area matching degree of cropland extraction using the multi-seasonal fractal features are 90.66% and 96.21%, and 95.33% and 83.52%, respectively, which are highly consistent with the statistical data provided by the local government. The extracted accuracy of cropland is much better than that of existing products at different scales due to the contribution of the multi-seasonal fractal features. This method can be used to accurately extract cropland information to monitor changes in black soil, and it can be used to support the conservation and development of black soil in China.
1. Introduction
Black soil, which is marked by black or dark black humus topsoil, is a valuable natural resource and the most fertile soil in the world [1]. Due to the impact of global warming and human activities, black soil has been exposed for a long time in some areas, and its soil structure degrades as wind and water erosions intensify [2,3]. This poses a severe challenge to the sustainable development of agriculture and food security in China. In response to the urgency to protect black soil, the Action Plan for Conservation Tillage in Northeast China (2020–2025) is jointly issued by the Ministry of Agriculture and Rural Affairs and the Ministry of Finance. This action plan is issued to deploy comprehensive promotion and application of conservation tillage in appropriate areas to ensure the sustainable development of black soil. The quality of black soil has changed and degraded markedly due to frequent human activities on the global and regional scales. Accurately determining the amount and spatial distribution of cropland on black soil is beneficial to the national government when implementing special protection measures to reduce the loss of black soil and improve the quality of black land. Information extraction is essential to implement conservation measures for the spatial distribution of cropland in black soil areas.
Remote sensing technology is an efficient way to realize large-scale cropland monitoring. Current research mainly focuses on extracting ground object information accurately. The spectral features, temporal features, and spatial features of remote sensing data are used for classification. Spectral features are the physical properties of natural materials, which generally refer to the absorption, reflection, and transmission of electromagnetic radiation of ground objects. Temporal features are the features that change in different time phases. Spatial features refer to the laws of spatial relationships between ground object pixels in remote sensing images through numerical operations. Classification methods based on spectral features generally analyze the spectral curves of ground objects to classify them. Machine learning-based algorithms, such as decision trees, support vector machines, random forests, and deep learning-based algorithms, have been used broadly [4,5,6,7,8,9]. These methods require mass training samples and significant time spent controlling the samples’ quality and adjusting complex model parameters to obtain the optimal results. Classification methods based on temporal features mainly focus on the analysis of time series to obtain the changes in the features of ground objects to reduce the influence of incomplete information brought by the use of a single temporal phase. However, the frequently used low-resolution MODIS data have limitations for features with a more fragmented distribution [10]. Moreover, it is necessary to reduce the influence of data redundancy of long-time series of remote sensing images. Classification methods based on spatial features are independent of mixed pixels and can directly extract the gray structure features of images. Examples are the gray-level co-occurrence matrix [11], fractal analysis [12], Fourier transform, wavelet transform, gray edge detection, variance function, and so on. However, there are some limitations in applying these methods to regions without directivity and regularity of texture features of images, such as optical images of mining areas [13]. Regarding the selection of data sources, some studies use many high-resolution images to obtain sufficient spatial features of their targets [14,15,16], such as planet 4, GF-2, and WorldView-2. Compared to a single feature, numerous studies have begun to combine multiple features to achieve higher accuracy. Combining spectral and temporal features can use spectral diversity and improve recognition ability of changes in ground object features [17,18]. Integrating temporal and spatial features can retain the law of ground objects changing with time and reduce the influence of mixed pixels [19,20].
The distribution area of black soil in Northeast China, which comprises complex and heterogeneous environmental conditions and vegetation growth environments, is not suitable for extracting information using traditional methods. However, the main crops in this area have a concentrated growing period that differs significantly from natural vegetation, which is appropriate for extracting cropland information using remote sensing images’ multi-seasonal features. Multi-seasonal remote sensing data are widely used for change detection and information extraction. The fusion of multi-seasonal data can compensate for the lack of information in single-temporal data so that the seasonal change information of ground objects can be effectively used for improving accuracy. When combined with various information extraction techniques, the feature information of ground objects is enhanced, and the accuracy of information extraction is improved [21,22,23]. To reduce the effect of mixed pixels, spatial feature classification methods, such as the fractal method, can be combined with multi-seasonal features to improve extraction accuracy. Fractal is a regional algorithm for the iterative processing of surface textures without selecting training samples. The texture information of natural objects may show a certain degree of statistical self-similarity within a limited range, which demonstrates that the fractal method can be used for iterative processing when extracting information from ground objects to narrow the scope and highlight the features of ground objects. Existing results suggest that the fractal method can reveal important differences in land use and land-cover types [12], improve classification accuracy, and reduce computational time to some extent [24,25]. Various studies have been conducted using fractal algorithms based on large-scale data with low spatial resolution [26]. However, for small-scale studies, the temporal variation of cropland has been neglected [27].
In this study, the multi-seasonal features of the Landsat 8 OLI remote sensing data were introduced into a fractal algorithm to improve classification accuracy, taking both temporal and spatial features into account, and the developed method was developed with existing products. The remainder of this paper is organized as follows: Section 2 introduces the data and the method used. The accuracy of the processing results was evaluated and compared with existing products at different scales, and the results are presented in Section 3. Section 4 discusses the applicability and uncertainty of the method developed in this study, and Section 5 provides a summary of this study.
2. Materials and Methods
2.1. Study Area
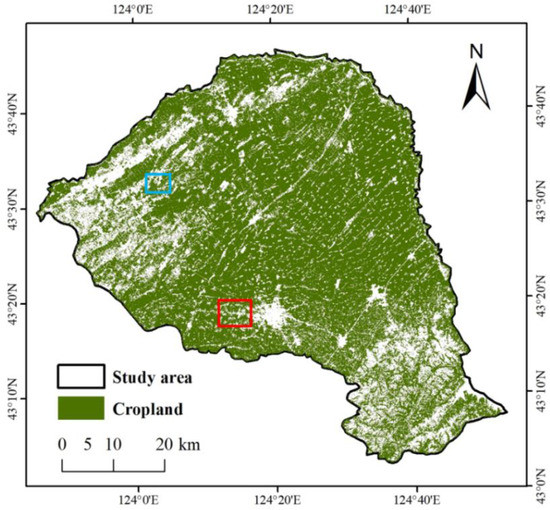
Lishu County (Figure 1), which is located in the western part of Jilin province, China, has a temperate humid and semi-humid monsoon climate with a low annual temperature, with plains in the north and hills in the southeast. Many soil types in this area, mainly including black soil, black calcium soil, light black calcium soil, and brown soil, belong to the typical thin black soil area of Northeast China [28]. The main land-cover types include cropland, forest, grassland, impervious surfaces, bare land, and water. This area has a large cropland, accounting for more than 80% of the county. It is a veritable central grain-producing area in this region and plays an irreplaceable role in ensuring China’s food security. Maize, rice, and soybean are the main crops, and deciduous trees are the main natural vegetation. The growth period of each crop is concentrated and different from that of natural vegetation, which is suitable for extracting information from croplands using multi-seasonal data. Since 2007, the national government has established a research demonstration area in Lishu County in conjunction with various scientific research institutes and put forward a black soil protection project named the Lishu Model, which is committed to protecting the sustainable development of black soil. The complex spatial heterogeneity of the region and frequent human activities lead to land cover changes in the area.
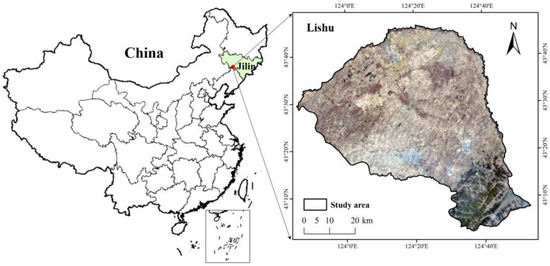
Figure 1.
Location of the study area.
2.2. Data and Data Processing
2.2.1. Remote Sensing Data
The Landsat 8 OLI data covering 2020 were freely downloaded from https://www.gscloud.cn (accessed on 7 October 2021), a data cloud computing and product distribution platform provided by the Geospatial Data Cloud site, Computer Network Information Center, Chinese Academy of Sciences. The data used in this study were level 1T standard terrain correction products, which were accurately corrected using ground control sites and digital elevation model data. The principle of data selection was cloudless or partly cloudy (<2%) to ensure monthly coverage as much as possible. According to Figure 2, the main crops are planted from April to May. The peak growth period for the crops is July to August, and the harvest period is September to October. Therefore, the Landsat 8 OLI satellite products on 1 April 2020, 22 July 2020, and 10 October 2020, were selected as the basic data to represent the spring, summer, and autumn seasons, respectively. Seven multispectral bands of the Landsat 8 data for each season were selected, and the detailed information is shown in Table 1. A sequence dataset with 21 bands was obtained in the order of spring, summer, and autumn, which was used for fractal processing.
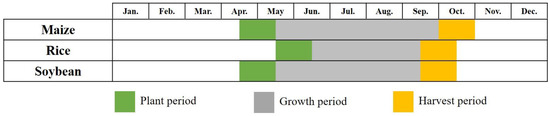
Figure 2.
The main crop periods in the study area.

Table 1.
The remote sensing images selected in this study.
2.2.2. Reference Data
The reference data included a statistical yearbook, the vector data, the European Space Agency (ESA) WorldCover data, and three land-cover products from the same period. The statistical yearbook, the vector data, and the ESA WorldCover data were used for accuracy evaluation, and the other three products were used for the comparative analysis in this study. Detailed information of the selected data is shown in Table 2.
Table 2.
Detailed information of the selected data for Lishu County in 2020.
(1) Statistical yearbook of Lishu County in 2020. The statistical yearbook was produced by the Government of Lishu County and obtained through questionnaires, field visits, and field measurements; thus, it provides highly suitable data for accuracy evaluation.
(2) Vector data of Lishu (2020). The vector data of cropland in Lishu County in 2020 were produced based on a human–computer interactive interpretation using the Landsat images from the Institute of Geographic Sciences and Natural Resources Research, Chinese Academy of Sciences, with a mapping scale of 1:100,000 and including 6 classes and 25 subclasses [29]. Standard quality control and integration checking for each dataset were implemented using many field survey photographs and records during the same period to ensure high-quality and consistent interpretation. Therefore, the vector data are the most reliable and comparable data available in the area during the same period, and the data had been widely applied to estimate the accuracies of different classification results [30,31]. The vector data (Figure 3) were used as the main reference data for the accuracy evaluation of information extraction.
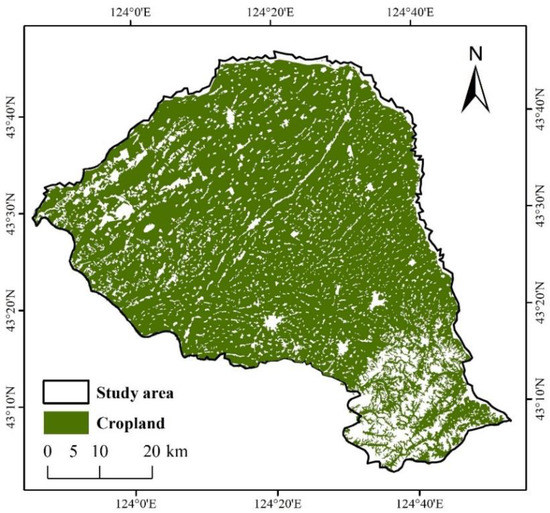
Figure 3.
The distribution of cropland in the vector data.
(3) ESA WorldCover data (2020). The ESA WorldCover data provide a global land cover map for 2020 at a 10 m resolution based on the Sentinel-1 and Sentinel-2 data [32], The dataset contains 11 different land-cover classes, including tree cover, shrubland, grassland, cropland, built-up, bare/sparse vegetation, snow and ice, permanent water bodies, herbaceous wetland, mangroves, moss and lichen, and achieves an overall accuracy of 74.4%. Figure 4 is the cropland distribution in the ESA WorldCover data for Lishu County, and the data were used for accuracy evaluation.
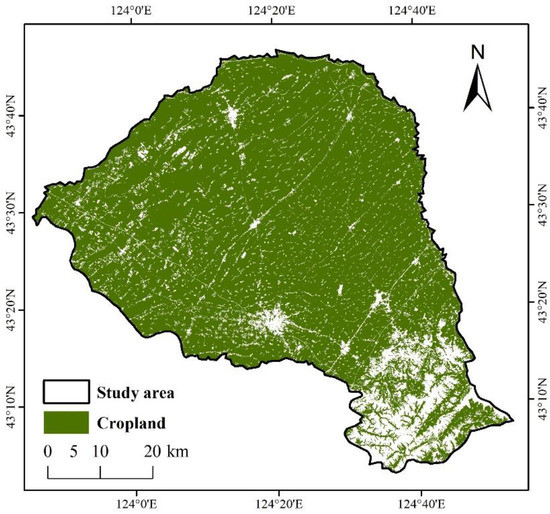
Figure 4.
The distribution of cropland in the ESA WorldCover data.
(4) Esri land cover dataset (2020). A global land-cover map using the Sentinel-2 images was produced by a deep learning model trained using over 5 billion hand-labeled Sentinel-2 pixels and sampled from over 20,000 sites distributed across all major biomes of the world, with a resolution of 10 m [33]. It provides a 10-class map of the surface, including water, tree, grass, flooded vegetation, crop, built area, bare ground, shrub, snow/ice, and clouds, and it achieves an overall accuracy of 85% across the ten classes. In this study, the distribution of cropland (Figure A1) was used as a reference for the comparative analysis.
(5) GlobeLand30 dataset (2020). A global land-cover data product with a spatial resolution of 30 m was provided by the National Geographic Information Centre of China [34], which mainly includes ten land-cover types: cropland, forest, grassland, shrubland, wetland, water, tundra, artificial land, bare land, and glacier/permanent snow. The overall accuracy of the GlobeLand30 dataset in 2020 was 85.72%, and the kappa coefficient was 0.82. This product (Figure A2) was also used for the comparative analysis of cropland information extraction.
(6) China Land Use and Land Cover Dataset (CNLUCC) (2020). This dataset was generated by the Resources and Environmental Science and Data Center (RESDC) of the Chinese Academy of Sciences based on Landsat 8 images through manual visual interpretation [35]. The land-cover types include cropland, woodland, grassland, water, residential land, unused land, and 25 secondary classifications, with a spatial resolution of 1000 m. This dataset (Figure A3) was used as a reference for the comparative analysis.
2.2.3. Data Processing
The downloaded remote sensing data and reference data for the study area were first converted by file formatting and re-projected into the UTM Zone 51 N with the WGS84 datum using nearest neighbor resampling. A spatial subset was extracted according to the boundary of Lishu County. Next, all raster data were converted into vector data using the Conversion Tools. Data processing was supported by ENVI 5.3 and ArcGIS 10.6, and the fractal programming operations were performed using IDL 8.5.
2.3. Methods
Figure 5 shows the flowchart of the information extraction method developed in this study. Firstly, data preprocessing was achieved, and fractal processing of the multi-seasonal images was used to select the feature-scale image of cropland. Secondly, cropland information was extracted using the degree of separation between cropland and other land-cover types in the statistical curve of the feature-scale image. An accuracy evaluation of the information extraction results was conducted using overlay analysis. Thirdly, through the comparison with other products, especially the local comparative analysis, the advantages and disadvantages of the method were summarized.
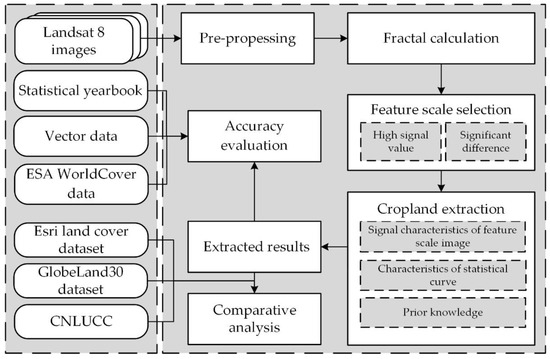
Figure 5.
Flowchart of the information extraction method.
This method was divided into four aspects, including the principle of the blanket covering method, the feature-scale selection method, the information extraction method, and the accuracy evaluation metrics.
2.3.1. Blanket Covering Method
The blanket covering method can be used in remote sensing for texture analysis, pattern recognition, and image classification. The purpose of the method is to treat a remote sensing image as a three-dimensional space, with the gray value of each pixel representing the height of the three-dimensional surface, and then sandwich the terrain surface with two blankets, with both the upper and lower blankets at a distance of from the terrain surface. The fractal dimension can be calculated from the relationship between the area of the blanket and the volume of the space surrounded by these two blankets [36]. This study used a mathematical transformation iterative analysis from the perspective of signal analysis to select the feature scales of different land-cover types. The fractal dimension of each image’s element spectral curve was calculated from the mathematical relationship between the area enclosed by the upper and lower two-dimensional curves and the lengths of these two curves. The specific calculation details are shown in [36,37].
The spectral curve is formulated as a function of ( = 1, 2, 3, …, , where is the number of samples in the band series selected), with two curves at a distance above and below the curve, which are called the upper fractal curve () and the lower fractal curve (), respectively, and is the measurement scale.
where is the value of discrete points in close proximity to .
According to the polygon area surrounded by these two curves and Mandelbrot’s definition of curve length, the upper curve length and the lower curve length can be calculated using the following formula:
where is the area of the upper curve enclosed by the proposed curve at measurement scale , and is the area of the upper curve enclosed by the proposed curve at measurement scale . Similarly, is the area of the lower curve enclosed by the proposed curve at measurement scale , and is the area of the lower curve enclosed by the proposed curve at measurement scale .
According to Equations (3) and (4), the measurement scale ( and the left and right neighbors are taken from the upper and lower curves, respectively, and three points (, ), (, ), (, ) are obtained. The slope of the line is the fractal signal value of the current scale . Finally, the upper and lower fractal signal values for each image are calculated to obtain the upper and lower fractal images. The fractal signal of each pixel in the remote sensing image is calculated using different measurement scales.
2.3.2. Feature Scale Selection Method
The fractal signal images and fractal signal variation curves were obtained at different measurement scales. The signal value of each pixel in the fractal signal image reflects the complexity of the variation of the time series curve comprising 21 bands of three seasons for a certain measurement scale. The time series curve for ground objects with more complex variation has a much higher fractal signal value.
The fractal signal images and the fractal signal variation curves were combined for a comprehensive evaluation to select feature scales of different targets. The scale with a high signal value of the land-cover type and a significant difference from other land-cover types is the feature scale of this land-cover type.
2.3.3. Information Extraction Method
An appropriate threshold range for information extraction determines the accuracy of the final extraction results. The feature-scale images selected can adequately distinguish the target land-cover type from other land-cover types, so the steps of information extraction based on the feature-scale images were carried out in this study. First, the rough distribution interval of the fractal signal value of the target land-cover type was determined based on the fractal signal curve of the sampling statistics and the feature-scale images. Second, all pixels of the feature-scale images were counted to obtain a statistical curve, and the suitable threshold value of image segmentation was selected according to the change characteristics of the curve. Finally, by combining prior knowledge, information extraction was carried out according to the determined threshold.
2.3.4. Accuracy Evaluation Metrics
This study measured the extraction accuracy using a spatial analysis algorithm. Firstly, a spatial location analysis was carried out using the overlay analysis of the data to be evaluated and the reference data. Secondly, the area’s similarity was compared, and the two indicators, including the point matching degree and the area matching degree, were combined for a comprehensive evaluation.
The point matching degree refers to the degree to which the extracted results match the reference data space. The extraction results and the reference vector data of cropland were matched at the spatial boundary, and their intersection was obtained. The spatial position attributes were counted and compared to the reference vector. The point matching degree reflects the spatial relationship between the extracted results and the reference vector. The higher the point matching degree, the higher the coincidence degree of the two kinds of data.
The area matching degree refers to the similarity between the extracted results and the reference data. The calculation method used was the ratio of the extracted area of cropland to the cropland area in the reference data, in which the cropland area was calculated using vector geometric statistics, as shown in Equation (5):
where is the extracted area of cropland; is the cropland area of the reference data; and is the area matching degree, which reflects the relationship between the extracted result and the area value of the reference data. The higher the area matching degree, the closer the area value of the two sets of data.
3. Results
3.1. Fractal Processing and Feature Analysis
According to the survey data and the land-cover classification products, six typical land-cover types, including cropland, grassland, impervious surface, forest, water, and bare land, were selected for the fractal feature analysis. Six pixels of each type were randomly selected from the upper and lower fractal signal images, respectively. Their average was considered as the fractal signal value of the variation curves in Figure 6. As shown in Figure 6, the variation curves of the upper and lower fractal signal values of different land-cover types with different scales were calculated, and the horizontal axis “scale” n denotes the nth iteration based on Equations (1) and (2).
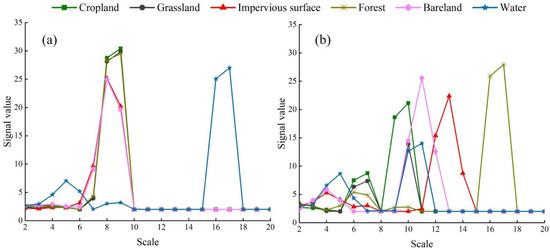
Figure 6.
The variation curves of upper (a) and lower (b) fractal signals of different land-cover types in Lishu County in 2020.
The fractal features of different land-cover types were analyzed based on the variation curves of the upper and lower fractal signals and have different change features.
(1) Both the upper and lower fractal signal values of different land-cover types are different at the same scale, and the fractal signal value of the same land-cover type significantly differs at different scales.
(2) For the variation curve of the upper fractal signal, the variations are concentrated at the third to tenth and fifteenth to eighteenth scales. The variations in the lower fractal signal variation curve are mainly concentrated at the second to eighteenth scales.
(3) The fractals can selectively highlight the features of different land-cover types at specific scales. Taking cropland as an example, cropland is reflected at the eighth and ninth scales of the upper fractal signal curve, and at the ninth and tenth scales of the lower fractal signal curve. According to the method of feature scale selection and significant differences in fractal features for different land-cover types, the ninth scale of the lower fractal was selected as the fractal feature scale of cropland, as depicted in Figure 7.
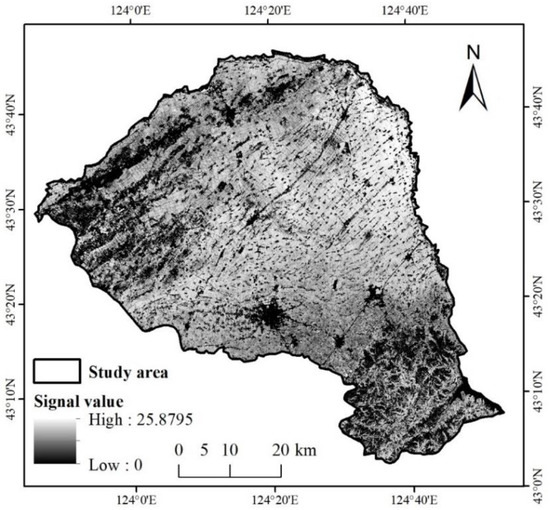
Figure 7.
Lower fractal image at the ninth scale.
3.2. Cropland Information Extraction and Accuracy Evaluation
According to Figure 6b and the feature-scale image in Figure 7, the fractal signal values of cropland and other land-cover types differ and have an obvious separation. Figure 6b shows that the signal value of cropland is concentrated around 20, while those of other land-cover types are concentrated around 2. However, the result of Figure 6b was calculated based on the sampling sites and only represents the approximate range of signal values of each land-cover type. Therefore, we plotted a statistical curve of the fractal signal values of all pixels at the feature scale, which reflects the relationship between the fractal signal value and the number of pixels, as shown in Figure 8. As the signal value increases, the number of pixels shows the characteristics of sharp increase, sharp decrease, slow increase, and slight decrease, and finally tends to be smooth. Specifically, the number of pixels reaches the highest value at a signal value of 2 and decreases sharply to a trough at a signal value of 7.30 (blue point in Figure 8). Then, the number of pixels starts to increase slowly with an increase in the signal value and reaches a peak at a signal value of 17.68, which is generally consistent with the result obtained for cropland, as shown in Figure 6b. Finally, the number of pixels begins to decrease slowly. After the signal value of 21.58 (green point in Figure 8), the number of pixels begins to smooth again. Combined with the actual spatial distribution of cropland in the remote sensing image, we determined that the signal segmentation threshold of cropland is from 7.30 to 21.58 in the feature-scale image, and we extracted the spatial distribution of cropland, as shown in Figure 9.
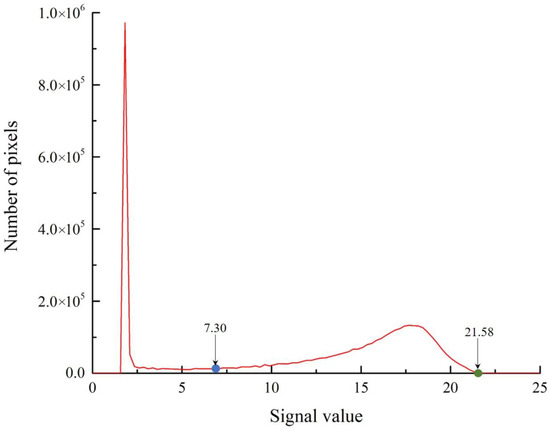
Figure 8.
Statistical curve of the feature-scale image.
An accuracy assessment of the results was conducted using the vector data (Figure 3) and the ESA WorldCover data (Figure 4) of cropland in Lishu County in 2020. The extracted area of cropland based on the fractal method is 2759.86 km2, and the total areas of cropland in the vector data and the ESA WorldCover data are 2659.10 km2 and 3304.54 km2, respectively. Compared to the vector data and the ESA WorldCover data, according to Equation (5) and the matching methods developed in this study, the calculated area matching degree of cropland extraction is 96.21% and 83.52%, respectively, and the point matching degree is 90.66% and 95.33%, respectively. The extracted results show that cropland located in the central, eastern, and northern plain areas has a high extraction accuracy, while cropland located in the southeastern mountainous and hilly areas and northwestern plain areas has a low extraction accuracy.
3.3. Comparative Analysis of Fractal Extracted Results with Existing Products
3.3.1. Comparative Analysis for the Extracted Area of Cropland
A comparative analysis of this study and existing products was performed. The existing products were selected, including the Esri land cover dataset, the GlobeLand30 dataset, and the CNLUCC, and the statistical yearbook, vector data, and ESA WorldCover data of Lishu County were employed for evaluating the accuracies. The area matching degree and point matching degree were used to evaluate the accuracy of the comparative analysis, and the comparison results are shown in Table 3.
Table 3.
Comparative analysis results.
For the statistical yearbook data, the cropland area is 2625.33 km2, and the cropland areas of the extracted data and the other three products are 2759.86 km2, 3074.49 km2, 3151.74 km2, and 3021.39 km2, respectively. Compared to the cropland area of the statistical yearbook, the area matching degree of the extracted data is 94.88%, which is much bigger than other values, as shown in Table 3. For the vector data of Lishu County, the area matching degrees of three products are lower than that of the extracted data (96.21%), ranging from 81.45% to 86.38%. The area matching degree of the extracted data increases by 9.83–14.76%. However, the point matching degrees of the three products are higher than that of the extracted data (90.66%), ranging from 95.86% to 98.74%, because the existing three products have excessive extraction results of the cropland, as shown in Table 3. For the ESA WorldCover data, the area matching degrees of three products are higher than that of the extracted data (83.52%), ranging from 91.43% to 95.38%. However, the point matching degree of the extracted data has the second highest accuracy (95.33%) out of the four datasets. Therefore, given both the area matching degree and point matching degree, these three comparative results suggest that the extraction accuracy of cropland in this study is better than that of existing products at different scales because of the contribution of multi-seasonal fractal features.
3.3.2. Comparative Analysis for the Spatial Distribution of Cropland
The area matching degrees of the extracted results in this study are consistent with the results of the statistical yearbook and the vector data. Still, the point matching degree is slightly lower than that of existing products of different scales. The main feature of fractal geometry can describe irregular or fragmented natural features [37]. Because of multi-seasonal fractal features, many field ridges and roads were finely divided into other land-cover types, leading to fragmentation of the spatial distribution of cropland in this study. However, field ridges and roads are all classed as croplands in the vector data, the ESA WorldCover data, and the existing three products, including the Esri land cover dataset, the GlobeLand30 dataset, and the CNLUCC, as depicted in Figure 10 and Figure 11.
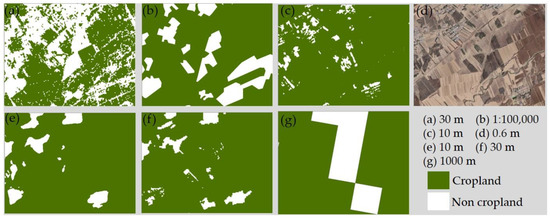
Figure 10.
Comparison of the fractal extraction results (a), vector data (b), ESA WorldCover data (c), Google Earth image (d), Esri land cover dataset (e), GlobeLand30 dataset (f), and CNLUCC (g) located in the blue box in Figure 9.
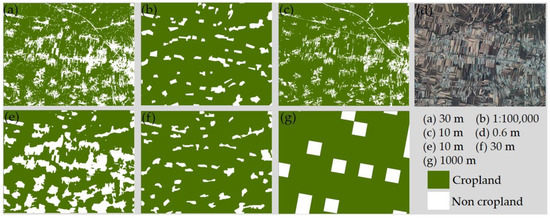
Figure 11.
Comparison of the fractal extraction results (a), vector data (b), ESA WorldCover data (c), Google Earth image (d), Esri land cover dataset (e), GlobeLand30 dataset (f), and CNLUCC (g) located in the red box in Figure 9.
Two typical subsets were selected and analyzed. The first subregion in the blue box in Figure 9 is comprised of cropland, forest, and impervious surface in Lishu County, as depicted in Figure 10. According to Figure 10, the fractal algorithm clearly distinguishes cropland, forest, and impervious surface, and field roads are also accurately identified. In the CNLUCC, the delineations of cropland and other land-cover types need to be more accurate due to their low resolution. The spatial distributions of cropland in the ESA WorldCover data, the Esri land cover dataset, and the GlobeLand30 dataset, are relatively consistent, but part of the forest land is misclassified as cropland. The limited accuracy for these land-cover types might be attributed to the need for training samples in this area and seasonal variations of vegetation used for remote sensing classification.
The second subregion, located in the red box in Figure 9, is mainly dominated by greenhouses in Lishu County, as depicted in Figure 11. According to Figure 11, for the spatial distribution of cropland, the fractal extracted results are much better than the results of the CNLUCC, worse than the results of the vector data, the GlobeLand30 dataset, and the Esri land cover dataset, and are relatively consistent with the ESA WorldCover data. However, compared to the other products, the fractal method developed in this study could extract cropland outside the greenhouses with high accuracy and clearly identify the outline of the greenhouses according to the Google Earth image, as depicted in Figure 11a,d.
Therefore, the comparison experiments demonstrated that the fractal extraction method based on multi-seasonal remote sensing data could better distinguish cropland and other land-cover types.
4. Discussion
4.1. Theoretical Assumptions of the Fractal Method Proposed in this Study
The cropland information extracted by the fractal method based on multi-seasonal remote sensing data developed in this study was effective. Firstly, fractal analysis methods are sensitive to regional variations in land-cover types [38]. In fractal calculation, land cover with more complex variation is easier to distinguish. The impact of a curve’s complexity is embodied in the fractal calculation process. According to Equations (1) and (2), the upper fractal curve tends toward a gradually narrowing trough and smoothing peak, while the inverse is true for the lower fractal curve [39]. After fractal processing, different land-cover types have different feature scales in the upper fractal or lower fractal. For example, water is reflected at the seventeenth scale of the upper fractal signal curve, whilst cropland is reflected at the ninth scale of the lower fractal signal curve in this study, which has been determined by the change characteristic curves of different ground objects [40].
Secondly, Lishu County is mainly dominated by plains with flat terrain, which are suitable for implementing various planting measures. Under the guidance of the “Lishu mode”, the quality of black soil has been improved, which is reflected in the well growth status of crops. The time divisions of sowing, heading, and maturity are obvious, and the spectral curve and texture characteristics differ from those of natural vegetation. Compared to the other land-cover types, cropland has more complex feature curve changes at different time stages, and the corresponding texture information is richer. In the fractal calculation, the boundary of cropland converges faster than the other land-cover types, and the fractal features are much easier to distinguish [26].
Finally, by combining multi-seasonal remote sensing images with a fractal analysis algorithm, the method proposed in this study can accurately obtain the spatial distribution of cropland and reduce the time required to select samples. Moreover, the Chinese governments have attached great importance to the conservation of black soil in Northeast China and clearly stated that effective measures should be taken to protect this precious resource. Therefore, supported by the National Key Research and Development Program of China, this method is being applied to extract cropland information for spatial and temporal analysis to evaluate the effectiveness and sustainability of local government projects.
4.2. Uncertainty Analysis of Fractal Method
Although the proposed method achieved satisfactory results, further improvement can be conducted from three aspects. The first one is the spatial resolution of the remote sensing images used. The Landsat 8 OLI data with a resolution of 30 m might have led to additional uncertainty in this study. High-resolution data, such as GF-2 or WorldView-3, should be integrated for the information extraction of cropland. Secondly, the inconsistency of land use and land cover nomenclature for different remote sensing data products might have affected the accuracy assessment of cropland extraction. Thirdly, although the main reference data were obtained using the vector data with a scale of 1:100,000 and the ESA WorldCover data at a 10 m resolution, systematic validations at different scales and regions should be employed to enhance the suitability of the method developed in this study for future implementation. In addition, the relation of the feature scale with a number of sampling sites results in poor comparability for different remote sensing images that have originated from different phases or sensors.
5. Conclusions
This study proposed an information extraction method of cropland based on multi-seasonal fractal features, and its performance was demonstrated in a case study of Lishu County, China. The results showed that fractals could reveal clear separations of different land-cover types at different scales, and the ninth scale of the lower fractal signal was selected as the fractal feature scale for cropland. Compared to the vector data and the ESA WorldCover data, the point matching degree and the area matching degree of cropland extraction based on multi-seasonal fractal features were 90.66% and 96.21%, and 95.33% and 83.52%, respectively, which were highly consistent with the data derived from the statistical yearbook. The extracted accuracy of cropland in this study was much better than that of existing products at different scales. This method can accurately extract cropland information and provide technical support for change monitoring, conservation, and development of black soil in China.
Author Contributions
Conceptualization, S.D., P.G. and Q.W.; methodology, Q.W.; software, Q.W.; validation, Q.W.; formal analysis, P.G.; investigation, Y.L. and Y.P.; resources, C.L.; data curation, Q.W.; writing—original draft preparation, Q.W.; writing—review and editing, P.G. and S.D.; visualization, S.D.; supervision, P.G.; project administration, S.D.; funding acquisition, S.D. All authors have read and agreed to the published version of the manuscript.
Funding
This research was funded by the National Key Research and Development Program of China (Grant Number 2021YFD1500203), and the Key Laboratory of Land Satellite Remote Sensing Application, Ministry of Natural Resources of the People’s Republic of China (Grant Number KLSMNR-G202219).
Institutional Review Board Statement
Not applicable.
Informed Consent Statement
Not applicable.
Data Availability Statement
Not applicable.
Conflicts of Interest
The authors declare no conflict of interest.
Appendix A

Figure A1.
The distribution of cropland in the Esri land cover dataset.
Figure A1.
The distribution of cropland in the Esri land cover dataset.


Figure A2.
The distribution of cropland in the GlobeLand30 dataset.
Figure A2.
The distribution of cropland in the GlobeLand30 dataset.


Figure A3.
The distribution of cropland in the CNLUCC.
Figure A3.
The distribution of cropland in the CNLUCC.

References
- Yao, Q.; Liu, J.; Yu, Z.; Li, Y.; Jin, J.; Liu, X.; Wang, G. Three years of biochar amendment alters soil physiochemical properties and fungal community composition in a black soil of northeast China. Soil Biol. Biochem. 2017, 110, 56–67. [Google Scholar] [CrossRef]
- Xie, Y.; Lin, H.; Ye, Y.; Ren, X. Changes in soil erosion in cropland in northeastern China over the past 300 years. Catena 2019, 176, 410–418. [Google Scholar] [CrossRef]
- Yang, X.M.; Zhang, X.P.; Deng, W.; Fang, H.J. Black soil degradation by rainfall erosion in Jilin, China. Land Degrad. Dev. 2003, 14, 409–420. [Google Scholar] [CrossRef]
- Khatami, R.; Mountrakis, G.; Stehman, S.V. A meta-analysis of remote sensing research on supervised pixel-based land-cover image classification processes: General guidelines for practitioners and future research. Remote Sens. Environ. 2016, 177, 89–100. [Google Scholar] [CrossRef]
- Liu, Y.; Zhang, B.; Wang, L.; Wang, N. A self-trained semisupervised SVM approach to the remote sensing land cover classification. Comput. Geosci. 2013, 59, 98–107. [Google Scholar] [CrossRef]
- Belgiu, M.; Drăguţ, L. Random forest in remote sensing: A review of applications and future directions. ISPRS J. Photogramm. 2016, 114, 24–31. [Google Scholar] [CrossRef]
- Tan, Q.; Guo, B.; Hu, J.; Dong, X.; Hu, J. Object-oriented remote sensing image information extraction method based on multi-classifier combination and deep learning algorithm. Pattern Recogn. Lett. 2021, 141, 32–36. [Google Scholar] [CrossRef]
- Martins, V.S.; Kaleita, A.L.; Gelder, B.K.; Da Silveira, H.L.; Abe, C.A. Exploring multiscale object-based convolutional neural network (multi-OCNN) for remote sensing image classification at high spatial resolution. ISPRS J. Photogramm. 2020, 168, 56–73. [Google Scholar] [CrossRef]
- Heydari, S.S.; Mountrakis, G. Meta-analysis of deep neural networks in remote sensing: A comparative study of mono-temporal classification to support vector machines. ISPRS J. Photogramm. 2019, 152, 192–210. [Google Scholar] [CrossRef]
- Qu, L.A.; Chen, Z.; Li, M. CART-RF Classification with Multifilter for Monitoring Land Use Changes Based on MODIS Time-Series Data: A Case Study from Jiangsu Province, China. Sustainability 2019, 11, 5657. [Google Scholar] [CrossRef]
- Sulochana, S.; Vidhya, R. Texture based image retrieval using framelet transform-gray level co-occurrence matrix (GLCM). Int. J. Adv. Res. Artif. Intell. 2013, 2, 68–73. [Google Scholar] [CrossRef]
- Dong, P. Fractal signatures for multiscale processing of hyperspectral image data. Adv. Space Res. 2008, 41, 1733–1743. [Google Scholar] [CrossRef]
- Li, H.K. Study on Remote Sensing Monitoring the Rare Earth Mining and Its Environment Impacts and Evaluation in South China; China University of Mining and Technology (Beijing): Beijing, China, 2016. (In Chinese) [Google Scholar]
- Xu, L.; Ming, D.P.; Zhou, W.; Bao, H.Q.; Chen, Y.Y.; Ling, X. Farmland extraction from high spatial resolution remote sensing images based on stratified scale pre-estimation. Remote Sens. 2019, 11, 108. [Google Scholar] [CrossRef]
- Lei, T.C.; Wan, S.; Wu, Y.C.; Wang, H.P.; Hsieh, C.W. Multi-Temporal Data Fusion in MS and SAR Images Using the Dynamic Time Warping Method for Paddy Rice Classification. Agriculture 2022, 12, 77. [Google Scholar] [CrossRef]
- Li, Z.Q.; Chen, S.B.; Meng, X.Y.; Zhu, R.F.; Lu, J.Y.; Cao, L.S.; Lu, P. Full Convolution Neural Network Combined with Contextual Feature Representation for Cropland Extraction from High-Resolution Remote Sensing Images. Remote Sens. 2022, 14, 2157. [Google Scholar] [CrossRef]
- Peña, M.A.; Liao, R.; Brenning, A. Using spectrotemporal indices to improve the fruit-tree crop classification accuracy. ISPRS J. Photogramm. 2017, 128, 158–169. [Google Scholar] [CrossRef]
- Zheng, B.; Myint, S.W.; Thenkabail, P.S.; Aggarwal, R.M. A support vector machine to identify irrigated crop types using time-series Landsat NDVI data. Int. J. Appl. Earth Obs. 2015, 34, 103–112. [Google Scholar] [CrossRef]
- Duan, M.Q.; Song, X.Y.; Liu, X.W.; Cui, D.J.; Zhang, X.G. Mapping the soil types combining multi-temporal remote sensing data with texture features. Comput. Electron. Agric. 2022, 200, 107230. [Google Scholar] [CrossRef]
- Wang, W.J.; Zhang, X.; Zhao, Y.D.; Wang, S.D. Cotton extraction method of integrated muti-features based on multitemporal Landsat 8 images. J. Remote Sens. 2017, 21, 115–124. (In Chinese) [Google Scholar]
- Chen, T.H.K.; Prishchepov, A.V.; Fensholt, R.; Sabel, C.E. Detecting and monitoring long-term landslides in urbanized areas with nighttime light data and multi-seasonal Landsat imagery across Taiwan from 1998 to 2017. Remote Sens. Environ. 2019, 225, 317–327. [Google Scholar] [CrossRef]
- Senf, C.; Leitão, P.J.; Pflugmacher, D.; van der Linden, S.; Hostert, P. Mapping land cover in complex Mediterranean landscapes using Landsat: Improved classification accuracies from integrating multi-seasonal and synthetic imagery. Remote Sens. Environ. 2015, 156, 527–536. [Google Scholar] [CrossRef]
- Clark, M.L. Comparison of simulated hyperspectral HyspIRI and multispectral Landsat 8 and Sentinel-2 imagery for multi-seasonal, regional land-cover mapping. Remote Sens. Environ. 2017, 200, 311–325. [Google Scholar] [CrossRef]
- Pant, T.; Singh, D.; Srivastava, T. Advanced fractal approach for unsupervised classification of SAR images. Adv. Space Res. 2010, 45, 1338–1349. [Google Scholar] [CrossRef]
- Tzeng, Y.C.; Fan, K.T.; Chen, K.S. A parallel differential box-counting algorithm applied to hyperspectral image classification. IEEE Geosci. Remote Sens. Lett. 2012, 9, 272–276. [Google Scholar] [CrossRef]
- Dong, S.W.; Li, H.; Sun, D.F. Fractal feature analysis and information extraction of woodlands based on MODIS NDVI time series. Sustainability 2017, 9, 1215. [Google Scholar] [CrossRef]
- Dong, S.W.; Li, X.H.; Li, H.; Sun, D.F.; Zhang, W.W.; Zhou, L.D. Extraction of cultivated land using ETM+ image based on multiscale fractal signature. Trans. CSAE 2011, 27, 213–218. (In Chinese) [Google Scholar]
- Nearing, M.A.; Xie, Y.; Liu, B.; Ye, Y. Natural and anthropogenic rates of soil erosion. Int. Soil Water Conserv. 2017, 5, 77–84. [Google Scholar] [CrossRef]
- Liu, J.Y.; Liu, M.L.; Tian, H.Q.; Zhuang, D.F.; Zhang, Z.X.; Zhang, W.; Tang, X.M.; Deng, X.Z. Spatial and temporal patterns of China’s cropland during 1990–2000: An analysis based on Landsat TM data. Remote Sens. Environ. 2005, 98, 442–456. [Google Scholar] [CrossRef]
- Zhang, Z.X.; Wang, X.; Zhao, X.L.; Liu, B.; Yi, L.; Zuo, L.J.; Wen, Q.K.; Liu, F.; Xu, J.Y.; Hu, S.G. A 2010 update of National Land Use/Cover Database of China at 1: 100000 scale using medium spatial resolution satellite images. Remote Sens. Environ. 2014, 149, 142–154. [Google Scholar] [CrossRef]
- Du, Y.J.; He, X.L.; Li, X.L.; Li, X.Q.; Gu, X.C.; Yang, G.; Li, W.J.; Wu, Y.G.; Qiu, J. Changes in landscape pattern and ecological service value as land use evolves in the Manas River Basin. Open Geosci. 2022, 14, 1092–1112. [Google Scholar] [CrossRef]
- Zanaga, D.; Van De Kerchove, R.; De Keersmaecker, W.; Souverijns, N.; Brockmann, C.; Quast, R.; Wevers, J.; Grosu, A.; Paccini, A.; Vergnaud, S.; et al. ESA WorldCover 10 m 2020 v100. Zenodo. Available online: https://zenodo.org/record/5571936#.Y_WE5x9ByUk (accessed on 10 January 2023).
- Karra, K.; Kontgis, C.; Statman-Weil, Z.; Mazzariello, J.C.; Mathis, M.; Brumby, S.P. Global land use/land cover with Sentinel 2 and deep learning. In Proceedings of the 2021 IEEE International Geoscience and Remote Sensing Symposium IGARSS, Brussels, Belgium, 11–16 July 2021; pp. 4704–4707. [Google Scholar]
- Chen, J.; Cao, X.; Peng, S.; Ren, H. Analysis and Applications of GlobeLand30: A Review. ISPRS Int. J. Geo-Inf. 2017, 6, 230. [Google Scholar] [CrossRef]
- Xu, X.L.; Liu, J.Y.; Zhang, S.W.; Li, R.D.; Yan, C.Z.; Wu, S.X. China Land Use/Cover Change. Chinese Academy of Sciences Resource and Environmental Science Data Center. Available online: https://www.resdc.cn/DOI/doi.aspx?DOIid=54 (accessed on 7 October 2021).
- Peleg, S.; Naor, J.; Hartley, R.; Avnir, D. Multiple Resolution Texture Analysis and Classification. IEEE Trans. Pattern Anal. Mach. Intell. 1984, PAMI-6, 518–523. [Google Scholar] [CrossRef] [PubMed]
- Sun, W.; Xu, G.; Gong, P.; Liang, S. Fractal analysis of remotely sensed images: A review of methods and applications. Int. J. Remote Sens. 2006, 27, 4963–4990. [Google Scholar] [CrossRef]
- Nayak, S.R.; Mishra, J.; Palai, G. Analysing roughness of surface through fractal dimension: A review. Image Vis. Comput. 2019, 89, 21–34. [Google Scholar] [CrossRef]
- Zhou, Z.Y.; Bu, Q. Research on fractal signature feature of Hyperion hyperspectral image. J. Remote Sens. 2011, 15, 173–182. (In Chinese) [Google Scholar]
- Tang, C.; Chen, J.P.; Cui, J.; Wen, B.T. Lithology feature extraction of CASI hyperspectral data based on fractal signal algorithm. Spectrosc. Spect. Anal. 2014, 34, 1388–1393. [Google Scholar]


Disclaimer/Publisher’s Note: The statements, opinions and data contained in all publications are solely those of the individual author(s) and contributor(s) and not of MDPI and/or the editor(s). MDPI and/or the editor(s) disclaim responsibility for any injury to people or property resulting from any ideas, methods, instructions or products referred to in the content. |
© 2023 by the authors. Licensee MDPI, Basel, Switzerland. This article is an open access article distributed under the terms and conditions of the Creative Commons Attribution (CC BY) license (https://creativecommons.org/licenses/by/4.0/).