Abstract
Most existing greenhouse decision support systems only consider external environmental factors, such as soil and atmosphere, rather than plant response. A conceptual plant-response-based strategy for irrigation and environmental controls for tomato (Solanum lycopersicum) seedling cultivation in greenhouse operations was proposed. Because stomatal conductance (gsw) is a comprehensive indicator of plants, soil moisture, and atmospheric conditions, this study used gsw to design a conceptual system by employing factors affecting gsw as the key for decision-making. Logistic regression was performed with independent variables (i.e., temperature (Tair), vapor pressure deficit (VPD), and leaf–air temperature difference) to predict the gsw status. When the gsw status was “low,” the system entered into the environmental control component, which examined whether the VPD and the photosynthetic photon flux density (PPFD) were in the normal range. If the VPD and the PPFD were not in the normal range, the system would offer a suggestion for environmental control. Conversely, when both parameters were in the normal range, the system would determine that irrigation should be performed and the irrigation amount could be estimated by the evapotranspiration model. Thus, the strategy only considered leaf temperature, Tair, VPD, and PPFD, and the overall error rate to characterize gsw was below 13.36%.
1. Introduction
Climate change has increased the occurrence of extreme climatic events, such as heavy rainfall, drought, and high temperature, thereby posing many challenges to agricultural production. Tomato (Solanum lycopersicum) is an important fruit and vegetable grown in Taiwan. In 2019, tomato was cultivated in an area of approximately 4300 ha in Taiwan, generating an output worth more than USD 132 million. However, in the same year, tomato cultivation losses due to extreme weather influences were close to USD 1 million. Therefore, stabilizing yield and improving quality are crucial for the cultivation of fruits and vegetables, especially tomato. Undoubtedly, facility cultivation can help achieve this goal [1,2]. According to the Markets and Markets [3] report, the global commercial smart greenhouse market size is expected to grow from USD 29.6 billion in 2020 to USD 50.6 billion in 2025, expanding at a compound annual growth rate of 11.3% during the forecast period. Thus, facility agriculture has become a crucial method of agricultural production globally.
Because tomato requires sufficient water throughout the growth period, severe water shortages reduce yield and increase the incidence of blossom-end rot [4]. Although a sufficient water supply during the flowering and fruit setting stages benefits flowering, pollination, and fruit development, ponding should be avoided. Moreover, moderate water control in the late stage of fruit maturity helps improve fruit quality [5]. Therefore, rational water management is vital for tomato production. In addition, both the microclimate in a facility and the plant growth status determine the amount of irrigation required. Therefore, deciding the time and amount of irrigation is critical for greenhouse management. Traditionally, for automated irrigation management in facilities, most farmers have used a timer to regularly drive irrigation or measure the soil water content and air humidity in the facility to ensure that these parameters are in accordance with the irrigation standards, typically neglecting to consider the plant physiological state [6]. However, if an automatically controlled irrigation system is adopted, the problems of irrigation deficiencies or excesses often become unavoidable. Because irrigation remains constant on cloudy and rainy days when using the current irrigation method, it leads to water wastage. In addition, soil moisture is only measured at a few fixed points and, hence, it cannot represent the moisture status of the entire field, because the soil structure is generally nonhomogeneous [7]. More importantly, sometimes, soil moisture may not accurately represent the plant water status [8]. Water uptake pattern depends upon the complex interaction among soil characters and root distribution. Different genotypes have various drought tolerance responses [9]. Therefore, soil moisture is not the best reference for irrigation.
High temperature is another problem associated with greenhouse cultivation in tropical and subtropical regions as it is unfavorable for plant growth. Efficient cooling in greenhouses is now increasingly crucial as the global average temperature is gradually increasing. The currently commonly used cooling methods include ventilation, evaporative cooling, and air conditioning and some auxiliary methods, such as shading, roof water flow or spray, and ground humidification [10,11]. Because tomato is a photophilic plant, the weights of single fruits and the number of fruits are limited in a low-light environment [12]. However, an increase in light intensity also increases the temperature inside the facility. High temperature inhibits photosynthesis [12], and excessive light leads to reactive oxygen species production, causing oxidative stress and, eventually, chlorosis and yellowing [13,14,15]. Therefore, proper shading is required in the presence of excessive light. Although many methods are available to control the greenhouse environment, how to determine the timing of each decision and whether the decision is suitable for plant growth remain pressing questions to resolve.
Decision support systems (DSSs) can assist growers in making more precise and consistent decisions [16,17]. Most current greenhouse environmental controls are intended not only to maintain a specific temperature or vapor pressure deficit (VPD) within the facility but also to adjust light intensity when required. Among the measures, VPD control technology for tomato greenhouses has recently received considerable research attention and has also exhibited good performance [18,19,20,21]. Although greenhouse controls based on atmospheric or soil conditions can improve plant growth and increase crop yield [2], conducting greenhouse control on the basis of plant response is more appropriate and accurate. This is because plant physiological responses result from the interaction of the atmosphere, soil, and plant [22]. Kacira et al. [23] proposed the concept of an environmental control production system with plant responses as the feedback. They contended that a good greenhouse control system should consider both plant response and environmental factors.
Among the physiological responses of plants to drought stress, cell growth is the most sensitive response, followed by stomatal closure [24]. At the initial stage of a drought, stomatal conductance (gsw) first decreases; however, the assimilation ability of mesophyll cells is not affected. Therefore, stomatal closure is generally believed to be the main limiting factor for plant photosynthesis under a mild or moderate drought condition [25,26]. Although the stomata are highly drought-stress sensitive, they are not completely controlled by soil moisture. In fact, gsw is influenced by many external factors and internal plant factors. For a small timescale (i.e., hours and days), light and VPD are the main factors that induce changes in gsw, but air temperature and soil moisture are also critical factors [27]. A VPD integrates the effects of ambient temperature and relative humidity (RH) and is the key factor driving plant transpiration. Regarding the light–gsw relationship, photosynthetic photon flux density (PPFD) and photosynthetic active radiation (PAR) are thought to be positively related to gsw, with an increase in PPFD or PAR increasing gsw until it reaches a stabilization state [28]. Yet, excess light inhibits stomatal opening, leading to stomatal closure, which is one of the factors that limit tomato photosynthesis in greenhouses [29].
Plant temperature (e.g., canopy and leaf temperatures) and the leaf–air temperature difference can be used to indirectly assess plant gsw [30,31,32,33]. In plants under drought stress, gsw is reduced and the heat loss through leaf transpiration is also hindered, thereby increasing plant temperature. Therefore, plant temperature can be effectively used as an indicator of plant water status [34,35,36]. The leaf temperature is often used to represent the crop temperature in some experiments [37].
The aim of this study is to propose a conceptual plant-response-based strategy for irrigation and environmental controls for greenhouse tomato seedling cultivation. The strategy is based on plant response and also considers environmental factors. This study collected physiological and environmental parameters of tomato seedlings under normal and water-deficient statuses to construct the control strategy for a DSS. The strategy first indirectly assessed the gsw status by using the leaf temperature and environmental data; it also used the factors affecting gsw as the key for decision-making. In addition, the amount of irrigation water was estimated using an evapotranspiration model. This strategy is expected to not only meet the needs of tomato growth but also serve as a reference for irrigation and environmental controls for automatic and intelligent tomato seedling cultivation in greenhouses.
2. Materials and Methods
2.1. Experimental Materials and Drought Treatment
The experiment was conducted from June 2018 to March 2021. Eleven batches of the most common tomato variety in Taiwan (Rosada) were used as plant materials. The plant material was grown in a glasshouse at the Taiwan Agricultural Research Institute (24°03′ N, 120°69′ E). Natural sunlight was used as the light source, and the air temperature (Tair) and RH inside the greenhouse were regulated by a pad-fan system to remain at 22–36 °C and 75–90%, respectively. Abnormal seedlings were excluded approximately 4 weeks after sowing for each batch, and 16 plants were selected and planted in two plastic baskets (50) with a 6D soil substrate (BVB, De Lier, The Netherlands). The tomato seedlings had 3–4 leaves at this time. For each batch, tomato seedlings randomly received either regular watering treatment or drought treatment. In regular watering treatment, the seedlings were irrigated daily until the field water capacity was reached. In drought treatment, the substrate was irrigating to reach the field water capacity at the time of transplanting. However, no irrigation was applied after transplanting, to mimic a drought condition.
2.2. Physiological and Environmental Data Measurements
Between 10:00 and 14:00 daily, the tomato leaf temperature (Tleaf), Tair (within-leaf chamber), the net CO2 assimilation rate (A), the evapotranspiration rate (ET), gsw, and the VPD were simultaneously measured using the LI-6800 portable photosynthesis system (LI-COR Biosciences, Lincoln, NE, USA). The measurements were performed using 3–5 fully expanded leaves from the top of each tomato plant of the two treatments. The measurement conditions of the LI-6800 system were set at an ambient air temperature (27–32 °C) and air humidity (RH = 60%), a reference CO2 concentration (400 µmol mol−1), and a stable light intensity of 1200 µmol photons m−2s−1 from an internal LED light source (red:blue = 9:1). The greenhouse environmental parameters—Tair and RH—were measured automatically every minute and averaged every 15 min using a data logger (CR200; Campbell Scientific Inc., Logan, UT, USA). The substrate water content was determined by WaterScout SM100 (Spectrum Technologies, Aurora, IL, USA). Four digital sensors were inserted evenly into the substrate of each plastic basket. The substrate water content was recorded every 30 min after the regular irrigation and drought treatments were applied to tomato seedlings.
For each batch, the collection of physiological and environmental data was started when the irrigation treatment was conducted. Once the visible symptoms of water shortage occurred (about 2 to 3 weeks after irrigation treatment), the collecting process ceased. At the beginning of each batch (Day 0), the substrate water content of both regular irrigation treatment and drought treatment was about 52–57%. On Day 0, there were no significant differences (α = 0.05) in tomato physiological parameters (ET, A, gsw, and Tleaf) between the two treatments (Supplementary Table S1). The substrate water content of regular irrigation treatment was about 49–57% in the experiment, while the substrate water content of drought treatment was 7–12% on the last day of each batch. However, all the measured tomato physiological parameters were significantly different (p < 0.001) between the two treatments (Supplementary Table S1).
In addition, to obtain data closely representing the actual situation in the greenhouse, the leaf chamber of the LI-6800 system was replaced with a transparent leaf chamber, which used natural light as the light source from February to March 2021. Additionally, the measurement time was extended by 2 h, starting 1 h earlier and ending 1 h later, running from 09:00 to 15:00. The PPFD inside the greenhouse was measured by the LI-190R quantum sensor (LI-COR Biosciences, Lincoln, NE, USA) attached to the sensor head of LI-6800. In this step, the physiological data were collected only from regularly irrigated plants. The data collection started from the transplanting until the seedlings entered the flowering stage. The data collected by the transparent leaf chamber were used to establish the evapotranspiration model and evaluate the performance of the strategy.
The physiological data included a total of 1142 and 524 measurements collected by an opaque (LED light source for both treatments) and a transparent (natural light source for regular irrigation only) leaf chamber, respectively.
2.3. Construction of the Conceptual Decision Support System
Based on plant physiological responses and environmental factors, this study proposed a conceptual DSS for irrigation and environmental controls for greenhouse tomato cultivation. The system was divided into three main components: the gsw status model, the environmental control component, and the irrigation component. The decision-making process of the system started from the gsw status model and used the VPD and the PPFD, which are the main factors that affect gsw, as the key input for environmental control. When gsw was lower than the threshold, if both VPD and PPFD were in a normal range, the system judged that irrigation should be performed at this time point and entered into the irrigation component. In the irrigation component, the amount of water required for irrigation was estimated by the evapotranspiration model. The established processes of each component were as follows:
2.3.1. gsw Status Model
Since our aim was to propose a control strategy based on plant responses, irrigation treatments were not used as the basis for data labeling. Data were first pooled from regular irrigation and drought treatments and then classified as “normal” or “low” based on gsw values as explained below.
In this study, logistic regression was used to establish the gsw status model. The environmental variables considered included VPD and Tair. The plant indicator considered the leaf–air temperature difference (Tdiff = Tleaf − Tair). Because the original gsw measurements collected by the LI-6800 system were continuous, finding the cutoff points was essential for transforming the gsw value to categorical data. As A is the most direct physiological indicator of crop production, we first related gsw to A by using gsw as the independent variable (X) and A as the dependent variable (Y) to fit a logarithmic curve (Equation (1)). After the relationships between A and gsw were established, the mean response of A corresponding to the maximum gsw in the data was considered the upper bound of A (Amax). Considering the practical seedling cultivation, the values of maintained 90%, 80%, and 70% of Amax were used as the control standards. The regression model of gsw on A was used to inversely predict gsw values corresponding to 90%, 80%, and 70% of Amax and then to obtain the three gsw cutoff points.
where β0 and β1 are the model parameters and εi is the error term.
Y = β0 + β1 ln (X) + εi
After the gsw cutoff points were obtained, the gsw values were transformed into dichotomous data; when the gsw value of the tomato leaves was higher than the cutoff point, it was defined as “normal” and coded as “0”; otherwise, it was defined as “low” and coded as “1.” However, it must be emphasized that low gsw is not necessarily caused by plants under the water-deficient status. Low gsw may represent that the plants are under unsuitable PPFD or VPD conditions. The gsw status model was established using VPD, Tair, and Tdiff as independent variables to classify the gsw status through logistic regression. Before model building, the data were randomly divided into the training dataset (70%) and the testing dataset (30%). The training dataset was used for model building, and the testing dataset was used to evaluate the classification performance. Sensitivity, specificity, and accuracy were used to evaluate the classification ability of the gsw status model.
where TN is true negative (the true gsw status of the tomato was “normal,” and the model also classified it as “normal”); FP is false positive (the true gsw status of the tomato was “normal,” but the model classified it as “low”); FN is false negative (the true gsw status of the tomato was “low,” but the model classified it as “normal”); and TP is true positive (the true gsw status of the tomato was “low,” and the model also classified it as “low”).
Sensitivity = TP/(TP + FN)
Specificity = TN/(TN + FP)
Accuracy = (TP + TN)/(TP + TN + FP + FN)
The aforementioned analysis was performed using the statistical software R (version 4.0.4), and the sensitivity, specificity, and accuracy of logistic regression were obtained using the InformationValue package (version 1.2.3).
2.3.2. Environmental Control Component
When constructing the environmental control component of the conceptual system, the appropriate ranges of VPD and PPFD had to be determined for tomato growth. The information from the literature review was used for the ranges of the VPD (0.5–1.2 kPa) in this study [38,39].
The light response curve is mainly used to describe the relationship between plant photosynthesis and light intensity. In general, when light intensity increases, photosynthesis also increases until a light saturation point is reached. The light saturation point of tomatoes is about 1300–1400 µmol m−2s−1. However, when the light intensity exceeds the light saturation point, photosynthesis no longer increases and may even start to decline. Excessive light frequently induces oxidative stress and limits the growth and photosynthetic capacity of plants [13,14,15]. Therefore, in this study, the upper bound of the PPFD in the light response curve measurement was set to 1200 µmol m−2s−1 instead of the light saturation point. We measured the A values of 30 regularly watered plants (6 plants × 5 replications) at different PPFD levels (1200, 900, 600, 300, 200, 150, 100, 70, 30, and 0 µmol m−2s−1) by the LI-6800 portable photosynthesis system. Each PPFD level was provided by the internal LED light source (red:blue = 9:1) of the LI-6800. These data were fitted with logarithmic curves (Equation (1)) by using PPFD as the independent variable and A as the dependent variable.
After obtaining the light response curve, the mean response of A at 1200 µmol m−2s−1 PPFD was considered the upper bound Amaxl and the curve was further used to infer PPFD values corresponding to 90%, 80%, and 70% of Amax1, thereby obtaining the lower bound of the PPFD (PPFDlowerlimit) within the PPFD normal range under the three control standards. The upper bound of the PPFD (PPFDupperlimit) within the PPFD normal range for all three control standards was set to 1200 µmol m−2s−1 rather than the light saturation point.
2.3.3. Irrigation Component
In the irrigation component, the evapotranspiration model was used to estimate the required amount of irrigation water. The empirical evapotranspiration model is generally fitted with VPD, light, and wind speed [40,41,42]. Given that the wind speed in a greenhouse is typically slow, we constructed the evapotranspiration model only with VPD and PPFD. Before model building, the data of regularly watered plants obtained by the transparent leaf chamber were randomly divided into the training dataset (70%) and the testing dataset (30%). The training dataset was used to fit the linear regression model (Equation (5)), with VPD and PPFD as independent variables and with E as a dependent variable, as follows:
where β0 to β2 are model parameters and εi is the error term.
E = β0 + β1 VPD + β2 PPFD + εi
The model performance was evaluated using the adjusted coefficient of determination (R2adj), and the fitted line between the fitted and observed values of the testing dataset was compared with a straight line having a slope of 1. Additionally, the mean absolute error (MAE) and the mean absolute percentage error (MAPE) were used to evaluate predictive capability.
where n is the number of observations, yi is the ith observation value, and is the fitted value of the ith observation.
2.4. Performance Evaluation of the Conceptual Decision Support System
To evaluate the reliability and stability of the conceptual DSS established for greenhouses, the data of regularly watered plants obtained by the transparent leaf chamber were used as the test data (n 524). The reason for only using regularly watered plants’ data was that gsw was affected by the substrate moisture and atmospheric conditions (PPFD and VPD). Had we used the data from drought treatment plants to evaluate the system, we could not have determined whether the low gsw was due to the low substrate moisture content or the unsuitable atmospheric conditions. This might have made it difficult to judge the correctness of the decision. Therefore, we only employed regularly watered plants data for the evaluation of the whole system. Before evaluation, the data were classified as “normal” and “low” according to the cutoff points of gsw under the three control standards.
The evaluation considered the performance of the gsw status model and of the whole system. First, the test data were classified using the gsw status model established previously and the sensitivity, specificity, and accuracy of the classification results were calculated. Furthermore, due to the obvious class imbalance of the test data (Supplementary Table S2), we used Cohen’s kappa (κ) [43] as another evaluation criterion for the gsw status model. The κ value of the model should be >0.60 for it to be regarded as a credible result [44].
where po is the actual proportion of correct classification of the model and pc is the proportion of correct classification achieved purely by chance. The formula of pc is given in Equation (9):
where cm1 is the total number in the first row of the confusion matrix [45], rm1 is the total number in the first column of the confusion matrix, cm2 is the total number in the second row of the confusion matrix, rm2 is the total number in the second column of the confusion matrix, and n is the total number of observations.
For the whole system evaluation, both the false positive (the true gsw status of the tomato was “normal,” but the model classified it as “low”) and the false negative (the true gsw status of the tomato was “low,” but the model classified it as “normal”) results of the gsw status model were wrong decisions (Figure 1). Moreover, the test data were collected from regularly watered plants. When the system indicated the need for irrigation on the basis of the test data, this was also a wrong decision (Figure 1). These cases demonstrate that our proposed system probably does not contain all factors affecting the gsw.
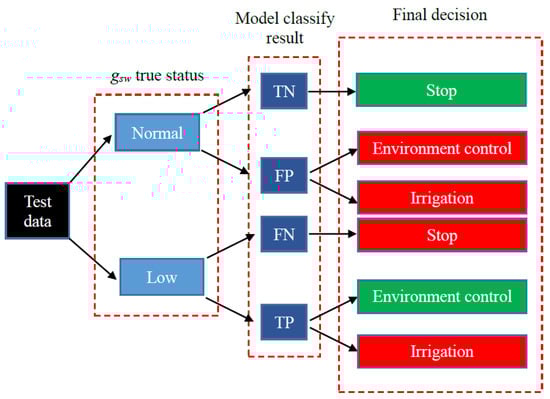
Figure 1.
Tree diagram of the whole system evaluation. TN is true negative (the true gsw status of the tomato was “normal,” and the model also classified it as “normal”); FP is false positive (the true gsw status of the tomato was “normal,” but the model classified it as “low”); FN is false negative (the true gsw status of the tomato was “low,” but the model classified it as “normal”); and TP is true positive (the true gsw status of the tomato was “low,” and the model also classified it as “low”). In the final decision box, a decision with a green background is the correct decision and a decision with a red background is the wrong decision.
The percentage of wrong decisions (Equation (10)) was used as a criterion to determine the performance of the whole system.
where FP is the number of false positives, FN is the number of false negatives, I is the number of true positives (the true gsw status of the tomato was “low,” and the model also classified it as “low”) that entered into the irrigation component, and n is the number of test data.
3. Results
3.1. Establishment of the Conceptual Decision Support System
The four key processes in establishing the three components of the conceptual DSS were to (1) determine the cutoff points of gsw to transform gsw to the binary status (“normal” and “low”), (2) establish gsw status models with logistic regression, (3) determine the lower limits of the PPFD in the environment control component, and (4) establish an evapotranspiration model for the irrigation component to estimate the amount of irrigation water required. The results of these four processes are described as follows.
3.1.1. Determination of gsw Cutoff Points
The physiological data of Rosada tomatoes were used to fit a logarithmic curve with gsw and A as the independent and dependent variables, respectively. The results are shown in Figure 2, and the fitted logarithmic curve is presented as Equation (11), with r = 0.8124.
A = 20.79 + 3.88 ln (gsw)
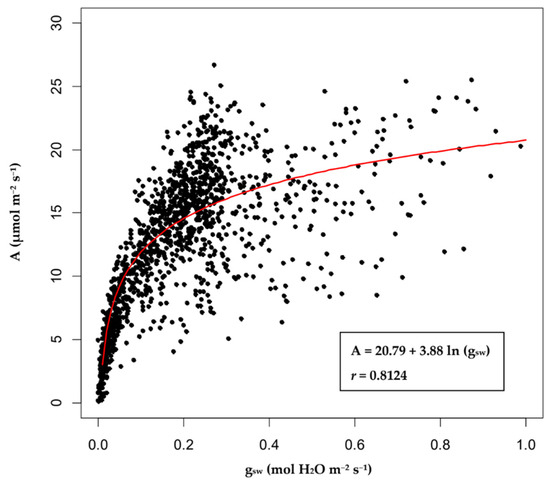
Figure 2.
The logarithmic curve of stomatal conductance (gsw) and the net CO2 assimilation rate (A) of Rosada tomatoes. The points in the figure are actual observations, and the red line is the fitted logarithmic curve.
When the logarithmic curves of gsw and A were obtained, the maximum gsw value of 1.00 mol H2O m−2s−1 was incorporated into Equation (11) to achieve the corresponding value of A, which was 20.79 µmol m−2s−1. Taking this value as the Amax of Rosada, we defined the maintenance of 90%, 80%, and 70% of Amax as the three control standards (I–III) of the system. The corresponding cutoff points of gsw were calculated by solving Equation (11) for gsw, given the different percentages of Amax. The cutoff points for the three control standards were 0.59, 0.34, and 0.20 mol H2O m−2s−1.
3.1.2. Establishment of gsw Status Models
In this study, logistic regression was used to establish gsw status models by using VPD, Tair, and Tdiff as independent variables. The Tair of the training data was 22.6–34.2 °C, the Tleaf was 21.5–36.0 °C, the Tdiff was −2.9 °C to 2.1 °C, and the VPD was 0.7–3.5 kPa (Table 1).

Table 1.
Descriptive statistic used to establish the gsw status model.
The gsw status models established by logistic regression for the three control standards are expressed by Equations (12–14). The sensitivity of the models was 0.91–1.00, the specificity was 0.66–0.85, and the accuracy was 88.01–97.00% (Table 2). In Table 2, the threshold probability is the probability threshold of logistic regression for classifying new observations. If the probability is above the threshold, the model classifies the observation with gsw as a “low” condition; otherwise, the model classifies the observation with gsw as a “normal” condition.
Table 2.
Probability thresholds and model performances of the gsw status logistic models under the three control standards.
3.1.3. Determination of Lower Limits of PPFD
The average values of A measured at 1200, 900, 600, 300, 200, 150, 100, 70, 30, and 0 µmol m−2s−1 PPFD for the regularly watered plants were 21.45, 21.01, 19.54, 13.43, 9.46, 7.14, 4.47, 2.77, 0.35, and −1.72 µmol m−2s−1, respectively (Supplementary Table S3). The fitted logarithmic light response curve of A and PPFD are expressed as Equation (15), with r = 0.9487, and the scatter plot is shown as Figure 3. After obtaining the light response curve of Rosada tomatoes, we considered A corresponding to 1200 µmol m−2s−1 PPFD to be the upper bound Amaxl, and then PPFD values corresponding to 90%, 80%, and 70% of Amax1 were obtained as the lower limits of PPFD by solving Equation (15) for PPFD, given the different percentages of Amax1. The PPFDlowerlimits values of the three control standards were 855.63, 610.00, and 434.88 µmol m−2s−1 (Table 3).
A= −24.24 + 6.54 ln (PPFD)
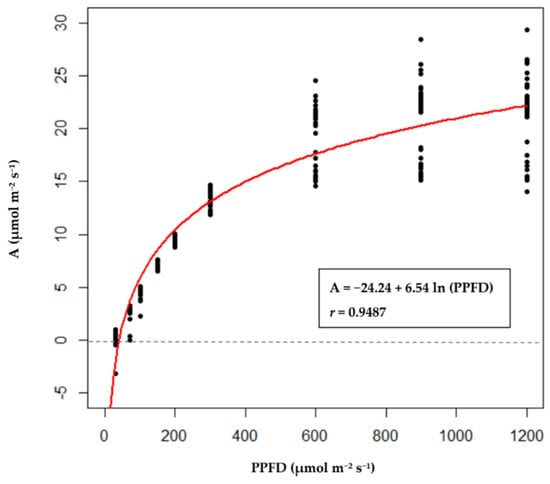
Figure 3.
The light response curve of Rosada tomatoes. The points in the figure are actual observations, and the red line is the fitted logarithmic curve.
Table 3.
Lower limits of PPFD corresponding to the three control standards.
3.1.4. Establishment of the Evapotranspiration Model
In this study, ET, VPD, and PPFD data collected by the transparent leaf chamber were used to establish a tomato evapotranspiration model with VPD and PPFD as independent variables. The evapotranspiration model of Rosada tomatoes is represented in Equation (16), with R2adj = 0.9775, MAE = 0.0033 mL m−2s−1, and MAPE = 2.95%. In addition, the fitted regression line between the fitted values and values of the actual ET of the testing dataset almost overlapped with the straight line having a slope of 1 (Figure 4), indicating that the fitted values were close to the observed values. When the ET can be accurately estimated, the amount of irrigation water recommended by the conceptual DSS will be a product of the ET and the time interval since the last irrigation.
where ET is the evapotranspiration rate in mL m−2s−1, VPD is given in kPa, and PPFD is given in µmol m−2s−1.
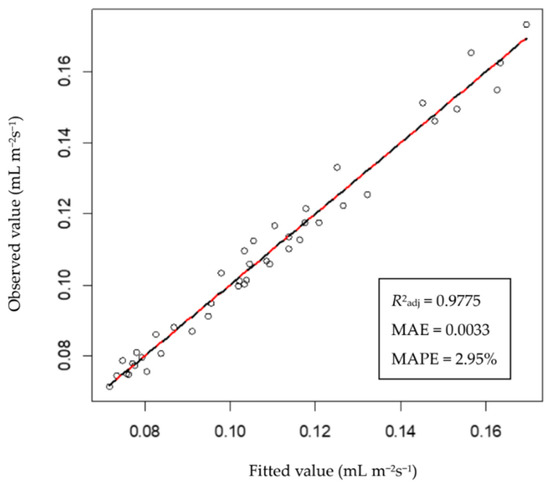
Figure 4.
Relationship between the fitting and observed values of the testing dataset of the evapotranspiration model. The red line is the fitted regression line between the observed and fitted values, and the black dashed line is a straight line with a slope of 1.
3.2. Description and Evaluation of the Plant-Response-Based Control Strategy
With the aforementioned results, the process of the plant-response-based control strategy established is as Figure 5. The strategy for the conceptual DSS started from the gsw status model. If the model classifies the tomato gsw status as “normal,” no treatment is to be applied; otherwise, the system enters into the environmental control component, which first determines whether the VPD is within the normal range (0.5–1.2 kPa) for tomato growth. If the VPD is too high, spray cooling is to be recommended; however, if the VPD is too low, ventilation and dehumidification are recommended. If the VPD is within the normal range, the environmental control component will check whether light is in the normal range. Shading is recommended when light is higher than 1200 µmol m−2s−1; however, a light supplement is recommended when light is lower than PPFDlowerlimit. If both VPD and light are in the normal range, the system judges that irrigation should be conducted at this time point and enters into the irrigation component. In the irrigation component, the amount of irrigation water required is estimated by the evapotranspiration model.
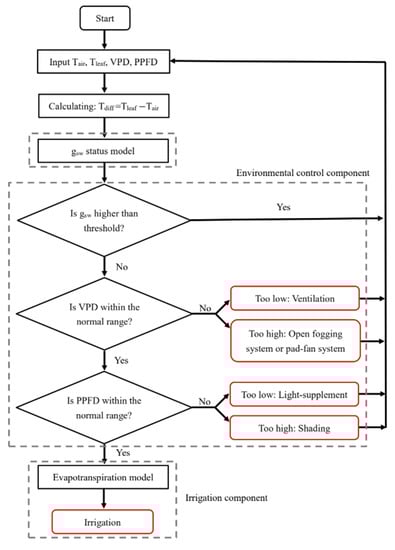
Figure 5.
The basic structure of the plant-response-based strategy for irrigation and environmental controls for greenhouse tomato seedling cultivation.
The performance of the strategy was based on the consideration of the classification ability of the gsw status model, and the percentage of wrong decisions made by the whole system was evaluated. A total of 524 test observations were used in this study. The Tair of the test data was 22.7–34.8 °C, the Tleaf was 21.8–35.6 °C, the Tdiff was −2.6–1.7 °C, the VPD was 0.7–3.4 kPa, and the PPFD was 58.3–1370.0 µmol m−2s−1 (Table 4). The data distribution under the three control standards was as follows: 48 normal and 476 low observations in control standard I, 149 normal and 375 low observations in control standard II, and 302 normal and 222 low observations in control standard III (Supplementary Table S2).
Table 4.
Descriptive statistics used to verify the gsw status model and the whole system. Data were collected by the transparent leaf chamber from regularly watered plants.
The sensitivity of the gsw status model was 0.93–0.98, the specificity was 0.54–0.82, and the accuracy was 86.64–94.27% under the three control standards (Table 5). In addition, the κ values of the gsw status models were all >0.60 (Table 5), indicating that the classification ability of the models was credible and stable rather than a product of random guessing. The percentage of wrong decisions relative to gsw characterization was 9.92–13.36% for the whole system (Table 5).
Table 5.
Performance of gsw status models and the percentage of wrong decisions of the strategy under the three control standards.
4. Discussion
To the best of our knowledge, few DSSs include both environmental and irrigation controls for greenhouse tomato cultivation in the subtropical region. Gupta et al. [17] developed a DSS for greenhouse tomato seedling production by incorporating growth models to achieve the desired dry weight of seedlings. The system made recommendations about daily average temperature, the need for supplementary light, and the need for shade but not about irrigation. The VegSyst simulation model was developed to assist with nitrogen and irrigation management of crops grown in Mediterranean-type greenhouses [46]. Based on the VegSyst simulation model, Gallardo et al. [47] proposed a prototype DSS for calculating the nitrogen and water requirements of tomato. The system can be potentially useful as a management tool for greenhouse-grown vegetable crops; however, it does not involve environmental control and is currently only available in the Mediterranean region. Linker et al. [48] conducted a simulation study with cotton, potato, and tomato to optimize deficit irrigation schedules for field cultivation but not greenhouse cultivation. In addition, environmental control in greenhouses typically involves maintaining a specific air temperature or adjusting the available light level, with few existing control strategies based on stomatal opening measurements or modeling [49]. Tu et al. [50] used Tdiff, soil water content and spectroscopy to detect the drought stress of tomato, but the study did not establish a DSS.
A conceptual plant-response-based strategy for a DSS for irrigation and environmental controls for greenhouse tomato seedling cultivation was established in this study. The system has three control standards with different levels available for control. Although the strategy only uses four variables, namely Tleaf, Tair, VPD, and PPFD, its overall error rate to characterize gsw was <13.36% (Table 5). This error rate indicated that our proposed system probably does not include all factors that may affect the gsw. Park et al. [51] have mentioned that indoor temperature and humidity do not exactly represent the temperature and humidity of leaves. Therefore, they recommend detecting the temperature and humidity of leaves separately. The VPD can integrate the effects of temperature and humidity simultaneously. In a greenhouse, the light intensity is usually monitored to be maintained at a fixed level [2]. When the light intensity is low, supplementary lighting should be supplied. Conversely, appropriate shading should be adopted when the light intensity is high. It must be noted that although a greenhouse could provide a relatively uniform environment compared to the field, the climate within the greenhouse is still heterogeneous and can be treated as a microclimate [52]. Therefore, the important environmental parameters used in this study, i.e., Tair, VPD, and PPFD, were measured by the LI-6800 portable photosynthesis system and its accessory. In other words, the microclimate around the tomato leaves was measured, in place of the traditional sensors used for macroclimate measurements, in this greenhouse study.
As is known, classification models tend to be highly biased for class imbalance data. The most common situation is that the recognition ability of a model for the minor class (category with few data) is considerably lower than that for the major class (category with more data) [53,54]. In such cases, considering only the overall accuracy would be problematic [55]. With control standard I, the difference between the numbers of normal and low observations was nearly 10 times (Supplementary Table S2). Although the sensitivity of models in this situation was 0.98 and the accuracy was also as high as 94.27%, the specificity was only 0.54 and κ was only 0.60 (Table 5). Galar et al. [56] reported that using ensemble methods for class imbalance data can improve the model performance. Methods such as resampling, cost-sensitive learning, and training set partition from the realms of statistics and data science are also available for improving model performance [54,55,57,58]. In the future, we can attempt to improve the performance of the gsw status model of this study by using those methods.
In this study, an evapotranspiration model for the irrigation component was established in the strategy by using an empirical model. The advantage of an empirical model is that it can fit a relatively simple form of data, but further extending the model to an environment with conditions different from the original site is difficult. However, the mechanistic model of the evapotranspiration is based on theories such as those concerning energy balance and water vapor diffusion. The Penman–Monteith (PM) equation is the most widely used mechanistic model for estimating the evapotranspiration. The PM equation has an excellent theoretical basis and computational accuracy; it considers the effects of crop physiological characteristics on evapotranspiration and involves changes in parameters of gas dynamics [59,60,61]. Boulard and Wang [62] derived a model for estimating evapotranspiration in greenhouse crops based on the PM equation. However, their parameters for the mechanistic model included not only basic meteorological data but also information on the leaf area index and the canopy height. These additional parameters must be measured using a sensor; thus, the cost of such a system is higher in practical application. Although the evapotranspiration can be estimated using growth models, additional studies supporting the accuracy of the value are warranted before applying it practically.
When we scrutinize the evapotranspiration model established in this study (Equation (16)), it can be seen that the ET estimated by the model is directly affected by the PPFD and the VPD. It is assumed that under different weather conditions (i.e., sunny, cloudy, or rainy), the system will adjust the amount of irrigation water. In addition, crop evapotranspiration varies with irrigation conditions [63,64,65]. Many studies have shown that reducing the amount of irrigation water would limit the evapotranspiration of greenhouse tomatoes [63,66,67]. Chen et al. [66] pointed out that tomato evapotranspiration under full irrigation at each growth stage was always higher than that under deficit irrigation in solar greenhouse. The evapotranspiration model established in this study only considers the conditions of full irrigation. Therefore, this model overestimates the evapotranspiration of water-deficient plants. It means that this strategy always provides enough water for tomato growth. Modeling the evapotranspiration under full and deficit irrigations needs to be considered in the future.
An intelligent system for crop production includes parts such as a cloud-based DSS, a sensing system, a multipurpose vehicle system, an agricultural robot system, and a drip irrigation system. A conceptual plant-response-based strategy has been proposed in this study. The strategy can be incorporated into a DSS and improved in many directions that require further validation. In the future, the system can be combined with technologies such as sensors and artificial intelligence of things to achieve automatic and intelligent greenhouse production.
5. Conclusions
In this study, various physiological parameters of tomato seedlings and environmental parameters were collected and a conceptual plant-response-based strategy and a future DSS for irrigation and environmental controls were presented. This system first uses Tleaf and environmental data to indirectly assess the gsw status. The system proposed herein includes three control standards with different crop performance levels. This system can provide decisions for the three main factors affecting gsw (i.e., VPD, PPFD, and substrate moisture) in greenhouse tomato seedling cultivation. In practice, this system only needs a few simple variables, namely Tleaf, Tair, VPD, and PPFD, to characterize gsw with an overall error rate < 13.36%. In the future, this system can be extended to nutrient supply and can be combined with technologies such as sensors and artificial intelligence of things. This system is expected to serve as a reference for irrigation and environmental controls for automatic and intelligent tomato cultivation in greenhouses.
Supplementary Materials
The following supporting information can be downloaded at https://www.mdpi.com/article/10.3390/agriculture12050633/s1: Table S1: Leaf temperature (Tleaf, °C), net CO2 assimilation rate (A, μmol m−2s−1), evapotranspiration rate (ET, mL m−2s−1), and stomatal conductance (gsw, mol m−²s−¹) of regular irrigation and drought treatment plants; Table S2: The gsw cutoff and corresponding ordinary and low observations for the three control standards of test data; Table S3: The net CO2 assimilation rate of Rosada tomatoes under different PPFD.
Author Contributions
Conceptualization, B.-J.K. and S.-L.F.; methodology, S.-L.F. and T.-J.C.; software, S.-L.F.; validation, Y.-K.T., H.-W.C. and M.-H.Y.; formal analysis, S.-L.F.; investigation, S.-L.F., T.-J.C., Y.-K.T. and H.-W.C.; resources, M.-H.Y. and B.-J.K.; data curation, S.-L.F. and T.-J.C.; writing—original draft preparation, S.-L.F.; writing—review and editing, B.-J.K.; supervision, B.-J.K.; project administration, B.-J.K.; funding acquisition, B.-J.K. All authors have read and agreed to the published version of the manuscript.
Funding
This research was funded by the Ministry of Science and Technology (grant nos. 107-2321-B-055-002 and 108-2634-F-005-003). This research was supported (in part) by MOST 110-2634-F-005-006—project Smart Sustainable New Agriculture Research Center (SMARTer).
Data Availability Statement
Not applicable.
Conflicts of Interest
The authors declare no conflict of interest.
References
- Salokhe, V.M.; Babel, M.S.; Tantau, H.J. Water requirement of drip irrigated tomatoes grown in greenhouse in tropical environment. Agric. Water Manag. 2005, 71, 225–242. [Google Scholar] [CrossRef]
- Li, H.; Guo, Y.; Zhao, H.; Wang, Y.; Chow, D. Towards automated greenhouse: A state of the art review on greenhouse monitoring methods and technologies based on internet of things. Comput. Electron. Agric. 2021, 191, 106558. [Google Scholar] [CrossRef]
- Markets and Markets. Commercial Greenhouse Market by Product Type (Fruits, Vegetables, Flowers & Ornamentals, Nursery Crops), Type (Glass Greenhouse, Plastic Greenhouse), Equipment (Heating Systems, Cooling Systems), and Region—Global Forecast to 2025. Available online: https://www.marketsandmarkets.com/Market-Reports/commercial-greenhouse-market-221045451.html (accessed on 8 February 2022).
- Nuruddin, M.M.; Madramootoo, C.A.; Dodds, G.T. Effects of water stress at different growth staged on greenhouse tomato yield and quality. HortScience 2003, 38, 1389–1393. [Google Scholar] [CrossRef] [Green Version]
- Suhandy, D.; Khuriyati, N.; Matsuoka, T. Determination of leaf water potential in tomato plants using NIR spectroscopy for water stress management. Environ. Control Biol. 2006, 44, 279–284. [Google Scholar] [CrossRef] [Green Version]
- Thompson, R.B.; Gallardo, M.; Valdez, L.C.; Fernandez, M.D. Using plant water status to define threshold values for irrigation management of vegetable crops using soil moisture sensors. Agric. Water Manag. 2007, 88, 147–158. [Google Scholar] [CrossRef]
- Ihuoma, S.O.; Madramootoo, C.A. Recent advances in crop water stress detection. Comput. Electron. Agric. 2017, 141, 267–275. [Google Scholar] [CrossRef]
- Jones, H.G. Monitoring plant and soil water status: Established and novel methods revisited and their relevance to studies of drought tolerance. J. Exp. Bot. 2007, 58, 119–130. [Google Scholar] [CrossRef] [Green Version]
- Sharma, S.P.; Leskovar, D.I.; Volder, A.; Crosby, K.M.; Ibrahim, A.M.H. Root distribution patterns of reticulatus and inodorus melon (Cucumis melo L.) under subsurface deficit irrigation. Irrig. Sci. 2018, 36, 301–317. [Google Scholar] [CrossRef]
- Ahemd, H.A.; Al-Faraj, A.A.; Abdel-Ghany, A.M. Shading greenhouses to improve the microclimate, energy and water saving in hot regions: A review. Sci. Hortic. 2016, 201, 36–45. [Google Scholar] [CrossRef]
- Li, H.; Wang, S. Technology and studies for greenhouse cooling. World J. Adv. Eng. Technol. 2015, 3, 73–77. [Google Scholar] [CrossRef] [Green Version]
- Inthichack, P.; Nishimura, Y.; Fukumoto, Y. Diurnal temperature alternations on plant growth and mineral absorption in eggplant, sweet pepper and tomato. Hortic. Environ. Biotechnol. 2013, 54, 37–43. [Google Scholar] [CrossRef]
- Karpinski, S.; Reynolds, H.; Karpinska, B.; Wingsle, G.; Creissen, G.; Mullineaux, P.M. Systemic signalling and acclimation in response to excess excitation energy in Arabidopsis. Science 1999, 284, 654–657. [Google Scholar] [CrossRef] [PubMed]
- Mullineaux, P.; Karpinski, S. Signal transduction in response to excess light: Getting out of the chloroplast. Curr. Opin. Plant Biol. 2002, 5, 43–48. [Google Scholar] [CrossRef]
- O’Carrigan, A.; Hinde, E.; Lu, N.; Xu, X.Q.; Duan, H.; Huang, G.; Mak, M.; Bellotti, B.; Chen, Z.H. Effects of light irradiance on stomatal regulation and growth of tomato. Environ. Exp. Bot. 2014, 98, 65–73. [Google Scholar] [CrossRef]
- Challa, H. Prediction of production: Requisite of an integrated approach. Acta Hortic. 1988, 229, 133–141. [Google Scholar] [CrossRef] [Green Version]
- Gupta, M.K.; Samuel, D.V.K.; Sirohi, N.P.S. Decision support system for greenhouse seedling production. Comput. Electron. Agric. 2010, 73, 133–145. [Google Scholar] [CrossRef]
- Lu, N.; Nukaya, T.; Kamimura, T.; Zhang, D.; Kurimoto, I.; Takagaki, M.; Maruo, T.; Kozai, T.; Yamori, W. Control of vapor pressure deficit (VPD) in greenhouse enhanced tomato growth and productivity during the winter season. Sci. Hortic. 2015, 197, 17–23. [Google Scholar] [CrossRef]
- Shamshiri, R.; Ismail, W.I.W. A review of greenhouse climate control and automation systems in tropical regions. J. Agric. Sci. Appl. 2013, 2, 176–183. [Google Scholar] [CrossRef]
- Zhang, D.; Du, Q.; Zhang, Z.; Jiao, X.; Song, X.; Li, J. Vapour pressure deficit control in relation to water transport and water productivity in greenhouse tomato production during summer. Sci. Rep. 2017, 7, 43461. [Google Scholar] [CrossRef]
- Zhang, D.; Zhang, Z.; Li, J.; Chang, Y.; Du, Q.; Pan, T. Regulation of vapor pressure deficit by greenhouse micro-fog systems improved growth and productivity of tomato via enhancing photosynthesis during summer season. PLoS ONE 2015, 10, e0133919. [Google Scholar] [CrossRef]
- Jones, H.G. Irrigation scheduling: Advantages and pitfalls of plant based methods. J. Exp. Bot. 2004, 55, 2427–2436. [Google Scholar] [CrossRef] [Green Version]
- Kacira, M.; Sase, S.; Okushima, L.; Ling, P.P. Plant response-based sensing for control strategies in sustainable greenhouse production. J. Agric. Meteorol. 2005, 61, 15–22. [Google Scholar] [CrossRef] [Green Version]
- Socías, F.X.; Correia, M.J.; Chaves, M.M.; Medrano, H. The role of abscisic acid and water relations in drought responses of subterranean clover. J. Exp. Bot. 1997, 48, 1281–1288. [Google Scholar] [CrossRef] [Green Version]
- Chaves, M.M. Effects of water deficits on carbon assimilation. J. Exp. Bot. 1991, 42, 1–16. [Google Scholar] [CrossRef]
- Sharkey, T.D. Water stress effects on photosynthesis. Photosynthetica 1990, 24, 651. [Google Scholar]
- Pataki, D.E.; Oren, R.; Katul, G.; Sigmon, J. Canopy conductance of Pinus taeda, Liquidambar styraciflua and Quercus phellos under varying atmospheric and soil water conditions. Plant Physiol. 1998, 18, 307–315. [Google Scholar] [CrossRef] [Green Version]
- Jones, H.G. Stomatal control of photosynthesis and transpiration. J. Exp. Bot. 1998, 49, 387–398. Available online: http://www.jstor.org/stable/23695972 (accessed on 8 February 2022). [CrossRef]
- Peat, W.E. Relationships between photosynthesis and light intensity in the tomato. Ann. Bot. 1970, 34, 319–328. [Google Scholar] [CrossRef]
- Costa, J.M.; Grant, O.M.; Chaves, M.M. Thermography to explore plant-environment interactions. J. Exp. Bot. 2013, 64, 3937–3949. [Google Scholar] [CrossRef]
- Iseki, K.; Olaleye, O. A new indicator of leaf stomatal conductance based on thermal imaging for field grown cowpea. Plant Prod. Sci. 2020, 23, 136–147. [Google Scholar] [CrossRef] [Green Version]
- Jones, H.G. Use of thermography for quantitative studies of spatial and temporal variation of stomatal conductance over leaf surfaces. Plant Cell Environ. 1999, 22, 1043–1055. [Google Scholar] [CrossRef] [Green Version]
- Leinonen, I.; Grant, O.M.; Tagliavia, C.P.P.; Chaves, M.M.; Jones, H.G. Estimating stomatal conductance with thermal imagery. Plant Cell Environ. 2006, 29, 1508–1518. [Google Scholar] [CrossRef] [PubMed]
- González-Dugo, M.; Moran, M.; Mateos, L.; Bryant, R. Canopy temperature variability as an indicator of crop water stress severity. Irrig. Sci. 2006, 24, 233–240. [Google Scholar] [CrossRef]
- Maes, W.H.; Steppe, K. Estimating evapotrasnpiration and drought stress with ground-based thermal remote sensing in agriculture: A review. J. Exp. Bot. 2012, 63, 4671–4712. [Google Scholar] [CrossRef] [PubMed] [Green Version]
- Sepulcre-Cantó, G.; Zarco-Tejada, P.J.; Jiménez-Muñoz, J.C.; Sobrino, J.A.; de Miguel, E.; Villalobos, F.J. Detection of water stress in an olive orchard with thermal remote sensing imagery. Agric. For. Meteorol. 2006, 136, 31–44. [Google Scholar] [CrossRef]
- Kobza, J.; Edwards, G.E. Influences of leaf temperature on photosynthetic carbon metabolism in wheat. Plant Physiol. 1987, 83, 69–74. [Google Scholar] [CrossRef]
- Shamshiri, R.R.; Jones, J.W.; Thorp, K.R.; Ahmad, D.; Man, H.C.; Taheri, S. Review of optimum temperature, humidity, and vapour pressure deficit for microclimate evaluation and control in greenhouse cultivation of tomato: A review. Int. Agrophys. 2018, 32, 287–302. [Google Scholar] [CrossRef]
- Argus Controls. Understanding and Using VPD. Canada. 2009. Available online: https://www.arguscontrols.com/resources/VPD_Application_Note.pdf (accessed on 26 March 2022).
- Boulard, T.; Jemaa, R. Greenhouse tomato crop transpiration model application to irrigation control. Acta Hortic. 1993, 335, 381–387. [Google Scholar] [CrossRef]
- Chen, L.H.; Chen, C.C. Study of the evapotranspiration models of tomato in subtropics greenhouse. J. Agric. For. 2018, 66, 37–44. [Google Scholar]
- Jolliet, O.; Bailey, B.J. The effect of climate on tomato transpiration in greenhouses: Measurements and models comparison. Agric. For. Meteorol. 1992, 58, 43–62. [Google Scholar] [CrossRef]
- Cohen, J. A coefficient of agreement for nominal scales. Educ. Psychol. Meas. 1960, 20, 37–46. [Google Scholar] [CrossRef]
- McHugh, M.L. Interrater reliability: The kappa statistic. Biochem. Med. 2012, 22, 276–282. Available online: https://hrcak.srce.hr/89395 (accessed on 8 February 2022). [CrossRef]
- Luque, A.; Carrasco, A.; Martín, A.; de las Heras, A. The impact of class imbalance in classification performance metrics based on the binary confusion matrix. Pattern Recognit. 2019, 91, 216–231. [Google Scholar] [CrossRef]
- Giménez, C.; Gallardo, M.; Martínez-Gaitán, C.; Stöckle, C.O.; Thompson, R.B.; Granados, M.R. VegSyst, a simulation model of daily crop growth, nitrogen uptake and evapotranspiration for pepper crops for use in an on-farm decision support system. Irrig. Sci. 2013, 31, 465–477. [Google Scholar] [CrossRef]
- Gallardo, M.; Thompson, R.B.; Giménez, C.; Padilla, F.M.; Stöckle, C.O. Prototype decision support system based on the VegSyst simulation model to calculate crop N and water requirements for tomato under plastic cover. Irrig. Sci. 2014, 32, 237–253. [Google Scholar] [CrossRef]
- Linker, R.; Ioslovich, I.; Sylaios, G.; Plauborg, F.; Battilani, A. Optimal model-based deficit irrigation scheduling using AquaCrop: A simulation study with cotton, potato and tomato. Agric. Water Manag. 2016, 163, 236–243. [Google Scholar] [CrossRef]
- Voogt, J.; Van Weel, P. Climate control based on stomatal behavior in a semi-closed greenhouse system ‘Aircokas’. Acta Hortic. 2008, 797, 151–156. [Google Scholar] [CrossRef] [Green Version]
- Tu, Y.-K.; Chen, H.-W.; Fang, S.-L.; Yao, M.-H.; Tseng, Y.-Y.; Kuo, B.-J. Establishing of early discrimination methods for drought stress of tomato by using environmental parameters and NIR spectroscopy in greenhouse. Acta Hortic. 2021, 1311, 501–512. [Google Scholar] [CrossRef]
- Park, D.-H.; Kang, B.-J.; Cho, K.-R.; Shin, C.-S.; Cho, S.-E.; Park, J.-W.; Yang, W.-M. A study on greenhouse automatic control system based on wireless sensor network. Wirel. Pers. Commun. 2011, 56, 117–130. [Google Scholar] [CrossRef]
- Ma, D.; Carpenter, N.; Maki, H.; Rehman, T.U.; Tuinstra, M.R.; Jin, J. Greenhouse environment modeling and simulation for microclimate control. Comput. Electron. Agric. 2019, 162, 134–142. [Google Scholar] [CrossRef]
- Ali, H.; Salleh, M.N.M.; Saedudin, R.; Hussain, K.; Mushtaq, M.F. Imbalance class problems in data mining: A review. Indonesian J. Elec. Eng. Comp. Sci. 2019, 14, 1560–1571. [Google Scholar] [CrossRef]
- Longadge, R.; Dongre, S.S.; Malik, L. Class imbalance problem in data mining: Review. IJCSN 2013, 2, 83–87. [Google Scholar]
- Kubus, M. Evaluation of resampling methods in the class unbalance problem. Ekonometria 2020, 24, 39–50. [Google Scholar] [CrossRef]
- Galar, M.; Fernandez, A.; Barrenechea, E.; Bustince, H.; Herrera, F. A review on ensembles for the class imbalance problem: Bagging-, boosting-, and hybrid-based approaches. IEEE Trans. Syst. Man Cybern. Part C Appl. Rev. 2011, 42, 463–484. [Google Scholar] [CrossRef]
- Haixiang, G.; Yijing, L.; Shang, J.; Mingyun, G.; Yuanyue, H.; Bing, G. Learning from class-imbalanced data: Review of methods and applications. Expert Syst. Appl. 2017, 73, 220–239. [Google Scholar] [CrossRef]
- Loyola-González, O.; Martínez-Trinidad, J.F.; Carrasco-Ochoa, J.A.; García-Borroto, M. Study of the impact of resampling methods for contrast pattern based classifiers in imbalanced databases. Neurocomputing 2016, 175, 935–947. [Google Scholar] [CrossRef]
- Landeras, G.; Ortiz-Barredo, A.; López, J.J. Comparison of artificial neural network models and empirical and semi-empirical equations for daily reference evapotranspiration estimation in the Basque Country (Northern Spain). Agric. Water Manag. 2008, 95, 553–565. [Google Scholar] [CrossRef]
- López-Urrea, R.; de Santa, M.; Olalla, F.; Fabeiro, C.; Moratalla, A. Testing evapotranspiration equations using lysimeter observations in a semiarid climate. Agric. Water Manag. 2006, 85, 15–26. [Google Scholar] [CrossRef]
- Pereira, L.S.; Allen, R.G.; Smith, M.; Raes, D. Crop evapotranspiration estimation with FAO56: Past and future. Agric. Water Manag. 2015, 147, 4–20. [Google Scholar] [CrossRef]
- Boulard, T.; Wang, S. Greenhouse crop transpiration simulation from external climate conditions. Agric. For. Meteorol. 2000, 100, 25–34. [Google Scholar] [CrossRef]
- Gong, X.; Qiu, R.; Sun, J.; Ge, J.; Li, Y.; Wang, S. Evapotranspiration and crop coefficient of tomato grown in a solar greenhouse under full and deficit irrigation. Agric. Water Manag. 2020, 235, 106154. [Google Scholar] [CrossRef]
- Ran, H.; Kang, S.; Li, F.; Du, T.; Tong, L.; Li, S.; Ding, R.; Zhang, X. Parameterization of the AquaCrop model for full and deficit irrigated maize for seed production in arid Northwest China. Agric. Water Manag. 2018, 203, 438–450. [Google Scholar] [CrossRef]
- Sandhu, R.; Irmak, S. Performance of AquaCrop model in simulating maize growth, yield, and evapotranspiration under rainfed, limited and full irrigation. Agric. Water Manag. 2019, 223, 105687. [Google Scholar] [CrossRef]
- Chen, J.; Kang, S.; Du, T.; Qiu, R.; Guo, P.; Chen, R. Quantitative response of greenhouse tomato yield and quality to water deficit at different growth stages. Agric. Water Manag. 2013, 129, 152–162. [Google Scholar] [CrossRef]
- Kirda, C.; Çetin, M.; Dasgan, Y.; Topçu, S.; Kaman, H.; Ekici, B.; Derici, M.R.; Ozguven, A.I. Yield response of greenhouse grown tomato to partial root drying and conventional deficit irrigation. Agric. Water Manag. 2004, 69, 191–201. [Google Scholar] [CrossRef]
Publisher’s Note: MDPI stays neutral with regard to jurisdictional claims in published maps and institutional affiliations. |
© 2022 by the authors. Licensee MDPI, Basel, Switzerland. This article is an open access article distributed under the terms and conditions of the Creative Commons Attribution (CC BY) license (https://creativecommons.org/licenses/by/4.0/).