


Effects of Oak Leaf Extract, Biofertilizer, and Soil Containing Oak Leaf Powder on Tomato Growth and Biochemical Characteristics under Water Stress Conditions

 ,
,  ,
,  and
and 
Abstract
:1. Introduction
2. Materials and Methods
2.1. Plant Materials
2.2. Experimental Design Components, Plant Treatement, and Growth Conditions
2.3. Evaluation of Morphological and Physiological Parameters
2.4. Tomato Leaves’ and Fruits’ Collection
2.5. Moisture Content, Titratable Acidity, and Total Soluble Solid Measurement
2.6. Measurement of Biochemical Traits
2.6.1. Ascorbic Acid Content (ASC)
2.6.2. Carotenoid Content (CAC)
2.6.3. Soluble Sugar Content (SSC)
2.6.4. Proline Content (PC)
2.6.5. Total Phenolic Content (TPC)
2.6.6. Antioxidant Compound Capacity (AC)
2.6.7. Antioxidant Enzyme Activity
2.6.8. Lipid Peroxidation Assays
2.7. GC-MS Analysis of Oak Leaf Extract
2.8. Statistical Data Analysis
3. Results
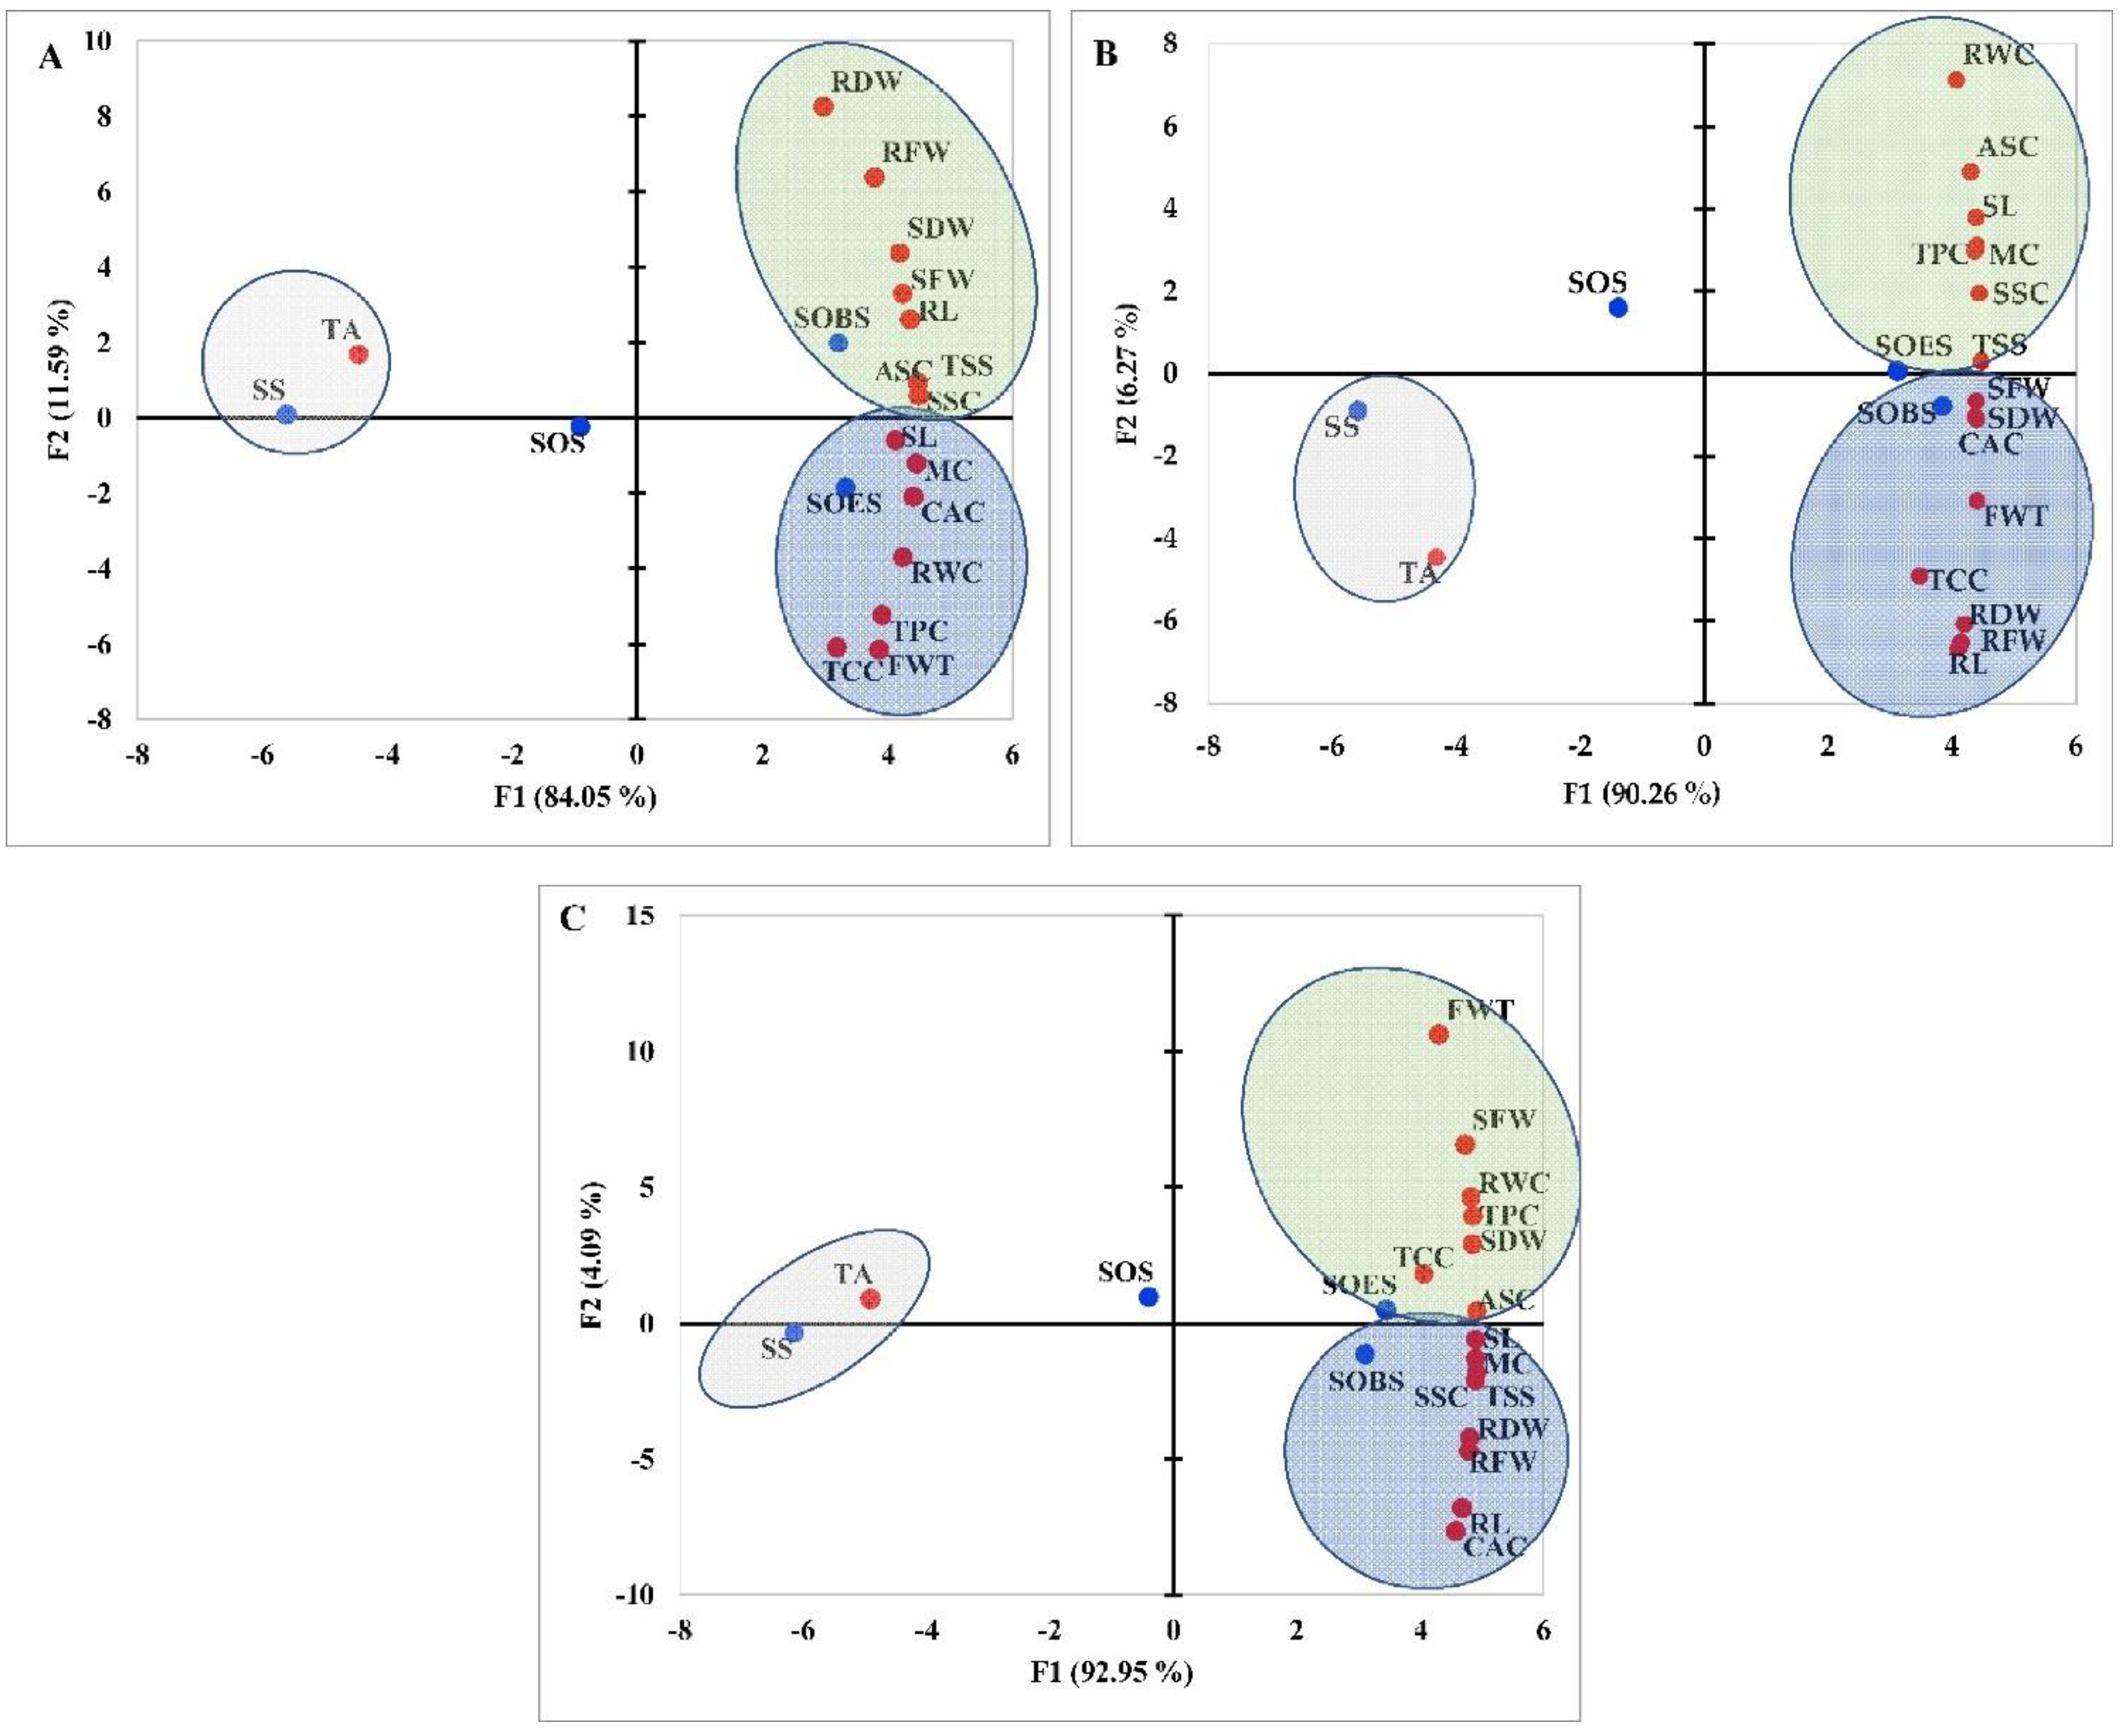
3.1. Effect of Various Treatments on the Morpho-Physiological and Fruit Physicochemical Traits of Tomato under Water Stress
3.2. Influence of Genotypes on the Morpho-Physiological and Physicochemical Characteristics of Tomato Fruit under Application of SS, SOS, SOES, and SOBS
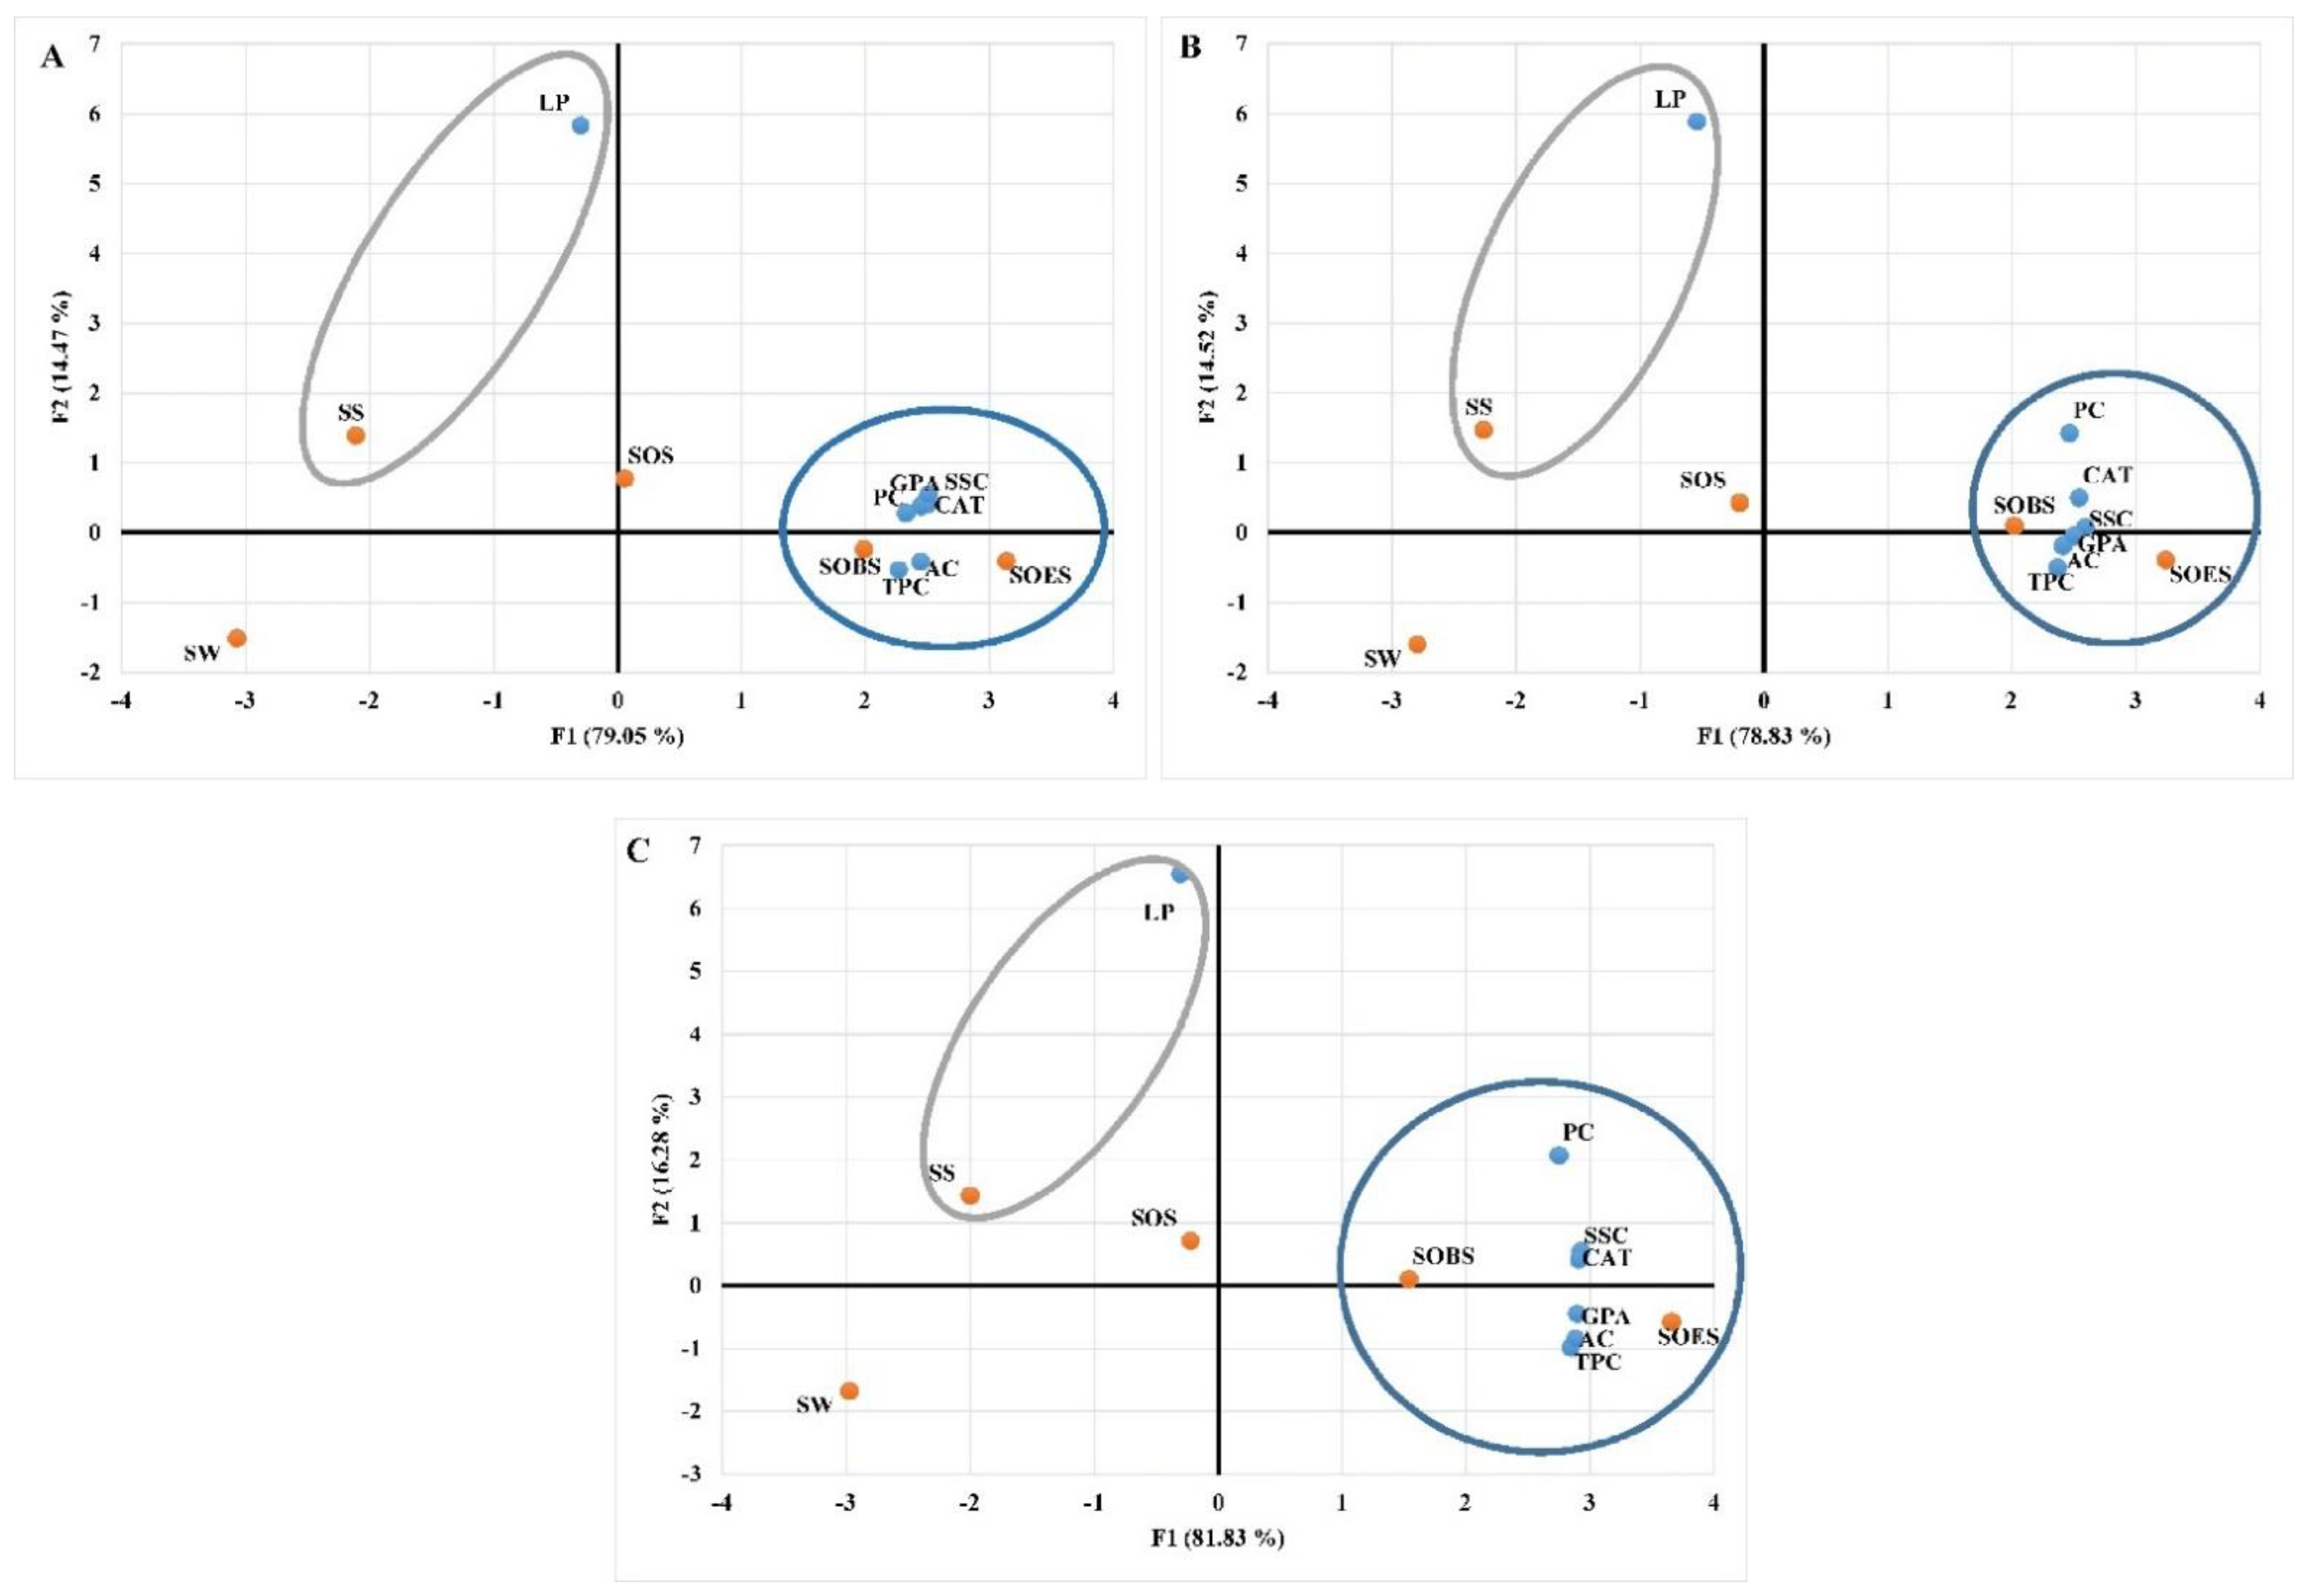
3.3. Impact of Various Treatments on the Biochemical Responses of the Leaves of Tomato Plants under Conditions of Water Stress
3.4. Impact of Different Genotypes Treated with SW, SS, SOS, SOES, and SOBS on the Biochemical Responses of the Leaves of Tomato Plants under Circumstances of Water Stress
3.5. GC/MS Analysis of Oak Leaf Extract
4. Discussion
5. Conclusions
Supplementary Materials
Author Contributions
Funding
Institutional Review Board Statement
Informed Consent Statement
Data Availability Statement
Acknowledgments
Conflicts of Interest
References
- Klunklin, W.; Savage, G. Effect on quality characteristics of tomatoes grown under well-watered and drought stress sonditions. Foods 2017, 6, 56. [Google Scholar] [CrossRef] [PubMed] [Green Version]
- Lahoz, I.; Pérez-de-Castro, A.; Valcárcel, M.; Macua, J.I.; Beltrán, J.; Roselló, S.; Cebolla-Cornejo, J. Effect of water deficit on the agronomical performance and quality of processing tomato. Sci. Hortic. 2016, 200, 55–65. [Google Scholar] [CrossRef] [Green Version]
- FAOSTAT. Food and Agriculture Organization of the United Nations, Statistics Division. Statistical Data on Crops, Tomatoes, World. 2020. Available online: http://www.fao.org/faostat/en/#data/QCL (accessed on 24 October 2022).
- Aldrich, H.T.; Salandanan, K.; Kendall, P.; Bunning, M.; Stonaker, F.; Külen, O.; Stushnoff, C. Cultivar choice provides options for local production of organic and conventionally produced tomatoes with higher quality and antioxidant content. J. Sci. Food Agric. 2010, 90, 2548–2555. [Google Scholar] [CrossRef] [PubMed]
- Bergougnoux, V. The history of tomato: From domestication to biopharming. Biotechnol. Adv. 2014, 32, 170–189. [Google Scholar] [CrossRef] [PubMed]
- Abbasi, S.; Sadeghi, A.; Safaie, N. Streptomyces alleviate drought stress in tomato plants and modulate the expression of transcription factors ERF1 and WRKY70 genes. Sci. Hortic. 2020, 265, 109206. [Google Scholar] [CrossRef]
- Srinivasa Rao, N.K.; Bhatt, R.M.; Sadashiva, A.T. Tolerance to water stress in tomato cultivars. Photosynthetica 2000, 38, 465–467. [Google Scholar]
- Jangid, K.K.; Dwivedi, P. Physiological responses of drought stress in tomato: A review. Int. J. Agric. Environ. Biotechnol. 2016, 9, 53–61. [Google Scholar] [CrossRef]
- Liu, Y.; Huang, W.; Xian, Z.; Hu, N.; Lin, D.; Ren, H.; Chen, J.; Su, D.; Li, Z. Overexpression of SLGRAS40 in tomato enhances tolerance to abiotic stresses and influences auxin and gibberellin signaling. Front. Plant Sci. 2017, 8, 1659. [Google Scholar] [CrossRef]
- Tamburino, R.; Vitale, M.; Ruggiero, A.; Sassi, M.; Sannino, L.; Arena, S.; Costa, A.; Batelli, G.; Zambrano, N.; Scaloni, A.; et al. Chloroplast proteome response to drought stress and recovery in tomato (Solanum lycopersicum L.). BMC Plant Biol. 2017, 17, 40. [Google Scholar] [CrossRef] [Green Version]
- Stajner, D.; Saponjac, V.T.; Orlovi, S. Water stress induces changes in polyphenol pro file and antioxidant capacity in poplar plants (Populus spp.). Plant Physiol. Biochem. 2016, 105, 242–250. [Google Scholar]
- Janni, M.; Coppede, N.; Bettelli, M.; Briglia, N.; Petrozza, A.; Summerer, S.; Vurro, F.; Danzi, D.; Cellini, F.; Marmiroli, N.; et al. In vivo phenotyping for the early detection of drought stress in tomato. Plant Phenomics 2019, 2019, 6168209. [Google Scholar] [CrossRef] [PubMed] [Green Version]
- Liang, G.; Liu, J.; Zhang, J. Effects of drought stress on photosynthetic and physiological parameters of tomato. J. Am. Soc. Hortic. 2020, 145, 12–17. [Google Scholar] [CrossRef]
- Cherit-Hacid, F.; Derridij, A.; Moulti-Mati, F.; Mati, A. Drought stress effect on some biochemical and physiological parameters; accumulation on total polyphenols and flavonoids in leaves of two provenance seedling Pistacia lentiscus. Int. J. Res. Appl. Nat. Soc. Sci 2015, 3, 127–138. [Google Scholar]
- Li, X.; Liu, F. Drought Stress Memory and Drought Stress Tolerance in Plants: Biochemical and Molecular Basis. In Drought Stress Tolerance in Plants; Springer: Cham, Germany, 2016; Volume 1, pp. 17–44. [Google Scholar]
- Li, F.; Chen, X.; Zhou, S.; Xie, Q.; Wang, Y.; Xiang, X.; Hu, Z.; Chen, G. Overexpression of SlMBP22 in tomato affects plant growth and enhances tolerance to drought stress. Plant Sci. 2020, 301, 110672. [Google Scholar] [CrossRef]
- Zhang, Y.; Wan, S.; Liu, X.; He, J.; Cheng, L.; Duan, M.; Liu, H.; Wang, W.; Yu, Y. Overexpression of CsSnRK2.5 increases tolerance to drought stress in transgenic Arabidopsis. Plant Physiol. Biochem. 2020, 150, 162–170. [Google Scholar] [CrossRef]
- Carvalho, J.L.N.; Hudiburg, T.W.; Franco, H.C.J.; DeLucia, E.H. Contribution of above- and belowground bioenergy crop residues to soil carbon. Glob. Change Biol. Bioenergy 2017, 9, 1333–1343. [Google Scholar] [CrossRef]
- Cherubin, M.R.; Oliveira, D.M.D.S.; Feigl, B.J.; Pimentel, L.G.; Lisboa, I.P.; Gmach, M.R.; Varanda, L.L.; Morais, M.C.; Satiro, L.S.; Popin, G.V.; et al. Crop residue harvest for bioenergy production and its implications on soil functioning and plant growth: A review. Sci. Agric. 2018, 75, 255–272. [Google Scholar] [CrossRef] [Green Version]
- Armada, E.; Portela, G.; Roldán, A.; Azcón, R. Combined use of beneficial soil microorganism and agrowaste residue to cope with plant water limitation under semiarid conditions. Geoderma 2014, 232–234, 640–648. [Google Scholar] [CrossRef]
- Coskun, D.; Britto, D.T.; Huynh, W.Q.; Kronzucker, H.J. The role of silicon in higher plants under salinity and drought stress. Front. Plant Sci. 2016, 7, 1072. [Google Scholar] [CrossRef] [Green Version]
- Chakma, R.; Saekong, P.; Biswas, A.; Ullah, H.; Datta, A. Growth, fruit yield, quality, and water productivity of grape tomato as affected by seed priming and soil application of silicon under drought stress. Agric. Water Manag. 2021, 256, 107055. [Google Scholar] [CrossRef]
- Meena, M.L.; Gehlot, V.S.; Meena, D.C.; Kishor, S.; Kumar, S. Impact of biofertilizers on growth, yield and quality of tomato (Lycopersicon esculentum Mill.) cv. Pusa Sheetal. J. Pharmacogn. Phytochem. 2017, 6, 1579–1583. [Google Scholar]
- Gagné-Bourque, F.; Bertrand, A.; Claessens, A.; Aliferis, K.A.; Jabaji, S. Alleviation of drought stress and metabolic changes in timothy (Phleum pratense L.) colonized with Bacillus subtilis B26. Front. Plant Sci. 2016, 7, 584. [Google Scholar] [CrossRef] [PubMed] [Green Version]
- Hashem, A.; Tabassum, B.; Fathi Abd_Allah, E. Bacillus subtilis: A plant-growth promoting rhizobacterium that also impacts biotic stress. Saudi J. Biol. Sci. 2019, 26, 1291–1297. [Google Scholar] [CrossRef] [PubMed]
- Yin, P.; Yang, L.; Li, K.; Fan, H.; Xue, Q.; Li, X.; Sun, L.; Liu, Y. Bioactive components and antioxidant activities of oak cup crude extract and its four partially purified fractions by HPD-100 macroporous resin chromatography. Arab. J. Chem. 2019, 12, 249–261. [Google Scholar] [CrossRef]
- Sánchez-Burgos, J.A.; Ramírez-Mares, M.V.; Larrosa, M.M.; Gallegos-Infante, J.A.; González-Laredo, R.F.; Medina-Torres, L.; Rocha-Guzmán, N.E. Antioxidant, antimicrobial, antitopoisomerase and gastroprotective effect of herbal infusions from four Quercus species. Ind. Crops Prod. 2013, 42, 57–62. [Google Scholar] [CrossRef]
- Jong, J.K.; Bimal, K.G.; Hyeun, C.S.; Kyung, J.L.; Ki, S.S.; Young, S.C.; Taek, S.Y.; Ye-Ji, L.; Eun-Hye, K.; Ill-Min, C. Comparison of phenolic compounds content in indeciduous Quercus species. J. Med. Plants Res. 2012, 6, 5228–5239. [Google Scholar] [CrossRef] [Green Version]
- Brossa, R.; Casals, I.; Pintó-Marijuan, M.; Fleck, I. Leaf flavonoid content in Quercus ilex L. resprouts and its seasonal variation. Trees 2009, 23, 401–408. [Google Scholar] [CrossRef]
- Korbekandi, H.; Chitsazi, M.R.; Asghari, G.; Bahri Najafi, R.; Badii, A.; Iravani, S. Green biosynthesis of silver nanoparticles using Quercus brantii (oak) leaves hydroalcoholic extract. Pharm. Biol. 2015, 53, 807–812. [Google Scholar] [CrossRef] [Green Version]
- Lavado, G.; Ladero, L.; Cava, R. Cork oak (Quercus suber L.) leaf extracts potential use as natural antioxidants in cooked meat. Ind. Crops Prod. 2021, 160, 113086. [Google Scholar] [CrossRef]
- Himes, F.L.; Tejeira, R.; Hayes, M.H.B. The reactions of extracts from maple and oak leaves with iron and zinc compounds. Soil Sci. Soc. Am. J. 1963, 27, 516–519. [Google Scholar] [CrossRef]
- Lateef, D.; Mustafa, K.; Tahir, N. Screening of Iraqi barley accessions under PEG-induced drought conditions. All Life 2021, 14, 308–332. [Google Scholar] [CrossRef]
- Rahman, A.; Kandpal, L.M.; Lohumi, S.; Kim, M.S.; Lee, H.; Mo, C.; Cho, B.K. Nondestructive estimation of moisture content, pH and soluble solid contents in intact tomatoes using hyperspectral imaging. Appl. Sci. 2017, 7, 109. [Google Scholar] [CrossRef]
- Rasul, K.S.; Grundler, F.M.W.; Abdul-razzak Tahir, N. Genetic diversity and population structure assessment of Iraqi tomato accessions using fruit characteristics and molecular markers. Hortic. Environ. Biotechnol. 2022, 63, 523–538. [Google Scholar] [CrossRef]
- Pedro, A.M.K.; Ferreira, M.M.C. Simultaneously calibrating solids, sugars and acidity of tomato products using PLS2 and NIR spectroscopy. Anal. Chim. Acta 2007, 595, 221–227. [Google Scholar] [CrossRef]
- Abbasi, N.A.; Ali, I.; Hafiz, I.A.; Alenazi, M.M.; Shafiq, M. Effects of putrescine application on peach fruit during Storage. Sustainability 2019, 11, 2013. [Google Scholar] [CrossRef] [Green Version]
- Ferrante, A.; Spinardi, A.; Maggiore, T.; Testoni, A.; Gallina, P.M. Effect of nitrogen fertilisation levels on melon fruit quality at the harvest time and during storage. J. Sci. Food Agric. 2008, 88, 707–713. [Google Scholar] [CrossRef]
- Juknys, R.; Vitkauskaitė, G.; Račaitė, M.; Venclovienė, J. The impacts of heavy metals on oxidative stress and growth of spring barley. Cent. Eur. J. Biol. 2012, 7, 299–306. [Google Scholar] [CrossRef] [Green Version]
- XLSTAT. Statistical and Data Analysis Solution; Addinsoft: Boston, MA, USA, 2019. [Google Scholar]
- Tahir, N.A.-R.; Lateef, D.D.; Mustafa, K.M.; Rasul, K.S. Under natural field conditions, exogenous application of moringa organ water extract enhanced the growth- and yield-related traits of barley accessions. Agriculture 2022, 12, 1502. [Google Scholar] [CrossRef]
- Ullah, U.; Ashraf, M.; Shahzad, S.M.; Siddiqui, A.R.; Piracha, M.A.; Suleman, M. Growth behavior of tomato (Solanum lycopersicum L.) under drought stress in the presence of silicon and plant growth promoting rhizobacteria. Soil Environ. 2016, 35, 65–75. [Google Scholar]
- Fathalipour, S.; Mardi, M. Synthesis of silane ligand-modified graphene oxide and antibacterial activity of modified graphene-silver nanocomposite. Mater. Sci. Eng. C 2017, 79, 55–65. [Google Scholar] [CrossRef]
- Togashi, N.; Shiraishi, A.; Nishizaka, M.; Matsuoka, K.; Endo, K.; Hamashima, H.; Inoue, Y. Antibacterial activity of long-chain fatty alcohols against Staphylococcus aureus. Molecules 2007, 12, 139–148. [Google Scholar] [CrossRef] [Green Version]
- Gugliotti, M.; Baptista, M.S.; Politi, M.J. Reduction of evaporation of natural water samples by monomolecular films. J. Braz. Chem. Soc. 2005, 16, 1186–1190. [Google Scholar] [CrossRef]
- Kolyada, M.N.; Osipova, V.P.; Berberova, N.T.; Shpakovsky, D.B.; Milaeva, E.R. Antioxidant activity of 2,6-Di-tert-butylphenol derivatives in lipid peroxidation and hydrogen peroxide decomposition by human erythrocytes in vitro. Russ. J. Gen. Chem. 2018, 88, 2513–2517. [Google Scholar] [CrossRef]
- Varsha, K.K.; Devendra, L.; Shilpa, G.; Priya, S.; Pandey, A.; Nampoothiri, K.M. 2,4-Di-tert-butyl phenol as the antifungal, antioxidant bioactive purified from a newly isolated Lactococcus sp. Int. J. Food Microbiol. 2015, 211, 44–50. [Google Scholar] [CrossRef] [PubMed]
- Zhao, F.; Wang, P.; Lucardi, R.D.; Su, Z.; Li, S. Natural sources and bioactivities of 2,4-Di-tert-butylphenol and Its analogs. Toxins 2020, 12, 35. [Google Scholar] [CrossRef]
- Jaradat, N.; Ghanim, M.; Abualhasan, M.N.; Rajab, A.; Kojok, B.; Abed, R.; Mousa, A.; Arar, M. Chemical compositions, antibacterial, antifungal and cytotoxic effects of Alhagi mannifera five extracts. J. Complement. Integr. Med. 2021. [Google Scholar] [CrossRef]
- Tonisi, S.; Okaiyeto, K.; Hoppe, H.; Mabinya, L.V.; Nwodo, U.U.; Okoh, A.I. Chemical constituents, antioxidant and cytotoxicity properties of Leonotisleonurus used in the folklore management of neurological disorders in the Eastern Cape, South Africa. 3 Biotech 2020, 10, 141. [Google Scholar] [CrossRef] [Green Version]
- Gautam, V.; Kohli, S.K.; Arora, S.; Bhardwaj, R.; Kazi, M.; Ahmad, A.; Raish, M.; Ganaie, M.A.; Ahmad, P. Antioxidant and antimutagenic activities of different fractions from the leaves of Rhododendron arboreum Sm. and their GC-MS profiling. Molecules 2018, 23, 2239. [Google Scholar] [CrossRef] [Green Version]
- Bhat, M.Y.; Talie, M.D.; Wani, A.H.; Lone, B.A. Chemical composition and antifungal activity of essential oil of Rhizopogon species against fungal rot of apple. J. Appl. Biol. Sci. 2020, 14, 296–308. [Google Scholar]
- Farag, S.M.; Essa, E.E.; Alharbi, S.A.; Alfarraj, S.; Abu El-Hassan, G.M.M. Agro-waste derived compounds (flax and black seed peels): Toxicological effect against the West Nile virus vector, Culex pipiens L. with special reference to GC–MS analysis. Saudi J. Biol. Sci. 2021, 28, 5261–5267. [Google Scholar] [CrossRef]
- Al-Samman, A.M.; Siddique, N.A. Gas chromatography-mass spectrometry (GC-MS/MS) analysis, ultrasonic assisted extraction, antibacterial and antifungal activity of Emblica officinalis fruit extract. Pharmacogn. J. 2019, 11, 315–323. [Google Scholar] [CrossRef] [Green Version]
- Ibrahim, M.F.M.; Abd Elbar, O.H.; Farag, R.; Hikal, M.; El-Kelish, A.; El-Yazied, A.A.; Alkahtani, J.; Abd El-Gawad, H.G. Melatonin counteracts drought induced oxidative damage and stimulates growth, productivity and fruit quality properties of tomato plants. Plants 2020, 9, 1276. [Google Scholar] [CrossRef] [PubMed]
- Eziz, A.; Yan, Z.; Tian, D.; Han, W.; Tang, Z.; Fang, J. Drought effect on plant biomass allocation: A meta-analysis. Ecol. Evol. 2017, 7, 11002–11010. [Google Scholar] [CrossRef] [PubMed]
- Wang, X.; Xing, Y. Evaluation of the effects of irrigation and fertilization on tomato fruit yield and quality: A principal component analysis. Sci. Rep. 2017, 7, 350. [Google Scholar] [CrossRef] [Green Version]
- Zhou, R.; Yu, X.; Ottosen, C.O.; Rosenqvist, E.; Zhao, L.; Wang, Y.; Yu, W.; Zhao, T.; Wu, Z. Drought stress had a predominant effect over heat stress on three tomato cultivars subjected to combined stress. BMC Plant Biol. 2017, 17, 24. [Google Scholar] [CrossRef] [Green Version]
- Khan, S.H.; Khan, A.; Litaf, U.; Shah, A.S.; Khan, M.A.; Bilal, M.; Ali, M.U. Effect of Drought Stress on Tomato cv. Bombino. J. Food Process Technol. 2015, 6, 465. [Google Scholar] [CrossRef]
- Kafi, M.; Rahimi, Z. Effect of salinity and silicon on root characteristics, growth, water status, proline content and ion accumulation of purslane (Portulaca oleracea L.). J. Soil Sci. Plant Nutr. 2011, 57, 341–347. [Google Scholar] [CrossRef]
- Sonobe, K.; Hattori, T.; An, P.; Tsuji, W.; Eneji, A.E.; Kobayashi, S.; Kawamura, Y.; Tanaka, K.; Inanaga, S. Effect of silicon application on sorghum root responses to water stress. J. Plant Nutr. 2010, 34, 71–82. [Google Scholar] [CrossRef]
- Wang, M.; Wang, R.; Mur, L.A.J.; Ruan, J.; Shen, Q.; Guo, S. Functions of silicon in plant drought stress responses. Hortic. Res. 2021, 8, 254. [Google Scholar] [CrossRef]
- Kim, H.-J.; Li, X. Effects of phosphorus on shoot and root growth, partitioning, and phosphorus utilization efficiency in Lantana. HortScience 2016, 51, 1001–1009. [Google Scholar] [CrossRef] [Green Version]
- Bavaresco, L.G.; Osco, L.P.; Araujo, A.S.F.; Mendes, L.W.; Bonifacio, A.; Araújo, F.F. Bacillus subtilis can modulate the growth and root architecture in soybean through volatile organic compounds. Theor. Exp. Plant Physiol. 2020, 32, 99–108. [Google Scholar] [CrossRef]
- Ortiz-Castro, R.; Campos-García, J.; López-Bucio, J. Pseudomonas putida and Pseudomonas fluorescens influence Arabidopsis root system architecture through an auxin response mediated by bioactive cyclodipeptides. J. Plant Growth Regul. 2020, 39, 254–265. [Google Scholar] [CrossRef]
- Medyouni, I.; Zouaoui, R.; Rubio, E.; Serino, S.; Ahmed, H.B.; Bertin, N. Effects of water deficit on leaves and fruit quality during the development period in tomato plant. Food Sci. Nutr. 2021, 9, 1949–1960. [Google Scholar] [CrossRef] [PubMed]
- Ma, W.-F.; Li, Y.-B.; Nai, G.-J.; Liang, G.-P.; Ma, Z.-H.; Chen, B.-H.; Mao, J. Changes and response mechanism of sugar and organic acids in fruits under water deficit stress. Peer J. 2022, 10, e13691. [Google Scholar] [CrossRef]
- Menezes-Silva, P.E.; Sanglard, L.; Ávila, R.T.; Morais, L.; Martins, S.C.V.; Nobres, P.; Patreze, C.M.; Ferreira, M.A.; Araújo, W.L.; Fernie, A.R.; et al. Photosynthetic and metabolic acclimation to repeated drought events play key roles in drought tolerance in coffee. J. Exp. Bot. 2017, 68, 4309–4322. [Google Scholar] [CrossRef]
- Jian-Kang, Z. Plant salt tolerance. Trends Plant Sci. 2001, 6, 66–71. [Google Scholar]
- Wang, L.; Meng, X.; Yang, D.; Ma, N.; Wang, G.; Meng, Q. Overexpression of tomato GDP-L-galactose phosphorylase gene in tobacco improves tolerance to chilling stress. Plant Cell Rep. 2014, 33, 1441–1451. [Google Scholar] [CrossRef]


| Increasing and Decreasing Percentages Compared with Irrigated Plants in the First Stress Stage | |||||||||
| Treatment | SL (%) | SFW (%) | SDW (%) | RL (%) | RFW (%) | RDW (%) | FWT (%) | RWC (%) | TCC (%) |
| SOBS | −6.70 a ± 5.15 | 1.90 a ± 20.80 | 7.72 a ± 27.31 | 4.94 a ± 16.58 | 74.93 a ± 50.94 | 99.21 a ± 84.92 | −27.30 ab ± 9.53 | −11.94 ab ± 3.26 | −24.30 b ± 12.18 |
| SOES | −6.54 a ± 8.47 | −5.78 b ± 7.59 | −3.24 b ± 8.14 | 0.03 ab ± 12.43 | 44.00 b ± 58.76 | 43.76 ab ± 117.82 | −21.36 a ± 16.97 | −9.44 a ± 8.07 | −9.80 a ± 18.67 |
| SOS | −7.13 a ± 5.52 | −8.93 b ± 6.53 | −11.53 c ± 6.95 | −4.57 b ± 15.55 | 30.05 b ± 26.34 | 22.51 b ± 20.64 | −28.59 b ± 10.07 | −14.24 bc ± 3.89 | −33.34 b ± 8.43 |
| SS | −13.52 b ± 6.56 | −24.76 c ± 15.11 | −22.98 d ± 14.67 | −16.67 c ± 11.37 | 16.16 b ± 29.80 | 26.11 b ± 52.72 | −32.58 b ± 11.58 | −16.75 c ± 4.69 | −31.30 b ± 10.72 |
| Increasing and Decreasing Percentages Compared with Irrigated Plants in the Second Stress Stage | |||||||||
| Treatment | SL (%) | SFW (%) | SDW (%) | RL (%) | RFW (%) | RDW (%) | FWT (%) | RWC (%) | TCC (%) |
| SOBS | −9.28 a ± 4.57 | −7.95 a ± 13.31 | 3.02 a ± 18.52 | 15.70 a ± 17.39 | 107.57 a ± 104.78 | 121.80 a ± 91.08 | −28.49 a ± 13.46 | −10.12 a ± 4.59 | −24.18 b ± 12.07 |
| SOES | −9.04 a ± 5.33 | −14.16 b ± 10.09 | −5.18 b ± 11.10 | 5.96 b ± 15.92 | 94.83 a ± 86.72 | 104.54 a ± 82.27 | −30.57 a ± 11.03 | −8.87 a ± 7.42 | −16.85 a ± 12.49 |
| SOS | −13.00 a ± 6.63 | −20.21 c ± 10.32 | −14.03 c ± 8.70 | −11.47 c ± 14.93 | 30.54 b ± 39.65 | 36.60 b ± 26.44 | −35.13 b ± 10.26 | −10.88 a ± 3.99 | −33.29 c ± 10.34 |
| SS | −20.56 b ± 8.62 | −29.05 d ± 15.83 | −25.14 d ± 14.76 | −12.84 c ± 11.43 | 29.59 b ± 39.99 | 31.48 b ± 67.26 | −37.64 b ± 11.47 | −18.14 b ± 6.84 | −31.55 c ± 10.75 |
| Increasing and Decreasing Percentages Compared with Irrigated Plants in the First and Second Stress Stages | |||||||||
| Treatment | SL (%) | SFW (%) | SDW (%) | RL (%) | RFW (%) | RDW (%) | FWT (%) | RWC (%) | TCC (%) |
| SOBS | −13.95 a ± 7.95 | −15.22 b ± 12.10 | −9.28 a ± 11.43 | 8.52 a ± 17.42 | 92.02 a ± 83.34 | 101.46 a ± 100.45 | −41.10 a ± 13.87 | −15.59 a ± 6.65 | −26.22 b ± 11.54 |
| SOES | −14.57 a ± 7.57 | −9.14 a ± 12.32 | −8.57 a ± 8.88 | 2.52 ab ± 14.18 | 89.63 a ± 76.02 | 100.71 a ± 106.78 | −39.72 a ± 12.98 | −13.70 a ± 6.65 | −16.24 a ± 14.80 |
| SOS | −17.50 a ± 8.64 | −16.48 b ± 13.13 | −13.05 b ± 10.59 | −3.73 b ± 9.00 | 51.78 b ± 52.23 | 62.56 b ± 117.59 | −40.04 a ± 11.37 | −16.87 a ± 6.45 | −32.91 c ± 8.37 |
| SS | −23.80 b ± 9.89 | −36.00 c ± 23.39 | −27.49 c ± 16.15 | −12.98 c ± 6.97 | 27.08 b ± 35.52 | 37.11 c ± 86.64 | −45.10 b ± 13.80 | −22.06 b ± 5.42 | −35.64 c ± 10.40 |
| Increasing and Decreasing Percentages Compared with Irrigated Plants in the First Stress Stage | |||||||
| Treatment | MC | TA | TSS | ASC | CAC | SSC | TPC |
| SOBS | −0.67 a ± 0.45 | 2.64 bc ± 6.43 | −1.73 a ± 4.35 | 23.50 a ± 12.40 | −3.02 b ± 4.43 | 3.27 a ± 7.73 | 8.55 b ± 12.38 |
| SOES | −0.59 a ± 0.35 | 1.03 c ± 6.81 | −2.08 a ± 3.60 | 22.10 b ± 14.06 | −1.80 a ± 4.25 | 2.78 a ± 8.68 | 11.10 a ± 10.93 |
| SOS | −0.87 b ± 045 | 5.82 b ± 5.12 | −4.43 b ± 4.29 | 15.92 c ± 11.81 | −5.35 c ± 6.19 | −2.34 b ± 7.72 | 9.06 b ± 10.41 |
| SS | −1.28 c ± 0.83 | 11.23 a ± 6.53 | −6.67 c ± 4.37 | 6.41 d ± 10.22 | −7.64 d ± 7.61 | −8.28 c ± 11.84 | 5.06 c ± 10.63 |
| Increasing and Decreasing Percentages Compared with Irrigated Plants in the Second Stress Stage | |||||||
| Treatment | MC | TA | TSS | ASC | CAC | SSC | TPC |
| SOBS | −0.65 a ± 0.046 | 3.45 b ± 7.54 | −1.59 a ± 3.23 | 17.22 b ± 18.89 | −0.03 a ± 6.67 | 1.68 b ± 10.98 | 12.21 a ± 14.70 |
| SOES | −0.55 a ± 0.039 | 2.12 b ± 7.50 | −2.42 a ± 3.26 | 18.49 a ± 16.69 | −2.40 b ± 7.74 | 2.73 a ± 9.89 | 11.37 a ± 14.15 |
| SOS | −0.87 b ± 0.44 | 6.00 b ± 5.91 | −4.21 b ± 4.64 | 13.40 c ± 17.44 | −4.70 c ± 8.46 | −2.71 c ± 9.85 | 9.37 b ± 12.41 |
| SS | −1.23 c ± 0.78 | 12.63 a ± 11.80 | −6.51 c ± 5.14 | 2.29 d ± 12.86 | −7.80 d ± 10.15 | −8.35 d ± 13.56 | 4.68 c ± 9.02 |
| Increasing and Decreasing Percentages Compared with Irrigated Plants in the First and Second Stress Stages | |||||||
| Treatment | MC | TA | TSS | ASC | CAC | SSC | TPC |
| SOBS | −0.90 a ± 0.58 | 6.65 c ± 6.14 | −3.86 a ± 4.53 | 12.73 a ± 16.38 | −2.58 a ± 9.90 | −1.49 a ± 10.12 | 9.12 b ± 13.75 |
| SOES | −0.86 a ± 0.59 | 7.19 c ± 5.68 | −4.27 a ± 4.50 | 13.11 a ± 17.24 | −5.12 b ± 9.91 | −1.69 a ± 9.79 | 10.42 a ± 14.22 |
| SOS | −1.21 b ± 0.74 | 11.47 b ± 5.94 | −5.88 b ± 5.32 | 7.04 b ± 17.51 | −6.92 c ± 10.56 | −6.41 b ± 10.34 | 7.65 c ± 12.05 |
| SS | −1.55 c ± 1.01 | 19.05 a ± 11.13 | −8.54 c ± 5.74 | −3.73 c ± 14.17 | −10.10 d ± 11.68 | −12.31 c ± 13.16 | 1.78 d ± 10.46 |
| Increasing and Decreasing Percentages Compared with Irrigated Plants during the First Stress Stage | |||||||||
| Genotypes | SL (%) | SFW (%) | SDW (%) | RL (%) | RFW (%) | RDW (%) | FWT (%) | RWC (%) | TCC (%) |
| Raza Pashayi | −4.98 a ± 5.24 | −5.75 a ± 2.20 | −3.79 b ± 1.95 | −6.52 bc ± 11.01 | 34.19 b ± 17.88 | 53.76 ab ± 16.65 | −19.47 a ± 6.44 | −11.75 ab ± 4.63 | −31.53 b ± 8.38 |
| Sandra | −5.14 a ± 5.81 | −8.03 a ± 7.99 | −9.21 c ± 9.88 | −5.18 b ± 7.93 | 36.34 b ± 60.49 | 98.55 a ± 146. 60 | −21.26 ab ± 14.64 | −10.13 a ± 8.03 | −32.62 b ± 23.06 |
| Braw | −10.65 b ± 6.62 | −5.83 a ± 30.20 | 0.79 a ± 35.77 | −14.79 c ± 13.11 | 66.29 a ± 64.37 | 24.59 b ± 41.84 | −26.48 b ± 5.15 | −14.81 b ± 5.28 | −17.60 a ± 8.38 |
| Yadgar | −13.12 b ± 7.06 | −17.96 b ± 9.03 | −17.83 d ± 9.88 | 10.23 a ± 19.20 | 28.30 b ± 25.01 | 14.68 b ± 16.65 | −42.63 c ± 6.24 | −15.68 b ± 3.01 | −16.98 a ± 11.40 |
| Increasing and Decreasing Percentages Compared with Irrigated Plants during the Second Stress Stage | |||||||||
| Genotypes | SL (%) | SFW (%) | SDW (%) | RL (%) | RFW (%) | RDW (%) | FWT (%) | RWC (%) | TCC (%) |
| Raza Pashayi | −8.71 a ± 4.44 | −6.32 a ± 1.83 | −4.32 a ± 1.17 | −2.97 bc ± 17.02 | 43.51 b ± 27.94 | 76.21 b ± 24.00 | −18.68 a ± 8.55 | −12.57 ab ± 4.76 | −31.19 c ± 7.80 |
| Sandra | −9.35 a ± 5.40 | −13.32 b ± 8.57 | −7.98 a ± 10.95 | −11.49 c ± 10.65 | 53.32 b ± 51.17 | 158.73 a ± 94.25 | −29.87 b ± 4.25 | −8.93 a ± 8.25 | −39.90 d ± 8.22 |
| Braw | −18.44 b ± 9.70 | −21.72 c ± 20.98 | −6.05 a ± 28.75 | −0.54 b ± 20.29 | 150.13 a ± 110.13 | 52.48 b ± 66.73 | −36.66 c ± 3.49 | −14.55 b ± 4.13 | −14.13 a ± 9.99 |
| Yadgar | −15.39 b ± 6.74 | −30.00 d ± 6.22 | −22.97 b ± 7.07 | 12.36 a ± 20.13 | 15.57 b ± 22.11 | 6.99 c ± 11.82 | −46.60 d ± 6.52 | −11.96 ab ± 8.40 | −20.65 b ± 7.58 |
| Increasing and Decreasing Percentages Compared with Irrigated Plants during the First and Second Stress Stages | |||||||||
| Genotypes | SL (%) | SFW (%) | SDW (%) | RL (%) | RFW (%) | RDW (%) | FWT (%) | RWC (%) | TCC (%) |
| Raza Pashayi | −9.97 a ± 3.90 | −6.23 a ± 1.68 | −3.28 a ± 1.61 | 0.14 b ± 11.89 | 36.62 c ± 23.30 | 53.07 b ± 26.86 | −25.90 a ± 5.29 | −22.04 c ± 2.75 | −33.06 c ± 7.58 |
| Sandra | −12.01 a ± 6.33 | −13.64 b ± 9.47 | −10.01 b ± 10.39 | −9.82 c ± 8.32 | 73.29 b ± 45.59 | 238.51 a ± 47.09 | −36.77 b ± 3.01 | −15.54 ab ± 6.41 | −40.04 d ± 6.58 |
| Braw | −27.55 c ± 7.28 | −24.46 c ± 29.40 | −18.78 c ± 18.75 | −4.75 bc ± 14.41 | 143.07 a ± 75.82 | 12.30 c ± 48.49 | −44.83 c ± 4.28 | −18.42 bc ± 5.54 | −15.80 a ± 10.58 |
| Yadgar | −20.29 b ± 6.15 | −32.50 d ± 8.00 | −26.31 d ± 6.58 | 8.77 a ± 16.95 | 7.52 d ± 18.88 | −2.04 c ± 17.34 | −58.46 d ± 5.43 | −12.23 a ± 8.06 | −22.11 b ± 13.26 |
| Increasing and Decreasing Percentages Compared with Irrigated Plants during the First Stress Stage | |||||||
| Genotypes | MC (%) | TA (%) | TSS (%) | ASC (%) | CAC (%) | SSC (%) | TPC (%) |
| Raza Pashayi | −0.45 a ± 0.14 | −1.49 b ± 9.61 | −2.06 b ± 2.35 | 29.29 a ± 6.52 | −0.84 b ± 1.37 | 5.73 b ± 3.59 | 19.82 a ± 2.46 |
| Sandra | −0.35 a ± 0.18 | 5.97 a ± 5.27 | 1.32 a ± 2.84 | 25.46 b ± 10.82 | 2.22 a ± 0.73 | 9.07 a ± 3.84 | 14.18 b ± 2.72 |
| Braw | −1.46 c ± 0.68 | 7.46 a ± 6.65 | −6.68 c ± 2.81 | 0.26 d ± 5.12 | −8.24 c ± 3.86 | −9.45 c ± 8.47 | −8.43 d ± 3.12 |
| Yadgar | −1.14 b ± 0.25 | 8.77 a ± 5.84 | −7.49 c ± 3.07 | 12.93 c ± 6.40 | −10.95 d ± 3.73 | −9.94 c ± 4.69 | 8.20 c ± 1.97 |
| Increasing and Decreasing Percentages Compared with Irrigated Plants during the Second Stress Stage | |||||||
| Genotypes | MC (%) | TA (%) | TSS (%) | ASC (%) | CAC (%) | SSC (%) | TPC (%) |
| Raza Pashayi | −0.39 a ± 0.20 | −3.71 c ± 5.59 | −1.93 b ± 1.54 | 24.72 b ± 4.60 | 2.04 b ± 1.51 | 2.73 b ± 2.79 | 24.29 a ± 6.83 |
| Sandra | −0.33 a ± 0.17 | 6.01 b ± 6.63 | 1.32 a ± 2.09 | 27.38 a ± 12.61 | 5.01 a ± 1.03 | 12.67 a ± 4.54 | 15.19 b ± 4.13 |
| Braw | −1.44 c ± 0.57 | 14.87 a ± 7.93 | −6.15 c ± 3.28 | −11.16 d ± 2.62 | −13.05 d ± 2.80 | −15.41 d ± 7.74 | −8.02 d ± 1.74 |
| Yadgar | −1.14 b ± 0.29 | 7.03 b ± 5.53 | −7.97 d ± 3.12 | 10.46 c ± 8.75 | −8.92 c ± 7.82 | −6.64 c ± 4.02 | 6.18 c ± 1.03 |
| Increasing and Decreasing Percentages Compared with Irrigated Plants during the First and Second Stress Stages | |||||||
| Genotypes | MC (%) | TA (%) | TSS (%) | ASC (%) | CAC (%) | SSC (%) | TPC (%) |
| Raza Pashayi | −0.42 a ± 0.20 | 3.12 c ± 5.58 | −2.90 b ± 3.32 | 20.78 a ± 7.76 | 0.19 b ± 2.75 | 0.33 b ± 3.46 | 21.28 a ± 6.70 |
| Sandra | −0.65 b ± 0.14 | 9.65 b ± 5.28 | 0.24 a ± 2.71 | 20.57 a ± 9.39 | 6.95 a ± 1.89 | 7.81 a ± 4.09 | 12.68 b ± 3.67 |
| Braw | −2.14 d ± 0.70 | 17.57 a ± 10.89 | −8.79 c ± 1.59 | −17.15 c ± 6.30 | −16.17 c ± 4.31 | −18.87 d ± 7.90 | −11.39 d ± 2.23 |
| Yadgar | −1.31 c ± 0.32 | 14.01 a ± 5.66 | −11.09 d ± 2.59 | 4.96 b ± 6.22 | −15.68 c ± 2.75 | −11.17 c ± 3.38 | 6.39 c ± 1.82 |
| First Stress Stage | |||||||
| Treatment | PC (µg g−1) | SSC (µg g−1) | TPC (µg g−1) | AC (µg g−1) | LP (nmol g−1) | GPA (units min−1 g−1) | CAT (units min−1 g−1) |
| SOBS | 1546.37 b ± 503.08 | 569.04 b ± 99.21 | 433.90 a ± 98.38 | 1010.20 a ± 173.44 | 8.46 c ± 1.13 | 0.26 b ± 0.06 | 139.61 b ± 42.49 |
| SOES | 1956.50 a ± 489.76 | 612.64 a ± 109.34 | 399.21 b ± 90.59 | 1006.99 b ± 175.26 | 7.15 d ± 0.98 | 0.34 a ± 0.06 | 160.71 a ± 56.00 |
| SOS | 1322.91 c ± 619.10 | 524.14 c ± 96.68 | 344.91 c ± 57.07 | 966.79 c ± 171.26 | 11.05 b ± 2.24 | 0.25 b ± 0.08 | 118.51 c ± 65.65 |
| SS | 1307.65 d ± 578.09 | 417.19 d ± 108.74 | 325.57 d ± 56.09 | 892.80 d ± 94.45 | 13.10 a ± 2.26 | 0.16 c ± 0.09 | 87.66 d ± 45.71 |
| SW | 1054.58 e ± 425.20 | 374.14 e ± 91.47 | 312.23 e ± 63.52 | 893.31 d ± 129.46 | 5.24 e ± 0.78 | 0.13 d ± 0.06 | 64.94 e ± 42.26 |
| Second Stress Stage | |||||||
| Treatment | PC (µg g−1) | SSC (µg g−1) | TPC (µg g−1) | AC (µg g−1) | LP (nmol g−1) | GPA (units min−1 g−1) | CAT (units min−1 g−1) |
| SOBS | 2058.81 b ± 426.81 | 742.65 b ± 110.77 | 428.24 a ± 20.91 | 986.05 a ± 120.82 | 9.92 c ± 1.40 | 0.24 b ± 0.08 | 126.62 b ± 30.89 |
| SOES | 2534.00 a ± 433.44 | 782.93 a ± 89.71 | 402.68 b ± 29.48 | 974.43 b ± 159.49 | 8.17 d ± 1.68 | 0.33 a ± 0.08 | 159.09 a ± 40.27 |
| SOS | 1813.81 c ± 396.27 | 627.76 c ± 146.44 | 378.99 c ± 35.48 | 909.19 c ± 163.83 | 10.59 b ± 1.32 | 0.23 c ± 0.06 | 113.64 c ± 24.69 |
| SS | 1616.82 d ± 444.00 | 529.00 d ± 122.78 | 322.51 e ± 70.59 | 902.40 d ± 139.83 | 12.83 a ± 2.85 | 0.17 d ± 0.07 | 81.17 d ± 15.04 |
| SW | 1126.37 e ± 533.06 | 501.76 e ± 145.17 | 334.84 d ± 32.40 | 895.51 e ± 109.70 | 7.20 e ± 0.51 | 0.15 e ± 0.08 | 64.94 e ± 40.50 |
| Combination of Both Stress Stages | |||||||
| Treatment | PC (µg g−1) | SSC (µg g−1) | TPC (µg g−1) | AC (µg g−1) | LP (nmol g−1) | GPA (units min−1 g−1) | CAT (units min−1 g−1) |
| SOBS | 2057.01 b ± 391.73 | 764.63 b ± 121.99 | 453.15 b ± 58.23 | 1029.29 b ± 96.55 | 10.67 c ± 1.11 | 0.30 b ± 0.11 | 155.84 b ± 63.92 |
| SOES | 2217.65 a ± 330.37 | 856.54 a ± 96.24 | 493.69 a ± 122.67 | 1092.47 a ± 120.92 | 8.94 d ± 1.21 | 0.44 a ± 0.19 | 217.53 a ± 90.38 |
| SOS | 1689.96 c ± 485.67 | 670.35 c ± 109.86 | 407.97 c ± 59.26 | 938.58 c ± 96.75 | 12.53 b ± 2.66 | 0.27 c ± 0.10 | 137.99 c ± 20.56 |
| SS | 1661.24 d ± 268.52 | 580.69 d ± 12.76 | 316.07 e ± 76.85 | 907.34 d ± 118.09 | 13.95 a ± 2.80 | 0.17 d ± 0.09 | 95.78 d ± 17.32 |
| SW | 1126.37 e ± 533.06 | 501.76 e ± 145.17 | 334.84 d ± 32.40 | 895.51 d ± 109.70 | 7.20 e ± 0.51 | 0.15 e ± 0.08 | 64.94 e ± 40.50 |
| First Stress Stage | |||||||
| Genotypes | PC (µg g−1) | SSC (µg g−1) | TPC (µg g−1) | AC (µg g−1) | LP (nmol g−1) | GPA (units min−1 g−1) | CAT (units min−1 g−1) |
| Raza Pashayi | 1093.08 d ± 146.59 | 517.72 b ± 160.20 | 433.82 a ± 65.06 | 987.30 c ± 34.97 | 6.86 d ± 2.03 | 0.30 a ± 0.06 | 172.73 a ± 40.01 |
| Sandra | 2220.97 a ± 257.08 | 610.25 a ± 88.53 | 371.72 c ± 70.52 | 1080.95 a ± 106.77 | 9.39 b ± 2.34 | 0.26 b ± 0.12 | 132.47 b ± 46.10 |
| Braw | 1252.82 b ± 497.38 | 499.26 c ± 75.14 | 393.63 b ± 48.06 | 1020.41 b ± 103.02 | 9.28 c ± 3.50 | 0.19 c ± 0.07 | 93.51 c ± 59.81 |
| Yadgar | 1183.54 c ± 526.99 | 370.49 d ± 69.11 | 253.48 d ± 21.77 | 727.43 d ± 34.97 | 10.46 a ± 3.77 | 0.16 d ± 0.08 | 58.44 d ± 17.35 |
| Second Stress Stage | |||||||
| Genotypes | PC (µg g−1) | SSC (µg g−1) | TPC (µg g−1) | AC (µg g−1) | LP (nmol g−1) | GPA (units min−1 g−1) | CAT (units min−1 g−1) |
| Raza Pashayi | 1620.41 c ± 526.17 | 606.11 c ± 181.90 | 378.73 b ± 51.11 | 1010.00 b ± 59.28 | 8.93 c ± 1.88 | 0.31 a ± 0.06 | 103.90 bc ± 27.77 |
| Sandra | 2278.41 a ± 491.93 | 658.77 b ± 100.11 | 414.37 a ± 27.83 | 1102.97 a ± 47.37 | 7.93 d ± 1.19 | 0.23 b ± 0.12 | 128.57 a ± 68.90 |
| Braw | 1621.13 c ± 938.94 | 795.56 a ± 82.71 | 373.60 c ± 23.28 | 858.92 c ± 27.47 | 10.77 b ± 2.48 | 0.19 c ± 0.07 | 106.49 b ± 47.70 |
| Yadgar | 1799.90 b ± 121.84 | 486.85 d ± 110.53 | 327.12 d ± 74.40 | 762.16 d ± 54.98 | 11.34 a ± 3.01 | 0.17 d ± 0.04 | 97.40 c ± 18.69 |
| Combination of Both Stress Stages | |||||||
| Genotypes | PC (µg g−1) | SSC (µg g−1) | TPC (µg g−1) | AC (µg g−1) | LP (nmol g−1) | GPA (units min−1 g−1) | CAT (units min−1 g−1) |
| Raza Pashayi | 1903.64 b ± 567.18 | 658.83 c ± 190.89 | 432.28 b ± 97.33 | 1003.38 b ± 57.89 | 9.30 c ± 2.13 | 0.40 a ± 0.13 | 132.47 b ± 47.07 |
| Sandra | 2114.72 a ± 403.89 | 724.07 b ± 157.46 | 405.43 c ± 18.45 | 1082.30 a ± 52.67 | 9.01 d ± 1.28 | 0.29 b ± 0.21 | 176.62 a ± 125.44 |
| Braw | 1382.77 d ± 117.24 | 793.94 a ± 72.50 | 459.33 a ± 118.99 | 955.36 c ± 168.75 | 12.48 a ± 3.63 | 0.17 d ± 0.06 | 103.90 c ± 36.73 |
| Yadgar | 1600.67 c ± 669.52 | 522.35 d ± 126.03 | 307.53 d ± 65.85 | 849.50 d ± 79.51 | 11.85 b ± 3.14 | 0.20 c ± 0.06 | 124.68 b ± 30.28 |
| Name of Compound | Retention Time (min) | Peak Area | Concentration (%) | Biological Activity of Major Compounds |
|---|---|---|---|---|
| Silane, dimethoxydimethyl- | 5.17 | 7,202,705.00 | 11.67 | Antibacterial [43] |
| Cyclotrisiloxane, hexamethyl- | 6.93 | 327,535.00 | 0.53 | |
| Silane, methyldimethoxyethoxy- | 8.30 | 268,638.00 | 0.44 | |
| Oxime-, methoxy-phenyl- | 9.38 | 231,616.00 | 0.38 | |
| Tetraethyl silicate | 10.54 | 314,412.00 | 0.51 | |
| 1-Dodecanol | 13.90 | 796,766.00 | 1.29 | Antibacterial [44] |
| 1-Hexadecanol | 16.73 | 1,941,423.00 | 9.37 | Reduction of evaporation [45] |
| Carbonic acid, decyl undecyl ester | 16.84 | 397,832.00 | 0.64 | |
| 7-Tetradecene | 16.90 | 307,446.00 | 0.50 | |
| Chloroacetic acid, tetradecyl ester | 17.04 | 250,824.00 | 0.41 | |
| 2,4-Di-tert-butylphenol | 18.29 | 4,329,760.00 | 7.02 | Antioxidant [46,47,48] |
| Carbonic acid, eicosyl vinyl ester | 19.31 | 422,435.00 | 0.68 | |
| Dichloroacetic acid, 4-hexadecyl ester | 19.36 | 536,815.00 | 1.52 | Antimicrobial [49] |
| 1-Octadecene | 21.45 | 4,150,402.00 | 6.73 | Antioxidant and antimicrobial [50,51] |
| Acetic acid, chloro-, octadecyl ester | 21.58 | 542,636.00 | 1.55 | No activity was reported |
| 1,2-Benzenedicarboxylic acid, bis(2-methylpropyl) ester | 22.32 | 229,532.00 | 0.37 | |
| 18-Norabietane | 23.10 | 242,753.00 | 0.39 | |
| Behenic alcohol | 23.48 | 3,132,644.00 | 8.86 | Antifungal [52] |
| Chloroacetic acid, pentadecyl ester | 23.58 | 273,527.00 | 1.01 | No activity was reported |
| Coumatetralyl isomer-2 ME | 23.67 | 918,610.00 | 1.49 | No activity was reported |
| Acetic acid, chloro-, octadecyl ester | 24.34 | 507,902.00 | 0.82 | |
| Cyclotetrasiloxane, octamethyl- | 27.02 | 268,576.00 | 0.44 | |
| Heptasiloxane, 1,1,3,3,5,5,7,7,9,9,11,11,13,13-tetradecamethyl- | 32.59 | 21,294,993.00 | 32.50 | Insecticidal and antibacterial [53,54] |
| Octasiloxane, 1,1,3,3,5,5,7,7,9,9,11,11,13,13,15,15-hexadecamethyl- | 38.79 | 6,719,421.00 | 10.88 |
Publisher’s Note: MDPI stays neutral with regard to jurisdictional claims in published maps and institutional affiliations. |
© 2022 by the authors. Licensee MDPI, Basel, Switzerland. This article is an open access article distributed under the terms and conditions of the Creative Commons Attribution (CC BY) license (https://creativecommons.org/licenses/by/4.0/).
Share and Cite
Tahir, N.A.-r.; Rasul, K.S.; Lateef, D.D.; Grundler, F.M.W. Effects of Oak Leaf Extract, Biofertilizer, and Soil Containing Oak Leaf Powder on Tomato Growth and Biochemical Characteristics under Water Stress Conditions. Agriculture 2022, 12, 2082. https://doi.org/10.3390/agriculture12122082
Tahir NA-r, Rasul KS, Lateef DD, Grundler FMW. Effects of Oak Leaf Extract, Biofertilizer, and Soil Containing Oak Leaf Powder on Tomato Growth and Biochemical Characteristics under Water Stress Conditions. Agriculture. 2022; 12(12):2082. https://doi.org/10.3390/agriculture12122082
Chicago/Turabian StyleTahir, Nawroz Abdul-razzak, Kamaran Salh Rasul, Djshwar Dhahir Lateef, and Florian M. W. Grundler. 2022. "Effects of Oak Leaf Extract, Biofertilizer, and Soil Containing Oak Leaf Powder on Tomato Growth and Biochemical Characteristics under Water Stress Conditions" Agriculture 12, no. 12: 2082. https://doi.org/10.3390/agriculture12122082
APA StyleTahir, N. A.-r., Rasul, K. S., Lateef, D. D., & Grundler, F. M. W. (2022). Effects of Oak Leaf Extract, Biofertilizer, and Soil Containing Oak Leaf Powder on Tomato Growth and Biochemical Characteristics under Water Stress Conditions. Agriculture, 12(12), 2082. https://doi.org/10.3390/agriculture12122082