Article

Soil Moisture and Temperature Effects on Granule Dissolution and Urease Activity of Urea with and without Inhibitors—An Incubation Study

by
Kang Ni
1,2 and
Andreas Siegfried Pacholski
2,3,*
1
Tea Research Institute, Chinese Academy of Agriculture Sciences, South Meiling Road 9, Hangzhou 310008, China
2
Department of Agronomy and Crop Science, Kiel University, Hermann Rodewald Str. 9, 24118 Kiel, Germany
3
Institute for Climate-Smart Agriculture—Thünen Institute, Bundesallee 65, 38116 Braunschweig, Germany
*
Author to whom correspondence should be addressed.
Agriculture 2022, 12(12), 2037; https://doi.org/10.3390/agriculture12122037
Submission received: 14 October 2022 / Revised: 16 November 2022 / Accepted: 24 November 2022 / Published: 28 November 2022
(This article belongs to the Special Issue Nitrogen Fertilization in Crop Production)

Abstract

:
Urea granule dissolution in soil and soil urease activity are essential parameters for the accurate prediction of nitrogen dynamics after urea application, but both are scarcely studied. The response of urease activity to temperature is unclear under the addition of urease or nitrification inhibitors. In this study, we conducted laboratory incubation trials using glass jars with 100 g soil to quantify urea granule dissolution. Urease activity after urease and nitrification inhibitor addition were investigated in plastic bottles (5 g soil) under different temperatures. Inhibitor N-(2-nitrophenyl) phosphoric triamide (2-NPT), and a mixture of dicyandiamide and 1 H-1,2,4-triazol (DCD/HZ) were tested as urease and nitrification inhibitors separately and in combination. The dynamics of urease activity was fitted with Michaelis–Menten kinetics combined with the Van’t Hoff equation. At low soil moisture contents close to air-dry conditions (4–8% w/w water content), soil moisture was the dominant factor, but at higher soil moisture contents (28% and 48% w/w), temperature controlled the dissolution process. Dissolution could take several days or even longer at very dry soil conditions, while it was completed between a few hours and 24 h at high soil moisture levels. Urea with urease inhibitor formulation dissolved significantly slower at a moisture level of 28% (w/w). In the studied soil, urease activity varied between 2.9 and 54.4 mg NH4+-N kg−1 h−1. Across all urea concentrations, the addition of urease inhibitor 2-NPT significantly reduced urease activity. The relationship between urease activity and urea addition rate could be accurately described with Michaelis–Menten kinetics, and urease inhibitor addition reduced the temperature sensitivity of urease activity by 7%, while the nitrification inhibitor increased it by 4%. Parameter estimates and process characterization for urea granule dissolution and urea hydrolysis in this study are meaningful for and helpful in agricultural practice and the model simulation of soil nitrogen dynamics.

1. Introduction

Urea has several advantages compared to other nitrogen fertilizers, including neutral pH, high N content, and nonexplosivity, and is the most widely used fertilizer globally. With increasing demands for nitrogen use efficiency and environmental protection in agriculture, e.g., fewer ammonia emissions and less nitrate leaching, coated or mixed granular urea with urease and nitrification inhibitors have been widely used in agricultural practice. Previous studies confirmed the positive effect of urease and nitrification inhibitors on ammonia emissions and nitrate leaching reduction, respectively, and nitrogen use efficiency [1,2,3,4].
The dynamics of urea granule dissolution and urea hydrolysis via urease determine the rate and intensity of the ammonia emission process [5,6,7]. A detailed understanding of both processes is required to understand the emission process, and the development of appropriate management and mitigation methods to reduce ammonia emissions. The first process involving crop fertilization with fertilizer granules is the dissolution of granules, which can be overall limiting when low temperature, low moisture, and other environmental conditions hinder dissolution. This aspect may become more relevant under conditions of climate change with longer periods of drought and low surface soil moisture. In recent years, urea dissolution and release have mainly been studied in the context of controlled release fertilizers [8]. However, the rate of urea granule dissolution might explain differences in ammonia loss dynamics for untreated urea [7]. The dissolution rate could influence urea distribution in soil, and thereby urea hydrolysis and connected soil pH increase, the main environmental factor for ammonia emissions after urea application. In addition, environmental conditions may change during a slower and longer dissolution process. A better understanding of this process is, therefore, desirable.
As the second step for the behavior of urea after fertilization, urease activity is a key parameter in modeling the urea nitrogen dynamics in soil after application, mainly depending on temperature and dissolved urea concentration. Many efforts have been made to investigate the effect of temperature and urea concentration on urease activity after the application of conventional urea. In practice, only Michaelis–Menten kinetics has been employed to describe the relation between substrate concentration [9,10] and urease activity, and the Arrhenius equation was used to quantify the positive effect of temperature on urease activity [11,12]. Due to the effects of urease concentrations and urease types, specific relationships and effect sizes should be considered to be soil-specific and cannot be transferred between soils. However, a general pattern of effects can be derived from a study involving single soils.
As both urea dissolution and urea hydrolysis are, apart from soil characteristics as urease concentrations and water retention, strongly governed by soil water content and soil temperature, the latter two influencing variables require specific attention. In many countries, in particular with machine application, the surface application of urea is standard; therefore, we wanted to simulate the surface application of urea in the field in the dissolution trial.
Knowledge of the effects of urease inhibitor (UI) or nitrification inhibitor (NI) on urease activity and urea dissolution is still limited, particularly for the novel urease inhibitor N-(2-nitrophenyl) phosphoric triamide (2-NPT). This study was conducted to evaluate the effects of a urease inhibitor and a nitrification inhibitor (alone and in combination), substrate concentration, and temperature on urease activity with laboratory incubation and subsequent statistical modelling. Second, we investigated the effect of temperature and soil moisture on urea dissolution of surface applied urea. We hypothesized that: (1) urease activity is strongly reduced across temperatures and urea concentrations with the use of UI, also in coapplication with NI; and (2) no effect on urea hydrolysis via the application of a nitrification inhibitor would be present. Urea dissolution as a physical process is also assumed to be strongly moisture- and temperature-dependent. Furthermore, we hypothesized that (3) granule dissolution is mainly dominated by soil moisture with variable effects of temperature across soil moisture levels.

2. Materials and Methods

2.1. Soil Sampling and Handling

The soil used in the study was from a surface (0–0.15 m) sample taken in September after a maize harvest from experimental station Hohenschulen, which belongs to the Christian Albrechts University at Kiel in Northern Germany (54°18′ N, 9°58′ E). It is classified as Luvisol with a sandy loam texture, bulk density of 1.37 g cm−3, pH of 6.5, total organic C of 1.5%, total N of 0.1%, NH4+-N of 0.2 mg kg−1, NO3-N of 51 mg kg−1, 58% sand, 29% silt, and 13% clay. The soil was air-dried for about 1 month, homogenized, and passed through a 2 mm sieve before storage in a refrigerator. Soil gravimetric water content was 8% (w/w) at the time of field sampling.

2.2. Tested Urea-Based Fertilizers

Four different urea fertilizers were tested in this study: conventional granular urea without any inhibitors (U), urea containing nitrification inhibitor (U + NI), urea containing urease inhibitor (U + UI) and urea with both urease and nitrification inhibitors (U + UI + NI). The urease inhibitor in the study was N-(2-nitrophenyl) phosphoric triamide (2-NPT), and the nitrification inhibitor was the mixture of dicyandiamide and 1 H-1,2,4-triazol (DCD/HZ). The concentrations of urease and nitrification inhibitors were 0.04% and 2% of N mass, respectively. The two inhibitors were mixed into the granule during granulation. All fertilizers were provided by SKW Stickstoffwerke Piesteritz GmbH, Germany.

2.3. Urea Granule Dissolution

Temperatures of 10, 20, and 30 °C, and gravimetric soil water levels of 4%, 8%, 28%, and 48% were chosen to test the effects of temperature and soil water content on granule dissolution in an incubation trial. Temperatures and soil water contents were chosen to account for the range of conditions at fertilizer application in central Europe. A gravimetric water content of the studied soil of 4% (w/w) corresponded to 11% water-filled pore space (WFPS), 8% (w/w) to 23% WFPS, 28% (w/w) to 79% WFPS, and 48% (w/w) to 136% WFPS (oversaturated). WFPS was calculated according to [13]:
WFPS[%] = (volumetric water content[%]/total soil porosity[%]) × 100%
where volumetric water content = gravimetric water content × soil bulk density (1/(g H2O/mL H2O) × g H2O/g dry soil × g dry soil/mL soil), the total soil porosity = 1—(soil bulk density/soil particle density), and soil particle density was assumed to be 2.65 g cm−3.
Before incubation, 10 g (oven-dried mass) air-dried soil was placed in a glass jar (0.05 m diameter, ~30 mm soil layer thickness), and distilled water was then added to adjust the soil water content to 8%, 28%, or 48% (w/w). The soil layer depth was considered to be sufficient to account for the soil area affected by urea dissolution and diffusion processes. After that, 5 urea granules (5 mm diameter) were placed on the soil surface and incubated in a climate chamber (70% air humidity). For each treatment, a total of 24 glass jars were placed in the climate chamber, removing 4 replicate samples on each sampling date. A jar was taken out from climate chamber every hour for higher soil moisture levels and at intervals of 5–24 h for 4% and 8% w/w soil moisture. Residual urea granules were manually removed and dried at 60 °C to constant mass (about 4 h). The loss of urea mass was considered as the dissolution loss during the incubation. The dissolution of the 3 stabilized urea fertilizers was also tested at 20 °C and 28% or 48% (w/w) water content with incubation using the same method.

2.4. Urease Activity Assay

Four temperature levels (10, 20, 30, and 37 °C) and seven urea concentrations (0.006, 0.01, 0.03, 0.06, 0.1, 0.2, 0.3 mol urea, -N L−1) were set to study the effect of temperature and urea concentration on urease activity. About 5 g fresh soil (the exact weight was recorded) was placed into each plastic bottle (80 mL), and different kinds of 2.5 mL urea solution were then added into the bottles. The soil samples were incubated aerobically in dark conditions in the climate chamber for 2 h. The addition of 2.5 mL 0.1 mol L−1 urea solution to 5 g soil equals to surface application of 200 kg N ha−1 on the field. Each treatment level was replicated 4 times.
Urease activity was derived with the nonbuffered method [14] and determining the NH4+-N concentration of the incubated soil. Then, 50 mL 1 M KCl solution was added into each bottle to extract NH4+-N from the soil. The pH value of the KCl extraction solution was adjusted to 5 by adding HCl solution to avoid ammonia emission after the extraction. Total ammoniacal nitrogen concentration in the extraction solution was determined with an ammonia selective electrode (Thermo Orion 4 star, Thermo Scientific, Beverly, MA, USA).

2.5. Statistical Analysis

A simplified sigmoidal function was fitted to the granule dissolution curves on replicate values for 28% and 48% w/w soil moisture levels (Equation (2)). Urea dissolution showed a different behavior at 4% and 8% gravimetric soil moisture, and these data were not included in the analysis.
U d i s = 1 e b × t i
where Udis is the fraction of dissolved urea (dimensionless, in the range of 0–1), b is the rate constant (1/h), t the time (h), and i (dimensionless) the shape parameter of sigmoidality (sigmoidal shape for c > 1). The effect of soil moisture and temperature on model parameters b and i was modeled by means of multiple linear regression. Differences in dissolution fractions between urea fertilizer types at the end of incubation were tested with one-way ANOVA und Tukey’s post hoc test (p < 0.05).
The Michaelis–Menten model was used to fit the relationship between urea concentration and measured urease activity:
A = V m a x × C C + K m
where A is the measured urease activity (mg NH4+-N kg−1 dry soil h−1), Vmax is the Michaelis–Menten kinetic constant (mg NH4+-N kg−1 dry soil h−1) representing maximal urease activity, Km represents the urea concentration (mol N L−1) when urease activity reached half of Vmax, and C is the urea concentration (mol N L−1). The two parameters of Vmax and Km were fitted to the data to quantify the effect of substrate concentration (urea) on urease activity.
The Arrhenius equation was employed to fit the response of urease activity to temperature change:
A = B × e E a R × T
where B is a pre-exponential factor (Arrhenius constant) that indicates the frequency of correctly oriented collisions between the reacting compounds, Ea is the activation energy of soil urease, R is a universal gas constant, and T is the temperature (K). The two parameters of B and Ea were fitted to the data to quantify the effect of temperature on urease activity.
For each urea fertilizer, the relationship among urease activity, urea concentration, and temperature were modeled by combining Michaelis–Menten and Van’t Hoff equations:
A = V m a x × C C + K m × e a T
The variables and parameters are the same as those in Equation (3), and a (dimensionless) represents the Van’t Hoff kinetic constant quantifying the effect of temperature on the Arrhenius relationship. The three parameters of Vmax, Km, and a were fitted to the data.
A multiplicative model was employed to study the effect of different urea fertilizers on urea hydrolysis:
A = D 0 × D 1 x 1 × D 2 x 2 × D 3 x 3
where Di is a parameter that, if less than 1, means a negative effect of an increase in variable xi on urease activity; otherwise, it means a positive effect. Xi indicates explanatory variables such as temperature, urea fertilizer, and urea concentration in this study.
The temperature sensitivity of urease activity is also expressed as a Q10 value, that is, the factor by which urease activity increases by a 10 °C increase in temperature:
Q 10 = e E a R × 10 T × T + 10
Q 10 = e 10 × a
where Ea in Equation (7) is the activation energy of soil urease as in Equation (4), and a in Equation (8) is the Van’t Hoff kinetic constant as in Equation (5).
The statistical work and calculations above were performed on the R platform (ver. 4.1.0, R Project for Statistical Computing, Vienna, Austria) [15].

3. Results

3.1. Urea Granule Dissolution

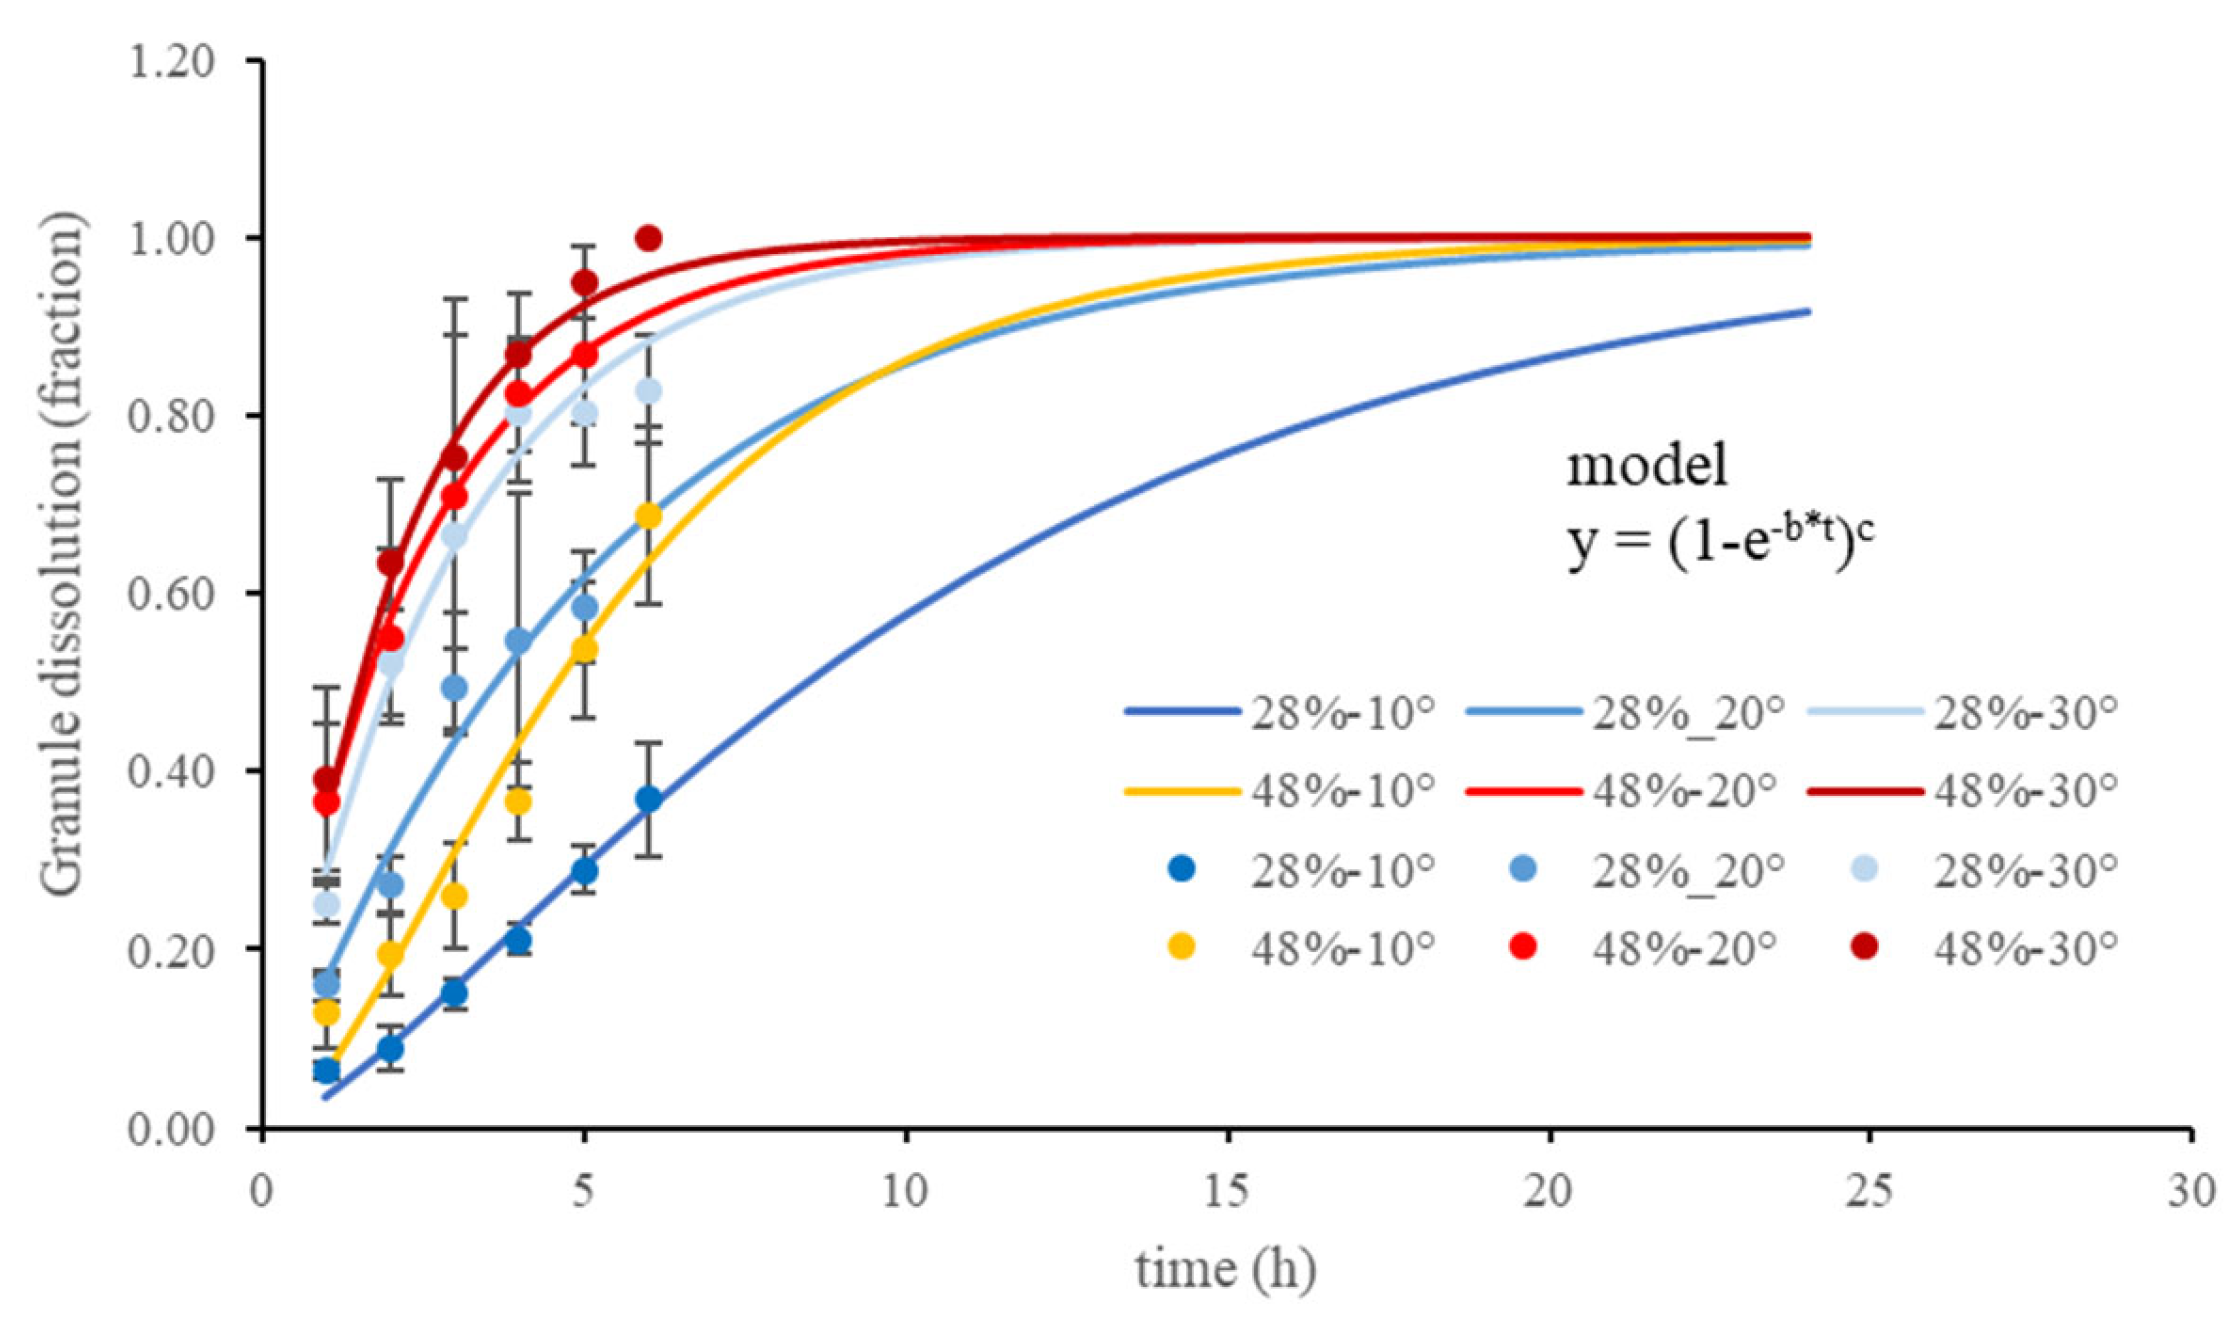
Urea dissolution strongly depended on soil moisture (Figure 1 and Figure 2). At 4% (w/w) soil water level, only a small fraction of the granules dissolved, even at 30 °C temperature. Humidity supply by air (70% humidity) was not sufficient to fully support this process. At soil moisture (w/w) of 8%, urea granule dissolution was still limited, with high rates at the beginning and a very slow increase to a level of 90% dissolution within 74 h of incubation. At the higher soil moisture levels, urea dissolution was mainly influenced by temperature with some effect of soil moisture (Figure 2).
Urea dissolution rates (Equation (2), parameter b) were increased by a factor of 2 (48% w/w moisture) −3 (28% w/w) between 10 and 30 °C. The increase in soil moisture from 28% (w/w) to 48% (w/w) yielded increases between factors 1.5 (30 °C) and 2 (10 °C) (Table 1). Modeling the effects of moisture and temperature on parameters b and i of the sigmoidal curve yielded an excellent fit for b (adj. R2 0.97), with positive influences of both temperature and soil moisture on b, while relationships for i were poor (adj R2 0.31) with a trend of higher sigmoidality at lower temperatures.
For the two higher soil moisture levels, granule dissolution was accomplished after about 12 h at temperatures of 20 and 30 °C. However, at lower soil moisture levels, urea granule dissolution was limited by soil moisture supply, which could not be compensated with the influence of air humidity or temperature.
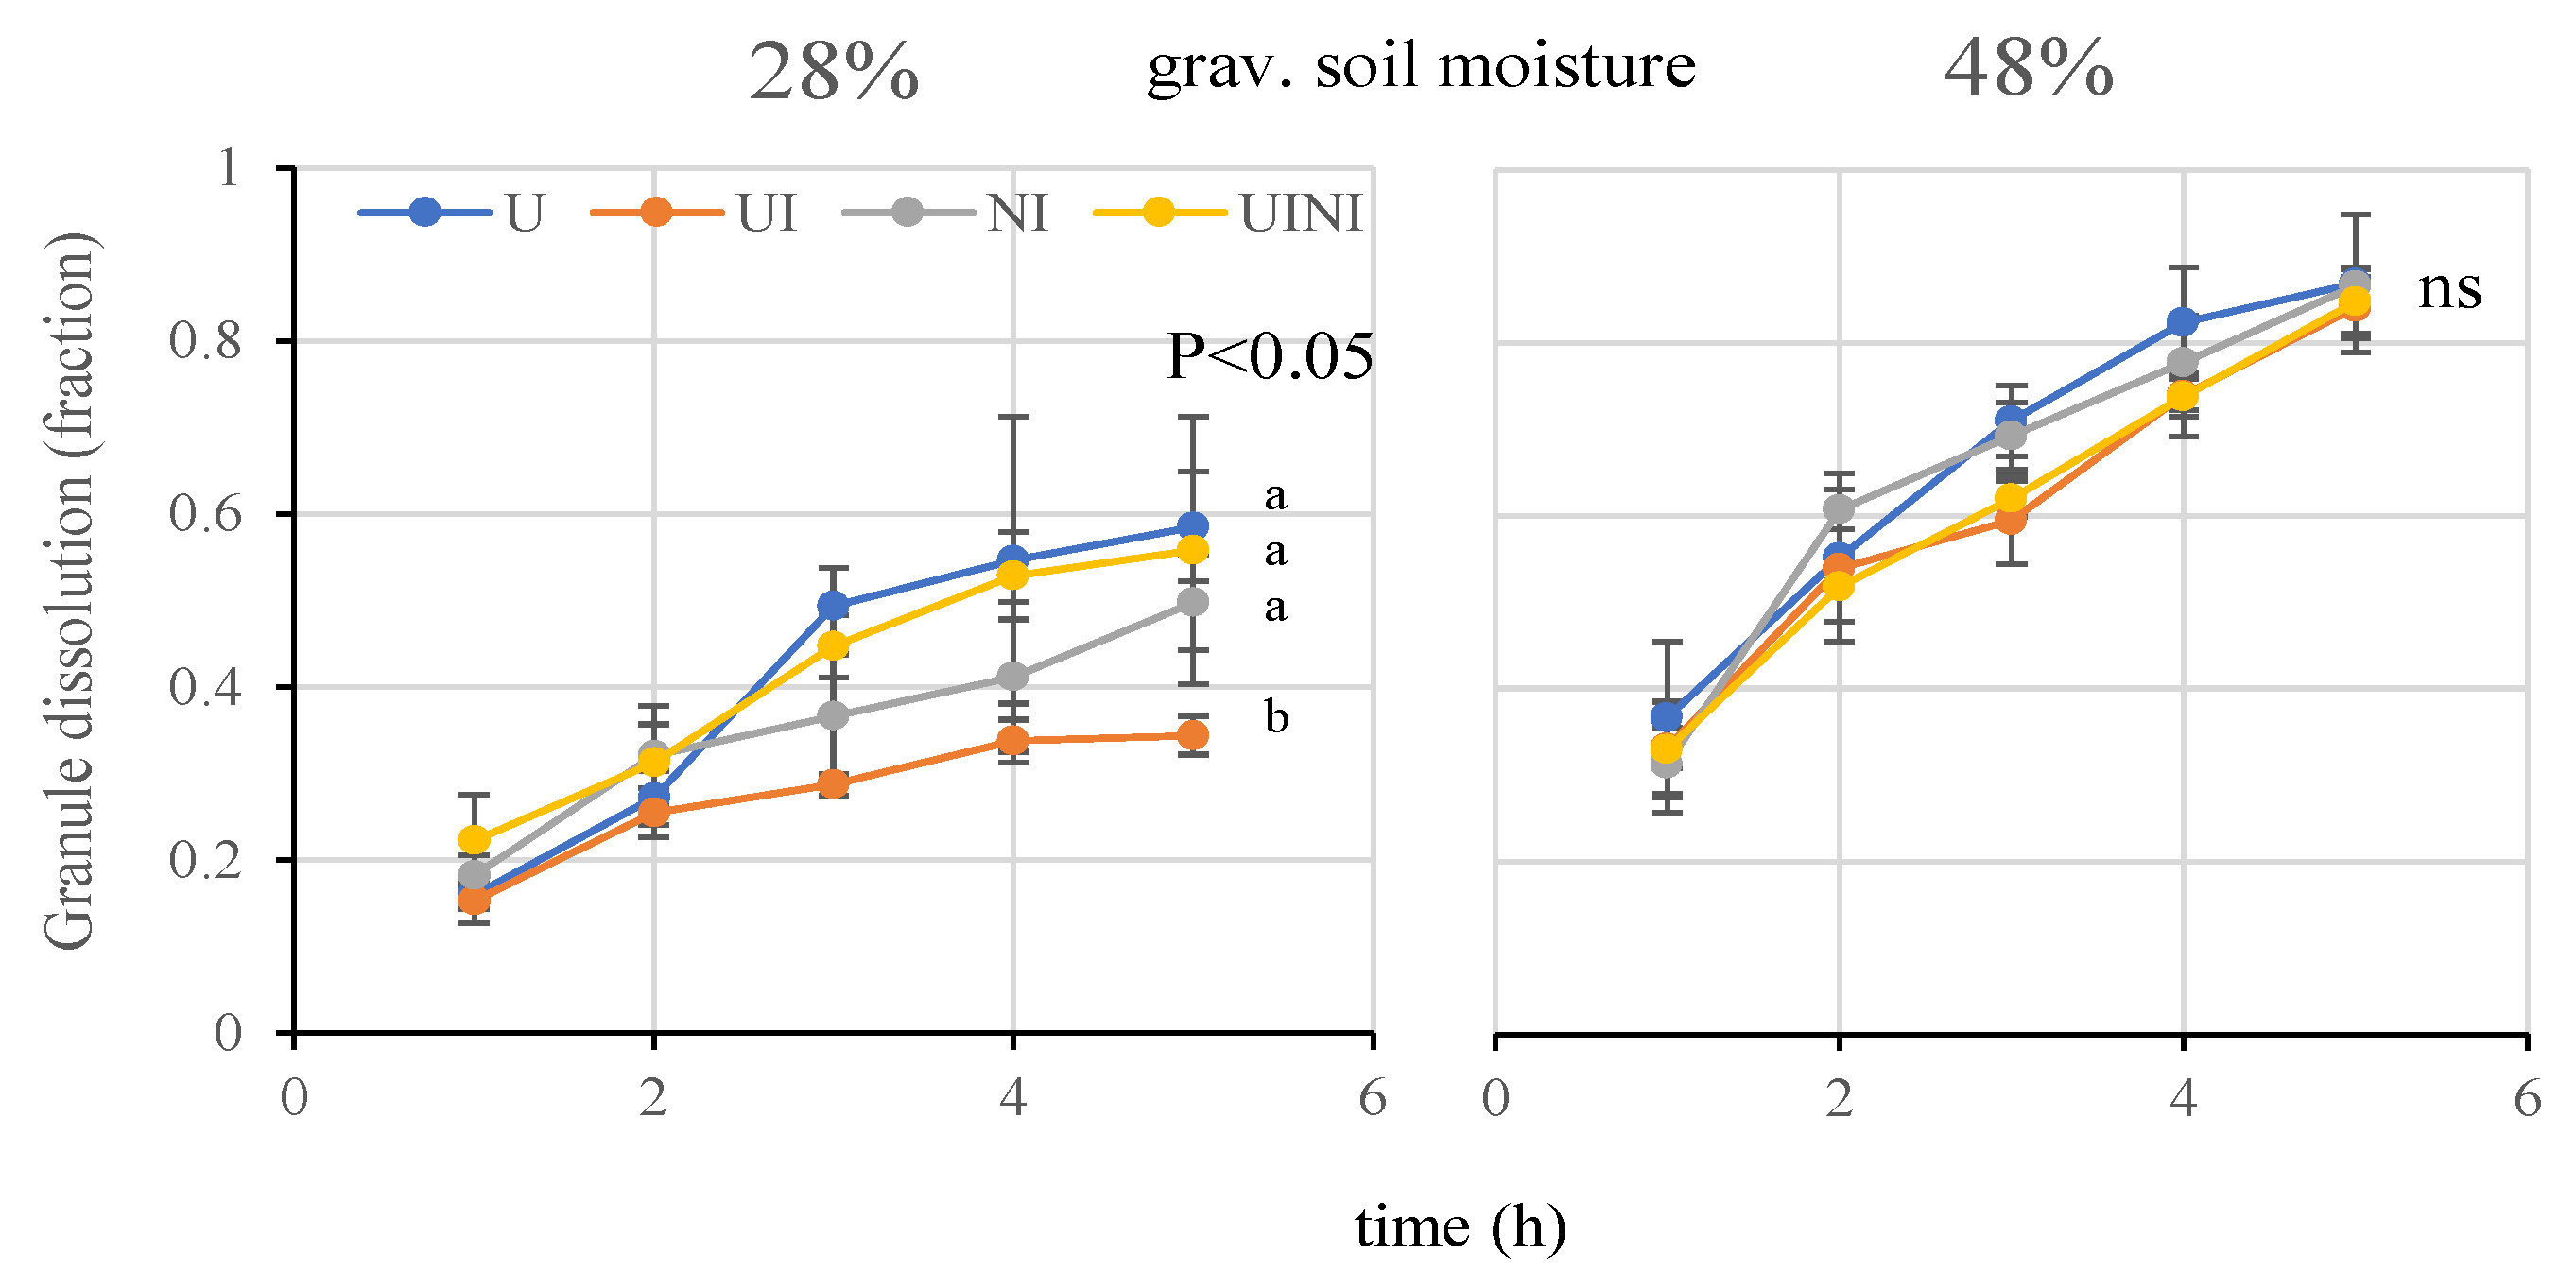
At the temperature of 20 °C and moisture level of 28% (w/w), water content urea showed a faster dissolution than that of fertilizers with inhibitors, particularly in U + UI (Figure 3). This effect was negligible at the very high soil water content of 48% (w/w).

3.2. Urease Activity

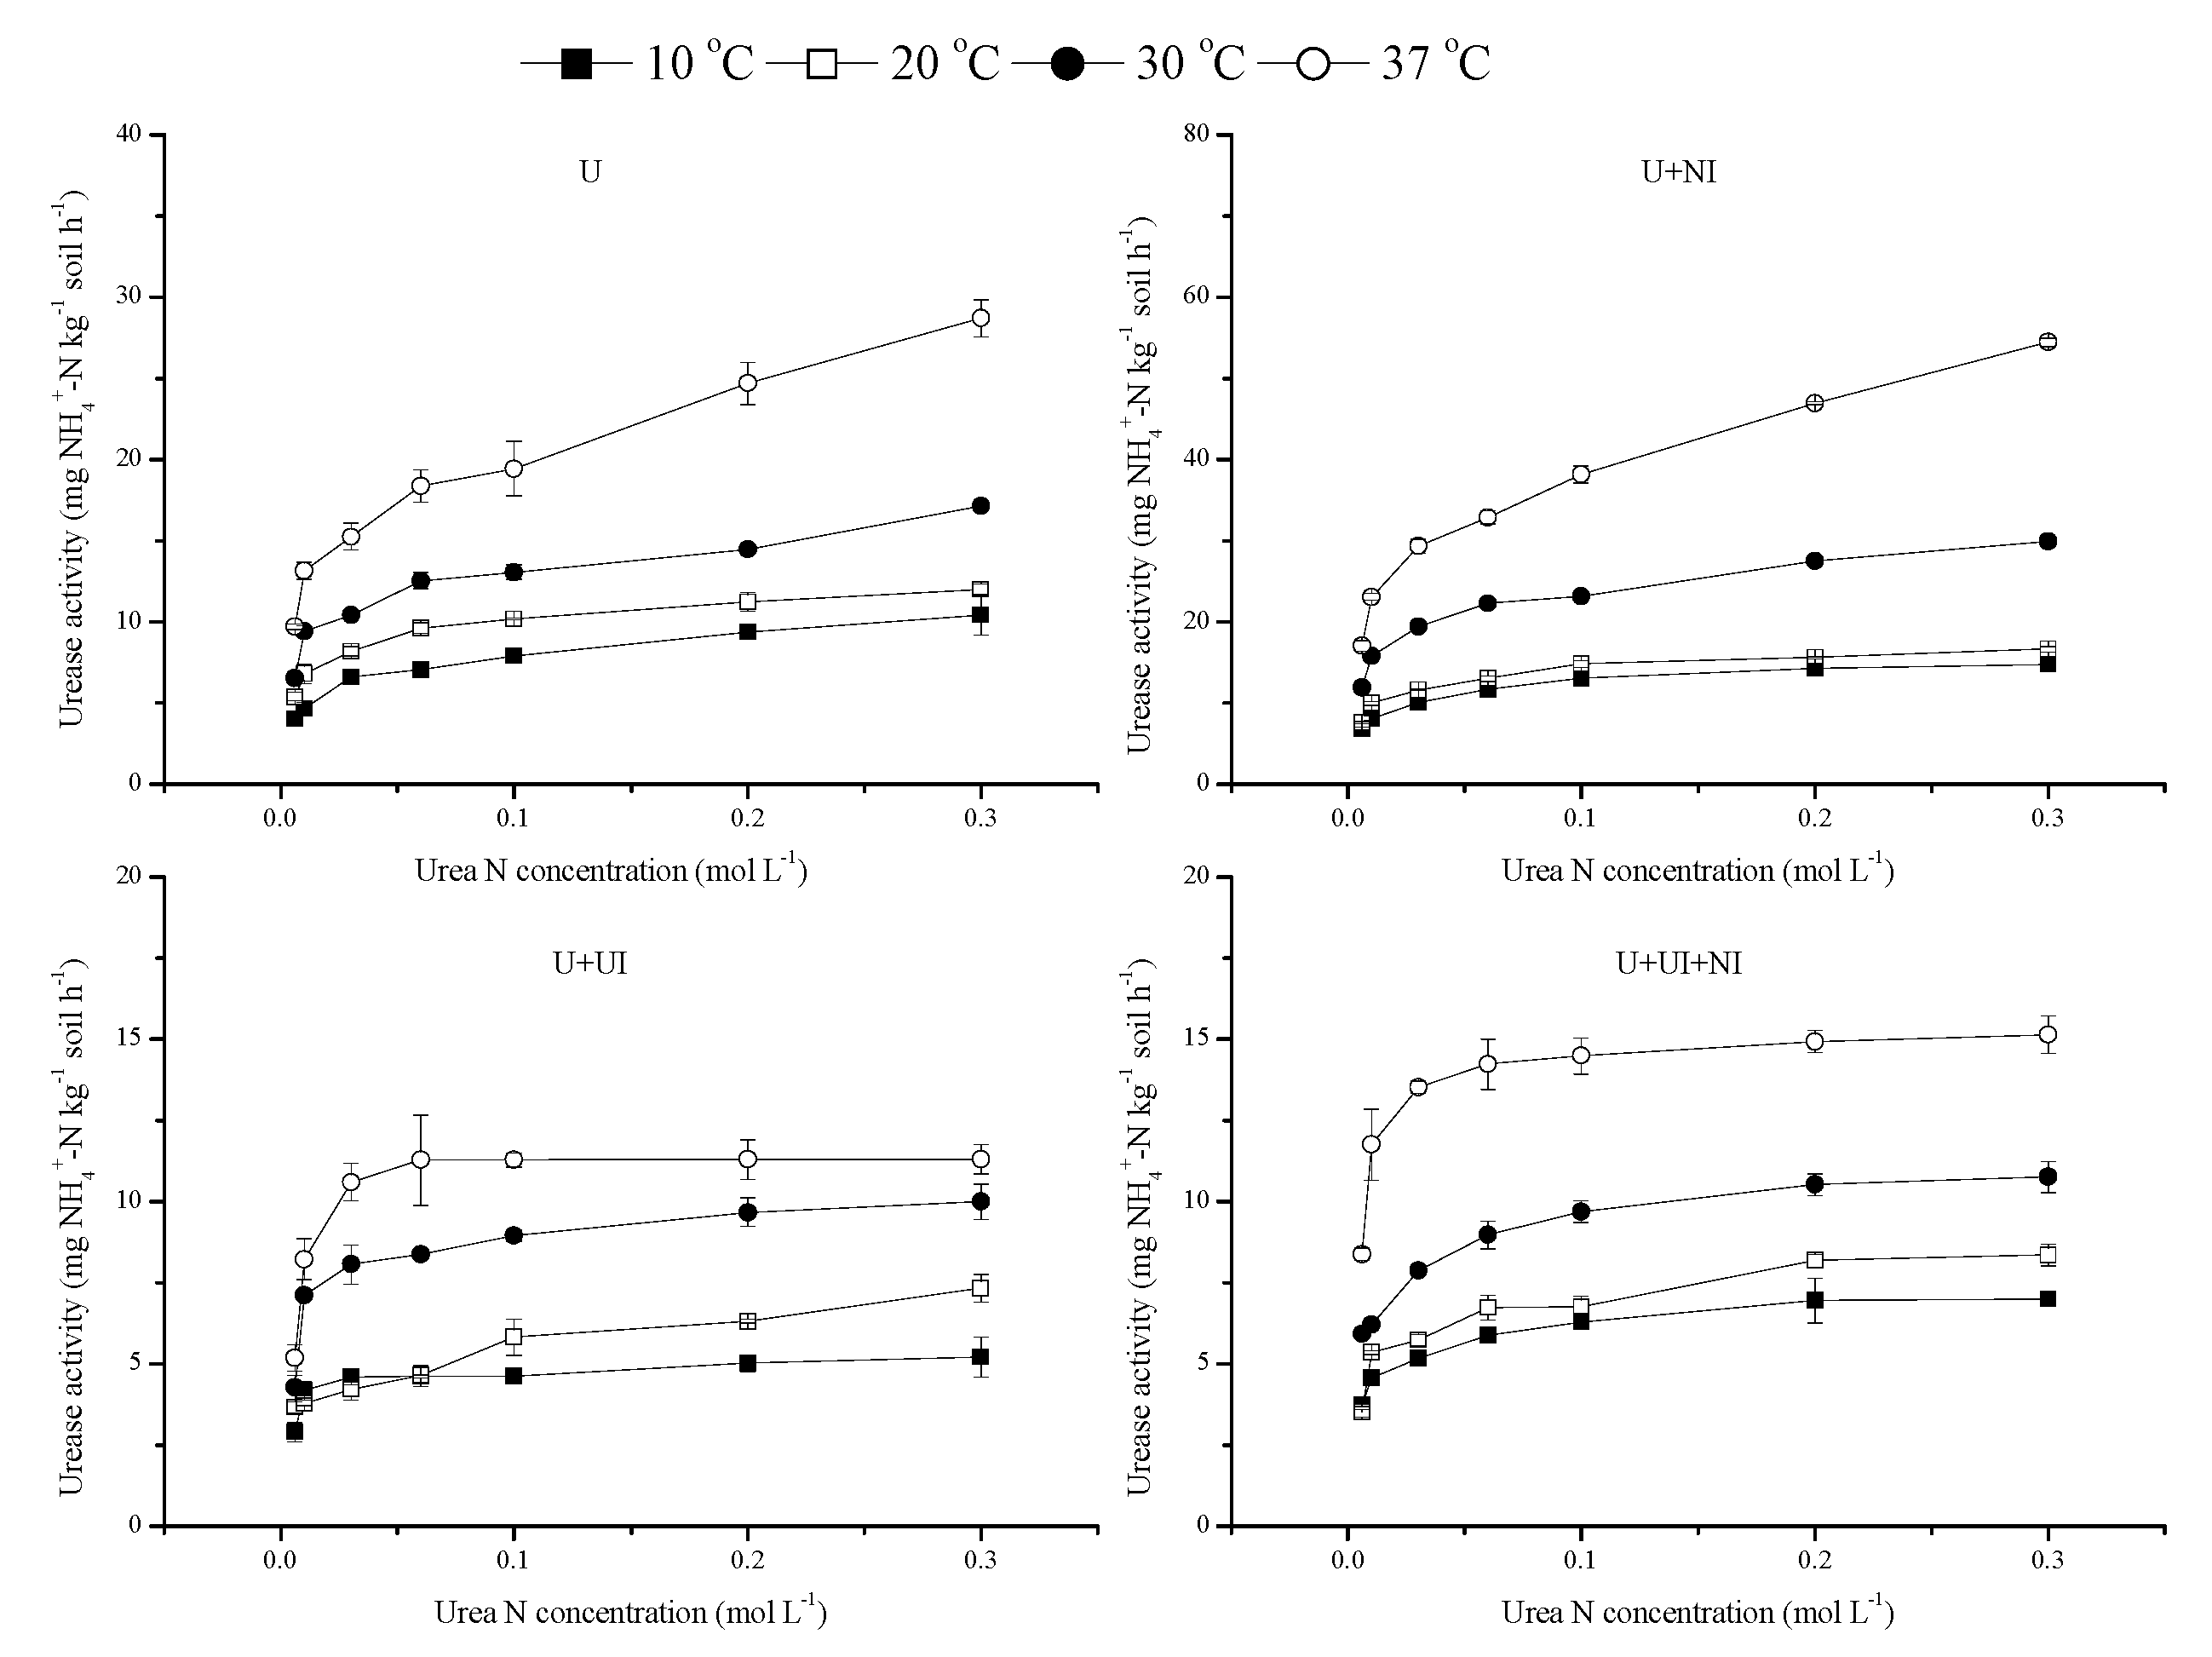
Urease activity varied between 2.9 and 54.4 mg NH4+-N kg−1 h−1 depending on urea concentration and incubation temperature (Figure 4). The Michaelis–Menten kinetic showed a good fit between urea concentration and urease activity (Table 2). Fitted Vmax and Km varied between 5.1 and 49.8 mg NH4+-N kg−1 h−1 and from 0.003 to 0.016 mol L−1, respectively. Generally, the urease inhibitor reduced Vmax, while the nitrification inhibitor increased it at a specific temperature.
The fitted Ea values via the Arrhenius equation varied from 15.18 to 34.97 kJ mol−1, with an average value of 24 kJ mol−1. ANOVA showed that there was a significant difference among urea types (p < 0.001, N = 28). Ea in UI and U + UI + NI was significantly lower than that in U and U + NI (Figure 5). The calculated Q10 (Equation (7)) for urease activity over the temperature range of 10–20 °C was 1.42, 1.54, 1.36, and 1.35 in U, U + NI, U + UI, and U + UI + NI, respectively. When the temperature range increased to 20–30 °C, Q10 decreased to 1.39, 1.49, 1.33, and 1.32 in U, U + NI, U + UI, and U + UI + NI, respectively.
The combination of Michaelis–Menten kinetics and the Van’t Hoff equation shows a close fit to the measured data (Table 3). Comparing with untreated urea (U), the urease inhibitor significantly decreased temperature sensitivity. Q10 values derived from Van’t Hoff kinetic constants (Equation (8)) were 1.48, 1.69, 1.36, and 1.42 in U, U + NI, U + UI, and U + UI + NI, respectively (Table 3), and showed the same trend as those fitted with Equation (7). The RMSE varied from 0.76 to 3.46 mg NH4+-N kg−1 h−1, lower than those from Arrhenius equation fitting.
The multiplicative model on the effect of factors on urease activity also shows a close fit to measured data (adj. R 2= 0.86, n = 112 jars, p < 0.001), and included all factors in a single equation. Parameter estimates show that the urease inhibitor treatment significantly reduced urease activity, since the estimate of D3 was smaller than 1, while the nitrification inhibitor showed a significant positive effect (D4, Table 4). There also existed a negative interaction effect (D5) between UI and NI on urease activity.

4. Discussion

4.1. Urea Granule Dissolution

Urea dissolution was strongly affected by low soil moisture levels that partly (8% w/w) or almost totally (4% w/w) hindered urea granule dissolution within 3 days of observation. This result agrees with investigations on a loblolly pine forest floor [7]. Granule diameter in the dissolution experiment was large (5 mm) compared to the average granule size indicated by the producer (3.5 mm, range 1.6–5.0 mm), so the total dissolutions observed in this study were probably slow compared to the average granule diameter. However, the partial dissolution of smaller granules probably also occurs at similar soil moisture levels. This effect also depends on the air humidity selected for the trials [7,16]. The humidity chosen for this trial was very similar to typical springtime and summer air levels under temperate climate conditions. In addition, the shallow soil layer used in this incubation may have limited the soil water supply for the dissolution process. Further investigation is required to determine the depth of the soil water catchment area of urea granule dissolution. Altogether, there probably exists a soil texture-dependent threshold value of soil moisture for complete urea granule dissolution within the observation period under otherwise constant environmental conditions, i.e., no precipitation and no large increase in air humidity. When the water supply was not limiting, granule dissolution depended to a stronger degree on incubation temperature. However, at higher soil water levels, soil moisture also influenced the dissolution rate, supporting our hypotheses on the effects of soil moisture und temperature on urea granule dissolution. Unexpectedly, urea treated with urease inhibitor dissolved more slowly than the common urea without inhibitor addition. This could have been due to the active ingredient, but more probably due to the active ingredient formulation stabilizing the inhibitor in the granule. Different surface finishers could also play a role.
All factors and ingredients slowing down granule dissolution influence urea hydrolysis and subsequently the ammonia emission process [4,5]. Slower release and hydrolysis may increase the range of urea diffusion and soil, and the efficacy of the soil pH buffer reaction, both potentially limiting soil pH increase by urea hydrolysis and its effect on ammonia emissions. In addition, a slower dissolution prolongs the time window for the further reduction of emissions by management activities or other environmental factors.

4.2. Urea Hydrolysis

There was a good fit of the Michaelis–Menten equation with the measured data (Table 2). U + UI had the smallest Vmax value in all treatments, which agreed with the finding by [11]. This could be attributed to the formation of an inhibitor–enzyme complex that blocked the active site of substrate [17]. The fitted Vmax was positively correlated with temperature, which is consistent with other studies [10,11].
In this study, UI showed a lower Km than that of U at 20 and 30 °C (Table 2). This is in contradiction to the result from [11], which reported that urease inhibitor NBPT significantly increased the Km value. This deviation may have been due to the different inhibitor types, soil properties between studies, or the temperature interaction effect. The lowest Km in U + UI indicated the insensitivity with the increase in urea concentration. This could be explained by the urease inhibitor being more competitive for active sites on enzymes than on urea [17]. Therefore, the saturation urea concentration of U + UI was lower than that of U (Figure 4). The ratio of Vmax to Km is considered to be the catalyst efficiency, which also depends on temperature. Compared with U, urease inhibitor addition reduced Vmax/Km at 20 and 30 °C (Table 2), which was also found in the similar study of [11] on black soil with high soil organic carbon content.
A positive relationship between urease activity and temperature was also reported in previous studies [18,19]. This study confirmed that urease activity generally increases with temperature (Figure 4). Arrhenius fitting provided the activation energy estimates of soil urease in each urea type (Figure 5). In our study, the Arrhenius equation-fitted Ea in the conventional urea treatment (U) was about 25 kJ mol−1, only about half of the 49.4 in Hapludolls and the 53.6 kJ mol−1 in Agriustolls measured by Moyo et al. (1989), but quite similar to the 23 kJ mol−1 reported by [11] on Mollisol soil in Northeast China. The variation in Ea among studies could be due to the different soil properties and assay methods, such as pH control, urea concentration, solution-to-soil ratio, and incubation duration [12]. Theoretically, the urease inhibitor would increase the energy barrier for urease activity, but the urease inhibitor (UI) reduced Ea in our study (Figure 5), which could have been due to soil properties such as SOC, total N and CEC [20], and urease inhibitor type. Considering the small difference in Ea among the four urea types (Figure 5), the intrinsic kinetic characteristics in inhibitors may have mainly been responsible for the effect of those on urease activity rather than thermodynamical causes.
Although the values in Table 3 show descriptive information that the urease inhibitor reduced urease activity, multiplicative regression (Table 4) provided better statistical information that demonstrated that the urease inhibitor showed a significantly (p < 0.001) negative effect on urease activity. A similar result was also reported by other studies [21,22]. The principal mechanism for this inhibitory effect is that the urease inhibitor could interact with enzymes and block their activity towards substrates [17]. However, we also found that the nitrification inhibitor showed a stimulatory effect on urease activity, which was contradictive with earlier findings with no effect of the nitrification inhibitor on urea hydrolysis [23,24]. In another study, even a reduction effect of another nitrification inhibitor (DCD) was found [25]. These deviations may be due to the longer incubation duration in the two cited studies compared to that in our investigation. However, there was also a similar result to our findings that the addition of a nitrification inhibitor (DCD) to urea resulted in the accumulation of ammonium [26]. Urease activity was also sensitive to pH changes, e.g., the authors in [9] reported that, when pH increased from 5.5 to 9.5, the urea hydrolysis rate also increased. Another incubation experiment showed that urea without a nitrification inhibitor could decrease the pH from 8.4 to 7.1 in one day [27], probably due to ammonia volatilization and nitrification after urea hydrolysis. Therefore, the positive effect of the nitrification inhibitor on urease activity could be due to the inhibitory effect of pH reduction during the process of nitrification. The positive effect of the nitrification inhibitor on urease activity implies higher urea hydrolysis potential, ammonium accumulation, and subsequent ammonia volatilization. The effect of urea fertilizer type on urease activity indicated that type-specific parameters should be employed to simulate nitrogen dynamics after urea had been applied to soil. While our hypotheses on the reducing effect of the UI across urea concentrations and temperatures are supported by the data, our hypothesis of a nonexistent effect of NI on urea hydrolysis was rejected by the findings.

5. Conclusions

In this study, the effects of soil moisture and temperature on urea granule dissolution and urea hydrolysis affected by urease and a nitrification inhibitor were investigated in a batch incubation experiment. At lower soil moisture levels (4–8% w/w soil water content), no total granule dissolution occurred in the observation period (74 h). Apart from the lowest soil moisture level, urea dissolution was also strongly influenced by temperature, and total dissolution was accomplished between 12 and 24 h after application. Further research is required to test the moisture effects related to different soil textures and soil depths. The relationship between urease activity and urea addition rate could be well-described by Michaelis–Menten kinetics. The urease inhibitor significantly reduced the value of the maximal hydrolysis rate Vmax. In addition, the lower temperature sensitivity of urease activity after the application of the urease-inhibitor-treated urea is a further advantage of the use of urease inhibitor in agricultural practice. However, care should be taken with the application of nitrification-inhibitor-treated urea because of the inhibitor’s positive effect on urease activity that may, in addition to the prolongation of the lifetime of ammonium in soil, increase the potential of ammonia emission. Parameter estimates in this study are meaningful to and helpful in the future model simulation of nitrogen dynamics in soil, and may facilitate better urea fertilizer management and the projection of urea behavior in trial work.

Supplementary Materials

The following supporting information can be downloaded at: https://www.mdpi.com/article/10.3390/agriculture12122037/s1, File S1: Ni Pacholski urea_dissolution urease_activity.

Author Contributions

Conceptualization, K.N. and A.S.P.; methodology, K.N. and A.S.P.; software, K.N.; formal analysis, K.N. and A.S.P.; investigation, K.N.; data curation, K.N. and A.S.P.; writing—original draft preparation, K.N. and A.S.P.; writing—review and editing, K.N. and A.S.P.; visualization, K.N. and A.S.P.; supervision, A.S.P. All authors have read and agreed to the published version of the manuscript.

Funding

This research received no external funding.

Institutional Review Board Statement

Not applicable.

Informed Consent Statement

Not applicable.

Data Availability Statement

The data presented in this study are available in Supplementary Materials.

Acknowledgments

The support of Gunda Schnack in taking and preparing the soil samples is gratefully acknowledged. We are particularly grateful to Sasha Hafner for revising the use of the English language.

Conflicts of Interest

The authors declare no conflict of interest.

References

  1. Di, H.J.; Cameron, K.C. Nitrate Leaching Losses and Pasture Yields as Affected by Different Rates of Animal Urine Nitrogen Returns and Application of a Nitrification Inhibitor—A Lysimeter Study. Nutr. Cycl. Agroecosystems 2007, 79, 281–290. [Google Scholar] [CrossRef]
  2. Rawluk, C.D.L.; Grant, C.A.; Racz, G.J. Ammonia Volatilization from Soils Fertilized with Urea and Varying Rates of Urease Inhibitor NBPT. Can. J. Soil Sci. 2001, 81, 239–246. [Google Scholar] [CrossRef]
  3. Sanz-Cobena, A.; Misselbrook, T.; Camp, V.; Vallejo, A. Effect of Water Addition and the Urease Inhibitor NBPT on the Abatement of Ammonia Emission from Surface Applied Urea. Atmos. Environ. 2011, 45, 1517–1524. [Google Scholar] [CrossRef] [Green Version]
  4. Li, T.; Zhang, W.; Yin, J.; Chadwick, D.; Norse, D.; Lu, Y.; Liu, X.; Chen, X.; Zhang, F.; Powlson, D.; et al. Enhanced-Efficiency Fertilizers Are Not a Panacea for Resolving the Nitrogen Problem. Glob. Chang. Biol. 2018, 24, e511–e521. [Google Scholar] [CrossRef]
  5. Rachhpal-Singh; Nye, P.H. A Model of Ammonia Volatilization from Applied Urea. I. Development of the Model. J. Soil Sci. 1986, 37, 9–20. [Google Scholar] [CrossRef]
  6. Le Cadre, E.; Génermont, S.; Azam, F.; Recous, S. The SAHGA Model to Calculate the Spatial Ammoniacal Heterogeneity at the Soil Surface after Fertiliser Granule Application. Biol. Fertil. Soils 2004, 40, 178–180. [Google Scholar] [CrossRef]
  7. Cabrera, M.L.; Kissel, D.E.; Bock, B.R. Urea Hydrolysis in Soil: Effects of Urea Concentration and Soil pH. Soil Biol. Biochem. 1991, 23, 1121–1124. [Google Scholar] [CrossRef]
  8. Ransom, C.J.; Jolley, V.D.; Blair, T.A.; Sutton, L.E.; Hopkins, B.G. Nitrogen Release Rates from Slow- and Controlled-Release Fertilizers Influenced by Placement and Temperature. PLoS ONE 2020, 15, e0234544. [Google Scholar] [CrossRef] [PubMed]
  9. Cabrera, M.L.; Kissel, D.E.; Craig, J.R.; Qafoku, N.P.; Vaio, N.; Rema, J.A.; Morris, L.A. Relative Humidity Controls Ammonia Loss from Urea Applied to Loblolly Pine. Soil Sci. Soc. Am. J. 2010, 74, 543–549. [Google Scholar] [CrossRef]
  10. Cartes, P.; Jara, A.A.; Demanet, R.; Mora, M. de la L. Urease Activity and Nitrogen Mineralization Kinetics as Affected by Temperature and Urea Input Rate in Southern Chilean Andisols. Rev. Cienc. Suelo Nutr. Veg. 2009, 9, 69–82. [Google Scholar] [CrossRef]
  11. Juan, Y.H.; Chen, Z.H.; Chen, L.J.; Wu, Z.J.; Wang, R.; Sun, W.T.; Zhang, Y.L. Kinetic and Thermodynamic Behaviors of Soil Urease as Affected by Urease Inhibitors. J. Soil Sci. Plant Nutr. 2010, 10, 1–11. [Google Scholar] [CrossRef]
  12. Moyo, C.C.; Kissel, D.E.; Cabrera, M.L. Temperature Effects on Soil Urease Activity. Soil Biol. Biochem. 1989, 21, 935–938. [Google Scholar] [CrossRef]
  13. Linn, D.M.; Doran, J.W. Effect of Water-Filled Pore Space on Carbon Dioxide and Nitrous Oxide Production in Tilled and Nontilled Soils. Soil Sci. Soc. Am. J. 1984, 48, 1267–1272. [Google Scholar] [CrossRef] [Green Version]
  14. Kandeler, E.; Gerber, H. Short-Term Assay of Soil Urease Activity Using Colorimetric Determination of Ammonium. Biol. Fertil. Soils 1988, 6, 68–72. [Google Scholar] [CrossRef]
  15. R Core Team, R. A Language and Environment for Statistical Computing; R Foundation for Statistical Computing: Vienna, Austria, 2021. [Google Scholar]
  16. Kissel, D.E.; Cabrera, M.L.; Craig, J.; Ariyama, J.; Vaio, N.; Rema, J. Predicting Urea Hydrolysis in a Loblolly Pine Forest Floor. Soil Sci. Soc. Am. J. 2014, 78, 2071–2077. [Google Scholar] [CrossRef]
  17. Amtul, Z.; Atta-ur-Rahman; Siddiqui, R.A.; Choudhary, M.I. Chemistry and Mechanism of Urease Inhibition. Curr. Med. Chem. 2002, 9, 1323–1348. [Google Scholar] [CrossRef]
  18. Longo, R.M.; de Melo, W.J. Urea Hydrolysis in Oxisols: Effects of Substrate Concentration, Temperature, pH, Incubation Time and Storage Conditions. Rev. Bras. Cienc. Solo 2005, 29, 651–657. [Google Scholar] [CrossRef]
  19. Xu, J.G.; Heeraman, D.A.; Wang, Y. Fertilizer and Temperature Effects on Urea Hydrolysis in Undisturbed Soil. Biol. Fertil. Soils 1993, 16, 63–65. [Google Scholar] [CrossRef]
  20. Tomar, J.S.; Mackenzie, A.F. Effects of Catechol and P-Benzoquinone on the Hydrolysis of Urea and Energy Barriers of Urease Activity in Soils. Can. J. Soil Sci. 1984, 64, 51–60. [Google Scholar] [CrossRef]
  21. Sanz-Cobena, A.; Misselbrook, T.H.; Arce, A.; Mingot, J.I.; Diez, J.A.; Vallejo, A. An Inhibitor of Urease Activity Effectively Reduces Ammonia Emissions from Soil Treated with Urea under Mediterranean Conditions. Agric. Ecosyst. Environ. 2008, 126, 243–249. [Google Scholar] [CrossRef]
  22. Wang, Z.P.; Van Cleemput, O.; Demeyer, P.; Baert, L. Effect of Urease Inhibitors on Urea Hydrolysis and Ammonia Volatilization. Biol. Fertil. Soils 1991, 11, 43–47. [Google Scholar] [CrossRef]
  23. Guthrie, T.F.; Bomke, A.A. Effects of Low Temperature and Nitrification Inhibitors on Urea Hydrolysis. Can. J. Soil Sci. 1981, 61, 529–532. [Google Scholar] [CrossRef]
  24. Yadvinder-Singh; Beauchamp, E.G. Nitrogen Transformations near Urea in Soil: Effects of Nitrification Inhibition, Nitrifier Activity and Liming. Fertil. Res. 1988, 18, 201–212. [Google Scholar] [CrossRef]
  25. Patra, D.D.; Kiran, U.; Chand, S.; Anwar, M. Use of Urea Coated with Natural Products to Inhibit Urea Hydrolysis and Nitrification in Soil. Biol. Fertil. Soils 2009, 45, 617–621. [Google Scholar] [CrossRef]
  26. Venkatesan, S.; Sudhahar, V.; Senthurpandian, V.K.; Murugesan, S. Urea Hydrolysis of Tea Soils as Influenced by Incubation Period, Soil PH, and Nitrification Inhibitor. Commun. Soil Sci. Plant Anal. 2007, 38, 2295–2307. [Google Scholar] [CrossRef]
  27. Ni, K.; Kage, H.; Pacholski, A. Effects of Novel Nitrification and Urease Inhibitors (DCD/TZ and 2-NPT) on N2O Emissions from Surface Applied Urea: An Incubation Study. Atmos. Environ. 2018, 175, 75–82. [Google Scholar] [CrossRef]
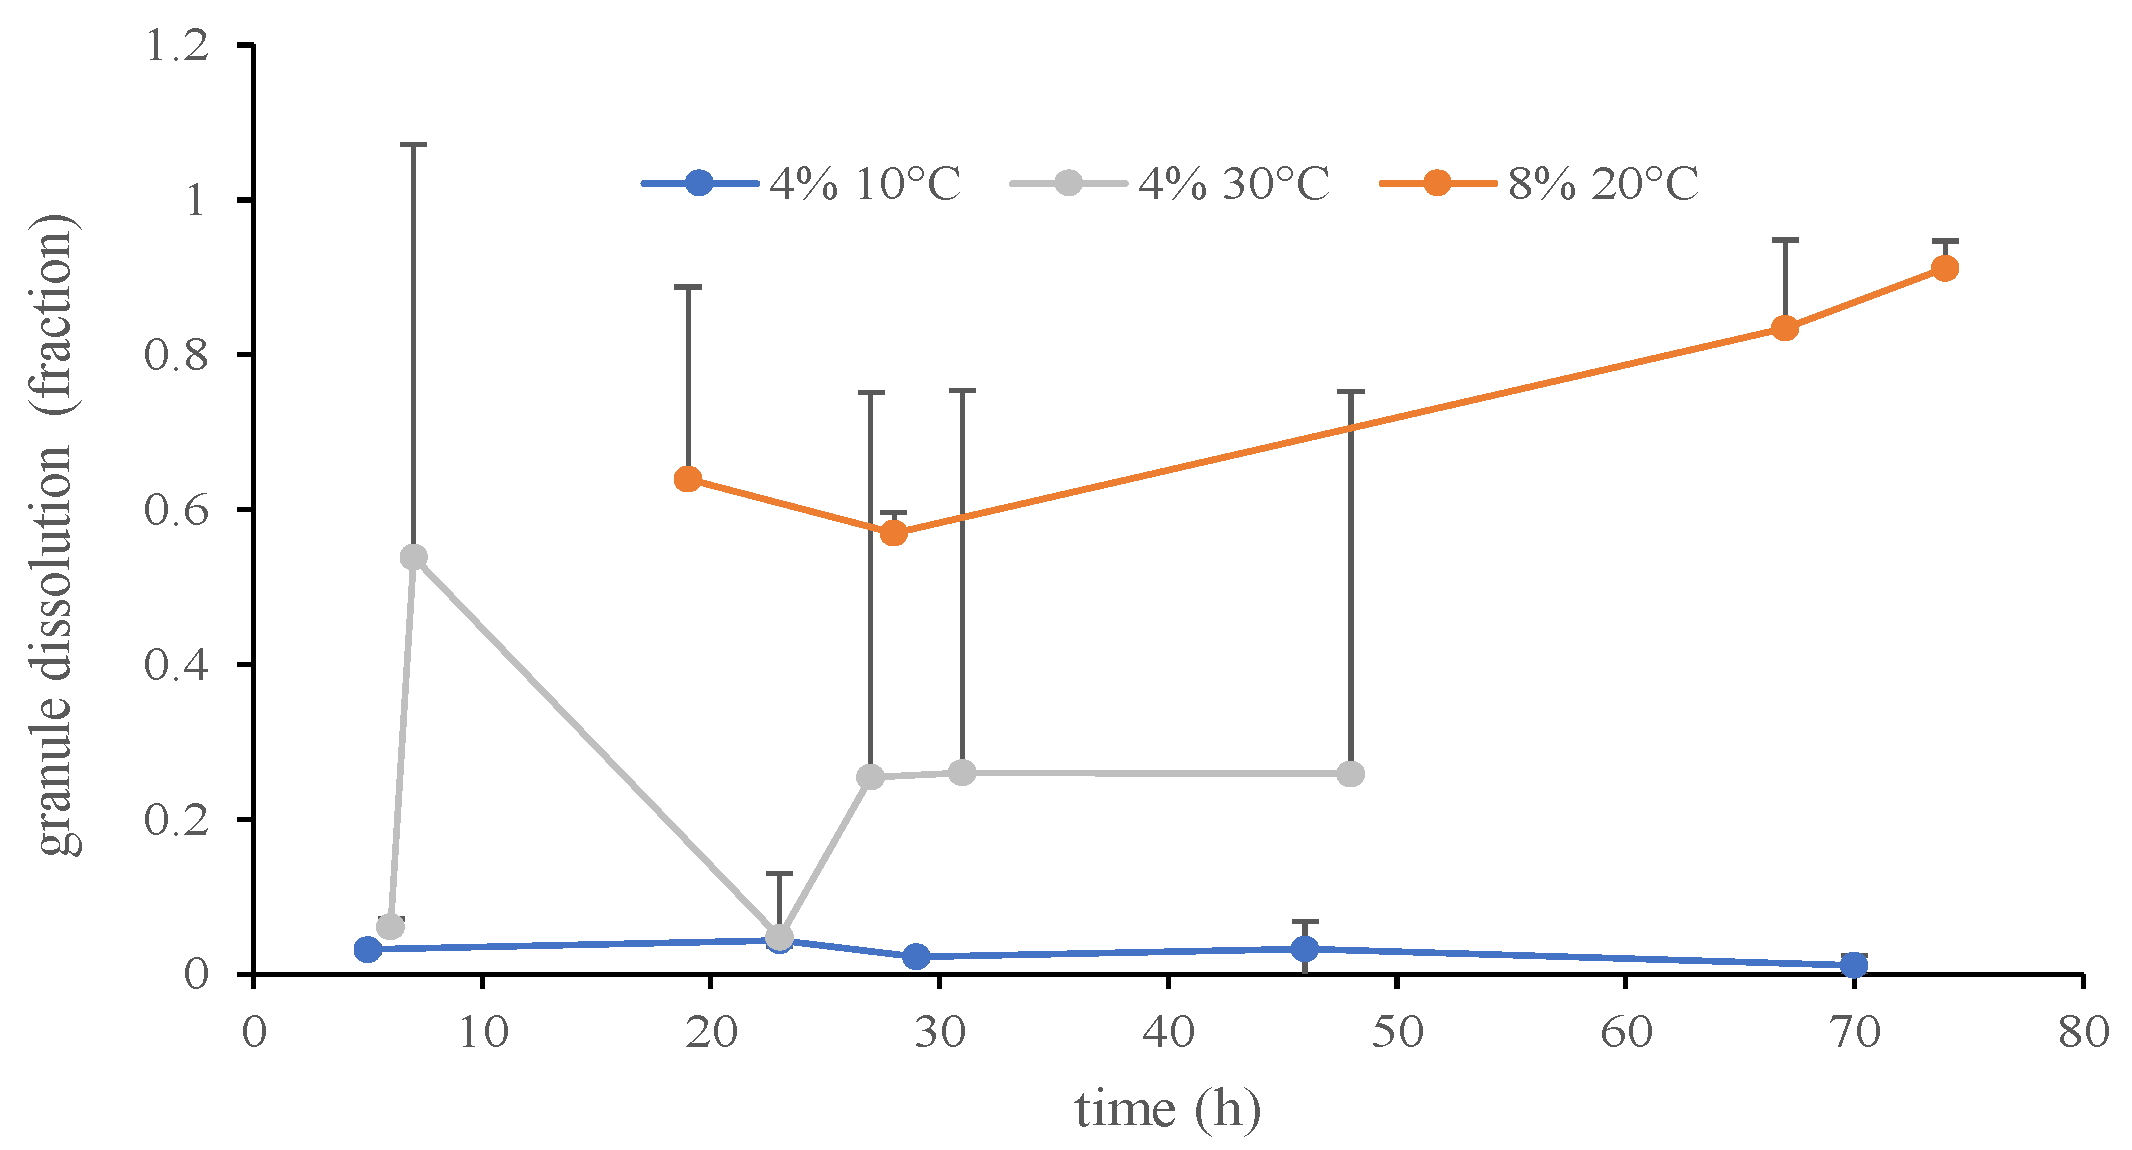
Figure 1. Urea granule dissolution rates at gravimetric soil moisture levels of 4% and 8%, and 3 temperature levels in a soil-filled Petri dish incubated in a climate chamber (70% air humidity). Error bars indicate standard deviation (n = 4).
Agriculture 12 02037 g001
Figure 2. Urea granule dissolution rates and sigmoidal model fits at gravimetric soil moisture levels of 24% and 48%, and 3 temperature levels in a soil-filled Petri dish incubated in a climate chamber (70% air humidity). Parameters are given in Table 1, error bars indicate standard deviation (n = 4).
Agriculture 12 02037 g002
Figure 3. Urea granule dissolution rates of 4 urea-based fertilizers at gravimetric soil moisture levels of 24% and 48%, and 20 °C temperature in a soil-filled Petri dish incubated in a climate chamber (70% air humidity). Test of final dissolution level with one-way ANOVA and Tukey’s post hoc test (p < 0.05). Error bars represent standard deviation (n = 4).
Agriculture 12 02037 g003
Figure 4. Effect of temperature and urea concentration on the urease activity. Bars represent the standard error (n = 4). U, U + NI, U + UI, and U + UI + NI represent the four urea types: conventional urea, nitrification inhibitor treated urea, urease inhibitor treated urea, and urease/nitrification inhibitor treated urea, respectively, in the incubation. Error bars indicate standard error (n = 4).
Agriculture 12 02037 g004
Figure 5. Effect of urea type on activation energy (Ea) fitted with the Arrhenius equation. Error bars represent the standard error (n = 4). Different letters denote statistical significance (p < 0.05).
Agriculture 12 02037 g005
Table 1. Effect of temperature on urea granule dissolution by nonlinear regression (Equation (2)) on simplified sigmoidal function (Tmax = ln(b/i)).
Grav. Water Content
(%)
Temperature
(°C)
b
(1/h)
i
(Dimensionless)
Tmax
(h)
Adj. R2p
28100.121.552.560.92<0.001
200.201.051.650.79<0.001
300.361.051.060.78<0.001
48100.261.892.000.87<0.001
200.390.920.850.87<0.001
300.551.120.710.84<0.001
Table 2. Effect of temperature and urea type on Michaelis–Menten kinetic parameters (Equation (3)).
TreatmentTemperature (°C)Vmax
(mg N kg−1 h−1)
Km
(mol L−1)
Vmax/KmAdj. R2
U109.60 **0.0114 **8440.88
2011.40 **0.0077 **14790.93
3015.30 **0.0086 **17720.84
3725.61 **0.0137 **18660.80
U + NI1014.30 **0.0083 **17330.93
2015.86 **0.0071 **22280.92
3027.72 **0.0092 **30280.89
3749.83 **0.0167 **29890.85
U + UI105.06 **0.0034 **14680.85
206.33 **0.0071 **8940.57
309.78 **0.0059 **16620.90
3710.94 **0.0044 **25020.73
U + UI + NI107.92 **0.0071 **11170.85
206.77 **0.0055 **12380.91
3010.11 **0.0055 **18480.89
3715.42 **0.0040 **38720.93
** represent statistical significance at p < 0.01.
Table 3. Regression with the combination of Michaelis–Menten and Van’t Hoff equation (Equation (5)).
FertilizerEstimatesAdj. R2RMSE
(mg N kg−1 h−1)
rRMSE
Vmax
(mg N kg−1 h−1)
Km
(mol N L−1)
a
U5.54 **0.0109 **0.0391 **0.8871.910.15
U + NI6.63 **0.0125 **0.0522 **0.9133.460.19
U + UI3.65 **0.005 **0.0304 **0.9050.760.13
U + UI + NI3.95 **0.0047 **0.0353 **0.8321.390.19
** statistically significant at p < 0.01.
Table 4. Parameter estimates by multiplicative regression (Equation (6)).
ParameterVariableEstimatep
D0Intercept3.82 **<0.001
D1Temperature1.03 **<0.001
D2Urea concentration7.87 **<0.001
D3UI0.60 **<0.001
D4NI1.65 **<0.001
D5UI* NI0.75 **<0.001
Adj. R2 = 0.86 RMSE = 3.22rRMSE = 0.22
* indicates interaction term, ** statistically significant at p < 0.01.
Publisher’s Note: MDPI stays neutral with regard to jurisdictional claims in published maps and institutional affiliations.