
Acidification Effects on In Situ Ammonia Emissions and Cereal Yields Depending on Slurry Type and Application Method


 and
and 
Abstract
:1. Introduction
- Ammonia loss reduction effects of the commercial system are similar to experimental systems;
- Effectiveness of a fixed acid dose on slurry pH and ammonia emission reductions varies among slurry types;
- Ammonia loss reduction significantly translates in higher yields and N use efficiency;
- Combining slurry acidification with slurry incorporation systems for NH3 emission reduction yield stronger NH3 loss reductions and thereby more pronounced yield effects.
2. Materials and Methods
2.1. Experimental Sites
2.2. Experimental Set-Up
2.2.1. Slurry Types
2.2.2. Slurry Fertilization and Application Methods
- (1)
- Trail hose application followed by incorporation within 4 h by power harrow (inc), before sowing;
- (2)
- Trail hose application of acidified CS, followed by incorporation within 4 h by power harrow (inc ac) before sowing;
- (3)
- Shallow closed slot injection (inj) before sowing;
- (4)
- Trail hose application (th) at EC 22;
- (5)
- Trail hose application + acidification (ac) at EC 22.
2.2.3. Ammonia Emissions
2.3. Meteorological Measurements
2.4. Yield and Nitrogen Use Efficiency
- NF = sum of N uptake by grain and stem (kg N ha−1) of fertilized treatment;
- Ncontrol = sum of N uptake by grain and stem (kg N ha−1) of unfertilized control;
- Nfert = N applied by fertilizer (kg N ha−1).
2.5. Statistics
3. Results
3.1. NH3 Emissions
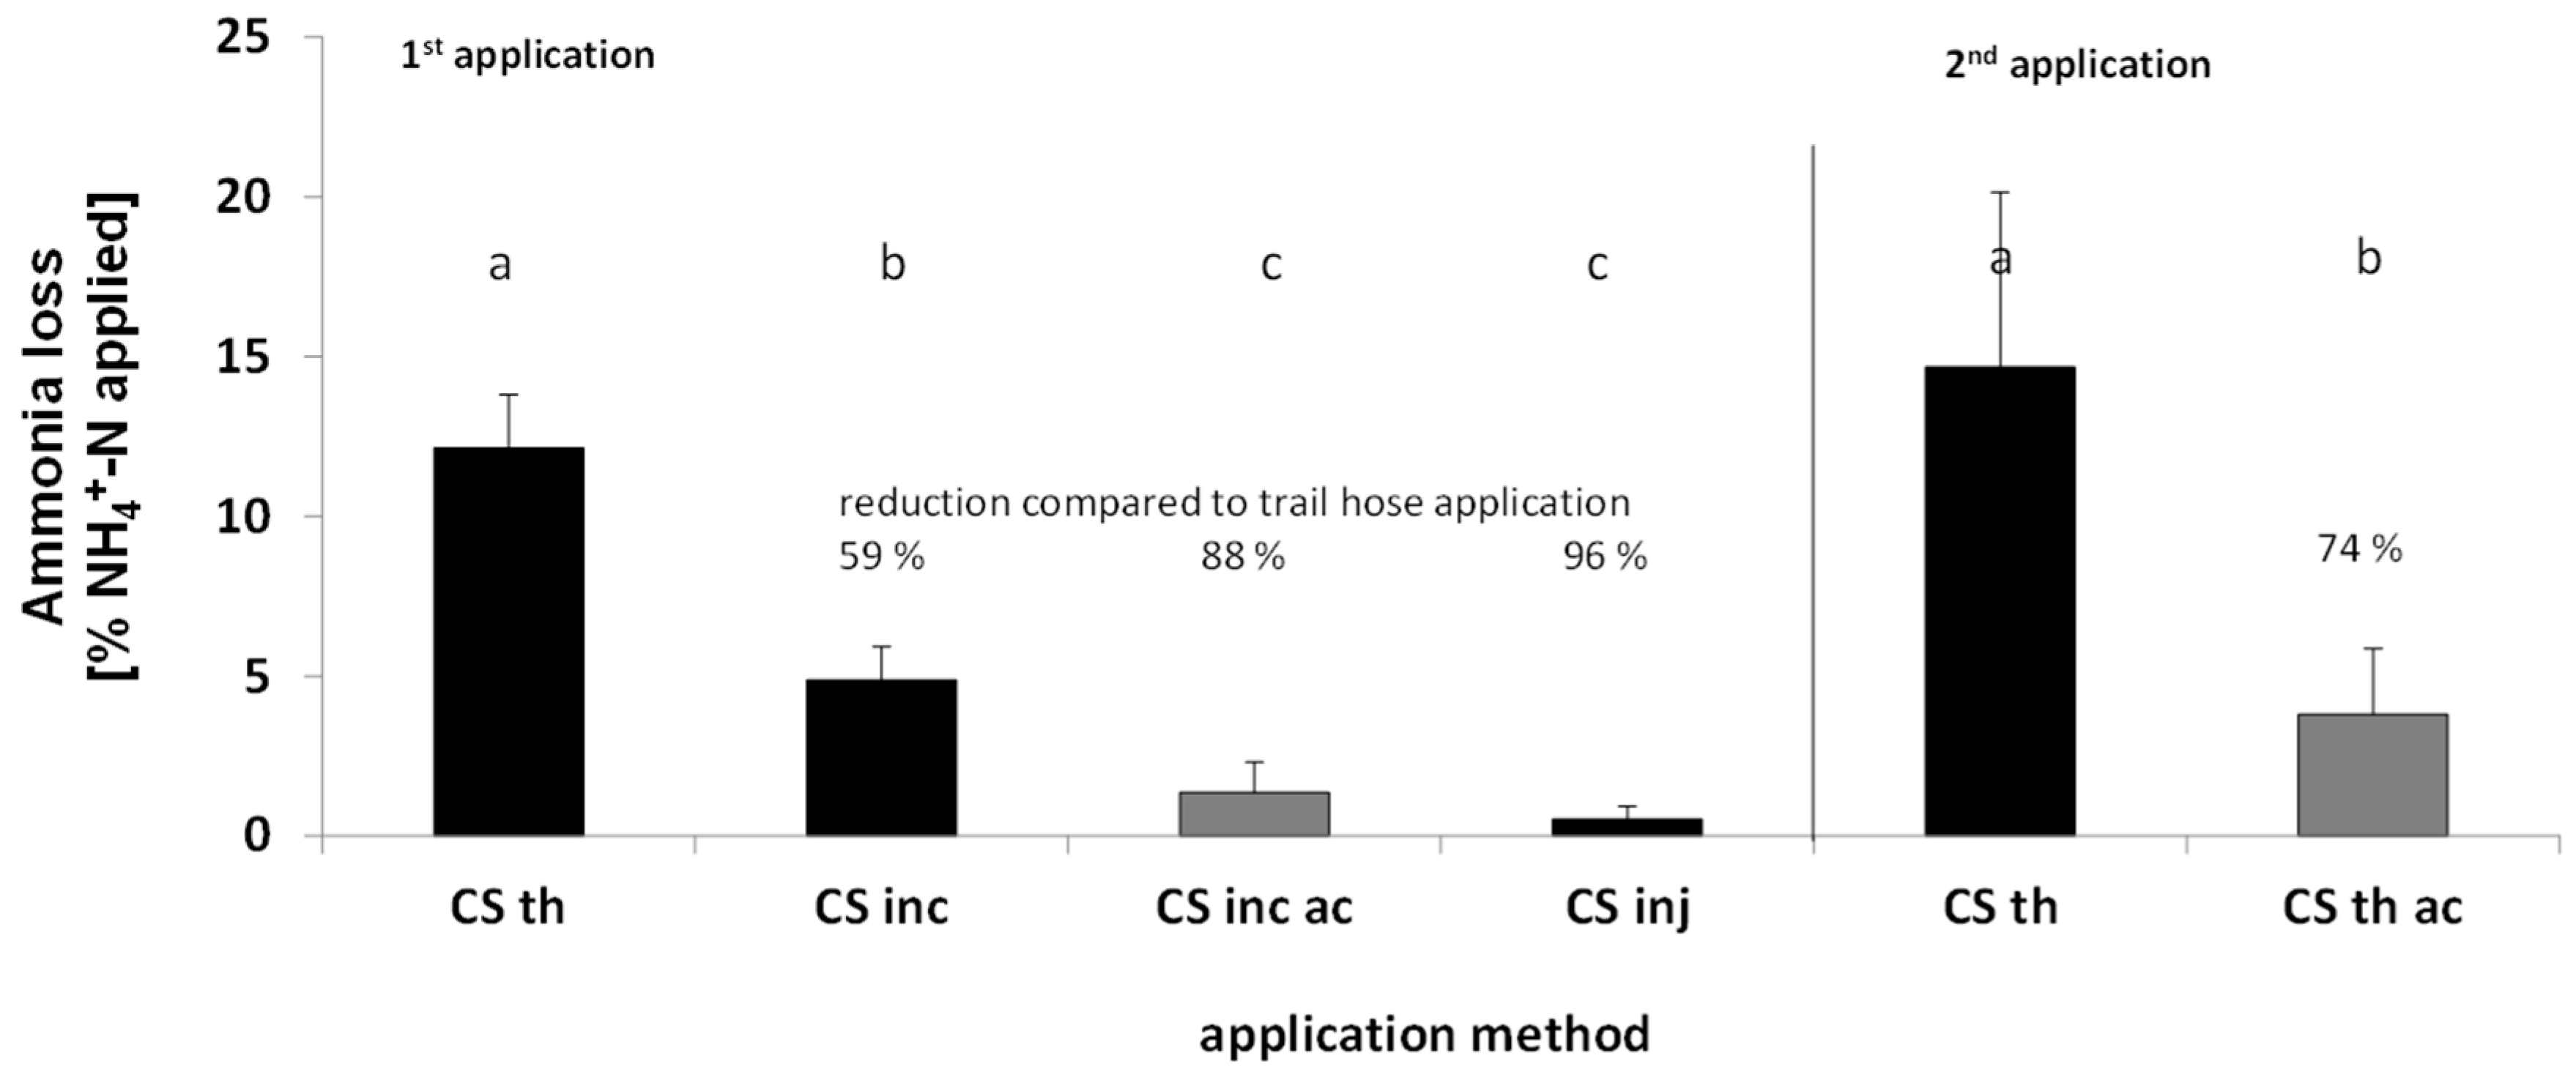
3.1.1. Summer Barley Trials
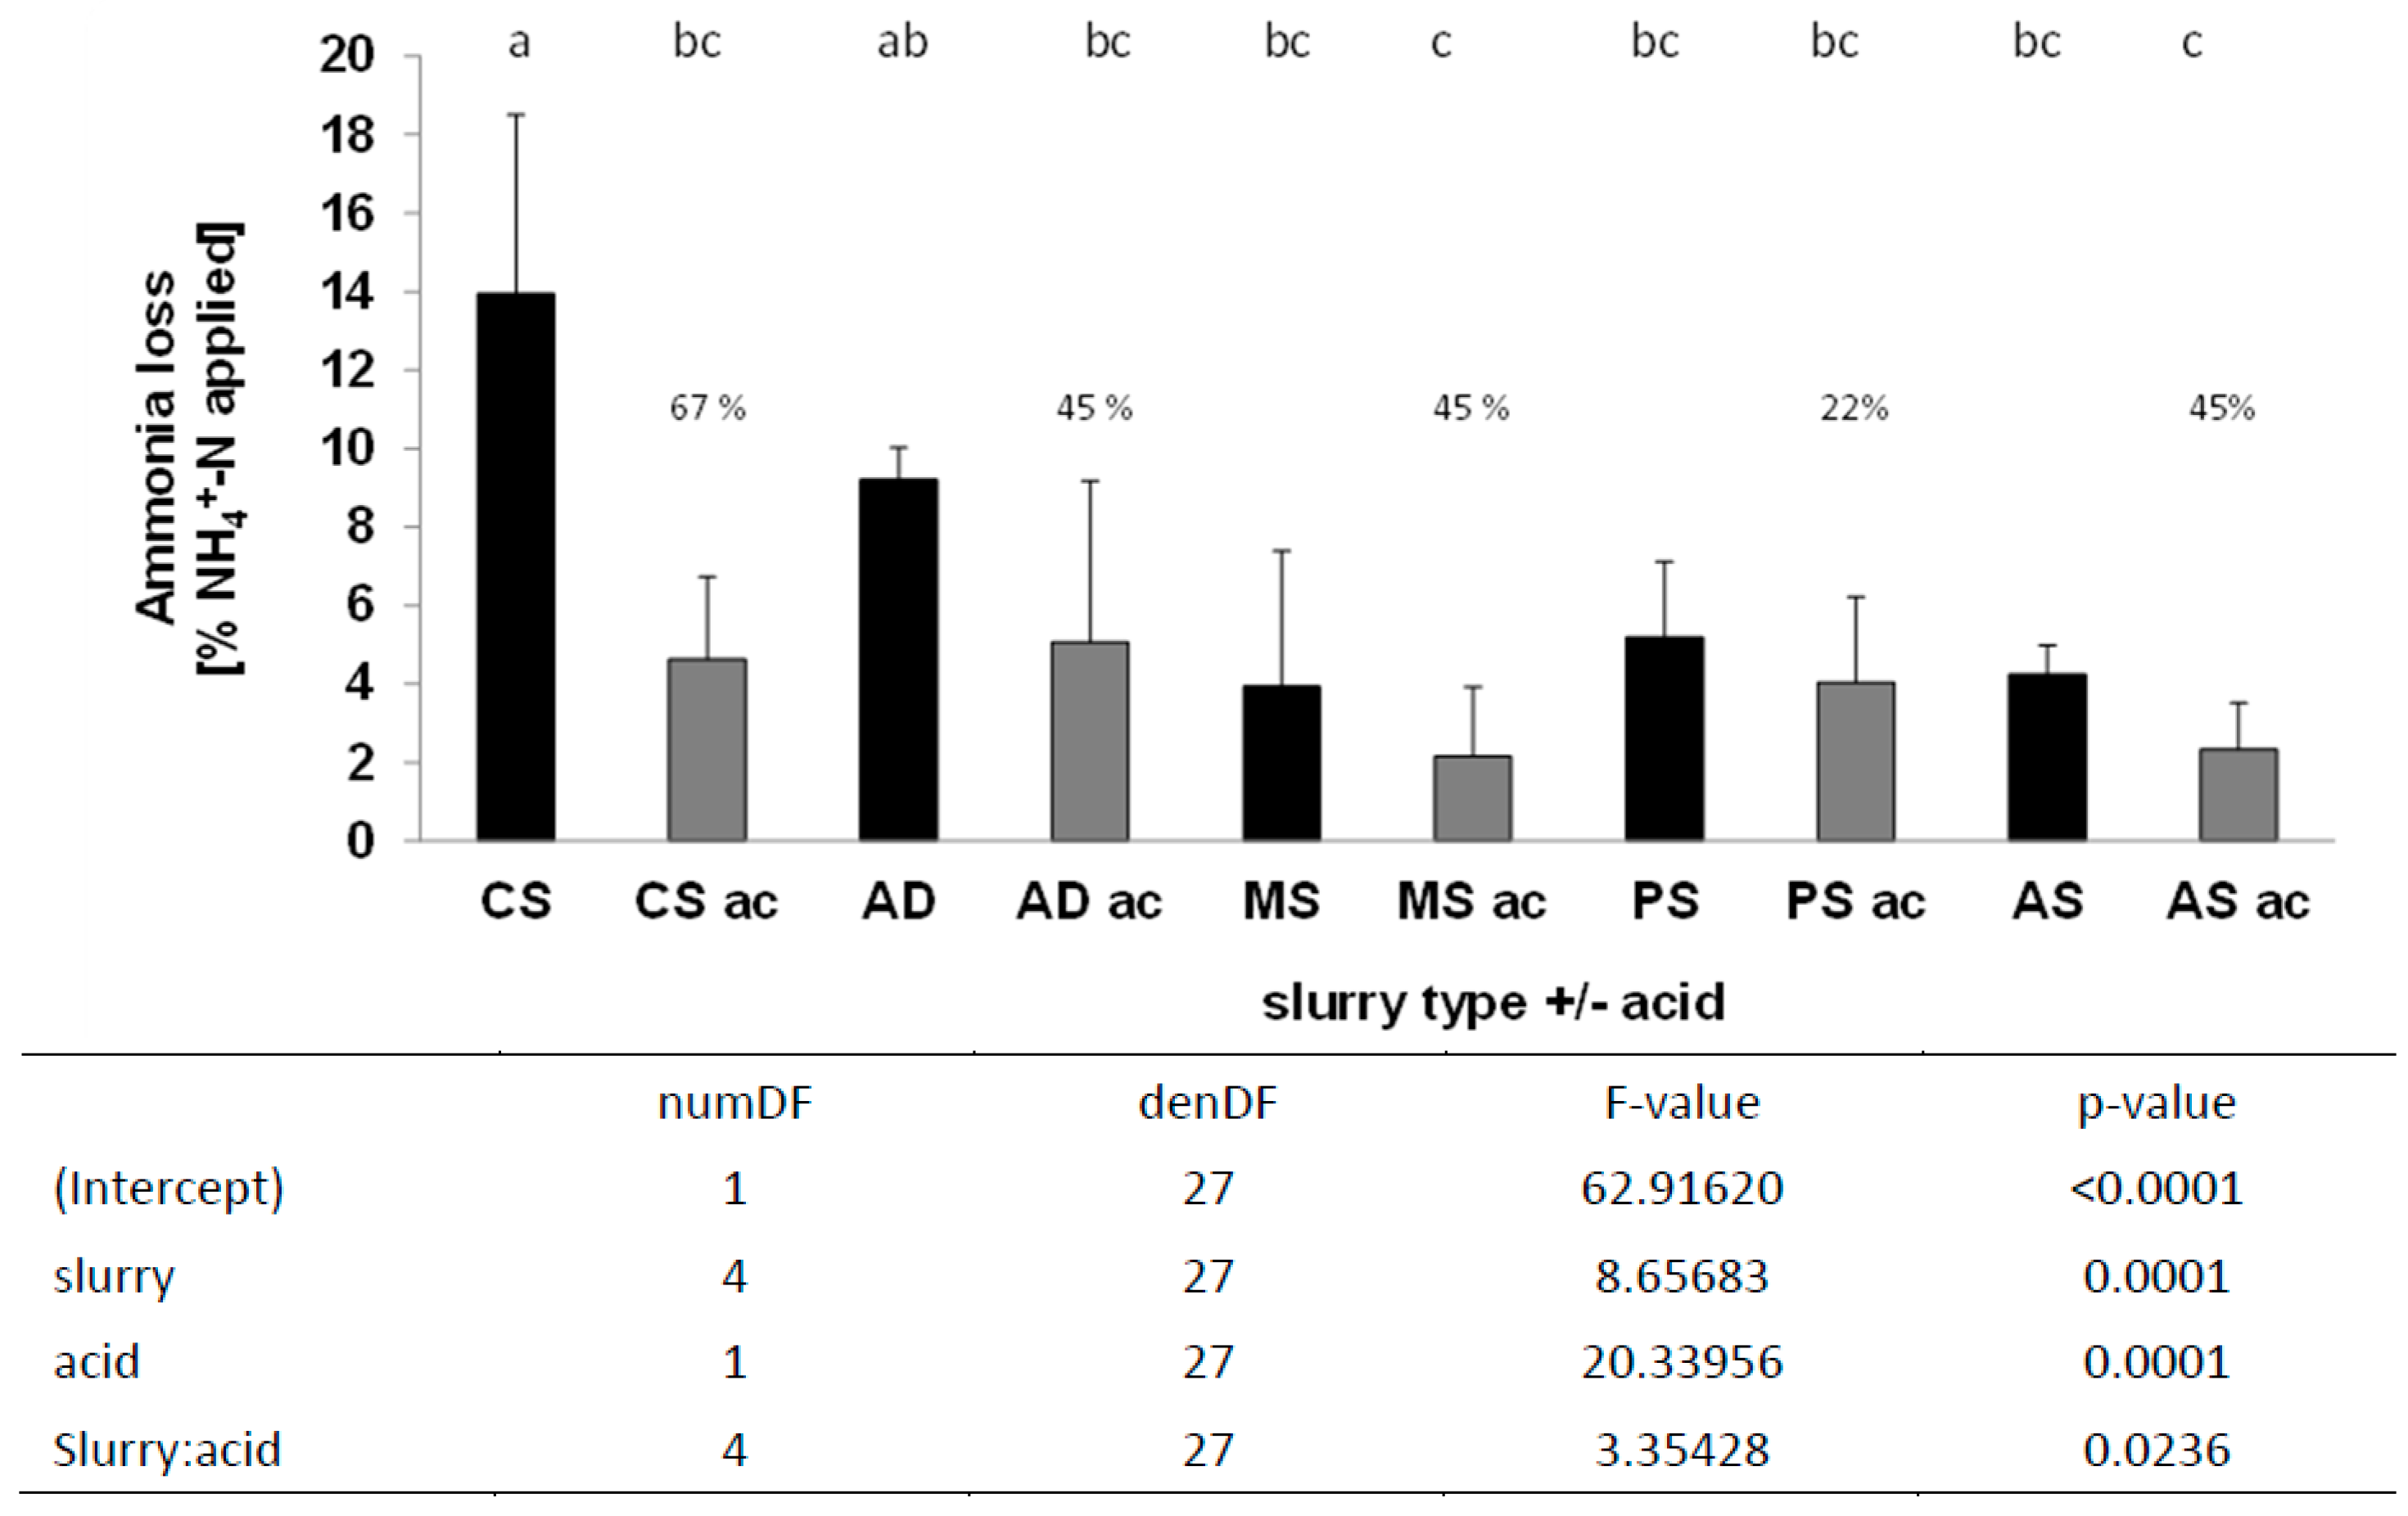
3.1.2. Winter Wheat Trials
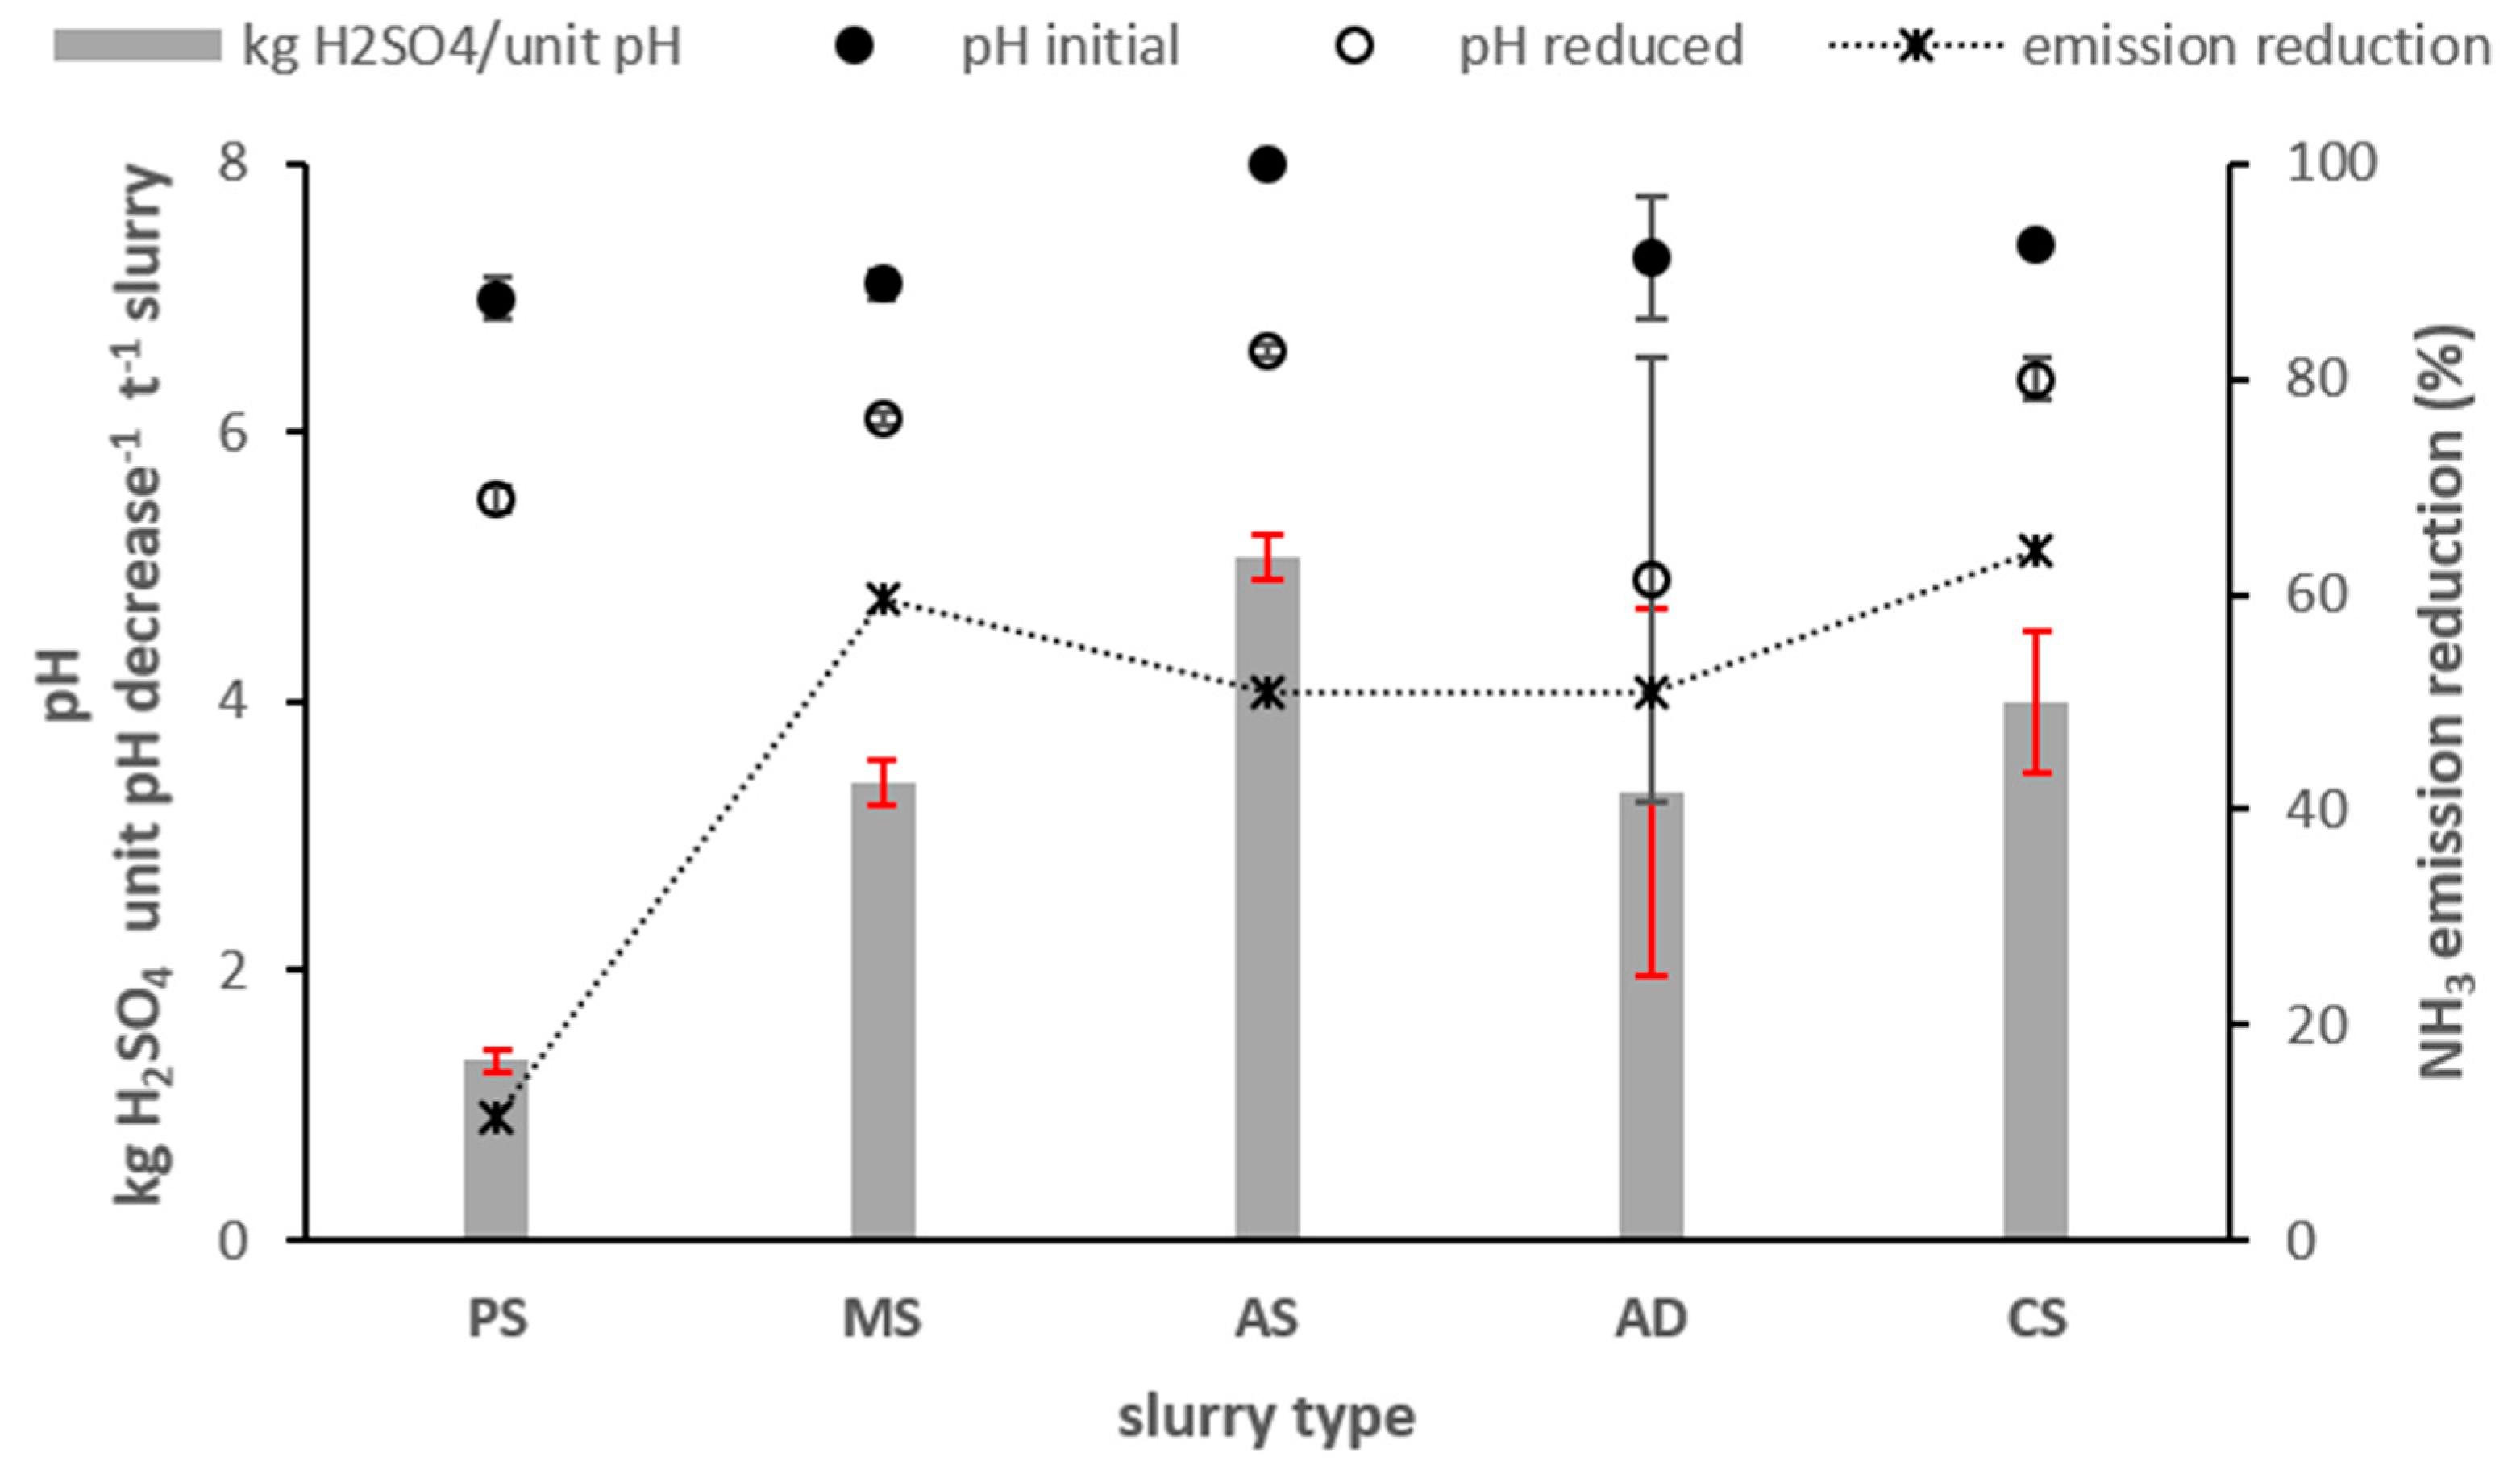
3.2. Acid Requirements
3.3. Yield Variables
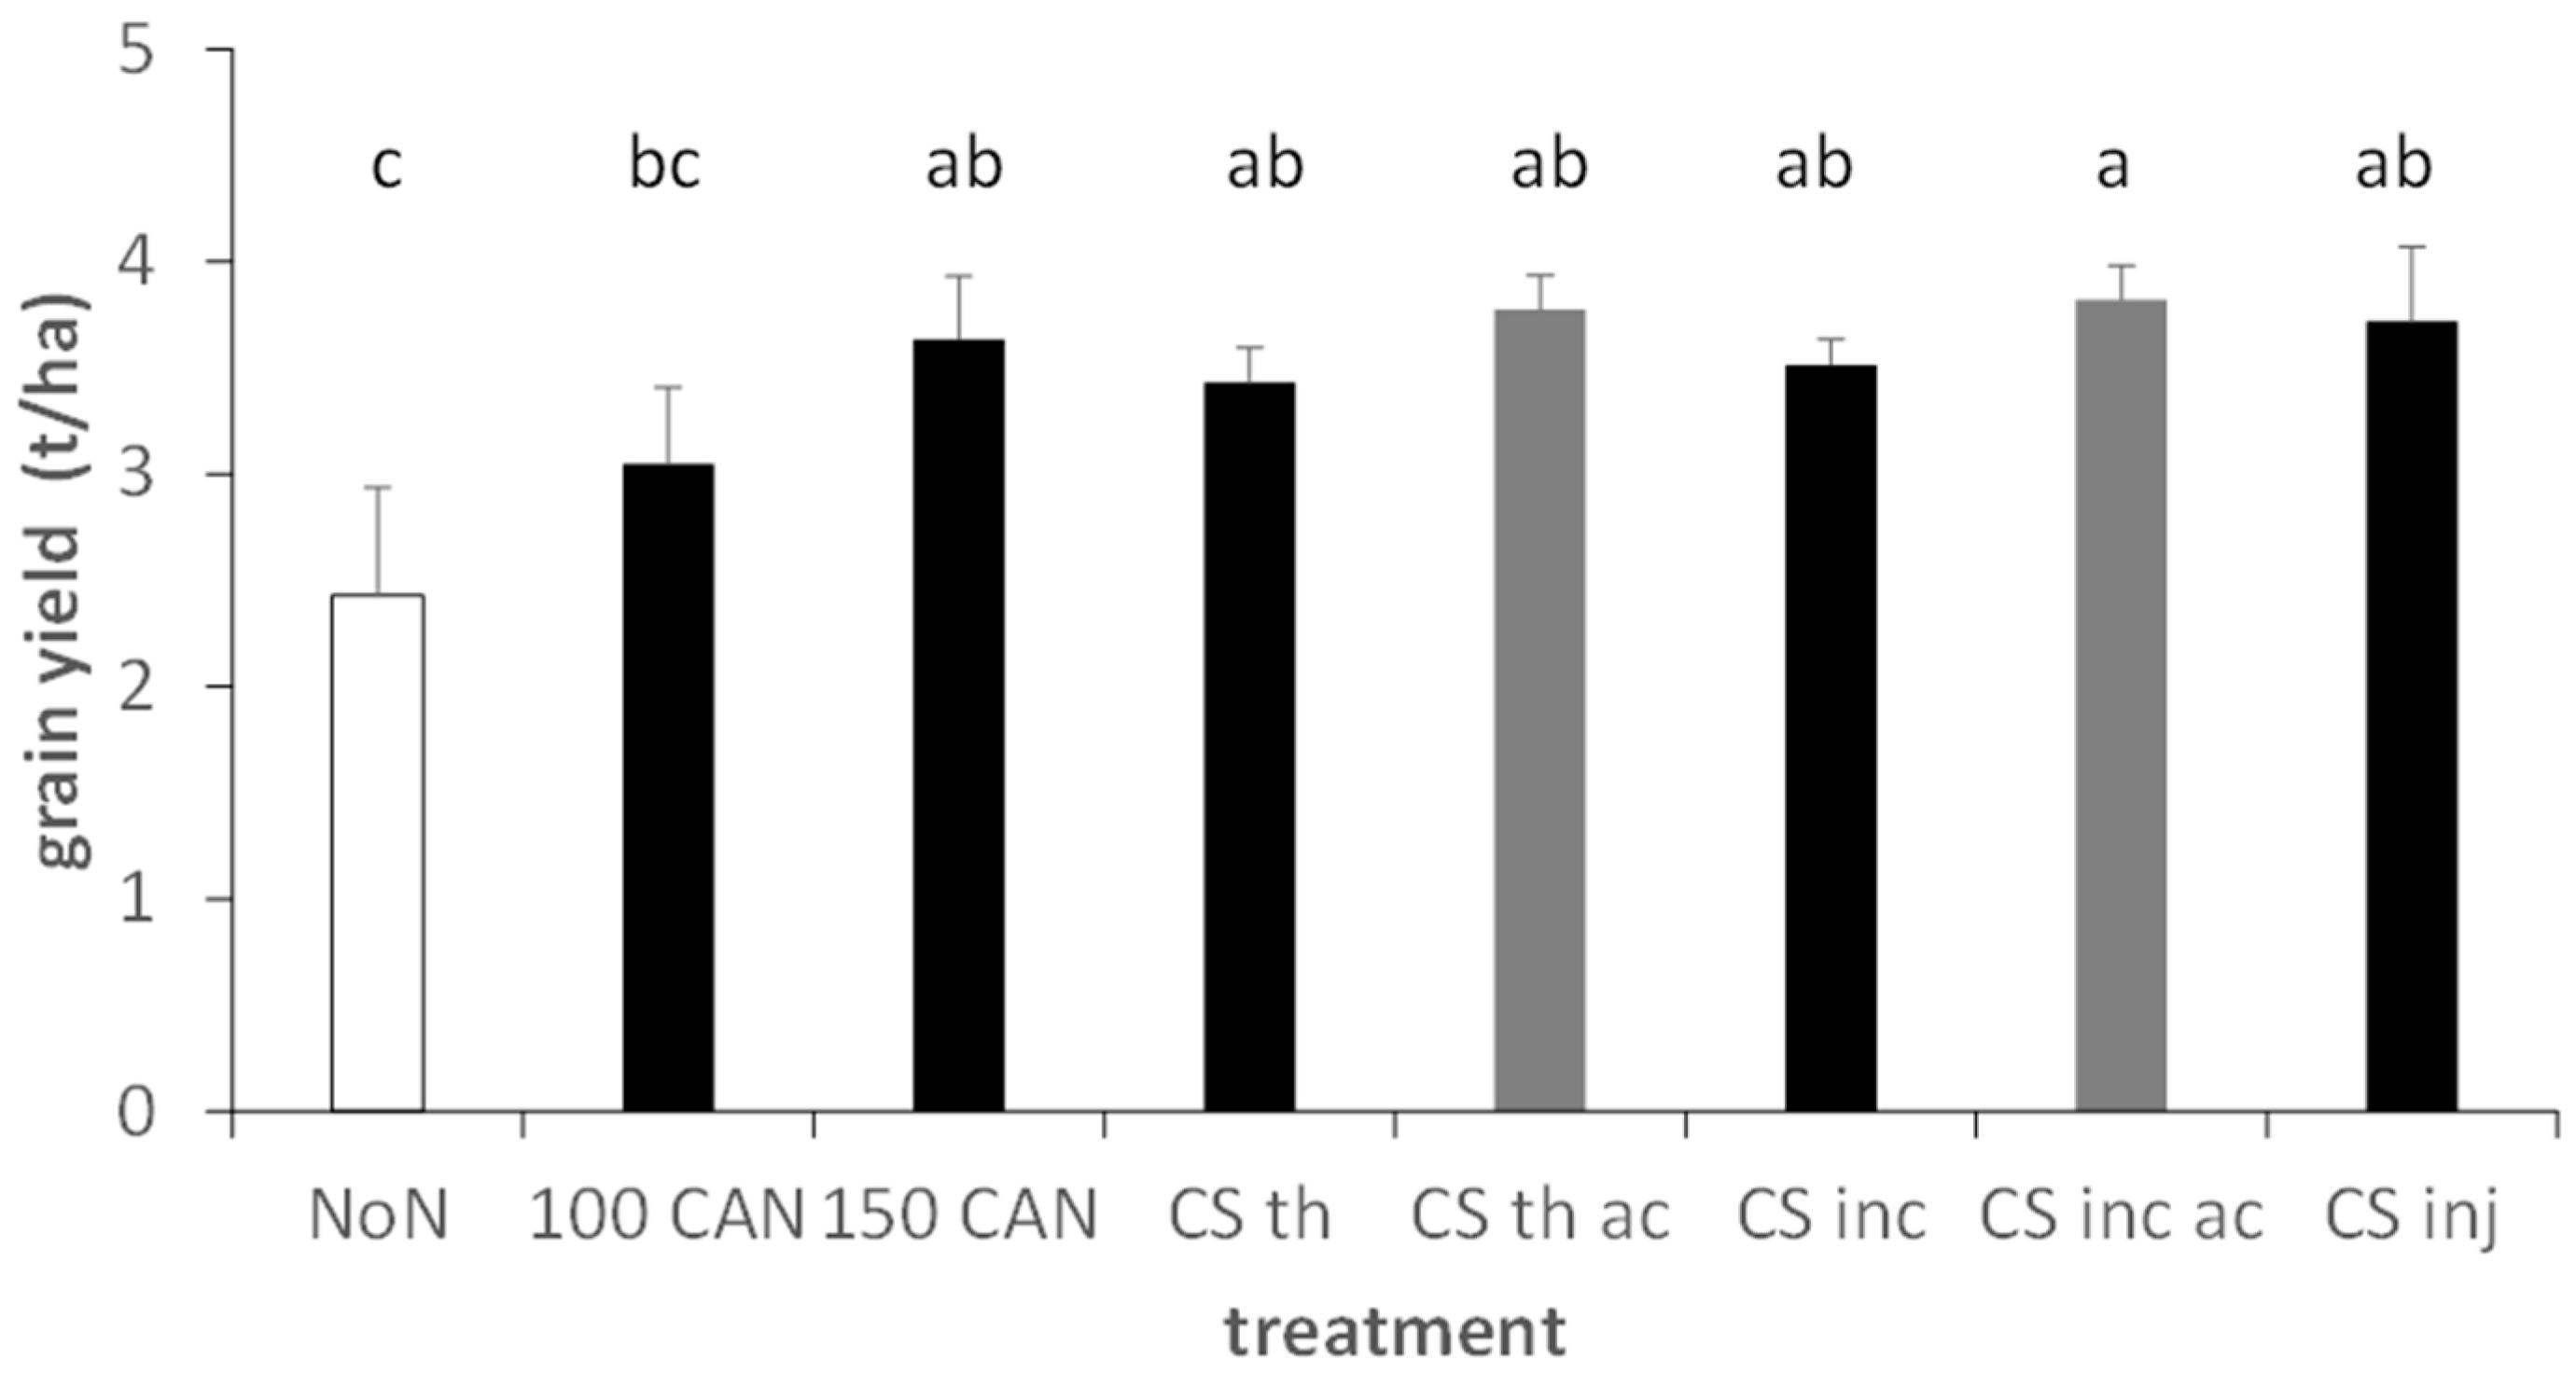
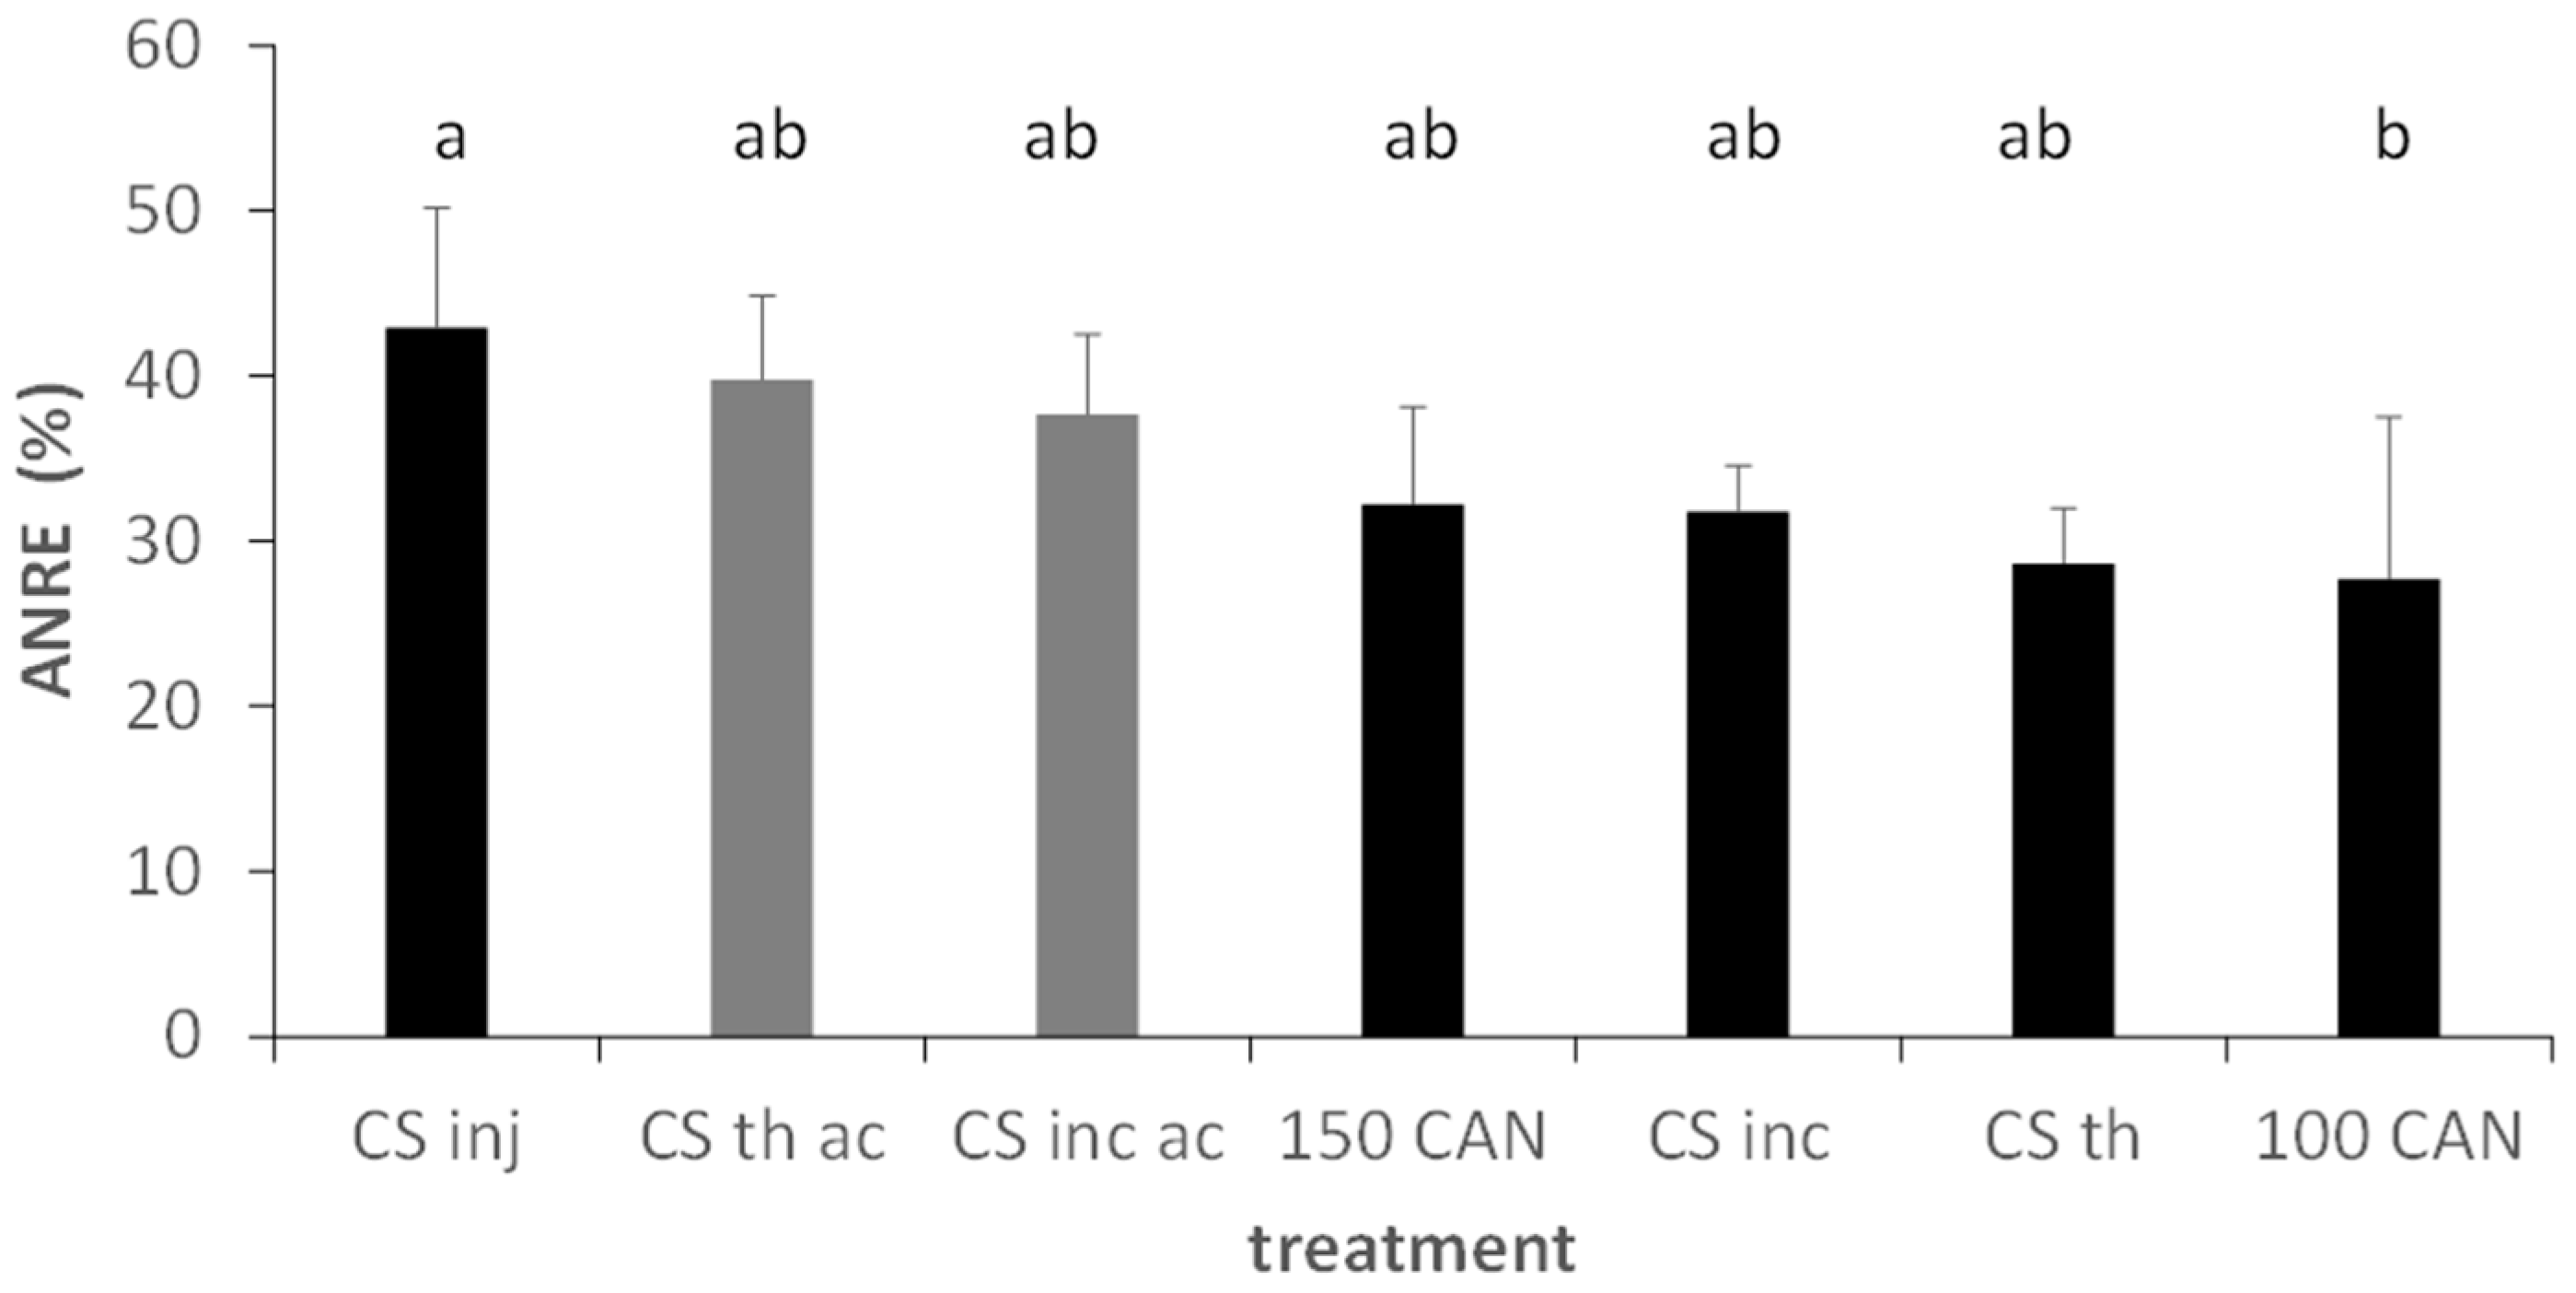
3.3.1. Barley Trials
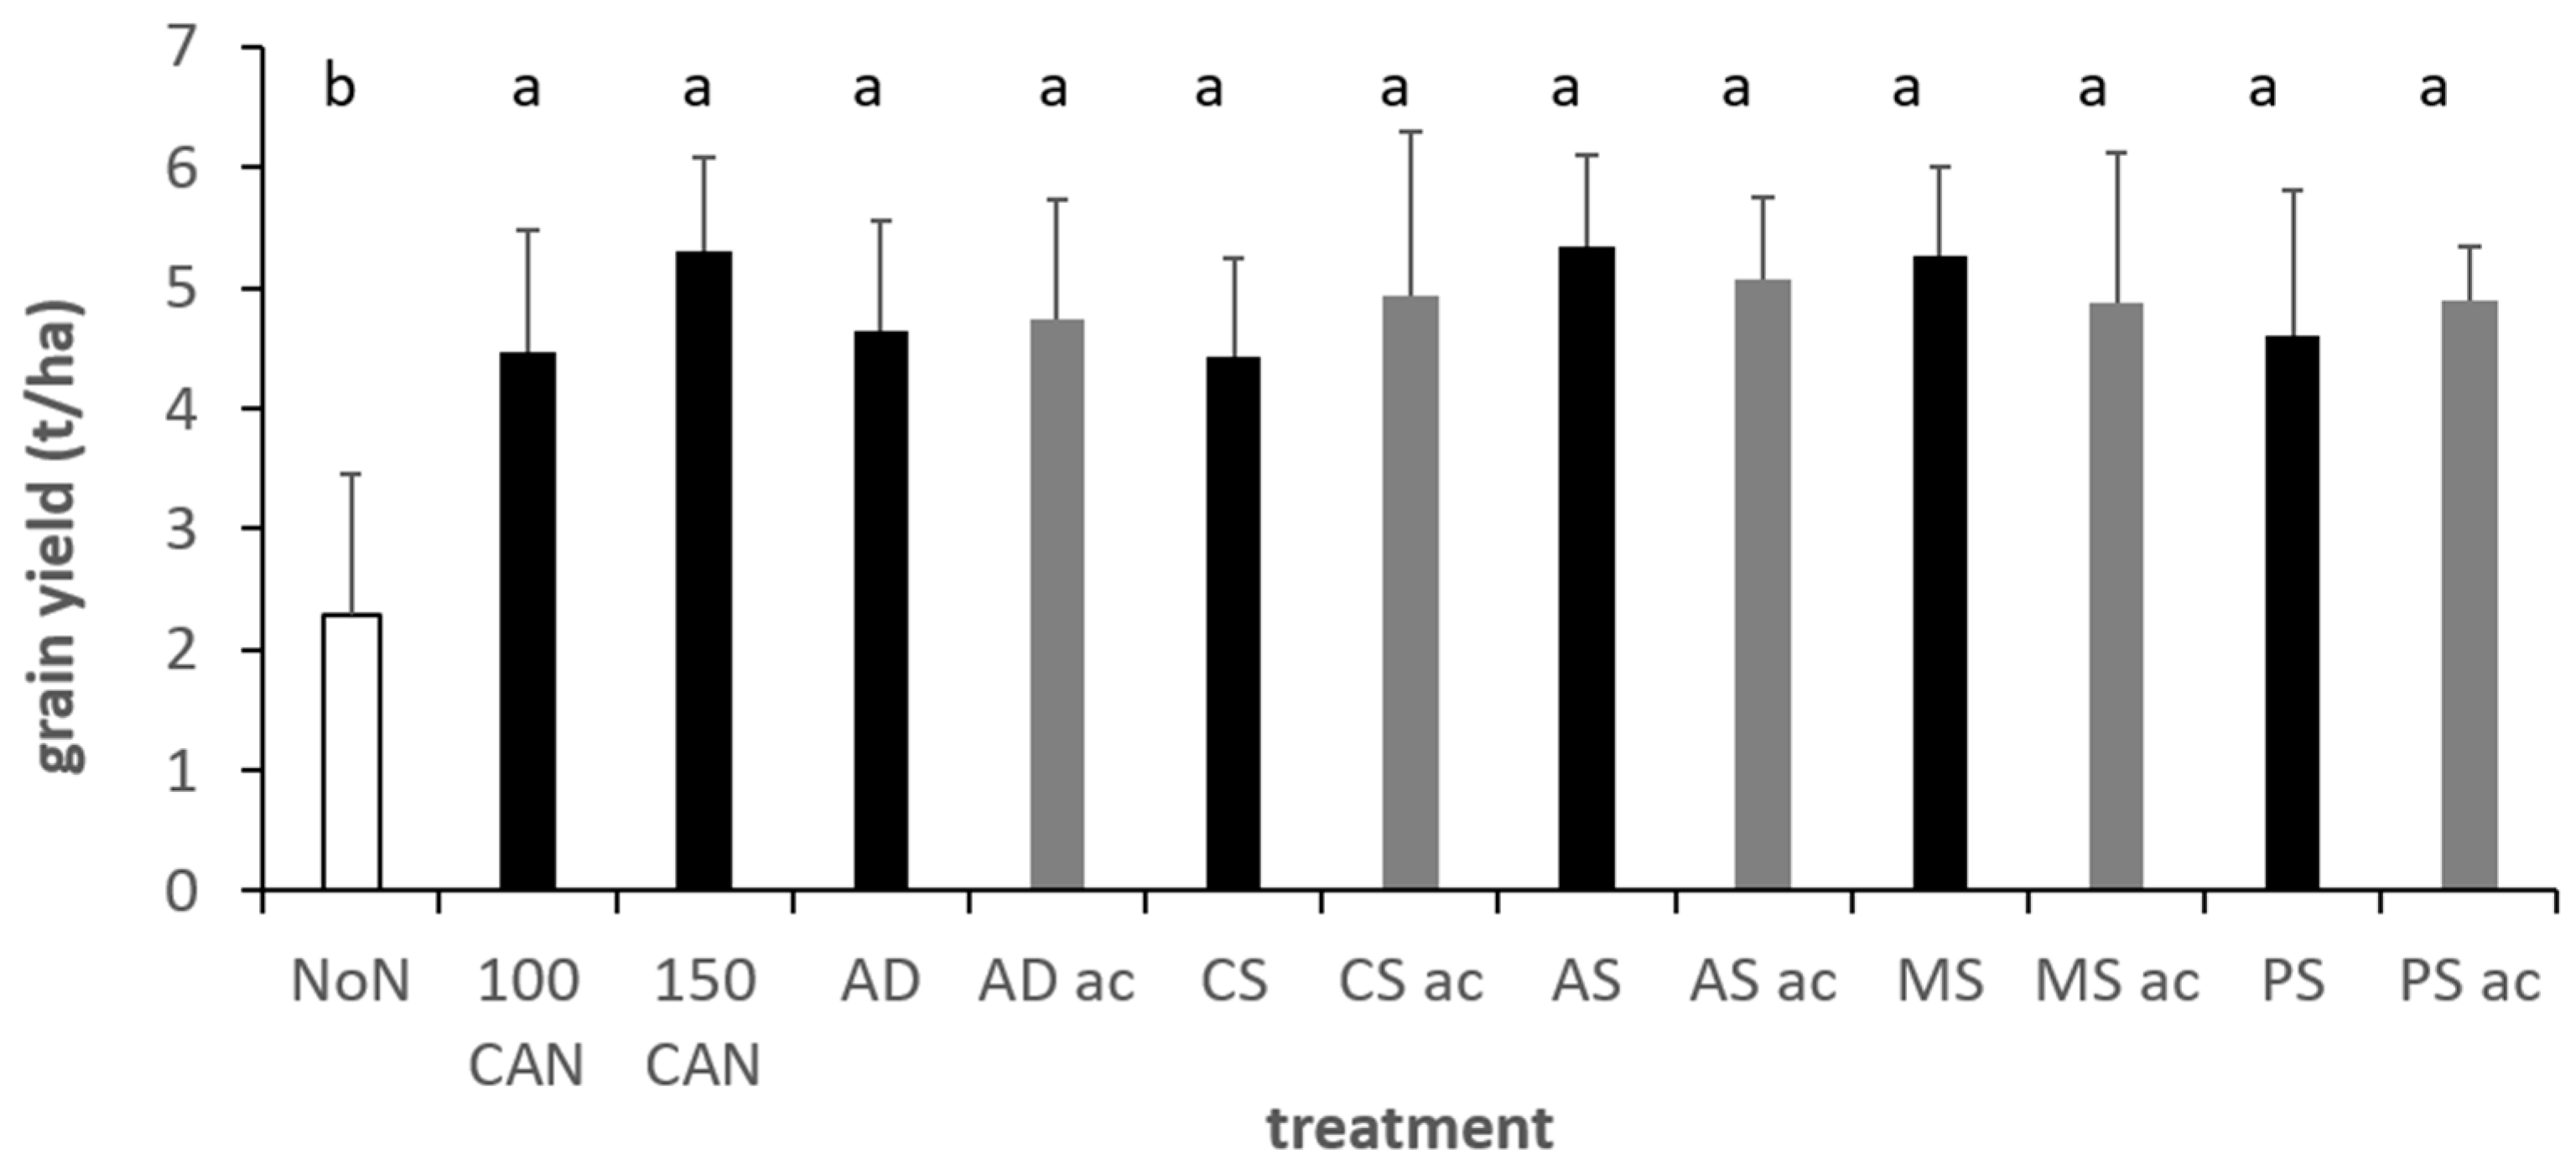
3.3.2. Winter Wheat Trials
4. Discussion
4.1. NH3 Emissions
4.2. Acid Requirements
4.3. Yield Variables
5. Conclusions
Supplementary Materials
Author Contributions
Funding
Data Availability Statement
Acknowledgments
Conflicts of Interest
References
- Erisman, J.W.; Sutton, M.A.; Galloway, J.; Klimont, Z.; Winiwarter, W. How a century of ammonia synthesis changed the world. Nat. Geosci. 2008, 1, 636–639. [Google Scholar] [CrossRef]
- Rockström, J.; Steffen, W.L.; Noone, K.; Persson, Å.; Chapin, F.S., III; Lambin, E.; Lenton, T.M.; Scheffer, M.; Folke, C.; Schellnhuber, H.J.; et al. Planetary Boundaries: Exploring the Safe Operating Space for Humanity. Ecol. Soc. 2009, 14, 915. [Google Scholar] [CrossRef]
- Erisman, J.W.; Bleeker, A.; Hensen, A.; Vermeulen, A. Agricultural air quality in Europe and the future perspectives. Atmos. Environ. 2008, 42, 3209–3217. [Google Scholar] [CrossRef] [Green Version]
- Oenema, O.; Wrage, N.; Velthof, G.L.; van Groenigen, J.W.; Dolfing, J.; Kuikman, P.J. Trends in Global Nitrous Oxide Emissions from Animal Production Systems. Nutr. Cycl. Agroecosyst. 2005, 72, 51–65. [Google Scholar] [CrossRef]
- Erisman, J.W.; Dammers, E.; van Damme, M.; Soudzilovskaia, N.; Schaap, M. Trends in EU nitrogen deposition and impacts on ecosystems: An overview of the achievements and the current state of knowledge on reactive nitrogen in Europe, focusing on deposition, critical load exceedances, and modeled and measured trends. In Reactive Nitrogen and Possible Management; Air and Waste Management Association’s Magazine for Environmental Managers; Bucher, L., Ed.; Air & Waste Management Association: Pittsburgh, PA, USA, 2015; pp. 31–35. [Google Scholar]
- Petersen, S.O.; Sommer, S.G.; Béline, F.; Burton, C.; Dach, J.; Dourmad, J.Y.; Leip, A.; Misselbrook, T.; Nicholson, F.; Poulsen, H.D.; et al. Recycling of livestock manure in a whole-farm perspective. Livest. Sci. 2007, 112, 180–191. [Google Scholar] [CrossRef]
- Hafner, S.D.; Pacholski, A.; Bittman, S.; Burchill, W.; Bussink, W.; Chantigny, M. The ALFAM2 database on ammonia emission from field-applied manure: Description and illustrative analysis. Agric. For. Meteorol. 2018, 258, 66–79. [Google Scholar] [CrossRef] [Green Version]
- Sommer, S.G.; Olesen, J.E.; Christensen, B.T. Effects of temperature, wind speed and air humidity on ammonia volatilization from surface applied cattle slurry. J. Agric. Sci. 1991, 117, 91. [Google Scholar] [CrossRef]
- Sommer, S.G.; Sherlock, R.R. pH and buffer component dynamics in the surface layers of animal slurries. J. Agric. Sci. 1996, 127, 109. [Google Scholar] [CrossRef]
- Sommer, S.G.; Christensen, M.L.; Schmidt, T.; Jensen, L.S. Animal Manure Recycling: Treatment and Management; John Wiley & Sons Inc.: Chichester, UK, 2013. [Google Scholar]
- Nyord, T.; Hansen, M.N.; Birkmose, T.S. Ammonia volatilisation and crop yield following land application of solid-liquid separated, anaerobically digested, and soil injected animal slurry to winter wheat. Agric. Ecosyst. Environ. 2012, 160, 75–81. [Google Scholar] [CrossRef]
- Mostafa, E.; Selders, A.; Buescher, W. Aeration of pig slurry affects ammonia and greenhouse gases emissions. Int. J. Environ. Sci. Technol. 2019, 16, 7327–7338. [Google Scholar] [CrossRef]
- Maglione, G.; Tommaso, G.; Iuliano, M.; Costanzo, G.; Vitale, E.; Arena, C.; Vitale, L. Aerated Buffalo Slurry Improves Spinach Plant Growth and Mitigates CO2 and N2O Emissions from Soil. Agriculture 2021, 11, 758. [Google Scholar] [CrossRef]
- Kai, P.; Pedersen, P.; Jensen, J.E.; Hansen, M.N.; Sommer, S.G. A whole-farm assessment of the efficacy of slurry acidification in reducing ammonia emissions. Eur. J. Agron. 2008, 28, 148–154. [Google Scholar] [CrossRef]
- Seidel, A.; Pacholski, A.; Nyord, T.; Vestergaard, A.; Pahlmann, I.; Herrmann, A.; Kage, H. Effects of acidification and injection of pasture applied cattle slurry on ammonia losses, N2O emissions and crop N uptake. Agric. Ecosyst. Environ. 2017, 247, 23–32. [Google Scholar] [CrossRef]
- Fangueiro, D.; Hjorth, M.; Gioelli, F. Acidification of animal slurry—A review. J. Environ. Manag. 2015, 149, 46–56. [Google Scholar] [CrossRef]
- Husted, S.; Jensen, L.S.; Jørgensen, S.S. Reducing ammonia loss from cattle slurry by the use of acidifying additives: The role of the buffer system. J. Sci. Food Agric. 1991, 57, 335–349. [Google Scholar] [CrossRef]
- Birkmose, T.; Vestergaard, A. Acidification of Slurry in Barns, Stores and during Application: Review of Danish Research, Trials and Experience. 2012. Available online: http://www.biocover.dk/images/Acidification_of_slurry_-_A_Danish_review.pdf (accessed on 12 February 2021).
- Pacholski, A. Calibrated Passive Sampling-Multi-plot Field Measurements of NH3 Emissions with a Combination of Dynamic Tube Method and Passive Samplers. J. Vis. Exp. 2016, 9, 15. [Google Scholar] [CrossRef] [Green Version]
- Sommer, S.G.; Olesen, J.E.; Petersen, S.O.; Weisbjerg, M.R.; Valli, L.; Rodhe, L.; Béline, F. Region-specific assessment of greenhouse gas mitigation with different manure management strategies in four agroecological zones. Glob. Chang. Biol. 2009, 15, 2825–2837. [Google Scholar] [CrossRef]
- Lyngsø, H.; Flotats, X.; Bonmati, A.; Palatsi, J.; Magri, A.; Schelde, K. Inventory of Manure Processing Activities in Europe: Technical Report No. I to the European Commission, Directorate-General Environment, Manure Processing Activities in Europe; Project Reference: ENV.B.1/ETU/2010/0007. 2011. Available online: https://op.europa.eu/en/publication-detail/-/publication/d629448f-d26a-4829-a220-136aad51d1d9/language-en/format-PDF/source-238017025 (accessed on 24 July 2016).
- Maag, M.; Lind, A.M.; Eiland, F. Emission of nitrous oxide and denitrification from Danish soils amended with slurry and fertilizer. In Progress in Nitrogen Cycling Studies, Proceedings of the 8th Nitrogen Workshop, Ghent, Belgium, 5–8 September 1994; Cleemput, O., Hofman, G., Vermoesen, A., Eds.; Springer: Dordrecht, The Netherlands, 1996; pp. 581–584. ISBN 9789401062923. [Google Scholar]
- Olesen, J.E.; Askegaard, M.; Berntsen, J. Nitrate leaching from arable crop rotations in organic farming. In Controlling Nitrogen Flows and Losses Fertiliser, Manures, Nutrient Cycling, 1st ed.; Hatch, D.J., Chadwick, D.R., Jarvis, S.C., Roker, J.A., Eds.; Wageningen Academic Publishers: Wageningen, The Netherlands, 2004; pp. 389–404. ISBN 9789076998435. [Google Scholar]
- Ni, K.; Koester, J.R.; Seidel, A.; Pacholski, A. Field measurement of ammonia emissions after nitrogen fertilization—A comparison between micrometeorological and chamber methods. Eur. J. Agron 2015, 71, 115–122. [Google Scholar] [CrossRef]
- Vandré, R.; Kaupenjohann, M. In Situ Measurement of Ammonia Emissions from Organic Fertilizers in Plot Experiments. Soil Sci. Soc. Am. J. 1998, 62, 467. [Google Scholar] [CrossRef]
- Pacholski, A.; Cai, G.; Nieder, R.; Richter, J.; Fan, X.; Zhu, Z.; Roelcke, M. Calibration of a simple method for determining ammonia volatilization in the field–comparative measurements in Henan Province, China. Nutr. Cycl. Agroecosyst. 2006, 74, 259–273. [Google Scholar] [CrossRef]
- Gericke, D.; Pacholski, A.; Kage, H. Measurement of ammonia emissions in multi-plot field experiments. Biosyst. Eng. 2011, 108, 164–173. [Google Scholar] [CrossRef]
- Quakernack, R.; Pacholski, A.; Techow, A.; Herrmann, A.; Taube, F.; Kage, H. Ammonia volatilization and yield response of energy crops after fertilization with biogas residues in a coastal marsh of Northern Germany. Agric. Ecosyst. Environ. 2012, 160, 66–74. [Google Scholar] [CrossRef]
- Pan, B.; Lam, S.K.; Mosier, A.; Luo, Y.; Chen, D. Ammonia volatilization from synthetic fertilizers and its mitigation strategies: A global synthesis. Agric. Ecosyst. Environ. 2016, 232, 283–289. [Google Scholar] [CrossRef]
- Ni, K.; Pacholski, A.; Kage, H. Ammonia volatilization after application of urea to winter wheat over 3 years affected by novel urease and nitrification inhibitors. Agric. Ecosyst. Environ. 2014, 197, 184–194. [Google Scholar] [CrossRef]
- Verband Deutscher Landwirtschaftlicher Untersuchungs-und Forschungsanstalten (VDLUFA). Stickstoffverbindungen. In Die Chemische Untersuchung von Futtermitteln; VDLUFA-Verlag: Darmstadt, Germany, 1976; Volume 3. [Google Scholar]
- Baligar, V.C.; Fageria, N.K.; He, Z.L. Nutrient use efficiency in plants Commun. Soil Sci. Plant Anal. 2001, 32, 921–950. [Google Scholar] [CrossRef]
- Hafner, S.D.; Pacholski, A.; Bittman, S.; Carozzi, M.; Chantigny, M.; Génermont, S. A flexible semi-empirical model for estimating ammonia volatilization from field-applied slurry. Atmos. Environ. 2019, 199, 474–484. [Google Scholar] [CrossRef]
- Webb, J.; Pain, B.; Bittman, S.; Morgan, J. The impacts of manure application methods on emissions of ammonia, nitrous oxide and on crop response—A review. Agric. Ecosyst. Environ. 2010, 137, 39–46. [Google Scholar] [CrossRef]
- Thorman, R.E.; Hansen, M.N.; Misselbrook, T.H.; Sommer, S.G. Algorithm for estimating the crop height effect on ammonia emission from slurry applied to cereal fields and grassland. Agron. Sustain. Dev. 2008, 28, 373–378. [Google Scholar] [CrossRef]
- Eriksen, J.; Sørensen, P.; Elsgaard, L. The fate of sulfate in acidified pig slurry during storage and following application to cropped soil. J. Environ. Qual. 2008, 37, 280–286. [Google Scholar] [CrossRef] [Green Version]
- Sørensen, P.; Eriksen, J. Effects of slurry acidification with sulphuric acid combined with aeration on the turnover and plant availability of nitrogen. Agric. Ecosyst. Environ. 2009, 131, 240–246. [Google Scholar] [CrossRef]
- Hansen, R.R.; Nielsen, D.A.; Schramm, A.; Nielsen, L.P.; Revsbech, N.P.; Hansen, M.N. Greenhouse Gas Microbiology in Wet and Dry Straw Crust Covering Pig Slurry. J. Environ. Qual. 2009, 38, 1311. [Google Scholar] [CrossRef] [PubMed] [Green Version]
- Szanto, G.; Hamelers, H.; Rulkens, W.; Veeken, A. NH3, N2O and CH4 emissions during passively aerated composting of straw-rich pig manure. Bioresour. Technol. 2007, 98, 2659–2670. [Google Scholar] [CrossRef] [PubMed]
- Hou, Y.; Velthof, G.L.; Oenema, O. Mitigation of ammonia, nitrous oxide and methane emissions from manure management chains: A meta-analysis and integrated assessment. Glob. Change Biol. 2015, 21, 1293–1312. [Google Scholar] [CrossRef] [PubMed]
- Misselbrook, T.; Hunt, J.; Perazzolo, F.; Provolo, G. Greenhouse gas and ammonia emissions from slurry storage: Impacts of temperature and potential mitigation through covering (pig slurry) and acidification (cattle slurry). J. Environ. Qual. 2016, 45, 1520–1530. [Google Scholar] [CrossRef] [PubMed]
- Pedersen, I.F.; Rubæk, G.H.; Sørensen, P. Cattle slurry acidification and application method can improve initial phosphorus availability for maize. Plant Soil 2017, 414, 143–158. [Google Scholar] [CrossRef] [Green Version]
- Kučinskienė, G.; Titiškytė, L.; Lundin, G.; Strand, L. Baltic Slurry Acidification: Methodology, Results Collection and Partners Practical Experiences 2016–2018. 2019. Available online: http://balticslurry.eu/wp-content/uploads/2016/06/Report-WP4.pdf (accessed on 15 June 2021).


| Location (Coordinates) | Texture (% 0–0.25 m) | Bulk Density (g cm−3) | pH | ||||
|---|---|---|---|---|---|---|---|
| Clay | Silt | Fine Sand | Coarse Sand | TOM * | |||
| First trial (56°28′58.1″ N 9°34′26.9″ E, 500 m distance: 56°29′00.2″ N 9°34′57.3″ E) | 7.7 | 9.8 | 47.8 | 29. | 5.8 | 1.32 | 5.6 |
| Second trial (56°28′53.8″ N 9°36′28.4″ E) | 6.9 | 8.7 | 49.2 | 29.4 | 5.5 | 1.30 | 5.7 |
| Experiment | Slurry Type | Application Method | Rate | pH | H2SO4 | NH4+-N | DM | DM ac | |
|---|---|---|---|---|---|---|---|---|---|
| t ha−1 | ac * | kg m−3 | kg ha−1 | % | % | ||||
| Application at seeding of spring barley 1.4.14 (soil moisture wet) | CS | Trail hose (th) | 53.0 | 84.8 | 6.5 | ||||
| Incorporation (inc) | 53.0 | 7.2 | 84.8 | 6.5 | |||||
| inc + ac | 53.0 | 5.6 | 2.5 | 84.8 | 6.4 | ||||
| Injection (inj) | 53.0 | 80.0 | 6.4 | ||||||
| Application on standing spring barley 1.5.14 (soil moisture wet) | CS | Th | 53.0 | 7.5 | 84.8 | 6.5 | |||
| th ac | 53.0 | 5.7 | 3.0 | 84.8 | 6.5 | ||||
| First winter wheat trial at the end of tillering stage 3.4.14 (soil moisture wet) | CS | th +/− ac | 53.0 | 7.3 | 6.5 | 4.0 | 84.8 | 6.2 | 5.7 |
| AD | 53.0 | 7.6 | 6.5 | 8.0 | 79.5 | 3.5 | 4.3 | ||
| MS | 37.5 | 7.2 | 6.0 | 3.4 | 78.8 | 1.4 | 1.5 | ||
| PS | 31.7 | 7.1 | 5.4 | 2.0 | 84.4 | 2.8 | 3.0 | ||
| AS | 53.0 | 8.0 | 6.6 | 7.1 | 79.5 | 2.4 | 2.7 | ||
| Second winter wheat trial at the beginning of flag leaf emergence 30.4.14 (soil moisture wet) | CS | th +/− ac | 53.0 | 7.4 | 6.2 | 4.0 | 84.8 | 6.2 | 5.7 |
| AD | 53.0 | 6.7 | 3.2 | 8.0 | 79.5 | 3.5 | 4.3 | ||
| MS | 37.5 | 7.0 | 6.1 | 3.4 | 78.8 | 1.4 | 1.5 | ||
| PS | 31.7 | 6.8 | 5.6 | 2.0 | 84.4 | 2.8 | 3.0 | ||
| AS | 53.0 | 7.9 | 6.5 | 7.1 | 79.5 | 2.4 | 2.7 | ||
| Application Date | Slurry Type | |||||
|---|---|---|---|---|---|---|
| CS | AD | MS | PS | AS | ||
| NH4+ (kg NH4+-N/m3) | 03.04./30.04. | 1.6 | 1.5 | 2.1 | 2.6 | 1.5 |
| DM * (%) | 03.04./30.04. | 6.2 | 3.5 | 1.4 | 2.8 | 2.4 |
| pH | 03.04. | 7.4 | 6.7 | 7.0 | 6.8 | 7.9 |
| 30.04. | 7.3 | 7.6 | 7.2 | 7.1 | 8.0 | |
| Model | ||||
|---|---|---|---|---|
| y~tec × acid, Random = ~1|Block | y~tec, Random = ~1|Block | |||
| Variable | Main Effects | Factors § (Post hoc Test) | Main Effects | Factors § (Post hoc Test) |
| Grain yield (t/ha) | tec ns acid * | ac+: a (+28%) ac−: b | tec: ns | - |
| Ngrain (kg N/ha) | tec ns acid * | ac+: a (+9%) ac−: b | tec: ns | - |
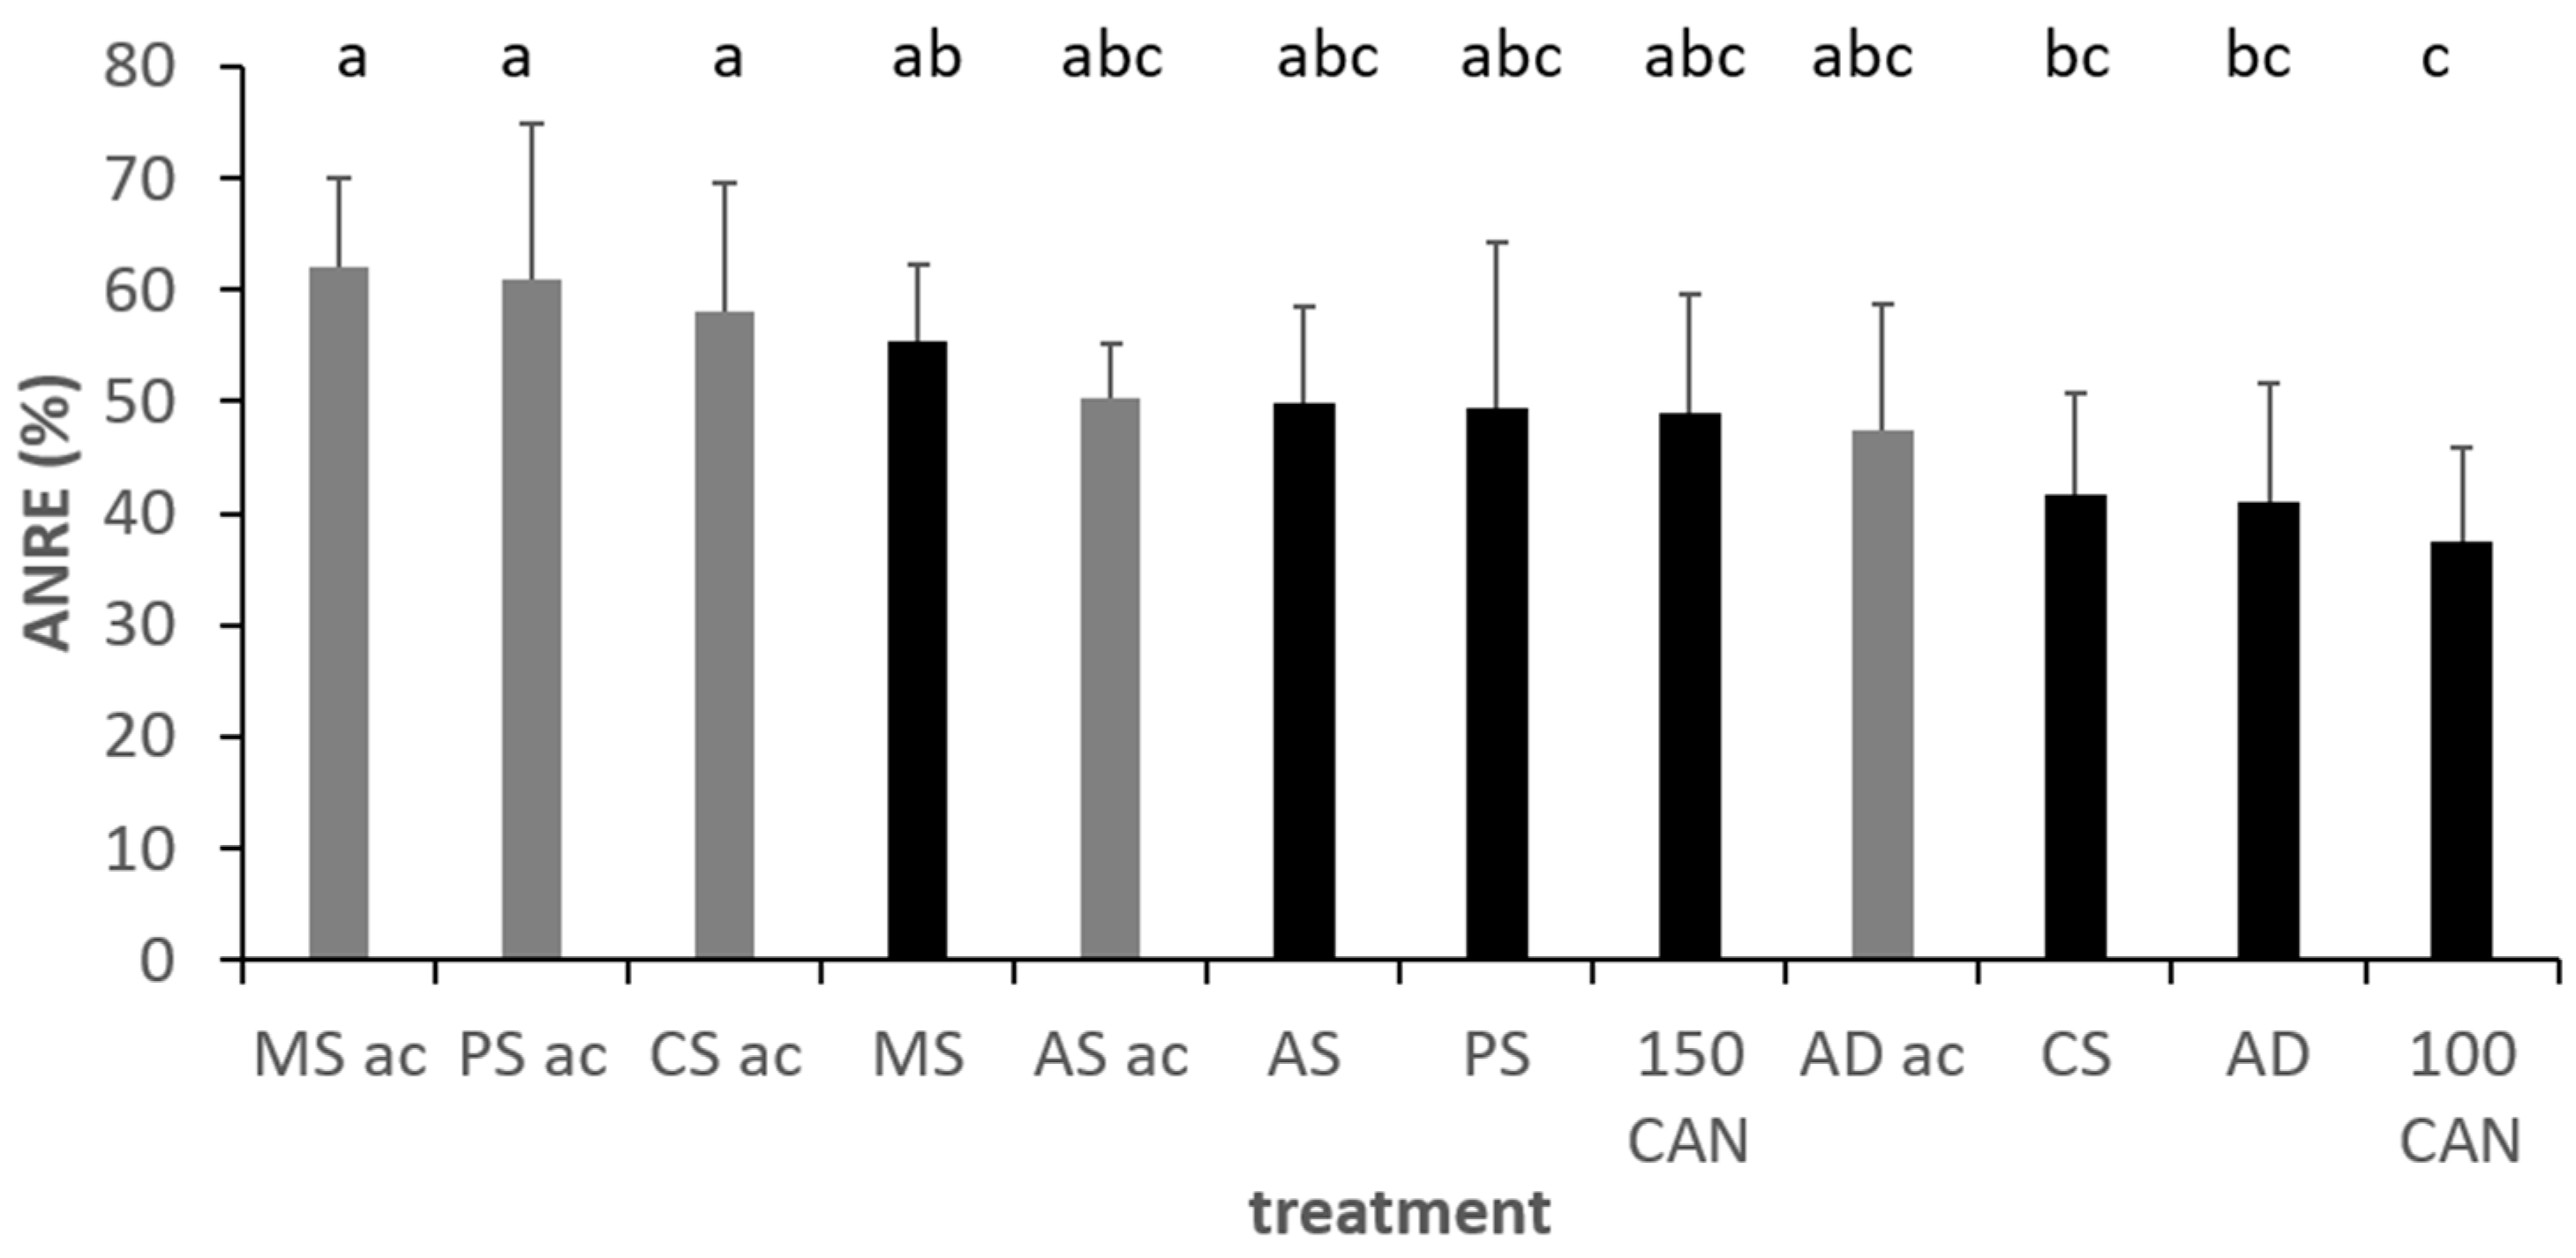
| ANRE (%) | tec: ns acid: * | ac+: a (+9%) acid−: b | tec: * | th: b inc: ab inj: a |
| Ntot (kg N/ha) | tec ns acid * | ac+: a (+10%) ac−: b | tec: * | th: b inc: ab inj: a |
| Protein (%) | tec: ns acid: ns | tec: * | th: b inc: ab inj: a | |
| Data source | Slurry treatments with + and − acid (injection excluded) | Application methods without acid treatment | ||
| Model: lme (y~fert × acid × date, Random = ~1|Block) | ||
|---|---|---|
| Variable | Main Effects | Factors § (Post hoc Test) |
| Grain yield (t/ha) | fert: ns acid: ns date: * | date: early: b, late: a |
| Ngrain (kg N/ha) | fert: * acid: * date: * fert:acid: * date:fert: * | fert: M: a, P: ab, AS: abc, C: bc, A:c acid: +:a (+9%), −:b date: early: b, late: a |
| ANRE (%) | fert: * acid: * date: ns | fert: M: a, P: a, AS: ab, C: ab, A:b acid: +:a (+17%), −:b |
| Ntot (kg N/ha) | fert: * acid: * date: ns | fert: M: a, P: a, AS: ab, C: ab, A:b acid: +:a (+9%), −:b |
| Protein (%) | fert: * acid: * date: * | fert: P: a, M: ab, C: ab, A: b, AS:b acid: +:a (7%), −:b date: early: b, late: a |
| data: slurry treatments | ||
Publisher’s Note: MDPI stays neutral with regard to jurisdictional claims in published maps and institutional affiliations. |
© 2021 by the authors. Licensee MDPI, Basel, Switzerland. This article is an open access article distributed under the terms and conditions of the Creative Commons Attribution (CC BY) license (https://creativecommons.org/licenses/by/4.0/).
Share and Cite
Wagner, C.; Nyord, T.; Vestergaard, A.V.; Hafner, S.D.; Pacholski, A.S. Acidification Effects on In Situ Ammonia Emissions and Cereal Yields Depending on Slurry Type and Application Method. Agriculture 2021, 11, 1053. https://doi.org/10.3390/agriculture11111053
Wagner C, Nyord T, Vestergaard AV, Hafner SD, Pacholski AS. Acidification Effects on In Situ Ammonia Emissions and Cereal Yields Depending on Slurry Type and Application Method. Agriculture. 2021; 11(11):1053. https://doi.org/10.3390/agriculture11111053
Chicago/Turabian StyleWagner, Christian, Tavs Nyord, Annette Vibeke Vestergaard, Sasha Daniel Hafner, and Andreas Siegfried Pacholski. 2021. "Acidification Effects on In Situ Ammonia Emissions and Cereal Yields Depending on Slurry Type and Application Method" Agriculture 11, no. 11: 1053. https://doi.org/10.3390/agriculture11111053
APA StyleWagner, C., Nyord, T., Vestergaard, A. V., Hafner, S. D., & Pacholski, A. S. (2021). Acidification Effects on In Situ Ammonia Emissions and Cereal Yields Depending on Slurry Type and Application Method. Agriculture, 11(11), 1053. https://doi.org/10.3390/agriculture11111053