Article

Growth and Energy Use Efficiency of Grafted Tomato Transplants as Affected by LED Light Quality and Photon Flux Density

1
Key Laboratory of Agricultural Engineering in Structure and Environment, Ministry of Agriculture and Rural Affairs, China Agricultural University, Beijing 100083, China
2
Beijing Lighting Valley Technology Company, Beijing 100083, China
*
Author to whom correspondence should be addressed.
Agriculture 2021, 11(9), 816; https://doi.org/10.3390/agriculture11090816
Submission received: 19 July 2021 / Revised: 23 August 2021 / Accepted: 24 August 2021 / Published: 27 August 2021
(This article belongs to the Special Issue Impact of Light on Horticultural Crops)

Abstract

:
This study was conducted to compare the effects of broad spectrum during the whole seedling period and photon flux density (PFD) in the healing stage on the growth and energy use efficiency of grafted tomato (Lycopersicon esculentum Mill.) transplants in a plant factory. Fluorescent lights, white LED lights, and white plus red LED lights were applied at the growth processes of grafted tomato transplants from germination of rootstock and scion to post-grafting. Three levels of PFD (50, 100, 150 μmol m−2 s−1) were set in the healing stage under each kind of light quality. The results indicated that the growth and quality of grafted tomato transplants under different broad spectrums were influenced by the ratio of red to blue light (R/B ratio) and the ratio of red to far-red light (R/FR ratio). A higher R/B ratio was beneficial to total dry matter accumulation, but excessive red light had a negative effect on the root to shoot ratio and the seedling quality index. The higher blue light and R/FR ratio suppressed stem extension synergistically. The LED lights had good abilities to promote plant compactness and leaf thickness in comparison with fluorescent lights. The plant compactness and leaf thickness increased with the increase in daily light integral in the healing stage within a range from 2.5 to 7.5 mol m−2 d−1 (PFD, 50 to 150 μmol m−2 s−1). Compared to fluorescent lights, the LED lights showed more than 110% electrical energy saving for lighting during the whole seedling period. Higher PFD in the healing stage did not significantly increase the consumption of electric power for lighting. White plus red LED lights with an R/B ratio of 1.2 and R/FR ratio of 16 were suggested to replace fluorescent lights for grafted tomato transplants production considering the high quality of transplants and electrical energy saving, and PFD in the healing stage was recommended to be set to 150 μmol m−2 s−1.

1. Introduction

Grafted tomato (Lycopersicon esculentum Mill.) transplants are the optimal combination of rootstock and scion with desirable production traits. They usually have the advantages of tolerance to soil-borne diseases and abiotic stresses, promotion of plant vigor, yield increases, and so on, compared to non-grafted ones [1]. The percentage of tomato cultivation area with grafted transplants has increased to 75% in the Netherlands, 50% in France, 40% in Japan, and 25% in Korea [2]. Although the proportion of tomato grafting is only around 1%, China is the country with the largest grafted tomato cultivation area of more than 20 thousand hectares [3].
The grafted tomato transplant production usually starts with the raising of rootstock and scion plantlets, followed with grafting and healing, and ends with the acclimation [1]. The management of light, temperature, and relative humidity during healing is very important for the survival and vigorous growth of tomato grafted transplants. Therefore, the professional nurseries usually utilize healing chambers to provide a controlled environment for the healing of grafted transplants [4]. Many studies have focused on environment optimization in the healing stage for grafted transplants production in the greenhouse [5,6,7]. It is noteworthy that grafted tomato transplants have been commercially produced in the plant factory with artificial lighting (PFAL) for the advantages of high-quality, pesticide-free, and annual production [8]. In comparison with the traditional production methods, production in PFAL is different in the preparation of rootstock and scion plantlets. To ensure the high-quality and pesticide-free production of transplants and stability of production, all the growth processes of grafted tomato transplants from sowing to post-grafting are in a fully controlled environment with artificial lighting. Generally, lighting accounts for 70%–80% of the total electricity consumption in a PFAL and greatly affects the growth and development of transplants [9]. It is meaningful to optimize the lighting environment during the whole seeding period to promote the growth of grafted tomatoes and reduce the electric consumption of lighting.
Recently, power-efficient and narrow-spectrum LED lights have been gradually replacing the fluorescent lights as the light sources in PFALs [10]. The chlorophyll absorption spectra were often used as the theoretical support for the design of horticultural commercial LED fixtures made by a combination of red and blue LEDs. However, the efficiency of red plus blue LED lights for plants is doubtful [11]. For a living plant, the pigments in vivo can absorb light with wavelengths from 400 nm to 700 nm and transfer the excitation energy to chlorophyll a for photoreaction [12]. Green light can be used for photosynthesis quite efficiently compared to blue light according to the relative quantum yield curve determined by McCree [13]. Kim et al. [14] reported that the growth of lettuce under red and blue LEDs was highly enhanced by an addition of 24% green lights, while the total photon flux density (PFD) and the ratio of red to blue light (R/B ratio) remained unchanged. The leaves can acclimate their photosystem composition to their growth light spectrum and quantum yields can be enhanced substantially under combined different wavelengths [15]. It has been proved that the phosphor-conversion white LEDs with continuous broad spectrum have great potential to promote high yields and energy-saving in PFALs compared to fluorescent lights and red and blue LED lights [16].
However, one thing to consider is that the common phosphor-based white LEDs that are widely used in architectural lighting applications [17] usually have a relative deficiency of red light in the spectrum considering the high use efficiency of red light for plants. One solution for the lack of red light in the spectrum of white LEDs is adding red LEDs to the white LED lights. The white LED light with additional red light emitted a more promising spectrum for increasing photosynthesis and energy efficiency of Chinese cabbage, lettuce, pepper, and tomato [18,19]. The quality of grafted tomato transplants was significantly promoted by supplementing lighting with white plus red plus blue LED lights compared to white LED lights in greenhouses [20].
The main aim of the present study is to compare the effects of the broad spectrum emitted by fluorescent lights, white LED lights, and white plus red LED lights during the whole seedling period on the growth and energy use efficiency of grafted tomato transplants in a PFAL. Considering that PFD in the healing stage affects the growth and quality of grafted transplants [21,22], three levels of PFD were set in the healing stage of grafted tomato transplants grown under each light quality to investigate the possible interactive effects of light quality and PFD. The results are expected to provide suggestions on replacing fluorescent lights with white LED lights for grafted tomato transplants production in a PFAL.

2. Materials and Methods

2.1. Plant Materials and Growth Conditions

The experiment was conducted in a walk-in growth chamber equipped with an automatic environmental control system, the internal size of which is 2.8 m long, 2.9 m wide, and 2.4 m high (Figure 1). The tomatoes (Lycopersicon esculentum Mill.) “Zhezhan No.1” and “Dongfeng No.1” (Jinan Weili Seeds Co., Ltd., Jinan, China) were used as rootstock and scion, respectively. Rootstock seeds were sown 2 days after sowing scion seeds, in 72-cell and 128-cell plug trays filled with a mixture of vermiculite and perlite (3:1, v/v), respectively. The scion and rootstock seeds germinated 4 days after sowing the scion in the dark with a temperature of 28 °C ± 1 °C and relative humidity of 75% ± 8%.
A total of 20 days after sowing the scion, the stem diameter of rootstock and scion was in the range between 2.0 mm and 3.0 mm. The grafting process was carried out manually by experienced workers using the cleft grafting method [2]. Air temperature in the growth chamber was maintained at 25 °C ± 1 °C and 20 °C ± 1 °C in photoperiod and dark period, respectively, and relative humidity was always controlled at 90% ± 5% within 7 days after grafting (in the healing stage). At pre-grafting and post-healing stage, air temperature and relative humidity in the growth chamber were maintained at 24 °C ± 1 °C and 60% ± 5%, respectively, in the light period, and 20 °C ± 1 °C and 65% ± 5%, respectively, in the dark period. During the whole seedling stage, the CO2 concentration was maintained at 800 ± 50 μmol mol−1 in photoperiod and no control in the dark period.
During the experiment, the tomato transplants were fully sub-irrigated every two or three days with the nutrient solution, which was prepared using purified water based on the Japanese horticultural formula (mg L−1): KNO3, 808; Ca(NO3)2·4H2O, 944; MgSO4·7H2O, 492; NH4H2PO4, 153; DTPA-Fe-7, 42.9; H3BO3, 2.82; MnSO4·H2O, 1.54; CuSO4·5H2O, 0.08; ZnSO4·7H2O, 0.22; (NH4)6Mo7O24·4H2O, 0.03, respectively. One-third strength of standard nutrient solution was used after seed germination. One-half strength of standard nutrient solution was used after cotyledon unfolding. Full strength of standard nutrient solution was used after first true leaf unfolding, until to the end of experiment. The pH of nutrient solution was controlled at 6.0–6.5 during the experiment.

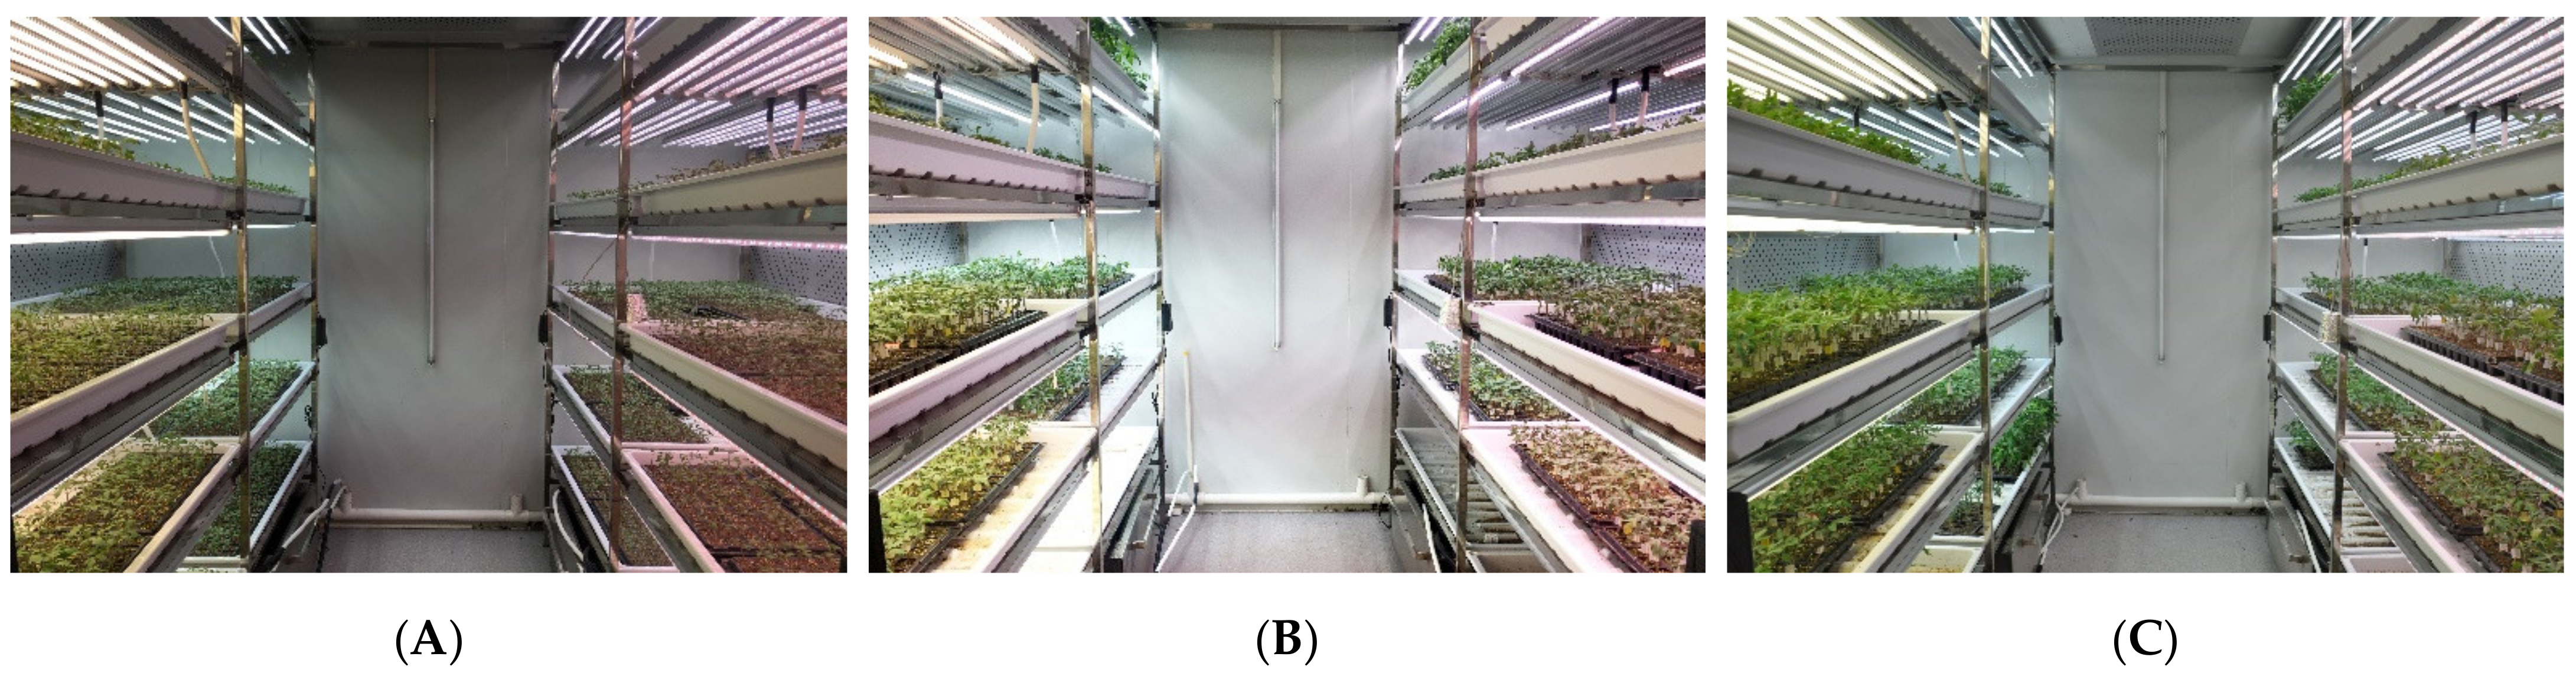
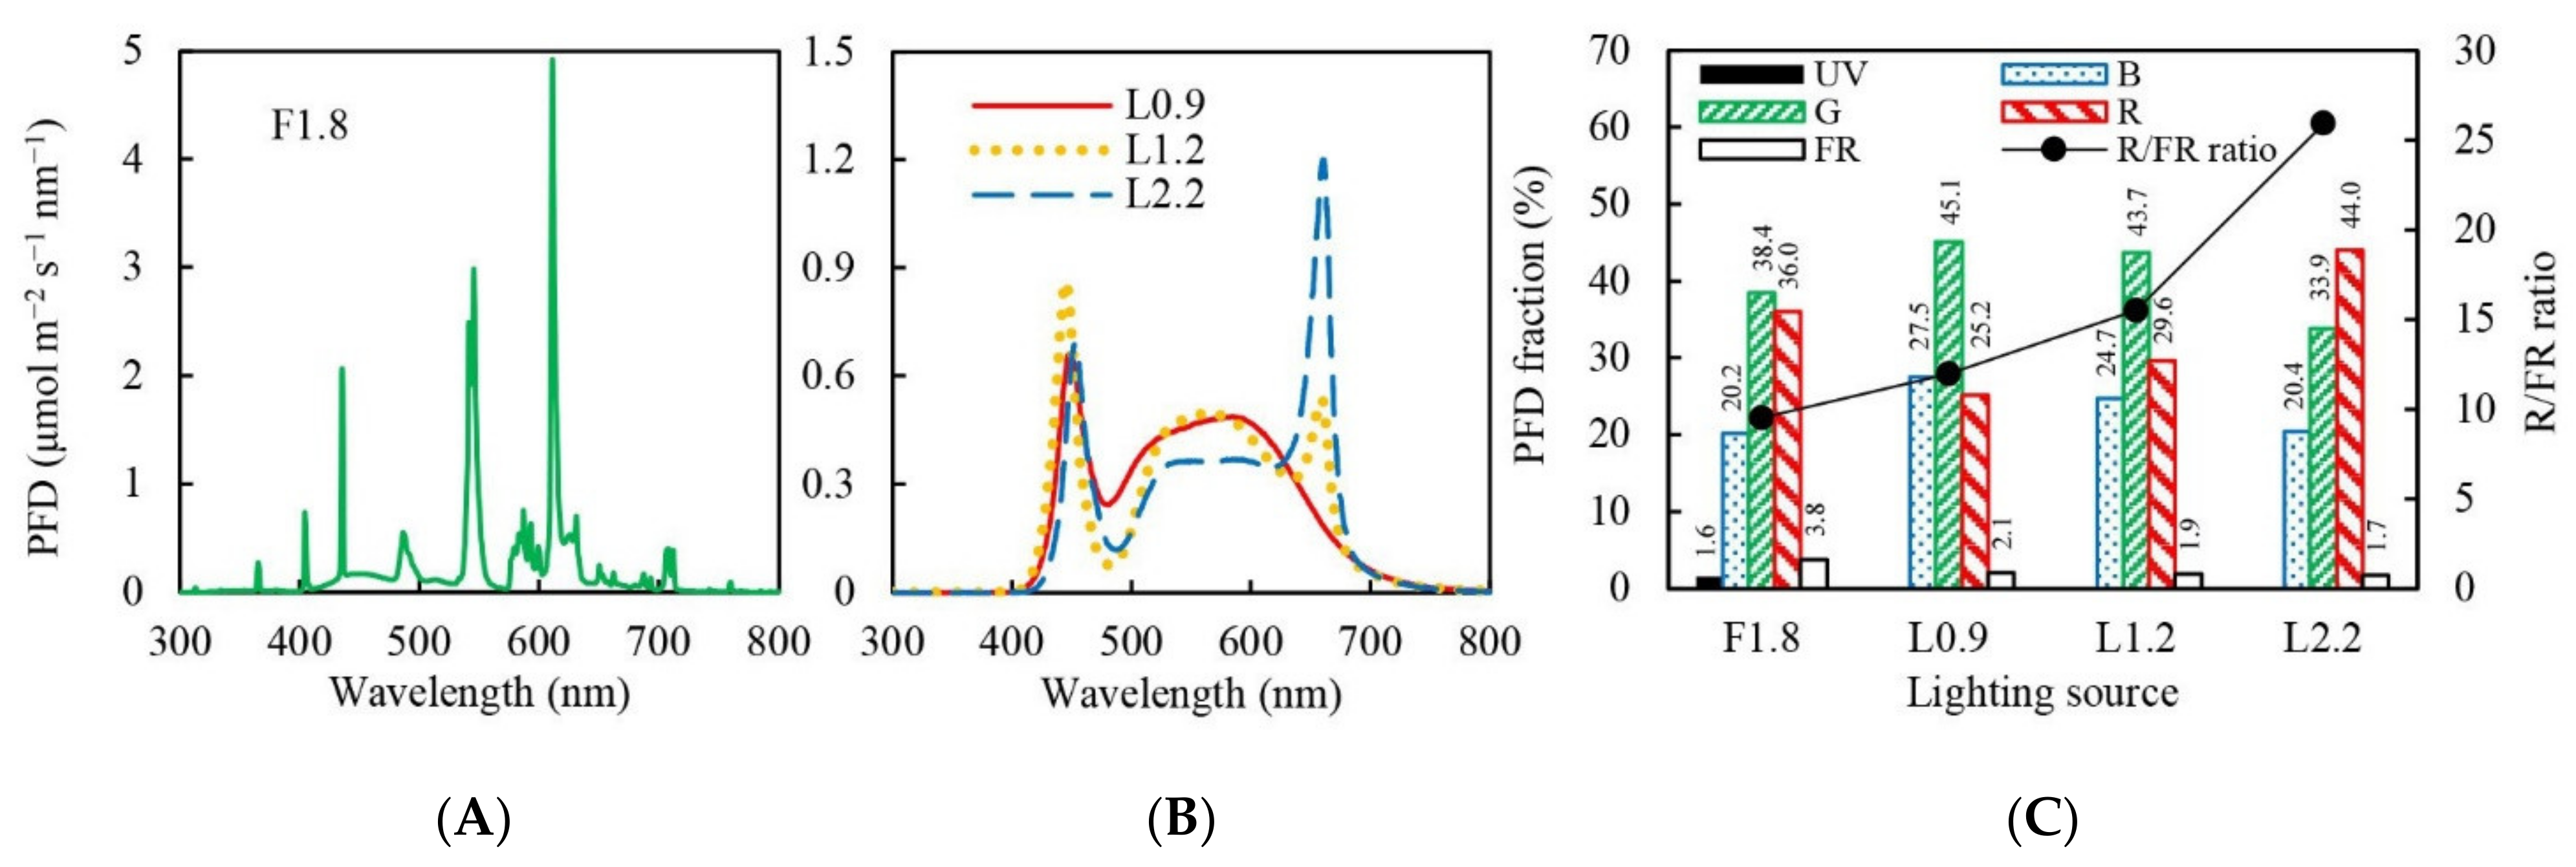
2.2. Lighting Treatments

Three kinds of tubular LED lighting fixtures (W-LED-16W, WR-LED5/1-16W, WR-LED5/3-16W, Beijing Lighting Valley Technology Co., Beijing, China) were used for lighting treatments (Table 1). They were white LED light with R:B ratio of 0.9 (L0.9), white plus red LED light with white and red chips in number ratio 5:1 and R:B ratio of 1.2 (L1.2), white plus red LED light with white and red chips in number ratio 5:3 and R:B ratio of 2.2 (L2.2), respectively. Each light is 1.2 m long and has 120 chips arranged linearly with a spacing of 1 cm. All the white LED chips had a color temperature of 6500 K, and red chips had a peak at 660 nm. One kind of tri-phosphor fluorescent light (Shanghai Nonghui Biotechnology Corp., Shanghai, China) in a color temperature of 4200 K with R:B ratio of 1.8 (F1.8) was used as a control. The spectral distributions of PFD emitted by four lighting sources across the 300–800 nm wavelength were measured at 15 cm below the lights using a fiber spectrometer (AvaSpec-ULS2048, Avantes Inc., Apeldoorn, The Netherlands) (Figure 2). The photon flux fraction of ultraviolet light (300–399 nm), blue light (400–499 nm), green light (500–599 nm), red light (600–699 nm), and far-red light (700–800 nm) were calculated for light quality analysis. Lighting treatments using four kinds of lights lasted 15 days after germination of rootstock and scion with the PFD of 250 μmol m−2 s−1 and photoperiod of 14 h d−1. On grafting day, all the lights were turned off to provide a dark environment for grafted seedlings. On the second day after grafting, the PFD was set to three levels, namely 50, 100, 150 μmol m−2 s−1, under each lighting source for 6 days until the healing stage was over. At post-healing stage, the PFD was set back to 250 μmol m−2 s−1 for 3 days. Different levels of PFD were achieved by changing the number and horizontal position of lights. Each lighting treatment included 24 plants and three replicates.

2.3. Measurements and Calculations

At ten days after grafting, the general destructive measurements were carried out to determine the transplant characteristics. Six plants were randomly selected to measure in each treatment. Plant height (PH, cm) was measured from the substrate surface to the growing point of stem apex using a ruler. Stem diameters (SD, mm) were measured 1 cm above and below the joint using a vernier caliper, and the average value of them was used. All unfolded true leaves were counted as the leaf number, and the total leaf area was calculated according to the pixel value of the leaf image taken by a scanner (LiDE 110, Canon (China) Co., Ltd., Shenzhen, China). The fresh leaves, stems and root were weighed separately, then they were dried for 72 h in a drying oven at 80 °C, and the dry matter of leaves, stems and root were measured, respectively.
The root to shoot (R/S) ratio was the ratio of root dry matter (RDM) and shoot dry matter (SDM). The seedling quality index (SQI) was calculated as TDM/(PH/SD + SDM/RDM) [23], where TDM was a total dry matter in grams, and PH and SD are in centimeters and millimeters, respectively. The plant compactness was defined as SDM/PH. The specific leaf area (SLA) was the ratio of total leaf area per plant to total leaf dry matter per plant [24].
The net photosynthetic rate (Pn) of tomato leaf was measured using a portable photosynthesis system (LI-6400XT, LI-COR Biosciences Inc., Lincoln, NE, USA) equipped with a 6400-02B leaf chamber, in which PFD, air temperature, and CO2 concentration were set at 250 µmol m−2 s−1, 25 °C, and 800 µmol mol−1, respectively. The potential maximum quantum yield of primary PSII photochemistry (Fv/Fm) of the tomato leaf was measured using a multi-function plant efficiency analyzer (M-PEA, Hansatech Instruments Ltd., Norfolk, UK) after dark-adaptation for 30 min.
The fresh leaf tissue in approximately 70.0 mg (W) of each transplant was extracted in 80% (v/v) acetone for 48 h in the dark. The total volume of extract solution is 10 mL. The absorbance of the solution at 663 nm (A663), 646 nm (A646) and 470 nm (A470) were measured by a spectrophotometer (UV-3150, Shimadzu Corporation, Kyoto, Japan). Chlorophyll a, chlorophyll b and total carotenoids content (mg g−1) were calculated as (122.5A663 − 27.9A646)/W, (215.0A646 − 51.0A663)/W and (50.5A470 + 20.8A663 − 92.1A646)/W, respectively [25].
The light energy use efficiency of the plant community (LUEp) and electrical energy use efficiency of lighting (EUEL) were calculated by f·D/PARp and f·D/AL, respectively [26]. f is the conversion factor from dry mass to chemical energy fixed in dry matter (about 20 MJ kg−1); D is the average dry matter increase rate of grafted tomato plants during the whole seedling period (kg m−2 h−1); PARP is average photosynthetically active radiation received at the plant community surface (MJ m−2 h−1); AL is electrical energy consumed by lights, which is measured by a power monitor (T8006, Shenzhen BeiDian Instrument Co., Shenzhen, China).

2.4. Data Statistics and Analysis

A two-way analysis of variance (ANOVA) was conducted to test the effects of light quality and PFD on plant growth and energy use efficiency using IBM SPSS Statistics 23 (IBM, Inc., Chicago, IL, USA). Duncan’s test was used to make post-hoc multiple comparisons at α = 0.05 level (n = 6). For the data in figures, means were separated across the four kinds of light quality and three levels of PFD, respectively, if there was no interaction between light quality and PFD.

3. Results

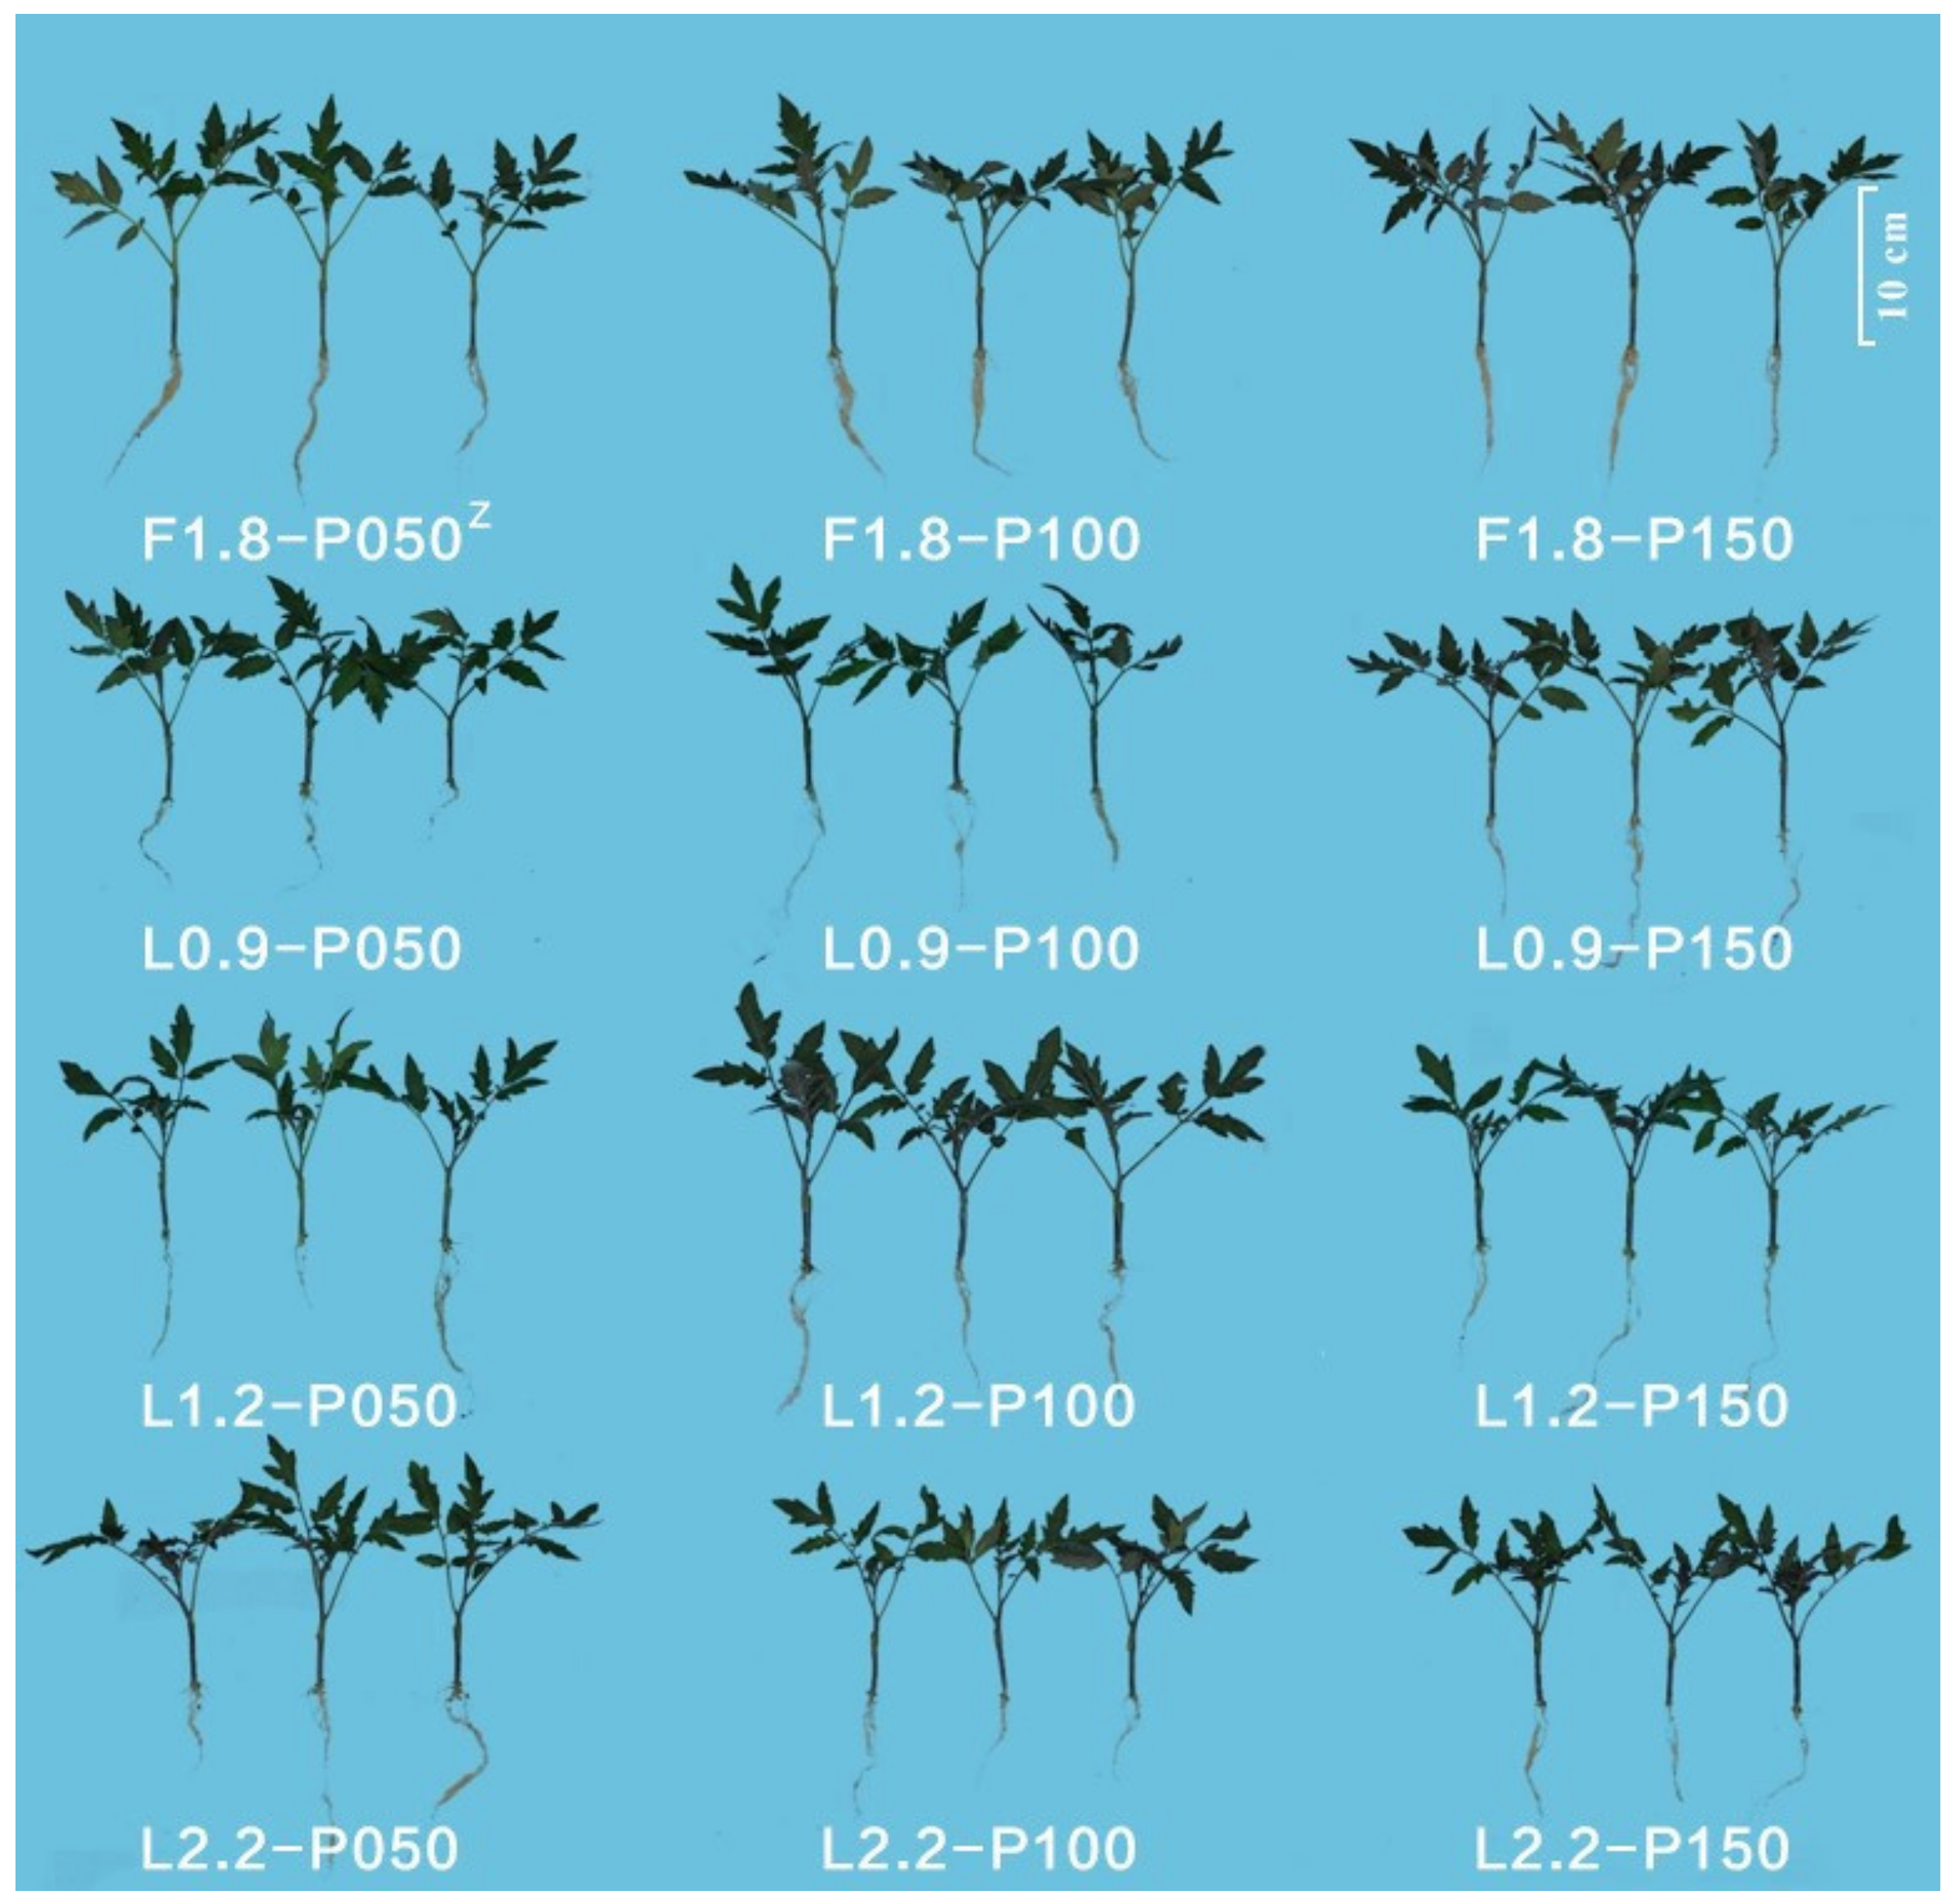
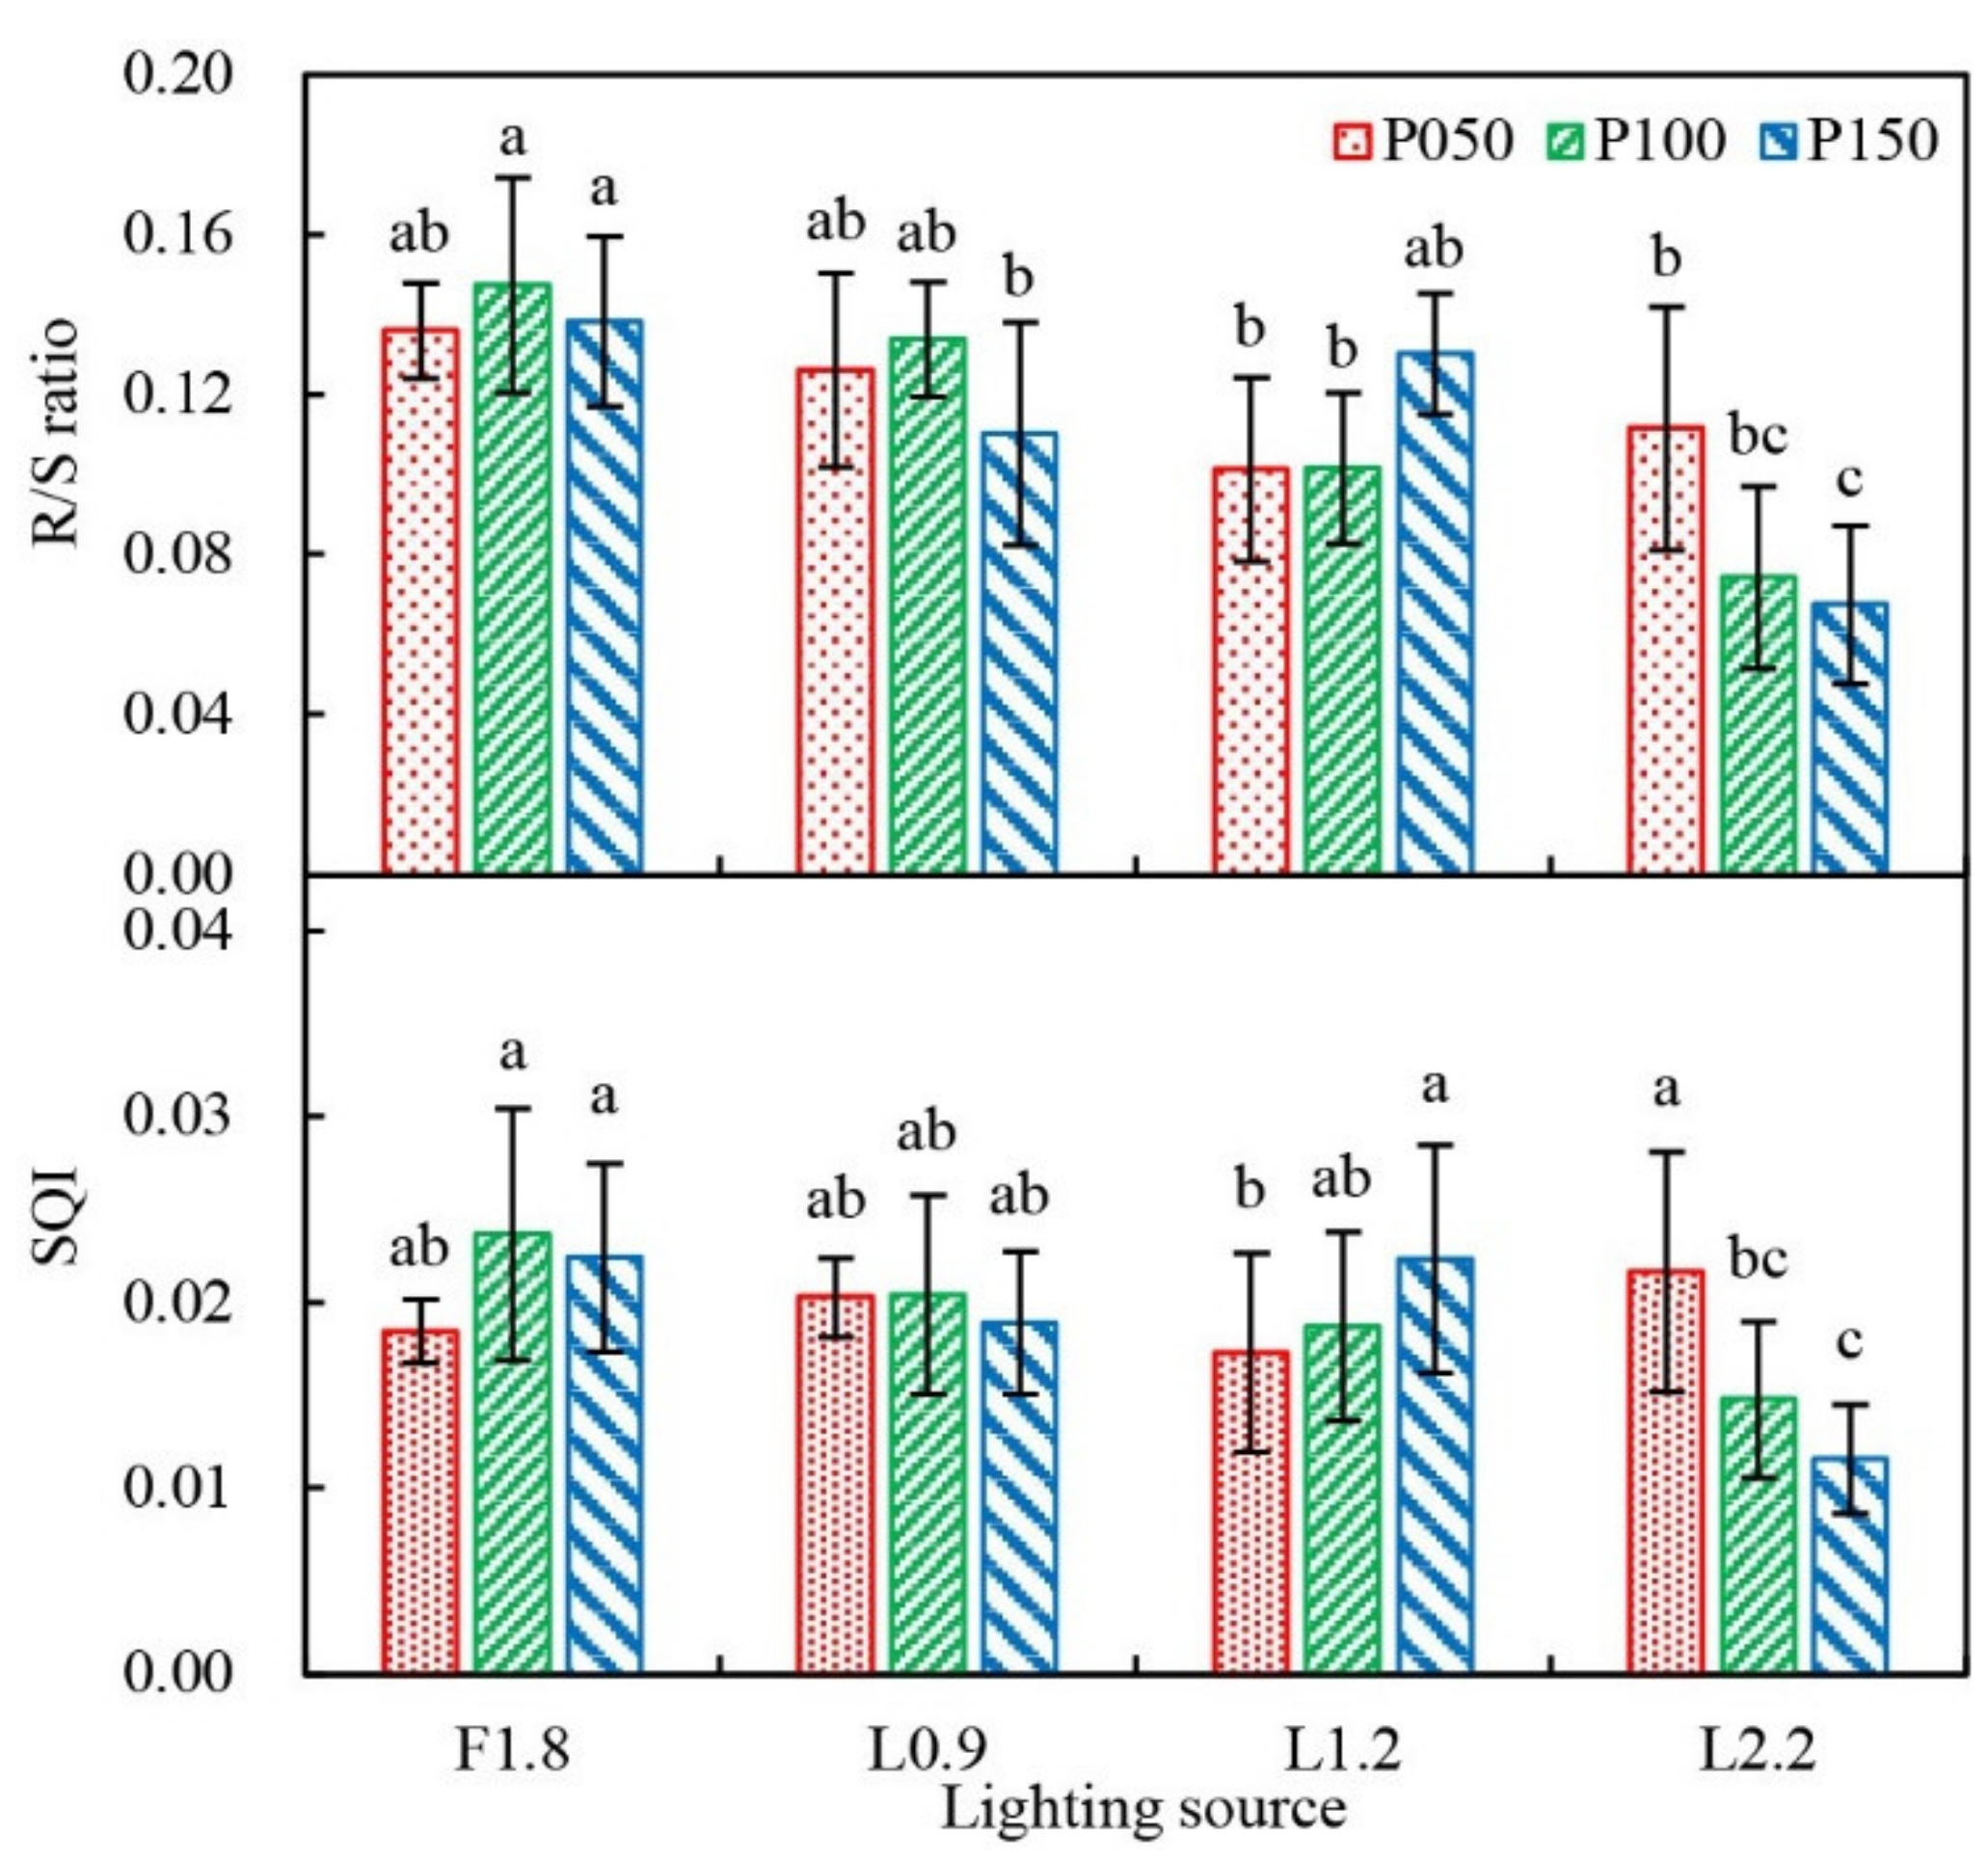
3.1. Growth Characteristics of Grafted Tomato Transplants

The morphology of grafted tomato transplants affected by light quality during the whole seedling period and PFD in the healing stage are shown in Figure 3. The PFD in the healing stage had interactive effects with light quality on plant height and Pn (Table 2). The height of grafted tomato transplants under F1.8-P100 was at the highest level, and that under L1.2-P100 was at the lowest level. Compared to F1.8-P100, the plant height under L1.2-P100 was 30% lower. The highest Pn of 14.1 μmol m−2 s−1 was observed on the transplants grown under F1.8-P150 and L1.2-P100, and the lowest Pn of 10.9 μmol m−2 s−1 was found on the transplants grown under L2.2-P50 and L2.2-P150. There were no interactive effects of light quality and PFD on the stem diameter, leaf number, leaf area, and TDM. The stem diameter was not affected by light quality during the whole seedling period. The PFD of 50 μmol m−2 s−1 in the healing stage resulted in the smallest stem diameters under F1.8 and L1.2. The leaf number and leaf area were not affected by PFD in the healing stage. The highest leaf number and leaf area were observed under F1.8. The TDM was affected by light quality and PFD. It was the highest under L2.2, and there were no significant differences under F1.8, L0.9, and L1.2. The PFD of 50 μmol m−2 s−1 in the healing stage led to the lowest TDM. There were no significant differences of TDM under 100 and 150 μmol m−2 s−1 in the healing stage.
No interactive effects of light quality and PFD were found on the Fv/Fm, ratio of chlorophyll a to chlorophyll b (chl a/b) and ratio of total chlorophylls to total carotenoids ((a + b)/(x + c)) (Figure 4). Fv/Fm of grafted tomato transplants grown under different light sources ranged from 0.811 to 0.822, not affected by PFD in the healing stage. The highest value of Fv/Fm 0.822 was observed on the transplants grown under L0.9, and the lowest value of Fv/Fm 0.811 was found on the transplants grown under L2.2. The PFD in the healing stage had no effects on the composition of photosynthetic pigments. Although there were statistical differences in chl a/b and (a + b)/(x + c) under different light quality, the chl a/b and (a + b)/(x + c) just varied within the range of 3.33 to 3.45 and 4.70 to 5.11, respectively. Moreover, the lowest values of chl a/b and (a + b)/(x + c) both emerged under L2.2.
There were no interactive effects of light quality and PFD on parameters of compactness and SLA (Figure 5). Compared to fluorescent lights, the LED lights led to higher compactness and lower SLA. The addition of red light to white LED lights significantly improved the compactness and reduced the SLA. However, no significant differences in compactness and SLA were found under two kinds of white plus red LED lights. The compactness increased linearly with an increase in daily light integral (DLI) in the healing stage at the range of 2.5 to 7.5 mol m−2 d−1. SLA decreased with the increase in DLI, responding in an opposite manner to compactness. Interactive effects of light quality and PFD were observed on the R/S ratio and SQI (Figure 6). There were no significant differences in R/S ratio between different PFD under F1.8 and L0.9 light quality. However, the R/S ratio had an increasing and decreasing trend, respectively, with the increase in PFD under L1.2 and L2.2 light quality. The SOI had a similar response as the R/S ratio to light quality and PFD. The R/S ratio and SQI of grafted tomato transplants under L1.2-P150 were both at comparable levels compared to that under F1.8.

3.2. Energy Use Efficiency

There were no interactive effects on LUEP and EUEL between light quality during the whole seedling period and PFD in the healing stage (Figure 7). The LUEP and EUEL were both affected by light quality during the whole seedling period but not affected by PFD in the healing stage. Compared to F1.8, the LUEp of grafted tomato transplants under L0.9 and L1.2 were both at the same level, and that under L2.2 increased by 19% with the highest value of 0.025. There were no significant differences in EUE of grafted tomato transplants grown under L0.9, L1.2 and L2.2, which improved by 123%, 126%, and 110%, respectively, compared to that under F1.8 with the lowest value of 0.0031.

4. Discussion

4.1. Growth of Grafted Tomato Transplants as Affected by Light Quality and PFD

Light quality is an essential factor for plant growth and development. Tubular fluorescent lights have been used as lighting sources for transplant production in commercialized PFALs since 2002 for their balanced spectrum and high efficiency [27]. Many studies aiming to optimize LED lighting for plant production in PFALs usually set fluorescent lights as the control in experiments [6,28,29]. They are willing to accept LED lights as lighting sources when the growth and quality of plants are comparable or better under LED lights in comparison with fluorescent lights considering the huge energy-saving advantages. In this study, high-quality transplants were evaluated according to the suggestions of Lee et al. [2] that they should have a proper size with healthy thick leaves and well-developed root systems, free from environmental stress during the growth stage. To understand the relationship between spectrum and growth and quality of grafted tomato transplants, integrated values of blue (400–499 nm), green (500–599 nm), red (600–699 nm), and far-red (700–800 nm) PFD in different lighting environments were used for discussion.
In the current study, light quality during the whole seeding period and PFD in the healing stage affected the TDM independently. Hernández et al. [29] compared the physiological responses of tomato seedlings to different R/B ratios using a combination of monochromatic blue LED and red LED, and found that R/B ratios in the range 1.0–2.3 were best for tomato seedling production in a PFAL, considering the higher dry matter accumulation. The R/B ratio of lights used in this study ranged from 0.9 to 2.2, similar to the ratio range mentioned above. Our results showed that there were no significant differences in TDM under an R/B ratio of 0.9–1.8, but a 14.2% increase in TDM was observed under an R/B ratio of 2.2. It seemed to indicate that grafted tomato transplants grown under L2.2 had the highest quantum yield for CO2 fixation. However, it cannot be explained by the Pn of grafted tomato transplants for the reason that it decreased significantly under L2.2, especially under PFD of 50 and 100 μmol m−2 s−1 in the healing stage. Correspondingly, a slight decrease in Fv/Fm was also found under L2.2. It has been reported that red light alone led to a lower Fv/Fm value but higher TDM on lettuces [30]. Hernández et al. [29] also observed a similar response on non-grafted tomato seedlings. A similar phenomenon was also reported by Bantis et al. [6], who found that grafted watermelon seedlings treated by a higher R/B ratio in the healing stage had a higher TDM but showed a lower Pn and Fv/Fm value. Hernández et al. [29] explained that this phenomenon was caused by the different light intersections due to different leaf areas and leaf numbers. However, the leaf area and leaf number under L2.2 were not significantly higher than those under other treatments in this study.
The photosynthetic quantum yield of leaves is wavelength-dependent, and the leaves can acclimate their photosystem composition to their growth light spectrum [15]. Adaptation to different light environment is usually characterized by the adjusted composition of photosynthetic pigments and various Chl fluorescences in the leaf [31]. In this study, Fv/Fm of grafted tomato transplants grown under different light sources ranged from 0.811 to 0.822. It indicated that the grafted tomato transplants under different lighting environments did not suffer from obvious environmental stress [32]. The chl a/b and (a + b)/(x + c) showed a mildly decreased value under L2.2, similar to Fv/Fm. These results showed that the leaves of grafted tomato transplants acclimated their photosystem to adapt to the higher red lights of L2.2 by increasing chlorophyll b and total carotenoids fraction to resist possible photoinhibition. In this study and that conducted by Bantis et al. [6], the Pn of plants grown under different light qualities was measured under the same lighting environment provided by red and blue LED built in the leaf chamber; the measured Pn cannot represent the real Pn during the growth period, since the leaves have adapted to their growth light spectrum. The Pn measured under the growth light spectrum may be a good indicator to explain the response of TDM. McCree [33] reported that effects of light of different wavelengths could be treated as independent and additive and that the relative photosynthetic rate of a leaf under white light could be roughly calculated as the sum of the products of action spectrum by the spectral energy flux distribution of the white light, which is also known as yield photon flux of lighting. Based on this method and action spectrum of tomato leaf measured by McCree [13], the yield photon flux of F1.8, L0.9, L1.2, and L2.2 can be estimated as 9.5, 9.4, 9.6, and 10.0 (relative value), respectively, which could explain the TDM response in this study.
It is necessary to prevent excessive elongation of stem for tomato transplant production in high planting densities. Wollaeger and Runkle [34] reported that tomato transplants grown under blue light alone or in combination with red reduced the height compared to that under pure red light and red plus green light. The effect of blue light on plant height was highly species-dependent [35]. Tomato was classified as the blue-inhibition type according to the stem elongation in response to monochromatic light [28]. In the current study, the grafted tomato transplants under L0.9 and L1.2 had a lower height than those under F1.8 and L2.2. It was a result of a higher fraction of blue light in L0.9 and L1.2. However, F1.8 showed a significant promotion effect on plant height compared to L2.2, although they had the same dose of blue light. This phenomenon may be caused by a lower ratio of red to far-red light (R/FR ratio) of F1.8 compared to L2.2, since the low R/FR ratio can induce the shade-avoidance response [36]. There were shreds of evidence that the high R/FR ratio and blue light could suppress stem extension synergistically; in other words, the full expression of shade avoidance required both low R/FR and reduced blue light [6,29,37]. What’s more, the higher fraction of green light of F1.8 might be another reason for the taller height. Green light can also induce the shade-avoidance response and promote the elongation of the stem [38,39]. This study indicated that the white plus red LED light of L1.2 with an R/B ratio of 1.2 and an R/FR ratio of 16 had a good ability of synergistically reducing shade-avoidance response for grafted tomato transplants.
In this study, LED lights showed good abilities to promote the compactness of grafted tomato transplants compared to fluorescent lights. The compactness of grafted tomato transplants was improved by a higher R/B ratio under LED lighting, but no significant differences were found between R/B ratios of 1.2 and 2.2. Excessive addition of red light to white LED light did not have a positive effect on improving transplant compactness. Similar results were also observed on grafted watermelon transplants: the plant compactness was not further promoted by a higher R/B ratio as the red-light fraction was over 64% under red plus blue LED lighting [6]. However, these results were not supported by Hernández et al. [29], who reported that the compactness of non-grafted tomato transplants was promoted by a higher fraction of blue light under red plus blue LED lighting, and no significant differences were observed when blue-light fraction was over 50%. This difference was caused by the different responses of SDM and plant height to R/B ratio. The SLA is the leaf area per unit of dry matter, and the lower SLA indicates a thicker leaf [24]. It was reported that a higher R/FR ratio led to the thicker leaves of tropical tree seedlings [40]. In this study, the far-red fraction of fluorescent light was two times that of LED light; therefore, it led to the lowest SLA. The grafted tomato transplants grown under L1.2 and L2.2 had the thickest leaves.
The healing process after grafting was influenced by PFD in the healing stage. Vu et al. [41] reported that grafted tomato seedlings under red light in approximately 15 μmol m−2 s−1 in the healing stage were significantly more compact than those in dark. The compactness and SLA had obvious responses to DLI in the healing stage in this study. Within the range of 2.5 to 7.5 mol m−2 d−1 in the healing stage, the compactness increased, and SLA decreased proportionally with the increase in DLI. This result agreed with the results of Jang et al. [21] who reported that the SLA of grafted cucumber seedlings decreased as DLI in the healing stage increased from 0 to 10.2 mol m−2 d−1. Hu et al. [22] also reported that compactness and SLA of grafted tomato transplants increased and decreased, respectively, as DLI in the healing stage increased from 2.2 to 6.5 mol m−2 d−1. Moreover, the compactness and SLA of grafted watermelon transplants also had similar responses to increasing supplemental DLI of 0–5.8 mol m−2 d−1 in greenhouses [42]. Our results indicated that high DLI in the healing stage was beneficial to the formation of compact plant shape. The provision of the PFD of 150 μmol m−2 s−1 is recommended at the healing stage.
A higher R/S ratio indicates that more carbohydrates are distributed to the roots, thus favoring the development of strong transplants [43]. In the current study, the R/S ratio of grafted tomato transplant was interactively affected by the light quality and PFD in the healing stage. A higher PFD in the healing stage promoted the R/S ratio under L1.2 but reduced the R/S ratio under L2.2. The L2.2 was not conducive to the allocation of dry matter to roots, especially under high PFD in the healing stage. Similarly, the R/S ratio of watermelon transplants significantly decreased when the R/B ratio of the broad LED spectrum was more than 1.7 [23]. It may be caused by excessive red light in photon fluxes, since it has been reported that red light was more beneficial to the growth rate of shoots than roots of lettuces, and the R/S ratio of lettuces decreased with increasing red LED ratio [30]. Higher PFD in the healing stage under L1.2 led to a higher R/S ratio. A similar result was also observed on the grafted cucumber seedlings [21]. The SQI includes parameters of height, stem diameter, and R/S ratio, and was suggested as a valuable indicator alongside the R/S ratio and compactness to evaluate the quality of grafted watermelon seedling [23]. In this study, the response of SQI to light quality and PFD in the healing stage was similar to the R/S ratio. Increased PFD in the healing stage under L1.2 promotes the increase in SQI. Sun et al. [44] also reported that the SQI of grafted cucumber seedlings with pumpkin rootstock increased with the increase in PFD within a range from 0 to 200 μmol m−2 s−1. Moreover, L1.2 showed the same ability as F1.8 to promote the quality of grafted tomato transplants when PFD in the healing stage was 150 μmol m−2 s−1.

4.2. Energy Use Efficiency as Affected by LED Quality

There were no effects of PFD in the healing stage on LUEP and EUEL of grafted tomato transplants, which may be caused by the little differences in dry matter accumulation under different PFD in the short healing time of only six days. The differences caused by different PFD in the healing stage were narrowed to a negligible level when compared to the differences in LUEP and EUEL during the whole seedling stage.
Compared to TDM and LUEP of grafted tomato transplants grown under F1.8, those under L2.2 increased by 14% and 19%, respectively. The difference between the two increase rates was due to the difference in light energy input. According to Planck’s equation, photon energy is inversely proportional to wavelength. It means that a greater fraction of red light and a lesser fraction of blue light contribute to less light energy when total photon flux is fixed. In this study, the fractions of red, green, and blue light photon flux of L2.2 were 44.0%, 33.9%, and 20.4%, respectively. The highest fraction of red light and the lowest fraction of green and blue light can explain why the increase rate of LUEP is higher than that of TDM of grafted tomato transplants under L2.2. In the current experiment, the average LUEp of grafted tomato transplants was approximately in the range between 0.021 and 0.025, which was about half times lower than that of non-grafted tomato seedling production in the PFAL reported by previous studies [45,46]. It is largely because half of the biomass of rootstock and scion was discarded during grafting, which was not regarded as the usable biomass of grafted transplants, and the decreased growth rate in the healing stage was another possible reason.
The EUEL of grafted tomato transplants under LED lights improved by 110%–126% compared to that under fluorescent lights. The LED lights showed good energy-saving ability. It is expected that replacing part of white LED chips with red LED chips can promote the photon efficacy of white LED fixtures for the reason that the photon efficiency of red LEDs is usually higher than that of white LEDs [47]. However, the EUEL of grafted tomato transplants under L2.2 did not increase compared to that under L0.9 and L1.2, although the LUEP of L2.2 was the highest among three kinds of LED lights. It indicated that L2.2 had a poor photon efficiency, which may be related to the manufacturing process of LED fixtures. Regardless, white LEDs are widely used in architectural lighting applications, the cost of which is now only 20% that of red LEDs [47]. Therefore, it is not necessary to add red light in excess considering the EUEL and cost of LED fixtures.

5. Conclusions

Compared to fluorescent lights, the LED lights show more than 110% electrical energy saving for lighting during the whole seedling period. The growth and quality of grafted tomato transplants under different broad LED light spectrums are influenced by the R/B ratio. The addition of an appropriate amount of red light to white LED lights can promote the total dry matter and enhance plant compactness and leaf thickness of grafted tomato transplants. However, excessive red light brings about a negative effect on the seedling quality and potentially increases costs of white plus red LED light fixtures. Higher PFD in the healing stage had a positive impact on the growth and quality of grafted tomato transplants and did not significantly increase the consumption of electric power for lighting. White plus red LED lights with R/B ratio of 1.2 and R/FR ratio of 16 are suggested to replace fluorescent lights for grafted tomato transplants production considering the high quality of transplants and electrical energy saving, and PFD in the healing stage is recommended to be set to 150 μmol m−2 s−1.

Author Contributions

Conceptualization, D.H.; Data curation, P.G.; Formal analysis, J.Z.; Funding acquisition, D.H.; Investigation, P.G.; Methodology, D.H.; Project administration, D.H.; Resources, P.Y.; Supervision, D.H.; Validation, F.J. and D.H.; Visualization, J.Z.; Writing—Original draft, J.Z.; Writing—Review and editing, F.J. and D.H. All authors have read and agreed to the published version of the manuscript.

Funding

This work was funded by the National Key Research and Development Program of China (Grant No. 2017YFB0403901).

Conflicts of Interest

The authors declare no conflict of interest.

References

  1. Colla, G.; Pérez-Alfocea, F.; Schwarz, D. Vegetable Grafting: Principles and Practices; CAB International: Oxfordshire, UK, 2017. [Google Scholar]
  2. Lee, J.M.; Kubota, C.; Tsao, S.J.; Bie, Z.; Hoyos Echevarria, P.; Morra, L.; Oda, M. Current status of vegetable grafting: Diffusion, grafting techniques, automation. Sci. Hortic. 2010, 127, 93–105. [Google Scholar] [CrossRef]
  3. Huang, Y.; Kong, Q.S.; Chen, F.; Bie, Z.L. The history, current status and future prospects of vegetable grafting in China. Acta Hortic. 2015, 1086, 31–40. [Google Scholar] [CrossRef]
  4. Dong, W.; Zhou, Z.C.; Bu, Y.L.; Zhuo, J.Q.; Chen, L.Z.; Li, Y.Z. Research and application of grafted seedlings healing room. Acta Hortic. 2015, 1086, 51–58. [Google Scholar] [CrossRef]
  5. Lee, K.M.; Lim, C.S.; Muneer, S.; Jeong, B.R. Functional vascular connections and light quality effects on tomato grafted unions. Sci. Hortic. 2016, 201, 306–317. [Google Scholar] [CrossRef]
  6. Bantis, F.; Koukounaras, A.; Siomos, A.S.; Fotelli, M.N.; Kintzonidis, D. Bichromatic red and blue LEDs during healing enhance the vegetative growth and quality of grafted watermelon seedlings. Sci. Hortic. 2020, 261, 109000. [Google Scholar] [CrossRef]
  7. Lang, K.M.; Nair, A.; Litvin, A.G. An alternative healing method for grafted tomato transplants: The effect of light exclusion and substrate temperature on plant survival and growth. HortTechnology 2020, 30, 677–684. [Google Scholar] [CrossRef]
  8. Yamaguchi, K.; Yang, C.S. Plant Factory: An Indoor Vertical Farming System for Efficient Quality Food Production; Kozai, T., Niu, G.H., Takagaki, M., Eds.; BERG EARTH Co. Ltd.: Uwajima, Japan; Academic Press: London, UK, 2016; pp. 382–386. [Google Scholar]
  9. Kozai, T.; Niu, G.H. Introduction. In Plant Factory: An Indoor Vertical Farming System for Efficient Quality Food Production; Kozai, T., Niu, G.H., Takagaki, M., Eds.; Academic Press: London, UK, 2020; pp. 3–6. [Google Scholar]
  10. Kozai, T. PFAL business and R&D in Asia and North America: Status and perspectives. In Plant Factory: An Indoor Vertical Farming System for Efficient Quality Food Production; Kozai, T., Niu, G.H., Takagaki, M., Eds.; Academic Press: London, UK, 2020; pp. 35–39. [Google Scholar]
  11. Sharakshane, A. White LED lighting for plants. BioRxiv 2016, e215095, (Preprint). [Google Scholar]
  12. Croce, R.; Müller, M.G.; Bassi, R.; Holzwarth, A.R. Carotenoid-to-chlorophyll energy transfer in recombinant major light-harvesting complex (LHCII) of higher plants. I. Femtosecond transient absorption measurements. Biophys. J. 2001, 80, 901–915. [Google Scholar] [CrossRef] [Green Version]
  13. McCree, K.J. The action spectrum, absorptance and quantum yield of photosynthesis in crop plants. Aagric. Meteorol. 1972, 9, 191–216. [Google Scholar] [CrossRef]
  14. Kim, H.H.; Goins, G.D.; Wheeler, R.M.; Sager, J.C. Green-light supplementation for enhanced lettuce growth under red-and blue-light-emitting diodes. HortScience 2004, 39, 1617–1622. [Google Scholar] [CrossRef] [Green Version]
  15. Hogewoning, S.W.; Wientjes, E.; Douwstra, P.; Trouwborst, G.; Van Ieperen, W.; Croce, R.; Harbinson, J. Photosynthetic quantum yield dynamics: From photosystems to leaves. Plant Cell 2012, 24, 1921–1935. [Google Scholar] [CrossRef] [Green Version]
  16. Nozue, H.; Shirai, K.; Kajikawa, K.; Gomi, M.; Nozue, M. White LED light with wide wavelength spectrum promotes high-yielding and energy-saving indoor vegetable production. Acta Hortic. 2018, 1227, 585–592. [Google Scholar] [CrossRef]
  17. Cho, J.; Park, J.H.; Kim, J.K.; Schubert, E.F. White light-emitting diodes: History, progress, and future. Laser Photonics Rev. 2017, 11, 1600147. [Google Scholar] [CrossRef]
  18. Avercheva, O.V.; Berkovich, Y.A.; Konovalova, I.O.; Radchenko, S.G.; Lapach, S.N.; Bassarskaya, E.M.; Kochetova, G.V.; Zhigalova, T.V.; Yakovleva, O.S.; Tarakanov, I.G. Optimizing LED lighting for space plant growth unit: Joint effects of photon flux density, red to white ratios and intermittent light pulses. Life Sci. Space Res. 2016, 11, 29–42. [Google Scholar] [CrossRef] [PubMed]
  19. Urrestarazu, M.; Nájera, C.; Gea, M.D.M. Effect of the spectral quality and intensity of light-emitting diodes on several horticultural crops. HortScience 2016, 53, 268–271. [Google Scholar] [CrossRef] [Green Version]
  20. Wei, H.; Hu, J.; Liu, C.; Wang, M.; Zhao, J.; Kang, D.I.; Jeong, B.R. Effect of supplementary light source on quality of grafted tomato seedlings and expression of two photosynthetic genes. Agronomy 2018, 8, 207. [Google Scholar] [CrossRef] [Green Version]
  21. Jang, Y.; Goto, E.; Ishigami, Y.; Mun, B.; Chun, C. Effects of light intensity and relative humidity on photosynthesis, growth and graft-take of grafted cucumber seedlings during healing and acclimatization. Hort. Environ. Biotechnol. 2011, 52, 331–338. [Google Scholar] [CrossRef]
  22. Hu, B.; Ling, P.; Kleinhenz, M. Grafted tomato propagation: Effects of light intensity and temperature on graft healing and plant regrowth. Acta Hortic. 2016, 1140, 327–330. [Google Scholar] [CrossRef]
  23. Bantis, F.; Koukounaras, A.; Siomos, A.; Radoglou, K.; Dangitsis, C. Optimal LED wavelength composition for the production of high-quality watermelon and interspecific squash seedlings used for grafting. Agronomy 2019, 9, 870. [Google Scholar] [CrossRef] [Green Version]
  24. Hunt, R. Basic Growth Analysis: Plant Growth Analysis for Beginners; Unwin Hyman Ltd.: London, UK, 1990. [Google Scholar]
  25. Lichtenthaler, H.K. Chlorophylls and carotenoids: Pigments of photosynthetic biomembranes. Methods Enzymol. 1987, 148, 350–382. [Google Scholar]
  26. Kozai, T. Resource use efficiency of closed plant production system with artificial light: Concept, estimation and application to plant factory. Proc. Jpn. Acad. Ser. B 2013, 89, 447–461. [Google Scholar] [CrossRef] [Green Version]
  27. Goto, E. Plant production in a closed plant factory with artificial lighting. Acta Hortic. 2012, 956, 37–49. [Google Scholar] [CrossRef]
  28. Jang, Y.; Mun, B.; Seo, T.; Lee, J.; Chun, C. Effects of light quality and intensity on the carbon dioxide exchange rate, growth, and morphogenesis of grafted pepper transplants during healing and acclimatization. Kor. J. Hort. Sci. Technol. 2013, 31, 260–266. [Google Scholar] [CrossRef] [Green Version]
  29. Hernández, R.; Eguchi, T.; Deveci, M.; Kubota, C. Tomato seedling physiological responses under different percentages of blue and red photon flux ratios using LEDs and cool white fluorescent lights. Sci. Hortic. 2016, 213, 270–280. [Google Scholar] [CrossRef] [Green Version]
  30. Son, K.H.; Oh, M.M. Leaf shape, growth, and antioxidant phenolic compounds of two lettuce cultivars grown under various combinations of blue and red light-emitting diodes. HortScience 2013, 48, 988–995. [Google Scholar] [CrossRef]
  31. Lichtenthaler, H.K.; Babani, F. Light adaptation and senescence of the photosynthetic apparatus. changes in pigment composition, chlorophyll fluorescence parameters and photosynthetic activity. In Chlorophyll a Fluorescence: A Signature of Photosynthesis; Papageorgiou, G.C., Govindjee, Eds.; Springer: Dordrecht, The Netherlands, 2004; pp. 713–736. [Google Scholar]
  32. Björkman, O.; Demmig, B. Photon yield of O2 evolution and chlorophyll fluorescence characteristics at 77 K among vascular plants of diverse origin. Planta 1987, 170, 489–504. [Google Scholar] [CrossRef] [PubMed]
  33. McCree, K.J. Significance of enhancement for calculations based on the action spectrum for photosynthesis. Plant Physiol. 1972, 49, 704–706. [Google Scholar] [CrossRef] [Green Version]
  34. Wollaeger, H.M.; Runkle, E.S. Growth of impatiens, petunia, salvia, and tomato seedlings under blue, green, and red light-emitting diodes. HortScience 2014, 49, 734–740. [Google Scholar] [CrossRef]
  35. Cope, K.R.; Snowden, M.C.; Bugbee, B. Photobiological interactions of blue light and photosynthetic photon flux: Effects of monochromatic and broad-spectrum light sources. Photochem. Photobiol. 2014, 90, 574–584. [Google Scholar] [CrossRef] [PubMed]
  36. Clifford, S.C.; Runkle, E.S.; Langton, F.A.; Mead, A.; Foster, S.A.; Pearson, S.; Heins, R.D. Height control of poinsettia using photoselective filters. HortScience 2004, 39, 383–387. [Google Scholar] [CrossRef] [Green Version]
  37. Ciolfi, A.; Sessa, G.; Sessi, M.; Possenti, M.; Salvucci, S.; Carabelli, M.; Morelli, G.; Ruberti, I. Dynamics of the shade-avoidance response in arabidopsis. Plant Physiol. 2013, 163, 331–353. [Google Scholar] [CrossRef] [Green Version]
  38. Wang, Y.; Folta, K.M. Contributions of green light to plant growth and development. Am. J. Bot. 2013, 100, 70–78. [Google Scholar] [CrossRef] [PubMed]
  39. Schenkels, L.; Saeys, W.; Lauwers, A.; Proft, M.P.D. Green light induces shade avoidance to alter plant morphology and increases biomass production in Ocimum basilicum L. Sci. Hortic. 2020, 261, e109002. [Google Scholar] [CrossRef]
  40. Kwesiga, F.; Grace, J. The role of the red/far-red ratio in the response of tropical tree seedlings to shade. Ann. Bot. 1986, 57, 283–290. [Google Scholar] [CrossRef]
  41. Vu, N.T.; Kim, Y.S.; Kang, H.M.; Kim, I.S. Influence of short-term light irradiation under pre-and post-grafting period on the graft-take ratio and quality of tomato seedlings. Hort. Environ. Biotechnol. 2014, 55, 27–35. [Google Scholar] [CrossRef]
  42. Wei, H.; Wang, M.; Jeong, B.R. Effect of supplementary lighting duration on growth and activity of antioxidant enzymes in grafted watermelon seedlings. Agronomy 2020, 10, 337. [Google Scholar] [CrossRef] [Green Version]
  43. Currey, C.J.; Hutchinson, V.A.; Lopez, R.G. Growth, morphology, and quality of rooted cuttings of several herbaceous annual bedding plants are influenced by photosynthetic daily light integral during root development. HortScience 2012, 47, 25–30. [Google Scholar] [CrossRef] [Green Version]
  44. Sun, F.; Ma, S.; Gao, L.; Qu, M.; Tian, Y. Enhancing root regeneration and nutrient absorption in double-rootcutting grafted seedlings by regulating light intensity and photoperiod. Sci. Hortic. 2020, 264, 109192. [Google Scholar] [CrossRef]
  45. Yokoi, S.; Kozai, T.; Ohyama, K.; Hasegawa, T.; Chun, C.; Kubota, C. Effects of leaf area index of tomato seedling populations on energy utilization efficiencies in a closed transplant production system. J. Soc. High Technol. Agr. 2003, 15, 231–238. [Google Scholar] [CrossRef] [Green Version]
  46. Ji, F.; Gan, P.D.; Liu, N.; He, D.X.; Yang, P. Effects of LED spectrum and daily light integral on growth and energy use efficiency of tomato seedlings. Trans. Chin. Soc. Agric. Eng. 2020, 36, 231–238. [Google Scholar]
  47. Kusuma, P.; Pattison, P.M.; Bugbee, B. From physics to fixtures to food: Current and potential LED efficacy. Hortic. Res. 2020, 7, e56. [Google Scholar] [CrossRef] [PubMed] [Green Version]
Figure 1. Tomato transplants at pre-grafting stage (A), healing stage (B), and post-healing stage (C).
Agriculture 11 00816 g001
Figure 2. Spectral distribution of photon flux density (PFD) emitted by fluorescent lights (F1.8) with R:B ratio of 1.8 (A) and three LED lights (L0.9, L1.2 and L2.2) with R:B ratio of 0.9, 1.2 and 2.2, respectively (B). The total PFD was normalized to 100 μmol m−2 s−1. The PFD of ultraviolet light (UV, 300–399 nm), blue light (B, 400–499 nm), green light (G, 500–599 nm), red light (R, 600–699 nm) and far-red light (FR, 700–800 nm) were obtained by integral calculation (C).
Agriculture 11 00816 g002
Figure 3. Effects of light quality during the whole seedling period and photon flux density in the healing stage on the morphology of grafted tomato transplants. Z Symbol represents lighting source of F1.8 and photon flux density of 50 μmol m−2 s−1.
Agriculture 11 00816 g003
Figure 4. Effects of light quality during the whole seedling period and photon flux density (PFD) in the healing stage on Fv/Fm, ratio of chlorophyll a to chlorophyll b (chl a/b) and ratio of total chlorophylls to total carotenoids ((a + b)/(x + c)) of grafted tomato transplants. There were no interactive effects of light quality and PFD on Fv/Fm (P = 0.056), chl a/b (P = 0.440) and (a + b)/(x + c) (P = 0.256). Duncan’s test was used to make post-hoc multiple comparisons at α = 0.05 level (n = 6). Vertical bars represent standard deviations. Different letters, a and b, indicate significant differences and NS indicates nonsignificant differences.
Agriculture 11 00816 g004
Figure 5. Effects of light quality during the whole seedling period and daily light integral (DLI) in the healing stage on compactness, specific leaf area (SLA) of grafted tomato transplants. There were no interactive effects of light quality and DLI on compactness (P = 0.216) and SLA (P = 0.716). Duncan’s test was used to make post-hoc multiple comparisons at α = 0.05 level (n = 6). Vertical bars represent standard deviations. Different letters, a–c, indicate significant differences.
Agriculture 11 00816 g005
Figure 6. Root to shoot (R/S) ratio and seedling quality index (SQI) of grafted tomato transplants as affected by light quality during the whole seedling period and photon flux density in the healing stage. Means were separated by Duncan’s test at α = 0.05 level (n = 6). Vertical bars represent standard deviations. Different letters, a–c, indicate significant differences.
Agriculture 11 00816 g006
Figure 7. Effects of light quality during the whole seedling period and photon flux density (PFD) in the healing stage on energy use efficiency of grafted tomato transplants. There were no interactive effects of light quality and PFD on LUEP (P = 0.212) and EUEL (P = 0.063). Duncan’s test was used to make post-hoc multiple comparisons at α = 0.05 level (n = 6). Vertical bars represent standard deviations. Different letters, a and b, indicate significant differences and NS indicates nonsignificant differences.
Agriculture 11 00816 g007
Table 1. Lighting treatments created by four kinds of light sources during the whole seedling period and three levels of photon flux density in the healing stage.
TreatmentLight Source for the Whole
Seedling Period
Photon Flux Density
(μmol m−2 s−1)
Photoperiod
(h d−1)
Daily Light Integral
(mol m−2 d−1)
Healing Stage
(7 d) Z
Pre-Grafting/Post-Healing Stage
(15 d/3 d)
Healing StagePre-Grafting/Post-Healing Stage
F1.8-P050YF1.850250142.512.6
F1.8-P1001005.0
F1.8-P1501507.6
L0.9-P050L0.950250142.512.6
L0.9-P1001005.0
L0.9-P1501507.6
L1.2-P050L1.250250142.512.6
L1.2-P1001005.0
L1.2-P1501507.6
L2.2-P050L2.250250142.512.6
L2.2-P1001005.0
L2.2-P1501507.6
Z The healing stage was 7 days. All the lights were turned off on the first day, and three levels of PFD were provided on the next 6 days. Y Symbol represents lighting source of F1.8 and photon flux density of 50 μmol m−2 s−1.
Table 2. Morphological characteristics, biomass and net photosynthetic rate (Pn) of grafted tomato transplants as affected by light quality (LQ) during the whole seedling period and photon flux density (PFD) in the healing stage. Different letters in the same column indicate significant differences at α = 0.05 level (n = 6) according to Duncan’s test. NS and * represent nonsignificant and significant difference, respectively.
TreatmentPlant Height
(cm)
Stem Diameter
(mm)
Leaf NumberLeaf Area
(cm2)
Total Dry Matter
(g)
Net Photosynthetic Rate
(μmol m−2 s−1)
F1.8-P050 Z7.6 ± 0.6 ab2.7 ± 0.1 b3.8 ± 0.4 a46.5 ± 4.3 a0.19 ± 0.02 b11.9 ± 1.4 ab
F1.8-P1007.9 ± 0.4 a3.0 ± 0.2 a3.8 ± 0.4 a46.0 ± 5.4 a0.22 ± 0.03 ab12.2 ± 1.1 ab
F1.8-P1507.2 ± 0.2 b2.9 ± 0.2 ab3.7 ± 0.5 ab46.9 ± 7.4 a0.22 ± 0.04 ab14.1 ± 1.2 a
L0.9-P0506.2 ± 0.8 cd2.9 ± 0.2 ab3.5 ± 0.5 ab43.4 ± 4.7 ab0.20 ± 0.03 b12.0 ± 1.7 ab
L0.9-P1006.0 ± 0.4 cd2.9 ± 0.2 ab3.2 ± 0.4 b41.9 ± 8.2 ab0.20 ± 0.03 b12.8 ± 1.7 ab
L0.9-P1506.6 ± 0.7 c2.9 ± 0.2 ab3.8 ± 0.4 a46.6 ± 6.8 a0.24 ± 0.03 a12.3 ± 2.3 ab
L1.2-P0505.4 ± 0.3 e2.7 ± 0.1 b3.0 ± 0.0 b36.6 ± 4.1 b0.19 ± 0.02 b13.8 ± 1.2 a
L1.2-P1005.5 ± 0.3 e3.0 ± 0.2 a3.3 ± 0.5 ab44.2 ± 5.1 ab0.23 ± 0.03 a14.1 ± 1.3 a
L1.2-P1505.6 ± 0.2 de3.0 ± 0.1 a3.3 ± 0.5 ab36.7 ± 1.7 b0.23 ± 0.02 a11.0 ± 1.0 b
L2.2-P0506.3 ± 0.4 cd2.9 ± 0.1 ab3.2 ± 0.4 b46.4 ± 3.0 a0.24 ± 0.03 a10.9 ± 2.6 b
L2.2-P1006.7 ± 0.5 c2.8 ± 0.2 ab3.2 ± 0.4 b42.4 ± 8.6 ab0.24 ± 0.05 a12.7 ± 1.6 ab
L2.2-P1506.0 ± 0.6 d2.8 ± 0.2 ab3.6 ± 0.5 ab42.4 ± 6.4 ab0.24 ± 0.04 a10.9 ± 0.8 b
LQ*NS****
PFDNS*NSNS*NS
LQ × PFD*NSNSNSNS*
Z Symbol represents lighting source of F1.8 and photon flux density of 50 μmol m−2 s−1.
Publisher’s Note: MDPI stays neutral with regard to jurisdictional claims in published maps and institutional affiliations.

