Article

The Impact of LED Light Spectrum on the Growth, Morphological Traits, and Nutritional Status of ‘Elizium’ Romaine Lettuce Grown in an Indoor Controlled Environment

by
Bożena Matysiak
1,*,
Stanisław Kaniszewski
2,
Jacek Dyśko
2,
Waldemar Kowalczyk
3,
Artur Kowalski
2 and
Maria Grzegorzewska
4
1
Department of Applied Biology, The National Institute of Horticultural Research, Konstytucji 3 Maja 1/3, 96-100 Skierniewice, Poland
2
Laboratory of Vegetable Crops and Edible Mushroom, The National Institute of Horticultural Research, Konstytucji 3 Maja 1/3, 96-100 Skierniewice, Poland
3
Laboratory of Chemical Analysis, The National Institute of Horticultural Research, Konstytucji 3 Maja 1/3, 96-100 Skierniewice, Poland
4
Fruit and Vegetables Storage and Processing Department, The National Institute of Horticultural Research, Konstytucji 3 Maja 1/3, 96-100 Skierniewice, Poland
*
Author to whom correspondence should be addressed.
Agriculture 2021, 11(11), 1133; https://doi.org/10.3390/agriculture11111133
Submission received: 27 September 2021 / Revised: 9 November 2021 / Accepted: 10 November 2021 / Published: 12 November 2021
(This article belongs to the Special Issue Impact of Light on Horticultural Crops)

Abstract

:
The study examined the influence of light quality on the growth and nutritional status of romaine lettuce grown in deep water culture with a floating raft system using two different nutrient solutions. Four spectra of LED light were used with different ratios of R, G, and B lights (80:10:10, 70:10:20, 60:10:30, and 70:18:12). Two nutrient solutions with a low (A) and moderately high (B) nutrient content were used. Regardless of the nutrient solution, the RGB 70:18:12 light promoted the production of leaf biomass as well as inhibited the accumulation of K and Mg in the leaves. Moreover, those plants were characterized by a low Nitrogen Balance Index (NBI) and a high flavonol index. In the last week of cultivation, there was a strong decrease in K, P, and nitrates in the nutrient solution, and an increase in Ca. In the final stage of growth, symptoms of withering of the tips of young leaves (tipburn) were observed on the plants. The most damage was observed on the plants growing under 70:10:20, 70:18:12, and with the higher concentration of minerals in the solution (B).

1. Introduction

The multi-level production of plants in plant factories is one of the strategies for adapting agriculture to the advancing climate change. The decreasing production potential of soils, and the shortage of raw materials for plant production as well as the growing demand for food in cities are caused by intensifying urbanization processes [1,2]. This technology is particularly suitable for the cultivation of small-sized plants with a short production cycle, such as leafy vegetables and herbs, and valuable medicinal plants [1,3,4]. The consumption of energy, water, carbon dioxide, and land area for producing a unit mass of lettuce in a plant factory is much lower than in greenhouse cultivation, because of the possibility of cultivating plants on many levels, using closed fertigation systems, and recovery of water lost due to transpiration [5]. The most important factors limiting the development of technologies of plant production in plant factories are the high costs of investment and energy for artificial lighting. The multi-level production of plants requires the use of light sources with high energy conversion to the light used by plants in the photosynthesis process and generating little heat [6]. A major advantage of LEDs lamps is their electrical efficiency and photosynthetic efficacy. The small size and low heat energy emission mean that LED lighting can be installed near plants. The spectrum of LEDs can be adjusted based on plant growth requirements.
Studies conducted on lettuce (Lactuca sativa L.) as a model plant in facilities without sunlight have shown that changes in the light spectrum significantly affect the growth and development of the plants, as both the morphology and physiological processes depend on the quality of light [7,8]. The greatest influence is exerted by red light (600–700 nm) in combination with blue light (400–500 nm) because it affects the process of photosynthesis [8,9,10,11,12,13,14] and the morphological features of leaves that facilitate the absorption of light quanta by plants [15]. A high proportion of red light stimulates the production of biomass of green-leaf lettuce, with its optimal percentage in the total spectrum being in a fairly wide range from 50% to 80% [8,13,16,17,18,19]. With the increase in the proportion of blue light, lettuce plants grow more slowly [8], but the amounts of bioactive compounds in them, e.g., flavonoids, increase [10,11,12,19,20]. In the case of red-leaf lettuce, blue light is more effective in stimulating growth than red light [21,22]. Positive effects on the production of lettuce leaf biomass have also been obtained with green light (500–600 nm) [23] The addition of green light has been shown to efficiently drive photosynthesis, however, this effect depends on the light intensity [24]. At low PPFD, green light compared to red and blue, has the lowest photosynthetic efficiency, because of its low absorptance; on the other hand, at high PPFD quantum yield of CO2 assimilation under green light is the highest [25]. Supplementation of the spectrum with green light at moderate PPFD decreased the intensity of photosynthesis but did not limit the growth of lettuce [8]. Butterhead lettuce (Lactuca sativa var. capitata) is the basic leafy vegetable produced in plant factories. The few studies relating to the production of plants in plant factories have concerned the romaine lettuce Lactuca sativa var. longifolia [26,27]. Despite its high taste quality and nutritional value [28], this variety, especially the ‘mini’ type is cultivated on a small scale in controlled atmosphere environments due to problems with obtaining high-quality plants and the lack of information on the requirements in relation to environmental conditions.
It has been demonstrated that with an increase in the photosynthetic photon flux density (PPFD) in the range from 150 to 300 µmol m−2 s−1, the growth rate, fresh and dry leaf weight, and the number of leaves of butterhead lettuce increased, but the negative effect was a greater number of leaves with tipburn symptoms, which was associated with a reduced calcium content [29]. The tipburn problem affects mainly head-forming lettuces, such as romaine lettuce and crisphead lettuce [30]. Increased light intensity (PPFD from 100 to 400 mol µm−2 s−1) promoted the production of biomass while reducing the nitrate content in lettuce leaves [31], even when high levels of PPFD were used only at the end of the production period [4]. The few studies concerned with the production of plants in plant factories have shown a significant correlation between the light spectrum and the nutritional status of lettuce plants with respect to macro- and micronutrients, including nitrates [12]. For microgreens, an increasing percentage of blue light in the LED illumination spectrum had a positive effect on the accumulation of mostly macro- and micronutrients [32]. In turn, Kyriacou et al. [33] showed that nitrate accumulation in microgreens was higher under monochromatic red and blue compared to red-blue lights, moreover monochromatic lights tended to increase K and Na and decrease Ca and Mg concentrations.
Cultivation in plant factories is aimed at maximizing the efficiency of the production process, and in the case of leafy vegetables, at achieving rapid weight gain of the aboveground part. In the hydroponic cultivation of lettuce, the composition and concentration of the nutrient solution supplied to the plants play a very important role. In order to obtain good quality and high yield lettuce, the appropriate composition and concentration of the fertigation medium are required. In greenhouse studies with a hydroponic flooding system, the optimal EC of the nutrient solution in the cultivation of butterhead and looseleaf lettuce has been found to be 2 mS cm−1. Increasing the nutrient concentration to an EC of 3 mS cm−1 did not increase the yield of lettuce, while a further increase to an EC of 4 mS cm−1 resulted in a significant reduction in the yield [34,35]. Moreover, it was found that the EC of 4 mS cm−1 increased the nitrate content above the permissible limit set by the European Commission [36]. Too rapid lettuce growth can lead to an unbalanced uptake of minerals from the nutrient solution and to the occurrence of deficiencies (e.g., calcium) or an excess of minerals (nitrates, potassium), which can lead to a reduction in plant quality and significant economic losses.
The aim of the study was to assess the influence of the LED light spectrum and the composition of the mineral nutrient solution on the production of biomass, morphological features, and nutritional status of ‘Elizium’ romaine lettuce in an indoor controlled environment. Changes in the content of basic nutrients in the hydroponic medium during plant growth were analyzed.

2. Materials and Methods

2.1. Plant Material and Growth Conditions

The study was conducted on romaine lettuce Lactuca sativa var. longifolium ‘Elizium’ type ‘mini’. Seedlings of the lettuce were produced on trays, in cubes of mineral wool (0.02 × 0.02 m) in a phytotron (model FD 730 DD INOX, BIOSELL, Warsaw, Poland) in a laboratory building where constant temperature (22 °C) and humidity (65%) were maintained throughout the day, with PPFD at the plant level of 75 µmol m−2 s−1 and a 16 h photoperiod. Twenty-one-day-old seedlings were used in the study. The experiment was performed in an outdoor free-standing container (Weldon, Brzezówka, Poland) with dimensions 6.0 × 2.6 × 3.2 m adapted to a phytotron by BIOSELL (Warsaw, Poland) fitted with two two-shelf racks. On each of the four shelves (3.3 × 0.6 m), there were placed 6 styrofoam containers (0.4 × 0.6 × 0.2 m) for growing lettuce in a hydroponic system. The lettuce seedlings were mounted on floating polystyrene rafts with openings for the plants and placed on the mineral nutrient solution contained in the containers (5 plants per container, 20 plants per m2). Each container contained 20 L of the solution; the solution was constantly aerated (2.3 L min−1). The temperature in the phytotron was set at 20/18 °C day/night, and the relative air humidity at 65%. The experiment was set up on 25 January 2021 and lasted 30 days.

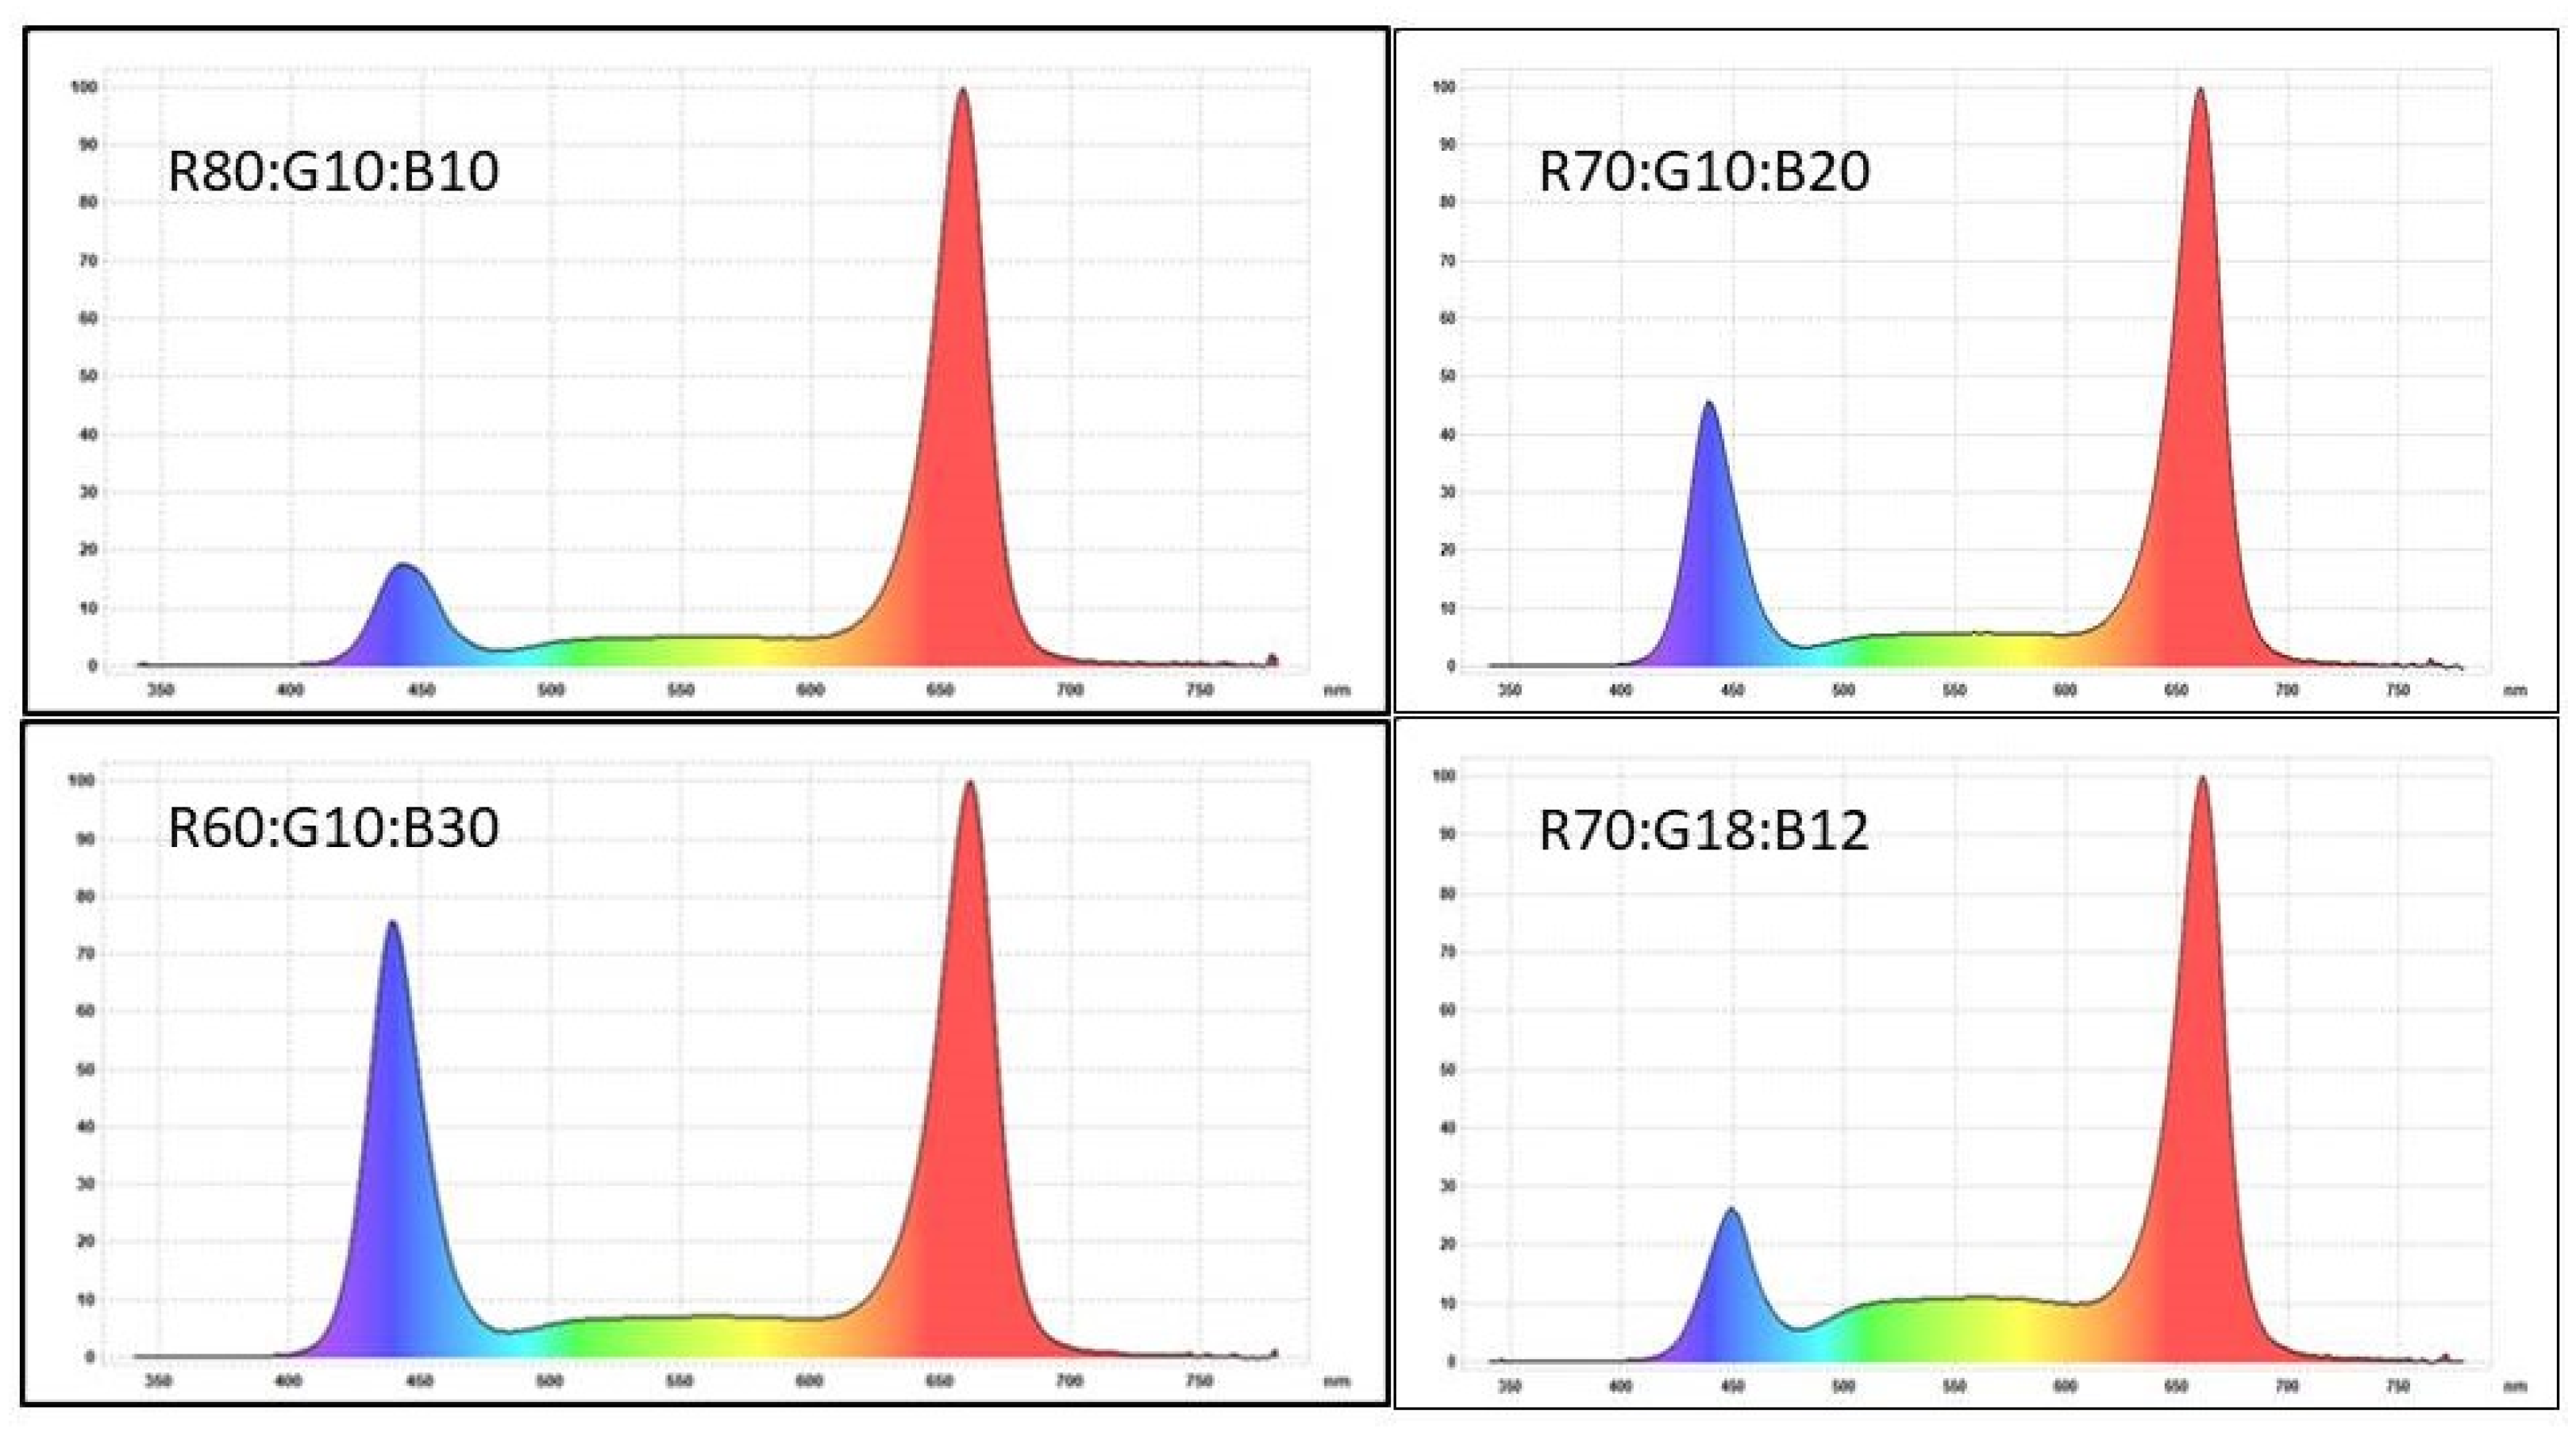
2.2. Experimental Combinations—Light

Each shelf was fitted with panels with LEDs emitting different lights: red (R)—Hyper Red 660 nm (Osram Osconique P 30–30), blue (B)—Deep Blue 440 nm (Osram Osconique P 30–30), and white (W)—6500 K (Samsung CRI 80). The study used 4 spectra of LED light with the following spectral composition: RGB 80:10:10, RGB 70:10:20, RGB 60:10:30, and RGB 70:18:12. The light spectra used in the study are shown in Table 1 and Figure 1. Photometric measurements were made with a GL Spectrolux VIS spectrometer (GL Optic, Puszczykowo, Poland, https://gloptic.com accessed on 23 January 2021). The intensity of photosynthetically active light (PPFD) at the plant height was 160 µmol m−2 s−1 for a 16-h photoperiod. The total daily amount of light (DLI) was 9.2 mol m−2.

2.3. Experimental Combinations—Composition of Nutrient Solution

Two nutrient solutions with a different nutrient content (A and B) were used in the study. The concentrations (mg dm−3) of macroelements in solution A (EC 1.6 mS cm−1, pH 6.0) were: N-NO3—130, N-NH4—11, P—40, K—180, Ca—200, Mg—35; in solution B (EC 2.0 mS cm−1, pH 6.0): N-NO3—170, N-NH4—10, P—50, K—210, Ca—210, Mg—45. The concentrations (mg dm−3) of microelements in solutions A and B were the same: Fe—2.0, Mn—0.76, Zn—0.16, B—0.32, Cu—0.16, Mo—0.04.
During the cultivation of lettuce, the electrical conductivity EC, pH, and nutrient content in the nutrient solution were measured. The pH was determined with the potentiometric method and EC using the conductivity method. Mineral components in the nutrient solution, as N-NO3, were analyzed by the potentiometric method; P, K, Ca, Mg, and SO4 by the spectrophotometric method using a sequential emission spectrometer with inductively coupled plasma (ICP Perkin-Elmer model Optima 2000 DV, Boston, MA, USA). Plant samples (leaves) from each treatment were placed for 48 h in a forced-air dryer at 70 °C. They were analyzed after grinding and wet mineralization in a strong HNO3 and HClO4 acid mixture. The concentrations of macronutrients (P, K, Ca, Mg) and micronutrients (Fe, Mn, Cu, Zn, B) were determined in three replications using an ICP spectrometer. Selected elements were determined at their characteristic wavelengths [37]. The N content in plant samples was analyzed using the Kjeldahl method using Vapodest Kjeldahl apparatus, Gerhardt GmbH & Co., KG, Königswinter, Bonn, Germany [38]. All the nutrients were determined in three replications.

2.4. Growth and Morphological Characteristics of Plants

Lettuce plants were assessed after 30 days of cultivation. Leaf fresh weight, plant height and diameter, number of leaves (including leaves with tipburn), and head circumference (curled inner leaves) were determined.

2.5. Chlorophyll, Flavonol, and Nitrogen Balance Indices

An optical sensor was used for the assessment of chlorophyll and flavonol compounds, measuring the UV absorbance of the leaf epidermis by the double excitation of chlorophyll fluorescence (Dualex Scientific+ Instrument, Force-A, Orsay, Paris, France, https://www.force-a.com, accessed on 23 January 2021). The nitrogen balance index (NBI) was automatically calculated as a ratio of the chlorophyll index (ChI) to the flavonol index (FLAV), i.e., NBI = ChI/FLAV. The device used in this study allows for non-destructive measurements of chlorophyll, flavonol content, and nitrogen balance in leaves, which makes it particularly suitable for photophysiological research. For each lighting combination, 30 young, fully expanded leaves were used for the determination of the flavonol and chlorophyll indices.

2.6. Experimental Design and Statistical Analysis

The experiment used a two-factorial design of light spectrum × nutrient solution. Plants were subjected to illumination with four light spectra (R:G:B—80:10:10, 70:10:20, 60:10:30, 70:18:12) and two nutrient solutions (A and B). There were three container replicates for each of the eight treatments and thus 24 containers in total. In the study, eight experimental treatment groups were analyzed, with five samples (plants) in each treatment group. Two-way ANOVAs were used to test the effects of the light spectrum and nutrient solution on the growth traits of romaine lettuce. The treatment means were compared using Tukey’s HSD. Statistical analysis was performed using the STATISTICA software, version 13.1 (StatSoft Inc., Tulsa, OK, USA).

3. Results

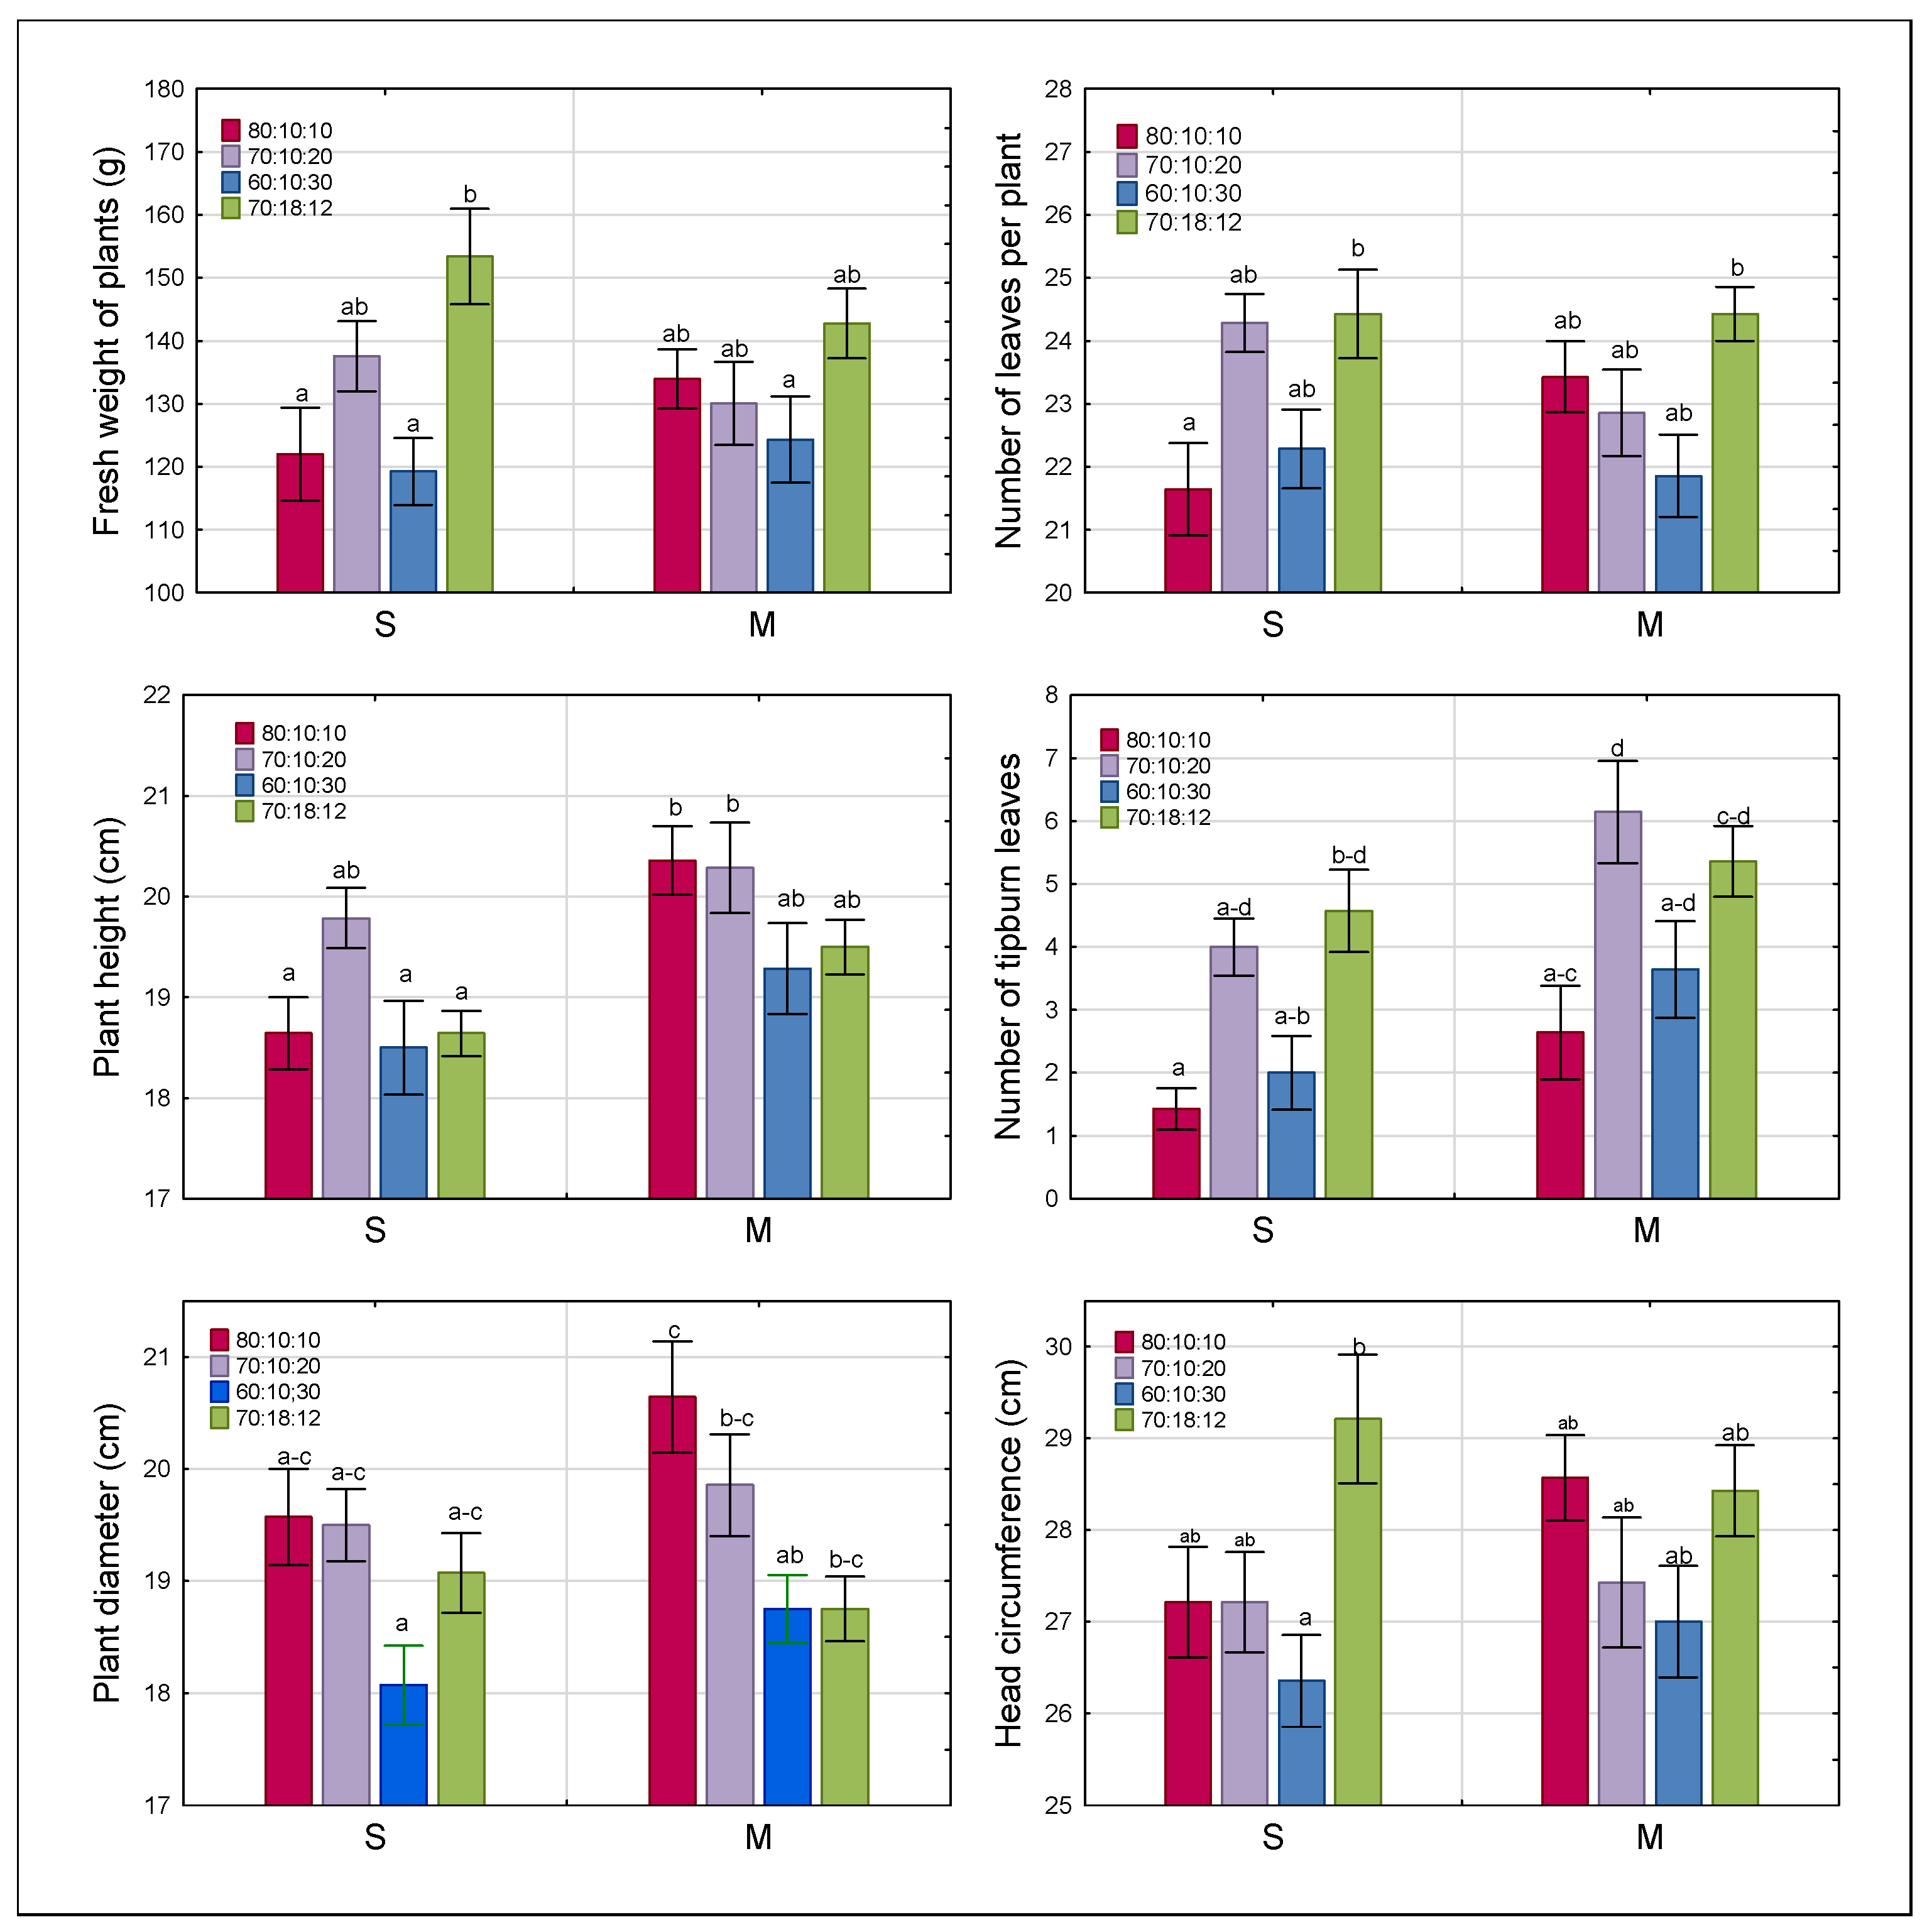
3.1. Growth and Morphological Characteristics of Plants

The quality of light significantly influenced the growth and development of ‘Elizium’ romaine lettuce grown in the hydroponic system without sunlight (Figure 2). However, the effects of light quality on the growth and morphological features of lettuce plants were not dependent on the type of nutrient solution used, and the interactions between the main factors tested (light spectrum × solution composition) were not significant (Table 2). A high proportion of red light R (600–699 nm), an increased proportion of green light G (500–599 nm), and a low proportion of blue light B (400–499 nm) in the spectrum of the light emitted by the LEDs (RGB 70:18:12) were favorable to biomass production, whereas the use of light with a reduced proportion of red light and a high proportion of blue light (RGB 60:10:30) was the least favorable for the growth of lettuce leaf biomass. Irrespective of the type of nutrient medium used, the lettuce plants grown under RGB 70:18:12 had the highest fresh weight of leaves (148 g), the highest number of leaves (24.4 cm), and the largest head circumference (29 cm), with these values being respectively 15%, 8%, and 7% higher than under RGB 60:10:30. By comparison, the plants growing under RGB 80:10:10 and RGB 70:10:20 had the largest diameter (20.2 and 19.7 cm, respectively), and those growing under RGB 70:10:20 were the tallest (20.2 cm). The plants growing under RGB 60:10:30 and RGB 70:18:12 had the lowest height and diameter.
The results of our study showed that a high ratio of red to blue light with a fairly high proportion of green light (RGB 70:18:12) stimulated the production of biomass in ‘Elizium’ romaine lettuce, and at the same time provided the most eye-friendly conditions, which is important when staying in sealed rooms with such lighting for longer periods of time [13]. Similarly, Mickens et al. [27] showed that the light emitted by LEDs with a spectrum similar to natural light, including the red, green, blue, and far-red bands (RGB 60:24:16 + FR), more strongly stimulated biomass production and the diameter of ‘Outredgeous’ romaine lettuce than the combination of only red light and blue light (RB 60:40). That study also showed that the requirements of lettuce plants at different stages of growth were different. In the initial period, white light combined with green light stimulated biomass production the most, while in the final stage—white light with red light. Monochromatic red light created unfavorable conditions for the growth of Lactuca sativa ‘Grizzly’ [39], and too much blue light resulted in the slower growth of lettuce plants [8,40]. It was been shown that the temporal shift of red light in relation to blue by 4 to 7 h gave a better effect than the simultaneous use of both types of LED light, which may, however, result from an extended photoperiod [26].
Our study showed that the quality of light influenced the development of physiological disorders manifested by the withering of the tips of young leaves (tipburn) of ‘Elizium’ romaine lettuce. The highest numbers of damaged leaves were observed in the plants growing under RGB 70:10:20 and RGB 70:18:12—respectively 5.3 and 5.0, which constituted 21% and 20% of all the leaves. The lowest numbers of damaged leaves were recorded in the plants growing under RGB 80:10:10 and RGB 60:10:30—respectively 9% and 12%. These results suggest that the faster the biomass production is, the more often tipburn symptoms occur on young romaine lettuce leaves. It is known that climatic factors such as high temperature and high light intensity, leading to the rapid growth of lettuce shoots, are conducive to the occurrence of tipburn [41,42,43] and that this is a genetically determined trait [30,42,44,45,46].
The type of nutrient solution influenced to only a small extent the growth and morphological features of ‘Elizium’ romaine lettuce, although the plants growing in solution B were 5% taller than those growing in solution A (on average for the tested light quality variants). Much stronger was the influence of nutrient solution on the occurrence of damage to the tips of young leaves (tipburn). In the case of plants growing in solution B, the percentage of leaves with tipburn symptoms was as high as 19%, whereas in solution A this percentage was 12%.

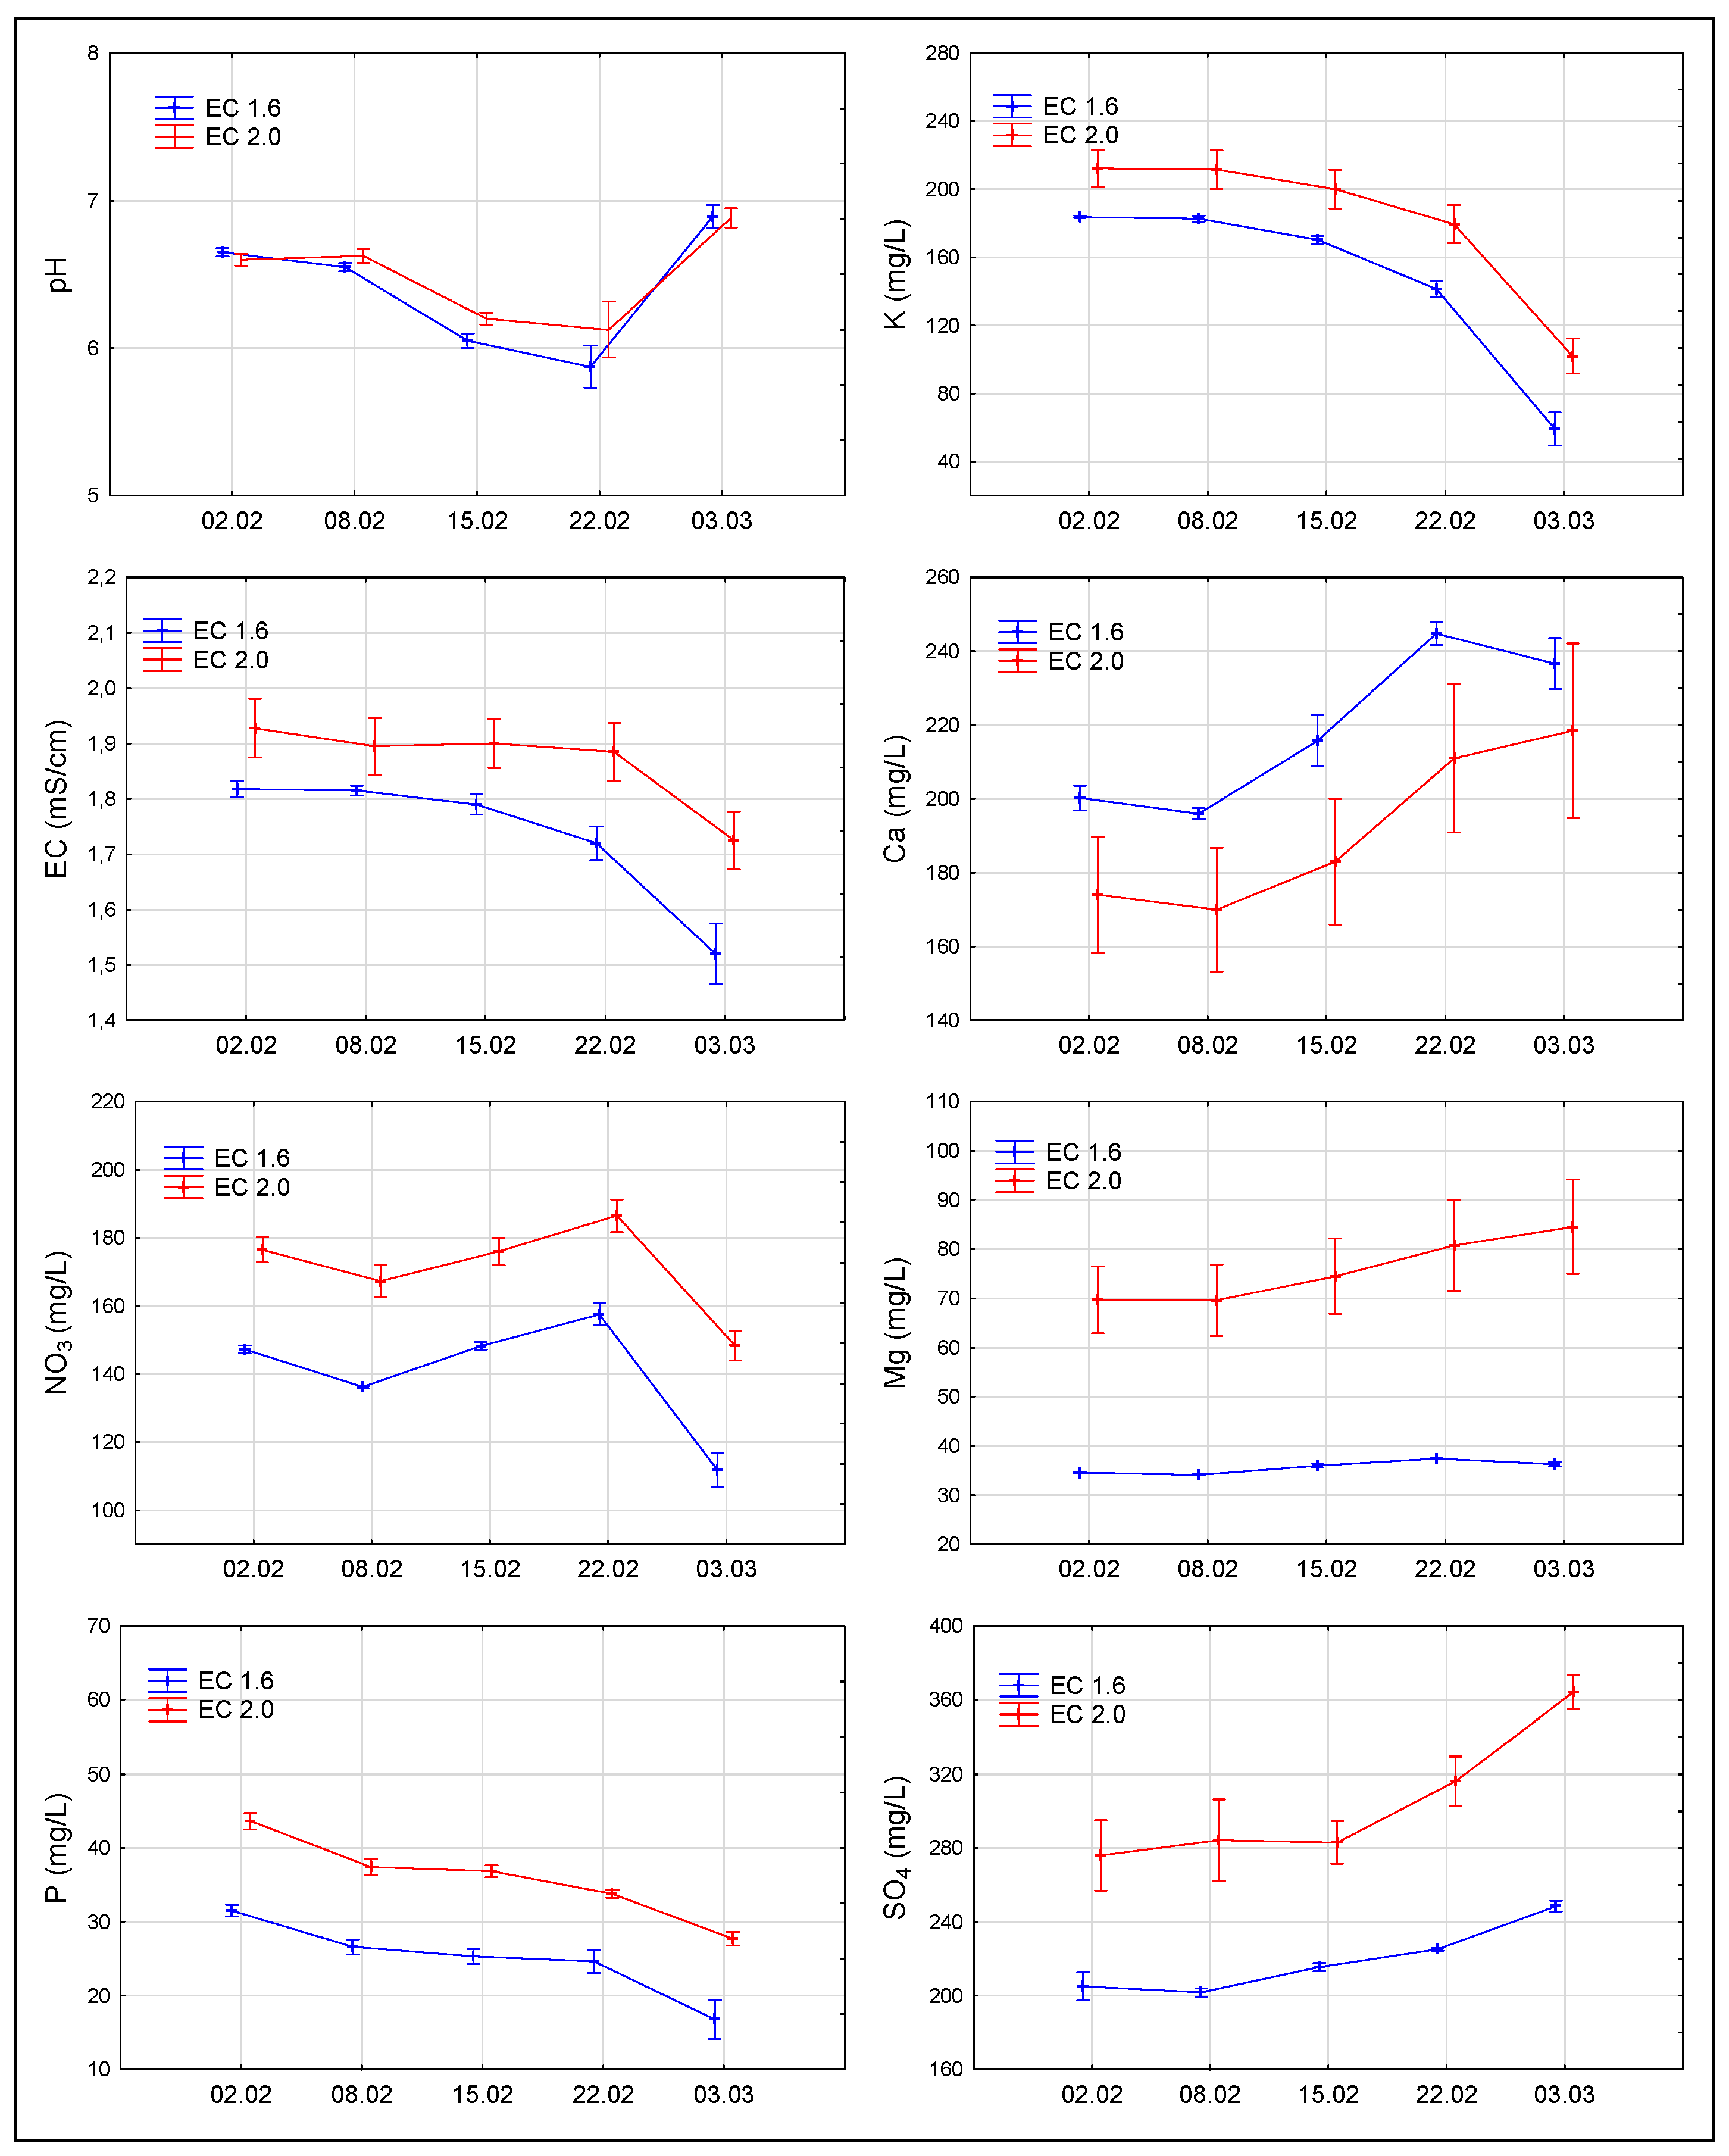
3.2. Changes in the Composition of Nutrient Solution

Weekly analyses of the composition of the hydroponic medium showed significant changes in pH, EC, and the concentrations of macronutrients during the 30-day growth period of ‘Elizium’ romaine lettuce (Figure 3). During the first 3 weeks of cultivation, the pH of the nutrient solution gradually decreased from 6.6 to 6.0, but in the last week, there was an increase in the pH value to 6.8 (on average for the two solutions). The EC value changed only slightly during the first three weeks and decreased in the last week of cultivation, reaching 1.5 and 1.7 mS cm−1 for solutions A and B, respectively. Changes in individual macronutrients were similar for the two solutions used. As the plants grew, decreases in the concentrations of nitrates, phosphorus, and potassium, as well as increasing concentrations of Ca and sulphates in the nutrient solution were recorded, and these changes were especially significant in the last week. On average, for the two solutions (A and B), the concentrations of nitrates in them were lower by 6% after 3 weeks and by 20% after 4 weeks of growth in relation to their concentrations at the beginning of cultivation. The content of phosphorus in the medium after 3 weeks of cultivation was lower by 21%, and after 4 weeks by 41%. The greatest decreases were related to potassium; after 3 weeks of plant growth, the content of this component in the medium was lower by 20%, and after 4 weeks by as much as 64% in relation to the potassium content in the medium immediately after the start of cultivation. Ca and sulphate contents after 3 and 4 weeks of cultivation were higher than in the initial phase of plant growth.
The amount of water used in growing lettuce in an indoor controlled environment in a hydroponic system is very small. Pennisi et al. [47] showed that in the deep-water culture system for the production of Lactuca sativa cultivars ‘Rebelina’, ‘Gautier’, and ‘Eyragues’ with a biomass weight not exceeding 50 g, only 0.46–0.56 L of water was used per plant. They also showed that lighting conditions affected the efficiency of water use by lettuce plants. The higher the ratio of red to blue light, the higher was the water consumption. In our study, the average consumption of the nutrient solution during the 30 days of cultivation was 6.4 L per container, which gives the value of 1.29 L for the production of one ‘Elizium’ romaine lettuce with a leaf biomass of about 148 g and was not dependent on lighting conditions. The percentage of red light in the entire spectrum in all the lighting combinations used was quite high (60–80%).

3.3. Mineral Composition of Plants

Although the nutrient solutions contained small (A) or moderate (B) amounts of minerals, the concentrations of macro- and microelements in the lettuce plants were within the optimal range for most of the components and quite high for nitrates and potassium [48], which corresponded to a strong decrease in the concentrations of nitrates and K in the nutrient medium (Table 3, Figure 3). The mineral composition of the ‘Elizium’ romaine lettuce plants depended both on the lighting conditions in which the plants were grown, as well as on the nutrient solution used, with the influence of the nutrient solution being much stronger than that of the light quality (Table 3). The lettuce plants grown under RGB 70:18:12 had the lowest K (7.7%) and Mg (0.34%) contents, while under the other light spectra these amounts ranged from 8.1–8.4% for K, and reached the value of 0.41% (on average) for Mg. The amounts of other macronutrients (nitrates, N, P, and Ca) and micronutrients, except for B, did not depend on the quality of the light. The B content was the lowest (57 mg kg−1 d.w.) at RGB 70:18:12. The lettuce plants grown in the hydroponic solution B contained more nitrates by 18%, total N by 4%, P by 5%, and Mg by 8%, but by 9% less K than in solution A. The Ca content in the plants was the same regardless of the solution used (1.2% on average). In the case of microelements, the type of solution did not affect the amounts of Fe and Mn, but the plants grown in solution B contained slightly less Cu and B, and more Zn.
Leafy vegetables, such as lettuce and spinach, contain the highest concentrations of nitrates [49]. The nitrate content in lettuce depends on the N content in the nutrient solution. In a study with flood fertigation of leaf lettuce [35], the nitrate content in the lettuce heads increased with the concentration of the nutrient solution, and at EC 3.0 mS cm−1 exceeded the permissible limit imposed by the European Union. To protect human health, most European countries regulate the nitrate content in vegetables. For lettuce, different limits have been set for protected and open-grown crops [36]. No separate limits have been established for different types of lettuce, such as leaf lettuce and head lettuce. The maximum limits for nitrates in lettuce are 5000 in winter-grown plants and 4000 mg per kg of fresh product in other seasons of the year. The results of our study showed that the concentration of nitrates in the leaves of ‘Elizium’ romaine lettuce (‘head’ type) grown in the indoor controlled environment was quite high (3128–3909 mg kg−1 f.w.) but did not exceed the limits for greenhouse winter crops. The study also showed that the concentration of nitrates in lettuce leaves in an indoor controlled environment could be managed by modifying the mineral composition of the nutrient solution. The nitrate content in the leaves of the lettuce plants grown in solution A with a low nitrate content (130 mg L−1) was significantly lower (3218 mg kg−1 f.w.) than of those grown in solution B with a higher nitrate content (170 mg L−1). The modifications of the spectrum of the light emitted by LEDs at PPFD 160 µmol m−2 s−1 did not significantly affect the concentration of nitrates in the leaves of ‘Elizium’ romaine lettuce despite the wide range of red light to blue light ratio (2.1–7.7) in the spectra tested.
So far, little research has been conducted on the effect of light quality on the mineral composition of lettuce in indoor controlled environments, and the obtained results have been inconclusive [17,27,47,50,51]. The concentration of nitrates in the leaves of Lactuca sativa ‘Grand Rapids’ grown in greenhouse conditions was found to be significantly lower after short-term exposure of the plants to red light of high intensity (PPFD 500 µmol m−2 s−1) [52]. A similar effect was achieved by the alternating use of red light and blue light during the day [17] and a high ratio of red to blue light with a simultaneous periodic change in light intensity [51]. The addition of red light to white light generated by LEDs did not reduce the nitrate content in the leaves of Lactuca sativa cultivars ‘Lvdie’ and ‘Ziya’, with green leaves and purple leaves, although it stimulated the production of biomass [53]. By comparison, Liu et al. [54] showed that lamps generating a wide spectrum of light, such as fluorescent lamps and high-pressure sodium lamps (HPS), were more effective in reducing nitrates in lettuce than the combination of red light with blue light.
Amoozgar et al. [39] showed that Lactuca sativa ‘Grizzly’ grown in an indoor controlled environment accumulated much greater amounts of minerals in the leaves than when grown in a greenhouse. The concentration of macronutrients in the plants in the indoor controlled environment was on average 2 to 4 times higher than in greenhouse cultivation. ‘Outredgeous’ romaine lettuce had a much greater ability to accumulate K than other minerals [27]. Monochromatic red light increased the accumulation of K, P, and Fe, while red light combined with blue light increased the accumulation of N and Mg in the leaves [39]. Clavijo-Herrera et al. [55] and Pennisi et al. [47] showed that the accumulation of N in lettuce leaves did not depend on the ratio of red to blue light generated by LEDs. Our study showed that the tested ratios of red light to blue light, i.e., 80:10, 70:20, and 60:30 with the same proportion of green light (10%), did not significantly affect the accumulation of macro- or micronutrients in the leaves of ‘Elizium’ romaine lettuce, but with a higher proportion of green light (RGB 70:18:12) the plants contained less K and Mg, which may be due to the dilution effect, as these plants had the highest fresh weight. Increasing the blue-to-red light ratio from 0.1 to 4.5 had negatively affected biomass production and leaf growth of oakleaf lettuce Lactuca sativa ‘Rouxai’, but increased the concentrations of nitrogen, magnesium, zinc, and copper in the plants [56]. Similarly, in the case of ‘Outredgeous’ romaine lettuce, increasing the proportion of blue light relative to white light had increased the concentrations of K, Ca, Mg, and P in the plants, but the resulting plants were the smallest and had the lowest weight [27].
Our study showed that the quality of the LED-generated light with a red-to-blue ratio of 2.1–7.7, and also the concentrations of Ca in the nutrient solution, 170 and 200 mg L−1, had no major effect on the accumulation of Ca in the leaves of ‘Elizium’ romaine lettuce. The average Ca content in the plants was 1.2%. At the same time, withering of the edges of young leaves (tipburn) was observed, and these symptoms were more common on the lettuce plants grown in the solution with the higher mineral content (B) and under RGB 70:10:20 and RGB 70:18:12. One of the main causes of the physiological disturbances causing tipburn is insufficient supply of Ca to young romaine lettuce leaves [29,57,58,59]. In our study, we observed increasing Ca concentrations in the hydroponic medium, and therefore the Ca concentration in the medium was not a direct cause of tipburn on lettuce leaves. Ca is not transported from older leaves to the younger ones, as a result of which the Ca content in mature lettuce leaves is higher than in young leaves [59,60,61]. Ca is transported from the roots to the leaves via the xylem and this process depends on the intensity of transpiration. Air humidity in an indoor controlled environment in hydroponic cultivation is usually high, which can create problems with adequately supplying Ca to young leaves [62], and this problem may especially concern the head-forming types of lettuce, such as crisphead lettuce and romaine lettuce. Lettuce plants grown in the DFT (Deep Flow Technique) hydroponic system have shown more severe tipburn symptoms than when grown in solid media [42]. The cause of the disturbances may also be an imbalance between the individual mineral components in the leaves, especially potassium and calcium [59]. There is little data on the accumulation of Ca in lettuce leaves depending on light quality. Increased Ca accumulation in plants has been obtained under LED lamps emitting white light compared to monochromatic red light and red light in combination with blue light [39], as well as under white light supplemented with blue light [27]. By contrast, Pennisi et al. [47] showed that the accumulation of Ca did not depend on the quality of light even if there was a relatively large variation in the ratio of red light to blue light (from 0.5 to 4).

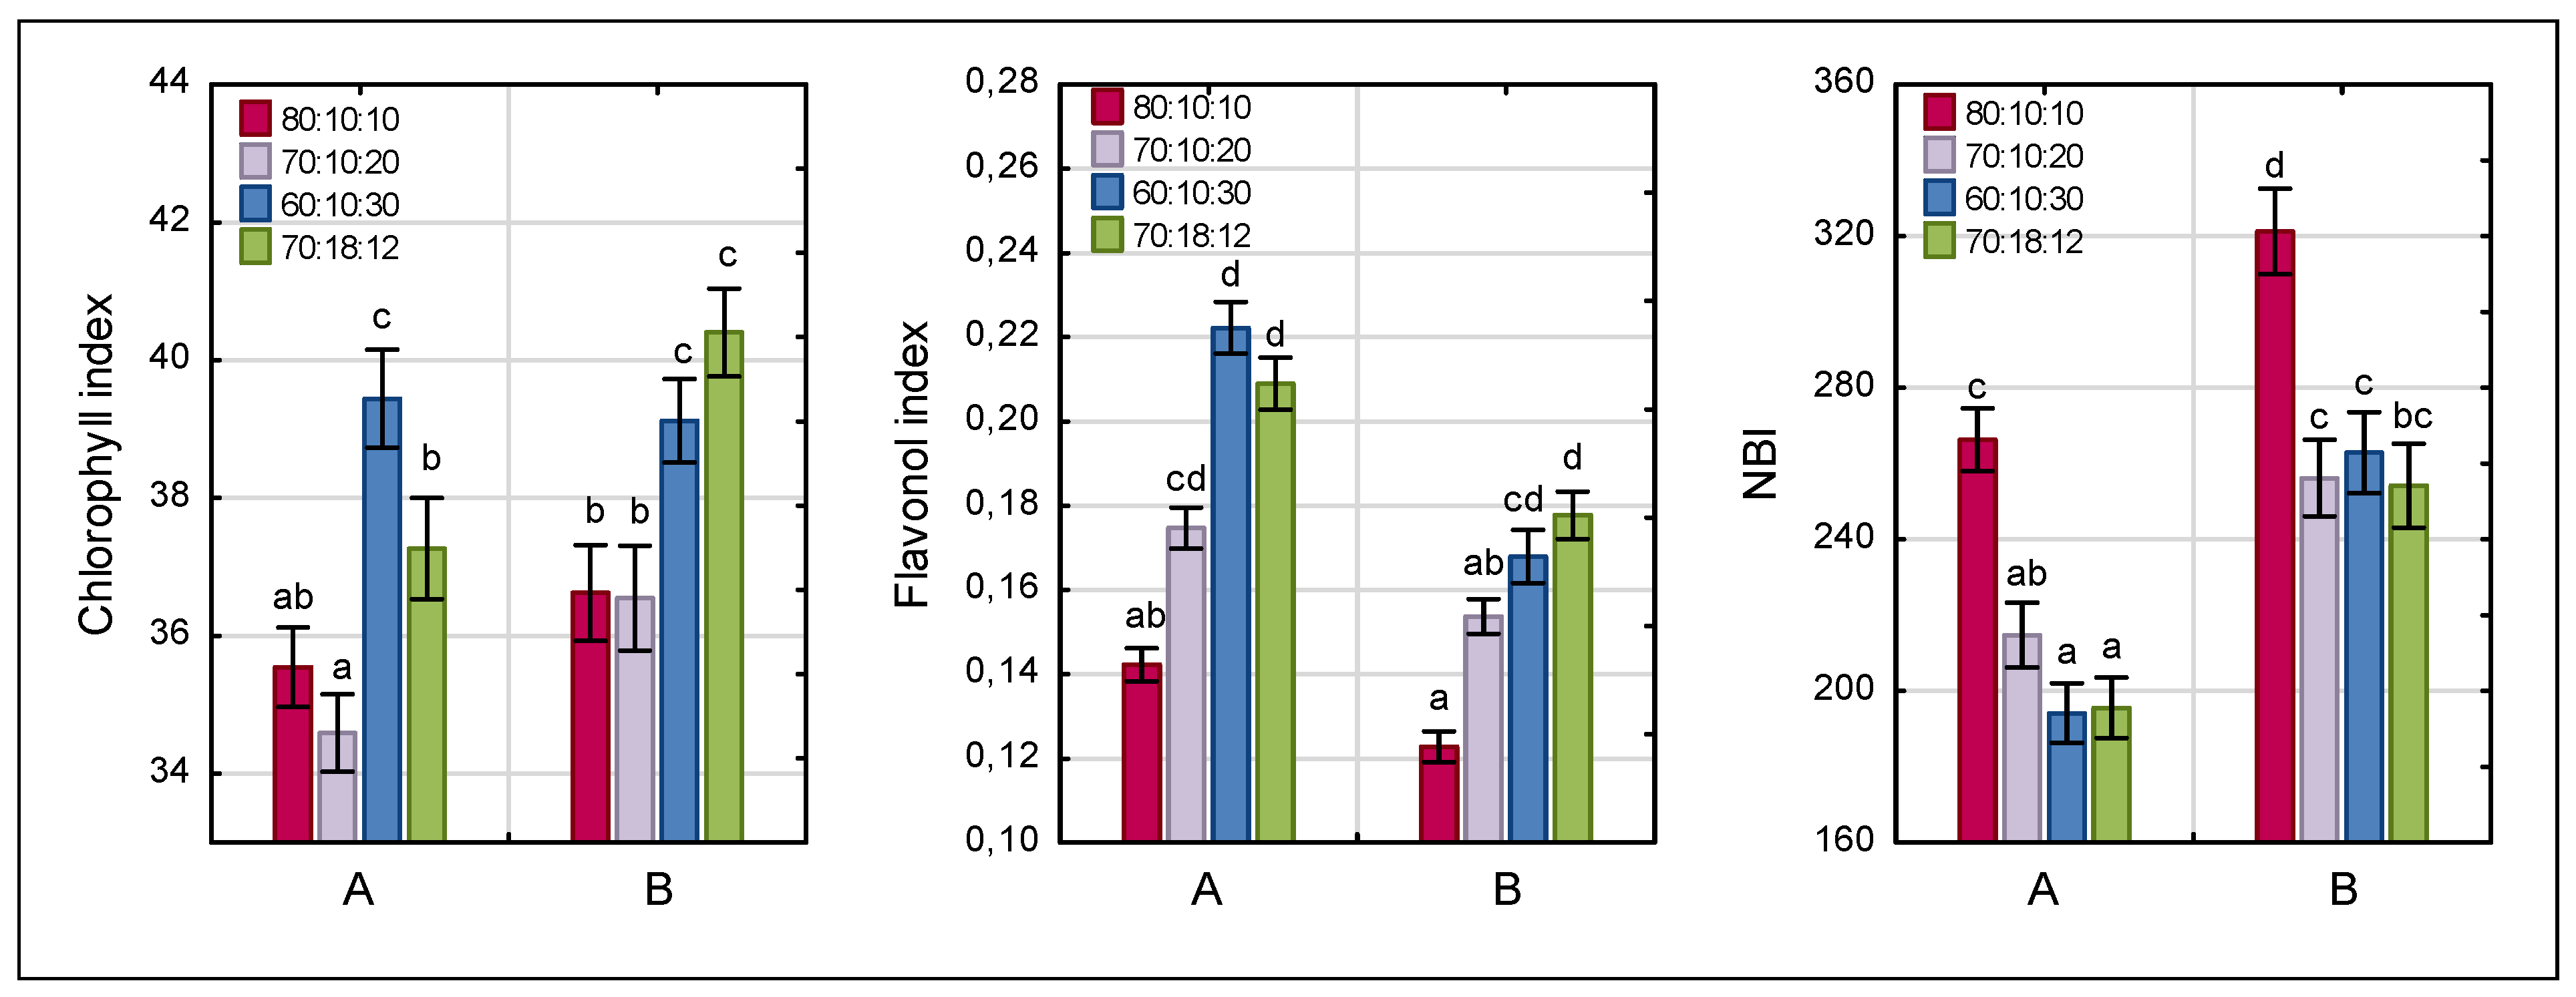
3.4. Chlorophyll, Flavonol, and Nitrogen Balance Indices

Dualex Scientific+ is an innovative testing device designed for non-destructive measurements of the chlorophyll, flavonol, and nitrogen balance (NBI) indices in plants, and is used to monitor the nitrogen nutritional status of plants. Ouzounis et al. [63] confirmed the high correlation of the flavonol index determined with Dualex Scientific+ with the concentrations of flavonoids such as rutin and quercetin determined with the HPLC technique. Tremblay et al. [64], Padilla et al. [65], Agati et al. [66], and Kaniszewski et al. [67] confirmed the high correlation of the NBI index with the nutritional status of plants with respect to nitrogen.
The measurements made with the Dualex Scientific+ device when the plants of ‘Elizium’ romaine lettuce had obtained its marketable size showed that both the quality of light and the type of nutrient solution used significantly affected the chlorophyll, flavonol, and NBI indices in the leaves (Figure 4). However, no significant interaction was found between the quality of light and the nutrient solution. Irrespective of the nutrient solution used, the highest values of the flavonol index, as well as that of chlorophyll, were recorded for the lettuce plants grown with an increased proportion of blue light (RGB 60:10:30) and green light (RGB 70:18:12). The flavonol index in the leaves of the plants grown under these lighting conditions was 46% higher than under RGB 80:10:10 and 19% higher than under RGB 70:10:20. The highest value of the NBI index was shown by the plants growing under RGB 80:10:10, and this index was 31% higher than the values recorded for the other three spectra of light emitted by the LEDs. The measurements also revealed that the flavonol index in the leaves of the plants growing in solution A was 21% higher than in solution B, while the chlorophyll and NBI indices were lower by 4% and 25%, respectively, than in solution B.
Our observations are generally consistent with the results of other authors relating to the various genotypes of lettuce, which indicate that blue light has a significant impact on the synthesis of bioactive compounds, including flavonoids [10,11,12,20,66,68]. In the case of red-leaf lettuce, supplementation of white light or red light with blue light has stimulated leaf pigmentation and the synthesis of secondary metabolites [27]. Increased levels of phytonutrients, including flavonoids, have been obtained after exposing lettuce plants to blue light with red light [69]. The biosynthesis of flavonoids is also affected by the nutritional status of plants with respect to nitrogen. Flavonoids, as nitrogen-free secondary metabolites, are considered indicators of nitrogen availability in the plant [70]. The concentrations of flavonoids increase with a low N availability. The highest level of flavonoids in lettuce leaves has been obtained with a medium containing the lowest tested mineral concentration [71]. It has also been shown that a high C/N ratio in plants stimulated the production of flavonoids, whereas a low C/N ratio inhibited their production [72]. In a study with cabbage [67], it was demonstrated that the chlorophyll index and the nitrogen balance index (NBI) were positively correlated with the N content in the leaves, whereas the flavonol index was negatively correlated. Similar relationships were evident in our study. The flavonol index was the highest for the nutrient solution with the low mineral content (A), while the high Chl and NBI indices corresponded to the low flavonol index. Our study also showed that the lettuce plants grown with an increased proportion of green light (RGB 70:18:12) were characterized by a high flavonol index and, at the same time, a low NBI index, while the nitrate concentration in the leaves was below the permissible limit. The resultant plants had the highest leaf fresh weight.

4. Conclusions

The quality of the light generated by LEDs significantly affects the rate of biomass production and the nutritional status of ‘Elizium’ romaine lettuce type ‘mini’ in an indoor controlled environment. Among the tested lighting combinations with different ratios of R, G, and B lights (80:10:10, 70:10:20, 60:10:30, and 70:18:12), the RGB 70:18:12 light promoted the production of leaf biomass, inhibited the accumulation of potassium in the leaves. Moreover, those plants were characterized by a low NBI index and a high flavonol index. In indoor cultivation, romaine lettuce accumulates significant amounts of minerals, especially nitrates and potassium. To achieve rapid growth of ‘Elizium’ romaine lettuce at a light intensity (PPFD) of 160 µmol m−2 s−1 and a 16-h photoperiod, it is sufficient for the nutrient solution to have a low concentration of minerals with the following composition (in mg L−1): N-NO3—130, N-NH4—11, P—40, K—180, Ca—200, Mg—35, and EC 1.6 mS cm−1. A relatively small increase in the concentration of minerals in the medium, on average by 25% (EC 2.0 mS m−2 s−1), significantly reduced the parameters related to food quality; there was a decrease in the flavonol index, an increase in the NBI index, and in the concentration of nitrates in plants, and at the same time the problem of withering of the tips of young leaves (tipburn) intensified.

Author Contributions

Conceptualization, B.M.; funding acquisition, S.K.; investigation, B.M., W.K. and A.K.; methodology, B.M., W.K. and J.D.; project administration, S.K. and M.G.; resources, B.M.; supervision, S.K.; writing—original draft, B.M.; writing—review and editing, B.M. and S.K. All authors have read and agreed to the published version of the manuscript.

Funding

This work was supported by funding through The National Centre for Research and Development in Poland, project number POIR. 01.01.01-00-0579/19, project title “Plantlab—innovative system of year-round production of romaine lettuce and freshwater fish in aquaponic technology”.

Institutional Review Board Statement

Not applicable.

Informed Consent Statement

Informed consent was obtained from all subjects involved in the study.

Data Availability Statement

The data presented in this study are available on request from the corresponding author.

Conflicts of Interest

The authors declare no conflict of interest.

References

  1. Kozai, T.; Niu, G. Plant factory as a resource-efficient closed plant production system. In Plant Factory: An Indoor Vertical Farming System for Efficient Quality Food Production; Academic Press: Cambridge, MA, USA, 2016; pp. 69–90. [Google Scholar]
  2. Kalantari, F.; Mohd Tahir, O.; Mahmoudi Lahijani, A.; Kalantari, S. A review of vertical farming technology: A guide for implementation of building integrated agriculture in cities. Adv. Eng. Forum 2017, 24, 76–91. [Google Scholar] [CrossRef]
  3. Ohashi-Kaneko, K. Functional components in leafy vegetables. In Plant Factory: An Indoor Vertical Farming System for Efficient Quality Food Production; Academic Press: Cambridge, MA, USA, 2016; pp. 177–185. [Google Scholar]
  4. Gómez, C.; Jiménez, J. Effect of end-of-production high-energy radiation on nutritional quality of indoor-grown red-leaf lettuce. HortScience 2020, 55, 1055–1060. [Google Scholar] [CrossRef]
  5. Graamans, L.; Baeza, E.; van den Dobbelsteen, A.; Tsafaras, I.; Stanghellini, C. Plant factories versus greenhouses: Comparison of resource use efficiency. Agric. Syst. 2018, 160, 31–43. [Google Scholar] [CrossRef]
  6. van Iersel, M.W. Optimizing LED lighting in controlled environment agriculture. In Light Emitting Diodes for Agriculture; Springer: Singapore, 2017; pp. 59–80. [Google Scholar]
  7. Lin, K.-H.; Huang, M.-Y.; Huang, W.-D.; Hsu, M.-H.; Yang, Z.-W.; Yang, C.-M. The effects of red, blue, and white light-emitting diodes on the growth, development, and edible quality of hydroponically grown lettuce (Lactuca sativa L. var. capitata). Sci. Hort. 2013, 150, 86–91. [Google Scholar] [CrossRef]
  8. Kang, W.H.; Park, J.S.; Park, K.S.; Son, J.E. Leaf photosynthetic rate, growth, and morphology of lettuce under different fractions of red, blue, and green light from light-emitting diodes (LEDs). Hortic. Environ. Biotechnol. 2016, 57, 573–579. [Google Scholar] [CrossRef]
  9. Ohashi-Kaneko, K.; Takase, M.; Kon, N.; Fujiwara, K.; Kurata, K. Effect of light quality on growth and vegetable quality in leaf lettuce, spinach and komatsuna. Environ. Control Biol. 2007, 45, 189–198. [Google Scholar] [CrossRef] [Green Version]
  10. Son, K.H.; Oh, M.M. Leaf shape, growth, and antioxidant phenolic compounds of two lettuce cultivars grown under various combinations of blue and red light-emitting diodes. HortScience 2013, 48, 988–995. [Google Scholar] [CrossRef]
  11. Lee, J.S.; Lim, T.G.; Kim, Y.H. Growth and phytochemicals in lettuce as affected by different ratios of blue to red LED radiation. Acta Hortic. 2014, 1037, 843–848. [Google Scholar] [CrossRef]
  12. Shen, Y.Z.; Guo, S.S.; Ai, W.D.; Tang, Y.K. Effects of illuminants and illumination time on lettuce growth, yield and nutritional quality in a controlled environment. Life Sci. Space Res. 2014, 2, 38–42. [Google Scholar] [CrossRef]
  13. Han, T.; Vaganov, V.; Cao, S.; Li, Q.; Ling, L.; Cheng, X.; Pen, L.; Zhang, C.; Yakovlev, A.N.; Zhong, Y.; et al. Improving “color rendering” of LED lighting for the growth of lettuce. Sci. Rep. 2017, 7, 45944. [Google Scholar] [CrossRef]
  14. Liu, H.; Fu, Y.; Hu, D.; Yu, J.; Liu, H. Effect of green, yellow and purple radiation on biomass, photosynthesis, morphology and soluble sugar content of leafy lettuce via spectral wavebands “knock out”. Sci. Hortic. 2018, 236, 10–17. [Google Scholar] [CrossRef]
  15. He, J.; Qin, L.; Chow, W.S. Impacts of LED spectral quality on leafy vegetables: Productivity closely linked to photosynthetic performance or associated with leaf traits? Int. J. Agric. Biol. Eng. 2019, 12, 16–25. [Google Scholar] [CrossRef]
  16. Chang, C.L.; Chang, K.P. The growth response of leaf lettuce at different stages to multiple wavelength-band light-emitting diode lighting. Sci. Hortic. 2014, 179, 78–84. [Google Scholar] [CrossRef]
  17. Chen, X.L.; Guo, W.Z.; Xue, X.Z.; Wang, L.C.; Qiao, X.J. Growth and quality responses of ‘Green Oak Leaf’ lettuce as affected by monochromic or mixed radiation provided by fluorescent lamp (FL) and light-emitting diode (LED). Sci. Hortic. 2014, 172, 168–175. [Google Scholar] [CrossRef]
  18. Wang, J.; Lu, W.; Tong, Y.; Yang, Q. Leaf morphology, photosynthetic performance, chlorophyll fluorescence, stomatal development of lettuce (Lactuca sativa L.) exposed to different ratios of red light to blue light. Front. Plant Sci. 2016, 7, 250. [Google Scholar] [CrossRef] [Green Version]
  19. Azad, O.K.; Kjaer, K.H.; Adnan, M.; Naznin, M.T.; Lim, J.D.; Sung, I.J.; Park, C.H.; Lim, Y.S. The evaluation of growth performance, photosynthetic capacity, and primary and secondary metabolite content of leaf lettuce grown under limited irradiation of blue and red LED light in an urban plant factory. Agriculture 2020, 10, 28. [Google Scholar] [CrossRef] [Green Version]
  20. Son, K.H.; Lee, J.H.; Oh, Y.; Kim, D.; Oh, M.M.; In, B.C. Growth and bioactive compound synthesis in cultivated lettuce subject to light-quality changes. HortScience 2017, 52, 584–591. [Google Scholar] [CrossRef]
  21. Johkan, M.; Shoji, K.; Goto, F.; Hashida, S.N.; Yoshihara, T. Blue light-emitting diode light irradiation of seedlings improves seedling quality and growth after transplanting in red leaf lettuce. HortScience 2010, 45, 1809–1814. [Google Scholar] [CrossRef] [Green Version]
  22. Muneer, S.; Kim, E.-J.; Park, J.-S.; Lee, J.-H. Influence of green, red and blue light emitting diodes on multiprotein complex proteins and photosynthetic activity under different light intensities in lettuce leaves (Lactuca sativa L.). Int. J. Mol. Sci. 2014, 515, 4657–4670. [Google Scholar] [CrossRef] [Green Version]
  23. Kim, H.H.; Goins, G.D.; Wheeler, R.M.; Sager, J.C. Green-light supplementation for enhanced lettuce growth under red-and blue light-emitting diodes. HortScience 2004, 39, 1617–1622. [Google Scholar] [CrossRef] [Green Version]
  24. Terashima, I.; Fujita, T.; Inoue, T.; Chow, W.E.; Oguchi, R. Green light drives leaf photosynthesis more efficiently than red light in strong white light: Revisiting the enigmatic question of why leaves are green. Plant Cell Physiol. 2009, 50, 684–697. [Google Scholar] [CrossRef] [Green Version]
  25. Liu, J.; van Iersel, M.W. Photosynthetic physiology of blue, green, and red light: Light intensity effects and underlying mechanisms. Front. Plant Sci. 2021, 12, 619987. [Google Scholar] [CrossRef]
  26. Jishi, T.; Kimura, K.; Matsuda, R.; Fujiwara, K. Effects of temporally shifted irradiation of blue and red LED light on cos lettuce growth and morphology. Sci. Hortic. 2016, 198, 227–232. [Google Scholar] [CrossRef]
  27. Mickens, M.A.; Skoog, E.J.; Reese, L.E.; Barnwell, P.L.; Spencer, L.E.; Massa, G.D.; Wheeler, R.M. A strategic approach for investigating light recipes for ‘Outredgeous’ red romaine lettuce using white and monochromatic LED. Life Sci. Space Res. 2018, 19, 53–62. [Google Scholar] [CrossRef]
  28. Kim, M.J.; Moon, Y.; Kopsell, D.A.; Park, S.; Tou, J.C.; Waterland, N.L. Nutritional value of crisphead ‘Iceberg’ and romaine lettuces (Lactuca sativa L.). J. Agric. Sci. 2016, 8, 734. [Google Scholar] [CrossRef] [Green Version]
  29. Sago, Y. Effects of light intensity and growth rate on tipburn development and leaf calcium concentration in butterhead lettuce. HortScience 2016, 51, 1087–1091. [Google Scholar] [CrossRef]
  30. Jenni, S.; Hayes, R.J. Genetic variation, genotype × environment interaction, and selection for tipburn resistance in lettuce in multi-environments. Euphytica 2010, 171, 427–439. [Google Scholar] [CrossRef]
  31. Fu, W.; Li, P.; Wu, Y.; Tang, J. Effects of different light intensities on anti-oxidative enzyme activity, quality and biomass in lettuce. Sci. Hort. 2012, 39, 129–134. [Google Scholar]
  32. Brazaitytè, A.; Miliauskienè, J.; Vaštakaitè-Kairienè, V.; Sutulienè, R.; Laužikè, K.; Duchovskis, P.; Małek, S. Effect of different ratios of blue and red LED light on Brassicaceae microgreens under a controlled environment. Plants 2021, 10, 801. [Google Scholar] [CrossRef] [PubMed]
  33. Kyriacou, M.C.; El-Nakhel, C.; Pannico, A.; Graziani, G.; Soteriou, G.A.; Giordano, M.; Zarrelli, A.; Ritieni, A.; De Pascale, S.; Rouphael, Y. Genotype-specific modulatory effects of select spectral bandwidths on the nutritive and phytochemical composition of microgreens. Front. Plant Sci. 2019, 10, 1501. [Google Scholar] [CrossRef]
  34. Sabat, T.; Kaniszewski, S.; Dyśko, J. Flood fertigation of leaf lettuce grown in various substrates. J. Elem. 2019, 24, 19–29. [Google Scholar] [CrossRef]
  35. Sabat, T.; Kaniszewski, S.; Dyśko, J. Effect of flood fertigation on yield of greenhouse lettuce grown in different substrates. J. Elem. 2015, 20, 407–416. [Google Scholar] [CrossRef] [Green Version]
  36. European Commission. European Commission Regulation EC No. 1881/2006 of 19 December 2006 setting maximum levels for certain contaminants in foodstuffs. Off. J. Eur. Union 2006, 364, 5–24. [Google Scholar]
  37. Boss, C.H.; Fredeen, K.J. Concepts, Instrumentation, and Techniques in Inductively Coupled Plasma Optical Emission Spectrometry, 3rd ed.; Perkin Elmer: Shelton, CT, USA, 2004; Available online: https://www.perkinelmer.com/lab-solutions/resources/docs/GDE_Concepts-of-ICP-OES-Booklet.pdf (accessed on 5 January 2021).
  38. Latimer, G., Jr. Official Methods of Analysis, 19th ed.; AOAC International: Gaithersburg, MD, USA, 2012; ISBN 978-0-935584-83-7. [Google Scholar]
  39. Amoozgar, A.; Mohammadi, A.; Sabzalian, M.R. Impact of light-emitting diode irradiation on photosynthesis, phytochemical composition and mineral element content of lettuce cv. Grizzly. Photosynthetica 2017, 55, 85–95. [Google Scholar] [CrossRef]
  40. Meng, Q.; Runkle, E.S. Growth responses of red-leaf lettuce to temporal spectral changes. Front. Plant Sci. 2020, 11, 571788. [Google Scholar] [CrossRef]
  41. Wissemeier, A.H.; Zühlke, G. Relation between climatic variables, growth and the incidence of tipburn in field-grown lettuce as evaluated by simple, partial and multiple regression analysis. Sci. Hortic. 2002, 93, 193–204. [Google Scholar] [CrossRef]
  42. Assimakopoulou, A.; Kotsiras, A.; Nifakos, K. Incidence of lettuce tipburn as related to hydroponic system and cultivar. J. Plant Nutr. 2013, 36, 1383–1400. [Google Scholar] [CrossRef]
  43. Carotti, L.; Graamans, L.; Puksic, F.; Butturini, M.; Meinen, E.; Heuvelink, E.; Stanghellini, C. Plant factories are heating up: Hunting for the best combination of light intensity, air temperature and root-zone temperature in lettuce production. Front. Plant Sci. 2021, 11, 592171. [Google Scholar] [CrossRef] [PubMed]
  44. Jenni, S.; Truco, M.J.; Michelmore, R.W. Quantitative trait loci associated with tipburn, heat stress-induced physiological disorders, and maturity traits in crisphead lettuce. Theor. Appl. Genet. 2013, 126, 3065–3079. [Google Scholar] [CrossRef] [PubMed]
  45. Holmes, S.C.; Wells, D.E.; Pickens, J.M.; Kemble, J.M. Selection of heat tolerant lettuce (Lactuca sativa L.) cultivars grown in deep water culture and their marketability. Horticulturae 2019, 5, 50. [Google Scholar] [CrossRef] [Green Version]
  46. Macias-González, M.; Truco, M.J.; Bertier, L.D.; Jenni, S.; Simko, I.; Hayes, R.J.; Michelmore, R.W. Genetic architecture of tipburn resistance in lettuce. Theor. Appl. Genet. 2019, 132, 2209–2222. [Google Scholar] [CrossRef]
  47. Pennisi, G.; Orsini, F.; Blasioli, S.; Cellini, A.; Crepaldi, A.; Braschi, I.; Spinelli, F.; Nicola, S.; Fernandez, J.; Stanghellini, C.; et al. Resource use efficiency of indoor lettuce (Lactuca sativa L.) cultivation as affected by red:blue ratio provided by LED lighting. Sci. Rep. 2019, 9, 14127. [Google Scholar] [CrossRef] [PubMed]
  48. Maynard, D.N.; Hochmuth, G.J. Knott’s Handbook for Vegetable Growers, 5th ed.; John Wiley and Sons: Hoboken, NJ, USA, 2013; p. 642. ISBN 978-1-118-68610-2. [Google Scholar]
  49. Iammarino, M.; Taranto, A.; Cristino, M. Monitoring of nitrites and nitrates levels in leafy vegetables (spinach and lettuce): A contribution to risk assessment. J. Sci. Food Agric. 2014, 94, 773–778. [Google Scholar] [CrossRef]
  50. Pinho, P.; Jokinen, K.; Halonen, L. The influence of the LED light spectrum on the growth and nutrient uptake of hydroponically grown lettuce. Lighting Res. Technol. 2017, 49, 866–881. [Google Scholar] [CrossRef]
  51. Loconsole, D.; Cocetta, C.; Santoro, P.; Ferrante, A. Optimization of LED lighting and quality evaluation of Romaine Lettuce grown in an innovative indoor cultivation system. Sustainability 2019, 11, 841. [Google Scholar] [CrossRef] [Green Version]
  52. Samuolienė, G.; Samuolienė, A.; Duchovskis, P.; Bliznikas, Z.; Vitta, P.; Žukauskas, A. Decrease in nitrate concentration in leafy vegetables under a solid-state illuminator. HortScience 2009, 44, 1857–1860. [Google Scholar] [CrossRef]
  53. Yan, Z.; He, D.; Niu, G.; Zhou, Q.; Qu, Y. Growth, nutritional quality, and energy use efficiency of hydroponic lettuce as influenced by daily light integrals exposed to white versus white plus red light-emitting diodes. Hortscience 2019, 54, 1737–1744. [Google Scholar] [CrossRef] [Green Version]
  54. Liu, H.; Fu, Y.; Yu, J.; Liu, H. Accumulation and primary metabolism of nitrate in lettuce (Lactuca sativa L. var. Youmaica) grown under three different light sources. Commun. Soil Sci. Plant Anal. 2016, 47, 1994–2002. [Google Scholar] [CrossRef]
  55. Clavijo-Herrera, J.; van Santen, E.; Gómez, C. Growth, water-use efficiency, stomatal conductance, and nitrogen uptake of two lettuce cultivars grown under different percentages of blue and red light. Horticulturae 2018, 4, 16. [Google Scholar] [CrossRef] [Green Version]
  56. Meng, Q.; Boldt, J.; Runkle, E.S. Blue radiation interacts with green radiation to influence growth and predominantly controls quality attributes of lettuce. J. Am. Soc. Hortic. Sci. 2020, 145, 75–87. [Google Scholar] [CrossRef] [Green Version]
  57. Ashkar, S.A.; Ries, S.K. Lettuce tipburn as related to nutrient imbalance and nitrogen composition. J. Am. Soc. Hortic. Sci. 1971, 96, 448–452. [Google Scholar]
  58. Saure, M.C. Causes of the tipburn disorder in leaves of vegetables. Sci. Hortic. 1998, 76, 131–147. [Google Scholar] [CrossRef]
  59. Barta, D.J.; Tibbitts, T.W. Calcium localization and tipburn development in lettuce leaves during early enlargement. J. Am. Soc. Hortic. Sci. 2000, 125, 294–298. [Google Scholar] [CrossRef] [Green Version]
  60. Gilliham, M.; Dayod, M.; Hocking, B.J.; Xu, B.; Conn, S.J.; Kaiser, B.N.; Leigh, R.A.; Tyerman, S.D. Calcium delivery and storage in plant leaves: Exploring the link with water flow. J. Exp. Bot. 2011, 62, 2233–2250. [Google Scholar] [CrossRef] [PubMed]
  61. Birlanga, V.; Acosta-Motos, J.R.; Pérez-Pérez, J.M. Genotype-dependent tipburn severity during lettuce hydroponic culture is associated with altered nutrient leaf content. Agronomy 2021, 11, 616. [Google Scholar] [CrossRef]
  62. Lee, J.G.; Choi, C.S.; Jang, Y.A.; Jang, S.W.; Lee, S.G.; Um, Y.C. Effects of air temperature and air flow rate control on the tipburn occurrence of leaf lettuce in a closed-type plant factory system. Hortic. Environ. Biotechnol. 2013, 54, 303–310. [Google Scholar] [CrossRef]
  63. Ouzounis, T.; Fretté, X.; Rosenqvist, E.; Ottosen, C.-O. Spectral effects of supplementary lighting on the secondary metabolites in roses, chrysanthemums, and campanulas. J. Plant Physiol. 2014, 171, 1491–1499. [Google Scholar] [CrossRef]
  64. Tremblay, N.; Wang, Z.; Cerovic, Z. Sensing crop nitrogen status with fluorescence indicators. A review. Agron. Sustain. Dev. 2012, 32, 451–464. [Google Scholar] [CrossRef] [Green Version]
  65. Padilla, F.M.; Peña-Fleitas, M.T.; Gallardo, M.; Thompson, R.B. Proximal optical sensing of cucumber N status using chlorophyll fluorescence indices. Eur. J. Agron. 2015, 73, 83–97. [Google Scholar] [CrossRef]
  66. Agati, G.; Tuccio, L.; Kusznierewicz, B.; Chmiel, T.; Bartoszek, A.; Kowalski, A.; Grzegorzewska, M.; Kosson, R.; Kaniszewski, S. Nondestructive optical sensing of flavonols and chlorophyll in white head cabbage (Brassica oleracea L. var. capitata subvar. alba) grown under different nitrogen regimens. J. Agric. Food Chem. 2016, 64, 85–94. [Google Scholar] [CrossRef]
  67. Kaniszewski, S.; Kowalski, A.; Dyśko, J.; Agati, G. Application of a combined transmittance /fluorescence leaf clip sensor for the non-destructive determination of nitrogen status in white cabbage plants. Sensors 2021, 21, 482. [Google Scholar] [CrossRef] [PubMed]
  68. Matysiak, B.; Kowalski, A. The growth, photosynthetic parameters and nitrogen status of basil, coriander and oregano grown under different led light spectra. Acta Sci. Pol. Hortorum Cultus 2021, 20, 13–22. [Google Scholar] [CrossRef]
  69. Hooks, T.; Masabni, J.; Sun, L.; Niu, G. Effect of pre-harvest supplemental UV-A/Blue and Red/Blue LED lighting on lettuce growth and nutritional quality. Horticulturae 2021, 7, 80. [Google Scholar] [CrossRef]
  70. Deng, B.; Li, Y.; Xu, D.; Qingqing, Y.; Guihua, L. Nitrogen availability alters flavonoid accumulation in Cyclocarya paliurus via the effects on the internal carbon/nitrogen balance. Sci. Rep. 2019, 9, 2370. [Google Scholar] [CrossRef]
  71. Song, J.; Huang, H.; Hao, Y.; Song, S.; Zhang, Y.; Liu, H. Nutritional quality, mineral and antioxidant content in lettuce affected by interaction of light intensity and nutrient solution concentration. Sci. Rep. 2020, 10, 2796. [Google Scholar] [CrossRef] [Green Version]
  72. Wan, H.; Zhang, J.; Song, T.; Tian, J.; Yao, Y. Promotion of flavonoid biosynthesis in leaves and calli of ornamental crab apple (Malus sp.) by high carbon to nitrogen ratios. Front. Plant Sci. 2015, 6, 673. [Google Scholar] [CrossRef] [Green Version]
Figure 1. Spectral photon flux distribution for the 4 LED light treatments in vertical cultivation of romaine lettuce; fraction of integral photon flux ranging from 340 to 780 nm in red R 600–699 nm, green G 500–599 nm, and blue B 400–499 nm (Y-axis—relative values from 0 to 100%).
Agriculture 11 01133 g001
Figure 2. Fresh weight of leaves, plant height, plant diameter, number of leaves per plant, number of tipburn leaves per plant, and head circumference of ‘Elizium’ romaine lettuce grown in a hydroponic system in different nutrient solutions (S and M) under four different light spectra (R:G:B—80:10:10, 70:10:20, 60:10:30, and 70:18:12) in an indoor controlled environment. Bars represent means ± SE. Means followed by the same letter are not significantly different (p < 0.05) according to Tukey’s HSD test.
Agriculture 11 01133 g002
Figure 3. pH, electrical conductivity (EC), nitrate nitrogen (N-NO3), phosphorus, potassium, calcium, magnesium, and sulfates contents in two different nutrient solutions (A and B) at weekly intervals from 25 January to 22 February 2021, for ‘Elizium’ romaine lettuce grown in a hydroponic system. Each data point is the average (±SE) for the four different light spectra (R:G:B).
Agriculture 11 01133 g003
Figure 4. Chlorophyll index, flavonol index, and nitrogen balance index (NBI) of ‘Elizium’ romaine lettuce grown in a hydroponic system with different mineral concentrations of nutrient solution (A and B) under illumination with four different light spectra (R:G:B—80:10:10, 70:10:20, 60:10:30, and 70:18:12) in an indoor controlled environment. Bars represent the means ± SE. Means followed by the same letter are not significantly different (p < 0.05) according to Tukey’s HSD test.
Agriculture 11 01133 g004
Table 1. Spectral photon flux PPF (µmol s−1) for the 4 LED light spectra in vertical cultivation of romaine lettuce (fraction of integral photon flux ranging from 340 to 780 nm in ultraviolet, blue, green, red, and far-red).
Light Spectrum
R:G:B
(Red:Green:Blue)
UV-A
340–399 nm
Blue
400–499 nm
Green
500–599 nm
Red
600–699 nm
Far-Red
700–780 nm
R:B
Ratio
Total
nm
80:10:10045.245.0349.51.37.7441.0
70:10:20089.642.0306.61.03.4439.2
60:10:300127.446.5267.21.12.1442.2
70:18:12052.080.3304.11.85.8438.2
Table 2. Significance of two-way ANOVA results (p-values) for the effects of light spectrum and nutrient solution on the measurements of biomass, morphological traits, chlorophyll, flavonol, and nitrogen balance indices (NBI) of ‘Elizium’ romaine lettuce.
Growth and Morphological TraitLight SpectrumNutrient SolutionLight Spectrum × Nutrient Solution
Fresh weight of leaves0.00050.95290.2375
Plant height0.01190.00010.3899
Plant diameter0.00010.10180.3182
Head circumference0.00350.39100.3258
Number of leaves per plant0.00090.96730.0734
Percentage tipburn0.00010.00160.7371
Chlorophyll index0.00010.00190.0651
Flavonol index0.00010.00010.0720
NBI0.00010.00010.5550
Significant p-values are shown in bold.
Table 3. Concentrations of nitrate nitrogen (mg kg−1 f.w.), macronutrients (N, P, K, Ca, and Mg, in %) and micronutrients (Fe, Mn, Cu, Zn and B, in mg kg−1 d.w.) in the leaves of ‘Elizium’ romaine lettuce grown in a hydroponic system with different nutrient solutions (A and B) under illumination with four different light spectra (R:G:B—80:10:10, 70:10:20, 60:10:30, and 70:18:12) in an indoor controlled environment.
TreatmentN-NO3NPKCaMgFeMnCuZnB
mg kg−1 f.w.% mg kg−1 d.w.
Light spectrum
R:G:B
80:10:103538 a4.40 a0.66 a8.38 b1.20 a0.41 b124 a149 a6.3 a51 a72 c
70:10:203909 a4.34 a0.66 a8.37 b1.24 a0.41 b135 a126 a6.0 a45 a63 b
60:10:303538 a4.36 a0.65 a8.10 ab1.18 a0.42 b135 a131 a5.8 a48 a58 ab
70:18:123128 a4.24 a0.64 a7.77 a1.18 a0.34 a146 a126 a5.6 a43 a57 a
Nutrient solution
A3218 a4.22 a0.64 a8.52 b1.20 a0.38 a141 a134 a6.5 b43 a69 b
B3899 b4.40 b0.67 b7.79 a1.20 a0.41 b130 a133 a5.4 a50 b55 a
Light spectrum × nutrient solutionn.s.n.s.n.s.n.sn.s.n.s.n.s.n.s.*n.s.*
Sufficient range (%) * -2.1–5.60.5–0.94.0–8.00.9–2.00.4–0.850–20025–2005–1830–20025–65
Means followed by the same letter are not significantly different (p < 0.05) using Tukey’s HSD test, ns = not significant, * Sufficient elemental ranges for the most recently matured leaf of greenhouse-grown lettuce, adapted from “Knott’s Handbook for Vegetable Growers” [48].
Publisher’s Note: MDPI stays neutral with regard to jurisdictional claims in published maps and institutional affiliations.

