Article

Comparative Studies on the Physiological and Biochemical Responses to Salt Stress of Eggplant (Solanum melongena) and Its Rootstock S. torvum

1
Institute for the Conservation and Improvement of Valencian Agrodiversity (COMAV), Universitat Politècnica de València, Camino de Vera 14, 46022 Valencia, Spain
2
Faculty of Biology, Instituto Tecnológico de Costa Rica, Avenida 14, calle 5, 30101 Cartago, Costa Rica
3
Mediterranean Agroforestry Institute (IAM), Universitat Politècnica de València, Camino de Vera 14, 46022 Valencia, Spain
*
Author to whom correspondence should be addressed.
Agriculture 2020, 10(8), 328; https://doi.org/10.3390/agriculture10080328
Submission received: 29 June 2020 / Revised: 29 July 2020 / Accepted: 31 July 2020 / Published: 4 August 2020
(This article belongs to the Special Issue Plant Environmental Stress Physiology and Metabolism)

Abstract

:
This study investigated the physiological and biochemical responses to salinity stress of Solanum melongena and its wild relative, Solanum torvum, commonly used as eggplant rootstock. Young plants of both species were watered during 25 days with NaCl aqueous solutions at the following four final concentrations: 0 (for the controls), 100, 200, and 300 mM. Plant growth parameters, photosynthetic pigments content, monovalent ion concentrations in roots and leaves, leaf levels of osmolytes (proline and total soluble sugars), oxidative stress markers (MDA and H2O2), non-enzymatic antioxidants (total phenolic compounds and total flavonoids), and enzymatic antioxidant activities (superoxide dismutase, catalase, glutathione reductase) were determined after the stress treatments. Salt-induced growth reduction was more significant in S. melongena than in S. torvum, especially at high salt concentrations, indicating a (slightly) higher salt tolerance of the wild species. The mechanisms of tolerance of S. torvum were partly based on the active transport of toxic ions to the leaves at high external salinity and, presumably, a better capacity to store them in the vacuoles, as well as on the accumulation of proline to higher concentrations than in the cultivated eggplant. MDA and H2O2 contents did not vary in response to the salt treatments in S. torvum. However, in S. melongena, MDA content increased by 78% when 300 mM NaCl was applied. No activation of antioxidant mechanisms, accumulation of antioxidant compounds, or increase in the specific activity of antioxidant enzymes in any of the studied species was induced by salinity. The relatively high salt tolerance of S. torvum supports its use as rootstock for eggplant cultivation in salinized soils and as a possible source of salt-tolerance genes for the genetic improvement of cultivated eggplant.

1. Introduction

The pressure exerted on the agricultural production chains due to the continuous increase in world population will require increasing crop production by 70% by the year 2050 [1]. Agriculture faces the challenge of producing more food in an available arable land area that is progressively decreasing and, at the same time, dealing with adverse conditions such as those generated by climate change [2].
Salinized soils represent a problem with a significant impact on food security. Soil salinity reduces agricultural yields by causing metabolic changes that affect plant growth and development. It is estimated that more than 800 million hectares of land are currently affected by salinity globally, and it is expected that this figure will increase in the coming years [3]. The use of different crop species or varieties of a given crop that perform better on land affected by salinity would be an economically viable option for increasing agricultural yields and food production [4]. Eggplant (Solanum melongena) is the fifth most economically important crop within the Solanaceae family and is considered by the Food and Agriculture Organization of the United Nations (FAO) as one of the 35 foods with the most considerable relevance for world food security [5]. Eggplant is a species sensitive to salinity and, therefore, is not well adapted to saline soils [6]. However, this trait could be enhanced by genetic improvement and also by the use as rootstocks of some related wild species that have more growth capacity in saline soils [7,8].
Solanum torvum has been used extensively as rootstock for eggplant and tomato [8,9,10,11] for its good agronomic performance and tolerance to some bacterial and fungal diseases. As S. torvum and eggplant are genetically related, it is likely that their physiological and biochemical responses to salt stress are qualitatively similar, even though they may differ quantitatively. Correlation of the relative degree of salt tolerance of the two species with the stress-induced changes in the levels of different stress biomarkers associated to specific responses to salinity, may provide relevant information on the mechanisms of salt tolerance in these and related taxa.
The most general and rapid effect of salt stress (and other stress conditions) on plants, is the reduction of their growth, as they redirect metabolic and energetic resources from biomass accumulation to the activation of defense mechanisms [12,13]. Therefore, salt-induced inhibition of growth represents an appropriate criterion to compare the relative tolerance of different plant species. Salinity is often associated with the degradation of photosynthetic pigments. Under the same stress conditions, the decrease in pigments concentrations is generally more pronounced in less tolerant species; consequently, the concentration of chlorophylls and carotenoids can be used as biomarkers of stress [14]. All plants share the same basic responses against salinity, but their behavior as more tolerant or susceptible relies mainly on the efficiency of these response mechanisms [15]. Accumulation of toxic ions such as Na+ and Cl and their sequestration in the vacuoles is a typical strategy of salt tolerant plants, which also insures an energetically “cheap” osmotic adjustment [16]. To maintain the osmotic balance under stress, plants accumulate different types of organic osmolytes in their cytoplasm; these compatible solutes include, for example, proline, glycine betaine, polyalcohols, and soluble sugars [16,17]. These compounds play additional roles in the responses to stress, acting as low-molecular-weight chaperons in the direct protection of macromolecular structures, such as cell membranes and proteins, as scavengers of reactive oxygen species (ROS) or as signaling molecules [12,18].
Salinity is generally associated with the generation of oxidative stress as a secondary effect, by an excess production of ROS, which appear by the transfer to O2 of one to three electrons, to form superoxide (O2), hydrogen peroxide (H2O2), or the hydroxyl radical (HO) [19]. ROS are by-products of normal cell metabolism, generated during photorespiration, respiration and photosynthesis, and at low concentrations play a necessary physiological role as signaling molecules that regulate plant growth and responses to stress [20]. When in excess, as it occurs in different stressful conditions, ROS alter the intracellular ionic homeostasis by reducing cytosolic K+ levels, and subsequently activating proteases and endonucleases. Furthermore, ROS oxidize proteins, DNA, and unsaturated fatty acids in membrane lipids, which can lead to cell death [21,22]. Excessive ROS accumulation is prevented or counteracted by the activation of enzymatic and non-enzymatic antioxidant systems. Different types of chemical compounds are included in the latter category—for example, phenolic compounds, especially flavonoids, ascorbic acid, glutathione, or β-carotenes, among others [19]. In addition, salinity stress causes changes in the major photosynthetic pigments accumulation. Superoxide dismutase (SOD), catalase (CAT), ascorbate peroxidase (APX) (and other peroxidases), or redox regulatory enzymes such as glutathione reductase (GR) are some of the commonest antioxidant plant enzymes [23].
This study aimed at identifying the most relevant mechanisms of salt tolerance in cultivated eggplant by comparing the responses to controlled salt stress treatments of S. melongena and its wild relative S. torvum. To address this objective, the relative salt tolerance of the two species, established by their degree of salt-induced growth inhibition, was correlated with the stress-induced changes in the contents of putative biomarkers associated to specific stress response mechanisms.

2. Materials and Methods

2.1. Plant Material and Experimental Design

The plant material used (seeds of S. melongena and S. torvum) was provided by the Institute for the Conservation and Improvement of Valencian Agrodiversity (COMAV-UPV). The cultivar of S. melongena used in the experiments, cv. MEL1, was selected for its ability to easily cross with wild relatives, being therefore suitable to start introgression programs. Seeds of the two species were germinated in Petri dishes in a growth chamber under conditions of 16 h light/8 h darkness at 25 °C, following the procedure described by Ranil et al. [24], with some modifications [25]. Germinated seedlings were transferred to seedbeds and maintained under the same light and temperature conditions for two weeks. Seedlings of uniform size were then selected and transferred individually to 1.3 L pots with 500 g of Huminsubstrat N3 (Klasmann–Deilmann, Geeste, Germany) substrate, placed in 55 × 40 cm plastic trays (10 pots per tray) in a greenhouse at ambient temperature, which oscillated between 18 °C and 25 °C, approximately, during the period of the experiments (spring 2019). Stress treatments started after two weeks of acclimatization, selecting five individual pots with seedlings of the same size for each species and treatment, as biological replicas. Treatments consisted in watering the plants with NaCl solutions of 0 (for the controls), 100, 200, and 300 mM NaCl in deionized water by adding 1.25 L of the corresponding solution to each tray every four days. After 25 days of treatment, plants were harvested to determine growth and biochemical parameters.

2.2. Electrical Conductivity of the Substrate

For the EC1:5 measurement, a 1:5 suspension was prepared by mixing 5 g of the substrate taken from each pot (previously dried at 65 °C for four days) with 25 mL of deionized water. The samples were stirred at 150 rpm for 12 h and then filtered through filter paper. Electrical conductivity measurements were carried out using a Crison Basic 30+ conductivity-meter (Crison Instruments SA, Barcelona, Spain) and expressed in dS m−1.

2.3. Evaluation of Growth Parameters

Different growth parameters were determined in shoots and roots at the end of the salt treatments: shoot fresh weight (SFW) and shoot dry weight (SDW), maximum leaf expansion or foliar area (FA), and stem length (SL) and root length (RL). Since plants of the two species have a different size (the aerial part of S. torvum plants is smaller than that of S. melongena), values of these parameters are shown as the percentage of the corresponding controls to better compare the responses of the two species. The water content of shoots (SWC) and roots (RWC) was also determined by weighing a part of fresh material (fresh weight, FW), drying it for four days at 60 °C and weighing it again (dry weight, DW); the water content percentage was calculated with the formula [26]:
WC% = [(FW − DW)/FW)] × 100
After measuring the growth parameters, all leaves of each plant were pooled and used to carry out the biochemical assays.

2.4. Ion Quantification

Potassium (K+), sodium (Na+), and chloride (Cl) contents were determined separately in leaves and roots of the plants sampled after the salt treatments [27]. Dry plant material obtained as indicated above, was ground, and the samples (50 mg suspended in 15 mL of deionized water) were heated at 95 °C for one hour, cooled on ice and filtered through a 0.45 μm nylon filter (Gelman Laboratory, PALL-Biotech, Madrid, Spain). Na+ and K+ contents were determined using a PFP7 flame photometer (Jenway Inc., Burlington, VT, USA), and chlorides were measured in an MKII Chloride Analyser 92 6 (Sherwood, Inc., Cambridge, UK). Concentrations were calculated from standard curves prepared with known amounts of each ion.

2.5. Quantification of Photosynthetic Pigments

Chlorophyll a (Chl a), chlorophyll b (Chl b), and carotenoids (Caro) contents were determined following the classical protocol of Lichtenthaler and Wellburn [28]. Photosynthetic pigments were extracted from fresh leaf material with 80% acetone, by shaking overnight in the dark at 4 °C. The samples were centrifuged at 12,000 rpm at 4 °C, and the absorbance of the supernatants was measured at 470, 645, and 663 nm. The following formulas were used to calculate the concentrations of the different pigments in the extracts [28]:
Chlorophyll a (µg ml−1) = 12.21 × A663 − 2.81 × A646
Chlorophyll b (µg ml−1) = 20.13 × A646 − 5.03 × A663
Carotenoids (µg mL−1) = (1000 × A470 − 3.27 × [Chlorophyll a] − 104 × [Chlorophyll b])/227
Pigment contents were finally expressed in mg g−1 DW.

2.6. Quantification of Osmolytes

The quantification of free proline (Pro) was carried out following the acid-ninhydrin method previously described [29]. Dry leaf material was extracted with a 3% (w/v) sulphosalicylic acid aqueous solution. The extracts were mixed with acid ninhydrin, incubated at 95 °C for one hour in a water bath, cooled to room temperature, and extracted with toluene; the absorbance of the organic phase was determined at 520 nm using toluene as the blank. Samples containing known amounts of Pro were processed in parallel to obtain a standard curve, from which Pro concentrations in the samples were calculated. Pro contents were finally expressed as µmol g⁻1 DW.
Total soluble sugars (TSS) were measured according to a previously published procedure [30]. Fresh leaf material was ground in liquid N2 and extracted with 80% (v/v) methanol. The samples were centrifuged at 12,000 rpm for 10 min; supernatants were collected, appropriately diluted with water and supplemented with concentrated sulfuric acid and 5% phenol. After 20 min incubation at room temperature, the absorbance was measured at 490 nm. TSS concentrations were expressed as equivalents of glucose, used as the standard (mg eq. glucose g−1 DW).

2.7. Measurement of Malondialdehyde, Hydrogen Peroxide, and Antioxidant Compounds

Malondialdehyde (MDA), a reliable oxidative stress biomarker, and total phenolic compounds (TPCs) and total flavonoids (TFs), as representative non-enzymatic antioxidants, were determined in leaf material extracted with 80% (v/v) methanol. MDA was quantified as previously described [31] with modifications [32]. Briefly, the methanol extracts were mixed with 0.5% (w/v) thiobarbituric acid (TBA) prepared in 20% (w/v) trichloroacetic acid (TCA), and then incubated at 95 °C for 20 min, cooled on ice, and centrifuged at 12,000× g for 10 min at 4 °C. The absorbance of the supernatants was measured at 532 nm. After subtracting the non-specific absorbance at 440 nm and 600 nm, the MDA contents were calculated using the equation included in Taulavuori et al. [32], based on the extinction coefficient at 532 nm of the MDA-TBA adduct (155 mM−1 cm−1). Control samples (extracts mixed with TCA without TBA) were processed in parallel. The concentration of MDA was finally expressed as nmol g−1 DW.
Leaf hydrogen peroxide contents in both, control and salt-treated plants, were quantified as previously described [33], with minor modifications. Dry leaf material (0.05 g) was extracted with a 0.1% (w/v) trichloroacetic acid (TCA) solution, followed by centrifugation of the extract. The supernatant was thoroughly mixed with one volume of 10 mM potassium phosphate buffer (pH 7.0) and two volumes of 1 M potassium iodide. The absorbance of the sample was determined at 390 nm. Hydrogen peroxide concentrations were calculated against an H2O2 standard calibration curve and expressed as µmol g−1 DW.
TPCs were determined by reaction with the Folin–Ciocalteu reagent [34]. The leaf methanol extracts were mixed with the reagent and Na2CO3, incubated for 90 min at room temperature in the dark, and the absorbance of the sample was measured at 765 nm. A standard curve was obtained from reactions run in parallel using known amounts of the standard gallic acid (GA), and TPC contents were expressed as equivalents of GA (mg eq. GA g−1 DW).
TFs were quantified according to a published method [35] based on the nitration of aromatic rings containing a catechol group. The methanol extracts were first reacted with NaNO2 and then with AlCl3 in the presence of NaOH; the absorbance of the samples was measured at 510 nm, and TFs contents were expressed as equivalents of catechin, used as the standard (mg eq. C g−1 DW).

2.8. Enzymatic Antioxidant Activities

Crude protein extracts were prepared from the leaf material, frozen and stored at −75 °C, as previously described [36]. Protein concentration in the extracts was determined according to Bradford [37], using the Bio-Rad reagent (Bio-Rad Laboratories, Alcobendas, Spain) and bovine serum albumin (BSA) as the standard. The specific activities of the antioxidant enzymes in the protein extracts were determined by spectrophotometric assays at room temperature.
Superoxide dismutase (SOD) activity was determined by monitoring spectrophotometrically, at 560 nm, the inhibition of nitroblue tetrazolium (NBT) photoreduction, in reaction mixtures containing riboflavin as the source of superoxide radicals [38]. One SOD unit was defined as the amount of enzyme causing a 50% inhibition of NBT photoreduction under the assay conditions.
Catalase (CAT) activity was measured following the consumption of H2O2 added to the extracts, by the decrease in absorbance at 240 nm. One CAT unit was defined as the amount of enzyme decomposing 1 mmol of H2O2 per minute at 25 °C [39].
Glutathione reductase (GR) activity was quantified following the oxidation of NADPH, the cofactor in the reaction of oxidized glutathione (GSSG) reduction, by the decrease in absorbance at 340 nm. One GR unit was defined as the amount of enzyme necessary to oxidize 1 mmol of NADPH per minute at 25 °C [40].

2.9. Statistical Analysis

Data were analyzed using the software Minitab® 19.2 (Minitab LLC, State College, PA, USA). Before data analysis, normality was established using the Shapiro–Wilk test. The significance of the differences between treatments for each species, species for each treatment, and their interactions were calculated using a two-way analysis of variance (ANOVA) for all traits except ion accumulation. For ion accumulation, an additional factor (organ) was included, and a three-way ANOVA (treatment, species, and organ) was carried out. Post-hoc comparisons were performed using the Tukey’s honestly significant difference (HSD) test at p < 0.05 for the effects of the treatment within species, and the combinations of species and organs in the case of ions. All the parameters measured in all the plants were subjected to multivariate analysis through a principal component analysis (PCA).

3. Results

3.1. Electrical Conductivity of the Substrate

The electrical conductivity (EC1:5) was measured in substrate samples from all pots once the salt stress treatments were completed. As expected, this value increased for both species with increasing NaCl concentrations. Statistically significant differences were found between treatments for each species but not between the two species for each treatment (Table 1).

3.2. Evaluation of Growth Parameters and Photosynthetic Pigments

Visual observation of the plants after 25 days of treatment with increasing salinity levels revealed a concentration-dependent inhibition of growth, as compared with the non-stressed controls. Both species were affected, although the harmful effects of the salt were more evident in S. melongena than in S. torvum, especially at the highest salt concentration tested (300 mM NaCl). Some representative examples are shown in Figure 1.
Several growth parameters and leaf contents of photosynthetic pigments were measured in all plants after the salt treatments, and a two-way ANOVA was performed to determine the effect of treatment, species and their interactions on those variables (Table 2). The species effect was highly significant (p < 0.001) for shoot fresh weight (SFW), chlorophylls (a and b) and carotenoid contents, and non-significant for the foliar area (FA), shoot length (SL), and the water content of shoots (SWC) and roots (RWC). On the other hand, the “treatment” effect was significant for all the analyzed traits, except root water content (RWC) and the concentration of the photosynthetic pigments. Finally, species x treatment interactions were significant only for shoot length (SL) and, especially, for shoot fresh weight (SFW) (Table 2).
Salt stress inhibited growth in both species, as revealed by a significant decrease in several morphological parameters of the plants. In general, no significant inhibition was observed in the presence of 100 mM NaCl, only at higher salinities, which seemed to affect S. melongena more than S. torvum, especially when considering the aerial part of the plants (Figure 2 and Table S1). For example, at the highest salt concentration tested (300 mM NaCl), shoot fresh weight was reduced to 14% of the non-stressed control in S. melongena, and 24% in S. torvum; root fresh weight also decreased, but to a similar extent (35–38%) in both species (Figure 2a). The foliar area was also reduced in response to the salt treatments, by 74% in S. melongena and somewhat less (by 63%) in S. torvum, in the presence of 300 mM NaCl (Figure 2b). Similarly, stem length was not affected at all by salt in S. torvum but was reduced down to 60% of the control in S. melongena; a concentration-dependent reduction of root length was observed in both species, in this case slightly more accentuated in S. torvum (Figure 2c). Both species showed a remarkable resistance to salt-induced dehydration; root water content of the controls was maintained after all salt treatments, whereas water content of shoots decreased (slightly more in S. melongena than in S. torvum) only at the highest salinity tested (Figure 2d). These data, taken together, point to a (slightly) higher salt tolerance of S. torvum, as compared to S. melongena, at moderate and high salinities.
As shown by the two-way ANOVA (Table 2), the “species” effect was highly significant for all analyzed photosynthetic pigments, Chl a, Chl b and Caro. Indeed, there is a significant difference between species regarding pigment contents, with S. torvum showing always higher values than S. melongena, both in the controls and under salt stress conditions (Table 3). However, despite some fluctuations in the mean values, no statistically significant changes in chlorophylls and carotenoid contents were detected in response to the treatments with increasing NaCl concentrations (Table 3).

3.3. Ion Accumulation in Roots and Leaves

Ions (Na+, Cl and K+) contents were determined in roots and leaves of all plants at the end of the salt treatments, and a multifactorial ANOVA was performed, considering the effect of species (S), treatment (T), organ (O), and their interactions (S × T; A × O; T × O; S × T × O) on the ion levels (Table 4) revealing that the effect of treatment was highly significant for all three ions and that of organ for Cl and K+. In contrast, no significant effect of the species factor was found for any of the ions. In the case of Na+, all double interactions between treatment, species, and organ, as well as the triple interaction, were significant, but only that of treatment x organ for Cl, and species x treatment for K+ (Table 4).
Root and leaf ion contents after the treatments are shown in Table 5. The patterns of accumulation of Na+ and Cl, in response to increasing external salinity, were qualitatively similar for S. melongena and S. torvum. Ion concentrations increased significantly in roots and leaves, in parallel to the increase in NaCl concentrations, but with quantitative differences between ions, organs, and species. For each species, Na+ concentrations were always higher than those of Cl, in roots and leaves of plants subjected to the same treatment. Interestingly, the two species differed regarding the responses of the two organs: absolute contents of Na+ and Cl and the relative increase over control values were higher in roots than in leaves in S. melongena but higher in leaves than in roots in S. torvum. For example, Na+ contents increased up to 11.3-fold in leaves and 5.2-fold in roots of S. torvum plants, whereas the corresponding values for S. melongena were 5.8-fold in leaves and 10.2-fold in roots (Table 4). The concentration of K+ did not change significantly in response to the salt treatments in roots and leaves of S. melongena plants or in roots of S. torvum. In S. torvum leaves, however, K+ contents decreased with respect to control values at low and moderate salinities (100 mM and 200 mM NaCl) but increased again significantly in the presence of 300 mM NaCl (Table 5).

3.4. Quantification of Osmolytes, Oxidative Stress Markers, and Antioxidant Compounds

Leaf contents of osmolytes (Pro, TSS), oxidative stress markers (MDA, H2O2) and representative non-enzymatic antioxidants (TPC, TF), were measured in control and salt-stressed plants of S. melongena and S. torvum. A two-way ANOVA was performed, showing that the effects of species and treatment (and the interaction of the two factors) were highly significant (p < 0.01 or p < 0.001), for all analyzed biochemical parameters, except for H2O2, where only the species effect was significant (Table 6).
Leaf Pro contents increased with increasing external salinity, in a concentration-dependent manner, in plants of both species. However, salt-induced Pro accumulation was higher in S. torvum than in S. melongena, both regarding the absolute values reached under high salinity conditions and the relative increase in relation to background levels in the non-stressed controls. Thus, in the presence of 300 mM NaCl, Pro concentration increased ca. 32-fold and 43-fold in S. melongena and S. torvum, respectively; the differences observed between the two species were significant in the 200 mM and 300 mM NaCl treatments (Table 7). TSS increased in response to the salt treatment in S. melongena, but the difference with the control was significant only at 300 mM NaCl. In S. torvum, on the contrary, a slight (but statistically significant) decrease of TSS levels was detected at 100 mM and 200 mM NaCl. It is also worth mentioning that TSS concentrations were much higher in S. torvum than in S. melongena at all salinities, but especially in the controls grown in the absence of salt (55-fold higher) (Table 7).
MDA contents were significantly higher in S. torvum than in S. melongena, in the controls and the presence of 100 mM NaCl but did not vary in the different salt treatments. In S. melongena, on the other hand, salt stress induced an increase of MDA mean values, but the differences with the control plants were significant only at 300 mM NaCl (Table 7). Similarly, the average levels of H2O2 were found to be higher in S. torvum than in S. melongena at all tested salinities, especially in the controls for which differences between species were statistically significant; however, no salt-dependent increase in H2O2 concentrations was observed in either species (Table 7). Also, no increase in the measured antioxidant compounds was detected in response to the salt treatments. TPC contents, in general, did not vary in either species, and no significant differences between species were observed for any of the treatments, whereas TF even decreased in the presence of salt (Table 7).

3.5. Antioxidant Enzymes Activities

The two-way ANOVA for antioxidant enzymes activities, superoxide dismutase (SOD), catalase (CAT), and glutathione reductase (GR), showed no significant effect of the factors species and treatment or their interactions, except for GR, which showed a significant species effect (Table 8).
The mean values of the activities of the assayed enzymes showed some fluctuations in samples from the different treatments but no significant differences were observed between control and salt-stressed plants, for any of the two species—except for SOD in S. torvum, which decreased at high salinities (Table 9). The specific activities of the three enzymes were higher in S. torvum than in S. melongena, at all salinities tested, although the differences between species were significant only for GR in the control plants and in those treated with 300 mM NaCl (Table 9), in agreement with the results of the two-way ANOVA (Table 8).

3.6. Principal Components Analysis (PCA)

A principal component analysis (PCA) was performed, including all evaluated parameters and all analyzed plants (Figure 3). Six components with an Eigenvalue greater than one were obtained, explaining 79% of the total variation (34.4% and 18.6% for the first and the second component, respectively). As can be seen in Figure 3a, the first principal component (PC1) shows strong positive correlations with most of the growth parameters in shoots (SFW, SWC, SL), leaves (FA), and roots (RW, RL), moderate positive correlations with K+ contents in leaves (LK) and roots (RK), and strong negative correlations with Na+ and Cl concentrations in leaves (LNa and LCl, respectively) and roots (RNa, RCl), and proline accumulation (Pro). The second principal component (PC2) displays a strong positive correlation with biomass production (SFW and RFW), and strong negative correlation with photosynthetic pigments (Chl a, Chl b, Caro), osmolytes (TSS, Pro), and non-enzymatic antioxidants (TF, TPC). The scatterplot of the PCA in Figure 3b allows a clear separation of the treatments according to the first component, and of the two species according to the second component.

4. Discussion

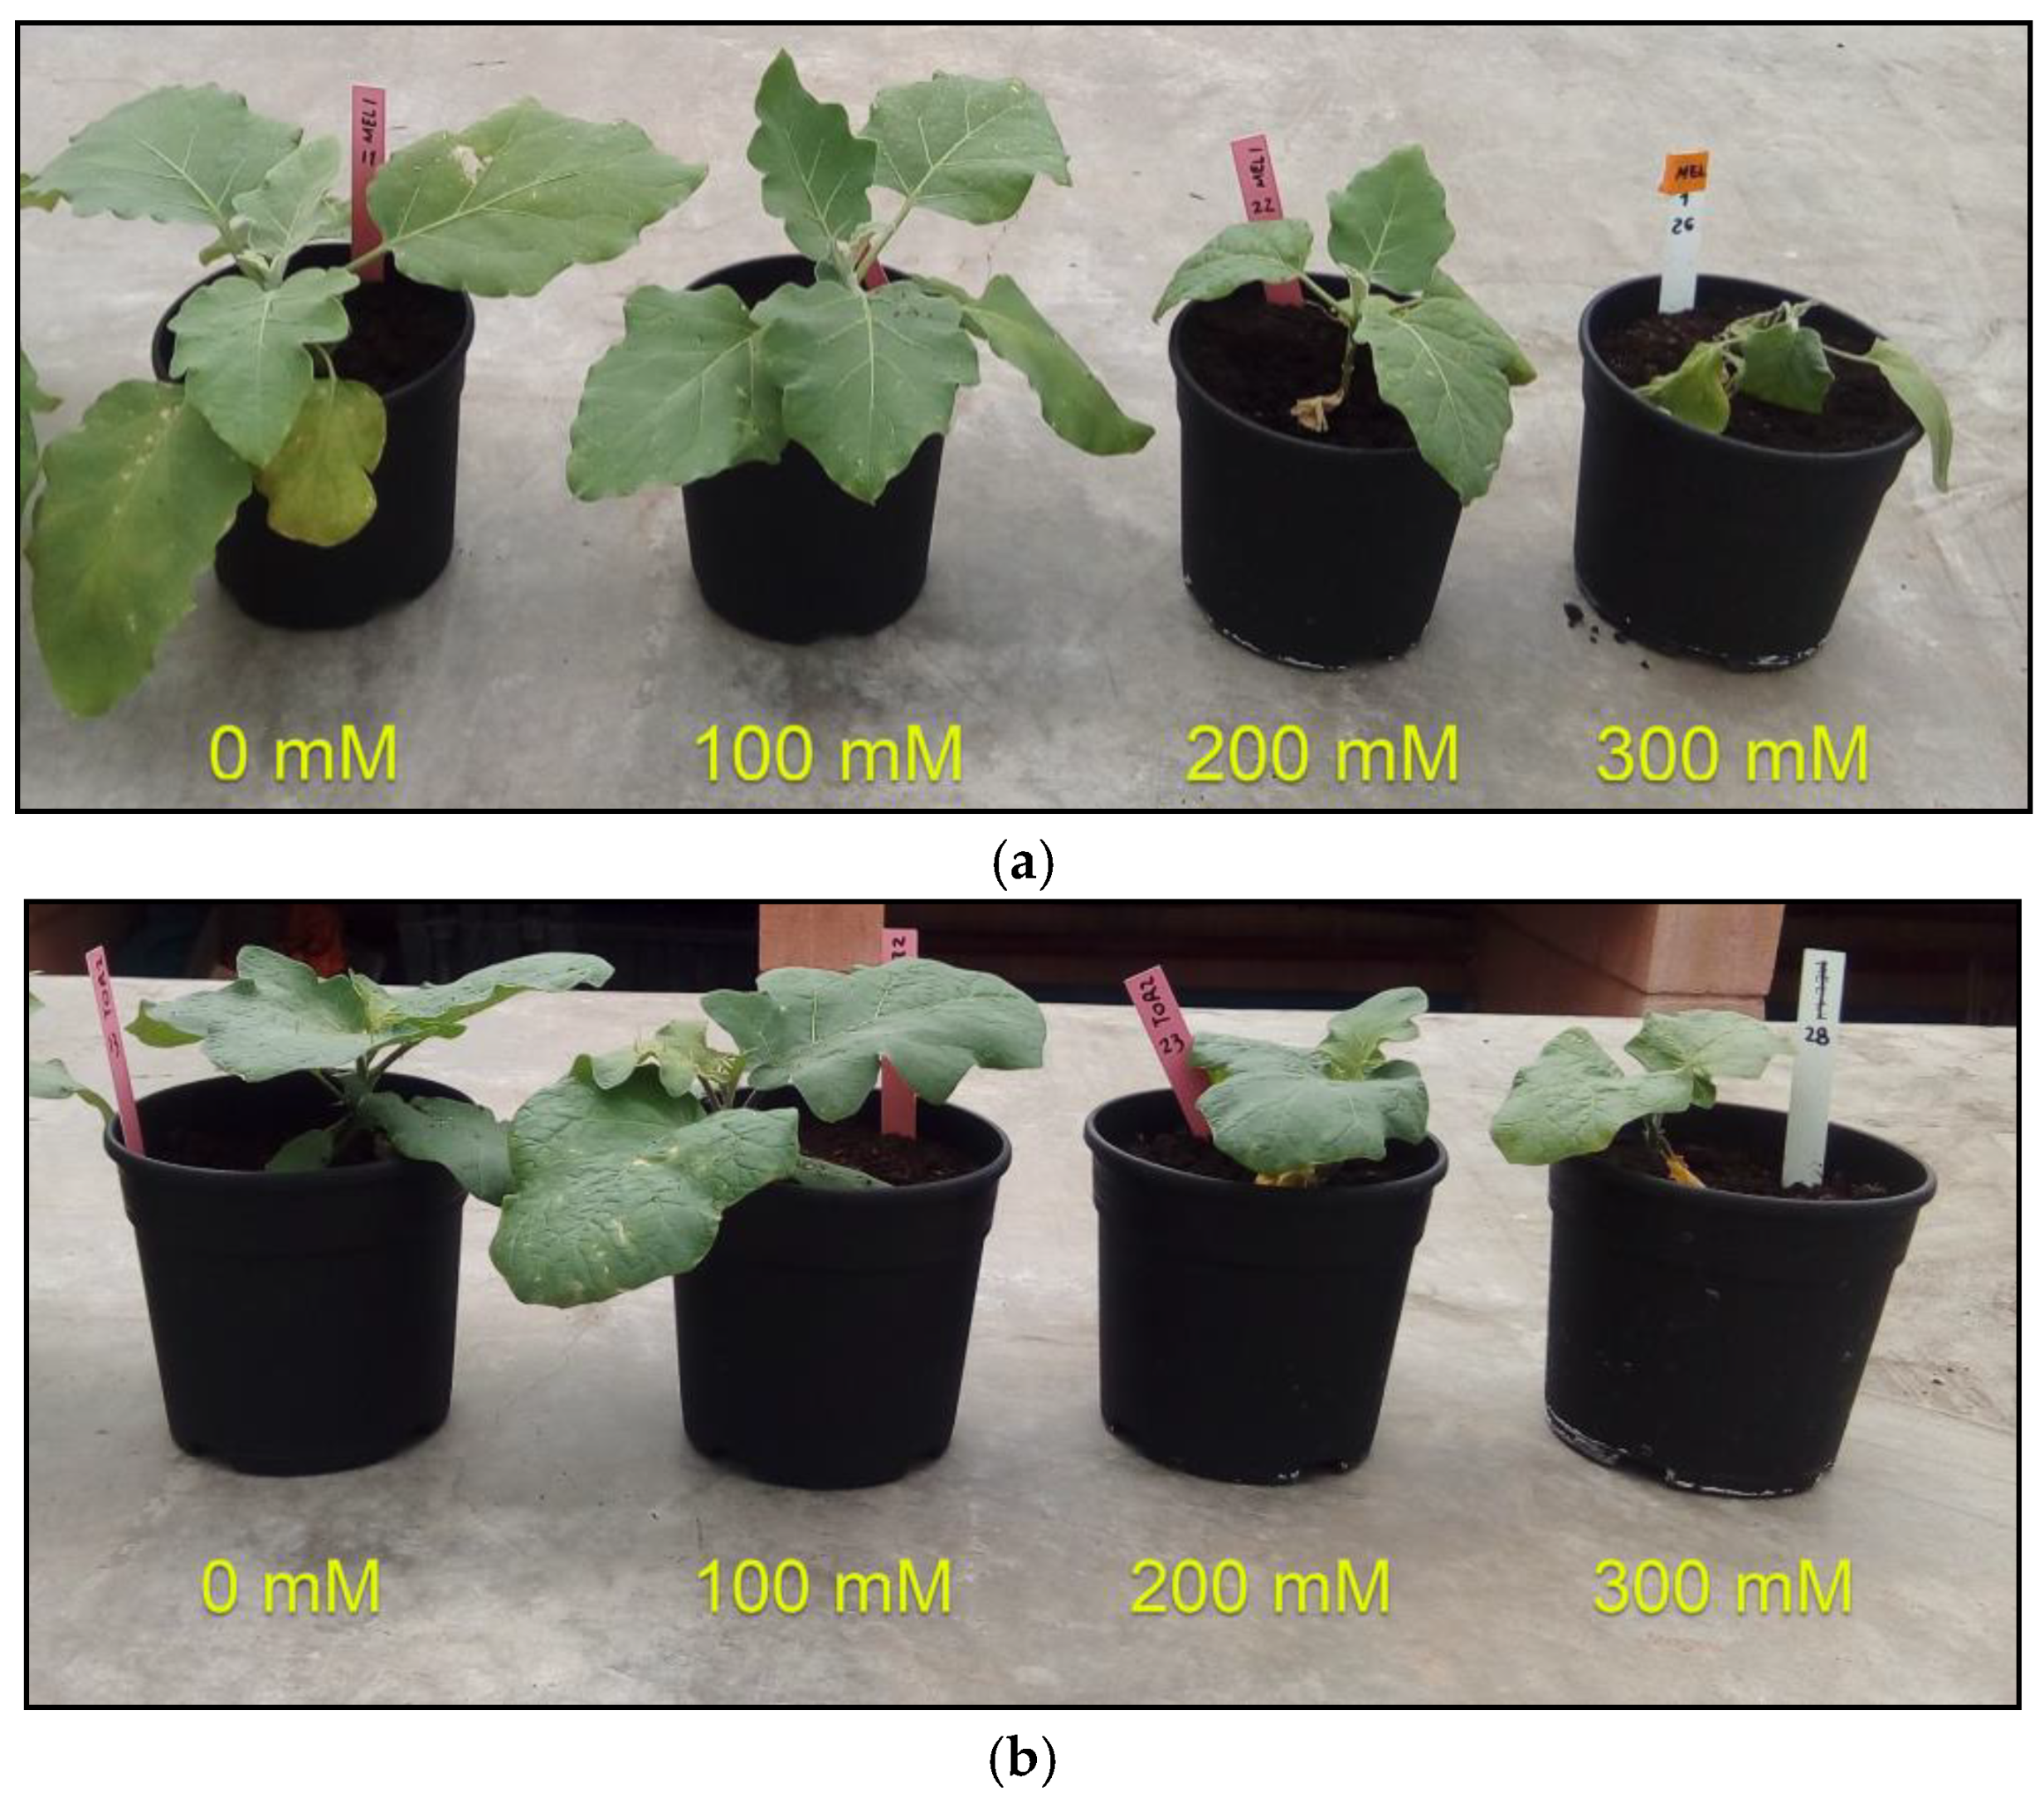
The salt treatments applied to S. melongena and S. torvum plants in the present study were sufficient to cause significant inhibition of growth and changes in several biochemical markers, at 200 mM and higher NaCl concentrations. Glycophytes, including eggplant and all major crops, are sensitive to relatively low salt concentrations. They show optimal development when growing in soils with a salinity level below a particular limit, specific for each species (and for specific genotypes within a species); once this threshold is exceeded, growth is significantly reduced as plants invest their resources to activate metabolic pathways involved in the mechanisms of defense against salt stress [12,41]. Eggplant is a species sensitive to moderate salinity levels, and several studies have shown a reduction in biomass production and other growth parameters caused by the increase in salinity [6,42,43]. The effects of salt stress on plant development and the general responses of plants to high salinity are well established [12,13], although the specific mechanisms of stress tolerance may differ widely in different species. The present work aimed to compare the responses to salt stress of the cultivated eggplant and its wild relative S. torvum. Correlation of the relative tolerance of the two species with salt-induced changes in physiological and biochemical parameters may provide information on the mechanisms of salinity tolerance in these species, by telling apart those responses that are relevant for tolerance from those that are not. On the other hand, from a practical point of view, a higher salt tolerance of S. torvum will support the use of this species as rootstock for eggplant in salinized farmland.
An analysis of salt effects on growth parameters can be useful for the establishment of a salt stress tolerance scale when comparing related species or different cultivars of a given species [44]. One of the criteria frequently used to assess the degree of tolerance to salinity (or other stresses) is the percentage of survival; in this case, however, all plants survived the stress period under the specific conditions used in the experiments. Therefore, the relative degree of salt-induced growth inhibition, most accurately indicated by the percentage of biomass reduction in relation to control plants, was used instead for ranking the selected genotypes. According to this criterion, Solanum torvum was shown to be more tolerant to salinity than S. melongena. Higher stress tolerance of eggplant wild relatives, compared to the cultivated species, is to be expected since they are often found in nature in arid or semiarid regions and in saline environments [45,46]. Nevertheless, it should be noted that the differences between the two species were relatively small and observed only at high external salinities (e.g., 300 mM NaCl) because the specific eggplant cultivar used in this work, MEL 1, seems to be also quite resistant to low and moderate salt concentrations [25], as well as to water stress [47]. Solanum melongena includes many varieties and commercial cultivars that differ considerably in their degree of salt tolerance [43].
One of the multiple effects of salt stress on plant metabolism is the generation of reactive oxygen species (ROS), highly reactive oxygen-containing free radicals, and other molecules, which can damage many cellular macromolecular structures, such as DNA, proteins, and membranes, but also the photosynthetic machinery, leading to the degradation of photosynthetic pigments [48,49]. Indeed, a reduction in the levels of chlorophyll a, chlorophyll b and carotenoids, in response to salt, has been reported in many plant species, including eggplant [50]. However, there are also many reports indicating that salt-tolerant plants can withstand relatively strong stress conditions without showing any degradation of chlorophylls or carotenoids [51,52]. In the present experiments, no significant decrease in pigment contents in response to salt was observed in S. torvum or the eggplant cultivar MEL 1, supporting the relative salt resistance of both genotypes.
As the evolution of glycophytes occurred in non-saline environments, their ion capture and storage mechanisms are not adapted to face salinity, and their response mechanisms are mostly based on the restriction of intake of toxic ions by the roots and the limitation of their transport to the aboveground organs of the plants. In contrast, dicotyledonous halophytes possess active transport systems to accumulate the ions in their aerial parts, where they are mostly stored in the leaf vacuoles, to avoid their toxic effects in the cytoplasm [12].
The cell has various ion channels and transporters, distributed throughout its cytoplasmic membrane and the tonoplast, which are responsible for controlling the passage of different ions, both inwardly and outwardly. High salt concentrations in the soil cause the water that enters the plant to carry an excess of ions, which have short and long-term deleterious effects for the plants. Na+ competes with K+ for protein binding since both elements have a similar atomic structure and can use K+ transport systems of low selectivity [53]. The increase in the intracellular concentration of Na+ and Cl alone generates toxicity in different tissues since glycophytes have a limited capacity of compartmentalization in vacuoles, and also affects the absorption of mineral nutrients, thus contributing to growth inhibition [54,55]. Besides, the Na+ ion, when in excess, can inhibit specific enzymatic activities and cellular processes by actively competing for the binding sites of enzymes that use K+ or Mg2+ as cofactors [56,57].
As expected, the levels of Na+ and Cl increased in parallel to the increase of NaCl concentrations in the pots, in roots and leaves of S. melongena and S. torvum plants. This finding coincides with the variation in the levels of ions reported in other cultivated eggplant genotypes [6,58] and other solanaceous crops [25,59]. However, the patterns of accumulation of the ions in belowground and aboveground organs differed in the two species, providing some hints on the mechanisms of tolerance. Solanum melongena behaves as a typical glycophyte, limiting ion transport to the leaves at high external salinities so that ion concentrations remain more elevated in the roots. In S. torvum, on the contrary, under the same conditions transport of ions to the aerial part of the plant is activated, leading to higher concentrations in the leaves than in the roots, which is rather characteristic of dicotyledonous halophytes. Since higher Na+ and Cl contents in leaves do not correlate with a stronger growth inhibition in S. torvum, just the opposite, it should be assumed that the wild species possesses a better capacity than cultivated eggplant for the transport and storage of toxic ions in the vacuoles.
As mentioned above, Na+ competes with K+ for the same transport systems and, therefore, an increase in intracellular Na+ concentration is generally accompanied by a decrease in K+ contents [56]. However, the concentration of K+ was maintained at steady levels in roots and leaves of S. melongena plants treated with increasing NaCl concentrations. This has been previously reported for the same eggplant cultivar, MEL 1 [25], and probably contributes to the relative salt tolerance of this specific genotype. In S. torvum, K+ concentrations are maintained in the roots, in the control and at all tested salinities, whereas they decrease in leaves in the presence of 100 and 200 mM NaCl, thus following the general pattern mentioned above. Interestingly, however, at the highest salt concentration tested (300 mM NaCl), K+ increases significantly again, suggesting the activation of uptake and transport mechanisms of this ″physiological cation″ to partly counteract the harmful effects of high Na+ concentrations. Further studies will be required to identify and characterize the ion transporters of S. torvum responsible for the efficient active transport of Na+ and K+ to the leaves at high external salinities, which appear to be relevant for the higher tolerance of the wild species. Transfer of the corresponding genes to S. melongena, through classical breeding or by genetic transformation, could be a suitable strategy for the genetic improvement of salt tolerance of the cultivated eggplant.
The synthesis of compatible solutes, or organic osmolytes, is also a general response of plants to any stress condition including an osmotic component, such as drought, high salinity, cold or high temperatures, as they limit cellular dehydration. In the specific case of salt stress, accumulation of osmolytes in the cytoplasm contributes to cellular osmotic adjustment, compensating the accumulation of toxic ions in the vacuole [12,16]. Proline and glycine betaine are two of the main osmolytes synthesized by plants [17,60]. Accumulation of Pro to very high levels in response to the salt treatments has been observed in the two analyzed species, reaching higher values (more than 40-fold over those of the control plants) in S. torvum, the most tolerant species. Therefore, there is a clear positive correlation of Pro accumulation with higher salt tolerance, as previously reported from other comparative studies with different eggplant cultivars [43] or eggplant and related wild species [25]. These data strongly support the direct participation of Pro in the mechanisms of salt tolerance in eggplant and related species. Although Pro accumulation in response to salt stress has been observed in many plants, its direct involvement in salt tolerance is not a general feature of Pro-accumulating species since other reports have shown higher Pro contents in the most susceptible genotypes of related species or cultivars of a given species [61]. The accumulation to high concentrations of this osmolyte in wild species has been related to a greater expression or better functioning under stress conditions of the enzyme pyrroline-5-carboxylate synthetase, which has a fundamental role in the biosynthesis pathway of proline [62].
Different soluble carbohydrates, sugars and polyalcohols, are often involved as osmolytes in the responses of plants to abiotic stresses [63]. In eggplant, however, the measured levels of total soluble sugars are too low to have any relevant osmotic effect, and they increased only slightly with increasing salinity. In S. torvum, although TSS contents in the controls were much higher than in S. melongena, they actually decreased in response to the stress treatment. Soluble carbohydrates have multiple functions, as direct products of photosynthesis, energy source, metabolic precursors or signaling molecules, and it is not always simple to assess their specific roles in osmotic adjustment and osmoprotection [16,63]. Nevertheless, it does not seem that these compounds play any important role in the mechanisms of salt tolerance in eggplant or related species.
Salt stress usually generates oxidative stress on plants as a secondary effect, by increasing the level of ROS, and plants respond activating enzymatic and non-enzymatic antioxidant systems, [19,20,64]. MDA, a product of membrane lipid peroxidation, is a reliable marker of oxidative stress [65]. In the present study, however, MDA contents did not increase at all in response to the salt treatments in S. torvum, and only in the presence of 300 mM NaCl in S. melongena. An increase in ROS levels will also indicate the generation of oxidative stress, but, here again, leaf H2O2 contents showed no marked variation in response to the salt treatment.
These data indicate that, under the specific conditions used in the experiments, no oxidative stress was generated in salt-treated plants of either species. This is probably due to the relatively high salt tolerance of the selected genotypes. Response mechanisms based on the control of ion transport and the accumulation of high concentrations of Pro, with its ″ROS-scavenging″ activity, may be efficient enough to avoid a significant increase in ROS contents. Consequently, we did not observe the activation of the synthesis of antioxidant compounds in response to salt stress: TPC and TF contents did not increase, or even decreased, with increasing salinity. Similarly, we did not detect in the salt-treated plants any significant increase in the specific activity of some of the enzymes commonly involved in antioxidant defense mechanisms, namely SOD, CAT and GR. There are many reports on salt tolerant plants that do not activate antioxidant responses under high salinity conditions, as they possess efficient mechanisms to avoid oxidative stress [36,66].
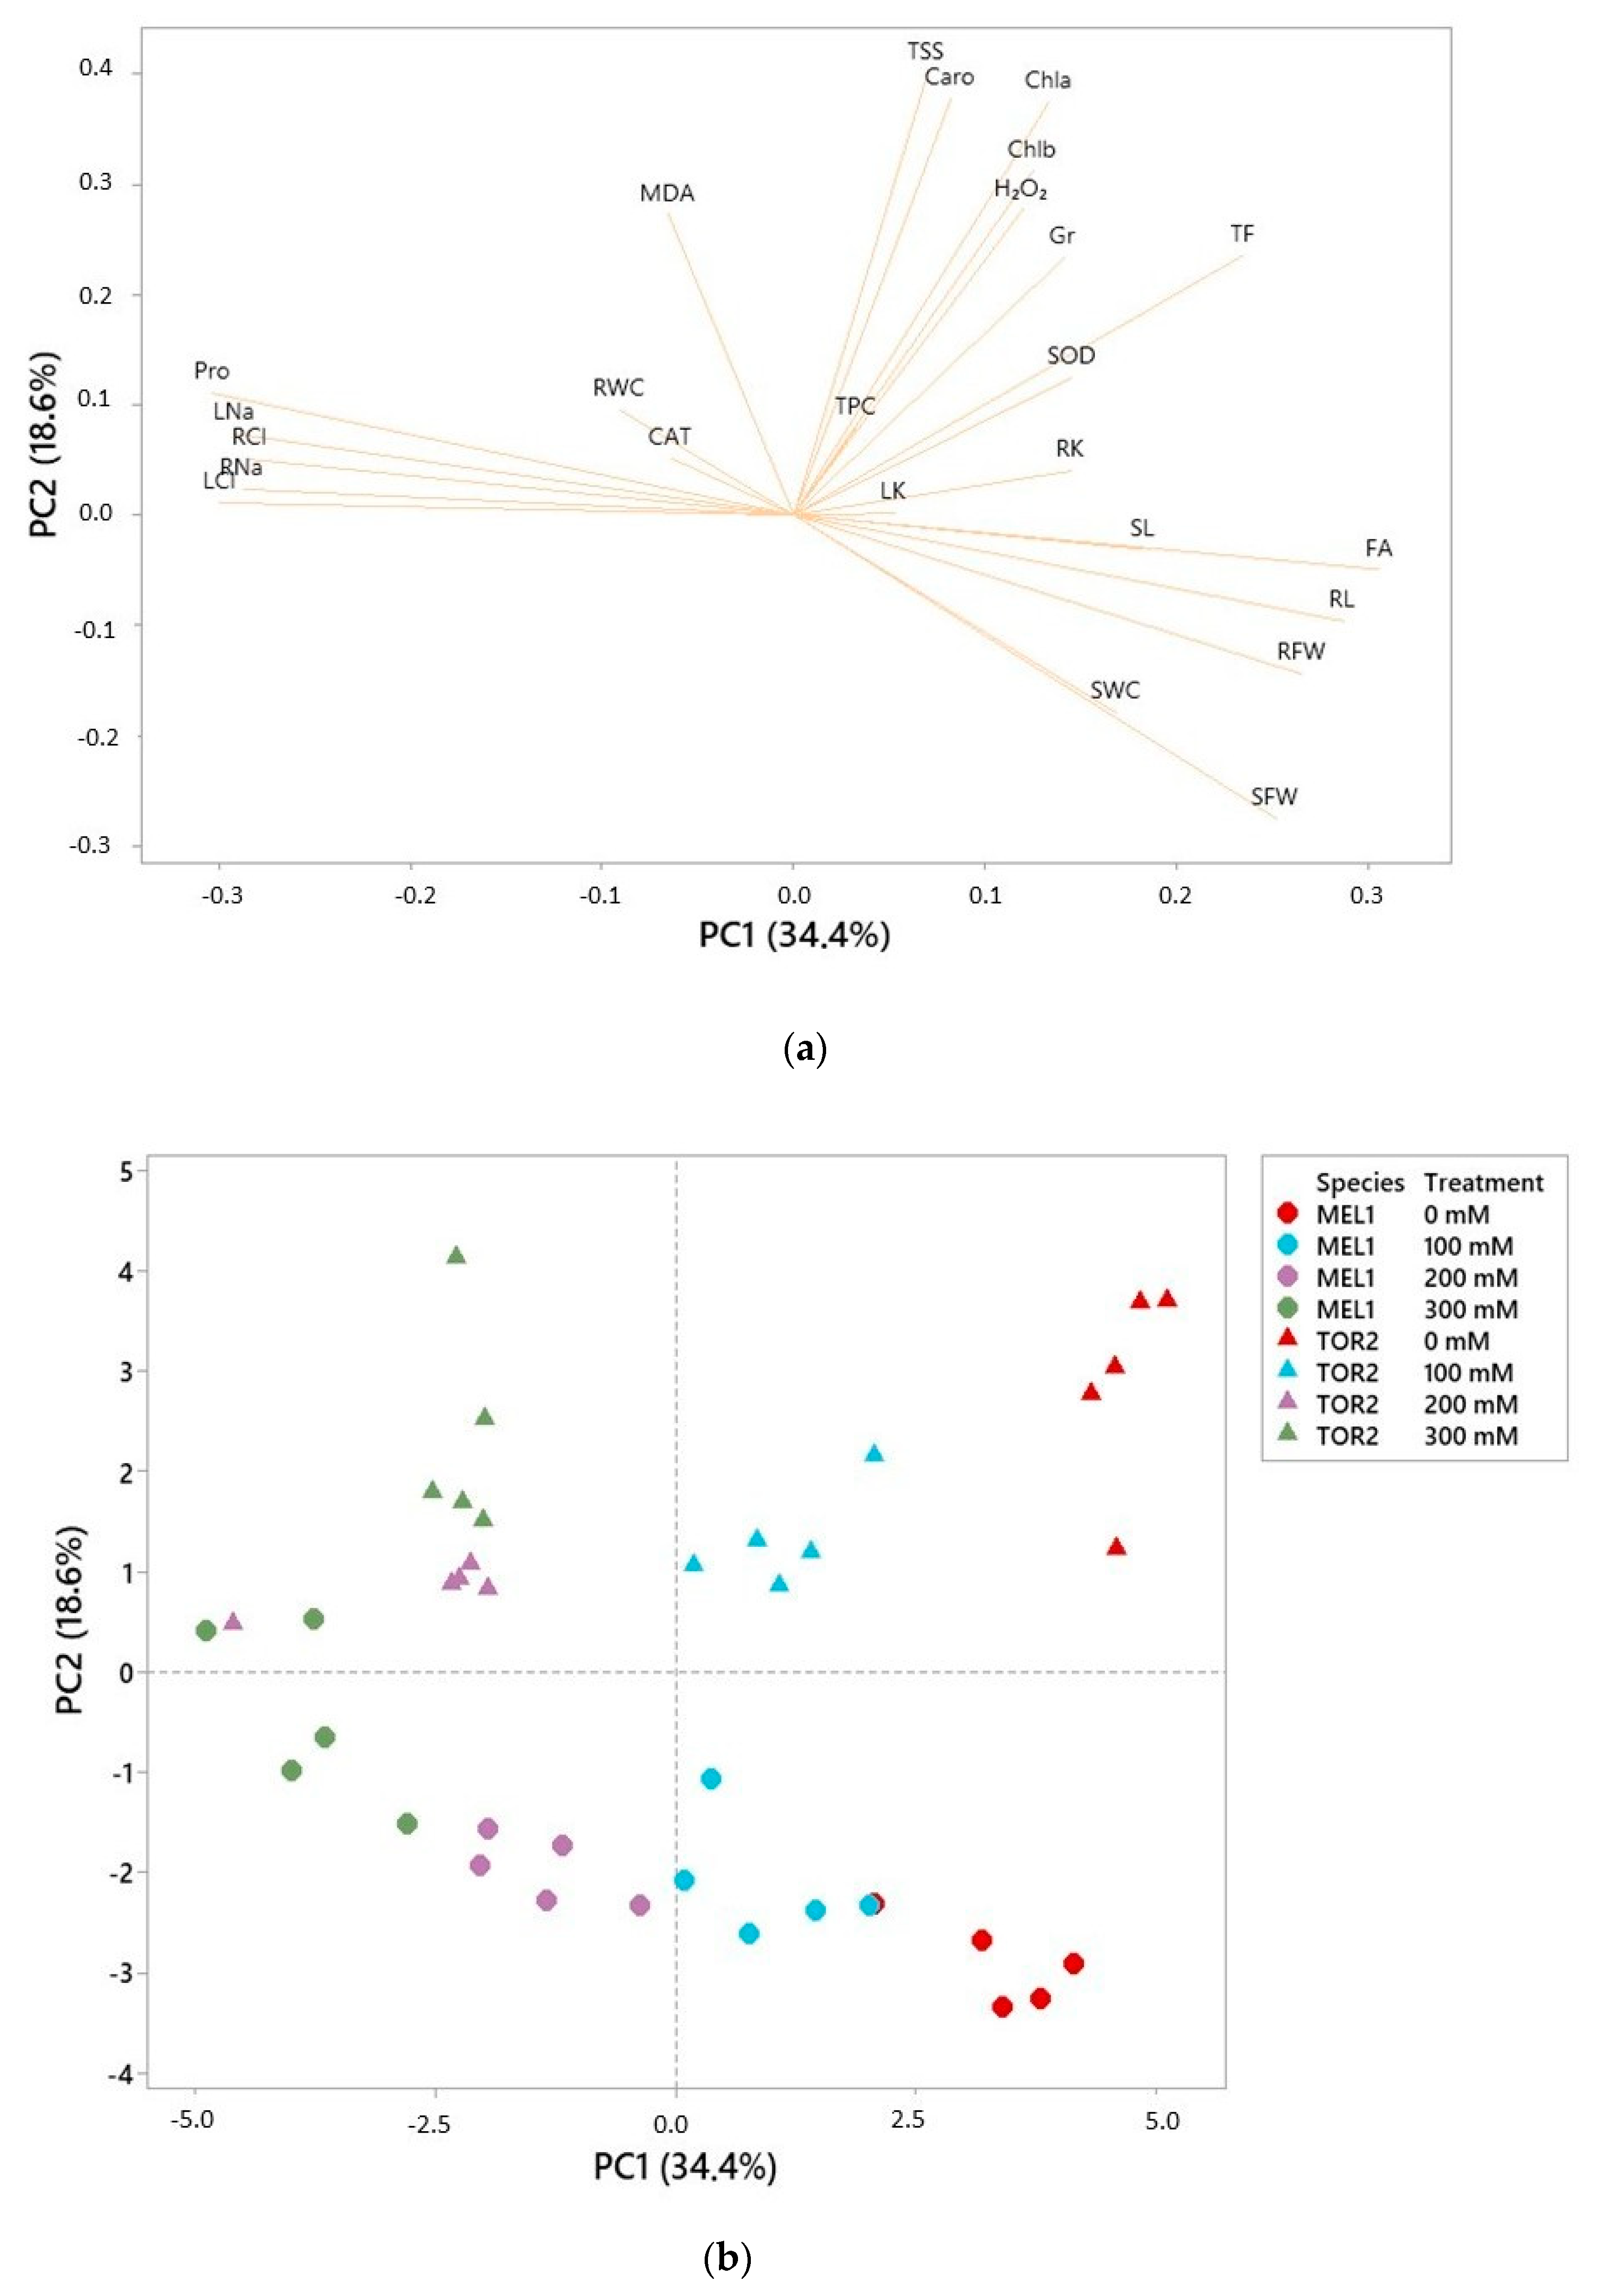
Interestingly, mean values of MDA and H2O2 contents, the concentration of total flavonoids, and SOD, CAT and GR specific activities were generally higher in S. torvum than in S. melongena plants, in the controls and all applied treatments, although the differences between species were statistically significant only in some cases. It seems, therefore, that the basal redox equilibrium in S. torvum is based on higher levels of oxidant and antioxidant compounds than in S. melongena. This difference between the two species does not affect the conclusions of the present work, as it is independent of the salt treatments; as mentioned above, none of the determined biochemical parameters varied significantly with external salinity.

5. Conclusions

Overall, our results indicate that S. torvum, which is commonly used as a rootstock for eggplant and tomato [8,9,10,11], is more tolerant to salinity than S. melongena at high salt concentrations (>200 mM NaCl), despite the fact that the specific eggplant cultivar used in this work, MEL1, is itself more tolerant than the average of the species. The mechanisms of salt tolerance of these species seem to be partly based on the active transport of toxic ions to the leaves at high external salinity, which is more efficient in the more tolerant S. torvum, and, presumably, a higher capacity to compartmentalize these ions in the vacuole. In addition, both taxa accumulate proline in the leaves for osmotic adjustment and osmoprotection to very high concentrations, especially in S. torvum. Therefore, since there is a positive correlation between proline contents and tolerance, Pro can be used as a reliable marker of salt tolerance in eggplant and wild relatives. As a practical outcome of this work, given its higher tolerance to salinity, S. torvum can be recommended as rootstock when growing eggplants (or other compatible species) in salinized soils. Furthermore, S. torvum could be a source of “salt-tolerance” genes for the genetic improvement of this trait in the cultivated eggplant.

Supplementary Materials

The following are available online at https://www.mdpi.com/2077-0472/10/8/328/s1, Table S1. Growth response measurements in S. melongena and S. torvum after 25 days of watering with the indicated NaCl concentrations. Numbers represent Mean ± SD (n = 5). The same letters within each column indicate non-significant differences between treatments for each species according to the Tukey test (p < 0.05).

Author Contributions

Conceptualization, O.V., J.P. (Jaime Prohens) and A.F.; methodology, M.B. (Marco Brenes), S.G.-O., and M.P.; software, A.F.; validation, J.P. (Jason Pérez) and M.P.; formal analysis, M.B. (Monica Boscaiu) and J.P. (Jason Pérez); investigation, M.B. (Marco Brenes), S.G.-O., M.P., and A.S.; resources, J.P. (Jaime Prohens) and O.V.; data curation, M.B. (Monica Boscaiu) and A.F.; writing—original draft preparation, M.B. (Marco Brenes), A.F., and M.B. (Monica Boscaiu); writing—review and editing, J.P. (Jaime Prohens) and O.V.; visualization, M.B. (Marco Brenes), A.F., and M.B. (Monica Boscaiu); supervision, O.V.; project administration, O.V. and J.P. (Jaime Prohens); funding acquisition, J.P. (Jaime Prohens) and O.V. All authors have read and agreed to the published version of the manuscript.

Funding

This work was undertaken as part of the initiative “Adapting Agriculture to Climate Change: Collecting, Protecting and Preparing Crop Wild Relatives” which is supported by the Government of Norway and managed by the Global Crop Diversity Trust. For further information, see the project website: http://cwrdiversity.org/. Funding was also received from Ministerio de Ciencia, Innovación y Universidades, Agencia Estatal de Investigación and Fondo Europeo de Desarrollo Regional (grant RTI-2018-094592-B-100 from MCIU/AEI/FEDER, UE), European Union’s Horizon 2020 Research and Innovation Programme under grant agreement No. 677379 (Linking genetic resources, genomes and phenotypes of Solanaceous crops; G2P-SOL) and Vicerrectorado de Investigación, Innovación y Transferencia de la Universitat Politècnica de València (Ayuda a Primeros Proyectos de Investigación; PAID-06-18). Mariola Plazas is grateful to Generalitat Valenciana and Fondo Social Europeo for a post-doctoral grant (APOSTD/2018/014). Marco Brenes is indebted to the Faculty of Biology of the Costa Rica Institute of Technology for partially supporting his stay in Valencia (“Fondo Solidario y Desarrollo Estudiantil”).

Conflicts of Interest

The authors declare no conflict of interest.

References

  1. FAO. High Level Expert Forum—How to Feed the World in 2050, Economic and Social Development; Food and Agricultural Organization of the United Nations: Rome, Italy, 2009. [Google Scholar]
  2. Raza, A.; Razzaq, A.; Mehmood, S.S.; Zou, X.; Zhang, X.; Lv, Y.; Xu, J. Impact of Climate Change on Crops Adaptation and Strategies to Tackle Its Outcome: A Review. Plants 2019, 8, 34. [Google Scholar] [CrossRef] [PubMed] [Green Version]
  3. Butcher, K.; Wick, A.F.; DeSutter, T.M.; Chatterjee, A.; Harmon, J. Soil Salinity: A Threat to Global Food Security. Agron. J. 2016, 108, 2189–2200. [Google Scholar] [CrossRef]
  4. Hanin, M.; Ebel, C.; Ngom, M.; Laplaze, L.; Masmoudi, K. New Insights on Plant Salt Tolerance Mechanisms and Their Potential Use for Breeding. Front. Plant Sci. 2016, 7. [Google Scholar] [CrossRef] [PubMed] [Green Version]
  5. FAOSTAT. Available online: http://www.fao.org/faostat/en/#data/QC (accessed on 15 June 2020).
  6. Ünlükara, A.; Kurunc, A.; Kesmez, G.D.; Yurtseven, E.; Suarez, D.L. Effects of salinity on eggplant (Solanum melongena L.) growth and evapotranspiration. Irrig. Drain. 2008, 59, 203–214. [Google Scholar] [CrossRef]
  7. Rotino, G.L.; Sala, R.; Toppino, L. Eggplant. In Alien Gene Transfer in Crop Plants; Springer: Berlin/Heidelberg, Germany, 2014; Volume 2, pp. 381–409. [Google Scholar]
  8. Gousset, C.; Collonnier, C.; Mulya, K.; Mariska, I.; Rotino, G.L.; Besse, P.; Servaes, A.; Sihachakr, D. Solanum torvum, as a useful source of resistance against bacterial and fungal diseases for improvement of eggplant (S. melongena L.). Plant Sci. 2005, 168, 319–327. [Google Scholar] [CrossRef]
  9. Petran, E.H.A. Solanum torvum as a Compatible Rootstock in Interspecific Tomato Grafting. J. Hortic. 2013, 1, 1. [Google Scholar] [CrossRef]
  10. Arwiyanto, T.; Lwin, K.; Maryudani, Y.; Purwantoro, A. Evaluation of Local Solanum Torvum As A Rootstock to Control Ralstonia Solanacearum in Indonesia. Acta Hortic. 2015, 101–106. [Google Scholar] [CrossRef]
  11. Kumar, S.; Patel, N.; Saravaiya, S. Studies on Solanum torvum Swartz rootstock on cultivated eggplant under excess moisture stress. Bangladesh J. Bot. 2019, 48, 297–306. [Google Scholar] [CrossRef]
  12. Munns, R.; Tester, M. Mechanisms of Salinity Tolerance. Annu. Rev. Plant Boil. 2008, 59, 651–681. [Google Scholar] [CrossRef] [Green Version]
  13. Gupta, B.; Huang, B. Mechanism of Salinity Tolerance in Plants: Physiological, Biochemical, and Molecular Characterization. Int. J. Genom. 2014, 2014, 1–18. [Google Scholar] [CrossRef]
  14. Al Hassan, M.; Chaura, J.; Donat-Torres, M.P.; Boscaiu, M.; Vicente, O. Antioxidant responses under salinity and drought in three closely related wild monocots with different ecological optima. AoB Plants 2017, 9, plx009. [Google Scholar] [CrossRef] [PubMed]
  15. Kumari, A.; Das, P.; Parida, A.K.; Agarwal, P.K. Proteomics, metabolomics, and ionomics perspectives of salinity tolerance in halophytes. Front. Plant Sci. 2015, 6, 537. [Google Scholar] [CrossRef] [PubMed] [Green Version]
  16. Flowers, T.J.; Colmer, T.D. Salinity tolerance in halophytes*. New Phytol. 2008, 179, 945–963. [Google Scholar] [CrossRef] [PubMed]
  17. Szabados, L.; Savoure, A. Proline: A multifunctional amino acid. Trends Plant Sci. 2010, 15, 89–97. [Google Scholar] [CrossRef] [PubMed]
  18. Slama, I.; Abdelly, C.; Bouchereau, A.; Flowers, T.; Savouré, A. Diversity, distribution and roles of osmoprotective compounds accumulated in halophytes under abiotic stress. Ann. Bot. 2015, 115, 433–447. [Google Scholar] [CrossRef] [PubMed] [Green Version]
  19. Apel, K.; Hirt, H. REACTIVE OXYGEN SPECIES: Metabolism, Oxidative Stress, and Signal Transduction. Annu. Rev. Plant Boil. 2004, 55, 373–399. [Google Scholar] [CrossRef] [Green Version]
  20. Huang, H.; Ullah, F.; Zhou, D.-X.; Yi, M.; Zhao, Y. Mechanisms of ROS Regulation of Plant Development and Stress Responses. Front. Plant Sci. 2019, 10. [Google Scholar] [CrossRef]
  21. Shabala, S. Salinity and programmed cell death: Unravelling mechanisms for ion specific signalling. J. Exp. Bot. 2009, 60, 709–712. [Google Scholar] [CrossRef] [Green Version]
  22. Demidchik, V.; Shabala, S.; Davies, J.M. Spatial variation in H2O2 response of Arabidopsis thaliana root epidermal Ca2+ flux and plasma membrane Ca2+ channels. Plant J. 2007, 49, 377–386. [Google Scholar] [CrossRef]
  23. Ozgur, R.; Uzilday, B.; Sekmen, A.H.; Turkan, I. Reactive oxygen species regulation and antioxidant defence in halophytes. Funct. Plant Boil. 2013, 40, 832–847. [Google Scholar] [CrossRef]
  24. Ranil, R.; Niran, H.; Plazas, M.; Fonseka, R.; Fonseka, H.; Vilanova, S.; Andújar, I.; Gramazio, P.; Fita, A.; Prohens, J. Improving seed germination of the eggplant rootstock Solanum torvum by testing multiple factors using an orthogonal array design. Sci. Hortic. 2015, 193, 174–181. [Google Scholar] [CrossRef] [Green Version]
  25. Brenes, M.; Solana, A.; Boşcaiu, M.; Fita, A.; Vicente, O.; Calatayud, Á.; Prohens, J.; Plazas, M. Physiological and Biochemical Responses to Salt Stress in Cultivated Eggplant (Solanum melongena L.) and in S. insanum L., a Close Wild Relative. Agronomy 2020, 10, 651. [Google Scholar] [CrossRef]
  26. Jin, X.; Shi, C.; Yu, C.Y.; Yamada, T.; Sacks, E.J. Determination of Leaf Water Content by Visible and Near-Infrared Spectrometry and Multivariate Calibration in Miscanthus. Front. Plant Sci. 2017, 8. [Google Scholar] [CrossRef] [PubMed] [Green Version]
  27. Weimberg, R. Solute adjustments in leaves of two species of wheat at two different stages of growth in response to salinity. Physiol. Plant. 1987, 70, 381–388. [Google Scholar] [CrossRef]
  28. Lichtenthaler, H.K.; Wellburn, A.R. Determinations of total carotenoids and chlorophylls a and b of leaf extracts in different solvents. Biochem. Soc. Trans. 1983, 11, 591–592. [Google Scholar] [CrossRef] [Green Version]
  29. Bates, L.S.; Waldren, R.P.; Teare, I.D. Rapid determination of free proline for water-stress studies. Plant Soil 1973, 39, 205–207. [Google Scholar] [CrossRef]
  30. Dubois, M.; Gilles, K.A.; Hamilton, J.K.; Rebers, P.A.; Smith, F. Colorimetric Method for Determination of Sugars and Related Substances. Anal. Chem. 1956, 28, 350–356. [Google Scholar] [CrossRef]
  31. Hodges, D.M.; Delong, J.M.; Forney, C.; Prange, R.K. Improving the thiobarbituric acid-reactive-substances assay for estimating lipid peroxidation in plant tissues containing anthocyanin and other interfering compounds. Planta 1999, 207, 604–611. [Google Scholar] [CrossRef]
  32. Taulavuori, E.; Hellström, E.; Taulavuori, K.; Laine, K. Comparison of two methods used to analyse lipid peroxidation from Vaccinium myrtillus (L.) during snow removal, reacclimation and cold acclimation. J. Exp. Bot. 2001, 52, 2375–2380. [Google Scholar] [CrossRef] [Green Version]
  33. Loreto, F.; Velikova, V. Isoprene produced by leaves protects the photosynthetic apparatus against ozone damage, quenches ozone products, and reduces lipid peroxidation of cellular membranes. Plant Physiol. 2002, 127, 1781–1787. [Google Scholar] [CrossRef]
  34. Blainski, A.; Lopes, G.C.; De Mello, J.C.P. Application and Analysis of the Folin Ciocalteu Method for the Determination of the Total Phenolic Content from Limonium Brasiliense L. Molecules 2013, 18, 6852–6865. [Google Scholar] [CrossRef] [PubMed] [Green Version]
  35. Jia, Z.S.; Tang, M.C.; Wu, J.M. The determination of flavonoid contents in mulberry and their scavenging effects on superoxide radicals. Food Chem. 1999, 64, 555–559. [Google Scholar] [CrossRef]
  36. Gil, R.; Bautista, I.; Boşcaiu, M.; Lidón, A.; Wankhade, S.; Sánchez, H.; Llinares, J.; Vicente, O. Responses of five Mediterranean halophytes to seasonal changes in environmental conditions. AoB Plants 2014, 6, plu049. [Google Scholar] [CrossRef] [PubMed]
  37. Bradford, M.M. A rapid and sensitive method for the quantitation of microgram quantities of protein utilizing the principle of protein-dye binding. Anal. Biochem. 1976, 72, 248–254. [Google Scholar] [CrossRef]
  38. Beyer, W.F.; Fridovich, I. Assaying for superoxide dismutase activity: Some large consequences of minor changes in conditions. Anal. Biochem. 1987, 161, 559–566. [Google Scholar] [CrossRef]
  39. Aebi, H. Catalase in vitro. Methods Enzym. 1984, 105, 121–126. [Google Scholar]
  40. Connell, J.P.; Mullet, J.E. Pea Chloroplast Glutathione Reductase: Purification and Characterization. Plant Physiol. 1986, 82, 351–356. [Google Scholar] [CrossRef] [Green Version]
  41. Parida, A.K.; Das, A.B. Salt tolerance and salinity effects on plants: A review. Ecotoxicol. Environ. Saf. 2005, 60, 324–349. [Google Scholar] [CrossRef]
  42. Zayova, E.; Philipov, P.; Nedev, T.; Stoeva, D. Response of in vitro cultivated eggplant to salt and drought stress. AgroLife Sci. J. 2017, 6, 276–282. [Google Scholar]
  43. Hannachi, S.; Van Labeke, M.-C. Salt stress affects germination, seedling growth and physiological responses differentially in eggplant cultivars (Solanum melongena L.). Sci. Hortic. 2018, 228, 56–65. [Google Scholar] [CrossRef]
  44. Al Hassan, M.; Morosan, M.; López-Gresa, M.P.; Prohens, J.; Vicente, O.; Boşcaiu, M. Salinity-Induced Variation in Biochemical Markers Provides Insight into the Mechanisms of Salt Tolerance in Common (Phaseolus vulgaris) and Runner (P. coccineus) Beans. Int. J. Mol. Sci. 2016, 17, 1582. [Google Scholar] [CrossRef] [PubMed]
  45. Ranil, R.H.G.; Prohens, J.; Aubriot, X.; Niran, H.M.L.; Plazas, M.; Fonseka, R.M.; Vilanova, S.; Fonseka, H.H.; Gramazio, P.; Knapp, S. Solanum insanum L. (subgenus Leptostemonum Bitter, Solanaceae), the neglected wild progenitor of eggplant (S. melongena L.): A review of taxonomy, characteristics and uses aimed at its enhancement for improved eggplant breeding. Genet. Resour. Crop. Evol. 2016, 64, 1707–1722. [Google Scholar] [CrossRef] [Green Version]
  46. Knapp, S.; Vorontsova, M.S.; Prohens, J. Wild Relatives of the Eggplant (Solanum melongena L.: Solanaceae): New Understanding of Species Names in a Complex Group. PLoS ONE 2013, 8, e57039. [Google Scholar] [CrossRef] [PubMed] [Green Version]
  47. Plazas, M.; Nguyen, H.T.; González-Orenga, S.; Fita, A.; Vicente, O.; Prohens, J.; Boscaiu, M. Comparative analysis of the responses to water stress in eggplant (Solanum melongena) cultivars. Plant Physiol. Biochem. 2019, 143, 72–82. [Google Scholar] [CrossRef]
  48. Yadav, S.; Irfan, M.; Ahmad, A.; Hayat, S. Causes of salinity and plant manifestations to salt stress: A review. J. Environ. Boil. 2011, 32, 667–685. [Google Scholar]
  49. Karuppanapandian, T.; Moon, J.C.; Kim, C.; Manoharan, K.; Kim, W. Reactive oxygen species in plants: Their generation, signal transduction, and scavenging mechanisms. Austr. J. Crop Sci. 2011, 5, 709–725. [Google Scholar]
  50. Bhuvaneshwari, V.; Rajeshwari, V. Enhancing Salinity Tolerance in Brinjal Plants by Application of Salicylic Acid. J. Plant Sci. 2016, 12, 46–51. [Google Scholar] [CrossRef] [Green Version]
  51. Qiu, N.; Lu, Q.; Lu, C. Photosynthesis, photosystem II efficiency and the xanthophyll cycle in the salt-adapted halophyte Atriplex centralasiatica. New Phytol. 2003, 159, 479–486. [Google Scholar] [CrossRef]
  52. Al Hassan, M.; Estrelles, E.; Soriano, P.; López-Gresa, M.P.; Bellés, J.M.; Boscaiu, M.; Vicente, O. Unraveling Salt Tolerance Mechanisms in Halophytes: A Comparative Study on Four Mediterranean Limonium Species with Different Geographic Distribution Patterns. Front. Plant Sci. 2017, 8, 8. [Google Scholar] [CrossRef] [Green Version]
  53. Shabala, S. Ionic and osmotic components of salt stress specifically modulate net ion fluxes from bean leaf mesophyll. Plant Cell Environ. 2000, 23, 825–837. [Google Scholar] [CrossRef]
  54. Mahajan, S.; Tuteja, N. Cold, salinity and drought stresses: An overview. Arch. Biochem. Biophys. 2005, 444, 139–158. [Google Scholar] [CrossRef] [PubMed]
  55. Neves-Piestun, B.G.; Bernstein, N. Salinity-induced changes in the nutritional status of expanding cells may impact leaf growth inhibition in maize. Funct. Plant Boil. 2005, 32, 141–152. [Google Scholar] [CrossRef] [PubMed]
  56. Parvaiz, A.; Satyawati, S. Salt stress and phyto-biochemical responses of plants—A review. Plant Soil Environ. 2008, 54, 89–99. [Google Scholar] [CrossRef]
  57. Almeida, D.M.; Oliveira, M.M.; Saibo, N.J. Regulation of Na+ and K+ homeostasis in plants: Towards improved salt stress tolerance in crop plants. Genet. Mol. Boil. 2017, 40, 326–345. [Google Scholar] [CrossRef] [Green Version]
  58. Akinci, I.E.; Akinci, S.; Yilmaz, K.; Dikici, H. Response of eggplant varieties (Solanum melongena) to salinity in germination and seedling stages. N. Z. J. Crop. Hortic. Sci. 2004, 32, 193–200. [Google Scholar] [CrossRef]
  59. Amjad, M.; Akhtar, J.; Murtaza, B.; Abbas, G.; Jawad, H. Differential accumulation of potassium results in varied salt-tolerance response in tomato (Solanum lycopersicum L.) cultivars. Hortic. Environ. Biotechnol. 2016, 57, 248–258. [Google Scholar] [CrossRef]
  60. Ashraf, M.; Foolad, M. Roles of glycine betaine and proline in improving plant abiotic stress resistance. Environ. Exp. Bot. 2007, 59, 206–216. [Google Scholar] [CrossRef]
  61. Arteaga, S.; Yabor, L.; Diez, M.J.; Prohens, J.; Boşcaiu, M.; Vicente, O. The Use of Proline in Screening for Tolerance to Drought and Salinity in Common Bean (Phaseolus vulgaris L.) Genotypes. Agronomy 2020, 10, 817. [Google Scholar] [CrossRef]
  62. Turchetto-Zolet, A.C.; Margis-Pinheiro, M.; Margis, R. The evolution of pyrroline-5-carboxylate synthase in plants: A key enzyme in proline synthesis. Mol. Genet. Genom. 2008, 281, 87–97. [Google Scholar] [CrossRef]
  63. Gil, R.; Boscaiu, M.T.; Lull, C.; Bautista, I.; Lidón, A.; Vicente, O. Are soluble carbohydrates ecologically relevant for salt tolerance in halophytes? Funct. Plant Biol. 2013, 40, 805–818. [Google Scholar] [CrossRef]
  64. Das, K.; Roychoudhury, A. Reactive oxygen species (ROS) and response of antioxidants as ROS-scavengers during environmental stress in plants. Front. Environ. Sci. 2014, 2, 2. [Google Scholar] [CrossRef] [Green Version]
  65. Del Rio, D.; Stewart, A.J.; Pellegrini, N. A review of recent studies on malondialdehyde as toxic molecule and biological marker of oxidative stress. Nutr. Metab. Cardiovasc. Dis. 2005, 15, 316–328. [Google Scholar] [CrossRef] [PubMed]
  66. Bose, J.; Rodrigo-Moreno, A.; Shabala, S. ROS homeostasis in halophytes in the context of salinity stress tolerance. J. Exp. Bot. 2013, 65, 1241–1257. [Google Scholar] [CrossRef] [PubMed]
Figure 1. Young plants of Solanum melongena (a) and S. torvum (b), showing the effects of 25 days of irrigation with NaCl solutions of the concentrations indicated below each pot.
Agriculture 10 00328 g001
Figure 2. Variation of growth parameters in S. melongena (MEL) and S. torvum (TOR), in roots (MELr and TORr), and shoots (MELs and TORs), after 25 days of salt treatments at the indicated NaCl concentrations: (a) fresh weight of roots and shoots; (b) foliar area; (c) length of roots and stems; and (d) water content of roots and shoots. Values displayed are percentages of the corresponding controls (0 mM of NaCl), taken as 100%; absolute values are shown in Table S1.
Agriculture 10 00328 g002
Figure 3. Loading plot of the principal component analysis (PCA) (a), and scatterplot of the PCA scores (b), including all analyzed traits in Solanum melongena and S. torvum plants subjected for 25 days to NaCl treatments, as indicated. The first and second principal components account for 38.6% and 19.1% of the total variation, respectively. Abbreviations: shoot fresh weight (SFW), shoot water content (SWC), maximum foliar area (FA), shoot length (SL), root fresh weight (RFW), root water content (RWC), root length (RL), chlorophyll a (Chl a), chlorophyll b (Chl b), carotenoids (Caro), Na+ content in leaves (LNa), K+ content in leaves (LK), Cl content in leaves (LCl), Na+ content in roots (RNa), K+ content in roots (RK), Cl content in roots (RCl), proline (Pro), total soluble sugars (TSS), malondialdehyde (MDA), total phenolic compounds (TPC), total flavonoids (TF).
Agriculture 10 00328 g003
Table 1. Electrical conductivity (EC1:5) of pot substrates after 25 days of salt treatment with the indicated NaCl concentrations. Numbers represent means ± SE (n = 5).
ParameterNaCl Treatment (mM)Species
S. melongenaS. torvum
EC1:5 (dS m−1)00.65 ± 0.07 a0.46 ± 0.02 A
1002.01 ± 0.09 b2.36 ± 0.07 B
2003.32 ± 0.10 c3.26 ± 0.10 B,C
3005.43 ± 0.56 d6.01 ± 0.26 D
For each species, different letters (lowercase for Solanum melongena and uppercase for S. torvum) indicate significant differences between treatments according to the Tukey test (p = 0.05).
Table 2. Two-way analysis of variance (ANOVA). Effects of species, treatment and their interactions, on the analyzed parameters.
TraitSpeciesTreatmentInteraction
Root length (RL)5.83 *77.82 ***0.30
Root fresh weight (RFW)4.75 *15.50 ***0.91
Foliar area (FA)0.7068.77 ***0.53
Shoot length (SL)2.745.95 **3.43 *
Shoot fresh weight (SFW)53.15 ***54.69 ***6.76 ***
Root water content (RWC)3.722.720.20
Shoot water content (SWC)1.1717.08 ***1.22
Chlorophyll a (Chl a)26.89 ***1.960.57
Chlorophyll b (Chl b)17.42 ***1.050.85
Carotenoids (Caro)20.77 ***2.490.18
Numbers represent F values. Statistically significant differences at p-value = 0.05 (*), 0.01 (**), and 0.001 (***).
Table 3. Chlorophyll a (Chl a), chlorophyll b (Chl b), and carotenoids (Caro) leaf contents (mean ± SE, n = 5) of S. melongena and S. torvum plants, after 25 days of treatment with the indicated NaCl concentrations.
PigmentsNaCl Treatment (mM)Species
S. melongenaS. torvum
Chl a (mg g−1 DW)06.60 ± 0.73 a14.16 ± 0.75 A
1005.87 ± 0.32 a10.08 ± 1.27 A
2004.77 ± 0.56 a9.13 ± 0.37 A
3005.71 ± 0.82 a10.52 ± 0.55 A
Chl b (mg g−1 DW)01.26 ± 0.25 a4.53 ± 1.00 A
1001.55 ± 0.58 a2.82 ± 0.78 A
2001.02 ± 0.32 a2.69 ± 0.28 A
3001.01 ± 0.88 a2.64 ± 0.62 A
Caro (mg g−1 DW)01.48 ± 0.10 a,b2.66 ± 0.27 A
1001.11 ± 0.17 a,b2.10 ± 0.61 A
2000.97 ± 0.12 a1.75 ± 0.24 A
3001.55 ± 0.30 b2.45 ± 0.19 A
For each species and photosynthetic pigment, different letters (lowercase for S. melongena and uppercase for S. torvum) indicate significant differences between treatments, according to the Tukey test (p = 0.05).
Table 4. Factorial ANOVA considering the effect of species (S), treatment (T), organ (O), and their interactions (S × T; S × O; T × O; S × T × O) on ions (Na+, Cl, K+) contents, in Solanum melongena and S. torvum.
STOS × TS × OT × OS × T × O
Na+0.1457.67 ***1.497.76 ***12.92 **3.34 *5.87 **
Cl0.0533.62 ***12.86 **1.390.893.07 *1.94
K+3.397.43 ***81.83 ***5.60 **3.781.661.58
Numbers represent F values. Statistically significant differences at p-value = 0.05 (*), 0.01 (**), and 0.001 (***).
Table 5. Monovalent ion contents (mean ± SE, n = 5) in roots and leaves of Solanum melongena and S. torvum plants after 25 days of treatment with the indicated NaCl concentrations.
Ion ConcentrationTreatmentS. melongenaS. torvum
Na+ in roots (µmol g−1 DW)0881 ± 61 a843 ± 60 A
1002295 ± 199 b2569 ± 121 B
2003840 ± 478 b4403 ± 606 C
3008961 ± 851 c4198 ± 504 C
Na+ in leaves (µmol g−1 DW)0885 ± 142 a700 ± 68 A
1003476 ± 414 b3328 ± 105 B
2004661 ± 594 b7704 ± 548 D
3005107 ± 634 b5842 ± 456 C
Cl in roots (µmol g−1 DW)0466 ± 28 a524 ± 80 A
1001351 ± 94 b1345 ± 82 A,B
2001690 ± 206 b,c1766 ± 227 B
3002432 ± 561 c1946 ± 401 B
Cl in leaves (µmol g−1 DW)0553 ± 47 a386 ± 41 A
1001918 ± 164 b1568 ± 82 B
2002189 ± 172 b,c3377 ± 221 D
3002904 ± 370 c2506 ± 111 C
K+ in roots (µmol g−1 DW)01085 ± 36 a1397 ± 242 A
100994 ± 55 a857 ± 65 A
200890 ± 31 a861 ± 43 A
300940 ± 117 a825 ± 164 A
K+ in leaves (µmol g−1 DW)01727 ± 153 a2139 ± 107 C
1001507 ± 139 a1212 ± 76 A
2001885 ± 284 a1197 ± 75 A
3001994 ± 221 a1595 ± 58 B
For each species, different letters (lowercase for S. melongena and uppercase for S. torvum) indicate significant differences between treatments, according to the Tukey test (p = 0.05).
Table 6. Two-way analysis of variance (ANOVA) of the species, treatment and their interactions for the parameters measured:
Biochemical ParametersSpeciesTreatmentInteraction
Pro43.93 ***492.24 ***10.94 ***
TSSs208.67 ***5.79 **5.71 **
MDA27.05 ***3.90 **3.97 **
H2O210.65 *2.632.81
TPC858.28 ***13.33 ***5.98 **
TF102.60 ***112.04 ***59.99 ***
Pro, proline; TSS, total soluble sugars; MDA, malondialdehyde; TPC, total phenolic compounds; TF, total flavonoids. Numbers represent F values. Statistically significant differences at p-value = 0.05 (*), 0.01 (**), and 0.001 (***).
Table 7. Proline (Pro), total soluble sugars (TSS), malondialdehyde (MDA), hydrogen peroxide (H2O2), total phenolic compounds (TPC), and total flavonoids (TF) leaf contents (mean ± SE, n = 5) in Solanum melongena and S. torvum plants after 25 days of salt treatments with the indicated NaCl concentrations.
Biochemical ParametersNaCl Treatment (mM)Species
S. melongenaS. torvum
Pro (µmol g−1 DW)070.40 ± 10.42 a62.19 ± 6.68 A
100300.30 ± 28.80 b462.40 ± 42.13 B
2001508.00 ± 112.69 c,*2286.60 ± 94.18 C,*
3002223.00 ± 112.25 c,*2662.70 ± 57.73 D,*
TSS (mg eq. gluc g−1 DW)00.44 ± 0.01 a,*24.29 ± 2.64 B,*
1000.61 ± 0.05 b,*12.53 ± 0.99 A,*
2000.78 ± 0.07 b,*13.51 ± 3.17 A,*
3001.48 ± 0.09 c,*19.9 ± 1.23 A,B,*
MDA (nmol g−1 DW)080.36 ± 4.61 a,*148.76 ± 4.87 A,*
100113.42 ± 6.85 a,*191.60 ± 20.57 A,*
200109.10 ± 10.51 a147.65 ± 9.14 A
300149.10 ± 13.24 b148.50 ± 14.58 A
H2O2 (µmol g−1 DW)040.73 ± 7.80 a,*105.31 ± 25.8 B,*
10048.09 ± 9.13 a66.15 ± 8.55 A
20038.48 ± 7.83 a67.98 ± 17.6 A
30040.36 ± 5.92 a58.04 ± 4.91 A
TPC (mg eq. GA g−1 DW)08.87 ± 0.51 b7.52 ± 2.23 A
1007.52 ± 0.62 b6.29 ± 0.57 A
2005.56 ± 0.19 a6.16 ± 0.43 A
3007.63 ± 0.24 b9.87 ± 0.54 A
TF (mg eq. C g−1 DW)09.34 ± 1.03 c,*33.67 ± 1.71 C,*
1007.12 ± 0.67 b,c8.87 ± 1.44 B
2003.87 ± 0.14 a3.57 ± 1.17 A
3005.21 ± 0.33 a,b,*9.67 ± 0.51 B,*
For each parameter and species, different letters (lowercase for S. melongena and uppercase for S. torvum) indicate significant differences between treatments, according to the Tukey test (p = 0.05). Asterisks indicate significant differences between the two species, for plants subjected to the same treatment.
Table 8. Two-way analysis of variance (ANOVA) of the species, treatment and their interactions for the activity of the antioxidant enzymes: superoxide dismutase (SOD), catalase (CAT), and glutathione reductase (GR) in foliar tissue. Numbers represent F values. Statistically significant differences at p-value = 0.05 (*).
EnzymeSpeciesTreatmentInteraction
SOD1.801.630.31
CAT2.232.280.37
GR7.18 *0.530.89
Table 9. Activity of the antioxidant enzymes, superoxide dismutase (SOD), catalase (CAT), and glutathione reductase (GR) (mean ± SE, n = 5) in foliar tissue of Solanum melongena and S. torvum plants after 25 days of salt treatments with the indicated NaCl concentrations
Antioxidant Enzymatic ActivityNaCl Treatment (mM)Species
S. melongenaS. torvum
SOD activity (U g⁻1 protein)032.45± 11.0 a98.63 ± 33.11 B
10040.57 ± 12.6 a78.84± 19.43 A,B
20040.35 ± 32.1 a35.84 ± 6.83 A
30021.54 ± 7.27 a47.97 ± 57.73 A
CAT activity (U g⁻1 protein)05. 51 ± 1.15 a7.83 ± 2.90 A
1009.19 ± 3.81 a12.12 ± 1.52 A
20012.98 ± 8.24 a26.98 ± 11.27 A
3002.21 ± 0.19 a8.62 ± 3.73 A
GR activity (U g⁻1 protein)0444.60 ± 49.22 a,*1572.68 ± 295 A,*
100620.98 ± 117.25 a1080.75 ± 125 A
200599.53 ± 89.01 a1051. 69 ±492 A
300274.33 ± 39.01 a,*1425.57 ± 376 A,*
For each parameter and species, different letters (lowercase for S. melongena and uppercase for S. torvum) indicate significant differences between treatments, according to the Tukey test (α = 0.05). Asterisks indicate significant differences between the two species for plants subjected to the same treatment.

