Article

Crop Sensor Based Non-destructive Estimation of Nitrogen Nutritional Status, Yield, and Grain Protein Content in Wheat

NEIKER-Basque Institute for Agricultural Research and Development, Department of Plant Production and Protection, Berreaga 1, 48160 Derio, Biscay, Spain
*
Author to whom correspondence should be addressed.
Agriculture 2020, 10(5), 148; https://doi.org/10.3390/agriculture10050148
Submission received: 16 April 2020 / Revised: 28 April 2020 / Accepted: 29 April 2020 / Published: 1 May 2020
(This article belongs to the Special Issue Innovative Agronomic Practices for Maximizing Crop Growth and Yield)

Abstract

:
Minimum NNI (Nitrogen Nutrition Index) values have been developed for each key growing stage of wheat (Triticum aestivum) to achieve high grain yields and grain protein content (GPC). However, the determination of NNI is time-consuming. This study aimed to (i) determine if the NNI can be predicted using the proximal sensing tools RapidScan CS-45 (NDVI (Normalized Difference Vegetation Index) and NDRE (Normalized Difference Red Edge)) and Yara N-TesterTM and if a single model for several growing stages could be used to predict the NNI (or if growing stage-specific models would be necessary); (ii) to determine if yield and GPC can be predicted using both tools; and (iii) to determine if the predictions are improved using normalized values rather than absolute values. Field trials were established for three consecutive growing seasons where different N fertilization doses were applied. The tools were applied during stem elongation, leaf-flag emergence, and mid-flowering. In the same stages, the plant biomass was sampled, N was analyzed, and the NNI was calculated. The NDVI was able to estimate the NNI with a single model for all growing stages (R2 = 0.70). RapidScan indexes were able to predict the yield at leaf-flag emergence with normalized values (R2 = 0.70–0.76). The sensors were not able to predict GPC. Data normalization improved the model for yield but not for NNI prediction.

1. Introduction

To meet the globally increasing food demand, achieving high grain yields and high-quality grains has become fundamental. For those purposes, N fertilizer is a crucial factor because its application results in an increase in grain quality and grain yield. However, in cereal production, the excessive application of nitrogen fertilisers is common. The optimum management of N fertilization requirements needs a steady monitoring of crop N status throughout the vegetative period [1].
Determining the cereal N status is very important for adjusting the necessary N dose, evaluating crop growth, and estimating yield and grain protein content (GPC) [2,3,4]. In this sense, the nitrogen nutrition index (NNI) has been commonly utilized to determine the N status of plants during the growing season [5]. The NNI, determines if the N concentration needed to achieve the greatest biomass production is optimum based on a crop’s current biomass [1]. The NNI could be helpful to follow N dynamics in a crop canopy and, in this way, identify the deficiencies that suggest a yield decrease. NNI dynamics may be useful under circumstances where cereals are destined to lose their yield. Ravier et al. [1] identified a threshold NNI path for the wheat growing cycle to determine N fertilizer application timing and suggested the minimum NNI values needed for each key growing stage to achieve high yields together with a lower risk of nitrate pollution. Reliable information on crop nutritional status throughout the vegetative period could reveal the need for additional N fertilizer [6,7] and may help develop an innovative method to manage N fertilization. However, to determine NNI, laboratory analytical procedures are needed, thereby making the calculations complicated and time-consuming. To achieve precise N fertilizer management, crop N status should be analysed in-season and at specific sites.
Optical sensing techniques estimate the N content in a plant indirectly, as such techniques cannot measure N content directly. Measurements are rapid, low cost, and can be done intensively over space and time, thereby providing the necessary resolutions required for N fertilizer management [4]. In this sense, non-destructive and instantaneous measurements can be taken for crop blades with chlorophyll meters to use them as estimators of the crop N nutritional status. A previous study showed a good relationship between leaf N concentration and measurements taken with chlorophyll meters [7,8,9]. Chlorophyll meters and wheat grain yield were related in different studies and used to identify responses to additional fertilizers [9,10] and for recommendations on fertilizer management [11,12,13]. Moreover, the possibility of using chlorophyll meters to decide if an extra fertilizer dose is required to increase GPC has been studied [7,9]. The readings provided by chlorophyll meters have also been well correlated with the NNI [14,15] and with wheat leaf N concentrations and leaf chlorophyll [7,8].
Active crop canopy sensors have their own light sources, so they are not limited by changeable light conditions, thus making them practical for on-farm management. Plant tissue normally reflects nearly 50% of the near infra-red (NIR) and absorbs nearly 90% of the visible radiation [16]. Information related to crop N status is provided because the ratio of reflectance and absorbance changes with crop N and biomass [17]. Then, vegetation indexes can be calculated with the spectral data collected by the crop sensors. Mistele and Schmidhalter [18] concluded that the NNI can be determined using spectra-based measurements, and Marti et al. [19] positively correlated Normalized Difference Vegetation Index (NDVI) values with wheat yield and biomass. RapidScan CS-45 (Holland Scientific, Lincoln, NE, USA) is a portable ground-based active canopy sensor with a built-in GPS that measures crop reflectance at red (R; 670 nm), red-edge (RE; 730 nm), and near infra-red (NIR; 780 nm) spectra and provides the NDVI and the Normalized Difference Red Edge (NDRE). Previous studies showed that RapidScan CS-45 estimates NNI in rice [20] and allows the fast and precise crop tracking of N status and yield estimations in wheat [21].
Proximal sensor measurements can be repeated several times throughout the wheat growing season, and the information obtained and related to crop N status may be utilized to follow crop N dynamics in real time [8,22,23,24]. However, remote sensing measurements are usually taken in the middle wheat-growing period to adjust the N fertilizer rate [11,25]. In our area, the highest amount of N is applied at stem elongation (GS30), but the time until harvest is long, and many factors may affect the subsequent N uptake by the crop. However, if the soil is wet [9], it is possible to amend N deficiency until late in the wheat growing season (GS65 [1]; mid-flowering; [26]). In our area, it is possible to use a third application of N fertilizer at leaf-flag emergence (GS37) because there will likely be sufficient rain [9,12] to permit N uptake by the crop. Therefore, it is desirable to follow the crop N status during the vegetative growing season to make decisions related to the optimization of N fertilizer applications [6,12] or to predict the yields and GPC values. In this sense, optical sensing tools could help us understand easily how climate and N rates affect N uptake via crops and, therefore, affect yield and GPC. Ravier et al. [6] developed decision rules for determining N fertilizer application through the wheat growing season as a function of the crop N status or NNI reference values in the key growing stages. However, there are no optical sensing reference values for evaluating wheat crop N status during the vegetative growing period.
The usefulness of the proximal sensing tools for predicting NNI [15,20] and for predicting yield [2,19] and GPC [3,23] has been studied with mixed results. Predictions depend on the agroecosystem environment, and specific correlations for each climate should be developed [23]. The present study was developed under humid Mediterranean conditions to (i) determine if the NNI can be predicted using the proximal sensing tools RapidScan CS-45 and Yara N-TesterTM and if a single or unique model for all growing stages (from GS30 to mid-flowering (GS65)) could be used to predict NNI (or if growing stage-specific models would be necessary); (ii) to determine if grain yield and GPC can be predicted using the RapidScan CS-45 and Yara N-TesterTM; and (iii) to determine if the predictions are improved using normalized values rather than absolute values.

2. Materials and Methods
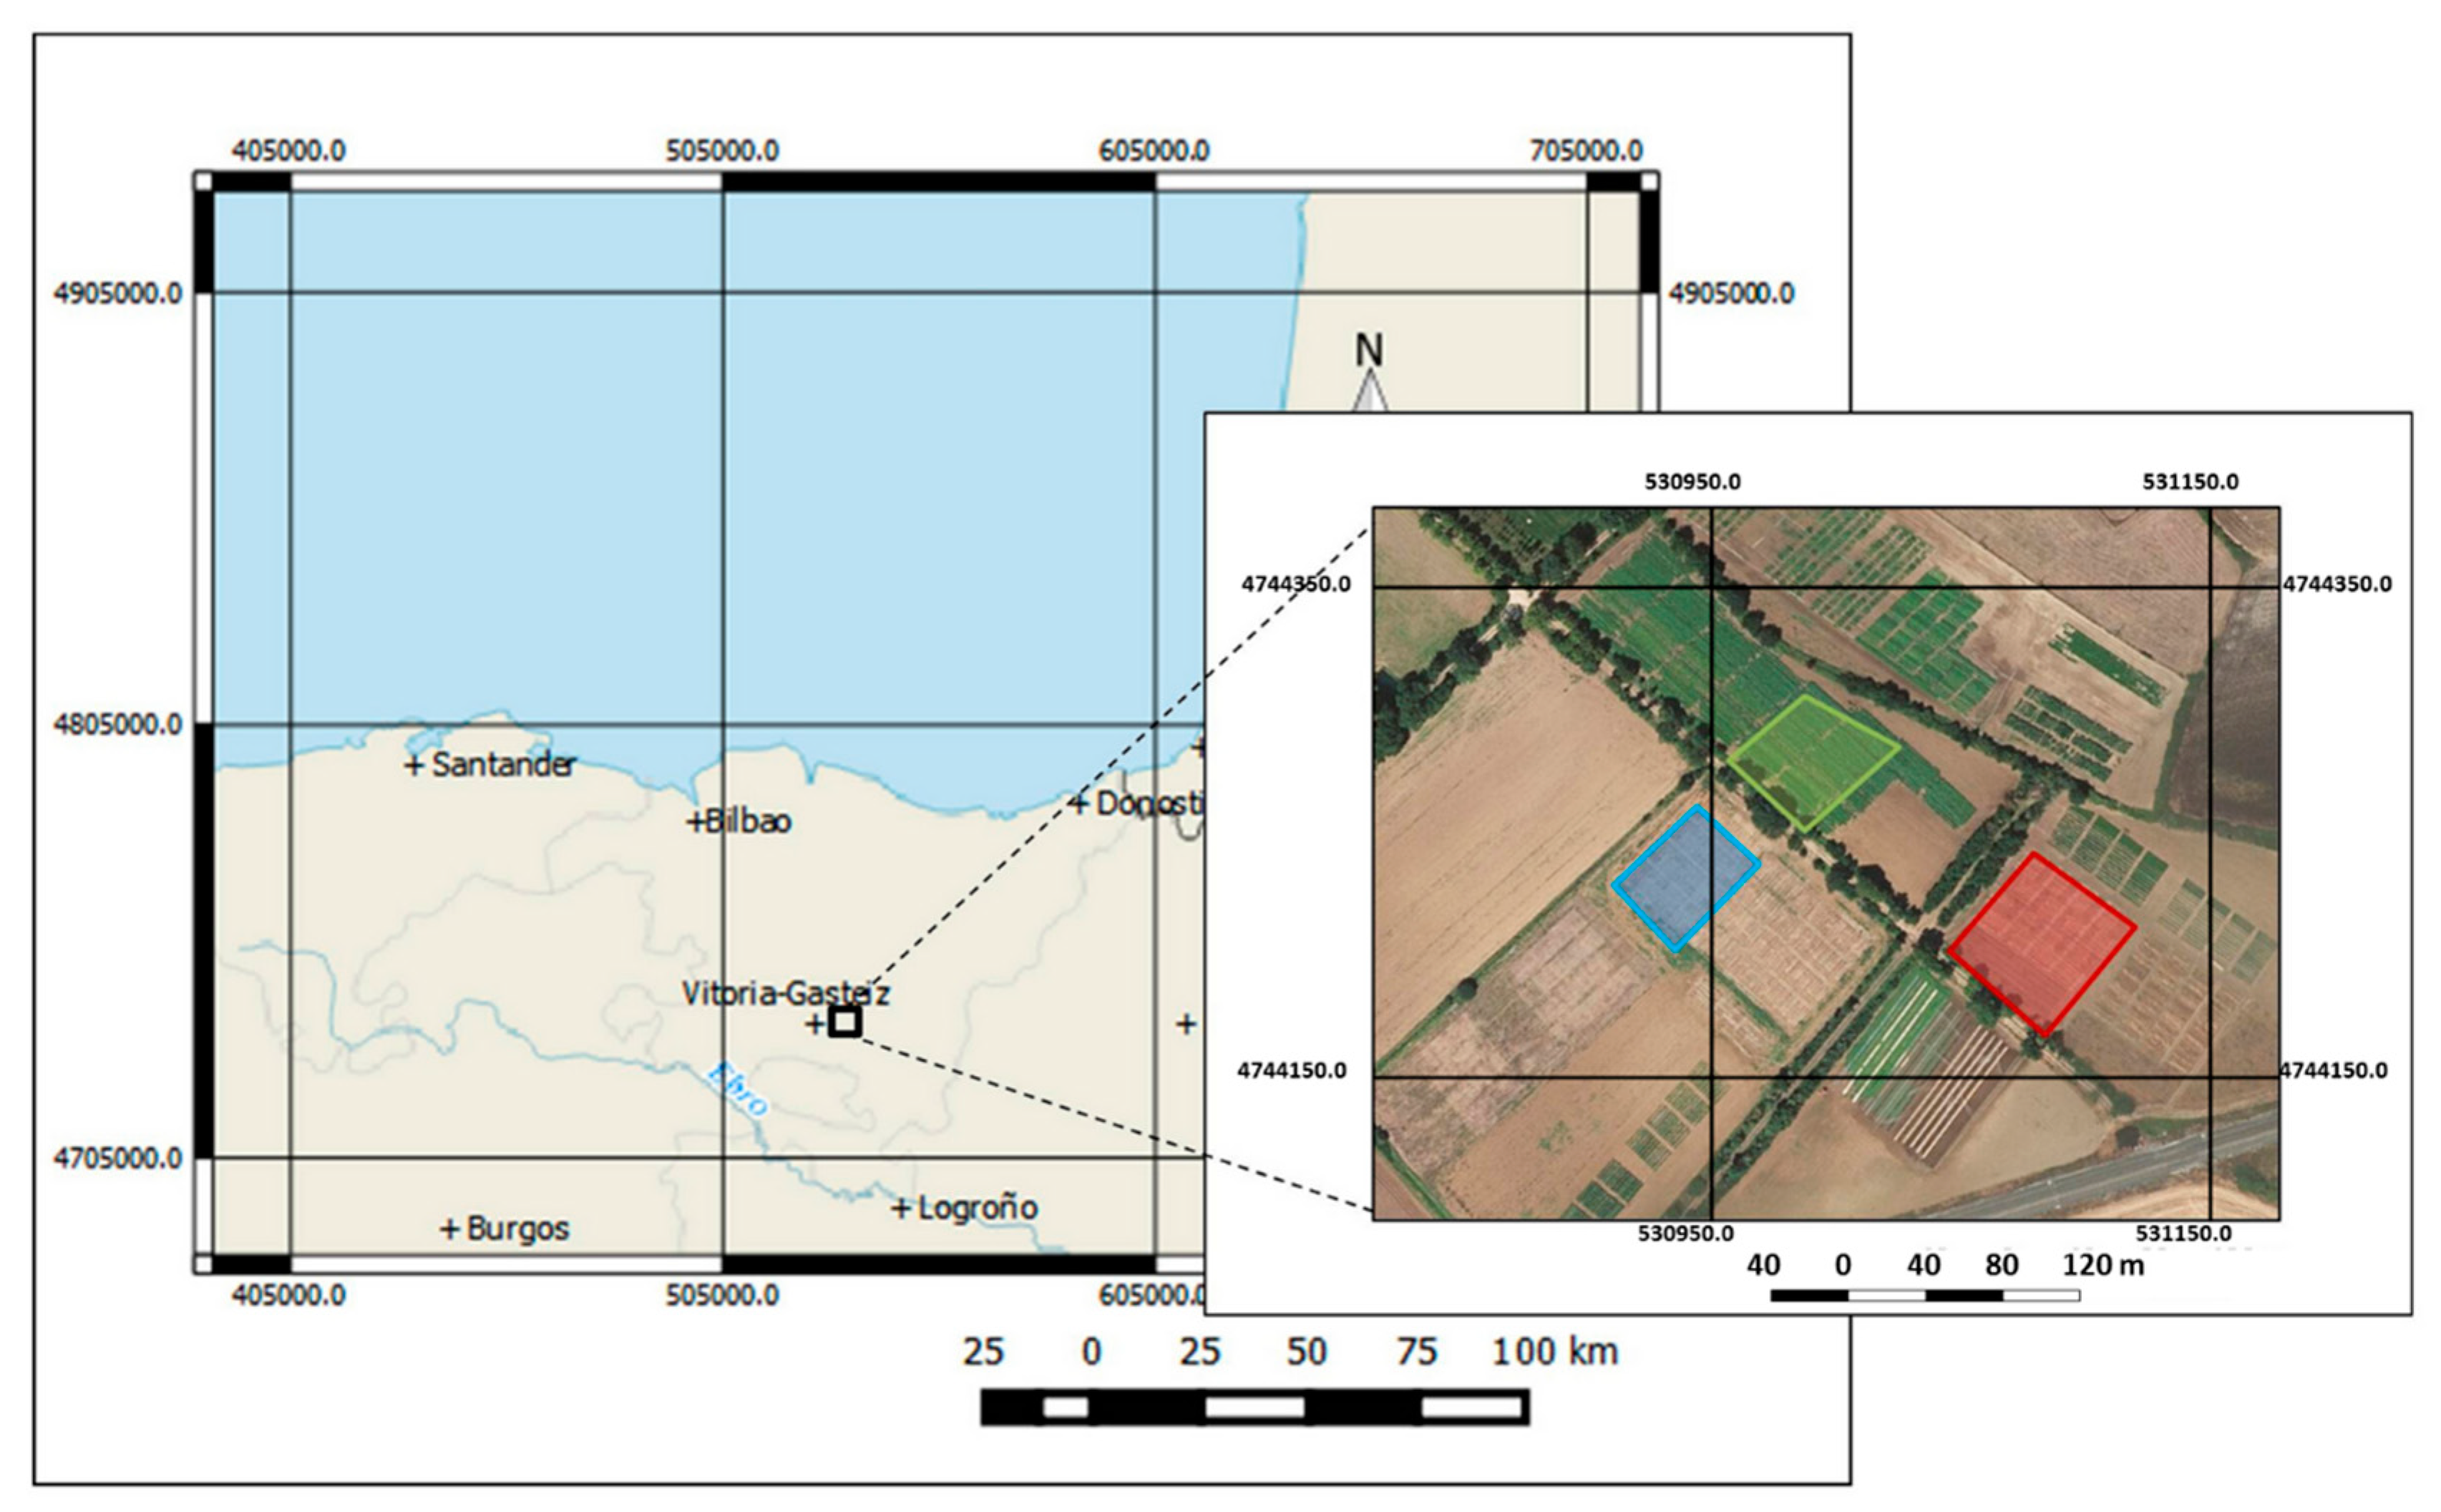
2.1. Study Site

Three field trials were established during three consecutive wheat growing seasons (2014–2015, 2015–2016, and 2016–2017) in Arkaute (Araba, Basque Country, northern Spain) at NEIKER installations (Figure 1) under unirrigated conditions. We refer to the growing seasons as 2015, 2016, and 2017. The climate of the area where the study was carried out was Temperate–Mediterranean [27]. The soil texture was analyzed by the pipette method [28] and classified (0–30 cm, sandy clay loam and 30–60 cm, clay loam) [29]. pH values (8.0–8.5) were high in the soil, which was calcareous [30] and had moderate organic matter content [31] in the upper layer (2%–2.5%). The soil was classified as Typic Calcexeroll [32]. Further experimental details were described by Aranguren et al. [11].

2.2. Treatments

Three different initial fertilizers were used: dairy slurry (40 t ha−1), sheep farmyard manure (40 t ha−1), and conventional treatment (no basal dressing but 40 kg N ha−1, 18 kg S ha−1, and 45 kg K ha−1 at tillering (GS21, [26]). The dairy slurry N content was 192, 144 and 120 kg N ha−1 in 2015, 2016, and 2017, respectively. The sheep farmyard manure N content was 336, 592 and 448 kg N ha−1 in 2015, 2016, and 2017, respectively. Five N rates, applied at GS30 (0, 40, 80, 120, and 160 kg N ha−1), were combined with the three types of initial fertilization. Regarding mineral fertilization, N was applied as calcium-ammonium-nitrate 27% (NAC) and S and K were applied as potassium sulphate 50%. A control without N (0 N) and an over-fertilized control plot (280 kg N ha−1) were also established. The treatments are shown in Table 1. Organic fertilizers were applied in mid-November each growing season. In the area where this study was carried out, organics are usually applied in combination with mineral fertilizers. The application rate in the experiment (40 t ha−1) is the usual rate applied in the area. Wheat (Triticum aestivum var. Cezanne) was sown just after application of the organics. The experiment used a factorial randomized complete block design. The area of each plot was 4 m wide and 8 m long.
Yields were harvested at crop maturity. Total N concentration was determined following the Kjeldhal procedure [33]. GPC was determined by multiplying the total N concentration of the product by 5.7 [34].

2.3. Plant Biomass and Nitrogen Nutrition Index (NNI)

Plant biomass samples were taken at GS30, GS37, and GS65 in all conventional treatments DS + 0N, and SM + 0N and in two control treatments (0N and 280N). Plant biomass sampling was done according to Aranguren et al. [11]. The biomass was measured and N concentration was determined following Kjeldahl’s method [33] to calculate the Nitrogen nutrition index (NNI) [1]:
NNI = N a N c
where Na represents the present wheat N uptake, and Nc represents the critical N uptake that corresponds to the present shoot wheat biomass W (t ha−1) [35]:
N c = 5.35   ×   W 0.442
when the NNI values are close to one, wheat has an optimum N status; values lower than 0.8 indicate N deficiency, and values higher than one indicate non-limiting N.

2.4. Crop Sensors for Following Crop N Status

Crop sensor readings (CSR) were taken with a Yara N-TesterTM (Yara International ASA, Oslo, Norway) and RapidScan CS-45 (Holland Scientific, Lincoln, NE, USA) at GS30, GS37, and GS65 [26] in four pseudo-replications of all treatments (Table 1). The Yara N-TesterTM is a chlorophyll meter that measures and processes the ratio of the light transmitted at 650 and 940 nm wavelengths, in addition to the ratio determined with no sample, to produce a digital reading. It is a clip-on hand-held tool whose measurement point is placed in the middle of the blade of the youngest fully developed leaf. To acquire a representative value for each measured treatment, thirty random measurements were recorded. The RapidScan CS-45 is a ground-based active crop canopy sensor that measures crop reflectance at 670, 730, and 780 nm and provides the NDVI and NDRE (Equations (3) and (4)). Plot measurements were taken when the sensor was passed over the crop at approximately 1 m at a constant walking speed. Two rows per plot were scanned, and the NDVI and NDRE values were averaged to generate a value for the plot.
We refer to the Yara N-TesterTM measurements as abs_N-Tester. We refer to the RapidScan CS-45 measurements as abs_NDVI and abs_NDRE. Measurements with both tools were taken as described by Aranguren et al. [11]:
NDVI = R N I R 780 R R E D 670 R N I R 780 + R R E D 670
NDRE = R N I R 780 R R E D E D G E 730 R N I R 780 + R R E D E D G E 730
The normalized values for crop sensor readings (nor_CSR: nor_N-Tester, nor_NDVI, and nor_NDRE) were calculated according to Aranguren et al. [11]:
          nor CSR = CSR CSRoverfertilized   100
Thus, each absolute crop sensor reading (CSR; abs_N-Tester, abs_NDVI, and abs_NDRE) was divided by the CSR values of the overfertilized plot (280N; CSR_overfertilized) at the same growing stage and in the same growing season [36].

2.5. Models to be Fitted

Based on a literature review, the models for predicting NNI [14,20,22], yield [19,24], and GPC [3,25] in cereals from crop sensors readings were selected.

2.5.1. The Linear Model

This model assumes that the NNI, yield, and GPC increase steadily with the CSR (or nor_CSR). The NNI is defined as follows:
Y = a + b × C S R
where Y is the NNI (or yield or GPC), CSR (or nor_CSR) is the measured value with the crop sensor, and a and b are the parameters of the linear trend that are estimated when the model is fitted to the experimental data.

2.5.2. The Exponential Model

This model does not feature a constant increase in NNI, yield, or GPC with CSR (or nor_CSR) (unlike the linear model) and is defined as follows:
Y = a + e b × C S R
where Y is NNI (or yield or GPC), CSR (or nor_CSR) is the measured value with the crop sensor, and a and b are the parameters of the exponential trend that is estimated when the model is fitted to the experimental data.
The three-year dataset was divided into two subsets: 75% for fitting the coefficients of determination and 25% for the validation dataset. The 25% dataset was always taken from the same block in the field experiment. The coefficients of determination (R2) were calculated using the R 3.2.5 software [37]. R2 was calculated for the relationship between the CSR (abs_N-Tester, abs_NDVI, and abs_NDRE) and NNI and between nor_CSR (nor_N-Tester, nor_NDVI, and nor_NDRE) and NNI in each growing stage (GS30, GS37, and GS65). R2 was calculated for the relationship between the CSR and NNI and between nor_CSR and the NNI for all growing stage readings together (general model). R2 was calculated for the relationship between the CSR and the yield and between nor_CSR and the yield for each growing stage (GS30, GS37, and GS65). R2 was calculated for the relationship between the CSR and GPC and between nor_CSR and GPC for each growing stage (GS30, GS37, and GS65).
Only when the above-mentioned relationships were statistically significant were the relationships plotted. Moreover, when these relationships were significant, the NNI values predicted from the different indexes and models were plotted against the NNI values measured from the remaining samples (25%) using the R 3.2.5 software [37].
The output of the models was assessed by comparing the R2, RMSE (root mean square error), and AIC (Akaike Information Criterion [38]). The RMSE defines the best-fit function that captures the relationship between NNI, yield, or GPC and CSR (or nor_CSR), which is defined as follows:
RMSE = 1 N N ( Y Y ) 2
where Y is the measured NNI, and Y’ is the estimated NNI.
The AIC describes to what degree the model is explained by the data. The models were compared, and that with the least amount of information loss was used [39]. The models close to reality had lower AIC values [14].
The highest precision and accuracy of the model for predicting crop N status (NNI), yield, or GPC was chosen based on (i) the highest R2, and (ii) the lowest RMSE and AIC. In the results of the models, the highest value was the R2 and the lowest was the RMSE and AIC in all cases. Therefore, only the R2 will be mentioned in the results.

3. Results

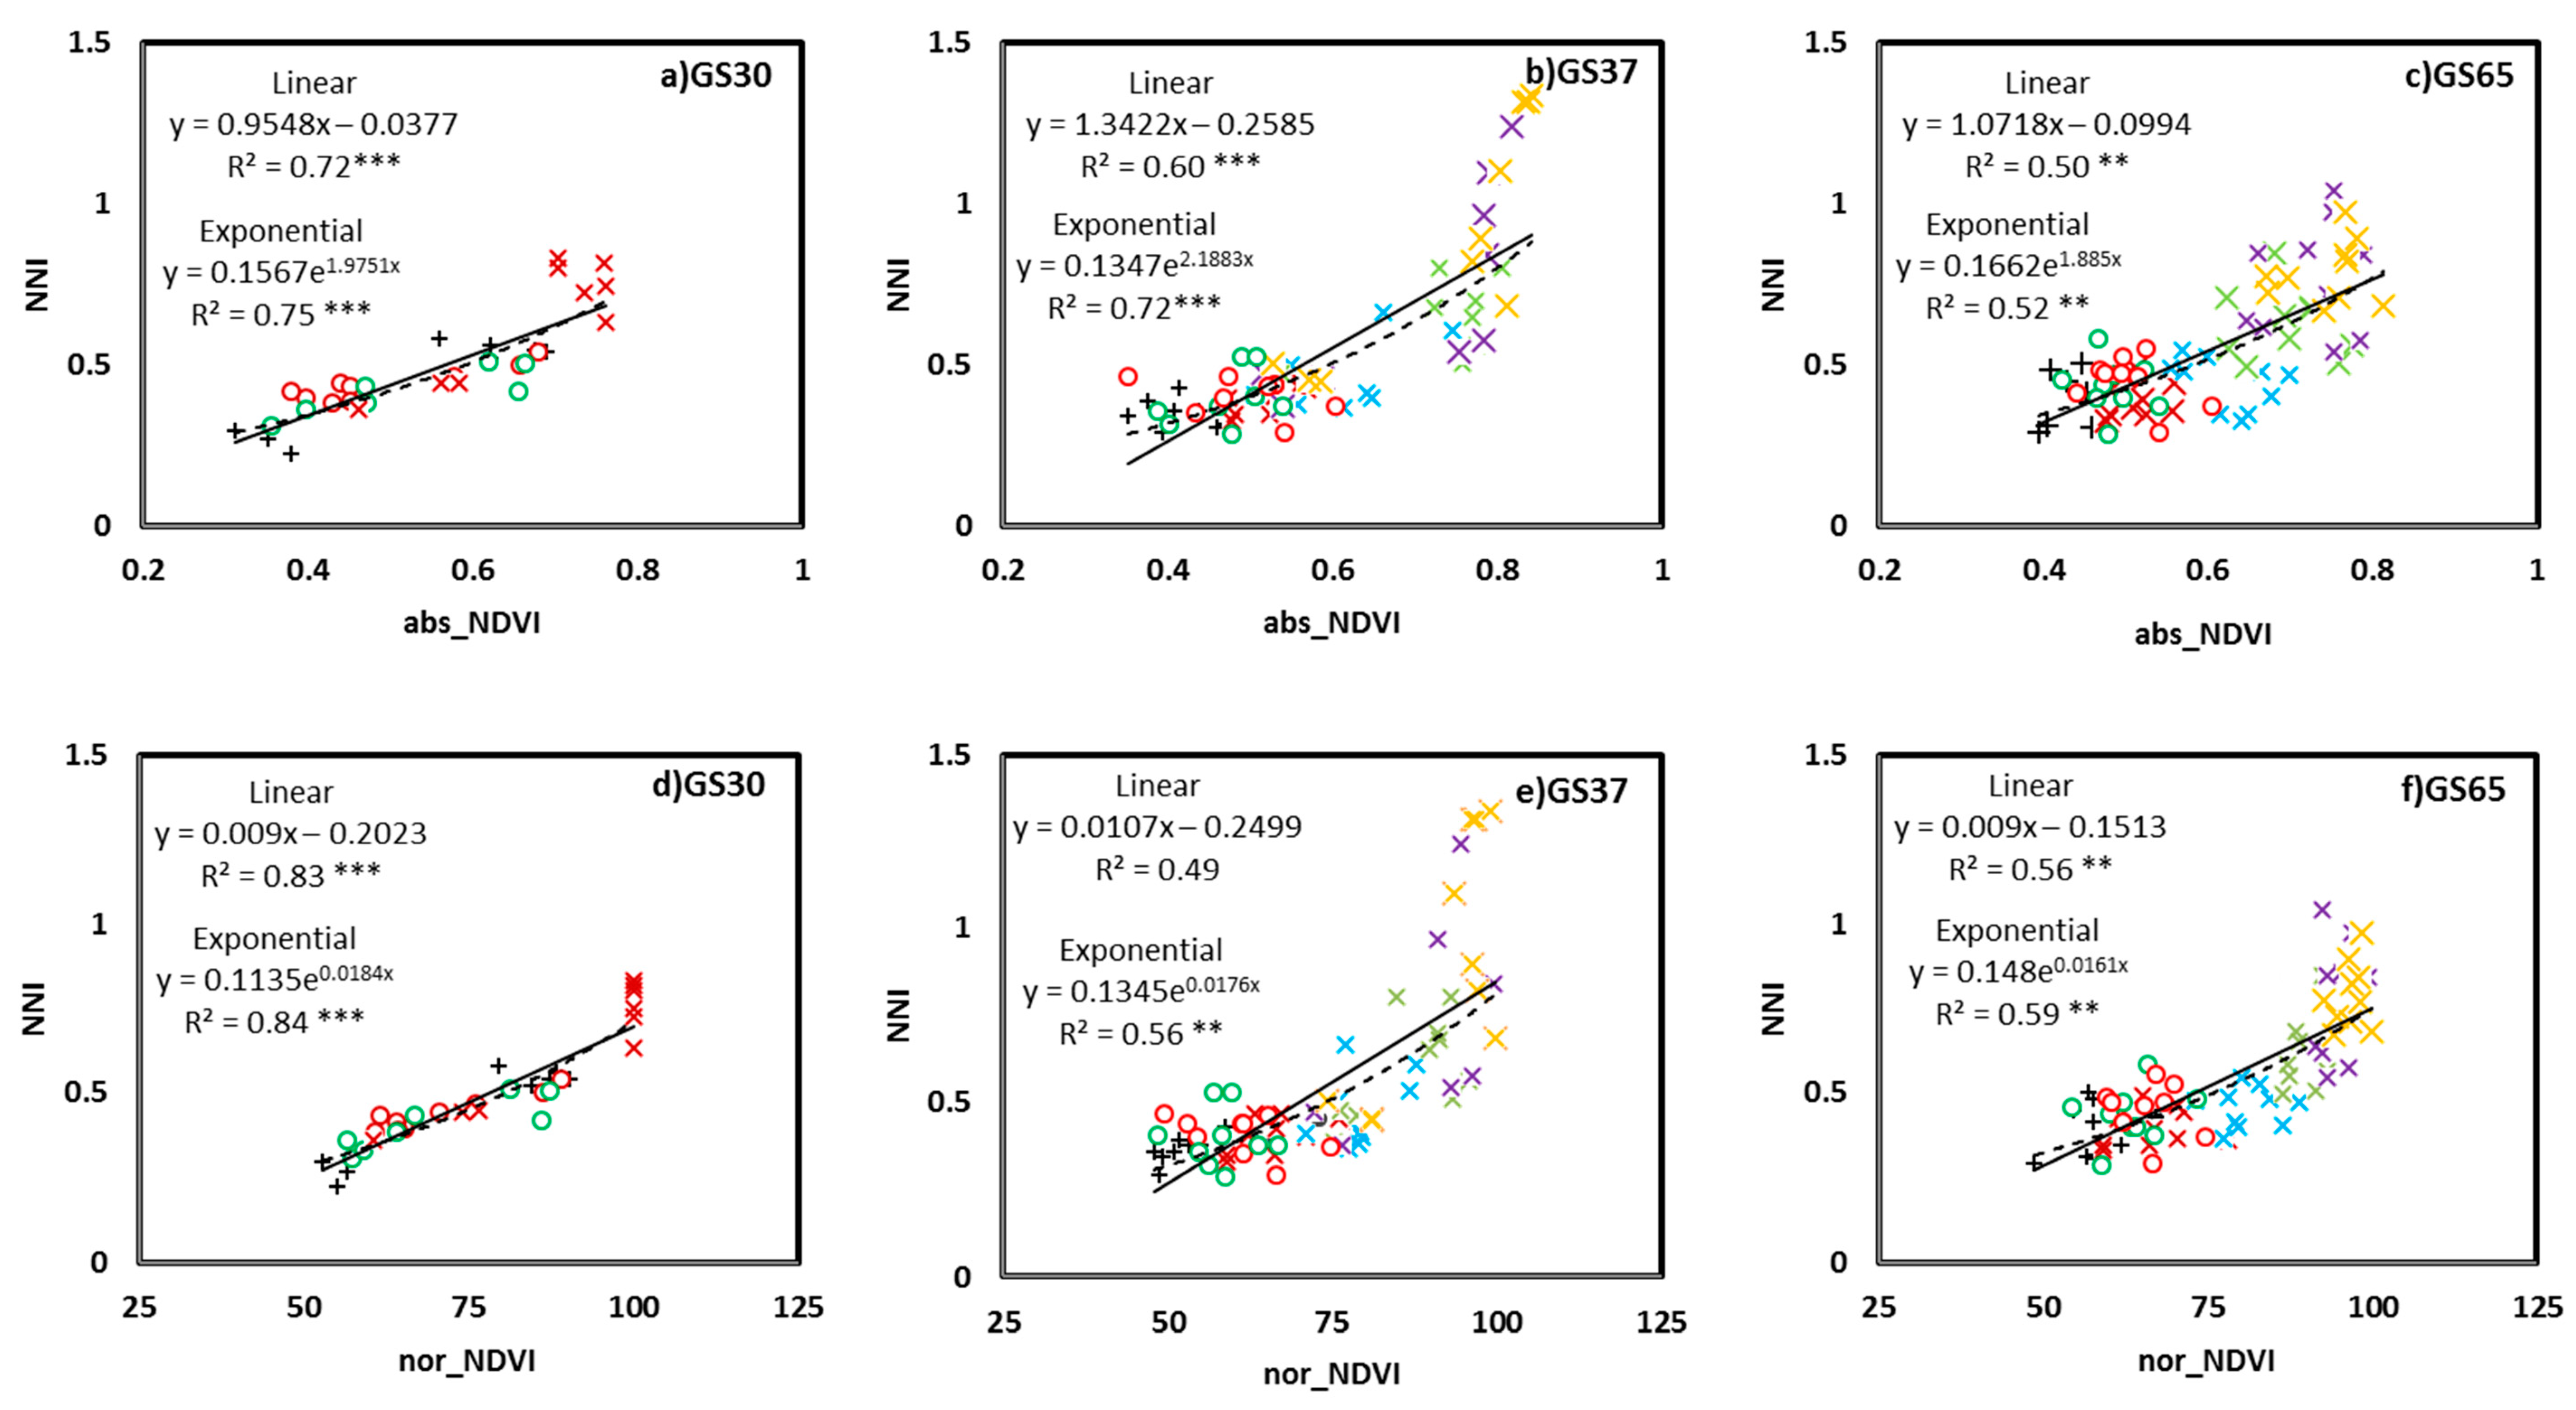
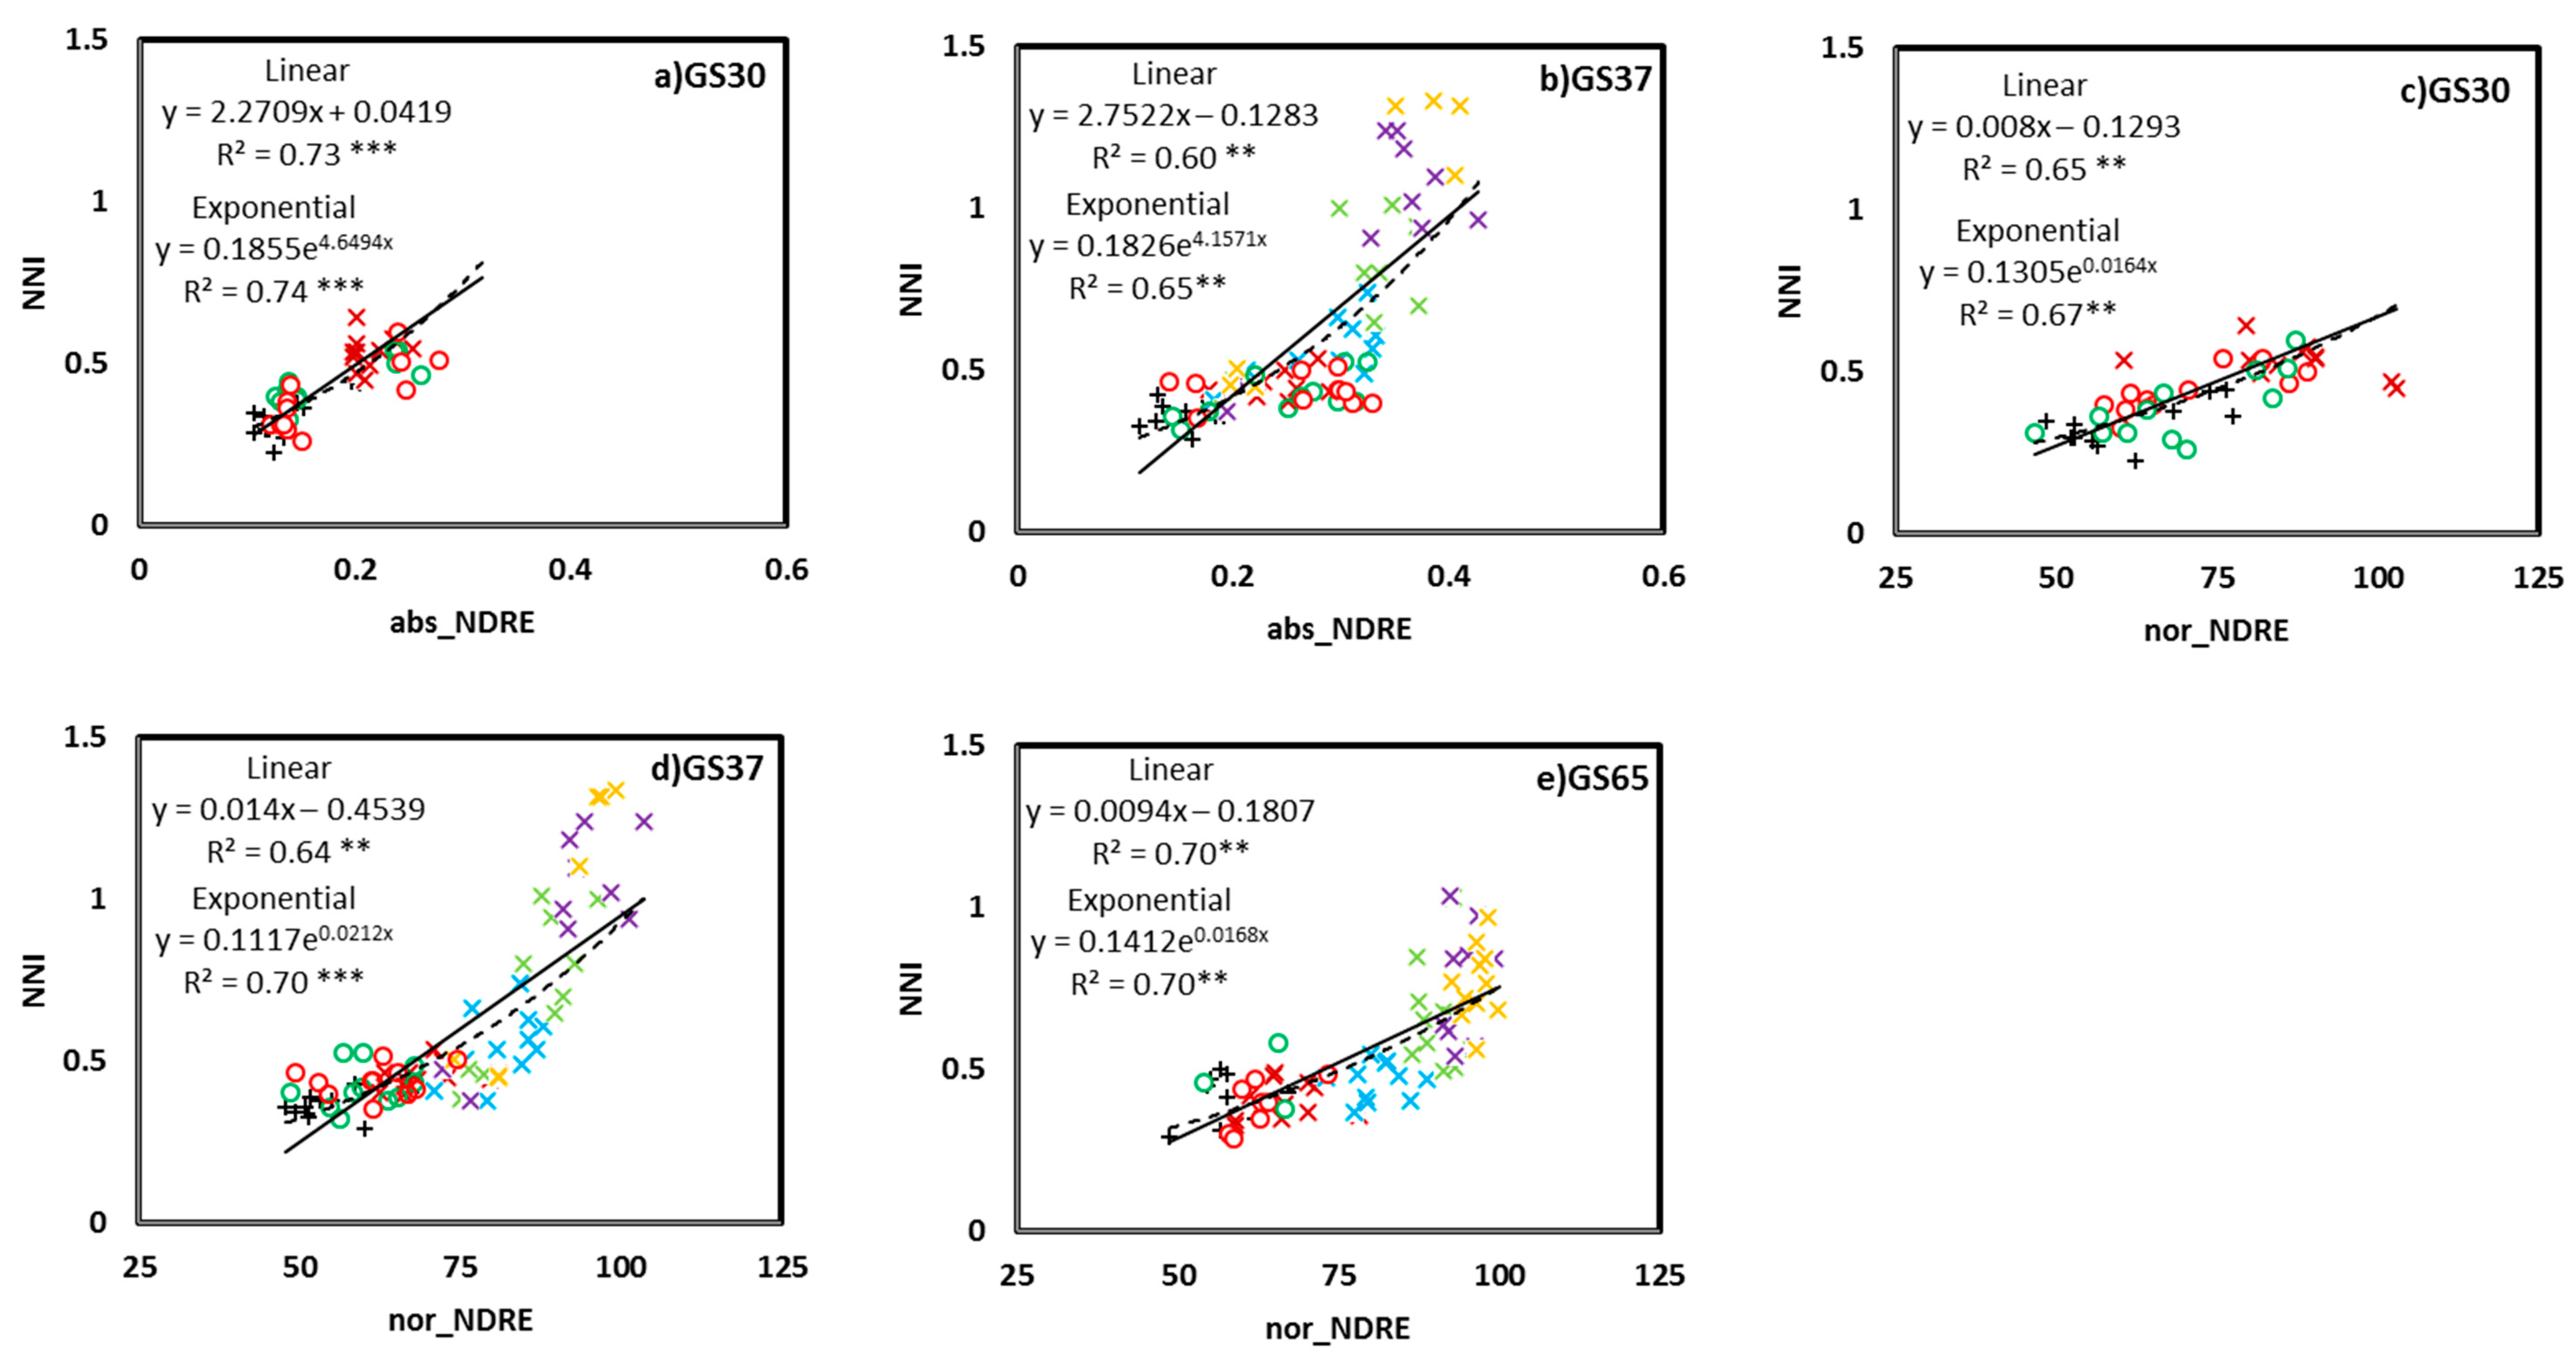
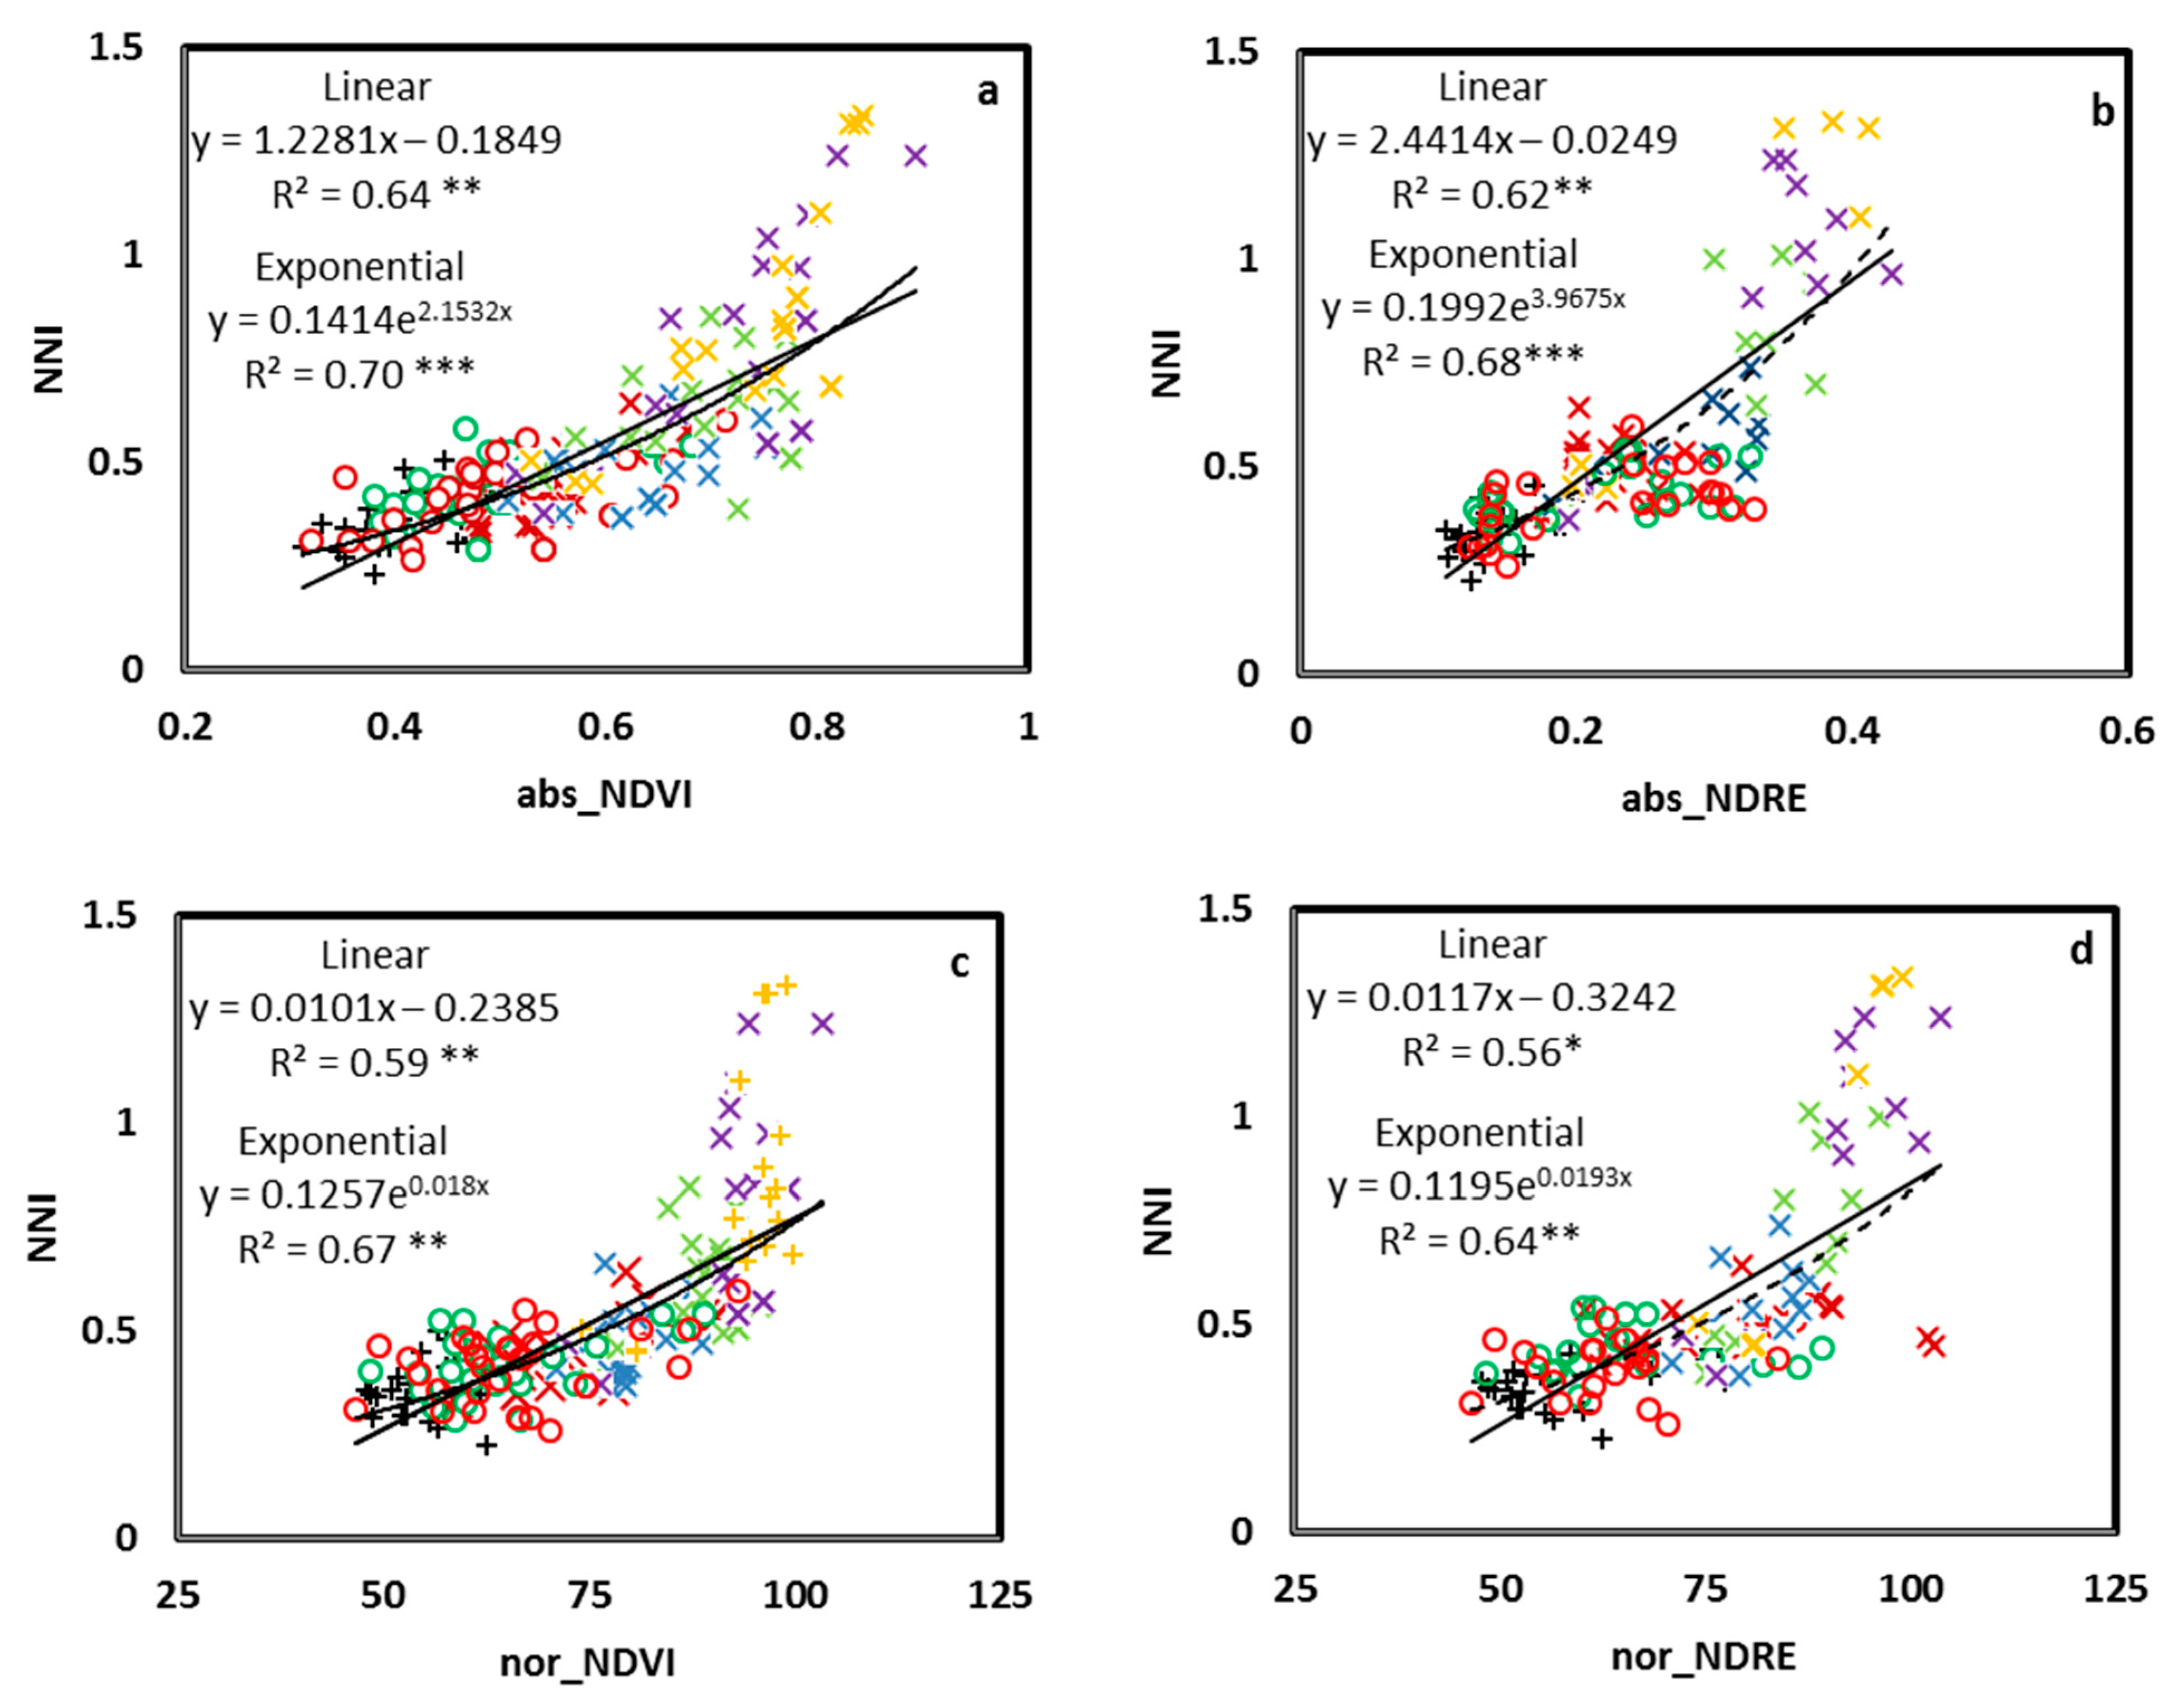
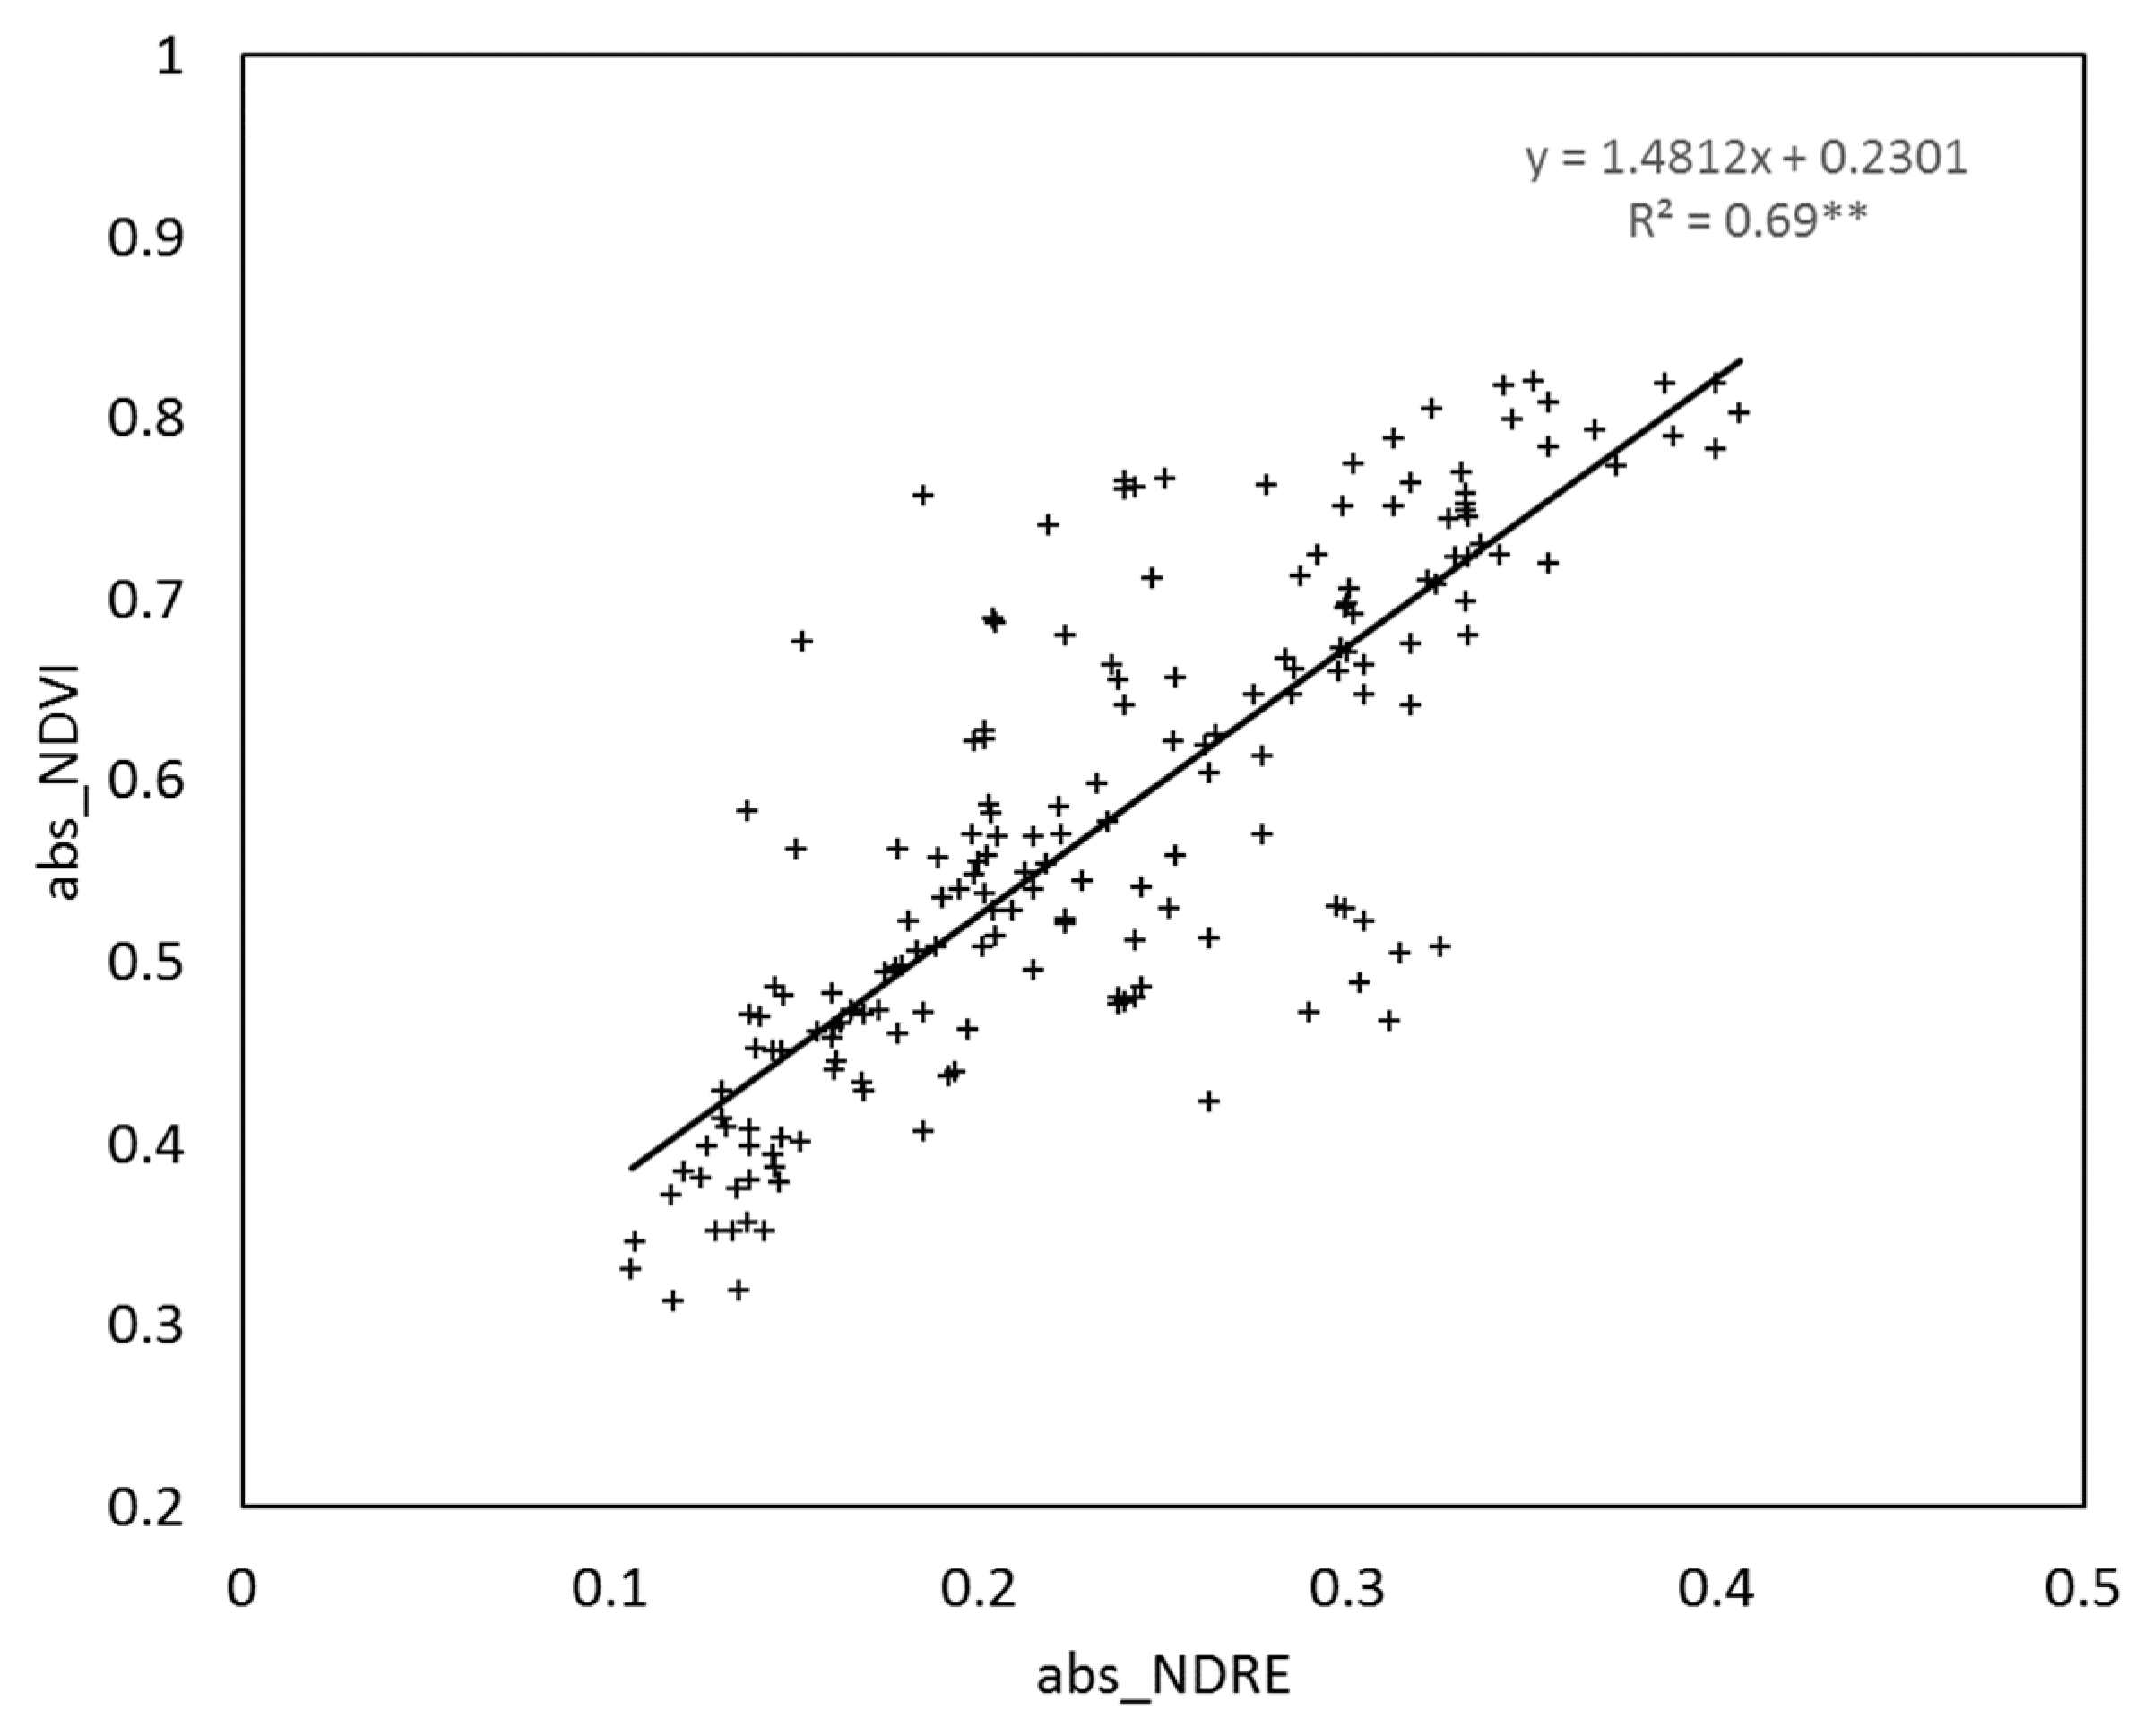
3.1. Relationship between the NNI and Crop Sensor Readings

The correlations were fitted between the absolute and normalized CSR and NNI for each different growing stage (GS30, GS37, and GS65; Figure 2 and Figure 3), as well as a general correlation across growing stages (Figure 4). For growing stage-specific models, the RapidScan CS-45 indexes predicted a better NNI (Figure 2 and Figure 3) than the Yara N-TesterTM for both models (linear and exponential). The Yara N-TesterTM did not present a significant relationship to NNI, thus, relationships were not plotted. With RapidScan, the exponential models predicted the NNI more successfully than the linear models in all cases (a higher R2 and lower AIC and RMSE). For absolute values, the abs_NDVI values better explained the NNI variability (Figure 2a–c) than the abs_NDRE values (Figure 3a,b) in every growing stage (R2 values higher than 52 in all cases). The relationship between abs_NDRE at GS65 and the NNI was not significant, thus, it was no plotted. For the normalized values, the nor_NDRE (Figure 3d,e) values fit the NNI slightly better at GS37 and GS65 (R2 = 0.7) than the nor_NDVI values (Figure 2e,f). However, at GS30, nor_NDVI predicted the NNI better than nor_NDRE (Figure 2d and Figure 3c). The general model (Figure 4), especially the abs_NDVI values (Figure 4a), had good accuracy when estimating the NNI (R2 = 0.7, similar to the models for different growing stages). In the general model, there were no significant relationships between the Yara N-TesterTM and NNI, like that found in the growing stage-specific models (data not shown).
Saturation effects were detected for both the NDVI and NDRE indexes when NNI > 0.8 (Figure 2, Figure 3 and Figure 4). The RapidScan CS-45 indexes did not increase more than 0.8 for the NDVI (Figure 2 and Figure 4) or more than 0.4 for the NDRE (Figure 3 and Figure 4), even though the NNI values continued increasing above 0.8. Although NDVI and NDRE reached saturation at a similar point, the NDRE value range was slightly wider for NDVI values around 0.8 (0.35–0.40; Figure 5). The values located from NNI = 0.8 to NNI = 1.4 were not quantified by RapidScan CS-45 (Figure 2, Figure 3 and Figure 4).

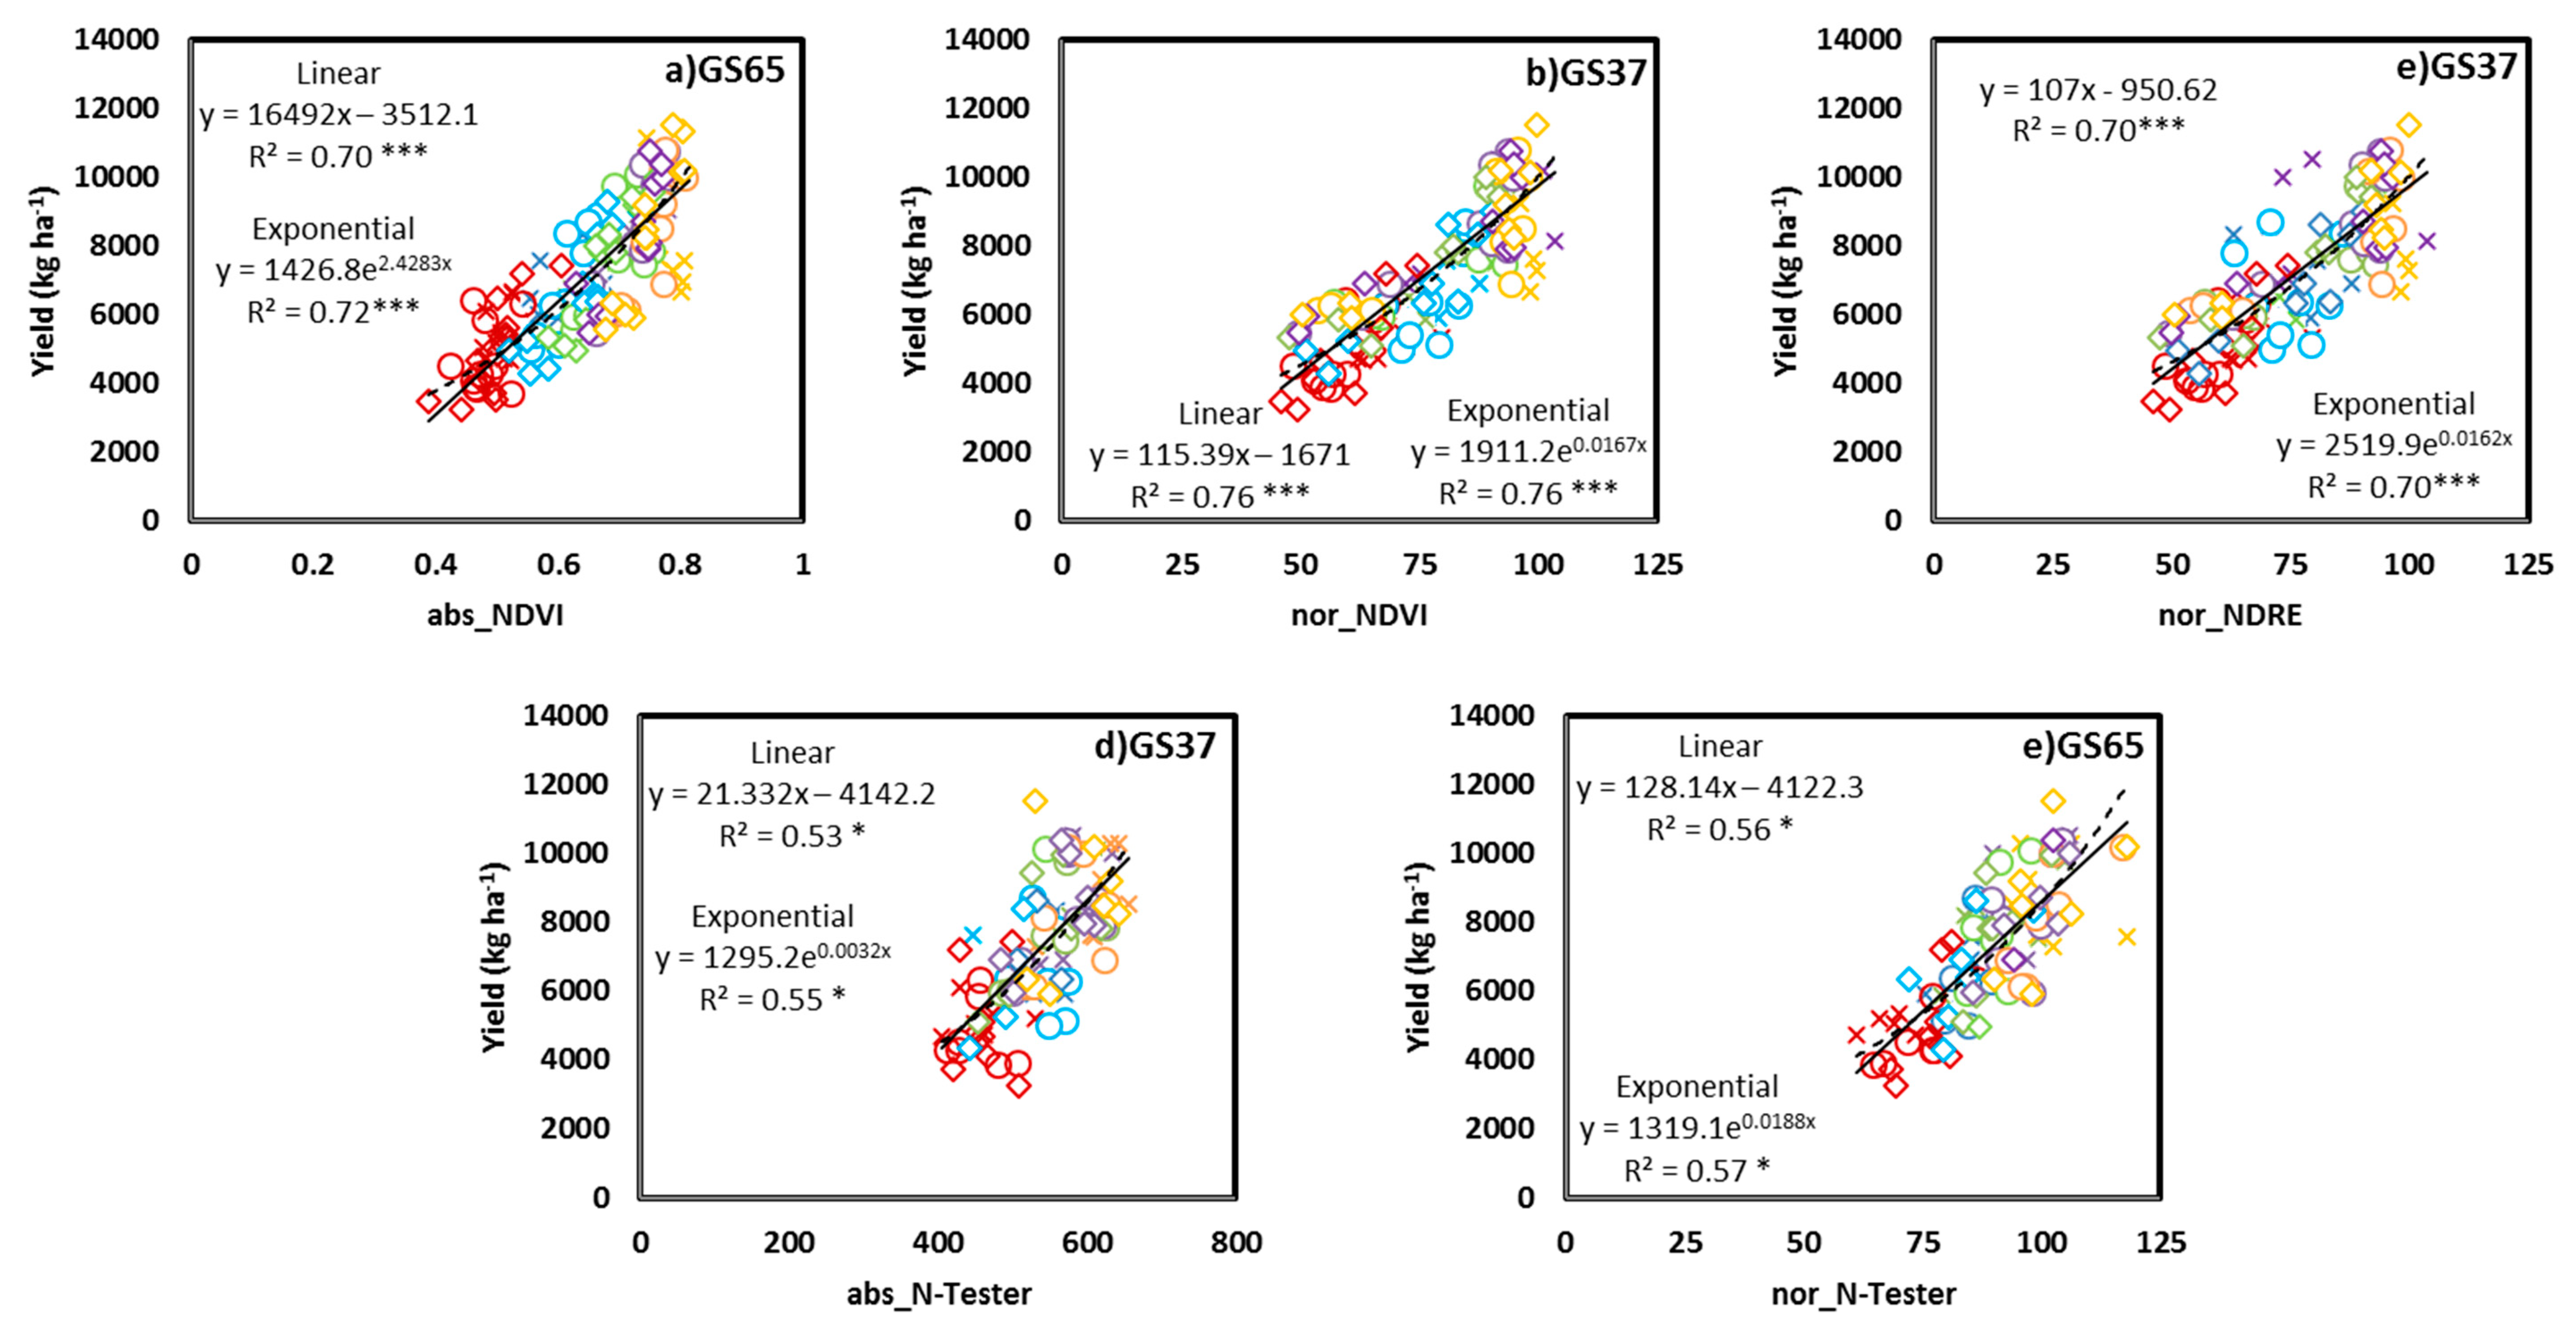
3.2. Relationship between the Yield and GPC and Crop Sensor Readings

Correlation coefficients of the relationship between the absolute and normalized CSR at each different growing stage (GS30, GS37, and GS65) and grain yield (Figure 6) and GPC were fitted. The lineal models and exponential models predicted similar yields from CSR. The yield prediction capacity was high with abs_NDVI at GS65 (Figure 6a; R2 = 0.72), nor_NDVI at GS37 (Figure 6b; R2 = 0.76), and nor_NDRE at GS37 (Figure 6c; R2 = 0.70), whereas the yield prediction capacity with abs_N-Tester at GS37 (Figure 6d; R2 = 0.53) and that with nor_ N-Tester at GS65 (Figure 6e; R2 = 0.57) was low. The remaining relationships between yield and CSR (abs_NDVI at GS30 and GS37; abs_NDRE at GS30, GS37 and GS65; abs_N-Tester at GS30 and GS65) and nor_CSR (nor_NDVI at GS30 and GS65; nor_NDRE at GS30 and GS65; nor_N-Tester at GS30 and GS37) were not significant (data not shown). The GPC prediction capacity with CSR and that with nor_CSR was not significant in any of the cases (the best relationship was observed between abs_N-Tester at GS65 (R2 = 0.35)).

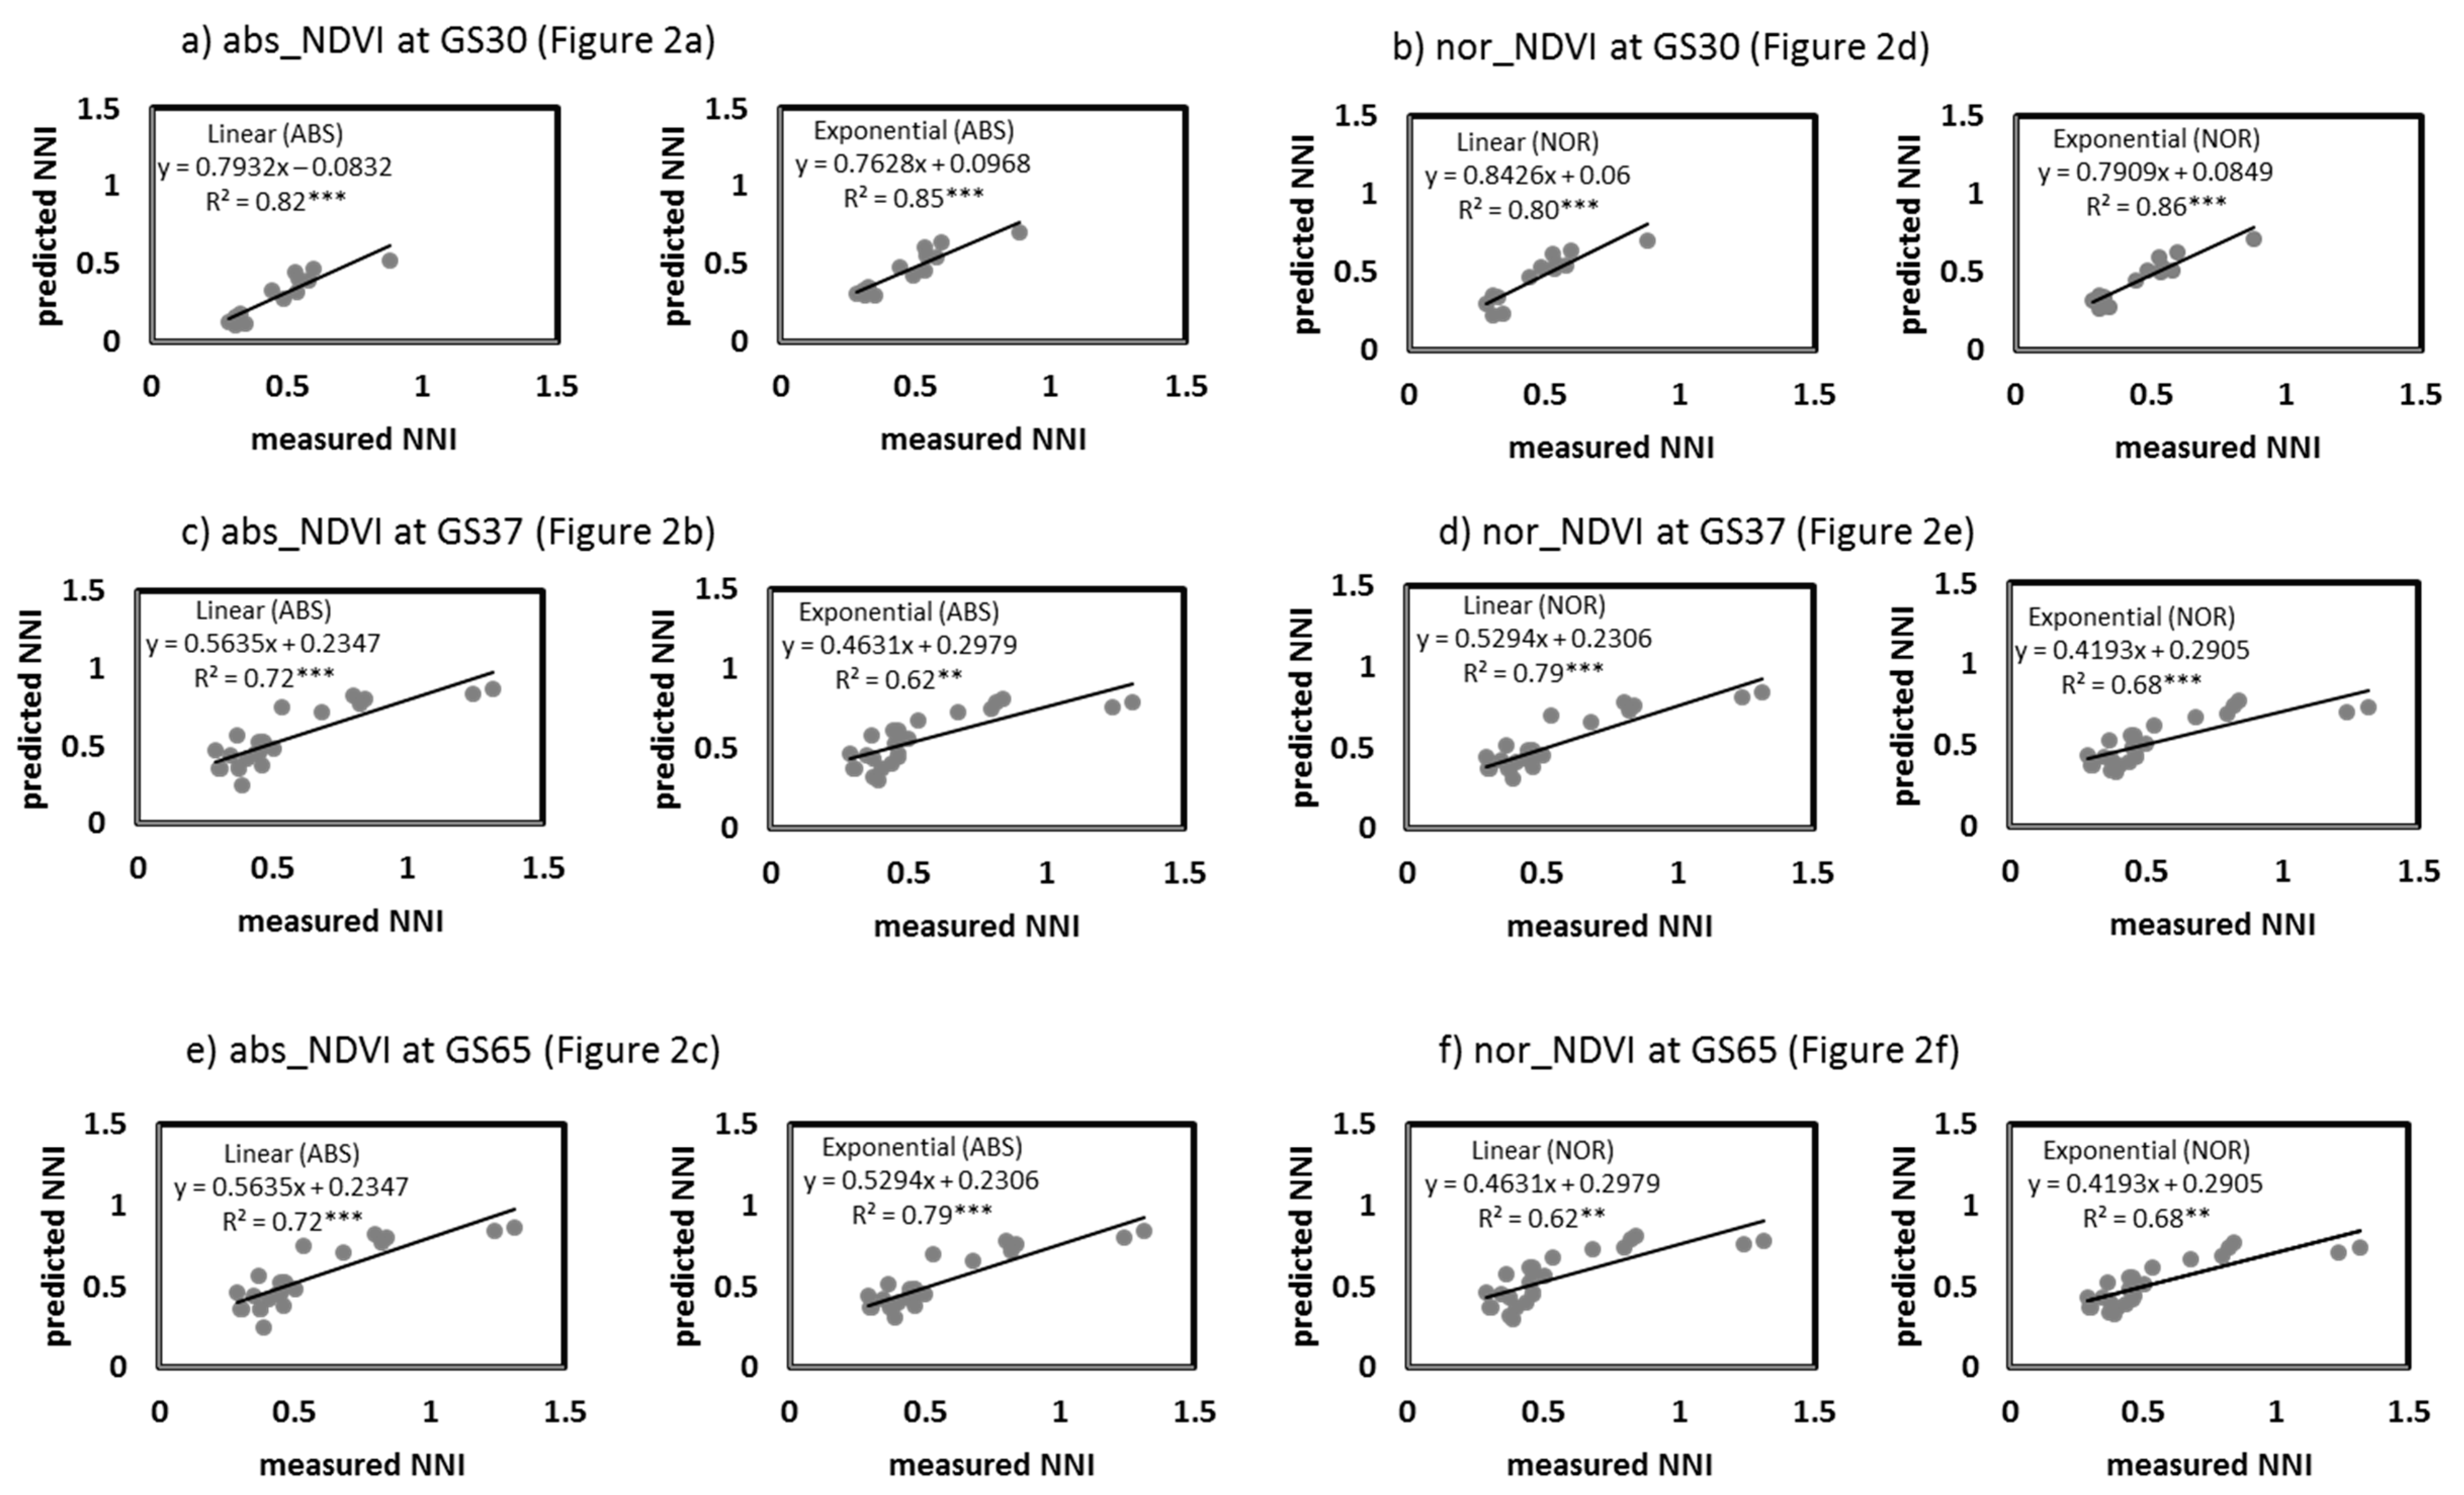
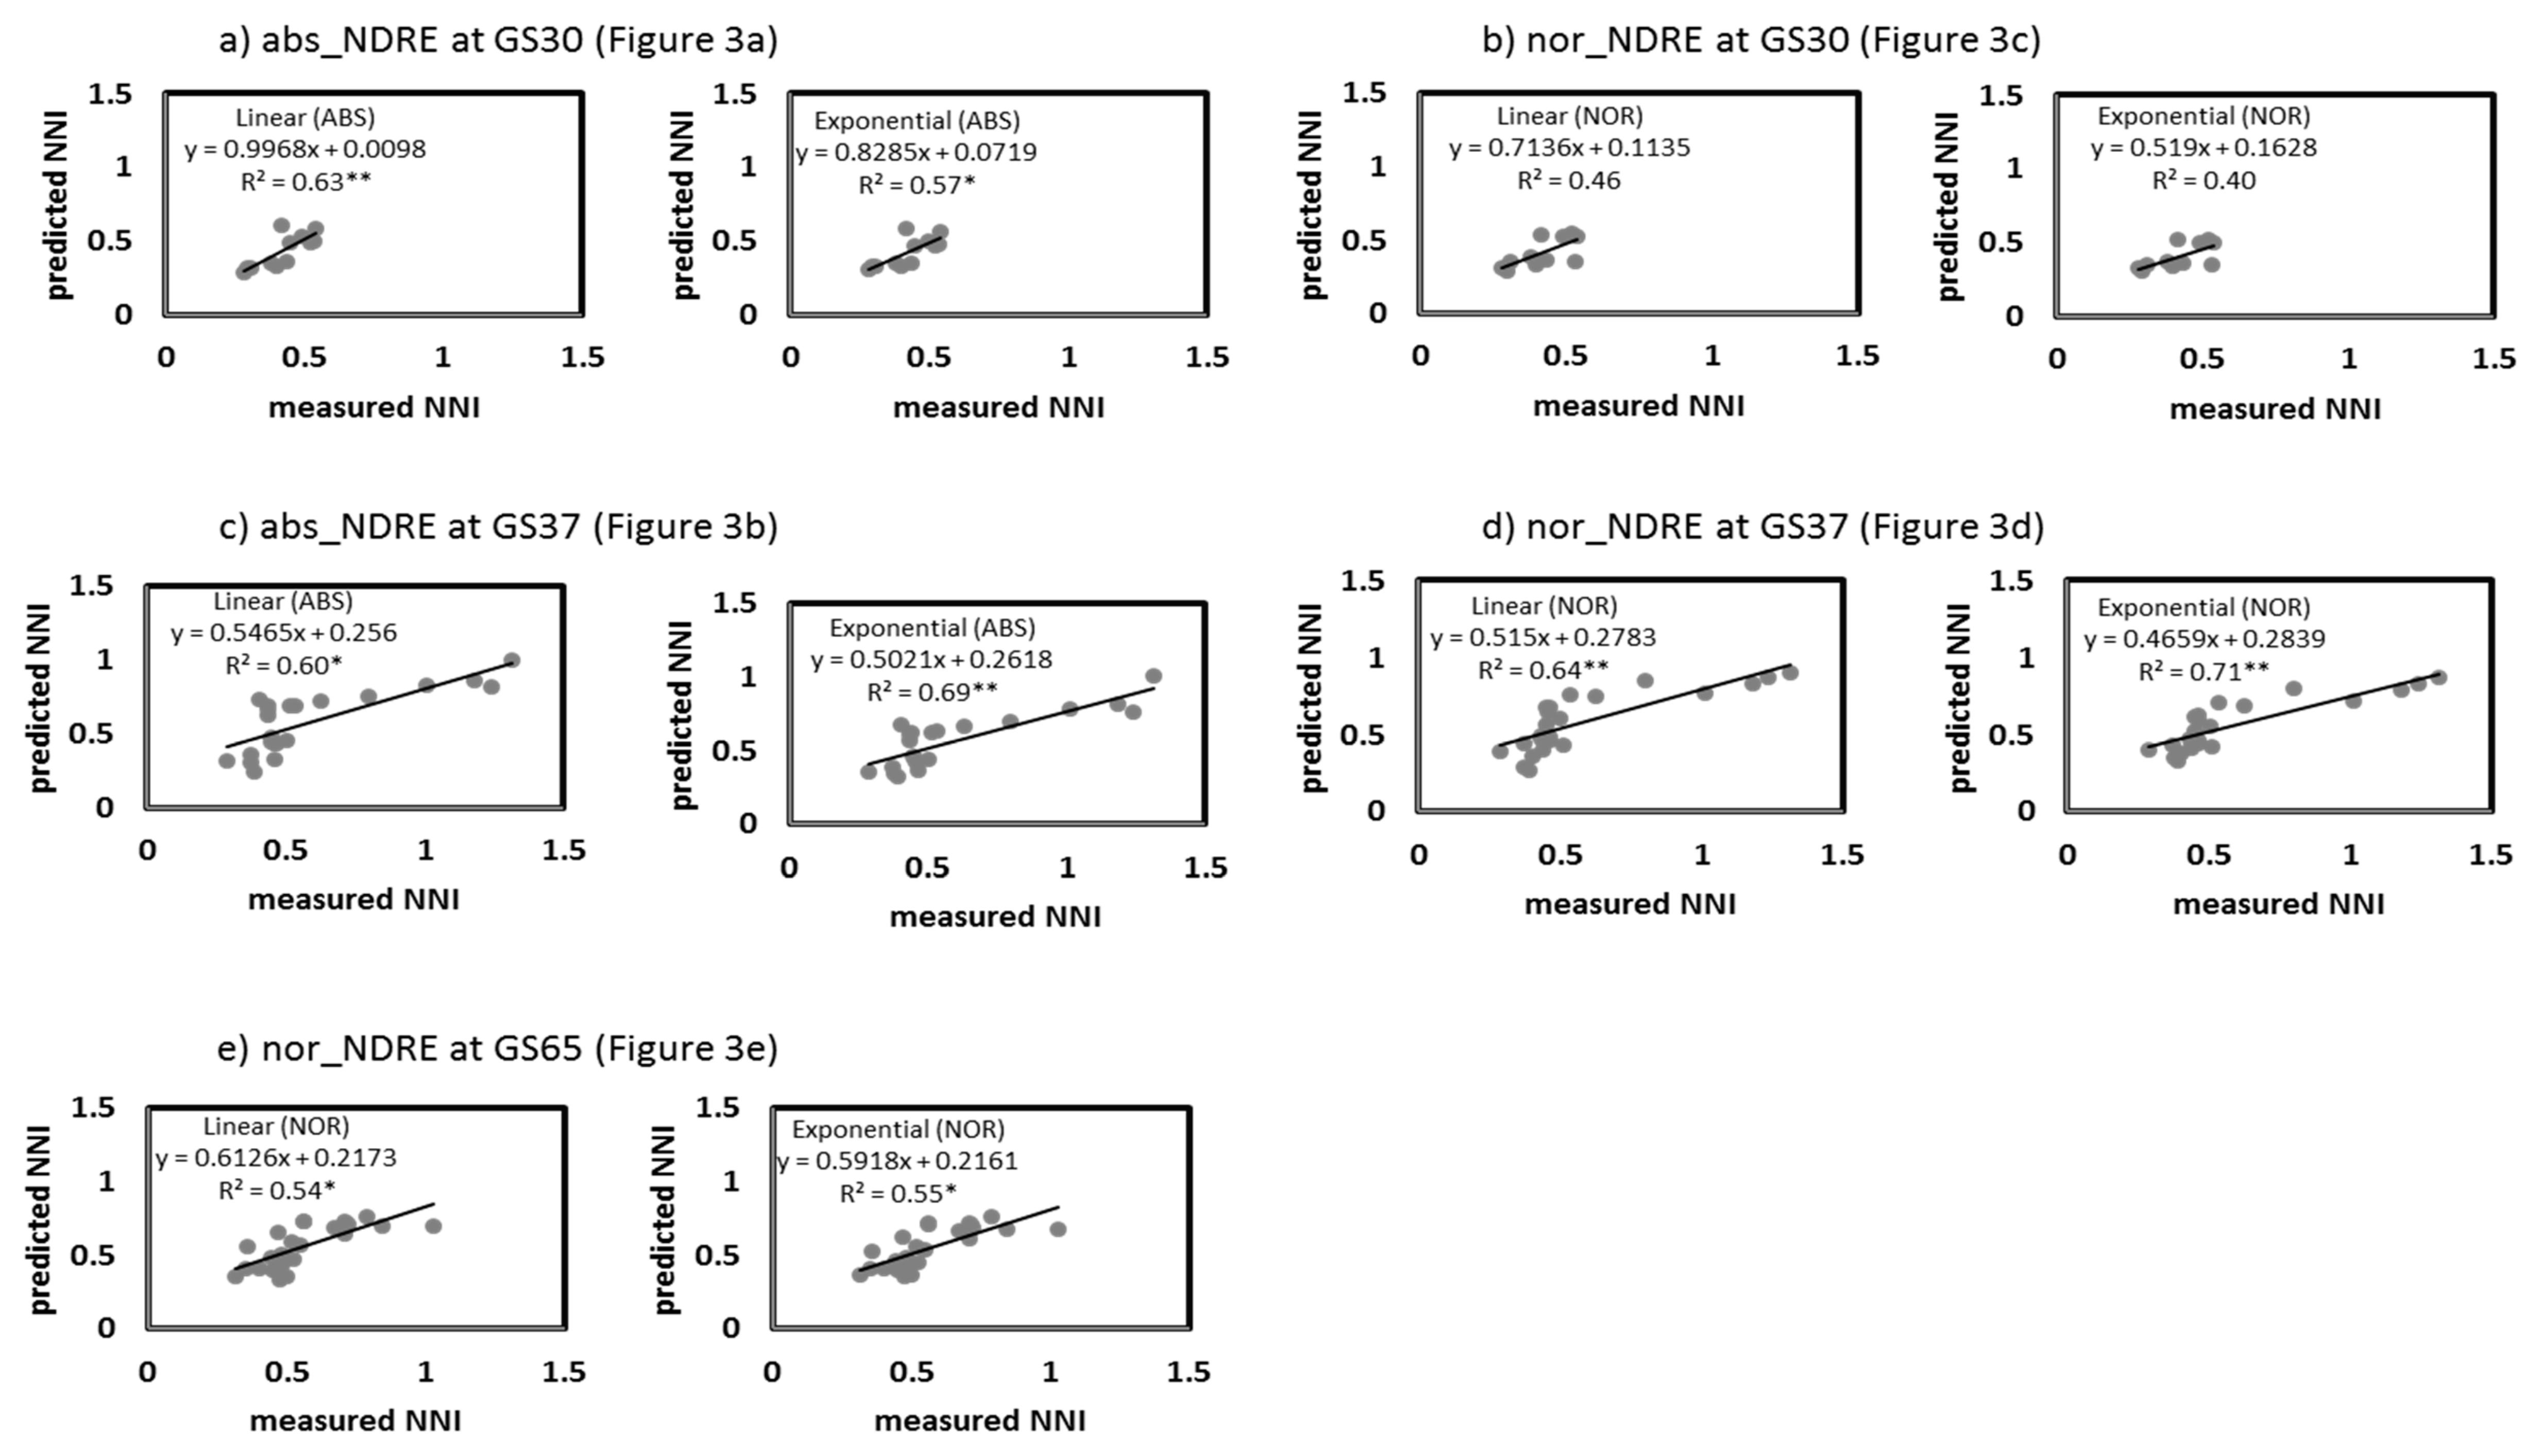
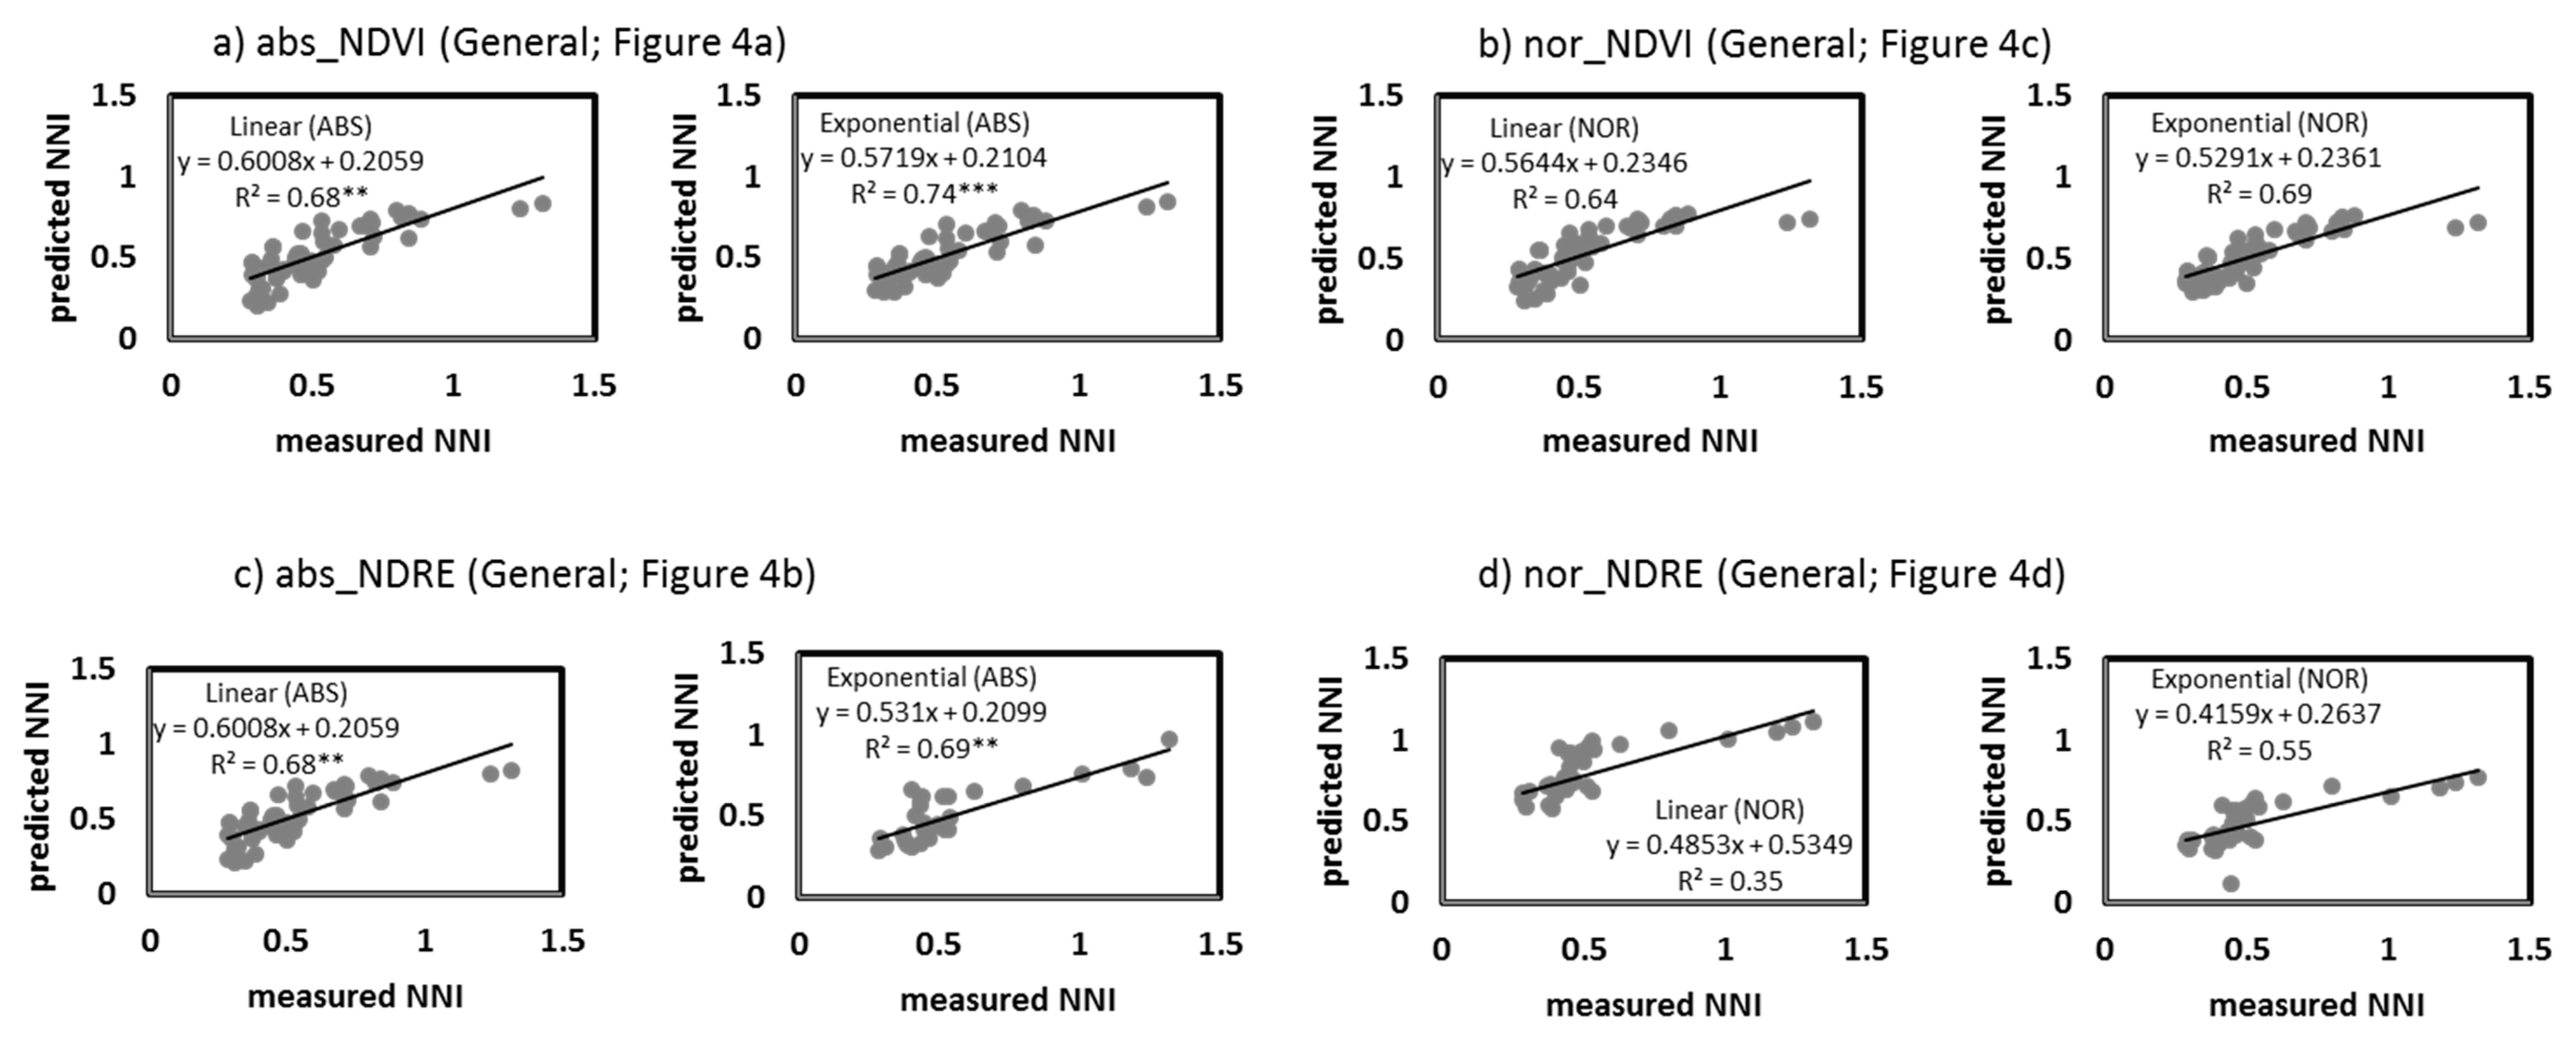
3.3. NNI Estimation Perfomances from Proximal Sensing Tools

The NNI values predicted from the different indexes and models were plotted against the measured NNI values from the remaining samples (25%) when the correlations were significant (Figure 7, Figure 8 and Figure 9). In the models specific to the growing stage, the order of the accuracy of the correlations for validation was similar to the accuracy of the prediction correlations (Figure 7 and Figure 8). There was a significant agreement between the estimated NNI and the measured NNI for the vast majority of the correlations, with the exception of nor_NDRE at GS30 (Figure 8b). NDVI had a greater potential for predicting NNI than NDRE, as represented by its higher R2 and lower RMSE and AIC. In the general model (Figure 9), there was a significant agreement between the estimated NNI and the measured NNI with abs_NDVI and abs_NDRE (Figure 9a,c), especially with abs_NDVI in the exponential model (Figure 9a). For nor_NDRE and nor_NDVI, the predicted NNI and the measured NNI did not agree (Figure 9b,d). NDVI had a high potential for predicting NNI, especially with the exponential model (R2 = 0.74; RMSE = 0.12; AIC = −89), even in the general model.

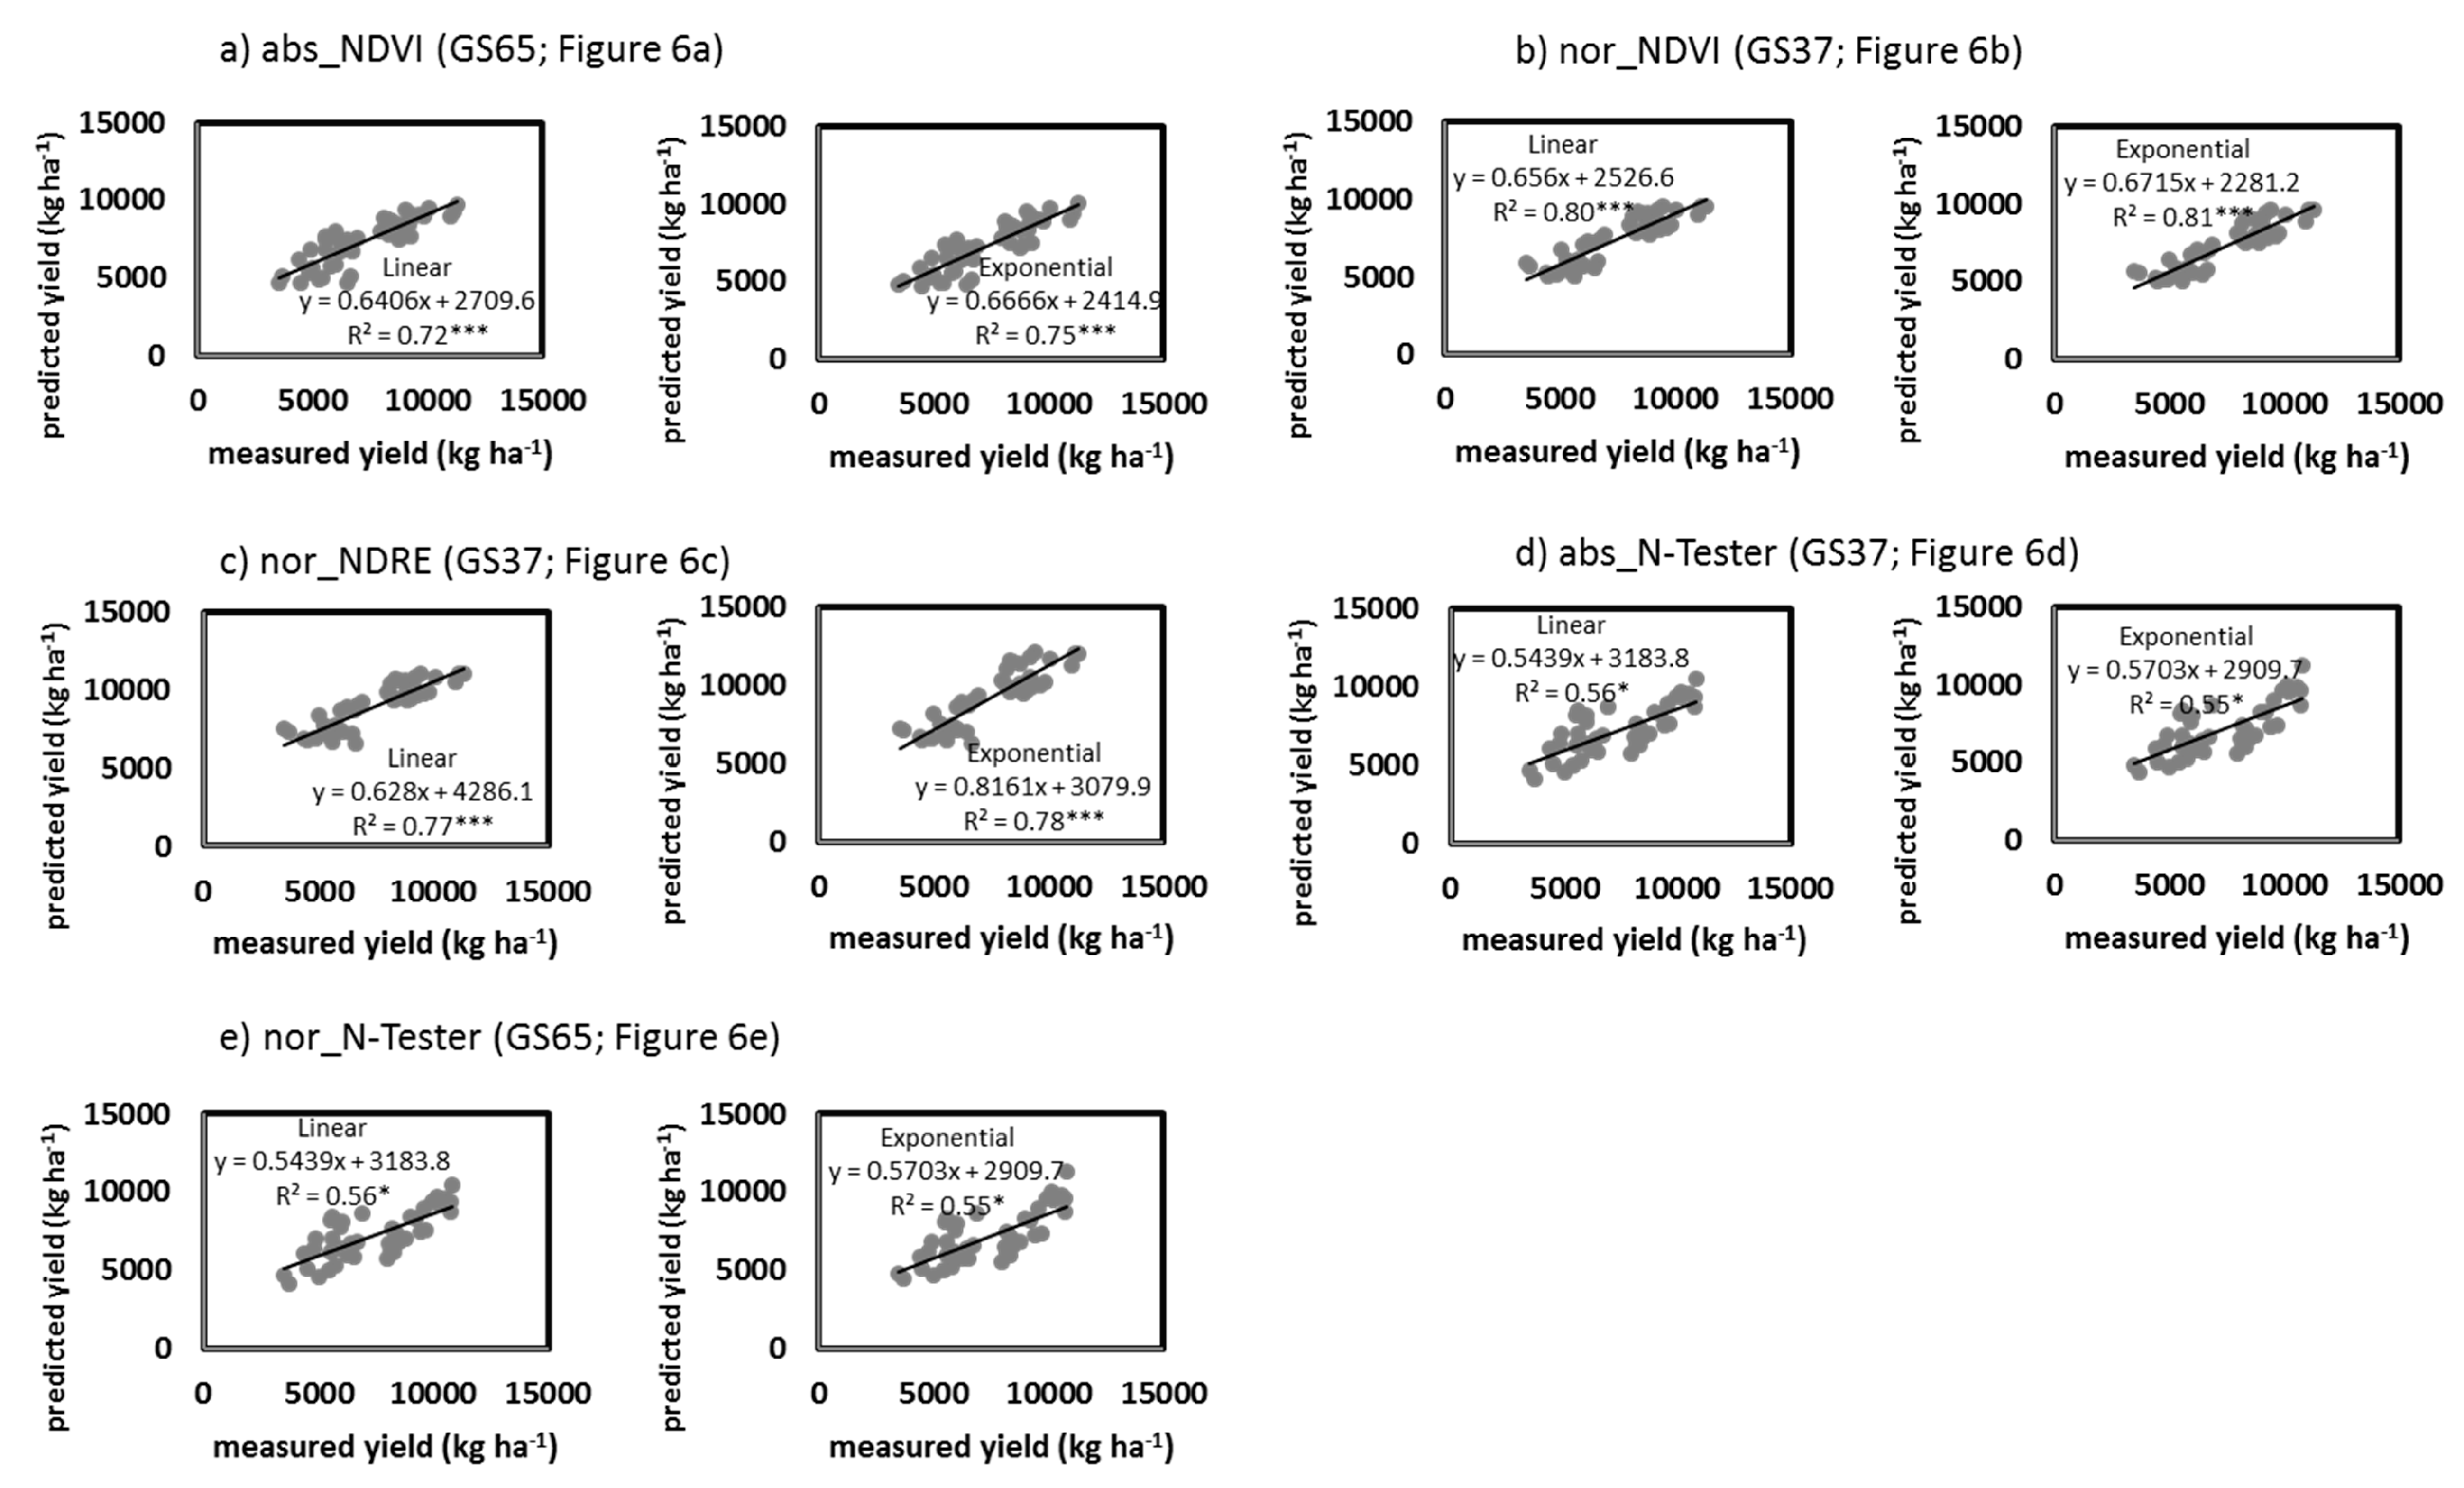
3.4. Grain Yield and GPC Estimation Perfomance from Proximal Sensing Tools

The predicted yield values from the different indexes and models were plotted against the measured yield values from the remaining samples (25%) when the correlations were significant (Figure 10). Figure 10 shows that there was a significant agreement between the estimated yields and the measured yields in all cases. However, for abs_N-Tester at GS37 and nor_N-Tester at GS65, the agreement was lower than that for nor_NDVI and nor_NDRE at GS37 and abs_NDVI at GS65, as shown by the higher R2 values and lower RMSE and AIC values. Since no index or model could predict the GPC values, GPC estimation performance was studied.

4. Discussion

The NDVI has been the most commonly used vegetation index in agriculture over the last four decades [40] and is a common measure for determining crop N status. The vast majority of the models for predicting the in-season N rate use NDVI [41]. Similar to the results of the present study, Xue et al. [42] described a good relationship between N status and the vegetative period of rice (R2 = 0.70–0.90), and Cao et al. [41] found that the NDVI explained 47% of NNI changeability across growing stages and growing seasons in wheat.
Usually, in scientific studies, ground-based values are normalized with an overfertilized reference strip where non-limiting N has been applied. However, this approach has limitations because it is not easy for a control fringe to be representative of the field. Moreover, using normalized values would make the use of these tools more difficult for the farmer. Furthermore, Ravier et al. [14] showed that it is not easy to ensure that an overfertilized fringe is not N deficient, thereby problematizing the use of normalized data. In our case, the absolute values were normalized using a strip fertilized with 280 kg N ha−1. However, these overfertilized treatments did not obtain NNI ≥ 1 in some situations. Moreover, when extending the method to large scale tools as the satellite, the utilization of absolute values is convenient, as having an overfertilized strip at each field for data normalization would be a challenging issue. However, if the measurements are not normalized it would be necessary to adjust the crop sensor measurements to different conditions, locations, and varieties [43].
Many authors have noted that the correlations between the NNI and proximal sensors fit better with growing stage-specific models. Sembiring et al. [44] and Mistele and Schmidhaltel [18] (using spectral reflectance) and Cao et al. [45], Ravier et al. [14] (using chlorophyll meters), and Lu et al. [20] (using RapidScan CS-45 sensors) have showed that the highest diagnostic accuracy obtained for cereals differs depending on the growing stage. In our study, the general model, especially abs_NDVI values, showed good accuracy in its NNI estimations, similar to the models for different growing stages (Figure 4). The accuracy of the correlations for validation was also high for abs_NDVI (Figure 7 and Figure 9a), especially in the exponential model. Remarkably, it would thus be easier to use a unique model for on-farm implementations than growing stage-specific models. As in the present study, other authors have also supported using general models with active canopy sensors for winter wheat [46] and with chlorophyll meters for durum wheat [13].
Saturation effects were detected for both the NDVI (around 0.8) and NDRE (around 0.4) indexes when NNI > 0.8. Although NDVI and NDRE reached saturation at a similar point, the NDRE value range is slightly wider for NDVI values around 0.8 (0.35–0.40; Figure 5). However, the NNI threshold values needed to achieve the maximum yields in wheat proposed by Ravier et al. [1] were always NNI < 0.8 or lower. In that case, the saturation effect of the RapidScan CS-45 indexes would not be a problem, as the values related to NNI = 0.8 were close to NDVI = 0.8 and NDRE = 0.37 (Figure 2, Figure 3, Figure 4 and Figure 5). Therefore, the NDVI values obtained in our conditions would be useful for us making a good nitrogen nutritional diagnosis. The saturation effects on NDVI have been also shown by other authors for winter wheat [41,47] and for rice [48]. It has been reported that when crops achieve a critical canopy or critical chlorophyll content, the NDVI saturation effect is relevant [41,49,50]. This saturation effect is relevant when the canopy is very close and the NIR and visible light break into the crop canopy differently, thereby diminishing the normalization effect of the calculations [16]. When the canopy is close, the NIR reflectance increases while the red reflectance hardly changes [16]. The transmittance of the visible light through the canopy is low, so it is dominated by the top leaves of the plants [16]. However, the NIR detects the biomass bellow as it has a higher transmittance through the crop canopy [16]. The saturation effect can be reduced by using red-edge-based vegetation indices, such as NDRE [46]. Indices including red-edge channels could have higher sensitivity to chlorophyll content in crops, as Cao et al. [46] and Zhang et al. [24] detected that the red-edge bands were more suitable for determing crop N status than the NDVI, and Sharma et al. [50] concluded that NDRE would be better for developing late-season N application algorithms. Conversely, Bonfil [21] showed that the NDVI reaches the same accuracy as the NDRE with RapidScan CS-45 in wheat, similar to the present study.
The yield potential may vary between growing seasons because of the temporal variability in rainfall, temperature, or relative humidity [1]. In this study, the rainfall patterns were very different between years (data not shown), giving more variability to the data. Royo et al. [51] and Martí et al. [19] concluded that the prediction of wheat yield is better when the absolute NDVI readings from later in the season (flowering; GS60–GS65) are used (when yield estimates stabilize). In late growing stages, crop development is advanced in its phenology, and fewer abiotic effects can affect the grain yield. However, similar to our results, Magney et al. [23] showed that the strongest predictions of wheat yield are made prior to heading (before GS50). Otherwise, the yield predictive capacity of the NDVI decreases during grain filling [23].
The GPC prediction capacity with CSR and nor_CSR was not possible in the present study. The best relationship was observed between abs_N-Tester at GS65, where the GPC values could be partially explained (R2 = 0.36). GPC is a product of the N assimilated by the crop prior to grain filling and of the environmental conditions that the crop undergoes in that period [52]. Contrary to our results, the literature showed the potential of using chlorophyll meters to estimate the GPC in wheat [7,9]. As also verified by other authors [3], in this study, the NDRE and NDVI could not explain the GPC variability in any of the growing stages. Magney et al. [23] showed that the NDVI’s predictive capacity for GPC never exceeds 0.2. As much as 75%–90% of the total N in plants at harvest may come from the preanthesis (growing stage prior to GS60) N uptake in cereals [53], significantly influencing grain quality [54]. However, it is not possible for crop sensors to estimate N translocation efficiency from the vegetative portion to the grain.
As the results showed, both tools have different behaviours in the prediction of NNI, yield, and GPC. These differences can be explained by the intrinsic differences between the proximal sensing tools, which sense different physical variables and different targets. The RapidScan CS-45 measurements are related to the photosynthetically active crop canopy biomass, while the Yara N-Tester measurements are related to leaf chlorophyll content. On the other hand, RapidScan CS-45 measures the crop reflectance, and Yara N-Tester measures the transmittance of the light on a particular leaf. The operations for the measurements are also different; the measurements using RapidScan CS-45 are simpler, faster, and cover a much larger area as they measure the whole canopy of the crop and thus better represent spatial variability. However, the Yara N-Tester only measures the central zone of the last fully developed leaf, even if this leaf has a relevant role in plant N nutrition.
N fertilization recommendations must be made based on remote sensing indexes that were studied and developed for NNI [6]. NNI measurements require great time and labour and are not instantaneous as subsequent laboratory analyses are needed. Active crop sensor measurements, on the other hand, are not invasive, their information obtained for crop N status is instantaneous and well correlated with the NNI, and measurements can be taken at many time-points during the growing season. Following crop N status is not only important in conventional fertilization but also when organics are applied as initial fertilizers. Organic manures differ in their physical and chemical characteristics; they possess different N mineralization patterns and, therefore, leave uncertain quantities of N available for the crop [10]. Moreover, the same organic fertilizer may have different N release dynamics depending on the year, especially considering the long period between the application and beginning of N uptake by the plant (3–4 months).
Some authors have noted that having only two or three wavebands are a limitation to developing optimum vegetation indices [55]. These authors have suggested the use of tools with more wavebands to calculate more complex indexes or indexes that also include green. Satellite remote sensing, where the waveband spectrum is more complete, may have the potential to improve ground-based sensor performance. However, for the accurate interpretation of satellite-based data necessary for making large-scale N fertilization recommendations, we must first understand the information obtained in ground-based areas through field-trials, where different fertilization strategies are tested and indexes are measured at various growing stages, as done in this study.

5. Conclusions

This study demonstrated that RapidScan CS-45 indexes are able to follow the NNI throughout the entire wheat growing season. A single model (for all growing stages) with absolute NDVI data can, therefore, be used for NNI prediction. The RapidScan CS-45 indexes were able to predict yield with normalized values at GS37 better than at GS65. RapidScan CS-45 and Yara N-TesterTM were not able to predict GPC. Data normalization improved the model for yield but not for NNI prediction. Therefore, following crop N status throughout the growing season using proximal sensing may allow for better adjustment of the N fertilizer to the crop requirements.

Author Contributions

M.A., A.C., and A.A. contributed to the design of this experiment. Field work was accomplished by M.A. and A.C.; M.A., A.C., and A.A. contributed to the interpretation of the data; M.A. and A.A. wrote the paper. M.A., A.C., and A.A. revised the paper critically and approved the final version. All authors have read and agreed to the published version of the manuscript.

Funding

The National Institute of Agricultural and Food Research and Technology (RTA2013-00057-01 and RTA2017-00088-C03-00) and the Department for Economic Development and Infrastructures of the Basque Government funded this study. M. Aranguren was the recipient of a predoctoral fellowship from the Department for Economic Development and Infrastructures of the Basque Government.

Conflicts of Interest

The author declares no conflicts of interest.

References

  1. Ravier, C.; Meynard, J.M.; Cohan, J.P.; Gate, P.; Jeuffroy, M.H. Early nitrogen deficiencies favor high yield, grain protein content and N use efficiency in wheat. Eur. J. Agron. 2017, 89, 16–24. [Google Scholar] [CrossRef]
  2. Raun, W.R.; Johnson, G.V.; Stone, M.L.; Solie, J.B.; Lukina, E.V.; Thomason, W.E.; . Schepers, J.S. In-season prediction of potential grain yield in winter wheat using canopy reflectance. Agron. J. 2001, 93, 131–138. [Google Scholar] [CrossRef] [Green Version]
  3. Hansen, P.M.; Jørgensen, J.R.; Thomsen, A. Predicting grain yield and protein content in winter wheat and spring barley using repeated canopy reflectance measurements and partial least squares regression. J. Agric. Sci. 2003, 139, 307–318. [Google Scholar] [CrossRef]
  4. Zhao, B.; Duan, A.; Ata-Ul-Karim, S.T.; Liu, Z.; Chen, Z.; Gong, Z.; Zhang, J.; Xiao, J.; Liu, Z.; Anzhen Qin, A.; et al. Exploring new spectral bands and vegetation indices for estimating nitrogen nutrition index of summer maize. Eur. J. Agron. 2018, 93, 113–125. [Google Scholar] [CrossRef]
  5. Lemaire, G.; Gastal, F. Quantifying Crop Responses to Nitrogen Deficiency and Avenues to Improve Nitrogen Use Efficiency. In Crop. Physiology: Applications for Genetic Improvement and Agronomy; Sadras, V.O., Calderini, D.F., Eds.; Academic Press: San Diego, CA, USA, 2009; pp. 171–211. [Google Scholar]
  6. Ravier, C.; Jeuffroy, M.H.; Gate, P.; Cohan, J.P.; Meynard, J.M. Combining user involvement with innovative design to develop a radical new method for managing N fertilization. Nutr. Cycl. Agroecosyst. 2018, 110, 117. [Google Scholar] [CrossRef]
  7. Denuit, J.P.; Olivier, M.; Goffaux, M.J.; Herman, J.L.; Goffart, J.P.; Destain, J.P.; Frankinet, M. Management of nitrogen fertilization of winter wheat and potato crops using the chlorophyll meter for crop nitrogen status assessment. Agronomie 2002, 22, 847–854. [Google Scholar] [CrossRef] [Green Version]
  8. López-Bellido, R.J.; Shepherd, C.E.; Barraclough, P.B. Pedicting post-anthesis N requeriments of bread wheat with Minolta SPAD meter. Eur. J. Agron. 2004, 20, 313–320. [Google Scholar] [CrossRef]
  9. Arregui, L.M.; Lasa, B.; Lafarga, A.; Irañeta, I.; Baroja, E.; Quemada, M. Evaluation of chlorophyll meters as tools for N fertilization in winter wheat under humid Mediterranean conditions. Eur. J. Agron. 2006, 24, 140–148. [Google Scholar] [CrossRef]
  10. Aranguren, M.; Castellon, A.; Aizpurua, A. Topdressing nitrogen recommendation in wheat after applying organic manures: The use of field diagnostic tools. Nutr. Cycl. Agroecosys. 2018, 110, 89–103. [Google Scholar] [CrossRef]
  11. Aranguren, M.; Castellón, A.; Aizpurua, A. Crop Sensor-Based In-Season Nitrogen Management of Wheat with Manure Application. Remote Sens. 2019, 11, 1094. [Google Scholar] [CrossRef] [Green Version]
  12. Ortuzar-Iragorri, M.A.; Aizpurua, A.; Castellón, A.; Alonso, A.; Estavillo, J.M.; Besga, G. Use of an N-tester chlorophyll meter to tune a late third nitrogen application to wheat under humid Mediterranean conditions. J. Plant. Nutr. 2017, 41, 627–635. [Google Scholar] [CrossRef]
  13. Debaeke, P.; Rouet, P.; Justes, E. Relationship between normalized SPAD index and the nitrogen nutrition index: Application to durum wheat. J. Plant. Nutr. 2006, 29, 275–286. [Google Scholar] [CrossRef]
  14. Ravier, C.; Quemada, M.; Jeuffroy, M.H. Use of a chlorophyll meter to assess nitrogen nutrition index during the growth cycle in winter wheat. Fields Crops Res. 2017, 214, 73–82. [Google Scholar] [CrossRef]
  15. Ortuzar-Iragorri, M.A.; Alonso, A.; Castellón, A.; Besga, G.; Estavillo, J.M.; Aizpurua, A. N-tester use in soft winter wheat: Evaluation of nitrogen status and grain yield prediction. Agron. J. 2005, 97, 1380–1389. [Google Scholar] [CrossRef]
  16. Knipling, E.B. Physical and physiological basis for the reflectance of visible and near-infrared radiation from vegetation. Remote Sens. of Environ. 1970, 1, 155–159. [Google Scholar] [CrossRef]
  17. Padilla, F.M.; de Souza, R.; Peña-Fleitas, M.T.; Grasso, R.; Gallardo, M.; Thompson, R.B. Influence of time of day on measurement with chlorophyll meters and canopy reflectance sensors of different crop N status. Precision Agric. 2019, 20, 1087–1106. [Google Scholar] [CrossRef] [Green Version]
  18. Mistele, B.; Schmidhalter, U. Estimating the nitrogen nutrition index using spectral canopy reflectance measurements. Eur. J. Agron. 2008, 29, 184–190. [Google Scholar] [CrossRef]
  19. Marti, J.; Bort, J.; Slafer, G.A.; Araus, J.L. Can wheat yield be assessed by early measurements of Normalized Difference Vegetation Index? Ann. Appl. Biol. 2007, 150, 253–257. [Google Scholar] [CrossRef]
  20. Lu, J.; Miao, Y.; Shi, W.; Li, J.; Yuan, F. Evaluating different approaches to non-destructive nitrogen status diagnosis of rice using portable RapidSCAN active canopy sensor. Sci. Rep. 2017, 7, 14073. [Google Scholar] [CrossRef]
  21. Bonfil, D.J. Monitoring Wheat Fields by RapidScan: Accuracy and Limitations. In Proceedings of the Conference on Precision Agriculture 2017, John McIntyre Centre, Edinburgh, UK, 16–20 July 2017. [Google Scholar]
  22. Cao, Q.; Miao, Y.; Wang, H.; Huang, S.; Cheng, S.; Khosla, R.; Jiang, R. Non-destructive estimation of rice plant nitrogen status with CropCircle multispectral active canopy sensor. Fields Crops Res 2013, 154, 133–144. [Google Scholar] [CrossRef]
  23. Magney, T.S.; Vierling, L.A.; Eitel, J.U.H.; Huggins, D.R.; Garrity, S.R. Response of high frequency Photochemical Reflectance Index (PRI) measurements to environmental conditions in wheat. Remote Sens. Environ. 2016, 173, 84–97. [Google Scholar] [CrossRef]
  24. Zhang, K.; Ge, X.; Shen, P.; Li, W.; Liu, X.; Cao, Q.; Zhu, Y.; Cao, W.; Tian, Y. Predicting rice grain yield based on dynamic changes in vegetation indexes during early to mid-growth stages. Remote Sens. 2019, 11, 387. [Google Scholar] [CrossRef] [Green Version]
  25. Bijay-Singh, S.R.K.; Jaspreet-Kaur, J.M.L.; Martin, K.L.; Yadvinder-Singh, V.S.; Chandna, P.; Choudhary, O.P.; Gupta, R.K.; Thind, H.S.; Jagmohan-Singh, U.H.S.; Khurana, H.S.; et al. Assessment of the nitrogen management strategy using an optical sensor for irrigated wheat. Agron. Sustain. Dev. 2011, 31, 589–603. [Google Scholar] [CrossRef] [Green Version]
  26. Zadoks, J.C.; Chang, T.T.; Konzak, C.F. A decimal code for growth stages of cereals. Weed Res. 1974, 4, 415–421. [Google Scholar] [CrossRef]
  27. Climates of the World and Their Agricultural Potentialities; J. Papadakis: Buenos Aires, Argentina, 1966.
  28. Gee, G.W.; Bauder, J.W. Particle-Size Analysis. In Methods of Soil Analysis: Part 1. Physical and Mineralogical Methods; Klute, A., Ed.; SSSA: Madison, AL, USA, 1986; pp. 383–411. [Google Scholar]
  29. Soil Survey Staff. Soil Taxonomy: A Basic System of Soil Classification for Making and Interpreting Soil Surveys, 2nd ed.; Natural Resources Conservation Service; U.S. Department of Agriculture Handbook 436: Washington, DC, USA, 1999.
  30. MAPA. Métodos Oficiales de Análisis. Tomo III; Ministerio de Agricultura; Pesca y Alimentación: Madrid, Spain, 1994.
  31. Walkey, A.; Black, I.A. An examination of Degtjareff method for determining soil organic matter and a proposed modification of the chromic and titration method. Soil Sci. 1934, 37, 29–37. [Google Scholar] [CrossRef]
  32. Soil Survey Staff. Illustrated Guide to Soil Taxonomy; U.S. Department of Agriculture, Natural Resources Conservation Service, National Soil Survey Center: Lincoln, Nebraska, 2015.
  33. AOAC, Association of Official Analytical Chemists International. Plants, 24, 127. In Official Methods of AOAC International, 16th ed.; Patricia, C., Ed.; AOAC International: Gaithersburg, MD, USA, 1999. [Google Scholar]
  34. Teller, G.L. Non-protein nitrogen compounds in cereals and their relation to the nitrogen factor for protein in cereals and bread. Cereal Chem. 1932, 9, 261–274. [Google Scholar]
  35. Justes, E.; Mary, B.; Meynard, J.M.; Machet, J.M.; Thelier-Huché, L. Determination of a critical nitrogen dilution curve for winter wheat crops. Ann. Bot. 1994, 74, 397–407. [Google Scholar] [CrossRef]
  36. Wang, G.; Bronson, K.F.; Thorp, K.R.; Mon, J.; Badaruddin, M. Multiple leaf measurements improve effectiveness of chlorophyll meter for durum wheat nitrogen management. Crop. Sci. 2014, 54, 817. [Google Scholar] [CrossRef]
  37. R Core Team. R: A Language and Environment for Statistical Computing; R Foundation for Statistical Computing: Vienna, Austria, 2013. [Google Scholar]
  38. Akaike, H. Information Theory and an Extension of the Maximum Likelihood Principle. In Proceedings of the Second International Symposium on Information Theory, Tsahkadsor, Armenia, September 2–8, 1971; Petrov, B.N., Csaki, F., Eds.; Akademiai Kiado: Budapest, Hungary, 1973; pp. 267–281. [Google Scholar]
  39. Burnham, K.P.; Anderson, D.R. Model Selection and Inference: A Practical Information-Theoretic Approach, 2nd ed.; Springer: New York, NY, USA, 2002. [Google Scholar] [CrossRef] [Green Version]
  40. Tucker, C.J. Red and photographic infrared linear combinations monitoring vegetation. J. Remote Sens. Environ. 1979, 8, 127–150. [Google Scholar] [CrossRef] [Green Version]
  41. Cao, Q.; Miao, Y.; Feng, G.; Gao, X.; Li, F.; Liu, B.; Yue, S.; Cheng, S.; Ustin, L.U.; Khosla, R. Active canopy sensing of winter wheat nitrogen status: An evaluation of two sensor systems. Comput. Electron. Agric. 2015, 112, 54–67. [Google Scholar] [CrossRef]
  42. Xue, L.; Li, G.; Qin, X.; Yang, L.; Zhang, L. Topdressing nitrogen recommendation for early rice with an active sensor in south China. Precision Agric. 2014, 15, 95–110. [Google Scholar] [CrossRef]
  43. Craigie, R.; Yule, I.; McVeagh, P. Crop sensing for nitrogen management; Foundation for Arable Research: Christchurch, New Zealand, 2013. [Google Scholar]
  44. Sembiring, H.; Lees, H.L.; Raun, W.R.; Johnson, G.V.; Solie, J.B.; Stone, M.L.; DeLeon, M.J.; Lukina, E.V.; Cossey, D.A.; LaRuffa, J.M.; et al. Effect of growth stage and variety on spectral radiance in winter wheat. J. Plant. Nutr. 2000, 23, 141–149. [Google Scholar] [CrossRef]
  45. Cao, Q.; Miao, Y.; Gao, X.; Liu, B.; Feng, G.; Yue, S. Estimating the Nitrogen Nutrition Index of Winter Wheat Using an Active Canopy Sensor in the NorthChina Plain. In Proceedings of the 1st International Conference Agro-Geoinformatics, Agro-Geoinformatics 2012, Shanghai, China, 2–4 August 2012; IEEE Computer Society: Shanghai, China, 2012; pp. 178–182. [Google Scholar]
  46. Cao, Q.; Miao, Y.; Shen, J.; Yuan, F.; Cheng, S.; Cui, Z. Evaluating Two Crop Circle Active Canopy Sensors for In-Season Diagnosis of Winter Wheat Nitrogen Status. Agronomy 2018, 8, 201. [Google Scholar] [CrossRef] [Green Version]
  47. Erdle, K.; Mistele, B.; Schmidhalter, U. Comparison of active and passive spectral sensors in discriminating biomass parameters and nitrogen status in wheat cultivars. Field Crops Res. 2011, 124, 74–84. [Google Scholar] [CrossRef]
  48. Gnyp, M.L.; Miao, Y.; Yuan, F.; Ustin, S.L.; Yu, K.; Yao, Y.; Huang, S.; Bareth, G. Hyperspectral canopy sensing of paddy rice aboveground biomass at different growth stages. Field Crops Res. 2014, 155, 42–55. [Google Scholar] [CrossRef]
  49. Moriondo, M.; Maselli, F.; Bindi, M. A simple model of regional wheat yield based on NDVI data. Eur. J. Agron. 2007, 26, 266–274. [Google Scholar] [CrossRef]
  50. Sharma, L.K.; Bu, H.; Denton, A.; Franzen, W.F. Active-Optical Sensors Using Red NDVI Compared to Red Edge NDVI for Prediction of Corn Grain Yield in North Dakota, U.S.A. Sensors 2015, 15, 27832–27853. [Google Scholar] [CrossRef]
  51. Royo, C.; Aparicio, N.; Villegas, D.; Casadesus, J.; Monneveux, P.; Araus, J.L. Usefulness of spectral reflectance indices as durum wheat yield predictors under contrasting Mediterranean conditions. Int. J. Remote Sens. 2003, 24, 4403–4419. [Google Scholar] [CrossRef]
  52. Masclaux-Daubresse, C.; Daniel-Vedele, F.; Dechorgnat, J.; Chardon, F.; Gaufichon, L.; Suzuki, A. Nitrogen uptake, assimilation and remobilization in plants: Challenges for sustainable and productive agriculture. Ann. Bot. 2010, 105, 1141–1157. [Google Scholar] [CrossRef] [Green Version]
  53. Dupont, F.M.; Altenbach, S.B. Molecular and biochemical impacts of environmental factors on wheat grain development and protein synthesis. J. Cereal Sci. 2003, 38, 133–146. [Google Scholar] [CrossRef]
  54. Montemurro, M.; Convertini, G.; Ferri, D. Nitrogen Application in Winter Wheat Grown in Mediterranean Conditions: Effects on Nitrogen Uptake, Utilization Efficiency, and Soil Nitrogen Deficit. J. Plant. Nutr. 2007, 30, 1681–1703. [Google Scholar] [CrossRef]
  55. Colaço, A.F.; Bramley, R.G.V. Do crop sensors promote improved nitrogen management in grain crops? Field Crops Res. 2018, 218, 126–140. [Google Scholar]
Figure 1. Location of the three field experiments in Arkaute, Araba, Basque Country, northern Spain. The field experiment in 2015 was carried out in the red field. The field experiment in 2016 was carried out in the blue field. The field experiment in 2017 was carried out in the green field.
Agriculture 10 00148 g001
Figure 2. Relationship between the NNI (Nitrogen Nutritional Index) and abs_NDVI values at GS30 (a), GS37 (b), and GS65 (c) and between the NNI and nor_NDVI values at GS30 (d), GS37 (e), and GS65 (f). Two models were fitted: linear, solid line; exponential, dashed line. **, *** Significant at 0.01 and 0.001 probability levels, respectively. +, 0N; ×, 40N + 0N; ×, 40N + 40N; ×, 40N + 80N; ×, 40N + 120N; ×, 40N + 160N; o, DS + 0N; o, SM + 0N. abs, absolute values; nor, normalized values; NDVI, Normalized Difference Vegetation Index.
Agriculture 10 00148 g002
Figure 3. Relationship between the NNI (Nitrogen Nutritional Index) and abs_NDRE values at GS30 (a) and GS37 (b) and between the NNI and nor_NDRE values at GS30 (c), GS37 (d), and GS65 (e). Two models were fitted: linear, solid line; exponential, dashed line. **, *** Significant at 0.01 and 0.001 probability levels, respectively. +, 0N; ×, 40N + 0N; ×, 40N + 40N; ×, 40N + 80N; ×, 40N + 120N; ×, 40N + 160N; o, DS + 0N; o, SM + 0N. abs, absolute values; nor, normalized values; NDRE, Normalized Difference Red Edge Index.
Agriculture 10 00148 g003
Figure 4. Relationship between the abs_NDVI (a) and abs_NDRE (b) values for all growing stages measurements together and the NNI (Nitrogen Nutritional Index) and the nor_NDVI (c) and nor_NDRE (d) values for all growing stage measurements together and the NNI. Two models were fitted: linear, solid line; exponential, dashed line. *, **, *** Significant at 0.05, 0.01 and 0.001 probability levels, respectively. +, 0N; ×, 40N + 0N; ×, 40N + 40N; ×, 40N + 80N; ×, 40N + 120N; ×, 40N + 160N; o, DS + 0N; o, SM + 0N. abs, absolute values; nor, normalized values; NDVI, Normalized Difference Vegetation Index; NDRE, Normalized Difference Red Edge Index.
Agriculture 10 00148 g004
Figure 5. Relationship between the abs_NDVI and abs_NDRE values from the three growing seasons. abs, absolute values; nor, normalized values; NDVI, Normalized Difference Vegetation Index; NDRE, Normalized Difference Red Edge Index. **, significant at 0.01 probability level.
Agriculture 10 00148 g005
Figure 6. Relationship between the yield (kg ha−1) and abs_NDVI values at GS65 (a), nor_NDVI at GS37 (b), nor_NDRE at GS37 (c), abs_N-Tester at GS37 (d), and nor_N-Tester at GS65 (e). Two models were fitted: linear, solid line; exponential, dashed line. *, *** Significant at 0.05 and 0.001 probability levels, respectively. Initial fertilizers: ×, conventional; o, dairy slurry; ◊, sheep manure. N rate at GS30: red, +0N; blue, +40N; green, +80N; purple, +120N; orange, +160N. abs, absolute values; nor, normalized values; NDVI, Normalized Difference Vegetation Index; NDRE, Normalized Difference Red Edge Index.
Agriculture 10 00148 g006
Figure 7. Relationships between the predicted NNI (Nitrogen Nutritional Index) values (from abs_NDVI at GS30 (a), nor_NDVI at GS30 (b), abs_NDVI at GS37(c), nor_NDVI at GS37 (d), abs_NDVI at GS65 (e) and nor_NDVI at GS65 (f) values in the growing stage-specific models) and the measured NNI values from 25% of the samples. **, *** Significant at 0.01 and 0.001 probability levels, respectively. abs, absolute values; nor, normalized values; NDVI, Normalized Difference Vegetation Index.
Agriculture 10 00148 g007
Figure 8. Relationships between the predicted NNI (Nitrogen Nutritional Index) values (from abs_NDRE at GS30 (a), nor_NDRE at GS30 (b), abs_NDRE at GS37(c), nor_NDRE at GS37 (d), and nor_NDRE at GS65 (e) values in the growing stage-specific models) and the measured NNI values from 25% of the samples. *, ** Significant at 0.05 and 0.01 probability levels, respectively. abs, absolute values; nor, normalized values; NDRE, Normalized Difference Red Edge Index.
Agriculture 10 00148 g008
Figure 9. Relationships between the predicted NNI (Nitrogen Nutritional Index) values (from abs_NDVI (a) and nor_NDVI (b) and abs_NDRE (c) and nor_NDRE (d) values in the general models) and the measured NNI values from 25% of the samples. **,*** Significant at 0.01 and 0.001 probability levels, respectively. abs, absolute values; nor, normalized values; NDVI, Normalized Difference Vegetation Index; NDRE, Normalized Difference Red Edge Index.
Agriculture 10 00148 g009
Figure 10. Relationships between the predicted yield values (from abs_NDVI at GS65 (a), nor_NDVI at GS37 (b), nor_NDRE at GS37 (c) abs_N-Tester at GS37 (d) and nor_N-Tester (e)) and the measured yield values from 25% of the samples. *,*** Significant at 0.05 and 0.001 probability levels, respectively. abs, absolute values; nor, normalized values; NDVI, Normalized Difference Vegetation Index; NDRE, Normalized Difference Red Edge Index.
Agriculture 10 00148 g010
Table 1. Fertilization treatments for the field trials (2015, 2016, and 2017) and the N dose applied in each of them. Beginning of tillering (GS21; end of winter [26]) and stem elongation (GS30; [26]).
Initial Fertilization2015-2016-2017Treatment Identification
Topdressing at GS21 (kg N ha−1)Topdressing at GS30 (kg N ha−1)
Conventional
(--)
40040N + 0N
4040N + 40N
8040N + 80N
12040N + 120N
16040N + 160N
Dairy Slurry (DS)
(40 t ha−1)
--0DS + 0N
40DS + 40N
80DS + 80N
120DS + 120N
160DS + 160N
Sheep manure (SM)
(40 t ha−1)
--0SM + 0N
40SM + 40N
80SM + 80N
120SM + 120N
160SM + 160N
Control (--)----0N
Overfertilized (--)80200280N
(--), no initial fertilization.

