Genetic Diversity Patterns and Discrimination of 172 Korean Soybean (Glycine max (L.) Merrill) Varieties Based on SSR Analysis


Abstract
:1. Introduction
2. Materials and Methods
2.1. Plant Material
2.2. DNA Extraction and SSR Analysis
2.3. Selection of SSR Markers for Discrimination of the Varieties
2.4. Data Analysis
3. Results
3.1. Genetic Diversity and Polymorphism of SSR Loci
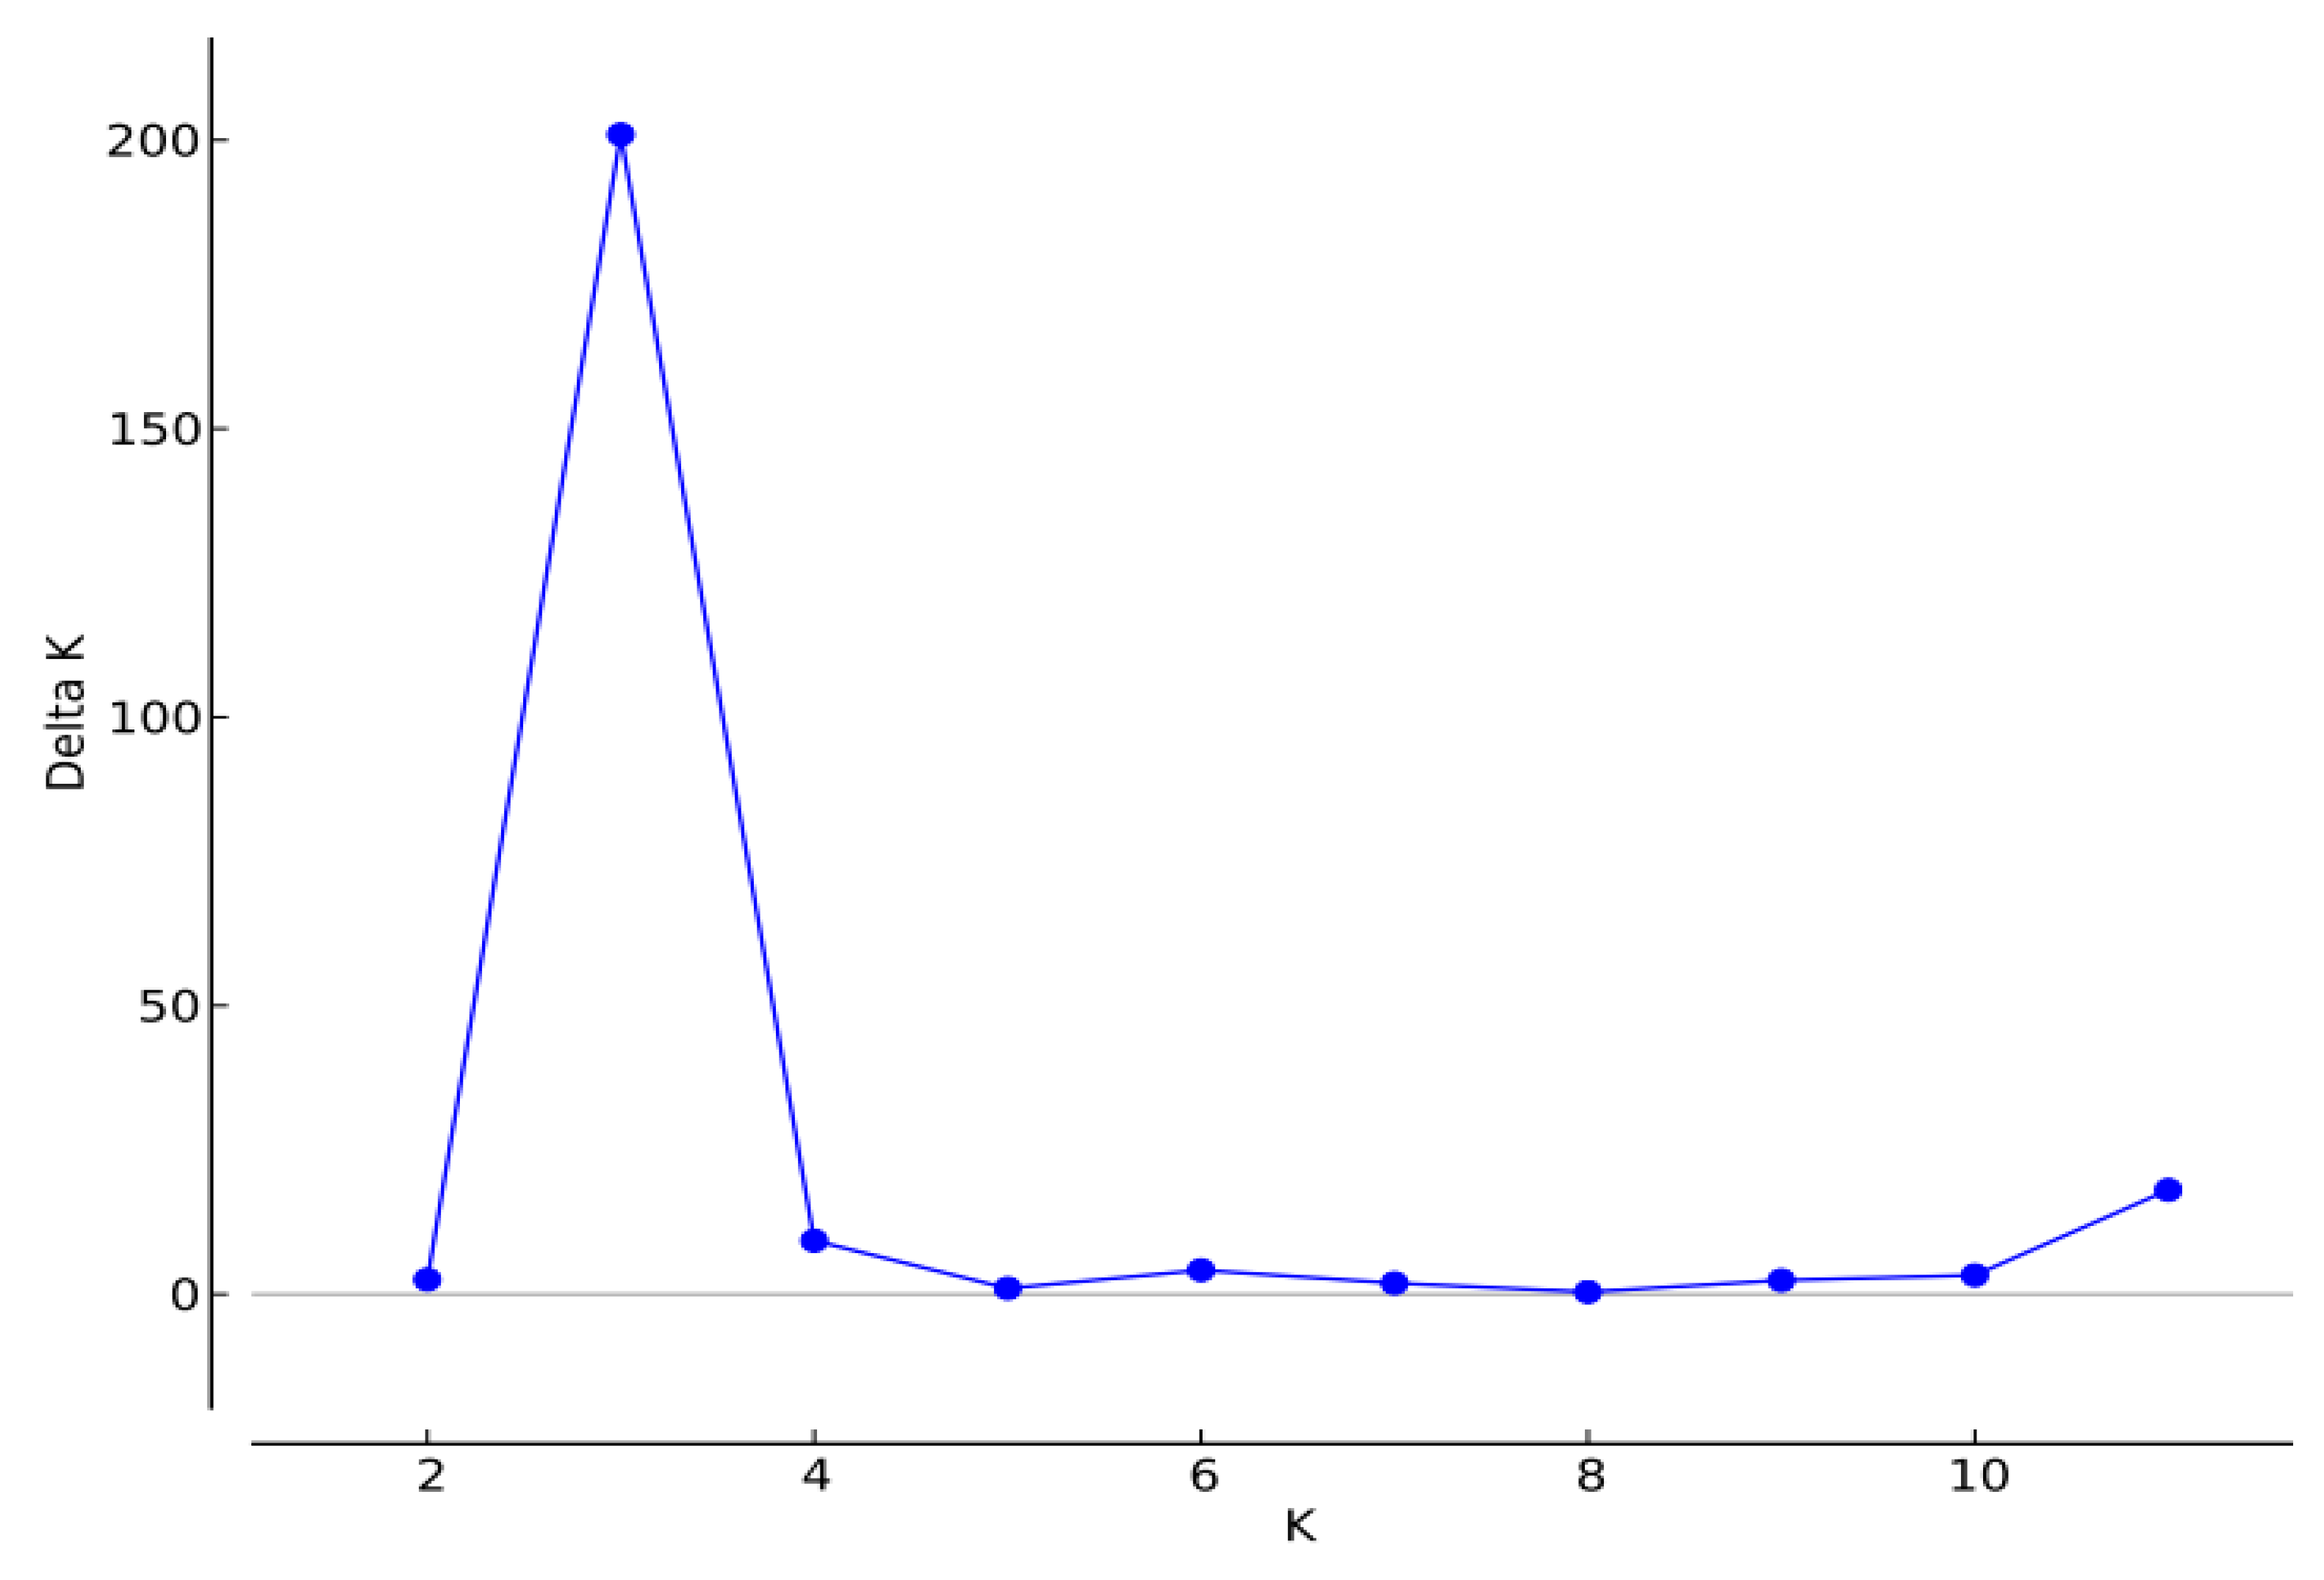
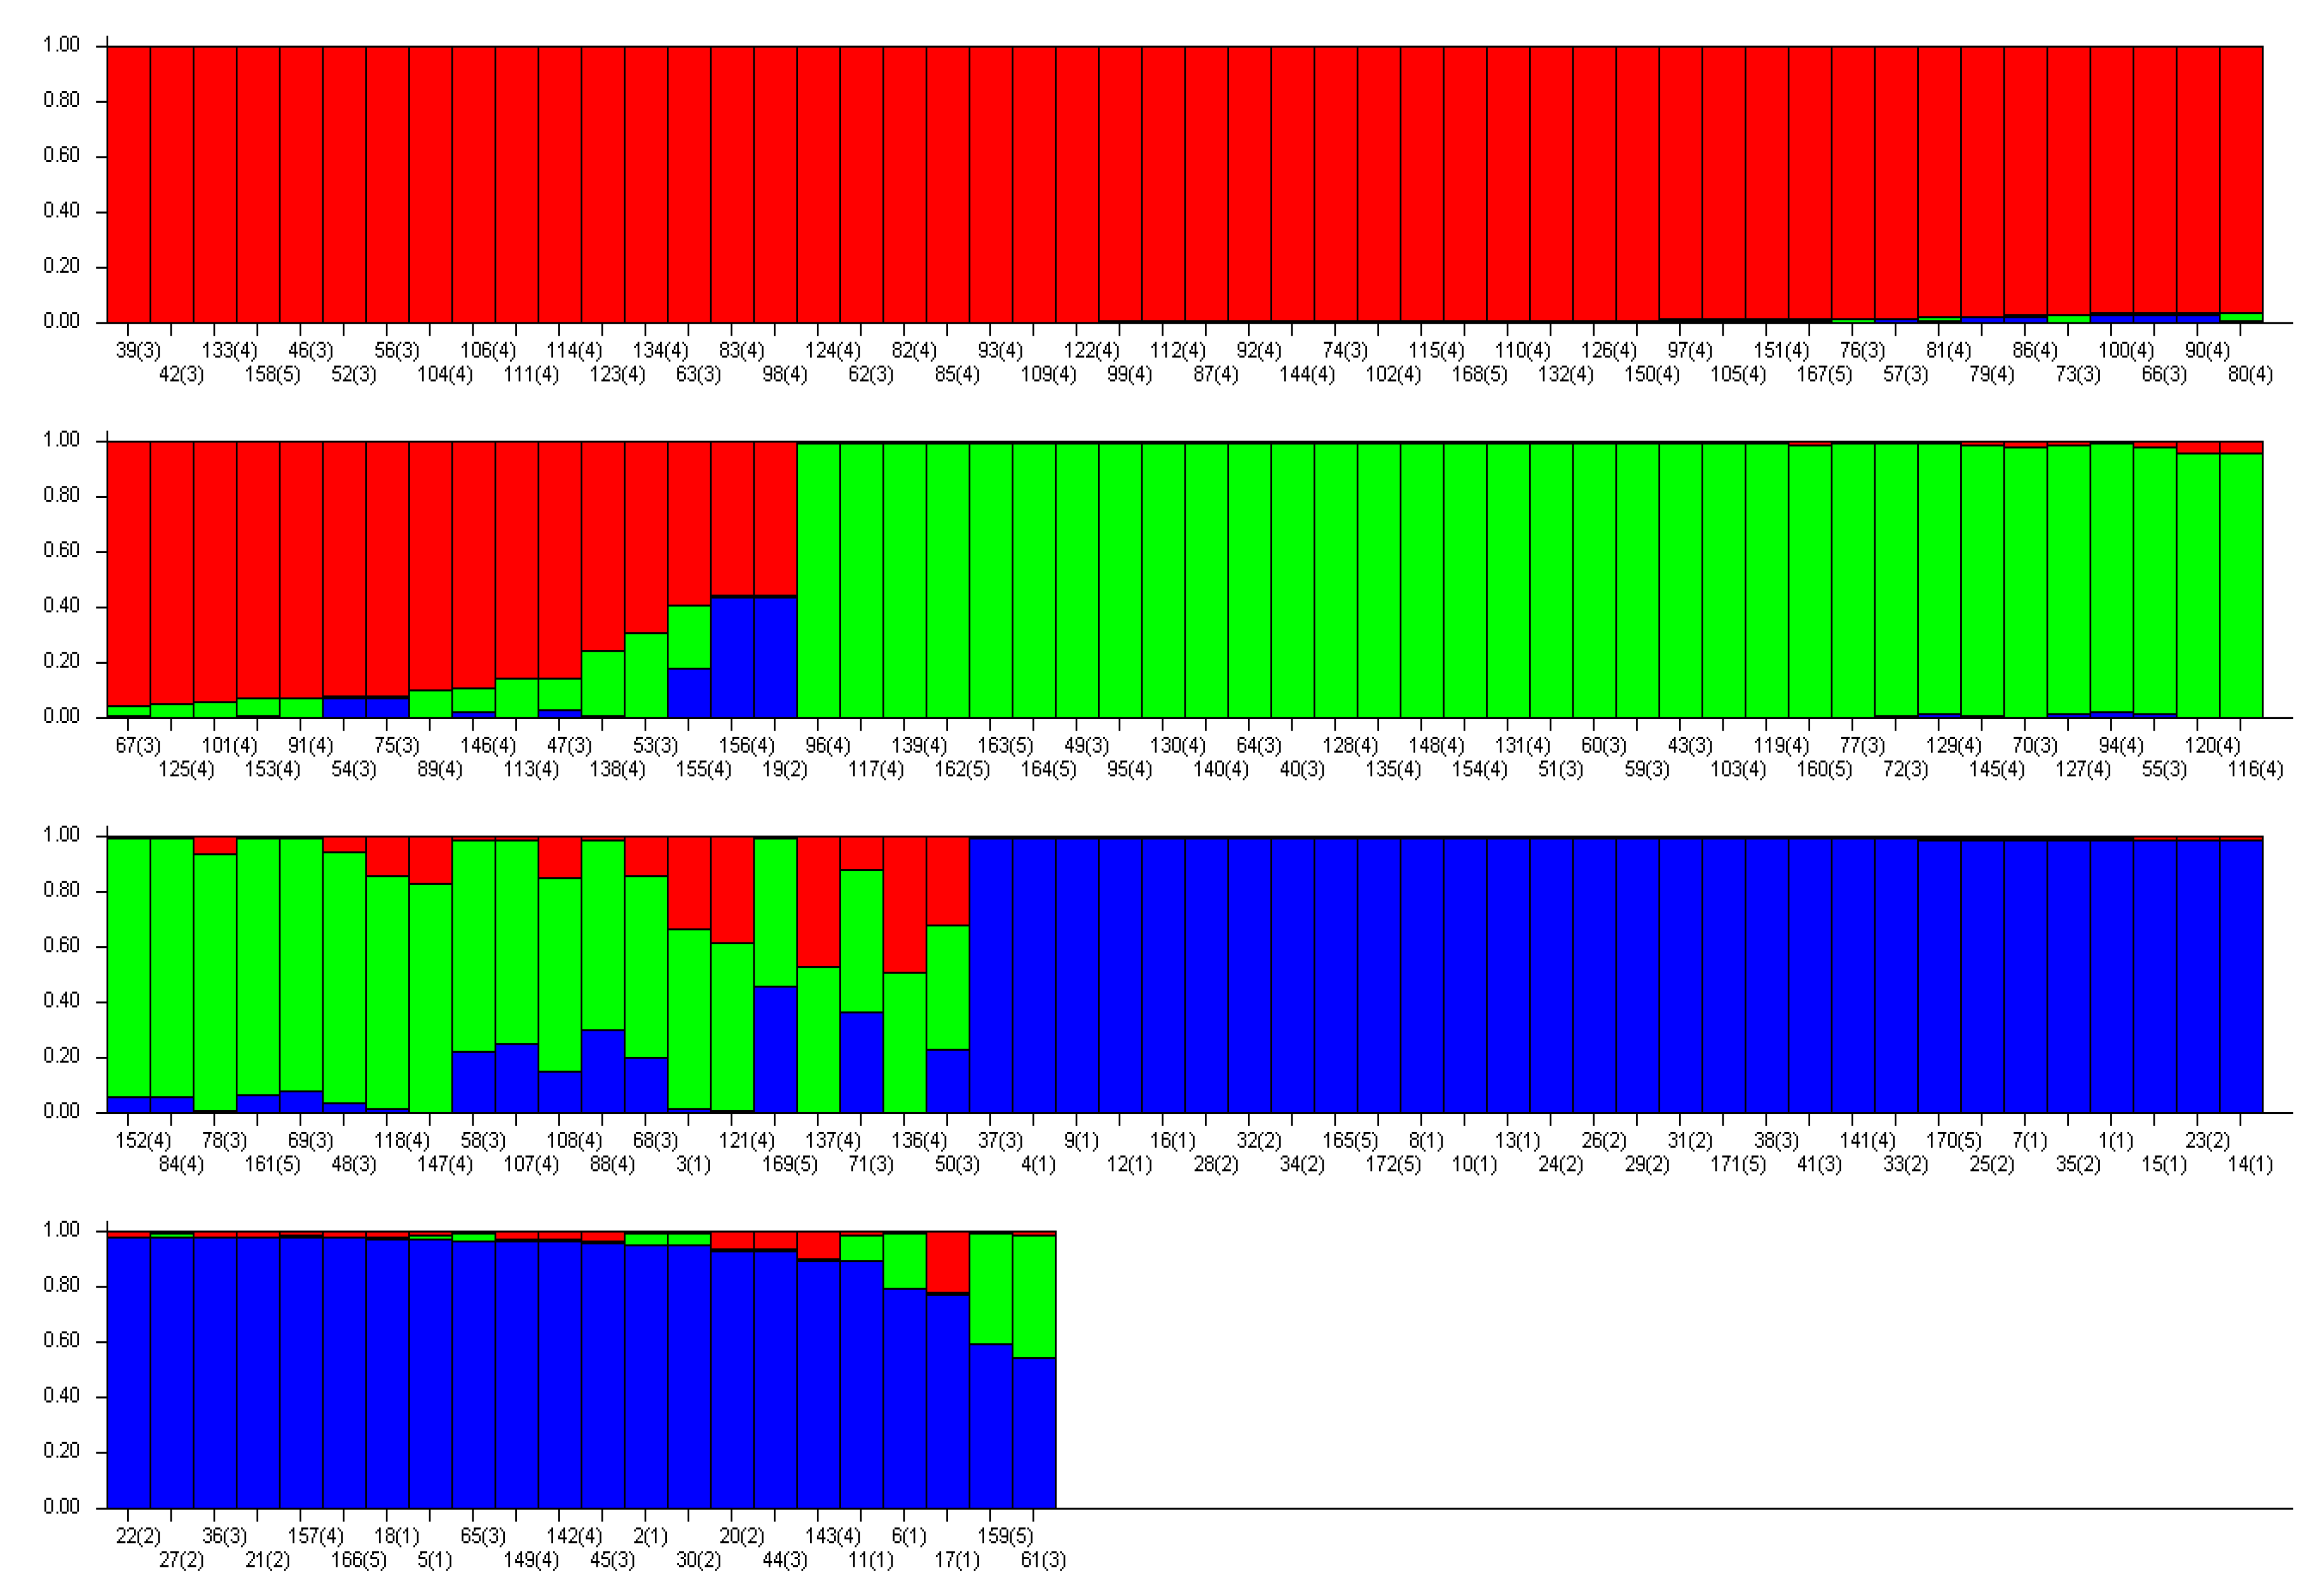
3.2. Polymorphism of SSR Loci by Time Period of Release Years and Population Structure
3.3. Discrimination of Soybean Varieties
4. Discussion
5. Conclusions
Supplementary Materials
Author Contributions
Funding
Acknowledgments
Conflicts of Interest
References
- Lee, G.A.; Choi, Y.M.; Chung, J.W.; Lee, M.C.; Ma, K.H.; Lee, S.; Cho, J.W.; Lee, J.R. Genetic Diversity and Population Structure of Korean Soybean Collection Using 75 Microsatellite Markers. Korean J. Crop Sci. 2014, 59, 492–497. [Google Scholar] [CrossRef]
- Choi, Y.M.; Lee, M.C.; Ro, N.Y.; Lee, S.G.; Gwag, J.G.; Yoon, M.S. Morphological Characteristics and SSR Profiling of Soybean Landraces of Korea. Korean J. Breed. Sci. 2014, 46, 353–363. [Google Scholar] [CrossRef] [Green Version]
- Qiu, L.J.; Xing, L.L.; Guo, Y.; Wang, J.; Jackson, S.A.; Chang, R.Z. A Platform for Soybean Molecular Breeding: The Utilization of Core Collections for Food Security. Plant Mol. Biol. 2013, 83, 41–50. [Google Scholar] [CrossRef] [PubMed] [Green Version]
- Tantasawat, P.; Trongchuen, J.; Prajongjai, T.; Jenweerawat, S.; Chaowiset, W. SSR Analysis of Soybean (Glycine max (L.) Merr.) Genetic Relationship and Variety Identification in Thailand. Aust. J. Crop Sci. 2011, 5, 283–290. [Google Scholar]
- Li, Z.; Nelson, R.L. Genetic Diversity among Soybean Accessions from Three Countries Measured by RAPDs. Crop Sci. 2001, 41, 1337–1347. [Google Scholar] [CrossRef] [Green Version]
- Bang, K.H.; Jo, I.H.; Chung, J.W.; Kim, Y.C.; Lee, J.W.; Seo, A.Y.; Park, J.H.; Kim, O.T.; Hyun, D.Y.; Kim, D.H.; et al. Analysis of Genetic Polymorphism of Korean Ginseng Cultivars and Foreign Accessions Using SSR Markers. Korean J. Med. Crop Sci. 2011, 19, 347–353. [Google Scholar] [CrossRef] [Green Version]
- Zhou, Z.; Jiang, Y.; Wang, Z.; Gou, Z.; Lyu, J.; Li, W.; Yu, Y.; Fang, C. Resequencing 302 Wild and Cultivated Accessions Identifies Genes Related to Domestication and Improvement in Soybean. Nat. Biotechnol. 2015, 33, 408–414. [Google Scholar] [CrossRef] [Green Version]
- Jang, S.J.; Park, S.J.; Park, K.H.; Song, H.L.; Cho, Y.G.; Jong, S.K.; Kang, J.H.; Kim, H.S. Genetic Diversity and Identification of Korean Soybean Cultivars Including Certified Cultivars Based on SSR Markers. Korean J. Crop Sci. 2009, 54, 231–240. [Google Scholar]
- Hwang, T.Y.; Nakamoto, Y.; Kono, I.; Enoki, H.; Funatsuki, H.; Kitamura, K.; Ishimoto, M. Genetic Diversity of Cultivated and Wild Soybeans Including Japanese Elite Cultivars as Revealed by Length Polymorphism of SSR Markers. Breed. Sci. 2008, 58, 315–323. [Google Scholar] [CrossRef] [Green Version]
- Jong, S.K.; Kim, S.H.; Woo, S.H.; Kim, H.S. Comparison of Pedigree-and DNA-Based Genetic Similarity among Korean Soybean Cultivars. Korean J. Breed. Sci. 2006, 38, 19–25. [Google Scholar]
- Wang, L.; Guan, R.; Liu, Z.; Chang, R.; Qiu, L. Genetic Diversity of Chinese Cultivated Soybean Revealed by SSR Markers. Crop Sci. 2006, 46, 1032–1038. [Google Scholar] [CrossRef]
- Ghosh, J.P.; Ghosh, D.; Choudhury, P.R. An Assessment of Genetic Relatedness Between Soybean [Glycine max (L.)/Merrill] Cultivars Using SSR Markers. Am. J. Plant Sci. 2014, 5, 3089–3096. [Google Scholar] [CrossRef] [Green Version]
- Weising, K.; Winter, P.; Hüttel, B.; Kahl, G. Microsatellites Marker for Molecular Breeding. J. Crop Prod. 1998, 1, 113–143. [Google Scholar] [CrossRef]
- Keim, P.; Olson, T.C.; Shoemaker, R.C. A Rapid Protocol for Isolating Soybean DNA. Genet. Newsl. 1988, 15, 150–152. [Google Scholar]
- Jang, S.J.; Park, S.J.; Piao, X.M.; Song, H.L.; Hwang, T.Y.; Cho, Y.G.; Liu, X.H.; Woo, S.H.; Kang, J.H.; Kim, H.S. Genetic Diversity and Relationships of Korean, Japanese, and Chinese Jilin Provincial Wild Soybeans (Glycine soja Sieb. and Zucc.) Based on SSR Markers. Korean J. Breed. Sci. 2010, 42, 87–99. [Google Scholar]
- Panaud, O.; Chen, X.; McCouch, S.R. Development of Microsatellite Markers and Characterization of Simple Sequence Length Polymorphism (SSLP) in Rice (Oryza sativa L.). Mol. Gen. Genet. 1996, 252, 597–607. [Google Scholar] [CrossRef]
- Liu, K.; Muse, S.V. PowerMarker: An Integrated Analysis Environment for Genetic Marker Analysis. Bioinformatics 2005, 21, 2128–2129. [Google Scholar] [CrossRef] [Green Version]
- Nei, M. Analysis of Gene Diversity in Subdivided Populations. Proc. Natl. Acad. Sci. USA 1973, 70, 3321–3323. [Google Scholar] [CrossRef] [Green Version]
- Pritchard, J.K.; Stephens, M.; Donnelly, P. Inference of Population Structure Using Multilocus Genotype Data. Genetics 2000, 155, 945–959. [Google Scholar]
- Falush, D.; Stephens, M.; Pritchard, K. Inference of Population Structure Using Multilocus Genotype Data: Linked Loci and Correlated Allele Frequencies. Genetics 2003, 164, 167–187. [Google Scholar]
- Evanno, G.; Regnaut, S.; Goudet, J. Detecting the Number of Clusters of Individuals Using the Software STRUCTURE: A Simulation Study. Mol. Ecol. 2005, 14, 2611–2620. [Google Scholar] [CrossRef] [PubMed] [Green Version]
- Song, J.Y.; Piao, X.M.; Choi, Y.M.; Lee, G.A.; Chung, J.W.; Lee, J.R.; Jung, Y.J.; Park, H.J.; Lee, M.C. Evaluation of Genetic Diversity and Comparison of Biochemical Traits of Soybean (Glycine max L.) Germplasm Collections. Plant Breed. Biotechnol. 2013, 1, 374–384. [Google Scholar] [CrossRef] [Green Version]
- Kuroda, Y.; Tomooka, N.; Kaga, A.; Wanigadeva, S.M.S.W.; Vaughan, D.A. Genetic Diversity of Wild Soybean (Glycine soja Sieb. et Zucc.) and Japanese Cultivated Soybeans [G. max (L.) Merr.] Based on Microsatellite (SSR) Analysis and the Selection of a Core Collection. Gene. Resour. Crop Evol. 2009, 56, 1045–1055. [Google Scholar] [CrossRef]
- Wang, M.; Li, R.Z.; Yang, W.M.; Du, W.J. Assessing the Genetic Diversity of Cultivars and Wild Soybeans Using SSR Markers. Afr. J. Biotechnol. 2010, 9, 4857–4866. [Google Scholar]
- Kim, S.H.; Chung, J.W.; Moon, J.K.; Woo, S.H.; Cho, Y.G.; Jong, S.K.; Kim, H.S. Discrimination of Korean Soybean Cultivars by SSR Markers. Korean J. Crop Sci. 2006, 51, 1–11. [Google Scholar]
- Hwang, T.Y.; Seo, M.J.; Lee, S.K.; Park, H.M.; Jeong, K.H.; Lee, Y.Y.; Kim, S.L.; Yun, H.T.; Lee, J.E.; Kim, D.W.; et al. Discrimination of 110 Korean Soybean Cultivars by Sequence Tagged Sites (STS)-CAPS Markers. Korean J. Breed. Sci. 2012, 44, 258–272. [Google Scholar]
- Gao, Y.L.; Zhu, R.S.; Liu, C.Y.; Li, W.F.; Jiang, H.W.; Li, C.D.; Yao, B.C.; Hu, G.H.; Chen, Q.S. Constructing Molecular Identity for Soybean Varieties from Heilongjiang Province, China. Acta Agron. Sin. 2009, 35, 211–218. [Google Scholar] [CrossRef]
- Lee, G.Y.; So, Y.S.; Kim, H.S.; Hong, J.H.; Jang, E.K.; Lee, K.H.; Yun, G.S.; Hwang, S.G. Variation of Growth and Yield Component Character and Varietal Classification by Multivariate Analysis in Korean Soybean Varieties. Korean J. Int. Agric. 2015, 27, 348–357. [Google Scholar] [CrossRef]
- Lee, C.; Choi, M.S.; Kim, H.T.; Yun, H.T.; Lee, B.; Chung, Y.S.; Kim, R.W.; Choi, H.K. Soybean [Glycine max (L.) Merrill]: Importance as A Crop and Pedigree Reconstruction of Korean Varieties. Plant Breed. Biotech. 2015, 3, 179–196. [Google Scholar] [CrossRef] [Green Version]
- Schmutz, J.; Cannon, S.B.; Schlueter, J.; Ma, J.; Mitros, T.; Nelson, W.; Hyten, D.L.; Song, Q.; Thelen, J.J.; Cheng, J.; et al. Genome sequence of the palaeopolyploid soybean. Nature 2010, 463, 178–183. [Google Scholar] [CrossRef] [Green Version]
- Song, Q.; Jia, G.; Zhu, Y.; Grant, D.; Nelson, R.T.; Hwang, E.Y.; Hyten, D.L.; Cregan, P.B. Abundance of SSR Motifs and Development of Candidate Polymorphic SSR Markers (BARCSOYSSR_1.0) in Soybean. Crop Sci. 2010, 50, 1950–1960. [Google Scholar] [CrossRef] [Green Version]
- Kim, Y.H.; Park, H.M.; Hwang, T.Y.; Lee, S.K.; Choi, M.S.; Jho, S.; Hwang, S.; Kim, H.M.; Lee, D.; Kim, B.C.; et al. Variation Block-Based Genomics Method for Crop Plants. BMC Genom. 2014, 15, 477–490. [Google Scholar] [CrossRef] [PubMed] [Green Version]
- Sohn, H.B.; Kim, S.J.; Hwang, T.Y.; Park, H.M.; Lee, Y.Y.; Koo, B.C.; Kim, Y.H. Chromosome Reshuffling Patterns of Korean Soybean Cultivars Using Genome-Wide 202 InDel Markers. Korean J. Breed. Sci. 2017, 49, 213–223. [Google Scholar] [CrossRef] [Green Version]
- Sohn, H.B.; Kim, S.J.; Hwang, T.Y.; Park, H.M.; Lee, Y.Y.; Markkandan, K.; Lee, D.; Lee, S.; Hong, S.Y.; Song, Y.H.; et al. Barcode System for Genetic Identification of Soybean [Glycine max (L.) Merrill] Cultivars Using InDel Markers Specific to Dense Variation Blocks. Front. Plant Sci. 2017, 8, 520–531. [Google Scholar] [CrossRef] [PubMed] [Green Version]
- Sohn, H.B.; Song, Y.H.; Kim, S.J.; Hong, S.Y.; Kim, K.D.; Koo, B.C.; Kim, Y.H. Identification and Chromosomal Reshuffling Patterns of Soybean Cultivars Bred in Gangwon-do using 202 InDel Markers Specific to Variation Blocks. Korean J. Breed. Sci. 2018, 50, 396–405. [Google Scholar] [CrossRef]

| Release Period | Use Type | Total | |||
|---|---|---|---|---|---|
| Soy Sauce and Tofu | Bean Sprout | Cooking with Rice | Vegetable and Early Maturity | ||
| Before 1980 | Jangdanbaekmok, Chungbukbaek, Iksan, Buseok, Haman, Keumkangdaelip, Geumgangsorip, Yukwoo 3, Kwangdu, Shelby, Kwangkyo, Bongeui, Kanglim, Dongpuktae, Baegcheon, Jangyeob | Hill, Danyeob | 18 | ||
| 1980s | Hwangkeum, Jangbeak, Namcheon, Deokyu, Milyang, Baegun, Saeal, Paldal, Pokwang, Dankyeong, Muhan, Jangkyong, Jangsu, Danweon | Pangsa, Eunha, Namhae | 17 | ||
| 1990s | Malli, Shinpaldal, Samnam, Sinpaldal2, Taekwang, Duyou, Danbaek, Soyang, Jinpum, Geumgang, Dajang, Alchan, Jinpum2, Jangmi, Daewon, Ilmi, Sodam, Songhag, Daehwang | Bukwang, Hannam, Kwangan, Pureun, Sobaegnamul, Myeongjunamul, Iksannamul, Pungsannamul, Tawon, Somyeong, Paldo, Sowon, Doremi | Geomjeong1, Geomjeong2, Ilpumgeomjeong, Heugcheong, Jinyul, Galmi | Hwaeomput, Hwasongput, Geomjeongol, Saeol, Seonheuk | 43 |
| After 1999 (2000–2013) | Jangwon, Jinmi, Daepung, Daol, Hojang, Daemang, Sunyu, Daemang2, Hoban, Socheong, Nokwon, Jonam, Cheonga, Daewang, Gangil, Nampung, Manpoong, Daeha1, Daeha, Gyeongsang3, Wonyul, Soheug, Haessal, Cheonsang, Uram, Saedanbaek, Yeonpung, Jinyang, Wonhyun, Neulchan, Jang Yon, Gipung | Saebyeol, Soho, Sorog, Anpyeong, Dachae, Seonam, Dagi, Shingi, Sojin, Bosuk, Sokang, Nogchae, Aga1, Aga2, Wonhwang, Jangki, Youngyang, Soyoung, Mansu, Pungwon, Pulmu-heukchae, Daeheug, Aga3, Aga4, Wonkwang, Hoseo, Shinhwa, Galchae, Sohwang, Pulmujigi, Wonheug, Aga8, Aga9, Aga10 | Cheongja, Geomjeong3, Geumjeong4, Cheongdu1, Cheongja2, Cheongja3, Gyeongsang2, Ilpumgeomjeong2, Gyeongsang1, Josaengseori, Gaechuk1, Gaechuk2, Heugmi, Daeyang, Heugseong, Jinnong, Geomjeong5, Socheong2 | Seonnog, Shillok, Danmi, Dajin, Geomjeongsaeol, Mirang, Danmi2, Sangwon, Hanol, Cheongyeob1 | 94 |
| Total | 81 | 52 | 24 | 15 | 172 |
| Marker | Linkage Group | Chromosome No. | Repeat Motif | AT † (°C) | Sequence (5′ to 3′) | |
|---|---|---|---|---|---|---|
| Sat_374 | A1 | 05 | (AT)23 | 57 | F: | GCGTTGAAACCGTTATAAACCAACTCA |
| R: | GCGCTTTATTGGCAATACTTTTAACTCACAT | |||||
| AW132402 | A2 | 08 | (AT)17 | 54 | F: | GCGCCTCCCTCCTCTCCTTTCTT |
| R: | GCGTTTCCCACATATTCTATCATTTGTT | |||||
| Satt197 | B1 | 11 | (ATT)20 | 49 | F: | CACTGCTTTTTCCCCTCTCT |
| R: | AAGATACCCCCAACATTATTTGTAA | |||||
| Sat_342 | B2 | 14 | (AT)11 | 53 | F: | GCGACTCTGGGGAAAATTAGTTTAG |
| R: | GCGGAGTCGGGGAGCACTACTTGTC | |||||
| Satt164 | C1 | 04 | (ATT)16 | 47 | F: | CACCAATGGCTAAAGGTACATAT |
| R: | AGGAGAAGAAAAAATCACATAAAATATC | |||||
| Sat_076 | C2 | 06 | (AT)40 | 47 | F: | GCGTAATTAACACCAATATATGACATG |
| R: | GCGGGGTTAAAAATTCAAAATGT | |||||
| Satt179 | D1a | 01 | (ATT)25 | 48 | F: | GGGATTAGGTTTATGGAAGTTTATTAT |
| R: | GGGTCATTAAAACGATCAGTAAGA | |||||
| Satt216 | D1b | 02 | (ATT)19 | 47 | F: | TACCCTTAATCACCGGACAA |
| R: | AGGGAACTAACACATTTAATCATCA | |||||
| Sat_022 | D2 | 17 | (AT)27 | 47 | F: | GCGGCCTTTTCTGACTGTTAA |
| R: | GCGCAGTGACTAAAACTTACTAT | |||||
| Satt185 | E | 15 | (ATT)29 | 49 | F: | GCGCATATGAATAGGTAAGTTGCACTAA |
| R: | GCGTTTTCCTACAATAATATTTCAT | |||||
| Sat_417 | F | 13 | (AT)16 | 54 | F: | GCGAATATGGCGTTGAAAATAGTGAT |
| R: | GCGACCCAGATTCTGTGCTAAGA | |||||
| Sat_210 | G | 18 | (AT)35 | 52 | F: | GCGCCAGCAACAAAGTTCCTGACAAA |
| R: | GCGCATGCAAATGAAATAATAA | |||||
| Satt434 | H | 12 | (ATT)32 | 48 | F: | GCGTTCCGATATACTATATAATCCTAAT |
| R: | GCGGGGTTAGTCTTTTTATTTAACTTAA | |||||
| Sat_105 | I | 20 | (AT)30 | 47 | F: | TTCCATACAAGATATCAAGTGAATTG |
| R: | GCTCCCCTACATTGGTAGTAAA | |||||
| Sat_151 | J | 16 | (AT)13 | 50 | F: | GCTGCATCAGATCACCCATCCTTC |
| R: | CATGCCATGTTGTATGTATGT | |||||
| Sat_043 | K | 09 | (AT)23 | 53 | F: | GCGGTCCGTCAATGAATATTAAATTAAAA |
| R: | GCGAAAGCGGCAGAGAGAGAAAGGT | |||||
| Sat_245 | L | 19 | (AT)27 | 55 | F: | GCGAGCCTACTTTTACTAGAACGTCAACAAG |
| R: | GCGAAAAATTCAACTCCCCTTTAATAGATTC | |||||
| Sat_391 | M | 07 | (AT)37 | 52 | F: | GCGTAGGCATCGGTCAATATTTT |
| R: | GCGTTAGCGAGTGGATCAAGATCA | |||||
| Satt339 | N | 03 | (ATT)26 | 49 | F: | TAATATGCTTTAAGTGGTGTGGTTATG |
| R: | GTTAAGCAGTTCCTCTCATCACG | |||||
| Sat_190 | O | 10 | (AT)9 | 51 | F: | GCGTGGAAAATATTTTAAAGATTAGGA |
| R: | GCGTGTGTACATTTAGTCTACTTGAGAA | |||||
| Marker | Size (bp) | NA † | NAF ‡ | PIC § |
|---|---|---|---|---|
| Sat_374 | 273–343 | 21 | 0.1919 | 0.9060 |
| AW132402 | 137–183 | 15 | 0.1977 | 0.8630 |
| Satt197 | 107–182 | 16 | 0.1395 | 0.9126 |
| Sat_342 | 176–246 | 19 | 0.2035 | 0.9113 |
| Satt164 | 222–246 | 7 | 0.3256 | 0.7529 |
| Sat_076 | 122–208 | 29 | 0.1337 | 0.9318 |
| Satt179 | 130–184 | 7 | 0.4244 | 0.6799 |
| Satt216 | 164–248 | 15 | 0.3430 | 0.7850 |
| Sat_022 | 203–255 | 18 | 0.1919 | 0.9114 |
| Satt185 | 210–270 | 16 | 0.1919 | 0.8819 |
| Sat_417 | 139–229 | 22 | 0.1105 | 0.9267 |
| Sat_210 | 217–287 | 18 | 0.2151 | 0.8741 |
| Satt434 | 301–361 | 18 | 0.2326 | 0.8875 |
| Sat_105 | 228–274 | 18 | 0.1628 | 0.9067 |
| Sat_151 | 210–272 | 17 | 0.2849 | 0.8241 |
| Sat_043 | 242–294 | 18 | 0.1453 | 0.9167 |
| Sat_245 | 119–207 | 19 | 0.1395 | 0.9107 |
| Sat_391 | 214–282 | 16 | 0.1628 | 0.8903 |
| Satt339 | 203–245 | 14 | 0.2849 | 0.8041 |
| Sat_190 | 125–215 | 21 | 0.2616 | 0.8737 |
| Total | 344 | |||
| Mean | 17.2 | 0.2172 | 0.8675 |
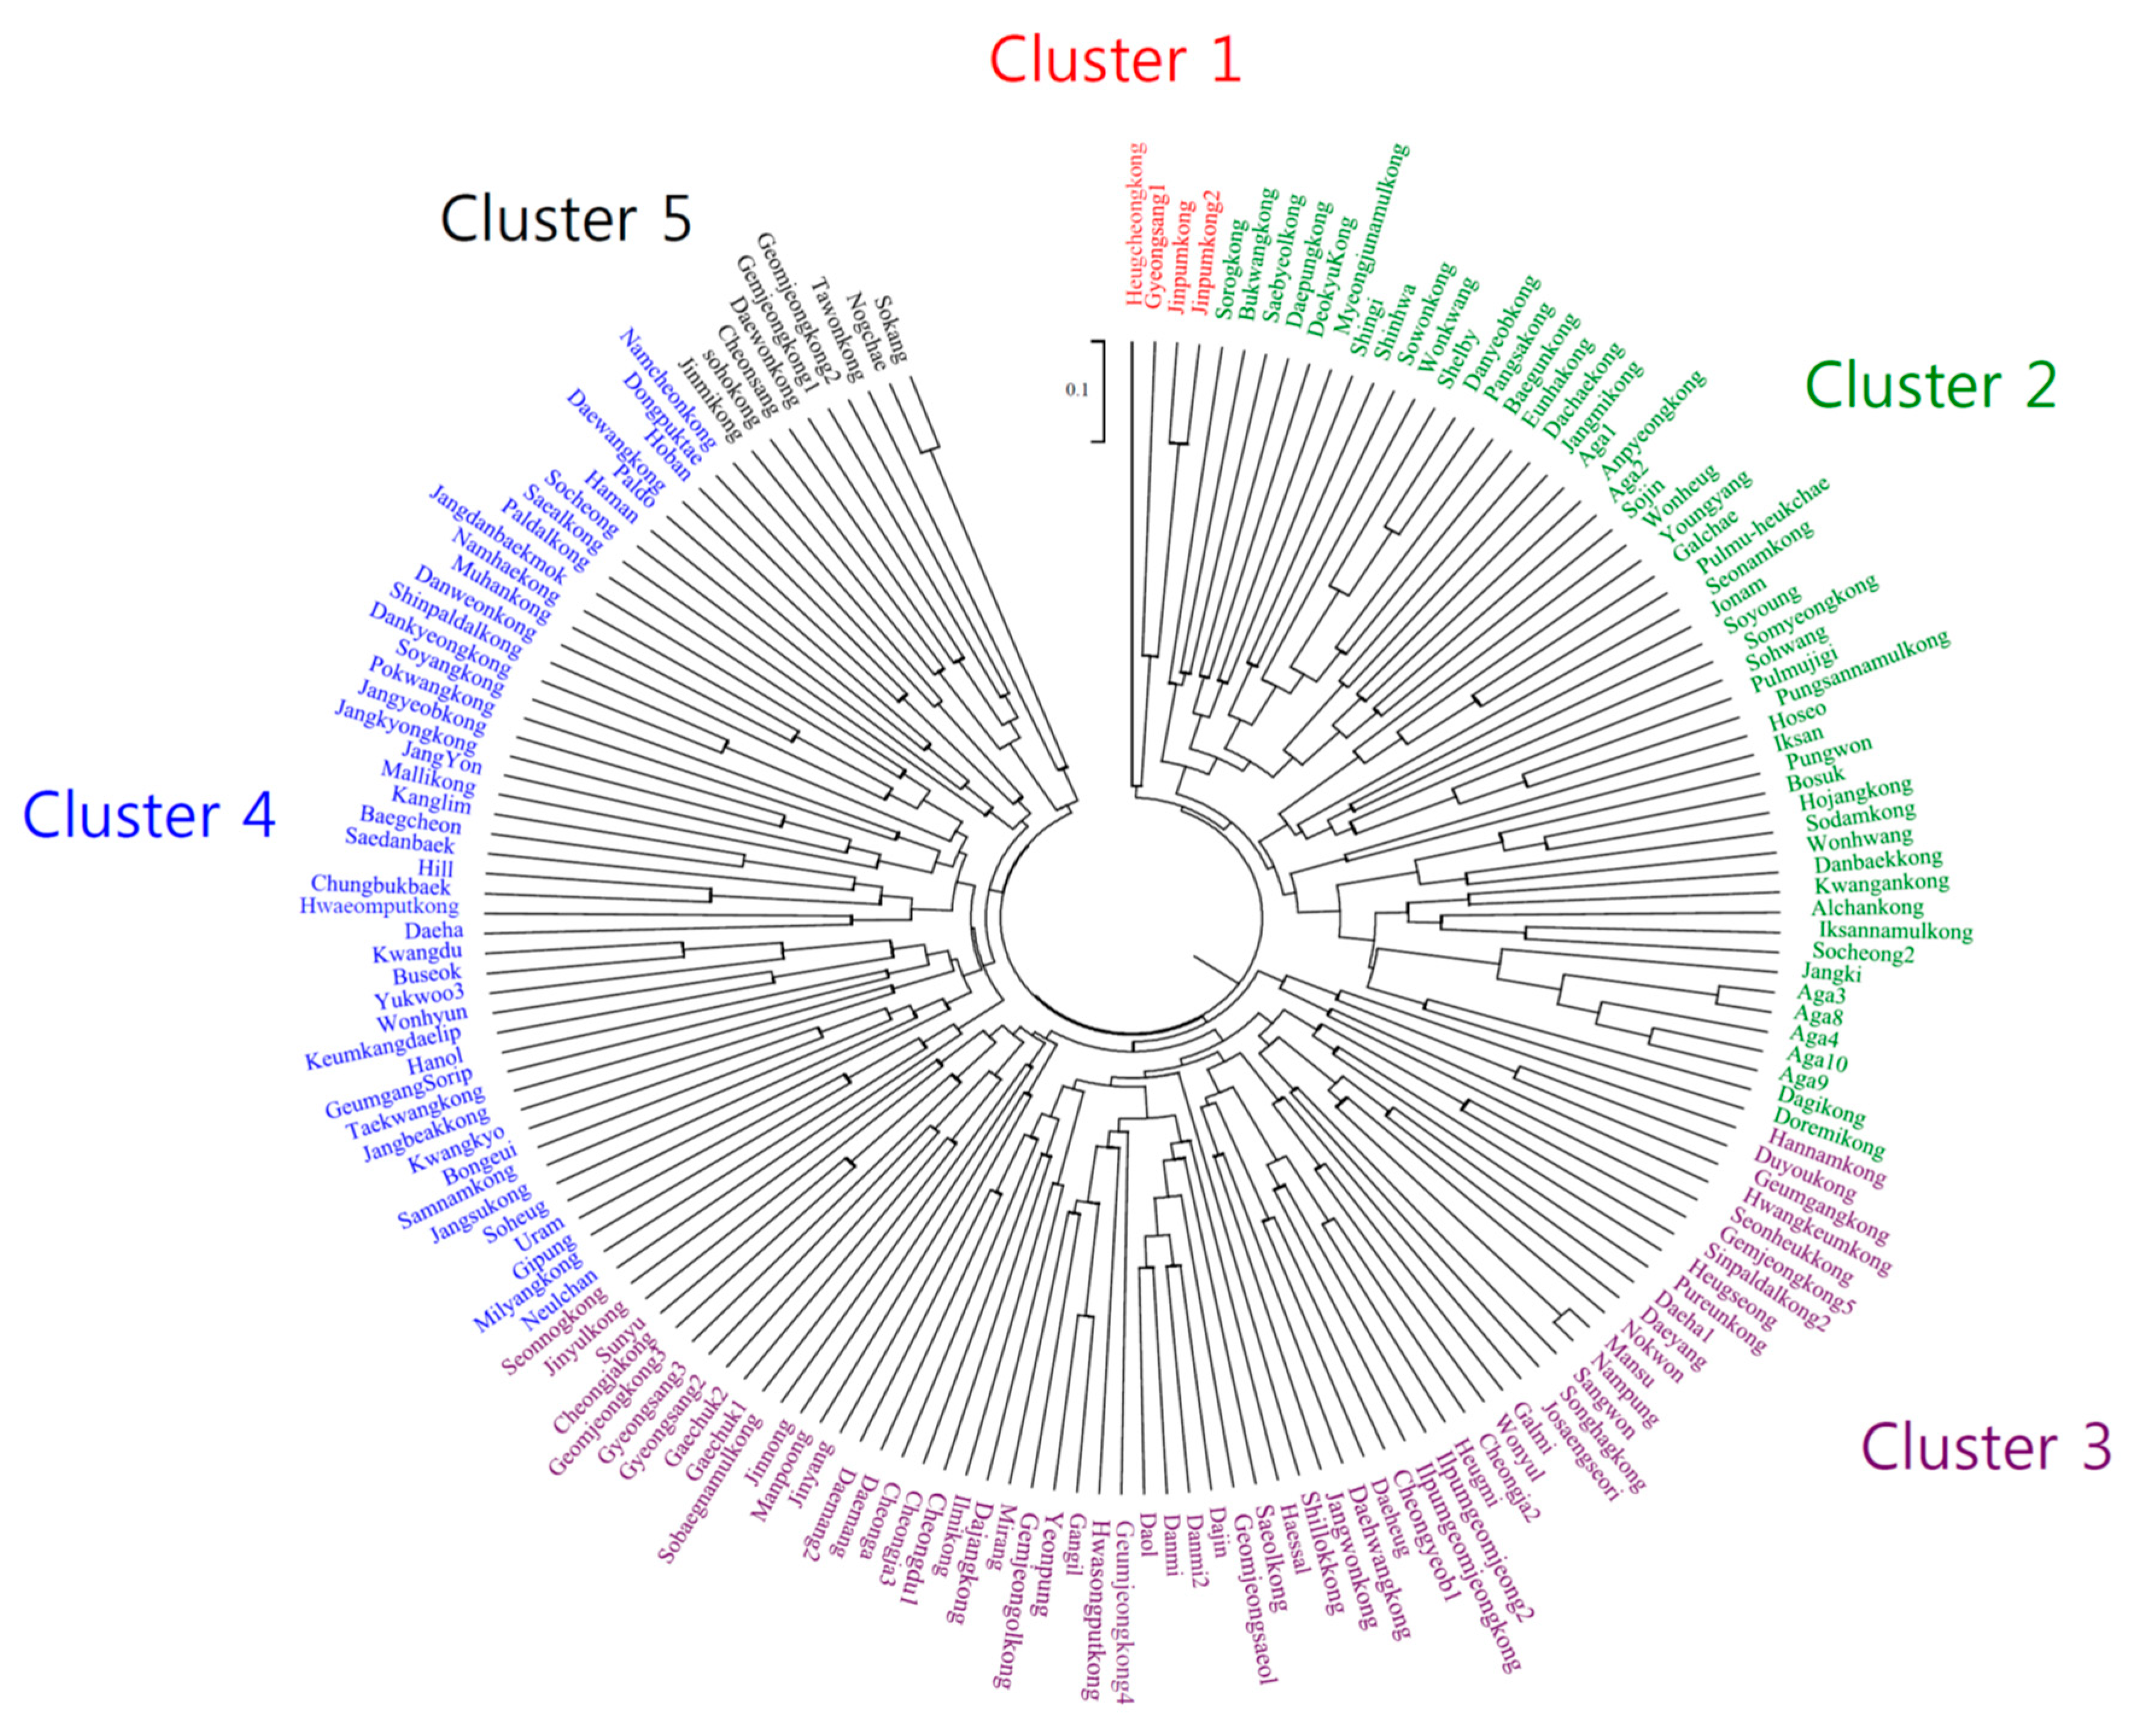
| Cluster | Release Period | Total | |||
|---|---|---|---|---|---|
| Before 1980 | 1980s | 1990s | 2000 or Later | ||
| I | Jinpum, Jinpum2, Heugcheong | Gyeongsang1 | 4 (2.3%) | ||
| II | Iksan, Shelby, Danyeob, | Deokyu, Baegun, Pangsa, Eunha, | Bukwang, Danbaek, Kwangan, Myeongjunamul, Iksannamul, Alchan, Pungsannamul, Jangmi, Somyeong, Sodam, Sowon, Doremi, | Saebyeol, Sorog, Anpyeong, Daepung, Dachae, Seonam, Dagi, Hojang, Shingi, Sojin, Bosuk, Aga1, Aga2, Wonhwang, Jangki, Youngyang, Soyoung, Pungwon, Jonam, Pulmu-heukchae, Aga3, Aga4, Wonkwang, Hoseo, Shinhwa, Galchae, Sohwang, Pulmujigi, Wonheug, Socheong2, Aga8, Aga9, Aga10 | 52 (30.2%) |
| III | Hwangkeum | Sinpaldal2, Duyou, Hwasongput, Hannam, Pureun, Geumgang, Sobaegnamul, Dajang, Gemjeongol, Ilpumgeomjeong, Ilmikong, Saeol, Seonheuk, Songhag, Jinyul, Daehwang, Galmi | Jangwon, Cheongja, Seonnog, Shillok, Geomjeong3, Geumjeong4, Daol, Danmi, Cheongdu1, Daemang, Dajin, Cheongja2, Cheongja3, Sunyu, Geomjeongsaeol, Gyeongsang2, Daemang2, Mirang, Danmi2, Ilpumgeomjeong2, Josaengseori, Gaechuk1, Gaechuk2, Heugmi, Nokwon, Mansu, Cheonga, Gangil, Nampung, Sangwon, Daeheug, Daeyang, Manpoong, Heugseong, Daeha1, Gyeongsang3, Jinnong, Gemjeong5, Cheongyeob1, Wonyul, Haessal, Yeonpung, Jinyang | 61 (35.5%) | |
| IV | Jangdanbaekmok, Chungbukbaek, Buseok, Haman, Keumkangdaelip, GeumgangSorip, Yukwoo3, Kwangdu, Hill, Kwangkyo, Bongeui, Kanglim, Dongpuktae, Baegcheon, Jangyeob | Jangbeak, Namcheon, Milyang, Saeal, Paldal, Pokwang, Dankyeong, Muhan, Namhae, Jangkyong, Jangsu, Danweon, | Malli, Shinpaldal, Samnam, Taekwang, Hwaeomput, Soyang, Paldo, | Hoban, Socheong, Daewang, Daeha, Hanol, Soheug, Uram, Saedanbaek, Wonhyun, Neulchan, JangYon, Gipung | 46 (26.7%) |
| V | Gemjeong1, Geomjeong2, Tawon, Daewon | Soho, Jinmi, Sokang, Nogchae, Cheonsang | 9 (5.2%) | ||
| Total | 18 | 17 | 43 | 94 | 172 (100%) |
| Cluster | I | II | III | IV | V |
|---|---|---|---|---|---|
| I | - | ||||
| II | 0.2412 | - | |||
| III | 0.2451 | 0.0873 | - | ||
| IV | 0.2482 | 0.0915 | 0.0819 | - | |
| V | 0.3382 | 0.1659 | 0.1459 | 0.1473 | - |
| Marker | Release Period | |||||||
|---|---|---|---|---|---|---|---|---|
| Before 1980 | 1980s | 1990s | 2000 or later | |||||
| NA. † | PIC ‡ | NA. | PIC | NA. | PIC | NA. | PIC | |
| Sat_374 | 9 | 0.8143 | 9 | 0.8198 | 17 | 0.9006 | 20 | 0.8999 |
| AW132402 | 8 | 0.7941 | 7 | 0.7928 | 10 | 0.8383 | 13 | 0.8604 |
| Satt197 | 10 | 0.8431 | 7 | 0.7713 | 13 | 0.8890 | 15 | 0.9121 |
| Sat_342 | 10 | 0.8431 | 10 | 0.8288 | 15 | 0.8724 | 19 | 0.9028 |
| Satt164 | 4 | 0.6658 | 6 | 0.7817 | 7 | 0.7810 | 7 | 0.7188 |
| Sat_076 | 13 | 0.9001 | 13 | 0.8846 | 19 | 0.9165 | 24 | 0.9285 |
| Satt179 | 5 | 0.6987 | 6 | 0.5299 | 5 | 0.5851 | 6 | 0.7093 |
| Satt216 | 8 | 0.6886 | 6 | 0.5769 | 10 | 0.8074 | 11 | 0.7779 |
| Sat_022 | 12 | 0.8795 | 9 | 0.8032 | 15 | 0.8927 | 18 | 0.9116 |
| Satt185 | 12 | 0.8929 | 9 | 0.8427 | 11 | 0.8395 | 15 | 0.8727 |
| Sat_417 | 8 | 0.8197 | 11 | 0.8752 | 17 | 0.9127 | 20 | 0.9252 |
| Sat_210 | 10 | 0.8645 | 9 | 0.8427 | 12 | 0.7753 | 16 | 0.8778 |
| Satt434 | 9 | 0.8024 | 9 | 0.8343 | 13 | 0.8682 | 17 | 0.8904 |
| Sat_105 | 9 | 0.8422 | 8 | 0.8339 | 12 | 0.8724 | 17 | 0.9074 |
| Sat_151 | 7 | 0.7900 | 7 | 0.7157 | 10 | 0.7695 | 16 | 0.8350 |
| Sat_043 | 10 | 0.8640 | 11 | 0.8830 | 15 | 0.9003 | 17 | 0.8982 |
| Sat_245 | 12 | 0.8724 | 6 | 0.7907 | 14 | 0.8989 | 18 | 0.9052 |
| Sat_391 | 11 | 0.8649 | 9 | 0.8266 | 12 | 0.8470 | 15 | 0.8889 |
| Satt339 | 8 | 0.7704 | 5 | 0.7557 | 11 | 0.8034 | 12 | 0.8001 |
| Sat_190 | 10 | 0.8645 | 10 | 0.8372 | 13 | 0.8612 | 19 | 0.8399 |
| Total | 185 | 167 | 251 | 315 | ||||
| Mean | 9.25 | 0.8188 | 8.35 | 0.7913 | 12.55 | 0.8416 | 15.75 | 0.8631 |
| Release Period | Before 1980 | 1980s | 1990s | 2000 or Later |
|---|---|---|---|---|
| Before 1980 | - | |||
| 1980s | 0.3382 | - | ||
| 1990s | 0.4906 | 0.4444 | - | |
| 2000 or later | 0.5587 | 0.5731 | 0.1909 | - |
| Step | Marker | Identified Varieties | No. of Identified Varieties | Percentage of Identified Varieties |
|---|---|---|---|---|
| Step 1 | Sat_076 | Gaechuk2, Geumjeong4, Heugcheong, Jinnong, Manpoong, Seonam, Sobaegnamul | 7 | 4.1% |
| Step 2 | Step 1 + Sat_417 | Bongeui, Galmi, Geumgangsorip, Jangkyong, Somyeong, Heugseong, Jangyon, Jangsu, Pureun, Baegcheon, Daemang2, Dankyeong, Deokyu, Haessal, Taekwang, Ilpumgeomjung, Jangdanbaekmok, Wonkwang, Saedanbaek, Tawon, Wonheug, Dajang, Geomjeongol, Cheongja2, Cheongyeob1, Daehwang, Galchae, Paldo, Pokwang, Shinpaldal, Jinyang, Milyang, Wonhwang, Aga2, Samnam, Sohwang, Sorog, Pulmujigi, Shingi, Haman, Hwaeomput, Heugmi, Jangyeob, Malli, Jangwon, Dongpuktae, Jonam, Saeal, Soyoung, Bukwang, Daepung, Pungsannamul, Saebyeol, Jangmi, Kwangan, Muhan, Sangwon, Shinhwa, Youngyang, Hoban, Gyeongsang1, Jangbeak, Shelby, Wonhyun, Josaengseori, Pangsa, Doremi, Hanol, Danyeob, Hojang, Hoseo, Namcheon, Soho | 73 | 42.4% |
| Step 3 | Step 2 + Sat_043 | Duyou, Geumgang, Cheongja, Geomjeong1, Daewon, Shillok, Ilpumgeomjeong2, Sunyu, Cheonga, Cheongja3, Sowon, Sodam, Alchan, Dachae, Iksannamul, Socheong2, Dagi, Songhag, Danbaek, Anpyeong, Eunha, Baegun, Gyeongsang2, Gyeongsang3, Gaechuk1, Aga4, Aga9, Jangki, Paldal, Danmi2, Geomjeongsaeol, Hill, Chungbukbaek, Danweon, Jinpum, Jinpum2, Cheongdu1, Daemang, Daeyang, Geomjeong3, Buseok, Kwangdu, Nokwon, Seonnog, Daol, Jinyul, Gangil, Dajin, Pulmu-heukchae, Saeol, Geomjeong2, Mirang, Daeheug, Myeongjunamul, Danmi, Hannam, Soyang, Ilmi, Yukwoo 3, Kanglim, Kwangkyo, Jinmi, IksanCheonsang, Hwangkeum, Keumkangdaelip, Neulchan, Soheug, Wonyul | 69 | 40.1% |
| Step 4 | Step 3 + Satt197 | Gipung, Uram, Daewang, Socheong, Hwasongput, Yeonpung, Aga10, Sojin, Aga1, Namhae, Seonheuk, Geomjeong5, Sinpaldal2 | 13 | 9.6% |
| Step 5 | Step 4 + Satt434 | Nogchae, Sokang, Aga3, Aga8, Pungwon, Bosuk, Daeha, Daeha1 | 8 | 4.6% |
| Step 6 | Step 5 + Satt179 | Mansu, Nampung | 2 | 1.2% |
| Total | 172 | 100% | ||
© 2020 by the authors. Licensee MDPI, Basel, Switzerland. This article is an open access article distributed under the terms and conditions of the Creative Commons Attribution (CC BY) license (http://creativecommons.org/licenses/by/4.0/).
Share and Cite
Hwang, T.-Y.; Gwak, B.S.; Sung, J.; Kim, H.-S. Genetic Diversity Patterns and Discrimination of 172 Korean Soybean (Glycine max (L.) Merrill) Varieties Based on SSR Analysis. Agriculture 2020, 10, 77. https://doi.org/10.3390/agriculture10030077
Hwang T-Y, Gwak BS, Sung J, Kim H-S. Genetic Diversity Patterns and Discrimination of 172 Korean Soybean (Glycine max (L.) Merrill) Varieties Based on SSR Analysis. Agriculture. 2020; 10(3):77. https://doi.org/10.3390/agriculture10030077
Chicago/Turabian StyleHwang, Tae-Young, Byeong Sam Gwak, Jwakyung Sung, and Hong-Sig Kim. 2020. "Genetic Diversity Patterns and Discrimination of 172 Korean Soybean (Glycine max (L.) Merrill) Varieties Based on SSR Analysis" Agriculture 10, no. 3: 77. https://doi.org/10.3390/agriculture10030077
APA StyleHwang, T.-Y., Gwak, B. S., Sung, J., & Kim, H.-S. (2020). Genetic Diversity Patterns and Discrimination of 172 Korean Soybean (Glycine max (L.) Merrill) Varieties Based on SSR Analysis. Agriculture, 10(3), 77. https://doi.org/10.3390/agriculture10030077