Article

A Decision Support Method for Choosing an Agricultural Machinery Service Workshop Based on Fuzzy Logic

Institute of Biosystems Engineering, Poznan University of Life Sciences Wojska Polskiego 50, 60-637 Poznan, Poland
*
Author to whom correspondence should be addressed.
Agriculture 2020, 10(3), 76; https://doi.org/10.3390/agriculture10030076
Submission received: 19 January 2020 / Revised: 4 February 2020 / Accepted: 7 February 2020 / Published: 13 March 2020

Abstract

:
The quality of technical services is one of the main criteria for assessing the service processes of agricultural machinery, and it has a significant impact on the decision-making process when choosing a service provider. Technical service quality has a significant role in maintaining agricultural machinery in optimal technical condition, thus ensuring its high reliability and durability. The purpose of this study is to present a decision support method for choosing the right agricultural machinery service facility. The method is based on fuzzy inference. The choice of service workshop is based on decision criteria individually accepted by farmers (experts). The method was checked by way of research carried out among 25 farmers facing the choice of a service facility. The decision-making process allows for ranking the decision criteria and decision-makers. The results of the presented research can be used by farm owners and service companies to plan their development directions.

1. Introduction

Agricultural machines constitute a group of technical objects which are clearly distinguished from others. They should be characterized by high reliability and capability. On account of the specificity of agricultural production, they are used seasonally and work in very difficult conditions [1]. Progress in agriculture is possible because of the access to modern and efficient machines and to the implementation of new technologies. Economic development in agriculture is also expressed via levels of equipping with technical means. The development of agricultural techniques is closely related to the needs and financial resources of farms [2], including the need for modernization of machines within these financial resources [3]. Unfortunately, the expense of agricultural machines means that only prospering farms can afford the restoration or renovation of machines [4].
The modern structure and complicated assemblies of agricultural machines require proper maintenance. Technical support of machines in practice is determined by comprehending technical services; the systems of these technical service inspections are basic processes [5]. The use of machines and agricultural devices is determined by the sequence of processes and occurrences associated with using them [6]. This includes the relations between technical objects from the moment of purchasing the machine to its sale or liquidation. Therefore, technical service is an integral part of the scheme of the use of all agricultural machines. With the main operations being included in the processes of servicing machines, there are periodic technical inspections; these are of a preventive nature and provide practical benefits for technical objects as their purpose is to extend the period of failure-free work [7]. On account of their peculiar working conditions, holding agricultural machines in a state of full readiness for use is a complex and very difficult process. Basic activities are connected with the timely exchange of exploitative materials. This results from counteractions for processes of material wear [8]. Aging and original property loss apply in particular to hydraulic fluids [9,10].
Technical services are a need that can cause breaks in the use of the machine [11,12]. Delaying service activities, disregarding the recommendations of the manufacturer of the machine, and replacing exploitative materials intended for exchange with another substitute (often of dubious quality) can result in undesirable failure of the machine [13,14]. Preventive service actions are the most important service activities of machines. However, they are often made to an insufficient level. This results mainly from inappropriate knowledge of using machines but also from economic conditions and a desire to minimize the share of service costs of agricultural farms [15]. High-quality technical support brings long-term financial gains for producers of agricultural machines. Additionally, it encourages the purchase of the proper products intended for each machine [16].
Changes in the functioning of an agricultural farm cause it to become open to extrinsic factors to a large degree. One should realize that, so far, a considerable number of farmers are making production decisions using advice from their fathers, neighbors, and acquaintances. Feature extraction is a first phase of decision-making processes (of parameters); after categorizing, these features become decision-making criteria [17,18]. It is possible to classify decision-making features on account of possibilities of their measurement and by the degree of their complexity. It is possible to characterize choosing an appropriate service workshop for agricultural machines with many parameters, at least a dozen, when evaluating their quality. Therefore, a dilemma appears. On the one hand, the set of features should be the biggest possible and should consider details very precisely. On the other hand, a substantial amount of compared factors reduces the efficiency of the analysis of decision-making processes and of making objective assessments [19,20]. Market information about service workshops does not deliver sufficient solid knowledge to enable making the right decisions associated with servicing machines. In the case of an improperly made decision on the choice of service workshop, the farmer can suffer grave financial losses associated with overdue or improper technical support of machines [21].

2. Materials and Methods

The aim of this research is to present a method using fuzzy logic to support the decision-making processes involved in choosing a service workshop. The choice of this method is justified by the fact that fuzzy logic allows the possibility of considering measurable and non-measurable features.
The method herein was built independently on the basis of fuzzy inference theory. In order to verify the method, a survey was conducted among 25 farm owners. The method was also checked on other cases. This method can be used both for one decision-maker and for many decision-makers.

2.1. Background on Fuzzy Logic

The introduction of the concept of fuzzy sets and the theory of fuzzy sets was motivated by the need to mathematically describe occurrences that are ambiguous and imprecise. In the theory of fuzzy sets, one can speak about the partial belonging of a point to the considered set. Instead of zeros and ones (0 or 1), fuzzy logic enables the use of linguistic variables. They assume imprecise values and concepts of spoken language. If something is warm, it is not cold or hot. If something is gray, it is not black or white. Fuzzy logic also allows us to describe features that cannot be expressed in numbers. It allows us to describe occurrences of an ambiguous nature that cannot be described in binary terms [22,23,24].
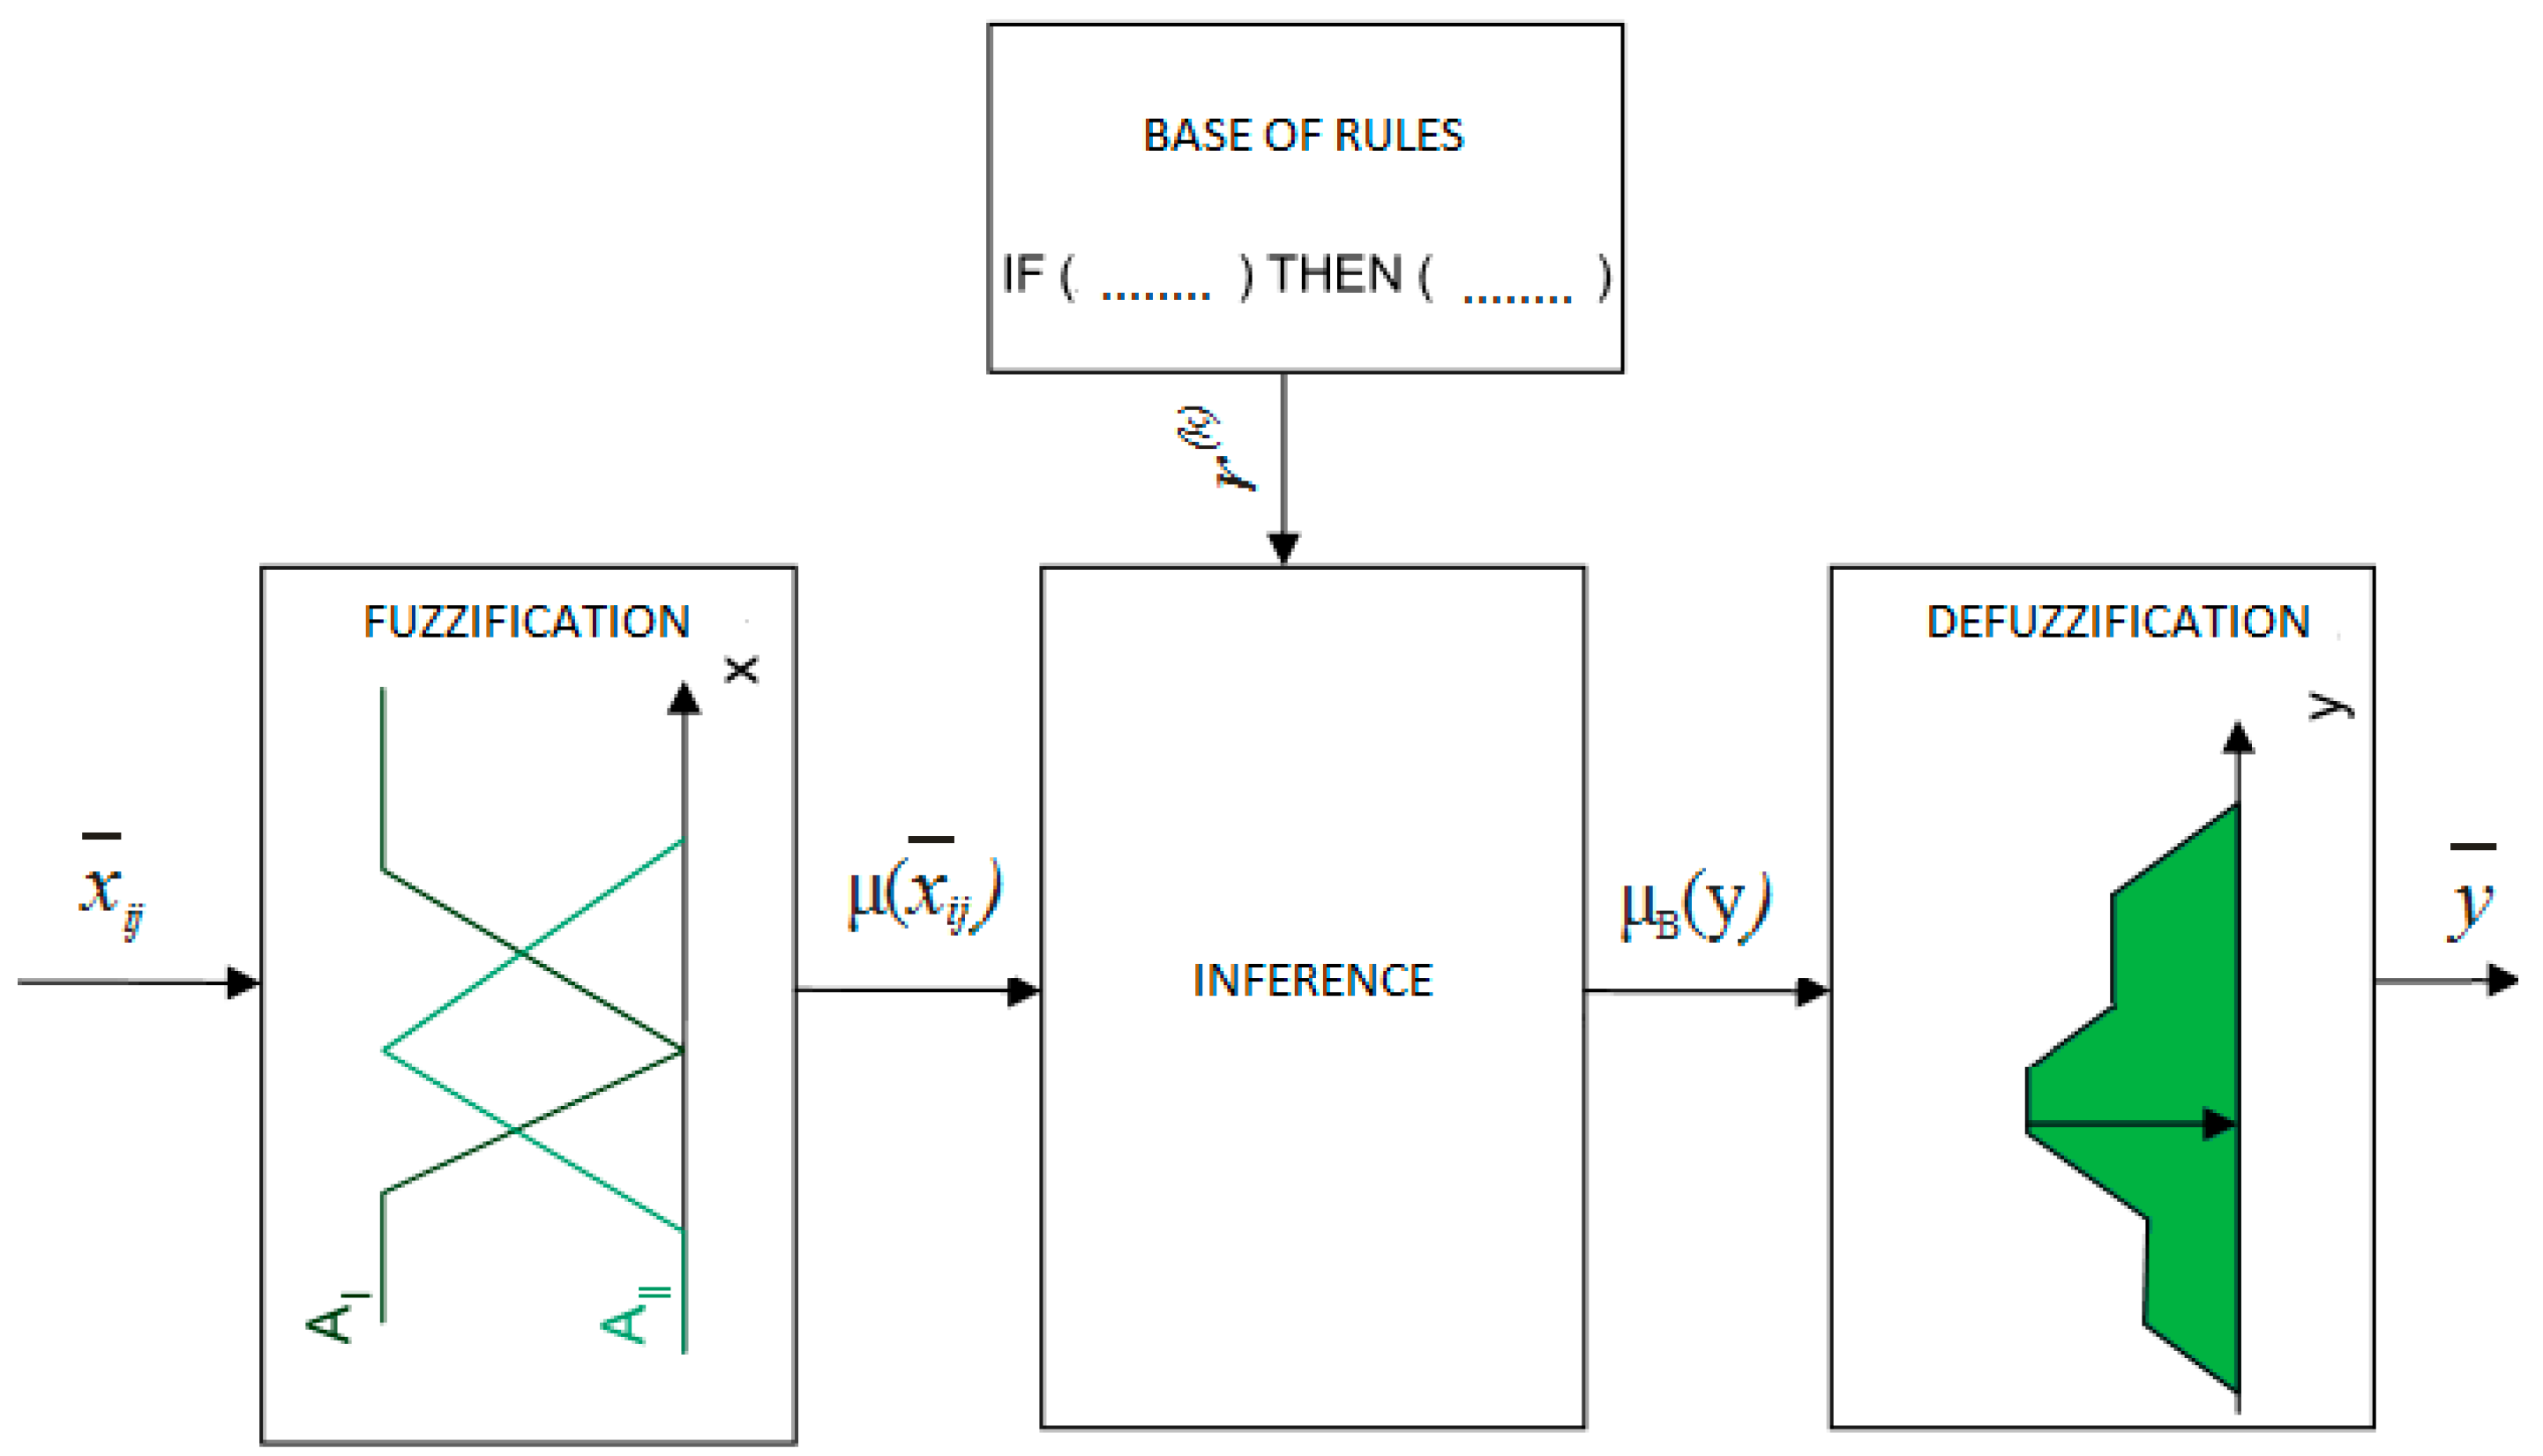
The notion of fuzzy sets was conceived in 1965 by the American researcher L. A. Zadeh. It was formed as an alternative to classic notions concerning set theory and logic, dating back to times of ancient Greek philosophy. This tool was intended for the modelling of complex processes. In the theory of fuzzy sets, the properties of fuzzy logic are exploited. This is applied for the modelling and guidance of complex systems [23,24,25,26,27]. The foundation and development of fuzzy logic resulted from the need to describe occurrences that are difficult to describe using classical mathematics. The model of fuzzy logic consists of three main components: fuzzification, inference, and defuzzification [24,28,29,30]. Together, they provide completeness and totality (Figure 1).
The fuzzification component carries out operations of fuzzifying input values to the model (e.g., number of employees of the service unit, charge) or of fuzzy sets (e.g., experience of employees). On accessing the inference block, a fuzzy value appears, where the ultimate membership function of the conclusion of the rule base is determined as the basic element. In the last block, the membership function of the conclusion in one pungent value is acquired. This constitutes the output from the model corresponding to the input values.

2.2. Methods

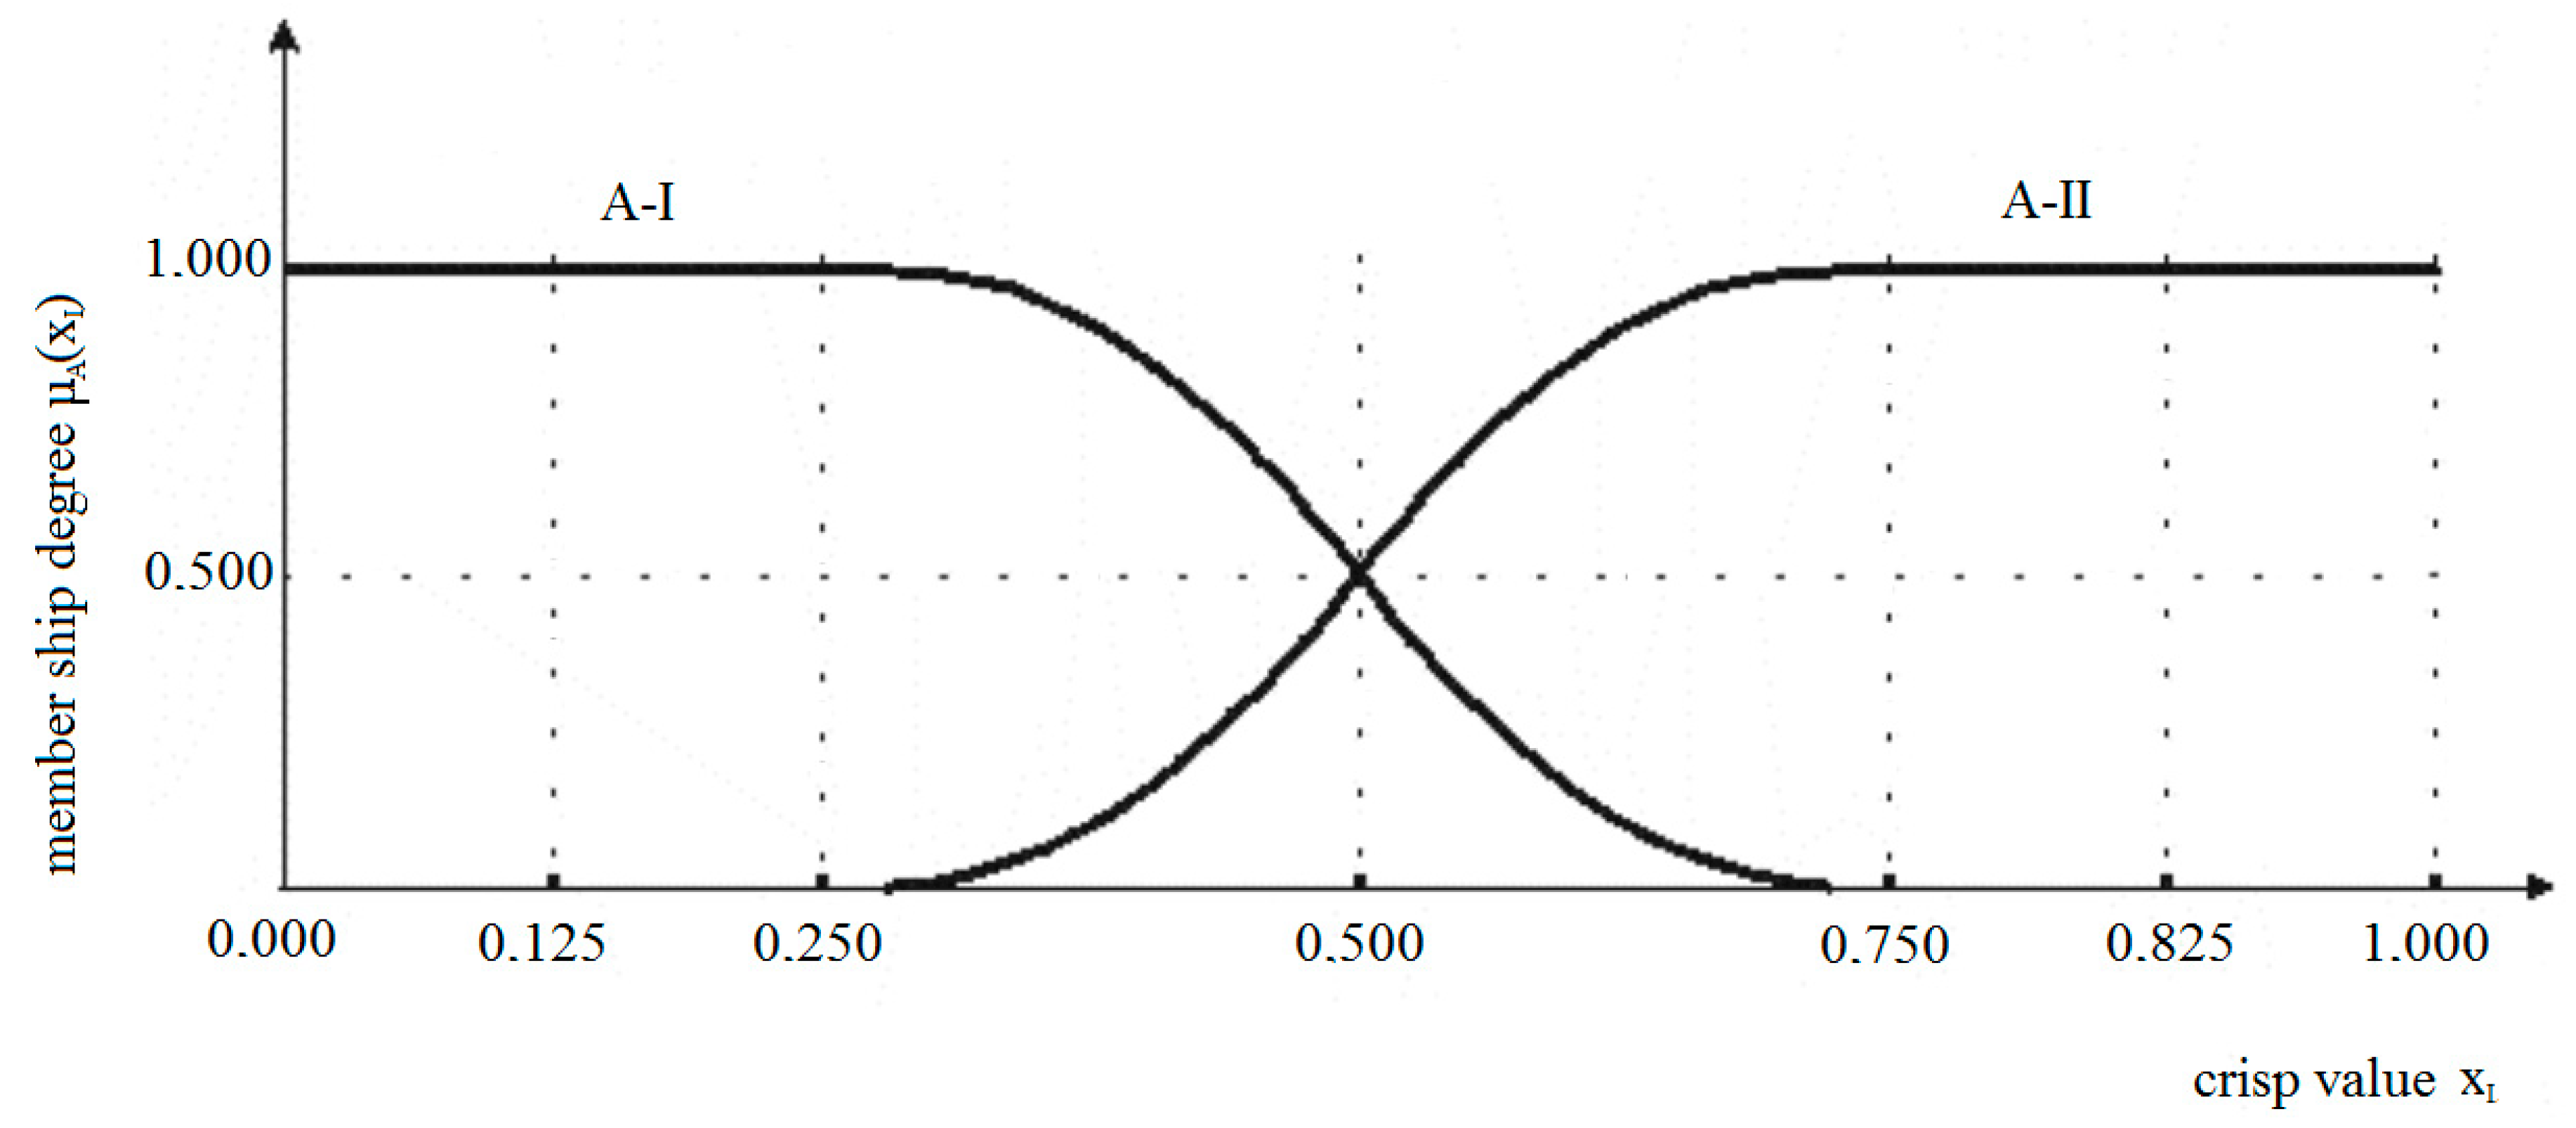
The proposed method allows a numerical value of the choice of agricultural machines to be obtained. On entry to the fuzzy system, one should define the shape of the membership function, giving the area of the choices X in the closed range [0, 1].
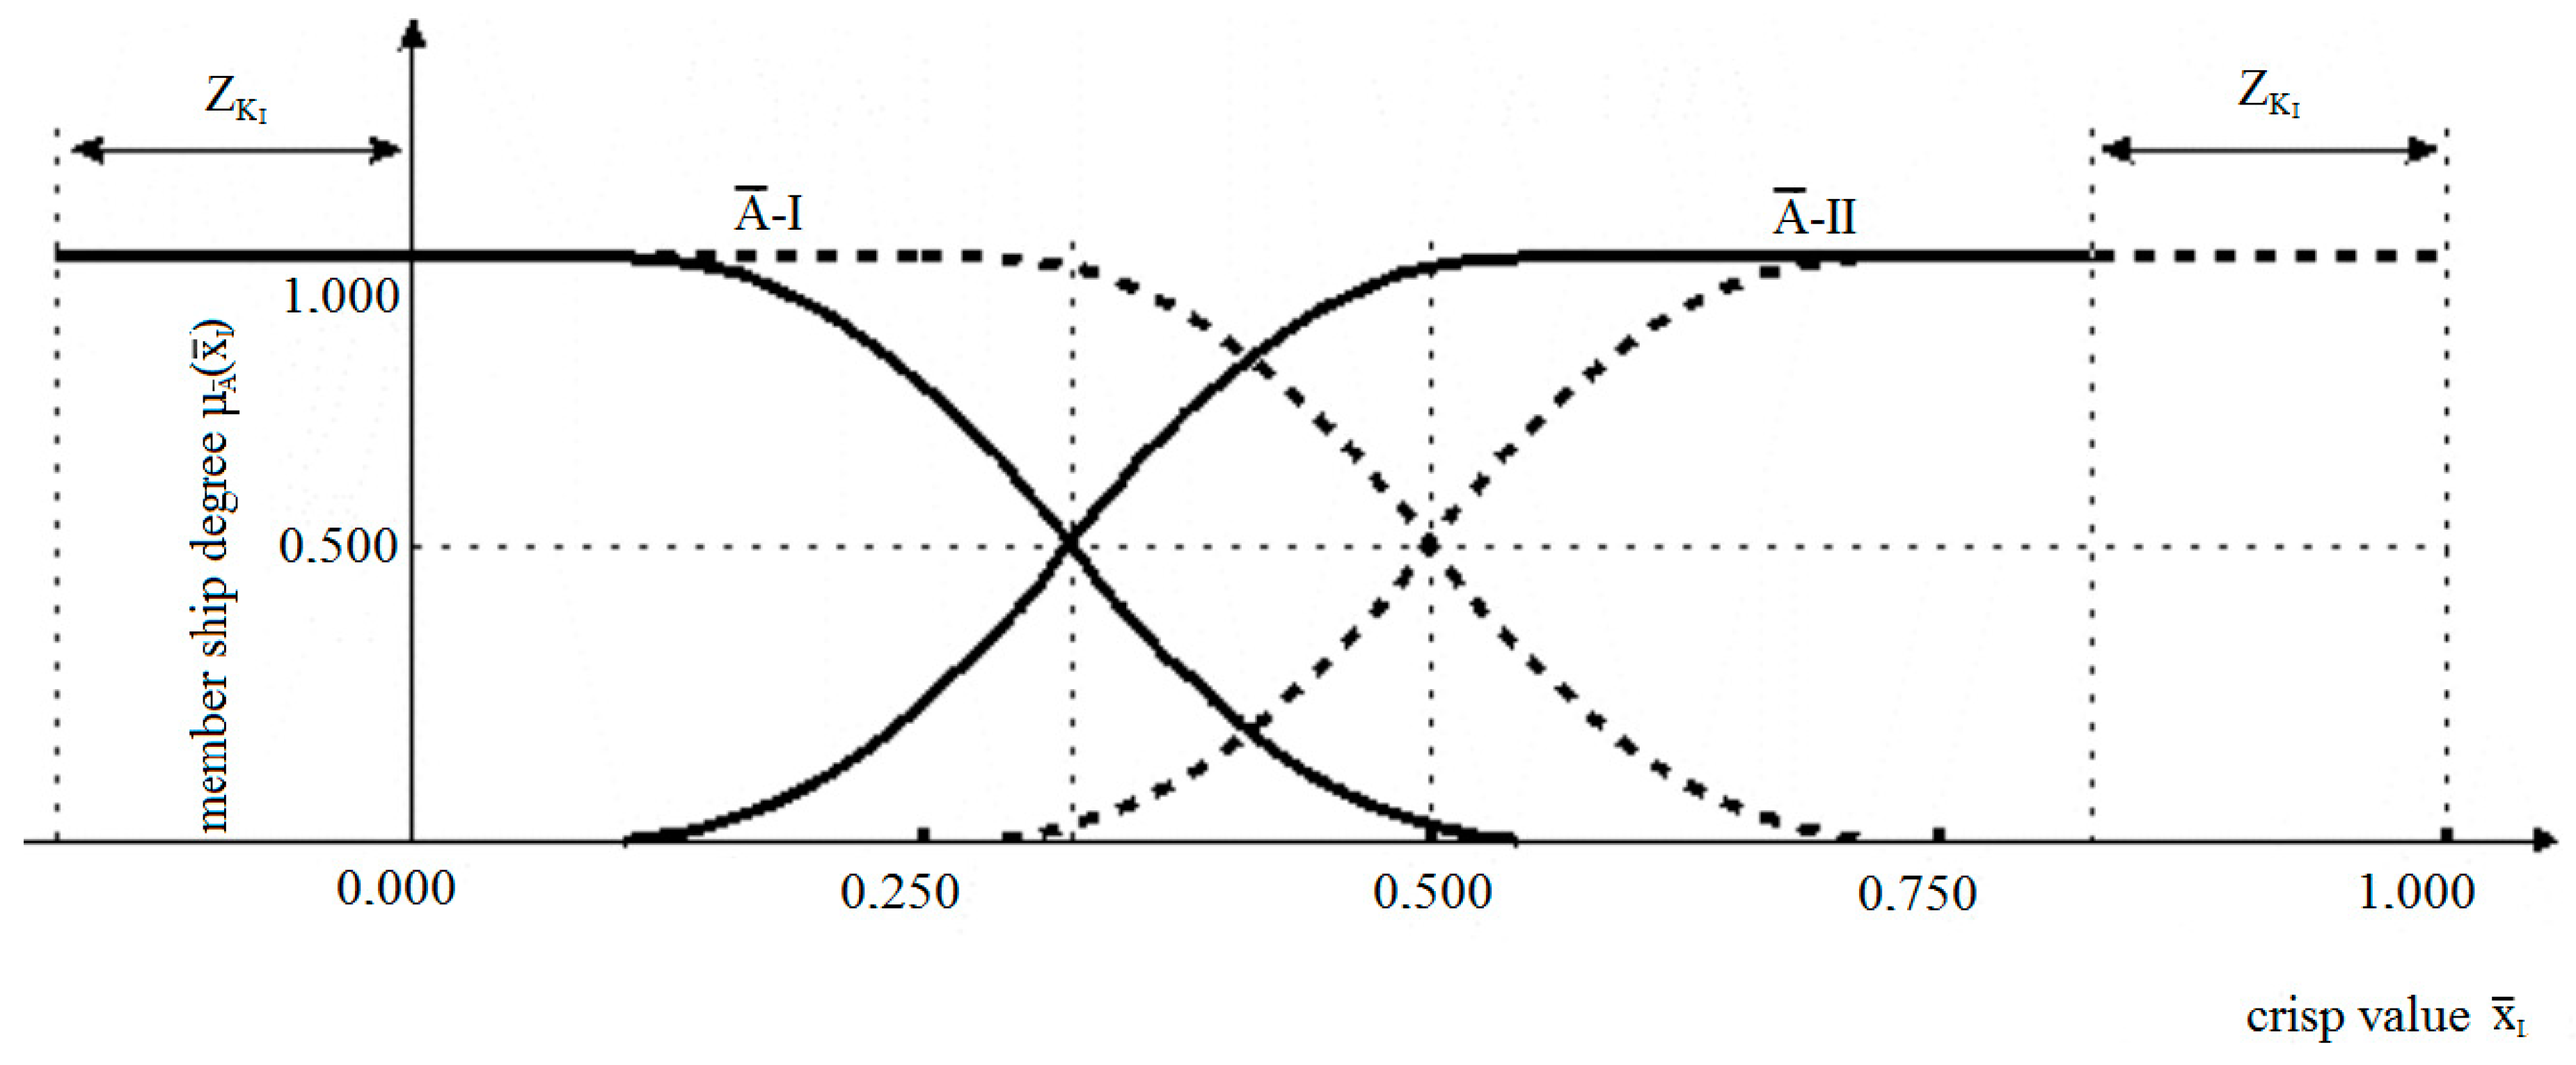
The input sets A-i of the method comprise two terms, each of them expressing a linguistic assessment of adopted criteria. The A-I set constitutes low evaluations (expense of after-sales service, lack of spare parts, lack of appropriate equipment), while the A-II set constitutes high evaluations (acceptable price for performed services, unlimited access to spare parts, modern diagnostic systems). In Figure 2, the set membership functions of the input sets A-i of the fuzzy model are described.
The established input sets A-i in the fuzzy model were modified. The weight values of the criteria W K i ,   (which were determined by farmers, where farmers assume the role of experts) were used to modify the input sets. The alteration of sets consists of moving them toward the axis of the value of the function fixtures μ A i ( x i ) , with the value Z i appointed using Equation (1):
Z K i   =   w K i n ,
where n is the number of terms of the input set of the fuzzy model.
Moving the input sets A-i with the value Z i allows for including the hierarchization of criteria for the choice of service workshop and appointing new input sets A ¯ i . The values x ¯ i for criteria of smaller weight acquire a lower grade in the fuzzification of the fuzzy logic model; those with greater weight have a larger degree of membership (Figure 3).
The rule base (linguistic model) is interpreted as the set of cause-and-effect relationships which occur among input sets A ¯ i and output sets B i (which are still fuzzy sets). Every rule consists of the part IF, called the predecessor, which is a set of conditions, and the part THEN, called the apodosis, containing the conclusion. For example, IF the price of services provided is low AND mobile services are provided AND there is good access to spare parts AND there are a large number of qualified mechanics AND there are modern diagnostic systems AND it is a short distance to the service workshop AND services rendered are of good quality AND other farmers have a good opinion of the service center THEN the service center is very good.
Fulfilling individual rules allows us to calculate the degree of activation of the conclusion in the form of the membership function μ B i ( y ) . Combining individual functions provides the ultimate membership function for the conclusion of the rule base. The substantial number of combinations of rules requires the establishment of a base containing only the most characteristic premises and conclusions for the analyzed variant. Extreme, contradictory, and illogical rules are omitted (e.g., IF the price of services provided is low AND mobile services are provided AND there is good access to spare parts AND there are a large number of qualified mechanics AND there are modern diagnostic systems AND it is a short distance to the service facility AND services rendered are of good quality AND other farmers have a good opinion of the service center THEN the service facility is very bad).
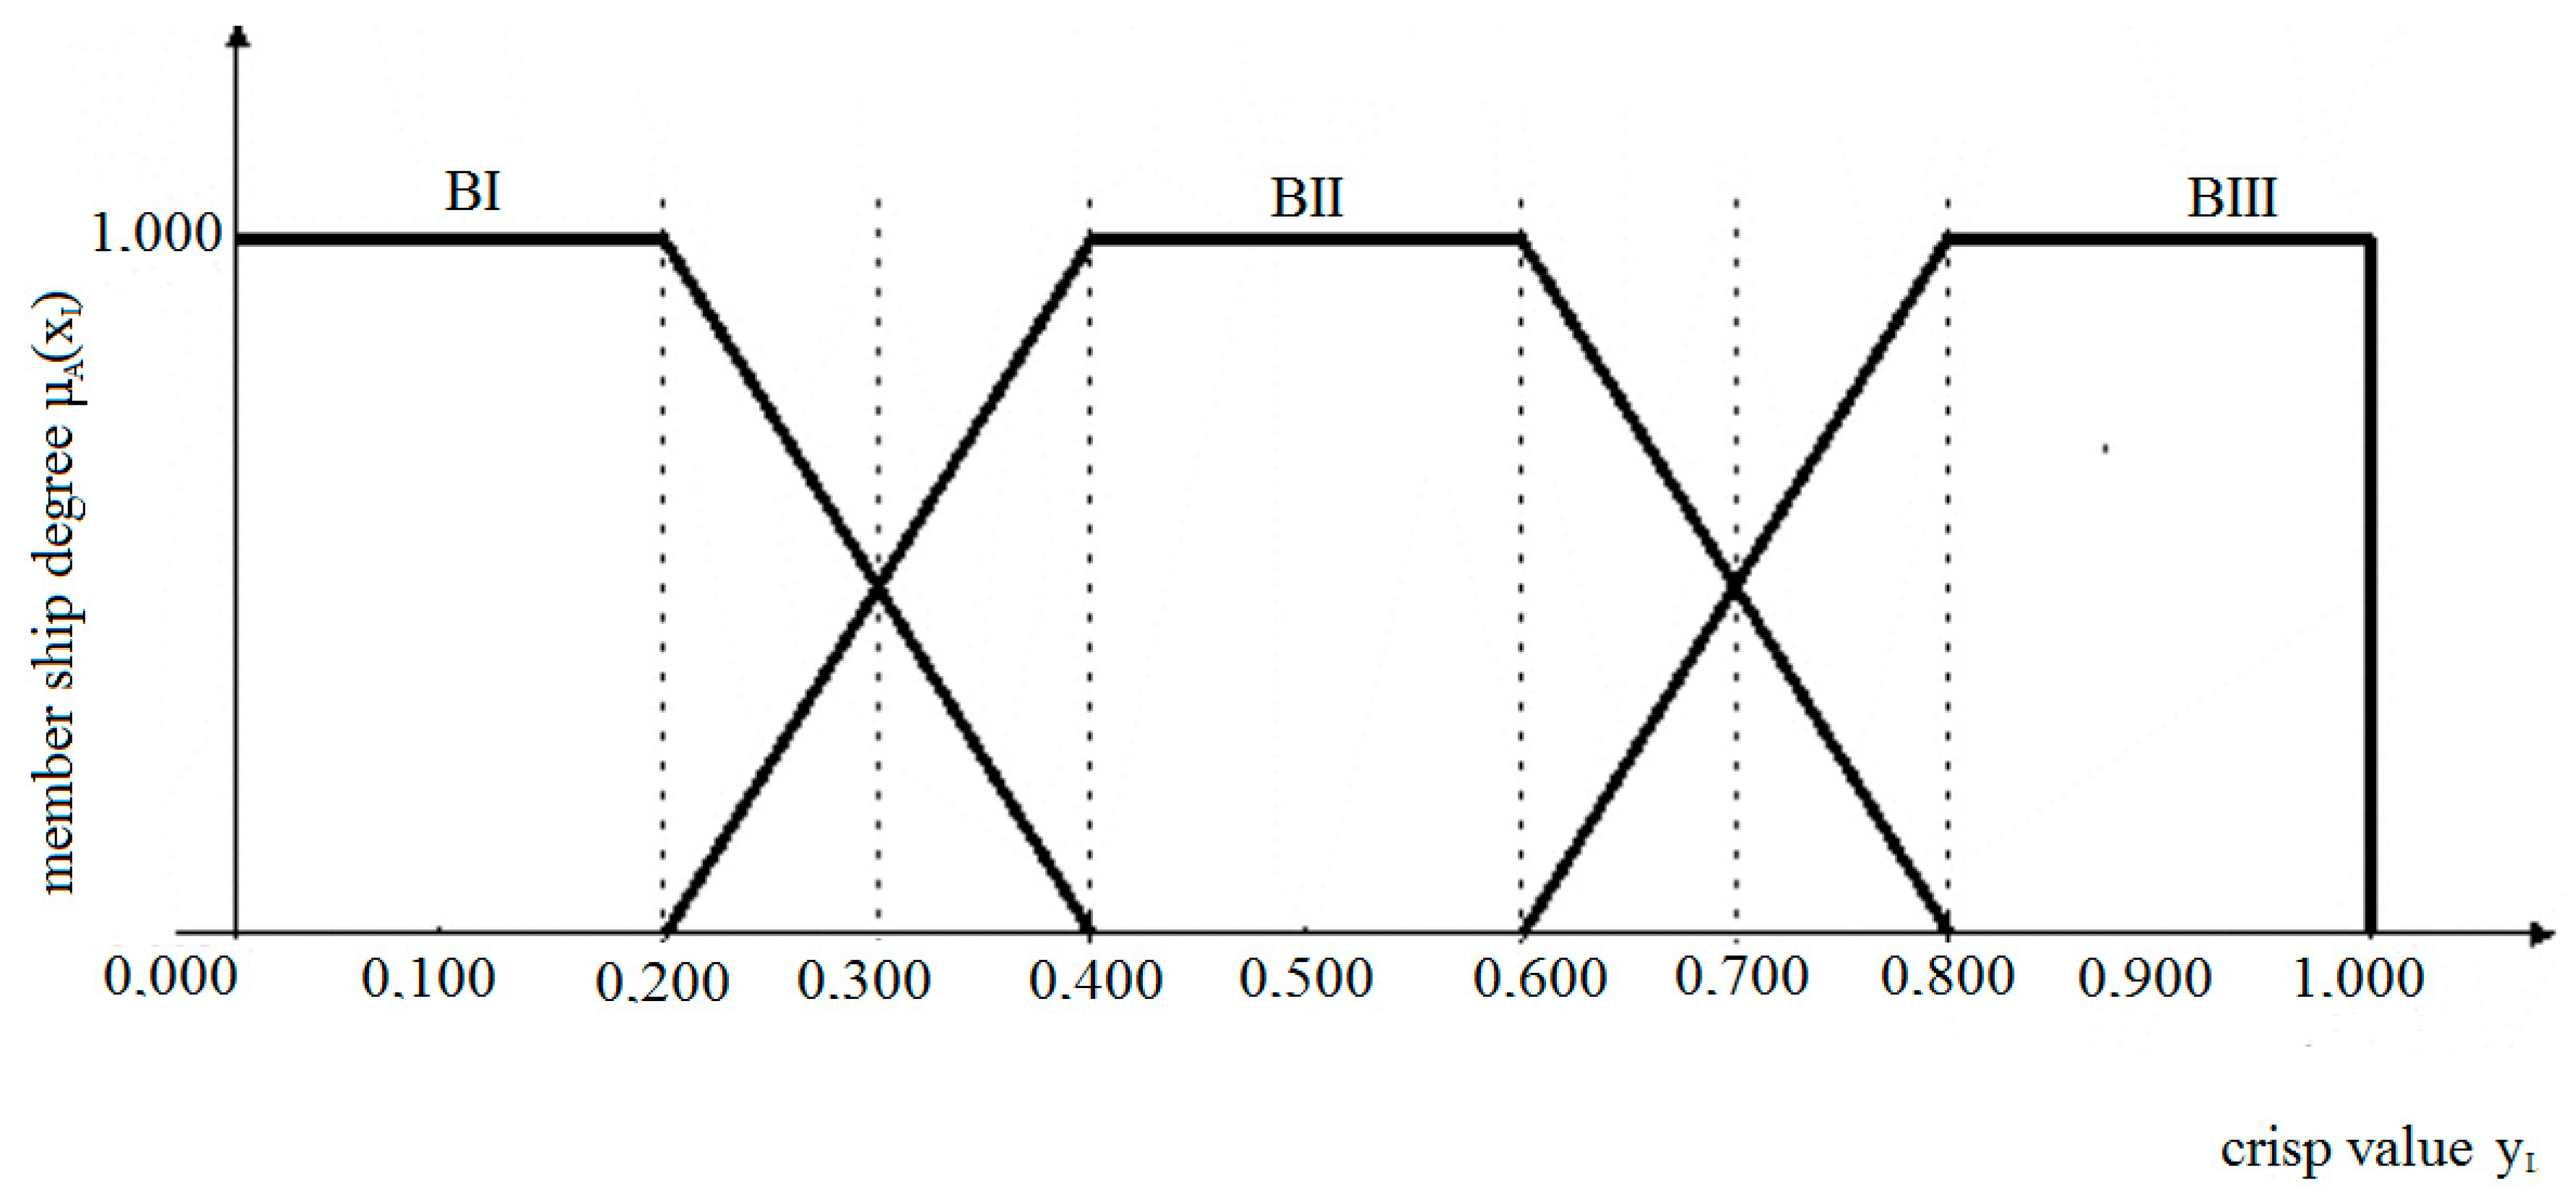
Defuzzification is the next stage of fuzzy logic modelling. It includes the process of importing the fuzzy set B(y) to one value y ¯ . This process constitutes the output from the inference block, being simultaneously a numerical value of the preference in the decision-making processes. The result is the output from the entire fuzzy logic model. The output set B(y) contains three terms (Figure 4). Each of them expresses a final linguistic assessment of the service characteristics: set BI—unsuitable service, set BII—optimal service, set BIII—very good service.
In the applied method of supporting decision-making processes for choosing a service workshop, the method of the middle maximum was applied (MOM), in which for the severe representative y ¯ F O M of the fuzzy set of the ultimate conclusion we assume the lowest yi. This value corresponds to the maximum membership degree μ B ( y i ) .
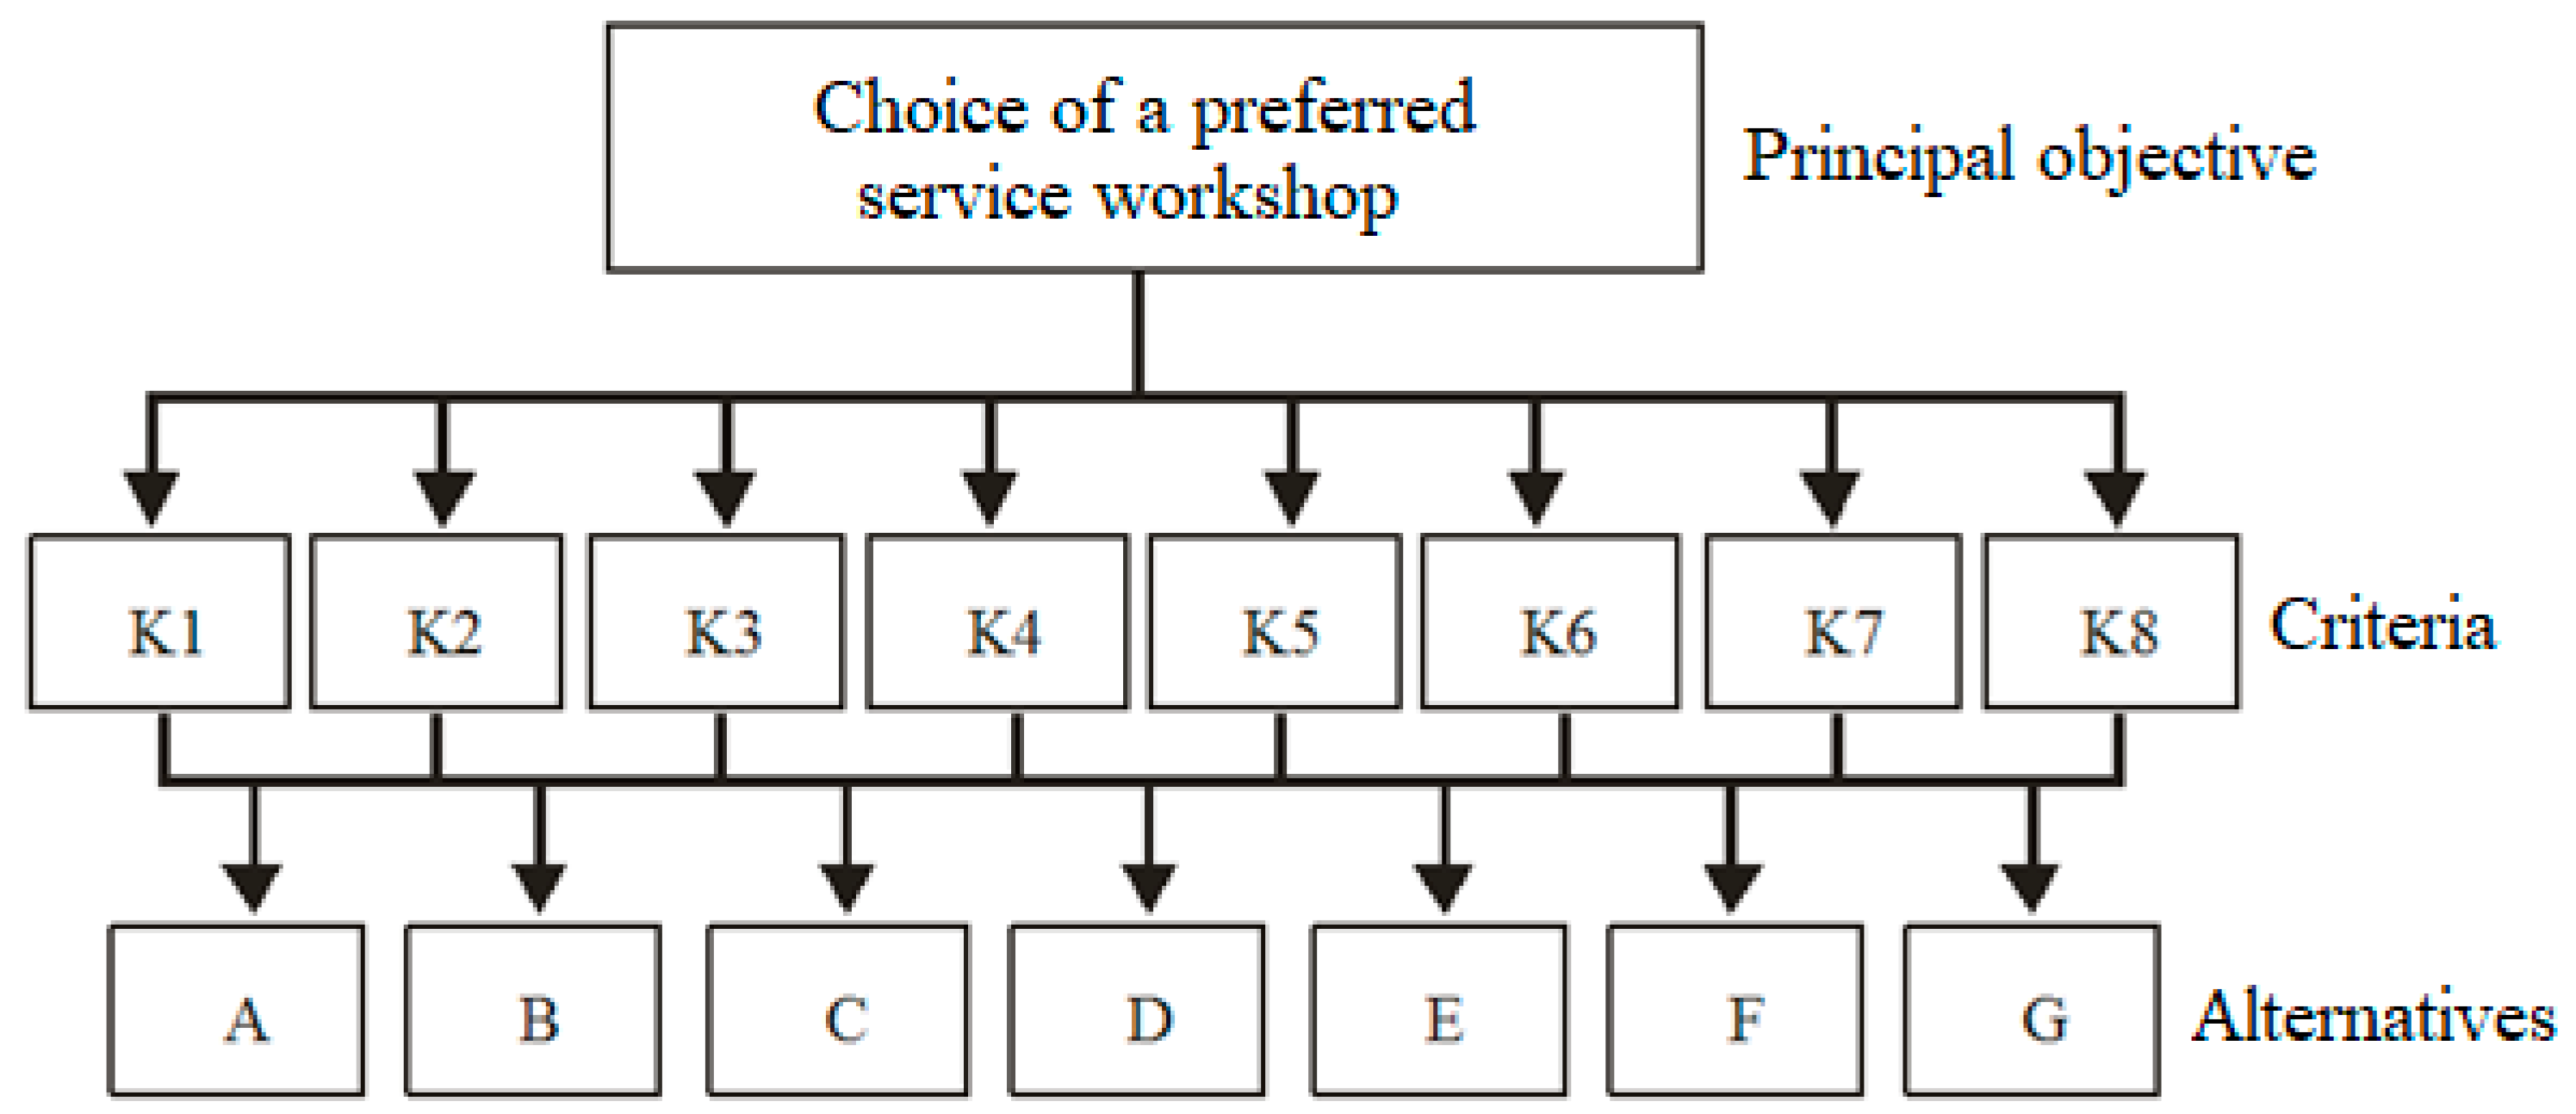
The problem of the due assortment of service workshops is presented in Figure 5. Choosing the most advantageous solution was a main aim of the method, including established criteria such as quality, promptness, and prices of provided services.
For fulfilling the purpose of this work, research was performed among a group of 25 farmers (F1, F2, F3, …, F25) who had bought some kind of agricultural machine with an engine. These machines are not already covered under warranty by the producer, so farmers are faced with the choice of a service workshop (not authorized), including preventive action connected with the exchange of exploitative liquids. For the research, seven prestigious service workshops were chosen. Hereinafter, they are denoted service workshop 1 (A), service workshop 2 (B), service workshop 3 (C), service workshop 4 (D), service workshop 5 (E), service workshop 6 (F), and service workshop 7 (G).
Farmers choosing a service workshop use the following main criteria: Price of the provided services (K1), mobility of the service workshop (K2), access to spare parts (K3), number of qualified mechanics (K4), modern diagnostic tools (K5), distance of the service workshop (K6), quality of provided services (K7), and opinion of other farmers (K8).
The last stage of the study was to check the satisfaction of the farmers participating in the study. We checked how many farmers chose the service facility in accordance with the decision support suggestion. In this way, two groups of farmers were obtained. One group consisted of farmers who chose the most optimal service workshop (according to the above methodology). The second group was made up of farmers who chose another service workshop. All farmers could allocate the appropriate number of up to 10 points to indicate their opinion; the higher the number, the greater their satisfaction with the process of choosing a service facility.
3. Results

Farmers allotted ranks to the decision-making criteria, dividing up 100 points. Each of the farmers, according to their knowledge and experience, awarded the appropriate number of points to each of the decision criteria. As shown in Table 1, farmers granted the largest average number of points to the criterion K1, that is, the price of provided services (31.4 points); however, the smallest average number of points (4.8 points) was granted to criterion K8—the opinion of other farmers.
Next, considering the adopted criteria, they awarded a specific number of points in the range from 0 to 10 to the analyzed service workshops. The allotted point values are presented in Table 2. For example, farmers for service center A in relation to the K1 criterion assigned a sum of 190 points—this is the sum of the ratings assigned by all farmers to Service A based on decision criterion K1 (the maximum possible number of points is 250—25 farmers giving 10 points each).
Based on the quotient relative to the maximum number of points, we calculated indices of preference. These are presented in Table 3. Every analyzed service workshop has several indices of preference corresponding to how many criteria were adopted for its evaluation. For example, for service facility A in relation to criterion K4, farmers allocated a total of 69 points, and the maximum number of points possible is 250. The preference index, being the quotient of the obtained (69) and the maximum (250) number of points is 0.248.
Table 4 also presents the weight values of decision criteria and the fuzzy set shift values based on them. When calculating the offset value, the number of input terms was also taken into account. The offset values reflect the global importance of the main decision criteria, which is why the shift in terms of the input function of the service workshop decision-making process results in greater degrees of belonging for criteria that received a higher rating in the ranking process. The values presented in Table 4 (criterion importance) result from assessment of the importance of the criteria presented in Table 1. The shift value in accordance with the adopted methodology is half of the importance of the decision criteria.
Taking into account the preference indices of criteria for every service workshop and moving values of input sets, the membership degrees of the fuzzy set input values in the model of decision-making processes were appointed. The results are presented in Table 5. For example, service facility A in relation to criterion K2 (access to spare parts) with grade 0.845 belongs to the collection “good access to spare parts,” and at the same time the degree of 0.155 belongs to the collection “bad access to spare parts.”
The rule database was developed at the stage of building the decision support system. All illogical rules were rejected (for example, IF all the characteristics of the service workshop are bad THEN the service workshop is good). The values of the input functions of belonging in the fuzzy model were used (based on the rule base) in the further part of fuzzy inference. Using the base rules, the input values of the membership function were marked for each of the service workshops. In Figure 6 an indicator of the preference is described for one of the service workshops.
In Table 6, the results of calculations of the indicator value of the decision-making processes for the analyzed service workshops are presented.
As shown in the table above, service center E is the most optimal choice. The obtained results were presented to all farmers participating in the research. Then, after the time related to the technical maintenance of the machines, repeated tests were carried out among the farmers. The research concerned satisfaction with the selected service workshop. Out of all 25 farmers, 16 chose service workshop E as suggested. The other farmers (9 farmers) chose other service workshops. Table 6 shows the results of farmers’ satisfaction with the choice of service facility E. Table 7, in turn, shows the results of farmers’ satisfaction with the choice of other service workshops. All farmers gave a score of satisfaction with the selected service facility on a scale of 1–10. The closer the number of points awarded to the number 10, the better their opinion of the selected service facility.
The conducted tests prove the effectiveness of the method. According to the data presented in Table 7, the average opinion score of the selected service workshop (service workshop E) is 8.25. When other service workshops were selected, the average opinion score allocated was only 6.7 (Table 8).

4. Conclusions

The research and analysis conducted allow us to form the following conclusions:
  • Service facility E attained the highest decision index value, which means that this choice is the most optimal.
  • The analyses carried out allow us to define the criteria for choosing a service facility. In the above case, the decision-makers expect satisfactory service quality at an acceptable price.
  • The proposed decision support method for choosing an optimal service facility allows us to determine the value of the decision indicator (being a numerical value) for all selection options, which allows for the comparison of both measurable and non-measurable decision criteria.
  • The results from the conducted analysis show that such criteria as the price of the after-sales service and the quality of the provided after-sales service are most important for farmers. They expect decent quality of services at a reasonable price.
  • The alteration of input sets of the fuzzy logic model allows us to take into account the importance of the optimum choice criteria of the service center, because pungent values for criteria with greater weight fixtures will obtain a large degree in the fuzzification module.

Author Contributions

Conceptualization: E.O., A.O.; methodology: A.O., E.O., P.R.; software: A.O., A.P.; validation: E.O., A.O.; formal analysis: E.O., A.O.; investigation: E.O., A.O.; resources: A.O., E.O.; data curation: A.P., A.O.; writing—original draft preparation: E.O., A.O., P.R., P.P.; writing—review and editing: A.O., P.R.; visualization: A.O., R.K., P.P.; supervision: E.O., P.R.; project administration: E.O., P.R.; All authors have read and agreed to the published version of the manuscript.

Funding

This research received no external funding.

Conflicts of Interest

The authors acknowledge the use of SCAPS program developed by Burgelman’s group of the University of Ghent, Belgium. In addition, the authors would like to thank National Supercomputing Center in Shenzhen for providing simulation calculation support.

References

  1. Sims, B.; Kienzle, J. Sustainable Agricultural Mechanization for Smallholders: What Is It and How Can We Implement It? Agriculture 2017, 7, 50. [Google Scholar] [CrossRef] [Green Version]
  2. Osuch, A.; Rybacki, P.; Osuch, E.; Szulc, R.; Szwedziak, K. Dynamic analysis of selected agricultural machinery price changes in the years 2011-2015. Intercathedra 2015, 31, 73–83. [Google Scholar]
  3. Rybacki, P.; Rzeźnik, C.; Durczak, K. The results of research on the dynamics of machinery park renewal in agriculture. Tech. Rol. Ogrod. Leśna 2011, 1, 20–21. (In Polish) [Google Scholar]
  4. Kusz, A.; Marciniak, A.; Skwarcz, J. Implementation of computation process in a bayesian network on the example of unit operating costs determination. Maint. Reliab. 2015, 17, 266–272. [Google Scholar] [CrossRef] [Green Version]
  5. Juściński, S.; Piekarski, W. The farm vehicles operation in the aspect of the structure Of demand for maintenance inspections. Maint. Reliab. 2010, 1, 59–68. [Google Scholar]
  6. Pelitli, V.; Dogan, Ö.; Köroglu, H.J. Waste oil management: Analyses of waste oils from vehicle crankcases and gearboxes. Glob. J. Environ. Sci. Manag. 2017, 3, 11–20. [Google Scholar] [CrossRef]
  7. Wolak, A. TBN performance study on a test fleet in real-world driving conditions using present-day engine oils. Measurement 2018, 114, 322–331. [Google Scholar] [CrossRef]
  8. Feng, S.; Fan, B.; Mao, J.; Xie, Y. Prediction on wear of a spur gearbox by on-line wear debris concentration monitoring. Wear 2018, 336–337, 1–8. [Google Scholar] [CrossRef]
  9. Gupta, S.; Khosravy, M.; Gupta, N.; Darbari, H. In-field failure assessment of tractor hydraulic system operation via pseudospectrum of acoustic measurements. Turk. J. Electr. Eng. Comput. Sci 2019, 27, 2718–2729. [Google Scholar]
  10. Gupta, S.; Khosravy, M.; Gupta, N.; Darbari, H.; Patel, N. Hydraulic System Onboard Monitoring and Fault Diagnostic in Agricultural Machine. Braz. Arch. Biol. Technol. 2019, 62, e19180363, Epub 24 October 2019. [Google Scholar] [CrossRef]
  11. Li, W.; Yan, Q.; Xue, J. Analysis of a crankshaft fatigue failure. Eng. Fail. Anal. 2015, 55, 139–147. [Google Scholar] [CrossRef]
  12. Cao, W.; Dong, G.; Chen, W.; Wu, J.; Xie, Y.B. Multisensor information integration for online wear condition monitoring of diesel engines. Tribol. Int. 2015, 82, 68–77. [Google Scholar] [CrossRef]
  13. Cao, W.; Dong, G.; Xie, Y.B.; Peng, Z. Prediction of wear trend of engines via on-line wear debris monitoring. Tribol. Int. 2018, 120, 510–519. [Google Scholar] [CrossRef]
  14. Fan, B.; Li, B.; Feng, S.; Mao, J.; Xie, Y.B. Modeling and experimental investigations on the relationship between wear debris concentration and wear rate in lubrication systems. Tribol. Int. 2017, 109, 114–123. [Google Scholar] [CrossRef] [Green Version]
  15. Antosz, K.; Stadnicka, D. The results of the study concerning the identification of the activities realized in the management of the technical infrastructure in large enterprises. Maint. Reliab. 2014, 16, 112–119. [Google Scholar]
  16. Caneca, A.R.; Pimentel, M.F.; Galvao, R.K.H.; Matta, C.E.; De Carvalho, F.R.; Raimundo, I.M.; Pasquini, C.; Rohwedder, J.J.R. Assessment of infrared spectroscopy and multivariate techniques for monitoring the service condition of diesel-engine lubricating oils. Talanta 2006, 70, 344–352. [Google Scholar] [CrossRef]
  17. Macian, V.; Tormos, B.; Olmeda, P.; Montoro, L. Analytical approach to wear rate determination for internal combustion engine condition monitoring based on oil analysis. Tribol. Int. 2013, 36, 771–776. [Google Scholar] [CrossRef]
  18. Macian, V.; Tormos, B.; Ruiz, S.; Miró, G. Low viscosity engine oils: Study of wear effects and oil key parameters in a heavy duty engine fleet test. Tribol. Int. 2016, 94, 240–248. [Google Scholar] [CrossRef]
  19. Papageorgiou, E.I.; Kokkinos, K.; Dikopoulou, Z. Fuzzy Sets in Agriculture. In Fuzzy Logic in Its 50th Year. Studies in Fuzziness and Soft Computingi; Kahraman, C., Kaymak, U., Yazici, A., Eds.; Springer: Cham, Switzerland, 2016; Volume 341. [Google Scholar] [CrossRef]
  20. Corrado, S.; Castellani, V.; Zampori, L.; Sala, S. Systematic analysis of secondary life cycle inventories when modelling agricultural production: A case study for arable crops. J. Clean. Prod. 2018, 172, 3990–4000. [Google Scholar] [CrossRef]
  21. Notarnicola, B.; Sala, S.; Anton, A.; McLaren, S.J.; Saouter, E.; Sonesson, U. The role of life cycle assessment in supporting sustainable agri-food systems: A review of the challenges. J. Clean. Prod. 2017, 140, 399–409. [Google Scholar] [CrossRef]
  22. Hamzeh, S.; Mokarram, M.; Haratian, A.; Bartholomeus, H.; Ligtenberg, A.; Bregt, A.K. Feature Selection as a Time and Cost-Saving Approach for Land Suitability Classification (Case Study of Shavur Plain, Iran). Agriculture 2016, 6, 52. [Google Scholar] [CrossRef] [Green Version]
  23. Ly, H.; Le, L.; Phi, L.; Phan, V.; Tran, V.; Pham, B.; Le, T.; Derrible, S. Development of an AI Model to Measure Traffic Air Pollution from Multisensor and Weather Data. Sensors 2019, 19, 4941. [Google Scholar] [CrossRef] [Green Version]
  24. Osuch, E.; Osuch, A.; Rybacki, P.; Przybylak, A.; Buchwald, T. Analysis of the factors influencing the decision about segregation by people not segregating the municipal waste with using the AHP method. J. Ecol. Eng. 2016, 17, 255–263. [Google Scholar] [CrossRef] [Green Version]
  25. Mokarram, M.; Najafi-Ghiri, M. Combination of Fuzzy Logic and Analytical Hierarchy Process Techniques to Assess Potassium Saturation Percentage of Some Calcareous Soils (Case Study: Fars Province, Southern Iran). Agriculture 2016, 6, 59. [Google Scholar] [CrossRef] [Green Version]
  26. Lin, Y.; Hua, K.; Lu, H.; Sun, W.; Chen, Y. An Adaptive Exposure Fusion Method Using Fuzzy Logic and Multivariate Normal Conditional Random Fields. Sensors 2019, 19, 4743. [Google Scholar] [CrossRef] [PubMed] [Green Version]
  27. Moayedi, H.; Bui, D.; Foong, L. Slope Stability Monitoring Using Novel Remote Sensing Based Fuzzy Logic. Sensors 2019, 19, 4636. [Google Scholar] [CrossRef] [Green Version]
  28. Zadeh, L.A. Fuzzy sets. Inf. Control 1965, 8, 338–353. [Google Scholar] [CrossRef] [Green Version]
  29. Zadeh, L.A. Fuzzy Logic. Computer 1988, 1, 83–93. [Google Scholar] [CrossRef]
  30. Osuch, E.; Osuch, A.; Podsiadłowski, S.; Piechnik, L.; Chwirot, D. Project of coagulant dispenser in pulverization aerator with wind drive. J. Ecol. Eng. 2017, 18, 192–198. [Google Scholar] [CrossRef]
Figure 1. The structure of a fuzzy model of the service workshop selection process.
Agriculture 10 00076 g001
Figure 2. Membership functions of input sets A-i of the fuzzy model.
Agriculture 10 00076 g002
Figure 3. Modified membership functions of input sets A ¯ i of the fuzzy model.
Agriculture 10 00076 g003
Figure 4. Membership functions of output set B(yi).
Agriculture 10 00076 g004
Figure 5. Hierarchical structure of the process of choosing a service workshop.
Agriculture 10 00076 g005
Figure 6. Accumulation membership functions of output set B(y).
Agriculture 10 00076 g006
Table 1. Evaluation of the importance of the adopted criteria.
Farmer Number0–100 Points
K1K2K3K4K5K6K7K8
R15055555250
R24555555255
R3251010101010250
R42010101010102010
R550200000300
R655155551050
R78500000150
R870000015150
R925555525255
R101510101510151510
R111015151510101510
R120000001000
R1301515150152515
R1415251501515015
R1540300000300
R1650205551050
R173055555405
R18301010101015150
R1925555520305
R201010101510152010
R21151515151010155
R221000000900
R2355555253515
R24152010101020510
R25905000050
Average of points31.410.66.46.25.410.225.24.8
Table 2. Evaluation of the service divisions and hierarchy of decision-making criteria.
Summary Evaluation of Service Workshops (0–10 Points)K1K2K3K4K5K6K7K8
A19070696247343652
B9168787264616167
C5586857676499669
D321059290562713286
E82807868576010565
F20374766652354956
G19848544540379963
Table 3. Indices of preference for service centers.
Preference IndicesK1K2K3K4K5K6K7K8
A0.7600.2800.2760.2480.1880.1360.1440.208
B0.3640.2720.3120.2880.2560.2440.2440.268
C0.2200.3440.3400.3040.3040.1960.3840.276
D0.1280.4200.3680.3600.2240.1080.5280.344
E0.3280.3200.3120.2720.2280.2400.4200.260
F0.8120.2960.3040.2640.2080.1400.1960.224
G0.7920.1920.2160.1800.1600.1480.3960.252
Table 4. Decision-making criteria scales and shifting set of input values.
Decision-making criteria scales0.3140.1060.0640.0620.0540.1020.2520.048
Shifting set of input values0.1570.0530.0320.0310.0270.0510.1260.024
Table 5. The values of the input membership function fuzzy model.
Values of the Input Membership FunctionK1K2K3K4K5K6K7K8
A0.7600.0000.2800.8450.2760.8820.2480.9200.1880.9800.1360.9880.1440.9700.2080.965
1.0000.1550.1180.0800.0200.0120.0300.035
B0.3640.4200.2720.8580.3120.8320.2880.8600.2560.9120.2440.8920.2440.8550.2680.904
0.5800.1420.1680.1400.0880.1080.1450.096
C0.2200.7500.3440.7400.3400.7900.3040.8450.3040.8500.1960.9500.3840.5850.2760.892
0.2500.2600.2100.1550.1500.0500.4150.108
D0.1280.8850.4200.5800.3680.7300.3600.7520.2240.9490.1081.0000.5280.2700.3440.790
0.1150.4200.2700.2480.0510.0000.7300.210
E0.3280.5050.3200.7900.3120.8320.2720.8900.2280.9420.2400.8940.4200.5100.2600.914
0.4950.2100.1680.1100.0580.1060.4900.086
F0.8120.0000.2960.8220.3040.8420.2640.8930.2080.9600.1400.9840.1960.9220.2240.950
1.0000.1780.1580.1070.0400.0160.0780.050
G0.7920.0000.1920.9500.2160.9520.1800.9800.1600.9900.1480.9820.3960.5850.2520.923
1.0000.0500.0480.0200.0100.0180.4150.077
Table 6. The indicator values Dc of the service workshop selection decision-making.
Service WorkshopABCDEFG
Decision-making indicator0.11550.1420.14150.1420.14950.11780.1415
Table 7. Assessment of the selected service facility (service facility E).
Farmer NumberF1F4F5F6F8F10F11F12F13F15F18F19F20F21F22F23
Service plant E7.59.05.510.08.56.58.58.58.58.58.58.58.58.58.58.5
Table 8. Assessment of the selected service facility (other service facilities).
Farmer NumberF2F3F7F9F14F16F17F24F25
other service7.55.59.56.58.56.53.58.54.5