Conversion from Standard-Release Tacrolimus to MeltDose® Tacrolimus (LCPT) Improves Renal Function after Liver Transplantation

 ,
,
Abstract
1. Introduction
2. Materials and Methods
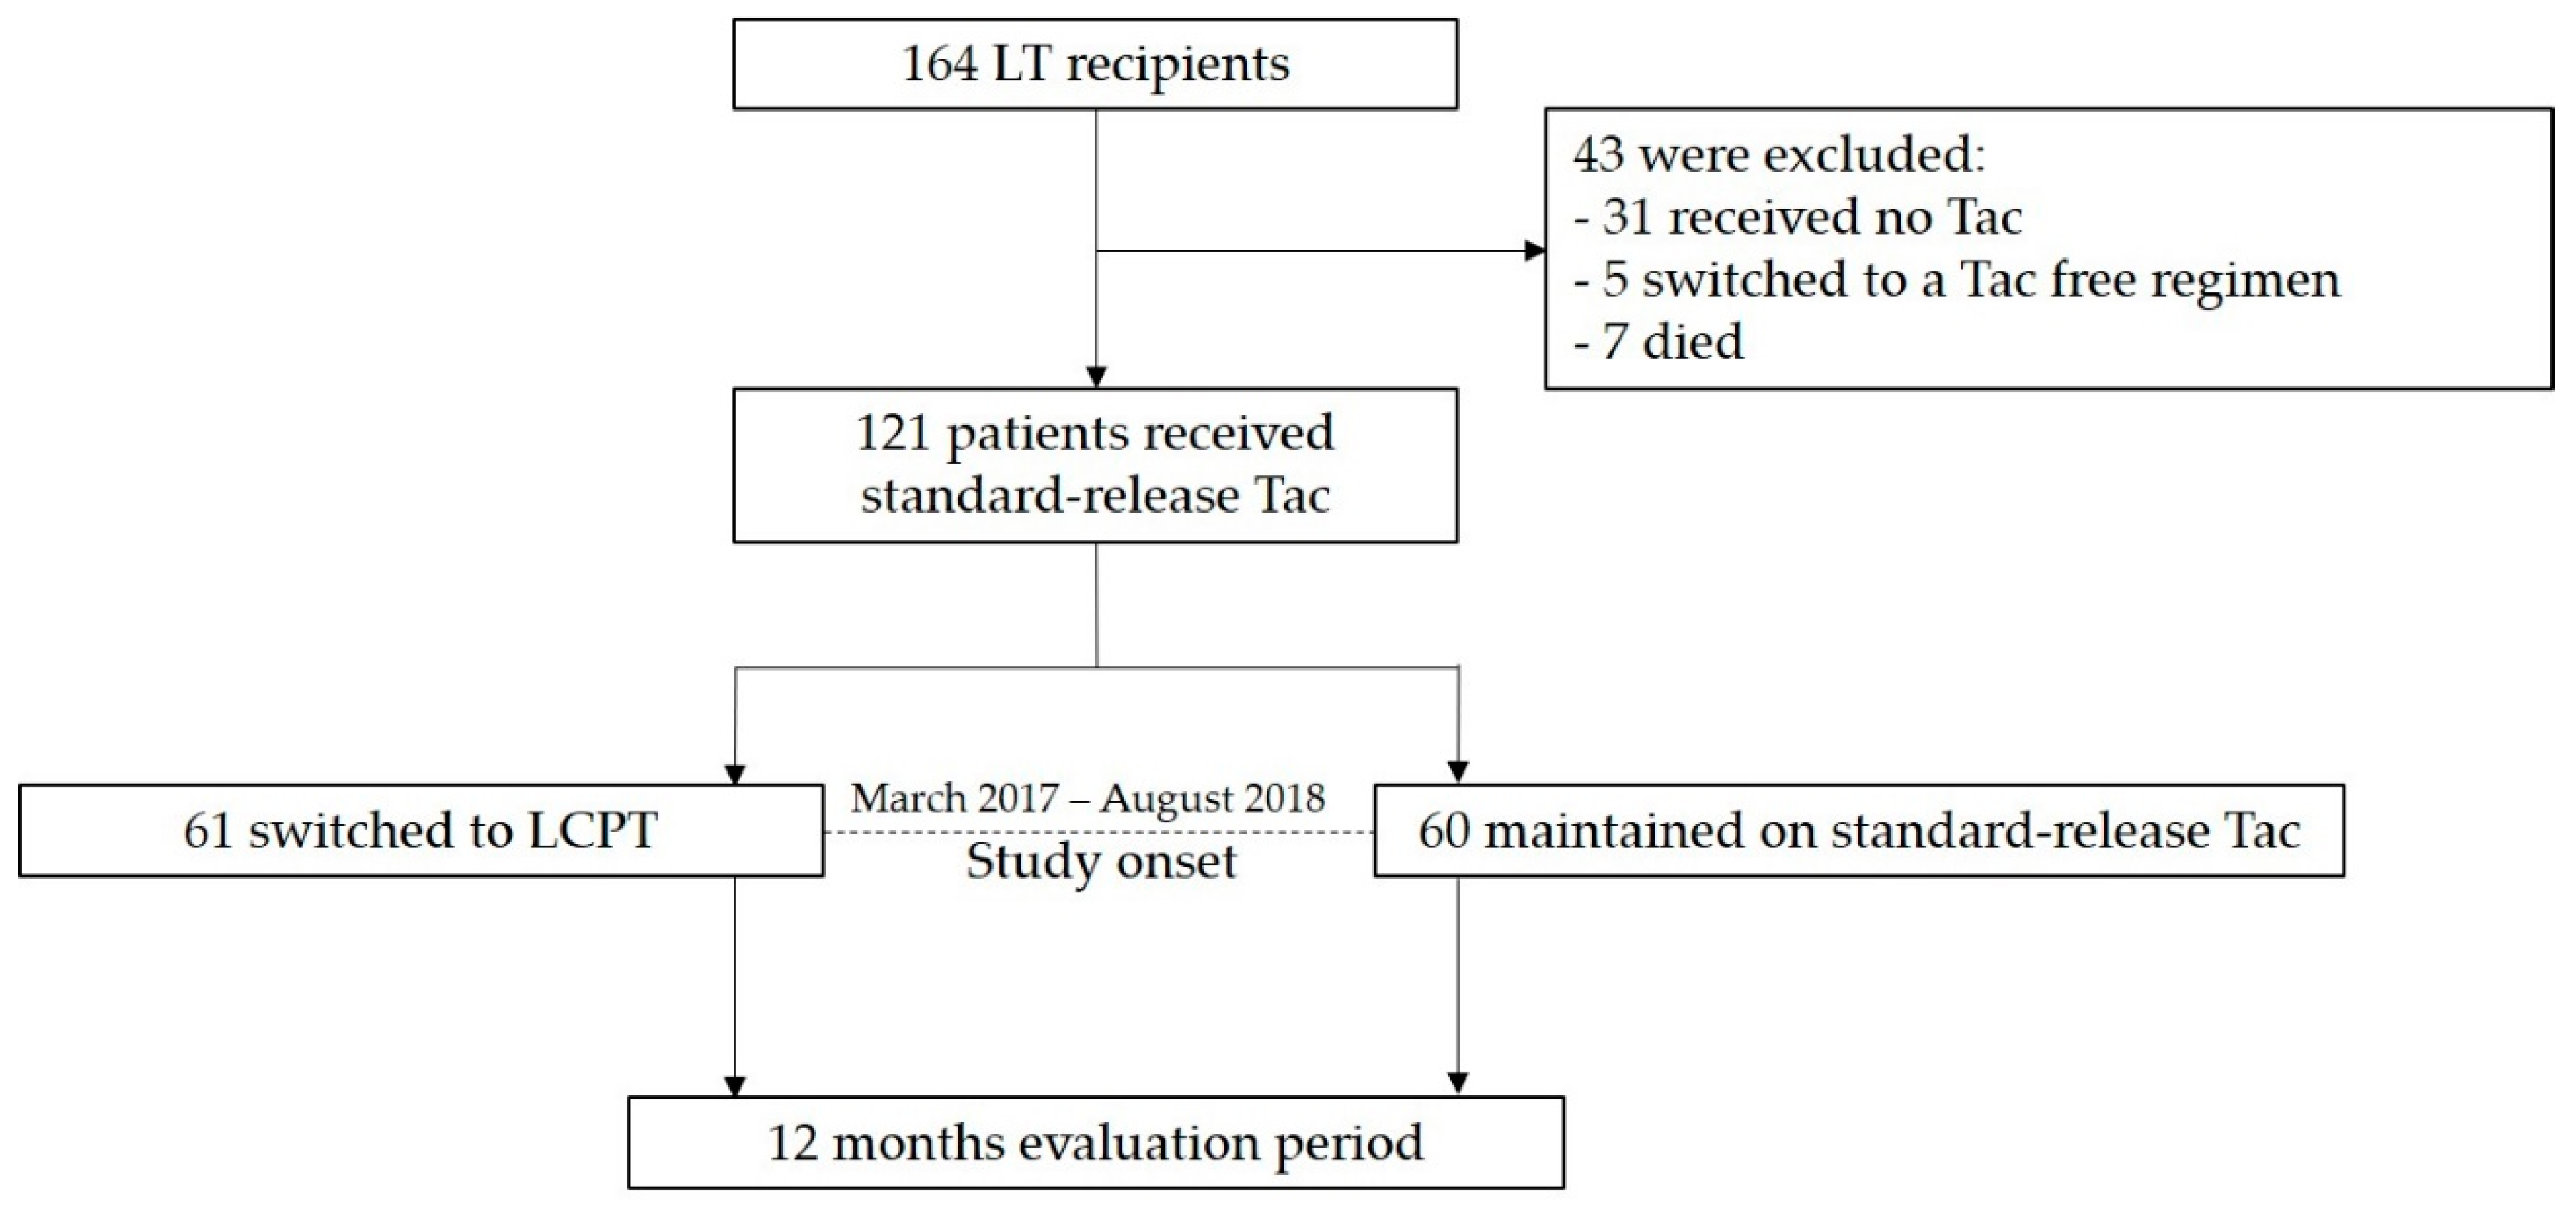
2.1. Patients and Study Design
2.2. Statistical Analysis
3. Results
3.1. Study Population
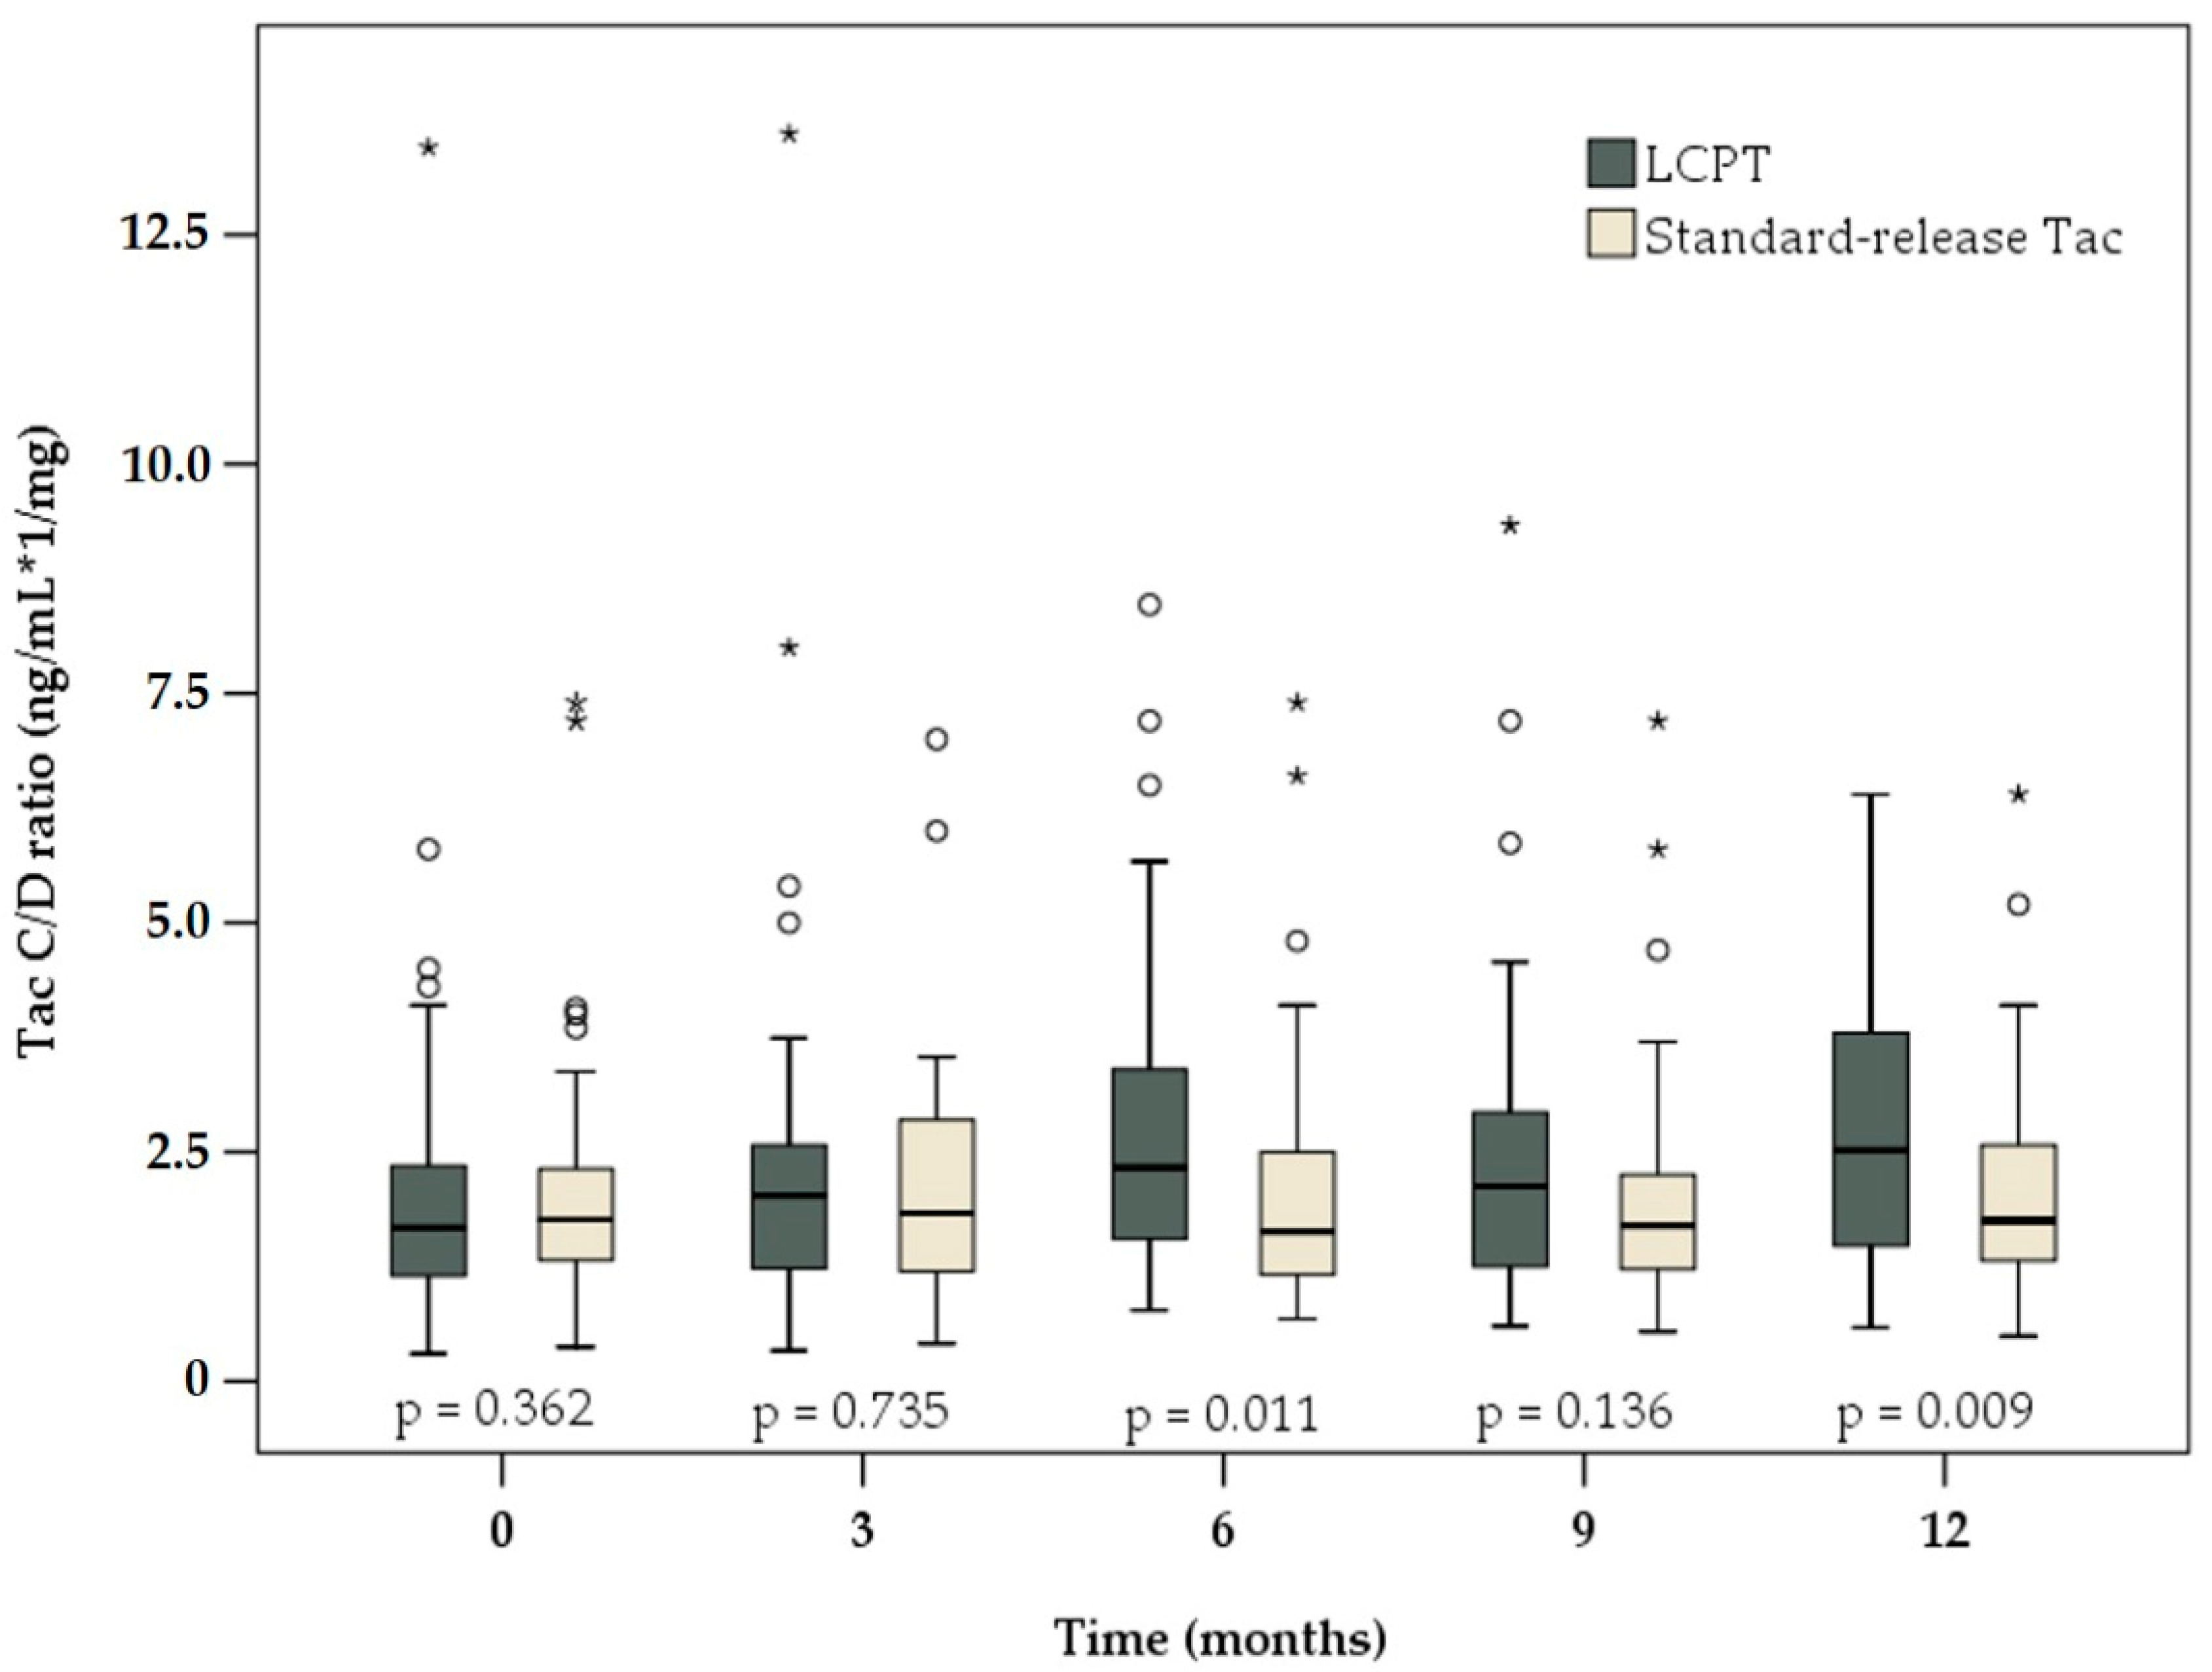
3.2. C/D Ratio
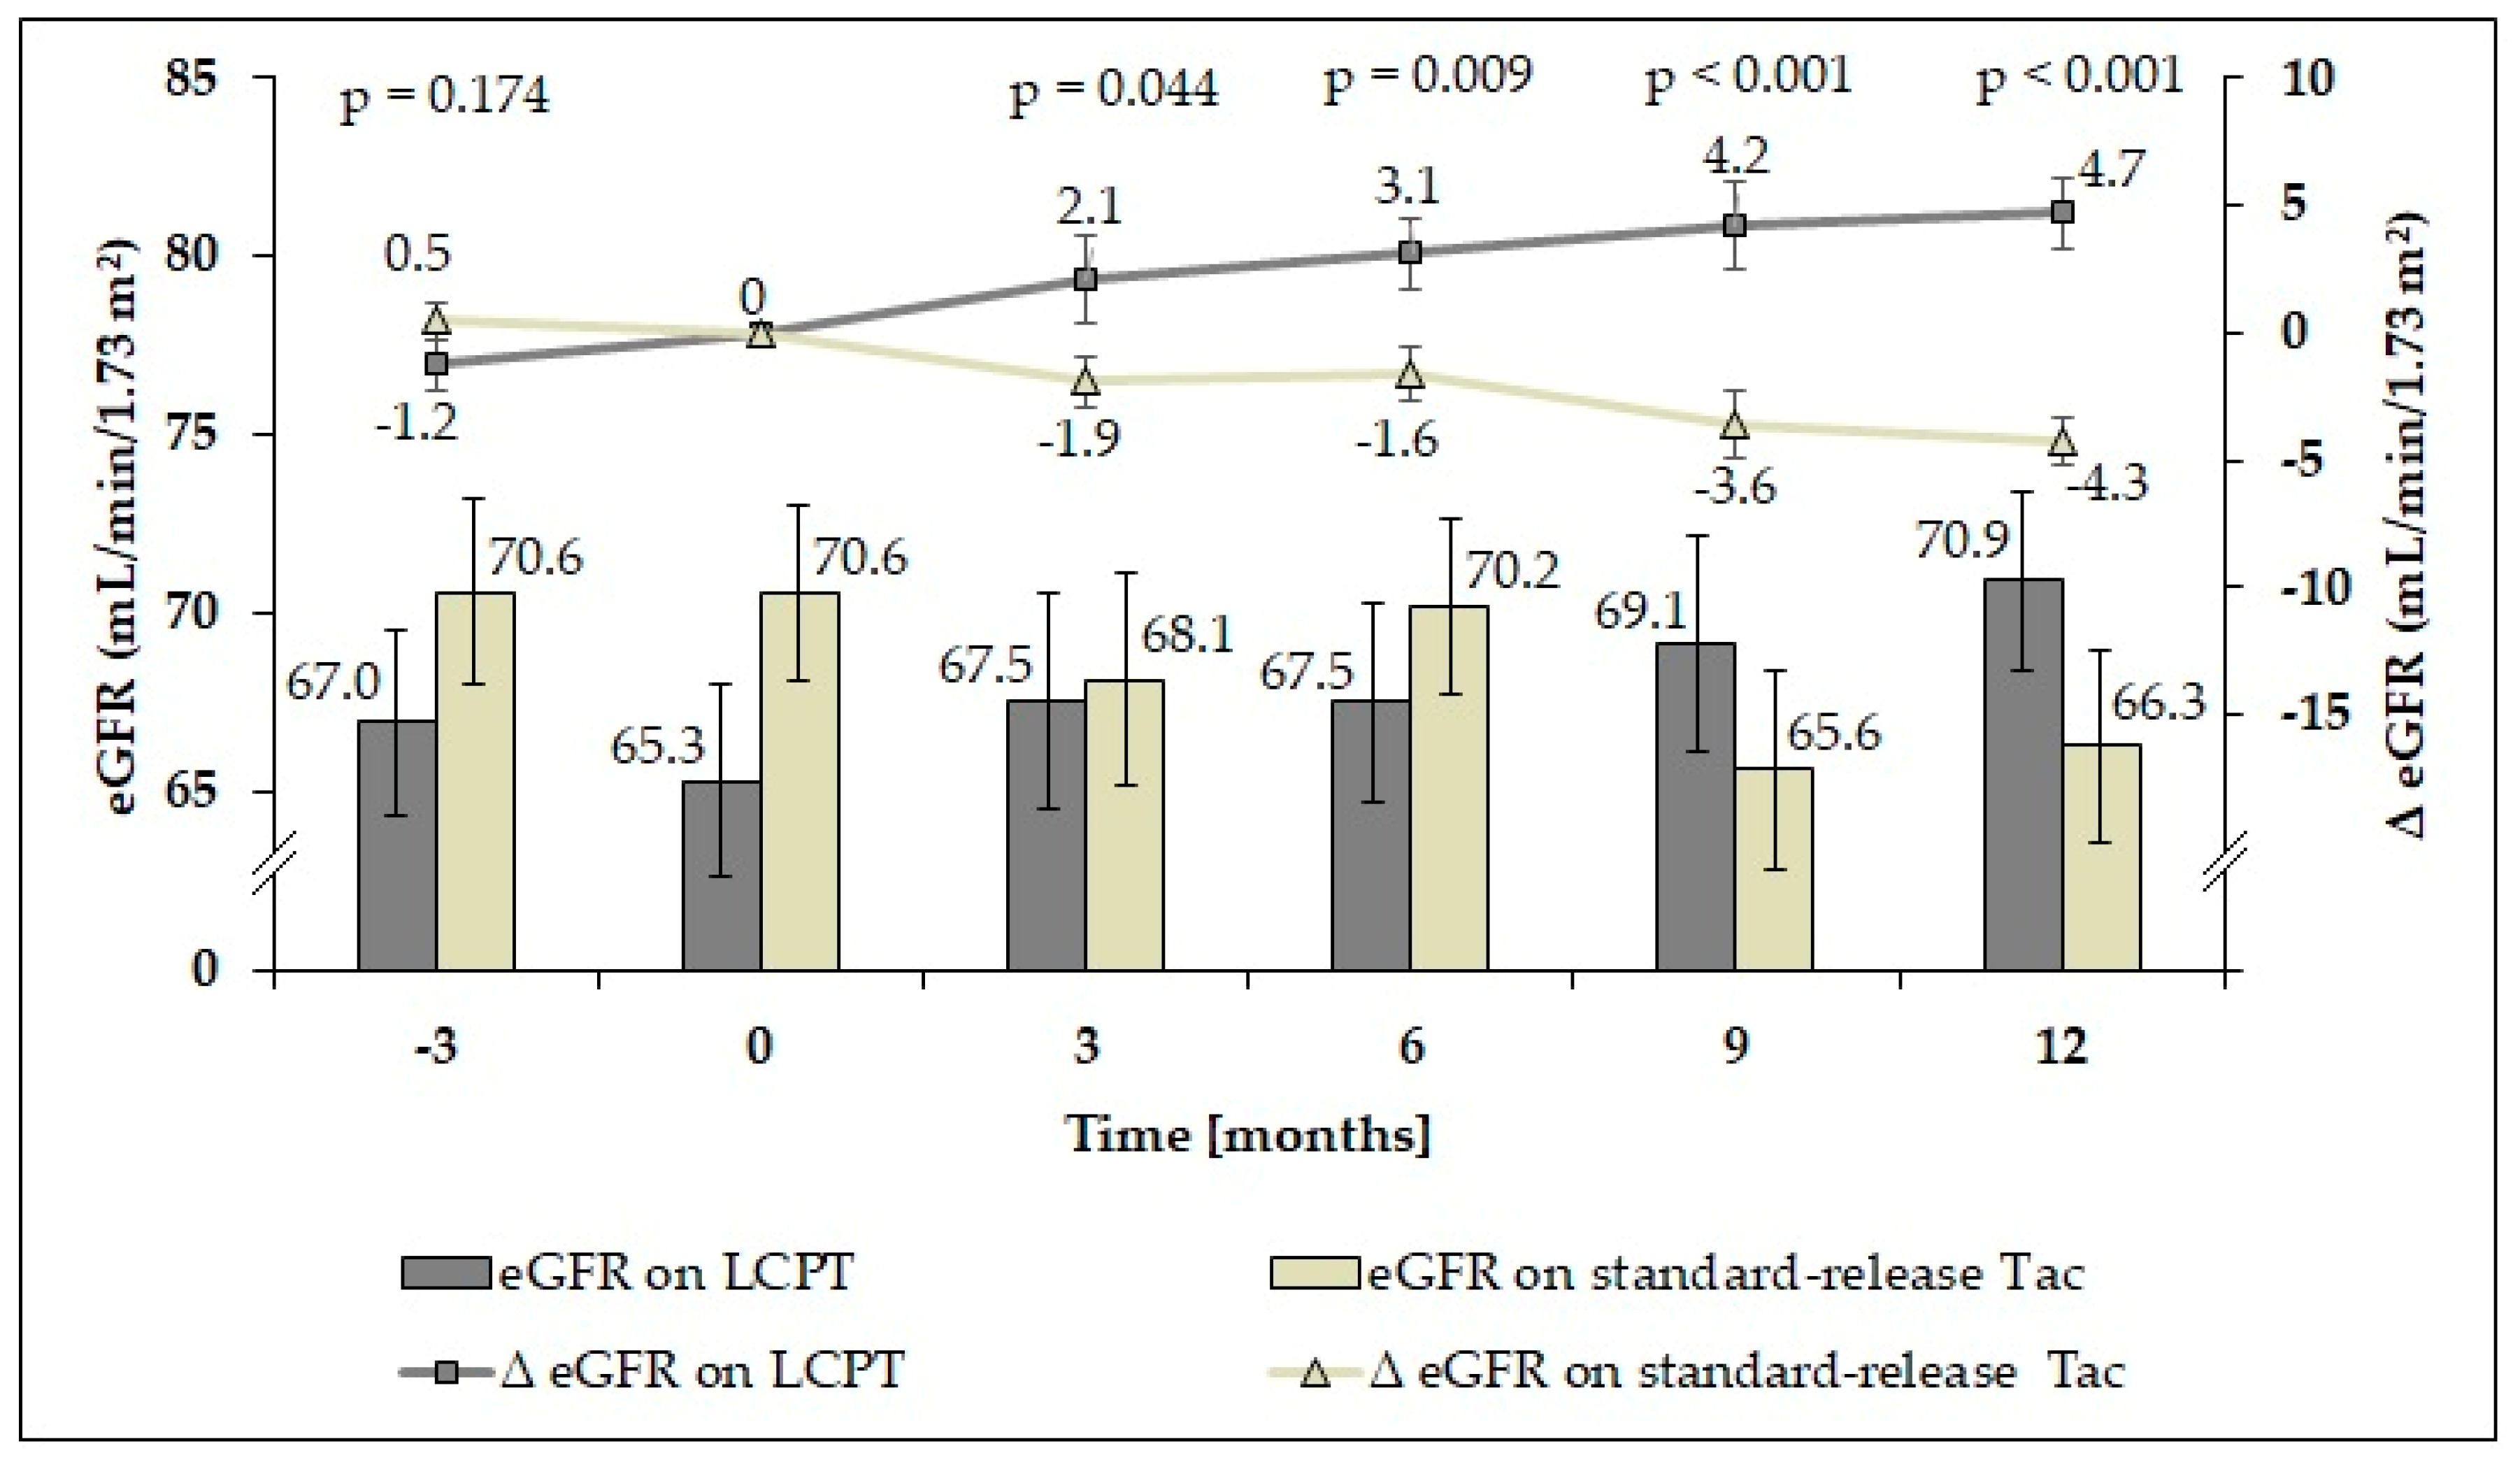
3.3. Renal Function
3.4. Liver Function
4. Discussion
5. Conclusions
Supplementary Materials
Author Contributions
Funding
Conflicts of Interest
References
- Wiesner, R.H.; Fung, J.J. Present state of immunosuppressive therapy in liver transplant recipients. Liver Transpl. 2011, 17 (Suppl. S3), S1–S9. [Google Scholar] [CrossRef]
- McAlister, V.C.; Haddad, E.; Renouf, E.; Malthaner, R.A.; Kjaer, M.S.; Gluud, L.L. Cyclosporin versus tacrolimus as primary immunosuppressant after liver transplantation: A meta-analysis. Am. J. Transplant. 2006, 6, 1578–1585. [Google Scholar] [CrossRef] [PubMed]
- European Association for the Study of the Liver. EASL Clinical Practice Guidelines: Liver transplantation. J. Hepatol. 2016, 64, 433–485. [Google Scholar] [CrossRef] [PubMed]
- O’Grady, J.G.; Hardy, P.; Burroughs, A.K.; Elbourne, D.; UK and Ireland Liver Transplant Study Group. Randomized controlled trial of tacrolimus versus microemulsified cyclosporin (TMC) in liver transplantation: Poststudy surveillance to 3 years. Am. J. Transplant. 2007, 7, 137–141. [Google Scholar] [CrossRef] [PubMed]
- Naesens, M.; Kuypers, D.R.; Sarwal, M. Calcineurin inhibitor nephrotoxicity. Clin. J. Am. Soc. Nephrol. 2009, 4, 481–508. [Google Scholar] [CrossRef] [PubMed]
- Beckebaum, S.; Cicinnati, V.R.; Radtke, A.; Kabar, I. Calcineurin inhibitors in liver transplantation - still champions or threatened by serious competitors? Liver Int. 2013, 33, 656–665. [Google Scholar] [CrossRef] [PubMed]
- Ziolkowski, J.; Paczek, L.; Senatorski, G.; Niewczas, M.; Oldakowska-Jedynak, U.; Wyzgal, J.; Sanko-Resmer, J.; Pilecki, T.; Zieniewicz, K.; Nyckowski, P.; et al. Renal function after liver transplantation: Calcineurin inhibitor nephrotoxicity. Transplant. Proc. 2003, 35, 2307–2309. [Google Scholar] [CrossRef]
- Afonso, R.C.; Hidalgo, R.; Zurstrassen, M.P.; Fonseca, L.E.; Pandullo, F.L.; Rezende, M.B.; Meira-Filho, S.P.; Ferraz-Neto, B.H. Impact of renal failure on liver transplantation survival. Transplant. Proc. 2008, 40, 808–810. [Google Scholar] [CrossRef]
- Gonwa, T.A.; Mai, M.L.; Melton, L.B.; Hays, S.R.; Goldstein, R.M.; Levy, M.F.; Klintmalm, G.B. End-stage renal disease (ESRD) after orthotopic liver transplantation (OLTX) using calcineurin-based immunotherapy: Risk of development and treatment. Transplantation 2001, 72, 1934–1939. [Google Scholar] [CrossRef]
- Kuypers, D.R.; de Jonge, H.; Naesens, M.; Lerut, E.; Verbeke, K.; Vanrenterghem, Y. CYP3A5 and CYP3A4 but not MDR1 single-nucleotide polymorphisms determine long-term tacrolimus disposition and drug-related nephrotoxicity in renal recipients. Clin. Pharmacol. Ther. 2007, 82, 711–725. [Google Scholar] [CrossRef]
- Kershner, R.P.; Fitzsimmons, W.E. Relationship of FK506 whole blood concentrations and efficacy and toxicity after liver and kidney transplantation. Transplantation 1996, 62, 920–926. [Google Scholar] [CrossRef] [PubMed]
- Tsuchiya, T.; Ishida, H.; Tanabe, T.; Shimizu, T.; Honda, K.; Omoto, K.; Tanabe, K. Comparison of pharmacokinetics and pathology for low-dose tacrolimus once-daily and twice-daily in living kidney transplantation: Prospective trial in once-daily versus twice-daily tacrolimus. Transplantation 2013, 96, 198–204. [Google Scholar] [CrossRef] [PubMed]
- Tholking, G.; Siats, L.; Fortmann, C.; Koch, R.; Husing, A.; Cicinnati, V.R.; Gerth, H.U.; Wolters, H.H.; Anthoni, C.; Pavenstadt, H.; et al. Tacrolimus Concentration/Dose Ratio is Associated with Renal Function After Liver Transplantation. Ann. Transplant. 2016, 21, 167–179. [Google Scholar] [CrossRef] [PubMed]
- Tholking, G.; Fortmann, C.; Koch, R.; Gerth, H.U.; Pabst, D.; Pavenstadt, H.; Kabar, I.; Husing, A.; Wolters, H.; Reuter, S.; et al. The tacrolimus metabolism rate influences renal function after kidney transplantation. PLoS ONE 2014, 9, e111128. [Google Scholar] [CrossRef] [PubMed]
- Rancic, N.; Dragojevic-Simic, V.; Vavic, N.; Kovacevic, A.; Segrt, Z.; Draskovic-Pavlovic, B.; Mikov, M. Tacrolimus concentration/dose ratio as a therapeutic drug monitoring strategy: The influence of gender and comedication. Vojnosanit. Pregl. 2015, 72, 813–822. [Google Scholar] [CrossRef] [PubMed]
- Tholking, G.; Schutte-Nutgen, K.; Schmitz, J.; Rovas, A.; Dahmen, M.; Bautz, J.; Jehn, U.; Pavenstadt, H.; Heitplatz, B.; Van Marck, V.; et al. A Low Tacrolimus Concentration/Dose Ratio Increases the Risk for the Development of Acute Calcineurin Inhibitor-Induced Nephrotoxicity. J. Clin. Med. 2019, 8, 1586. [Google Scholar] [CrossRef]
- Schutte-Nutgen, K.; Tholking, G.; Steinke, J.; Pavenstadt, H.; Schmidt, R.; Suwelack, B.; Reuter, S. Fast Tac Metabolizers at Risk (-) It is Time for a C/D Ratio Calculation. J. Clin. Med. 2019, 8, 587. [Google Scholar] [CrossRef]
- Egeland, E.J.; Robertsen, I.; Hermann, M.; Midtvedt, K.; Storset, E.; Gustavsen, M.T.; Reisaeter, A.V.; Klaasen, R.; Bergan, S.; Holdaas, H.; et al. High Tacrolimus Clearance Is a Risk Factor for Acute Rejection in the Early Phase After Renal Transplantation. Transplantation 2017, 101, e273–e279. [Google Scholar] [CrossRef]
- Nowicka, M.; Gorska, M.; Nowicka, Z.; Edyko, K.; Edyko, P.; Wislicki, S.; Zawiasa-Bryszewska, A.; Strzelczyk, J.; Matych, J.; Kurnatowska, I. Tacrolimus: Influence of the Posttransplant Concentration/Dose Ratio on Kidney Graft Function in a Two-Year Follow-Up. Kidney Blood Press. Res. 2019, 44, 1075–1088. [Google Scholar] [CrossRef]
- Tremblay, S.; Nigro, V.; Weinberg, J.; Woodle, E.S.; Alloway, R.R. A Steady-State Head-to-Head Pharmacokinetic Comparison of All FK-506 (Tacrolimus) Formulations (ASTCOFF): An Open-Label, Prospective, Randomized, Two-Arm, Three-Period Crossover Study. Am. J. Transplant. 2017, 17, 432–442. [Google Scholar] [CrossRef]
- Grinyo, J.M.; Petruzzelli, S. Once-daily LCP-Tacro MeltDose tacrolimus for the prophylaxis of organ rejection in kidney and liver transplantations. Expert Rev. Clin. Immunol. 2014, 10, 1567–1579. [Google Scholar] [CrossRef] [PubMed]
- Garnock-Jones, K.P. Tacrolimus prolonged release (Envarsus(R)): A review of its use in kidney and liver transplant recipients. Drugs 2015, 75, 309–320. [Google Scholar] [CrossRef] [PubMed]
- Levin, A.; Stevens, P.E. Summary of KDIGO 2012 CKD Guideline: Behind the scenes, need for guidance, and a framework for moving forward. Kidney Int. 2014, 85, 49–61. [Google Scholar] [CrossRef] [PubMed]
- DuBay, D.A.; Teperman, L.; Ueda, K.; Silverman, A.; Chapman, W.; Alsina, A.E.; Tyler, C.; Stevens, D.R. Pharmacokinetics of Once-Daily Extended-Release Tacrolimus Tablets Versus Twice-Daily Capsules in De Novo Liver Transplant. Clin. Pharmacol. Drug Dev. 2019, 8, 995–1008. [Google Scholar] [CrossRef] [PubMed]
- Alloway, R.R.; Eckhoff, D.E.; Washburn, W.K.; Teperman, L.W. Conversion from twice daily tacrolimus capsules to once daily extended-release tacrolimus (LCP-Tacro): Phase 2 trial of stable liver transplant recipients. Liver Transpl. 2014, 20, 564–575. [Google Scholar] [CrossRef] [PubMed]
- Franco, A.; Mas-Serrano, P.; Balibrea, N.; Rodriguez, D.; Javaloyes, A.; Diaz, M.; Gascon, I.; Ramon-Lopez, A.; Perez-Contreras, J.; Selva, J.; et al. Envarsus, a novelty for transplant nephrologists: Observational retrospective study. Nefrologia 2019, 39, 506–512. [Google Scholar] [CrossRef]
- Rostaing, L.; Bunnapradist, S.; Grinyo, J.M.; Ciechanowski, K.; Denny, J.E.; Silva, H.T., Jr.; Budde, K.; Envarsus Study, G. Novel Once-Daily Extended-Release Tacrolimus Versus Twice-Daily Tacrolimus in De Novo Kidney Transplant Recipients: Two-Year Results of Phase 3, Double-Blind, Randomized Trial. Am. J. Kidney Dis. 2016, 67, 648–659. [Google Scholar] [CrossRef]
- Kaminska, D.; Poznanski, P.; Kuriata-Kordek, M.; Zielinska, D.; Mazanowska, O.; Koscielska-Kasprzak, K.; Krajewska, M. Conversion From a Twice-Daily to a Once-Daily Tacrolimus Formulation in Kidney Transplant Recipients. Transplant. Proc. 2020. [Google Scholar] [CrossRef]
- Jouve, T.; Fonrose, X.; Noble, J.; Janbon, B.; Fiard, G.; Malvezzi, P.; Stanke-Labesque, F.; Rostaing, L. The TOMATO study (TacrOlimus MetabolizAtion in kidney TransplantatiOn): Impact of the concentration-dose ratio on death-censored graft survival. Transplantation 2019. [Google Scholar] [CrossRef]
- Kwiatkowska, E.; Kwiatkowski, S.; Wahler, F.; Gryczman, M.; Domanki, L.; Marchelk-Mysliwiec, M.; Ciechanowski, K.; Drozd-Dabrowska, M. C/D Ratio in Long-Term Renal Function. Transplant. Proc. 2019, 51, 3265–3270. [Google Scholar] [CrossRef]
- Tholking, G.; Schmidt, C.; Koch, R.; Schuette-Nuetgen, K.; Pabst, D.; Wolters, H.; Kabar, I.; Husing, A.; Pavenstadt, H.; Reuter, S.; et al. Influence of tacrolimus metabolism rate on BKV infection after kidney transplantation. Sci. Rep. 2016, 6, 32273. [Google Scholar] [CrossRef] [PubMed]
- Baraldo, M. Meltdose Tacrolimus Pharmacokinetics. Transplant. Proc. 2016, 48, 420–423. [Google Scholar] [CrossRef]
- Bunnapradist, S.; Rostaing, L.; Alloway, R.R.; West-Thielke, P.; Denny, J.; Mulgaonkar, S.; Budde, K. LCPT once-daily extended-release tacrolimus tablets versus twice-daily capsules: A pooled analysis of two phase 3 trials in important de novo and stable kidney transplant recipient subgroups. Transpl. Int. 2016, 29, 603–611. [Google Scholar] [CrossRef] [PubMed]
- Kamar, N.; Cassuto, E.; Piotti, G.; Govoni, M.; Ciurlia, G.; Geraci, S.; Poli, G.; Nicolini, G.; Mariat, C.; Essig, M.; et al. Pharmacokinetics of Prolonged-Release Once-Daily Formulations of Tacrolimus in De Novo Kidney Transplant Recipients: A Randomized, Parallel-Group, Open-Label, Multicenter Study. Adv. Ther. 2019, 36, 462–477. [Google Scholar] [CrossRef]
- Laskey, H.L.; Schomaker, N.; Hung, K.W.; Asrani, S.K.; Jennings, L.; Nydam, T.L.; Gralla, J.; Wiseman, A.; Rosen, H.R.; Biggins, S.W. Predicting renal recovery after liver transplant with severe pretransplant subacute kidney injury: The impact of warm ischemia time. Liver Transpl. 2016, 22, 1085–1091. [Google Scholar] [CrossRef] [PubMed]
- Lu, Z.; Bonate, P.; Keirns, J. Population pharmacokinetics of immediate- and prolonged-release tacrolimus formulations in liver, kidney and heart transplant recipients. Br. J. Clin. Pharmacol. 2019, 85, 1692–1703. [Google Scholar] [CrossRef]
- Bardou, F.N.; Guillaud, O.; Erard-Poinsot, D.; Chambon-Augoyard, C.; Thimonier, E.; Vallin, M.; Boillot, O.; Dumortier, J. Tacrolimus exposure after liver transplantation for alcohol-related liver disease: Impact on complications. Transpl. Immunol. 2019, 56, 101227. [Google Scholar] [CrossRef]
- Zegarska, J.; Hryniewiecka, E.; Zochowska, D.; Samborowska, E.; Jazwiec, R.; Borowiec, A.; Tszyrsznic, W.; Chmura, A.; Nazarewski, S.; Dadlez, M.; et al. Tacrolimus Metabolite M-III May Have Nephrotoxic and Myelotoxic Effects and Increase the Incidence of Infections in Kidney Transplant Recipients. Transplant. Proc. 2016, 48, 1539–1542. [Google Scholar] [CrossRef]
- Vanhove, T.; de Jonge, H.; de Loor, H.; Oorts, M.; de Hoon, J.; Pohanka, A.; Annaert, P.; Kuypers, D.R.J. Relationship between In Vivo CYP3A4 Activity, CYP3A5 Genotype, and Systemic Tacrolimus Metabolite/Parent Drug Ratio in Renal Transplant Recipients and Healthy Volunteers. Drug Metab. Dispos. 2018, 46, 1507–1513. [Google Scholar] [CrossRef]


| LCPT (n = 61) | Standard-Release Tac (n = 60) | p-Value | |
|---|---|---|---|
| Age at LTx (years) | 46.3 ± 16.7 | 48.8 ± 12.4 | 0.348 a |
| Age at study onset (years) | 51.0 ± 15.9 | 56.1 ± 12.7 | 0.054 a |
| Height (m) | 1.72 ± 0.087 | 1.73 ± 0.094 | 0.714 a |
| Weight (kg) | 79.4 ± 20.8 | 76.7 ± 16.5 | 0.420 a |
| BMI (kg/m2) | 26.7 ± 6.1 | 25.6 ± 5.0 | 0.310 a |
| Sex (male/female) | 29 (47.5%) / 32 (52.5%) | 38 (63.3%) / 22 (36.7%) | 0.101 b |
| CIT (h) | 11.3 ± 2.6 | 10.5 ± 2.4 | 0.065 a |
| WIT (min) | 38.9 ± 9.2 | 43.8 ± 8.7 | 0.005 a |
| Number of grafts | 0.255 b | ||
| One | 56 (91.8%) | 49 (81.7%) | |
| Two | 4 (6.6%) | 8 (13.3%) | |
| Three | 1 (1.6%) | 3 (5.0%) | |
| Blood type | 0.545 b | ||
| A | 28 (47.5%) | 30 (50.0%) | |
| B | 6 (10.2%) | 6 (10.0%) | |
| AB | 6 (10.2%) | 2 (3.3%) | |
| O | 19 (32.2%) | 22 (36.7%) | |
| Hepatitis B antigen (positive) | 5 (8.2%) | 7 (11.9%) | 0.556 b |
| Hepatitis C antibody (positive) | 9 (14.8%) | 8 (13.6%) | 1.000 b |
| Recipient CMV IgG (positive) | 34 (57.6%) | 27 (45.0%) | 0.201 b |
| Donor CMV IgG (positive) | 32 (56.1%) | 37 (63.8%) | 0.450 b |
| LCPT (n = 61) | Standard-Release Tac (n = 60) | p-Value | |
|---|---|---|---|
| Principal diagnosis | 0.455 | ||
| Alcoholism | 9 (14.8%) | 16 (26.7%) | |
| Viral hepatitis | 15 (24.6%) | 15 (25.0%) | |
| Genetically related metabolic disease | 7 (11.5%) | 5 (8.3%) | |
| Toxic: nutritional or NASH | 3 (4.9%) | 1 (1.7%) | |
| Autoimmune liver disease | 11 (18.0%) | 13 (21.7%) | |
| Other | 16 (26.2%) | 10 (16.7%) | |
| Arterial hypertension | 36 (59.0%) | 37 (61.7%) | 0.853 |
| Diabetes mellitus | 18 (29.5%) | 17 (28.3%) | 1.000 |
| Hyperlipidaemia | 19 (31.1%) | 14 (23.3%) | 0.415 |
| CKD at study start | 0.598 | ||
| CKD 2 | 18 (29.5%) | 21 (35.0%) | |
| CKD 3a | 16 (26.2%) | 10 (16.7%) | |
| CKD 3b | 9 (14.8%) | 7 (11.7%) | |
| CKD 4 | 2 (3.3%) | 1 (1.7%) | |
| Tac formulation at study onset | <0.001 | ||
| Immediate-release Tac | 43 (70.5%) | 22 (36.7%) | |
| Extended-release Tac | 18 (29.5%) | 38 (63.3%) | |
| Co-immunosuppression | 0.060 | ||
| MMF | 34 (55.7%) | 35 (58.3%) | |
| Everolimus | 13 (21.3%) | 5 (8.3%) | |
| Prednisolone | 3 (4.9%) | 10 (16.7%) | |
| Sirolimus | 0 | 1 (1.7%) | |
| None | 11 (18.0%) | 9 (15.0%) | |
| Reasons for a switch to LCPT | |||
| CNIT | 7 | ||
| Neurotoxicity | 5 | ||
| Preventions of side effects | 49 |
| LCPT | Standard-Release Tac | p-Value | |
|---|---|---|---|
| Tac C/D ratio (ng/mL × 1/mg) | |||
| 3 months before (n = 54 vs. 58) | 1.44 (0.24–6.20) on s-r-Tac | 1.69 (0.40–9.20) | 0.344 |
| At study onset (n = 61 vs. 60) | 1.68 (0.30–13.45) on s-r-Tac | 1.76 (0.38–7.40) | 0.362 |
| After 3 months (n = 61 vs. 60) | 2.03 (0.33–13.60) | 1.83 (0.41–7.00) | 0.735 |
| After 6 months (n = 61 vs. 60) | 2.33 (0.77–8.47) | 1.63 (0.68–7.40) | 0.011 |
| After 9 months (n = 61 vs. 60) | 2.13 (0.60–9.33) | 1.70 (0.54–7.20) | 0.136 |
| After 12 months (n = 61 vs. 60) | 2.52 (0.58–6.40) | 1.75 (0.49–6.40) | 0.009 |
| Tac daily dose (mg) | |||
| 3 months before (n = 54 vs. 58) | 3.0 (0.5–12.0) on s-r-Tac | 2.5 (0.5–9.0) | 0.056 |
| At study onset (n = 61 vs. 60) | 3.0 (1.0–22.0) on s-r-Tac | 2.8 (0.5–10.0) | 0.044 |
| After 3 months (n = 61 vs. 60) | 2.0 (0.8–8.0) | 2.5 (0.5–9.0) | 0.330 |
| After 6 months (n = 61 vs. 60) | 2.0 (0.8–5.0) | 2.5 (0.5–7.0) | 0.248 |
| After 9 months (n = 61 vs. 60) | 2.0 (0.4–6.0) | 2.5 (0.5–9.0) | 0.060 |
| After 12 months (n = 61 vs. 60) | 2.0 (0.4–7.8) | 2.5 (0.5–10.0) | 0.047 |
| Tac trough level (ng/mL) | |||
| 3 months before (n = 54 vs. 58) | 5.0 (2.4–15.3) on s-r-Tac | 4.4 (1.5–14.7) | 0.087 |
| At study onset (n = 61 vs. 60) | 6.0 (1.5–26.9) on s-r-Tac | 4.7 (1.5–14.3) | 0.005 |
| After 3 months (n = 61 vs. 60) | 4.6 (0.5–13.1) | 4.4 (2.2–10.4) | 0.863 |
| After 6 months (n = 61 vs. 60) | 4.7 (1.5–12.7) | 4.1 (2.0–10.9) | 0.022 |
| After 9 months (n = 61 vs. 60) | 4.3 (1.5–15.1) | 4.0 (1.9–10.1) | 0.867 |
| After 12 months (n = 61 vs. 60) | 4.4 (2.2–11.8) | 4.1 (1.6–15.6) | 0.283 |
| Time Point | Estimate | 95% Confidence Limit | p-Value | |
|---|---|---|---|---|
| Lower | Upper | |||
| LCPT | ||||
| −3 months vs. baseline | −1.2 | −3.2 | 0.8 | 0.223 |
| 3 months vs. baseline | 2.1 | −1.3 | 5.5 | 0.219 |
| 6 months vs. baseline | 3.1 | 0.3 | 6.0 | 0.029 |
| 9 months vs. baseline | 4.2 | 0.8 | 7.6 | 0.015 |
| 12 months vs. baseline | 4.7 | 1.9 | 7.5 | 0.001 |
| Standard-release Tac | ||||
| −3 months vs. baseline | 0.5 | −1.0 | 1.9 | 0.547 |
| 3 months vs. baseline | −1.9 | −3.9 | 0.0 | 0.053 |
| 6 months vs. baseline | −1.6 | −3.8 | 0.6 | 0.154 |
| 9 months vs. baseline | −3.6 | −6.1 | −1.1 | 0.006 |
| 12 months vs. baseline | −4.3 | −6.2 | −2.3 | <0.001 |
| Time Point | LCPT | Standard-Release Tac | ||||
|---|---|---|---|---|---|---|
| Diabetics (n = 18) | Non-Diabetics (n = 43) | p-Value | Diabetics (n = 17) | Non-Diabetics (n = 43) | p-Value | |
| t0 | 52.6 ± 21.3 | 70.3 ± 19.0 | 0.003 | 56.0 ± 20.3 | 76.3 ± 15.6 | <0.001 |
| t3 | 56.2 ± 21.2 | 72.3 ± 20.0 | 0.013 | 51.2 ± 17.6 | 74.9 ± 18.1 | <0.001 |
| t6 | 56.3 ± 19.2 | 73.0 ± 18.4 | 0.004 | 56.5 ± 20.3 | 75.5 ± 15.1 | <0.001 |
| t9 | 57.1 ± 22.1 | 74.4 ± 17.7 | 0.007 | 53.2 ± 22.2 | 71.5 ± 16.5 | 0.002 |
| t12 | 56.3 ± 19.5 | 77.2 ± 13.4 | <0.001 | 49.9 ± 22.5 | 72.7 ± 16.6 | <0.001 |
| Time Point | LCPT | Standard-Release Tac | ||||
|---|---|---|---|---|---|---|
| Arterial Hypertension (n = 36) | Normal Blood Pressure (n = 25) | p-Value | Arterial Hypertension (n = 37) | Normal Blood Pressure (n = 23) | p-Value | |
| t0 | 59.3 ± 20.7 | 74.3 ± 18.7 | 0.006 | 66.8 ± 21.0 | 76.6 ± 14.5 | 0.056 |
| t3 | 63.4 ± 22.4 | 73.1 ± 19.2 | 0.111 | 64.6 ± 22.4 | 74.2 ± 16.7 | 0.121 |
| t6 | 62.6 ± 20.1 | 74.2 ± 18.5 | 0.038 | 65.5 ± 20.4 | 77.6 ± 12.7 | 0.015 |
| t9 | 65.1 ± 19.9 | 74.7 ± 20.7 | 0.120 | 63.2 ± 21.8 | 70.4 ± 16.3 | 0.222 |
| t12 | 66.7 ± 17.0 | 76.9 ± 18.3 | 0.042 | 61.2 ± 22.4 | 74.5 ± 15.6 | 0.015 |
| LCPT (n = 61) | Standard-Release Tac (n = 60) | p-Value | |
|---|---|---|---|
| Bilirubin (mg/dL) | |||
| At study onset | 0.4 (0.2–1.3) | 0.6 (0.2–2.0) | 0.001 |
| After 3 months | 0.4 (0.2–2.2) | 0.5 (0.2–4.0) | 0.006 |
| After 6 months | 0.4 (0.2–1.2) | 0.6 (0.2–2.1) | 0.010 |
| After 9 months | 0.4 (0.2–1.2) | 0.5 (0.2–1.9) | 0.001 |
| After 12 months | 0.5 (0.2–1.2) | 0.6 (0.2–2.7) | 0.011 |
| ALT (U/L) | |||
| At study onset | 20 (8–102) | 21 (9–117) | 0.431 |
| After 3 months | 24 (8–78) | 22 (10–140) | 0.348 |
| After 6 months | 20 (6–92) | 18 (8–448) | 0.406 |
| After 9 months | 20 (7–202) | 20 (7–138) | 0.997 |
| After 12 months | 20 (9–104) | 20 (7–380) | 0.696 |
| INR | |||
| At study onset | 1.0 (0.9–2.2) | 1.0 (0.9–1.6) | 0.765 |
| After 3 months | 1.0 (0.9–2.3) | 1.0 (0.9–1.3) | 0.871 |
| After 6 months | 1.0 (0.9–1.3) | 1.0 (0.9–1.6) | 0.969 |
| After 9 months | 1.0 (0.9–1.3) | 1.0 (0.9–1.5) | 0.634 |
| After 12 months | 1.0 (0.9–1.3) | 1.0 (0.9–1.5) | 0.217 |
© 2020 by the authors. Licensee MDPI, Basel, Switzerland. This article is an open access article distributed under the terms and conditions of the Creative Commons Attribution (CC BY) license (http://creativecommons.org/licenses/by/4.0/).
Share and Cite
von Einsiedel, J.; Thölking, G.; Wilms, C.; Vorona, E.; Bokemeyer, A.; Schmidt, H.H.; Kabar, I.; Hüsing-Kabar, A. Conversion from Standard-Release Tacrolimus to MeltDose® Tacrolimus (LCPT) Improves Renal Function after Liver Transplantation. J. Clin. Med. 2020, 9, 1654. https://doi.org/10.3390/jcm9061654
von Einsiedel J, Thölking G, Wilms C, Vorona E, Bokemeyer A, Schmidt HH, Kabar I, Hüsing-Kabar A. Conversion from Standard-Release Tacrolimus to MeltDose® Tacrolimus (LCPT) Improves Renal Function after Liver Transplantation. Journal of Clinical Medicine. 2020; 9(6):1654. https://doi.org/10.3390/jcm9061654
Chicago/Turabian Stylevon Einsiedel, Johannes, Gerold Thölking, Christian Wilms, Elena Vorona, Arne Bokemeyer, Hartmut H. Schmidt, Iyad Kabar, and Anna Hüsing-Kabar. 2020. "Conversion from Standard-Release Tacrolimus to MeltDose® Tacrolimus (LCPT) Improves Renal Function after Liver Transplantation" Journal of Clinical Medicine 9, no. 6: 1654. https://doi.org/10.3390/jcm9061654
APA Stylevon Einsiedel, J., Thölking, G., Wilms, C., Vorona, E., Bokemeyer, A., Schmidt, H. H., Kabar, I., & Hüsing-Kabar, A. (2020). Conversion from Standard-Release Tacrolimus to MeltDose® Tacrolimus (LCPT) Improves Renal Function after Liver Transplantation. Journal of Clinical Medicine, 9(6), 1654. https://doi.org/10.3390/jcm9061654