An Efficient COVID-19 Prediction Model Validated with the Cases of China, Italy and Spain: Total or Partial Lockdowns?


Abstract
:1. Introduction
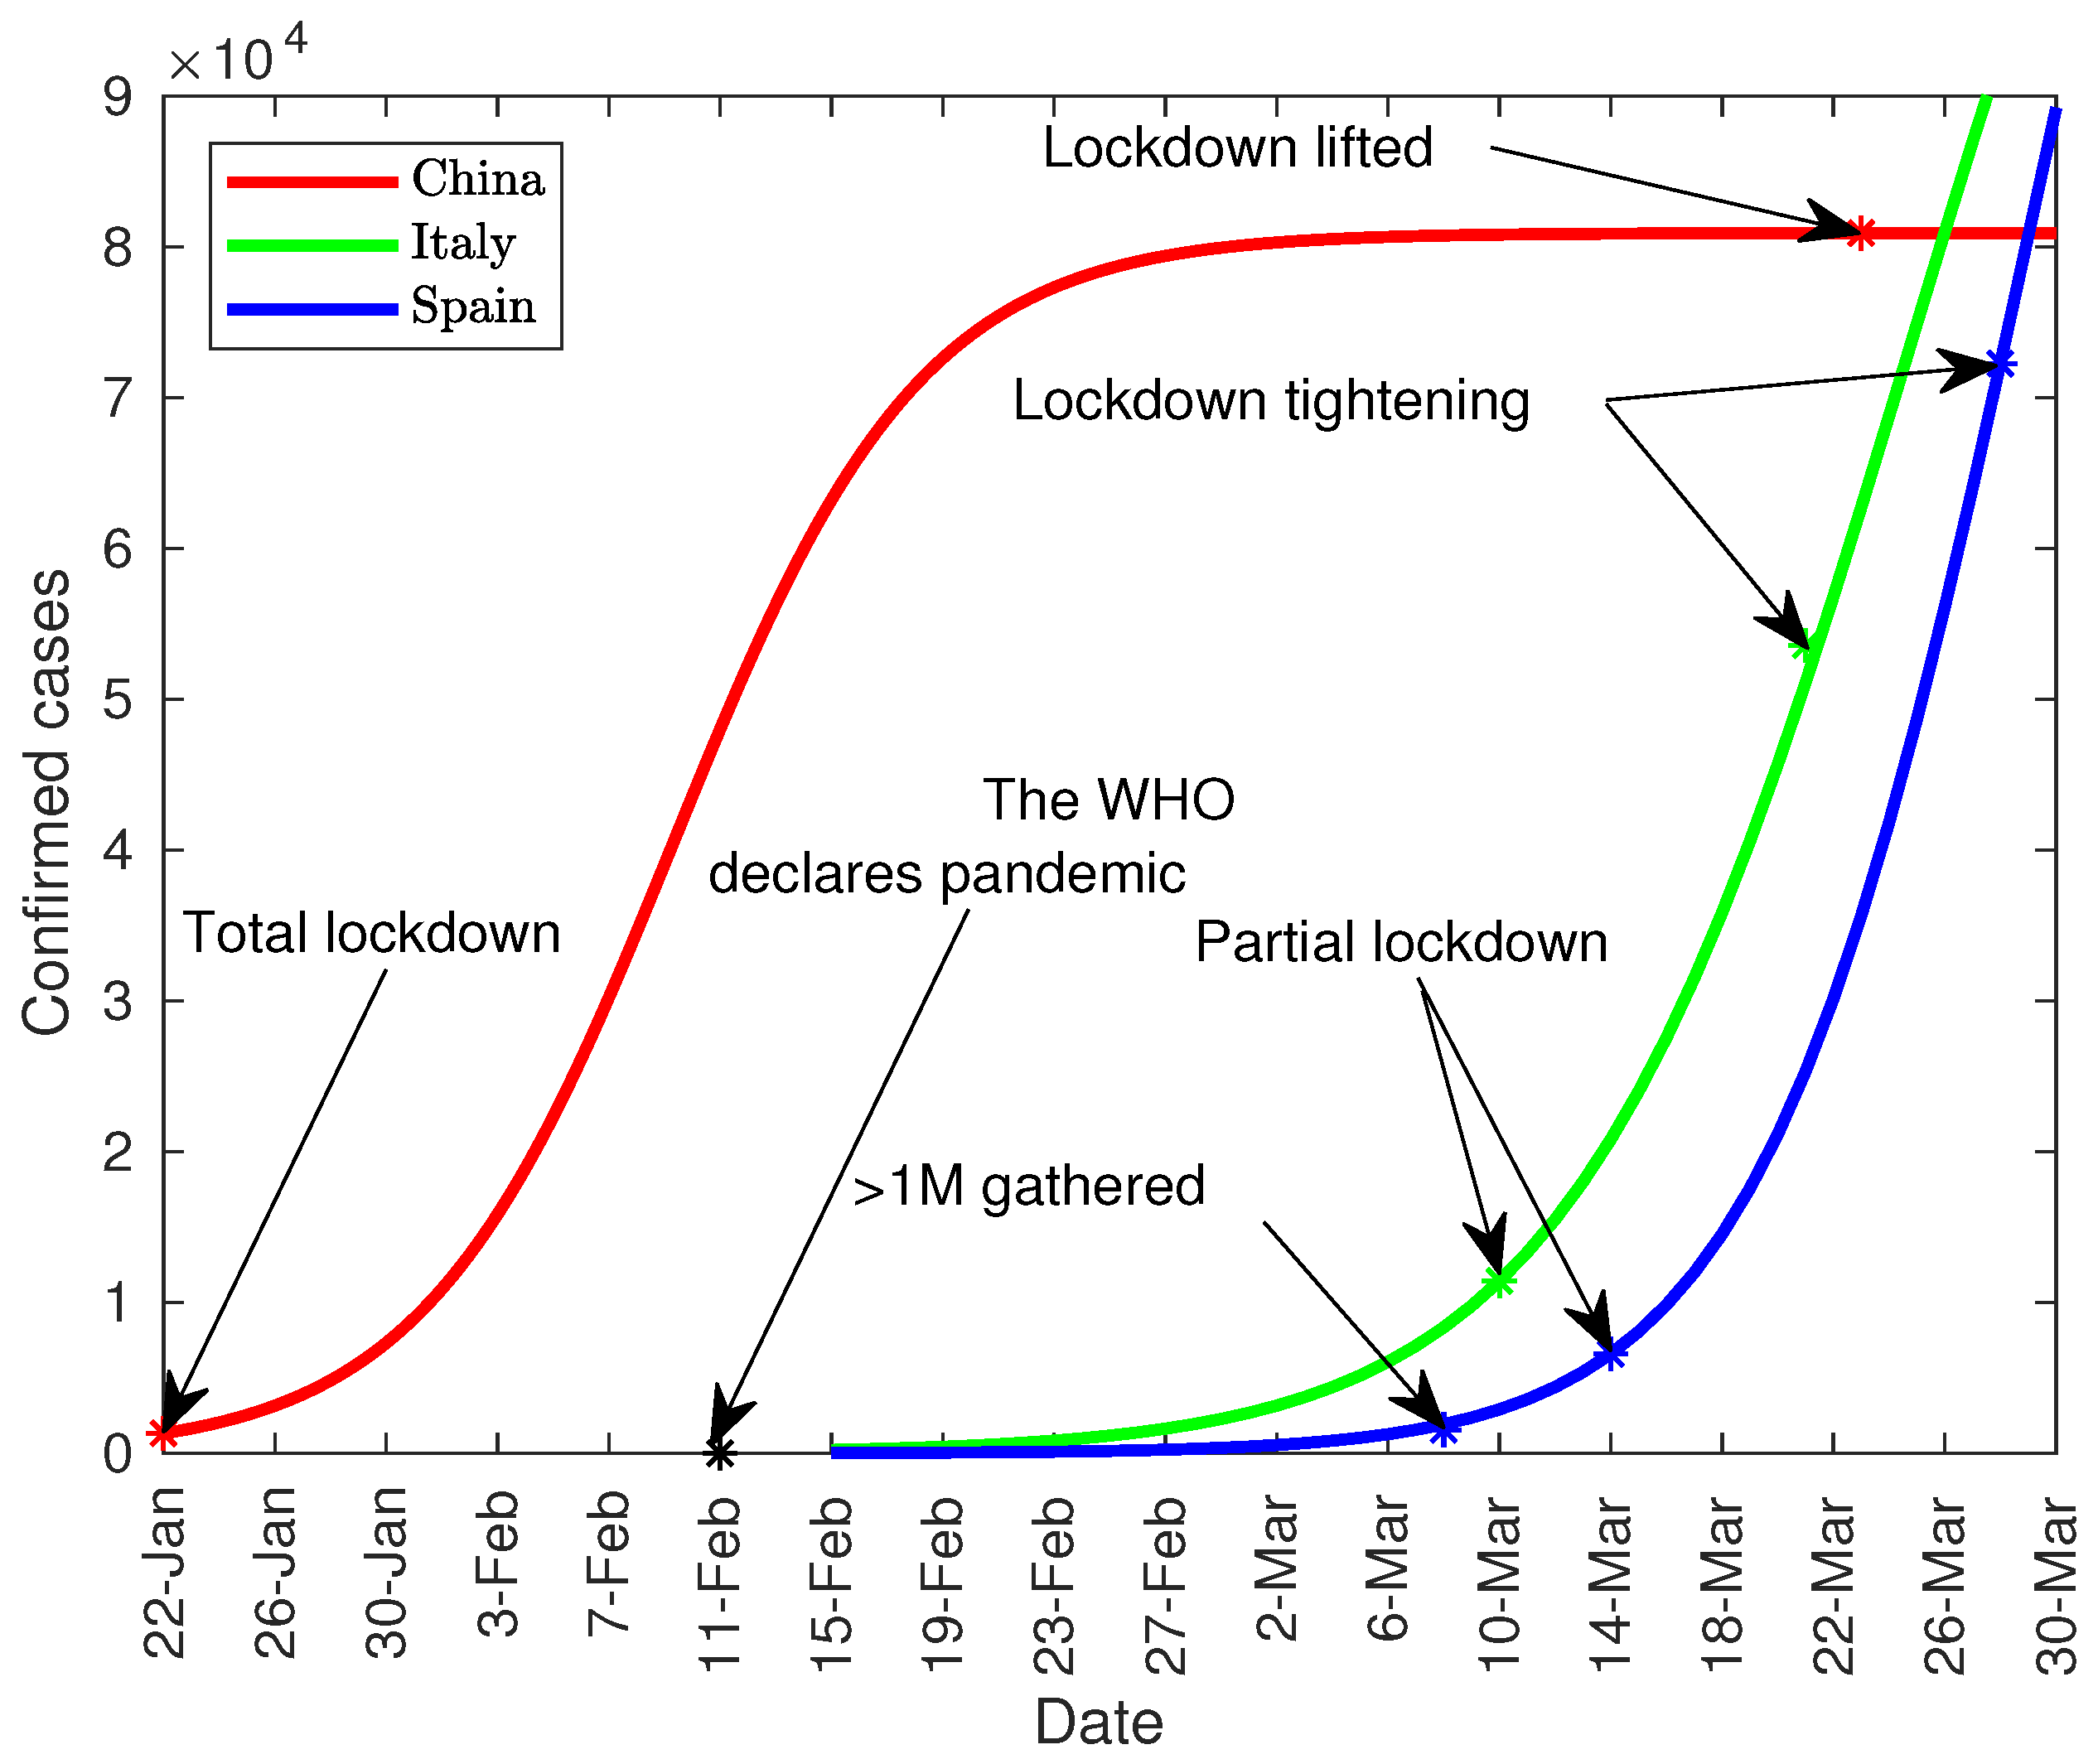
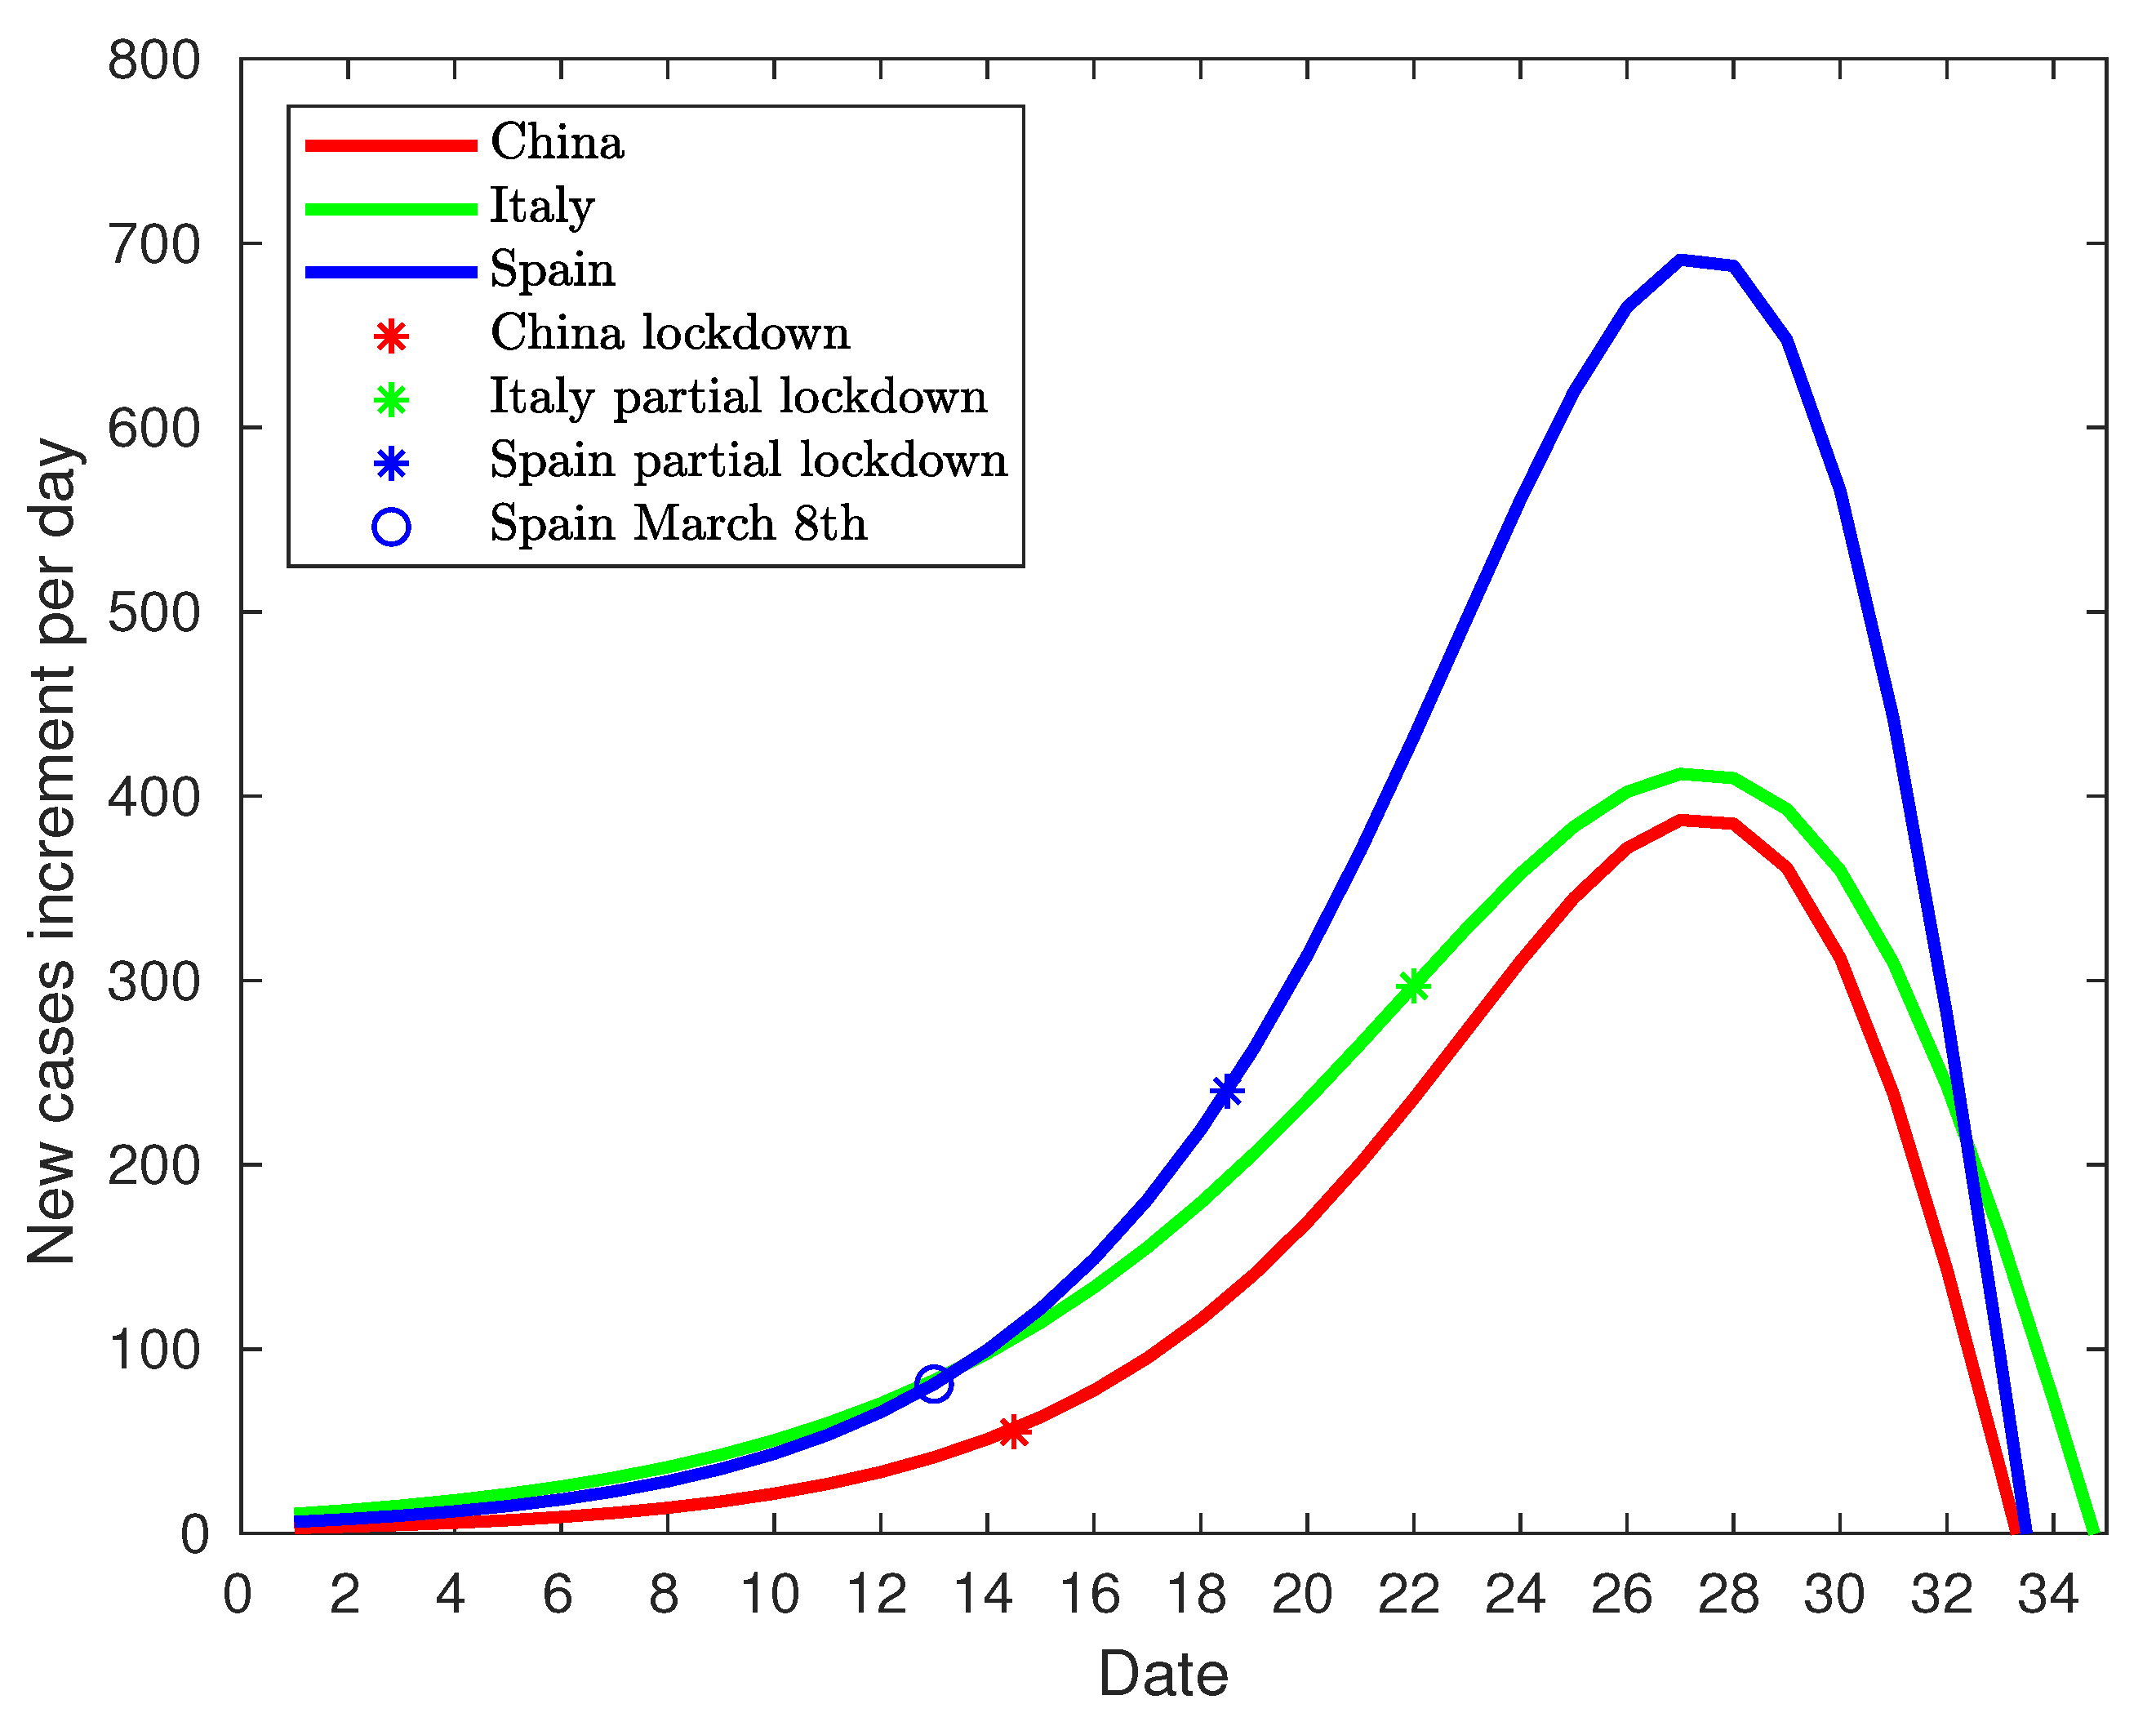
2. Chronology
3. Development of the Predictive Model
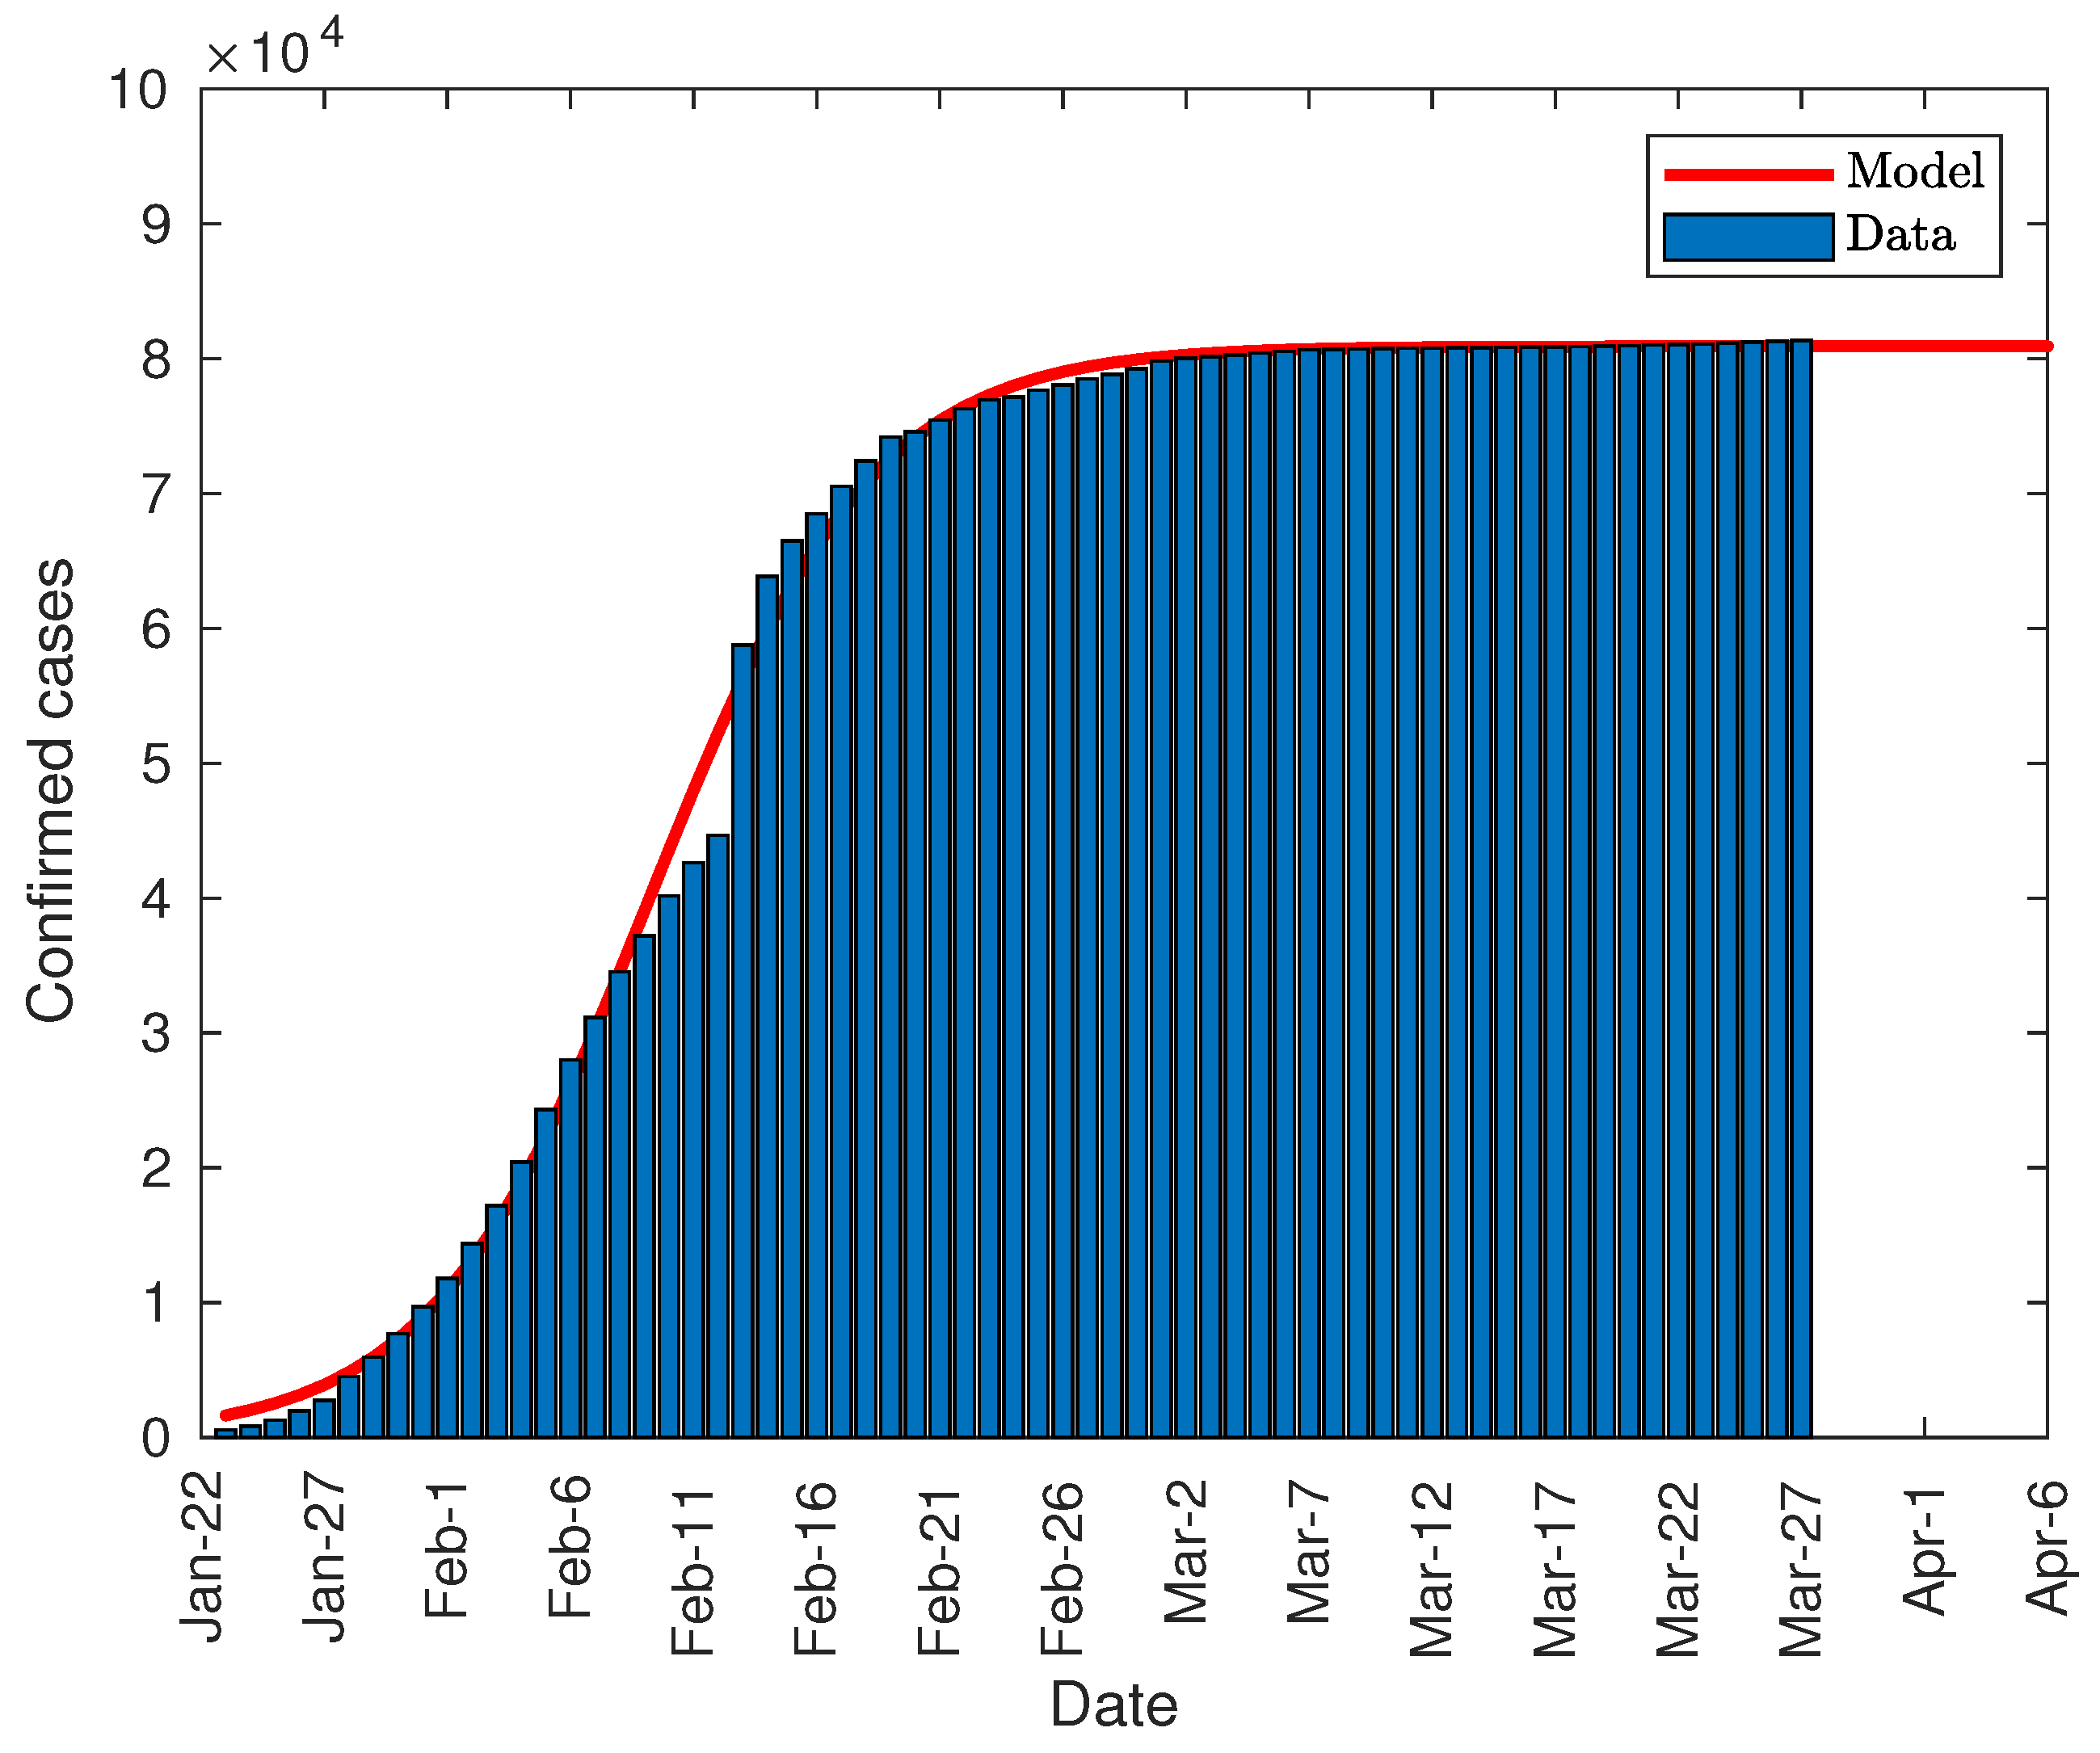
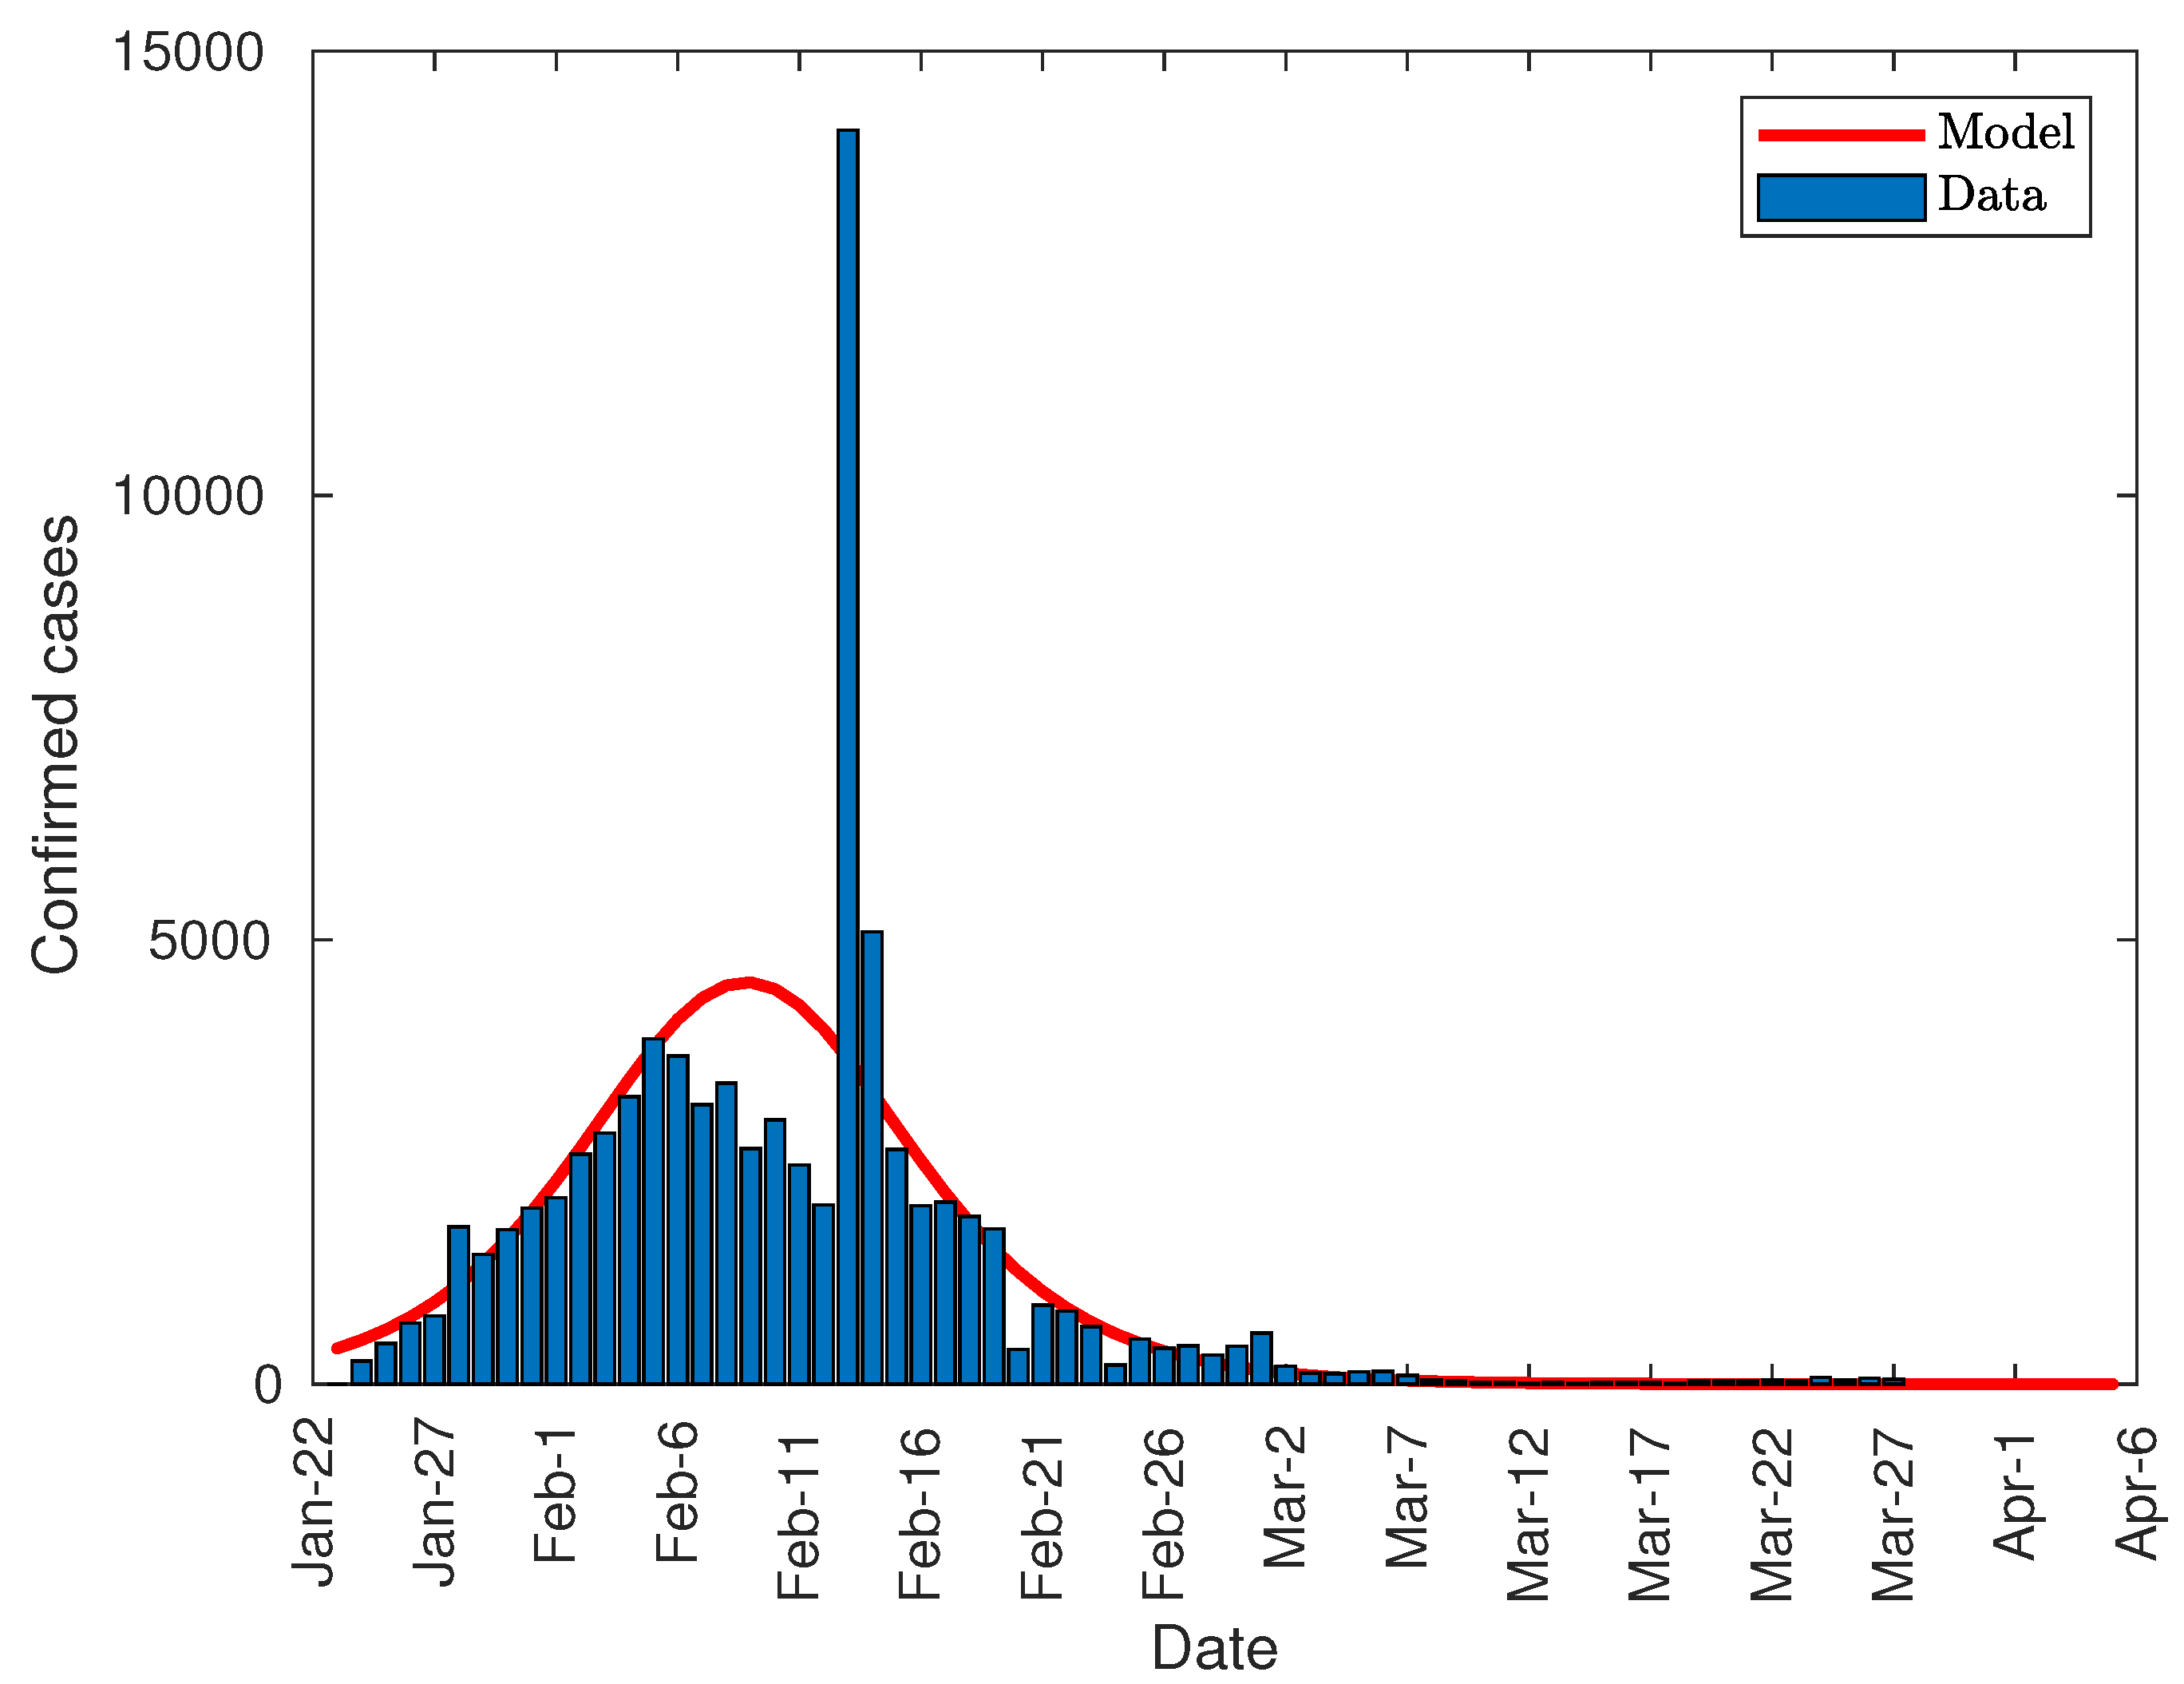
3.1. Application of the Predictive Model to the Spread of the Virus in China
- K = 8.091 × 10⁴ (8.031 × 10⁴, 8.125 × 10⁴)
- P0 = 1320 (1071, 1569)
- r = 0.2239 (0.2135, 0.2343)
3.2. Application of the Predictive Model to the Spread of the Virus in Italy
- K = 1.365 × 10⁵ (1.34 × 10⁵, 1.389 × 10⁵)
- P0 = 139.8 (121, 158.7)
- r = 0.1775 (0.1735, 0.1816)
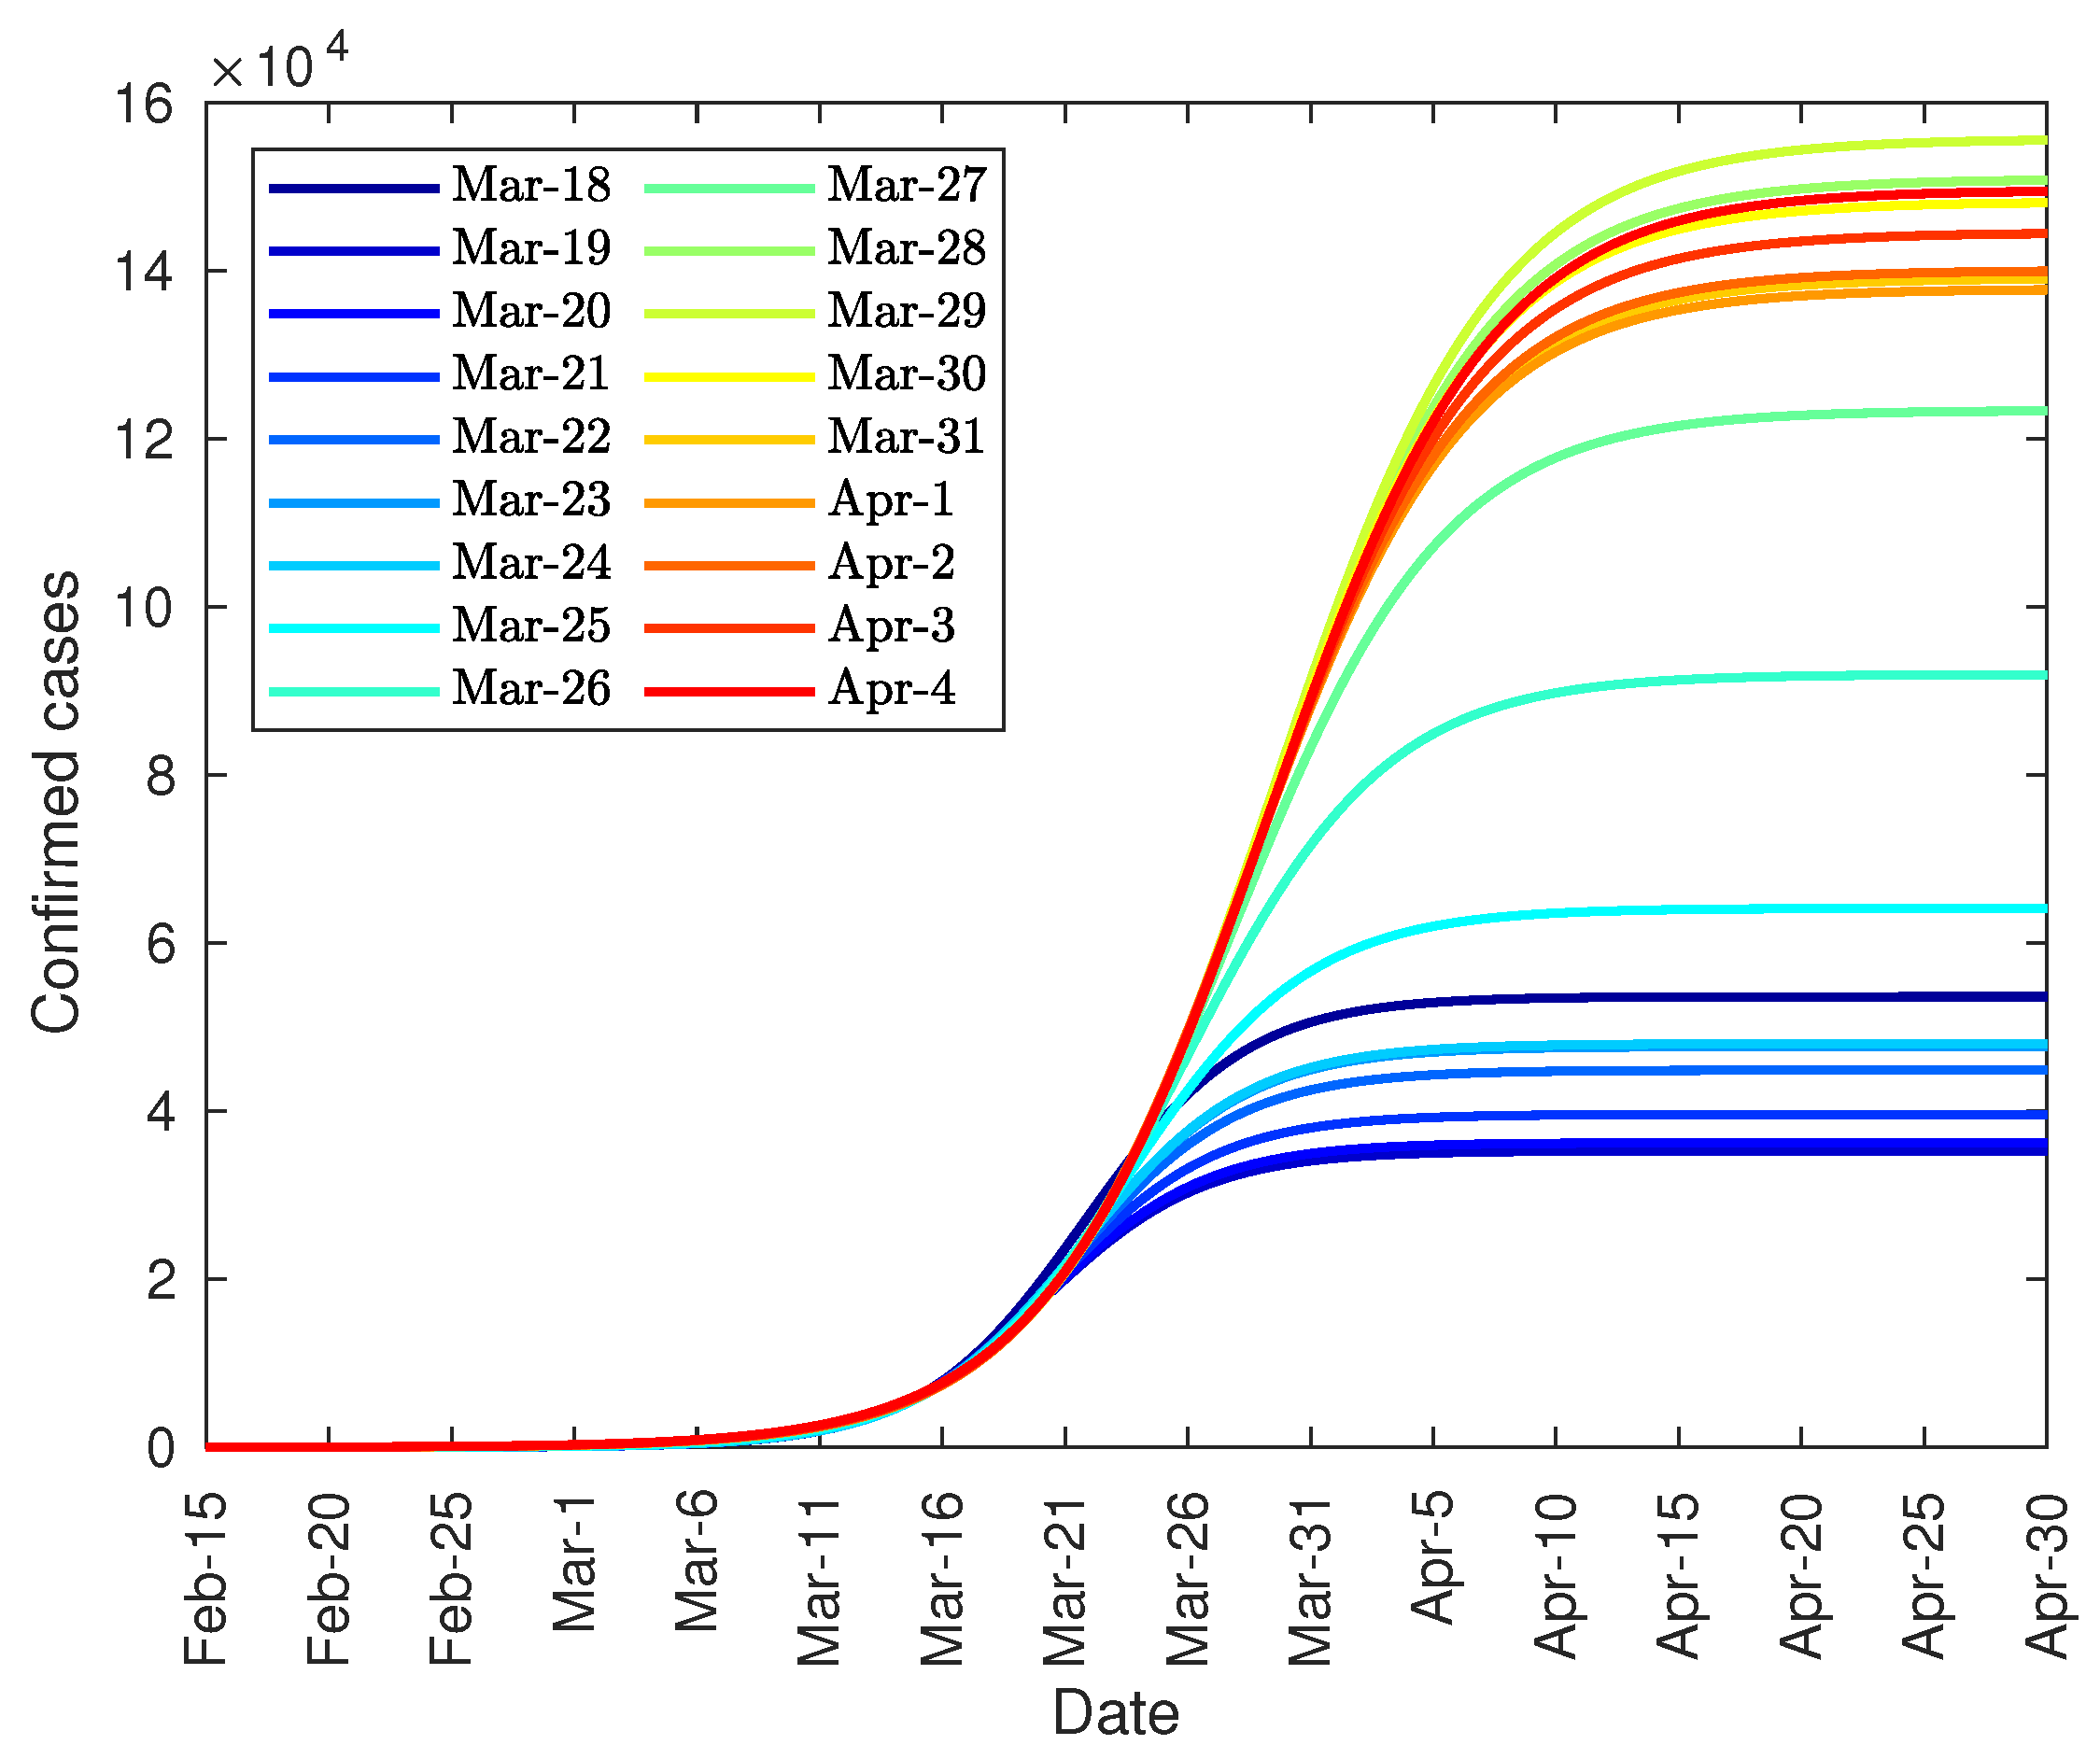
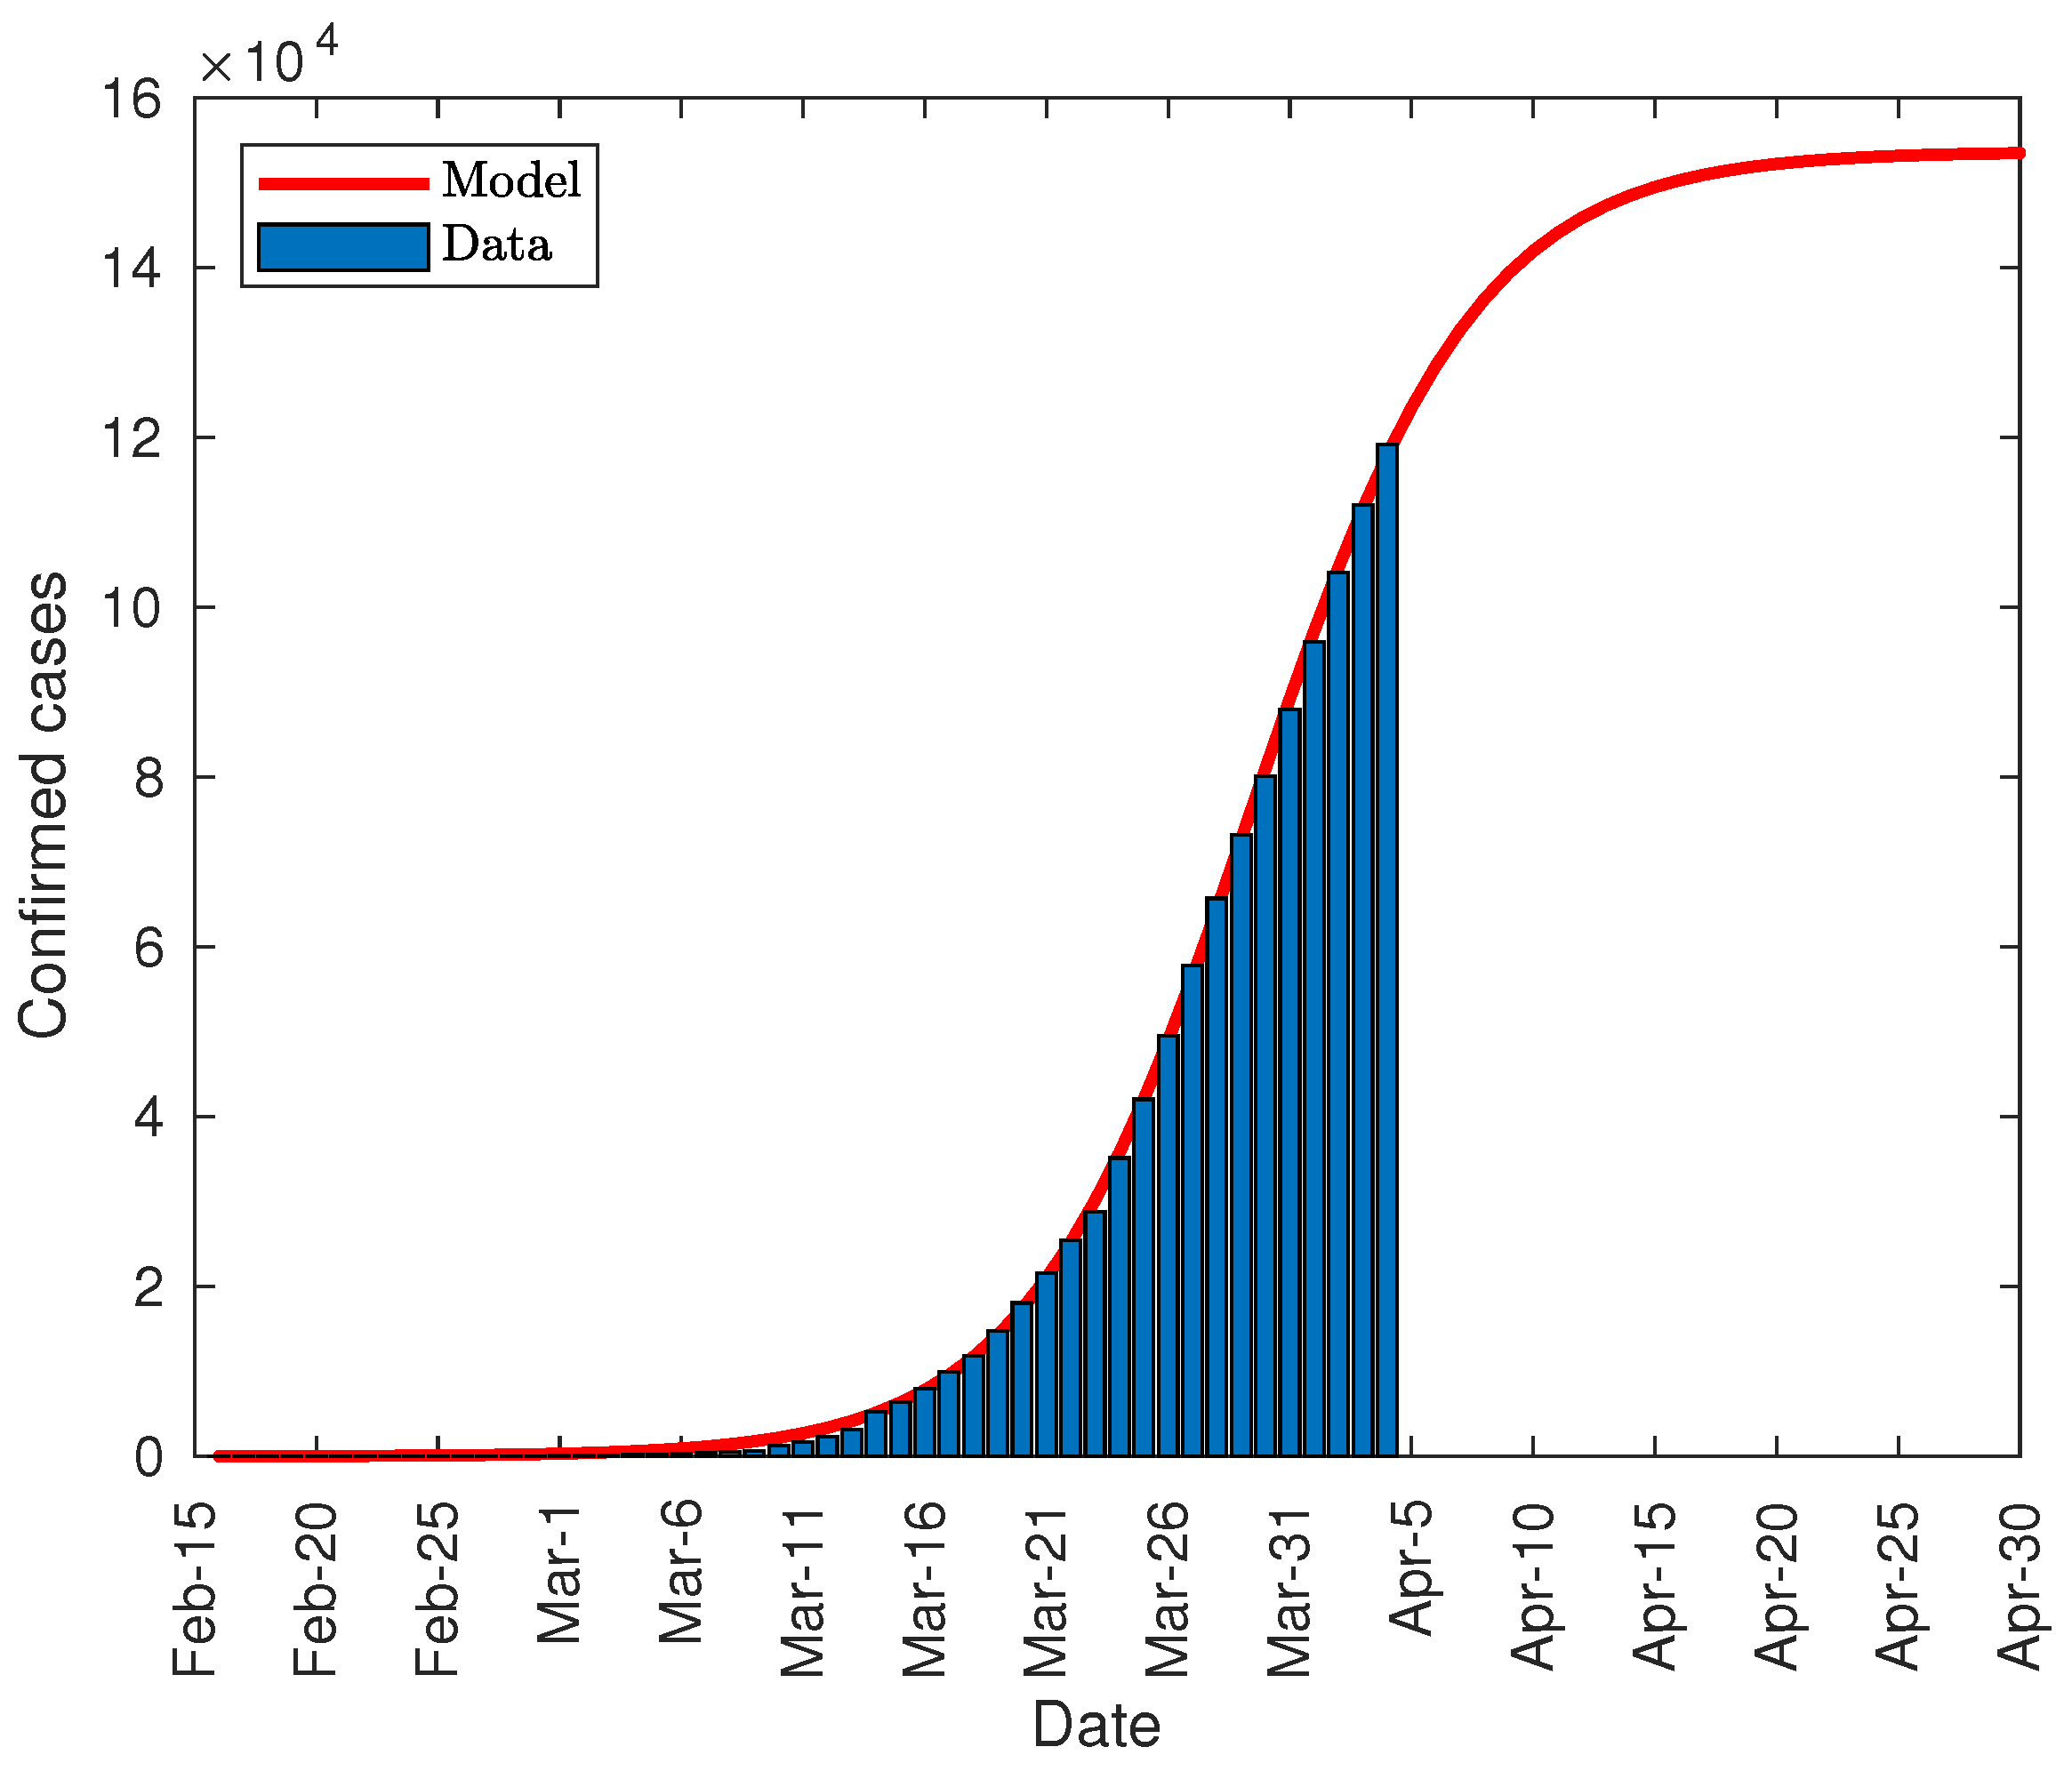
3.3. Application of the Predictive Model to the Spread of the Virus in Spain
- K = 1.537 × 10⁵ (1.494 × 10⁵, 1.579 × 10⁵)
- P0 = 12.21 (9.671, 14.76)
- r = 0.217 (0.2115, 0.2226)
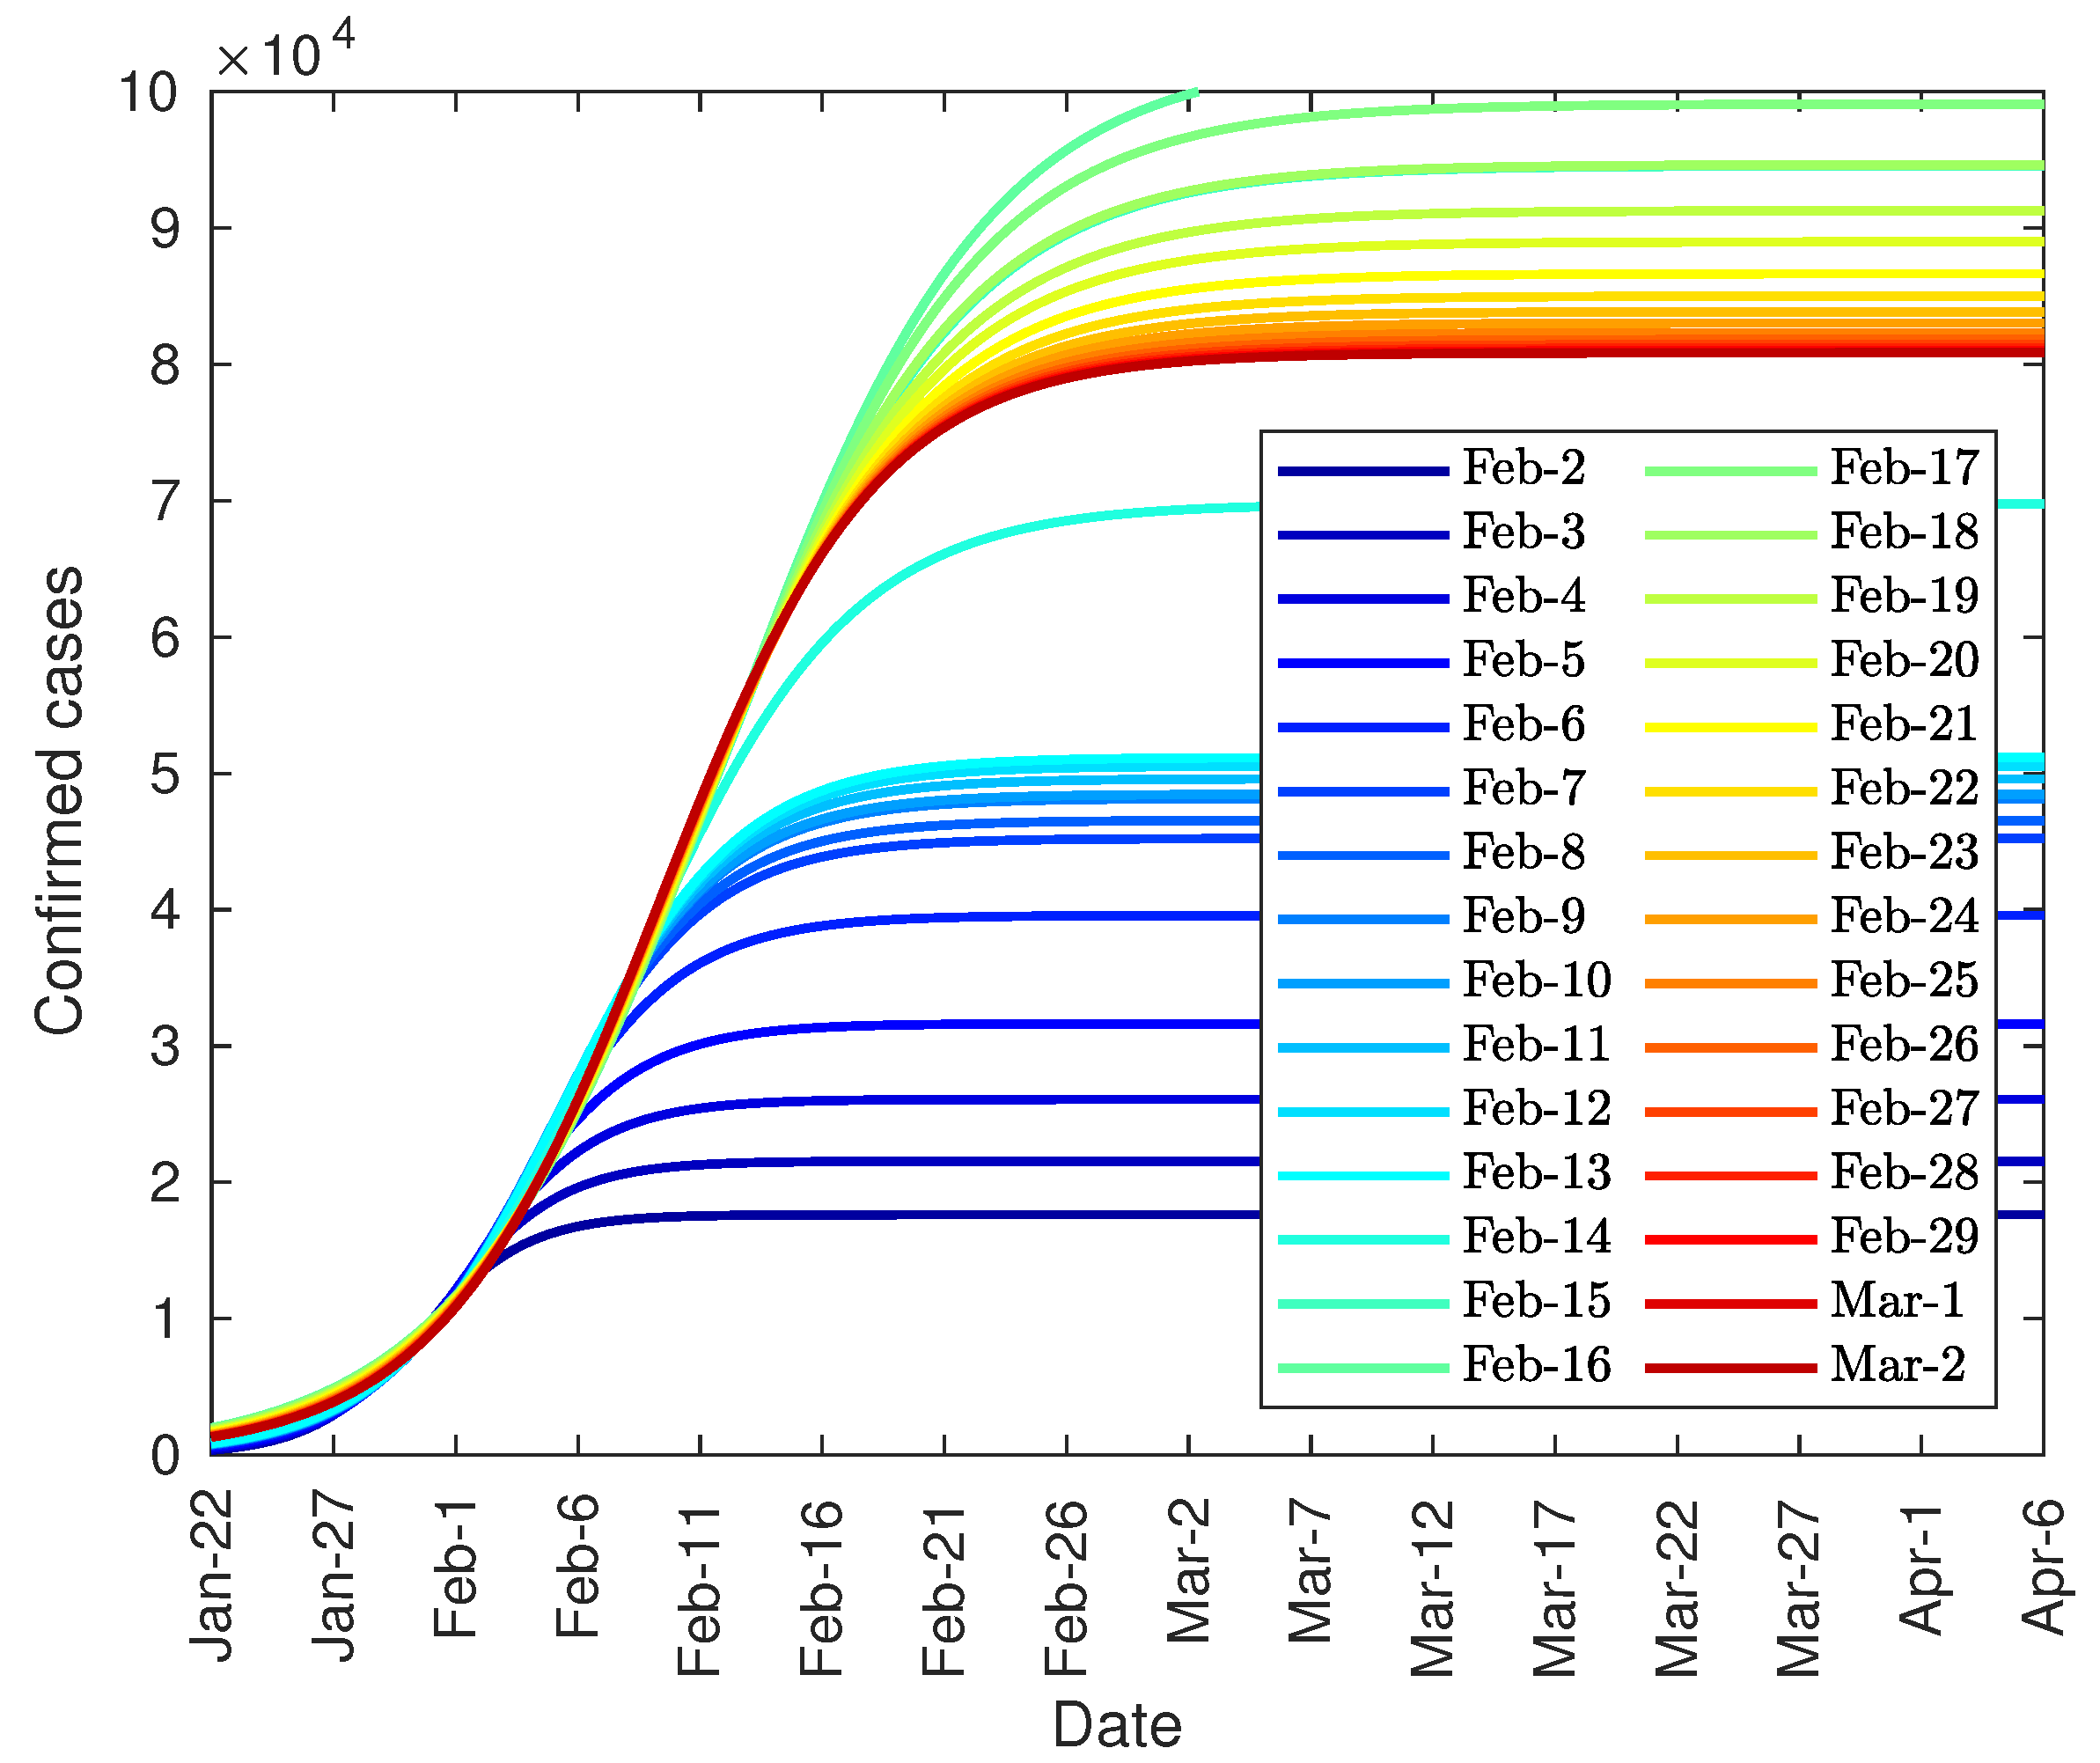
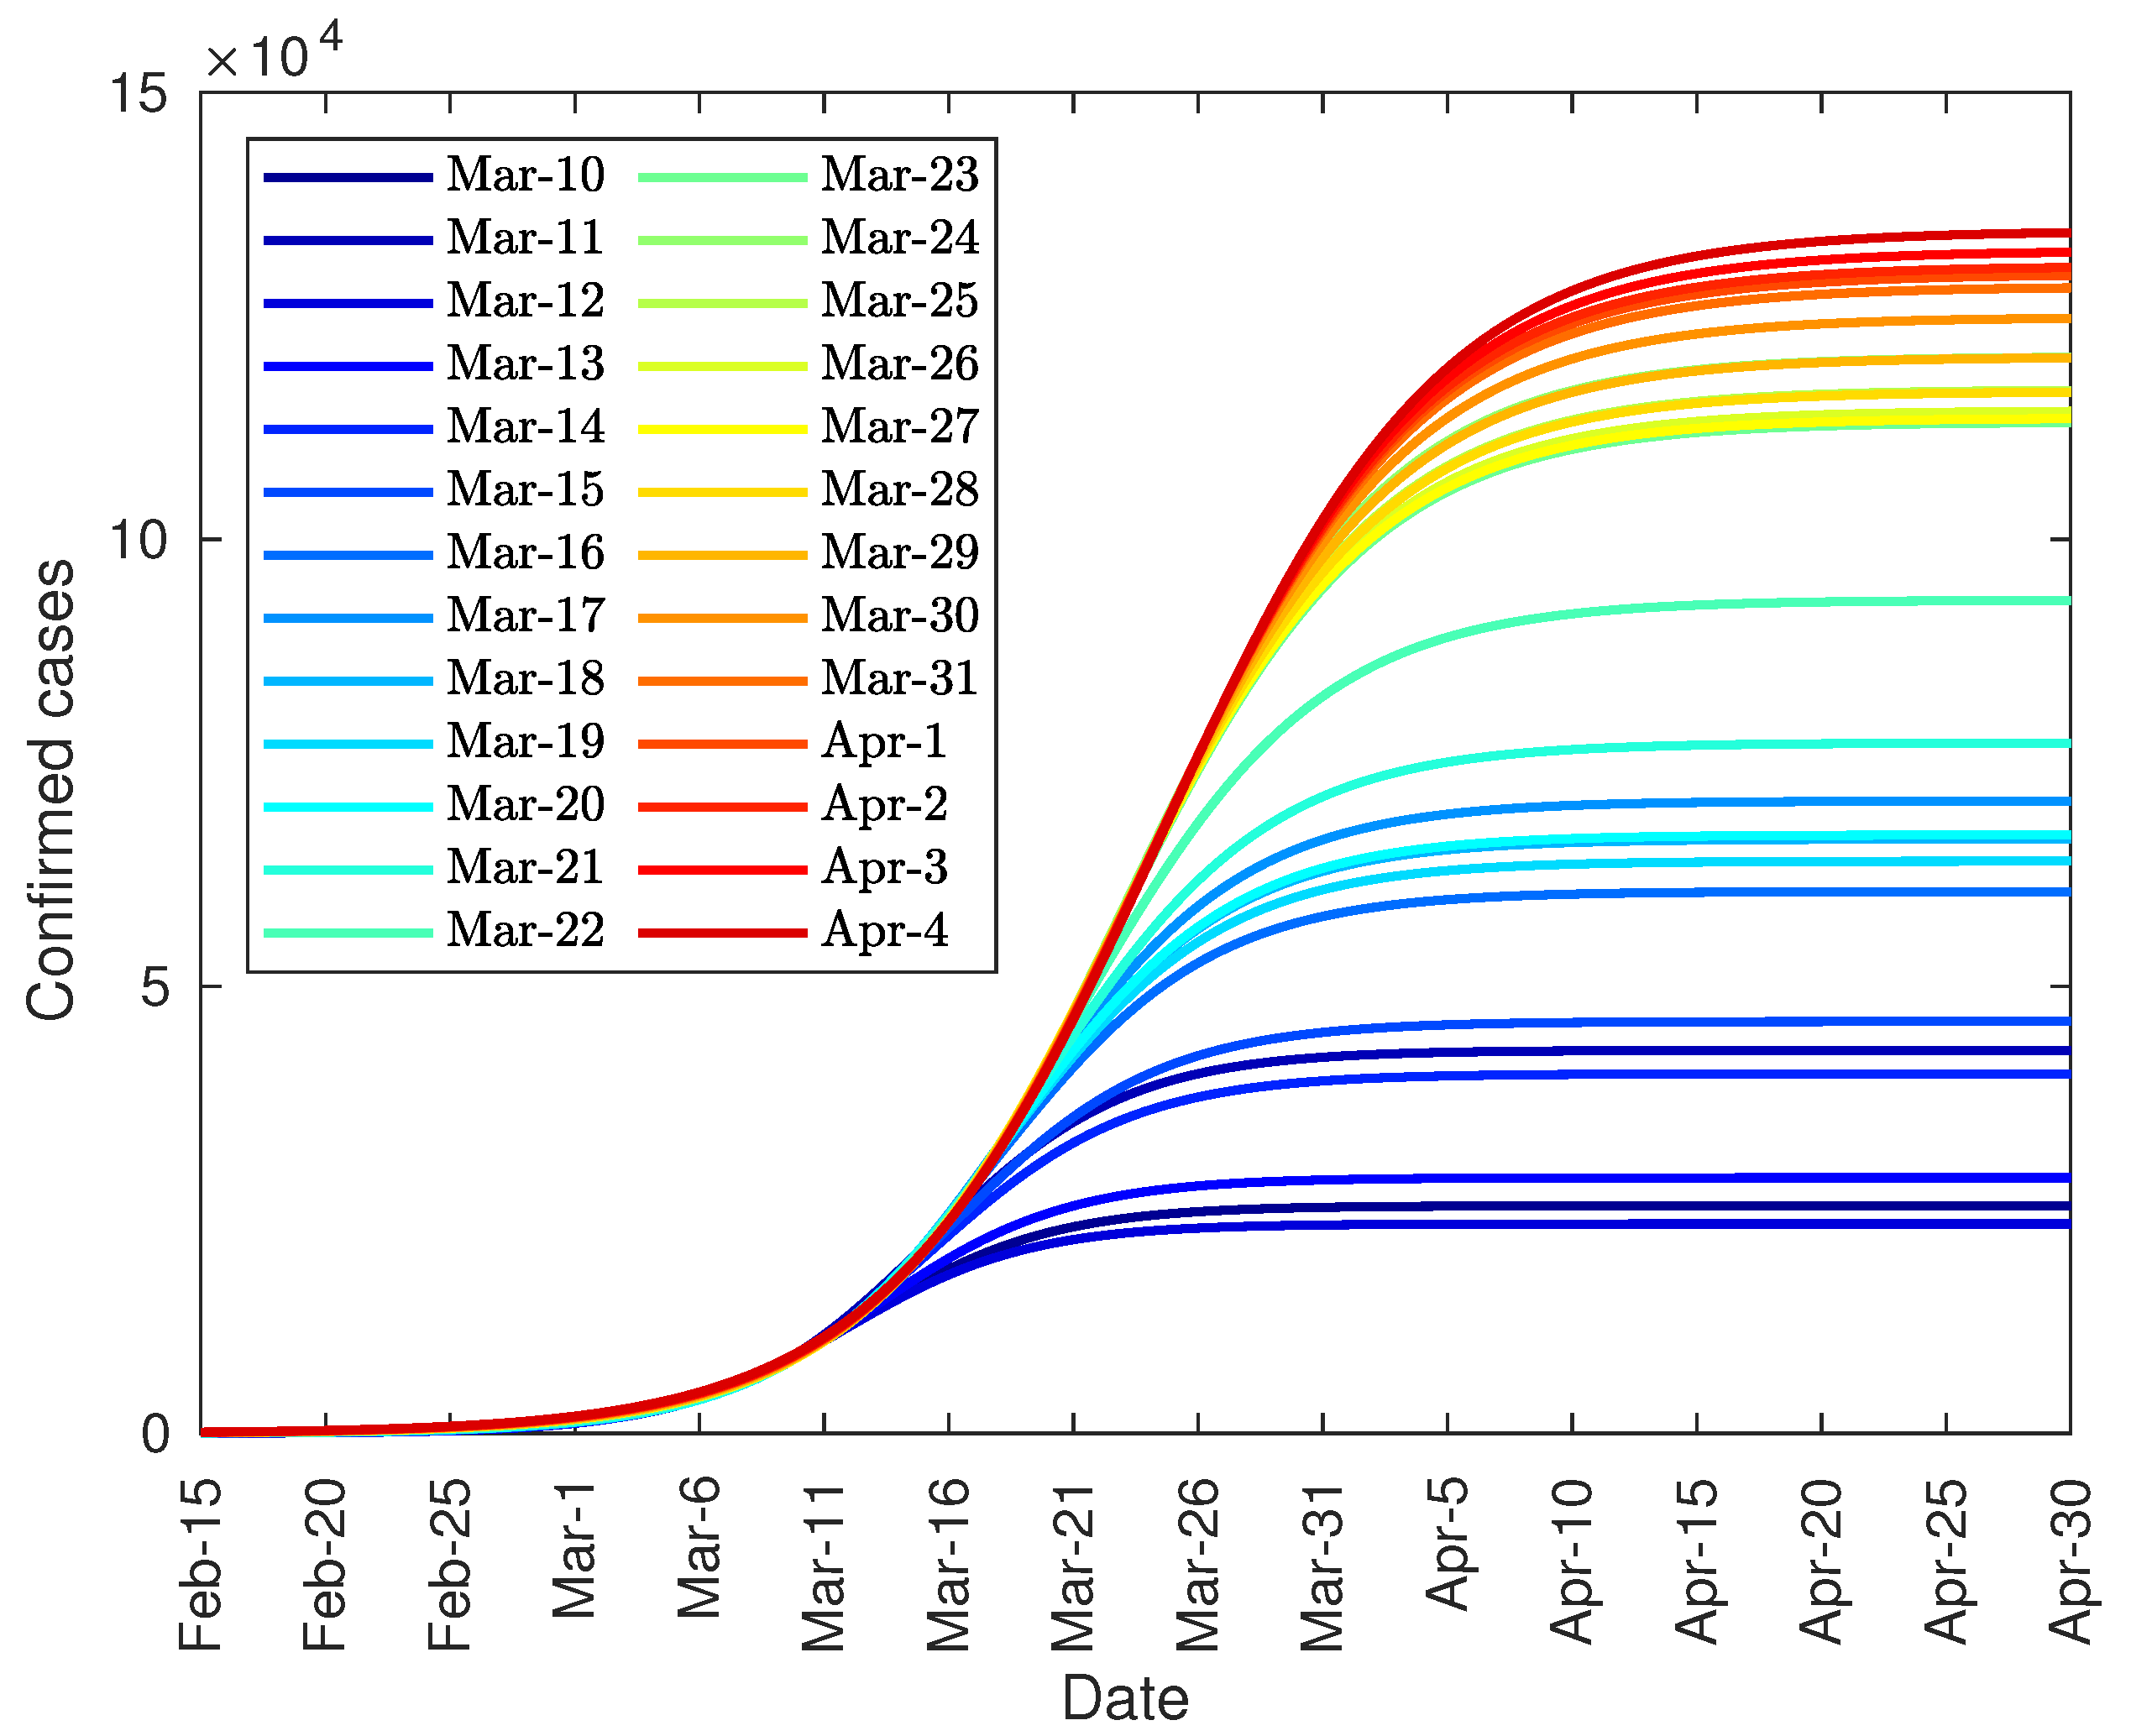
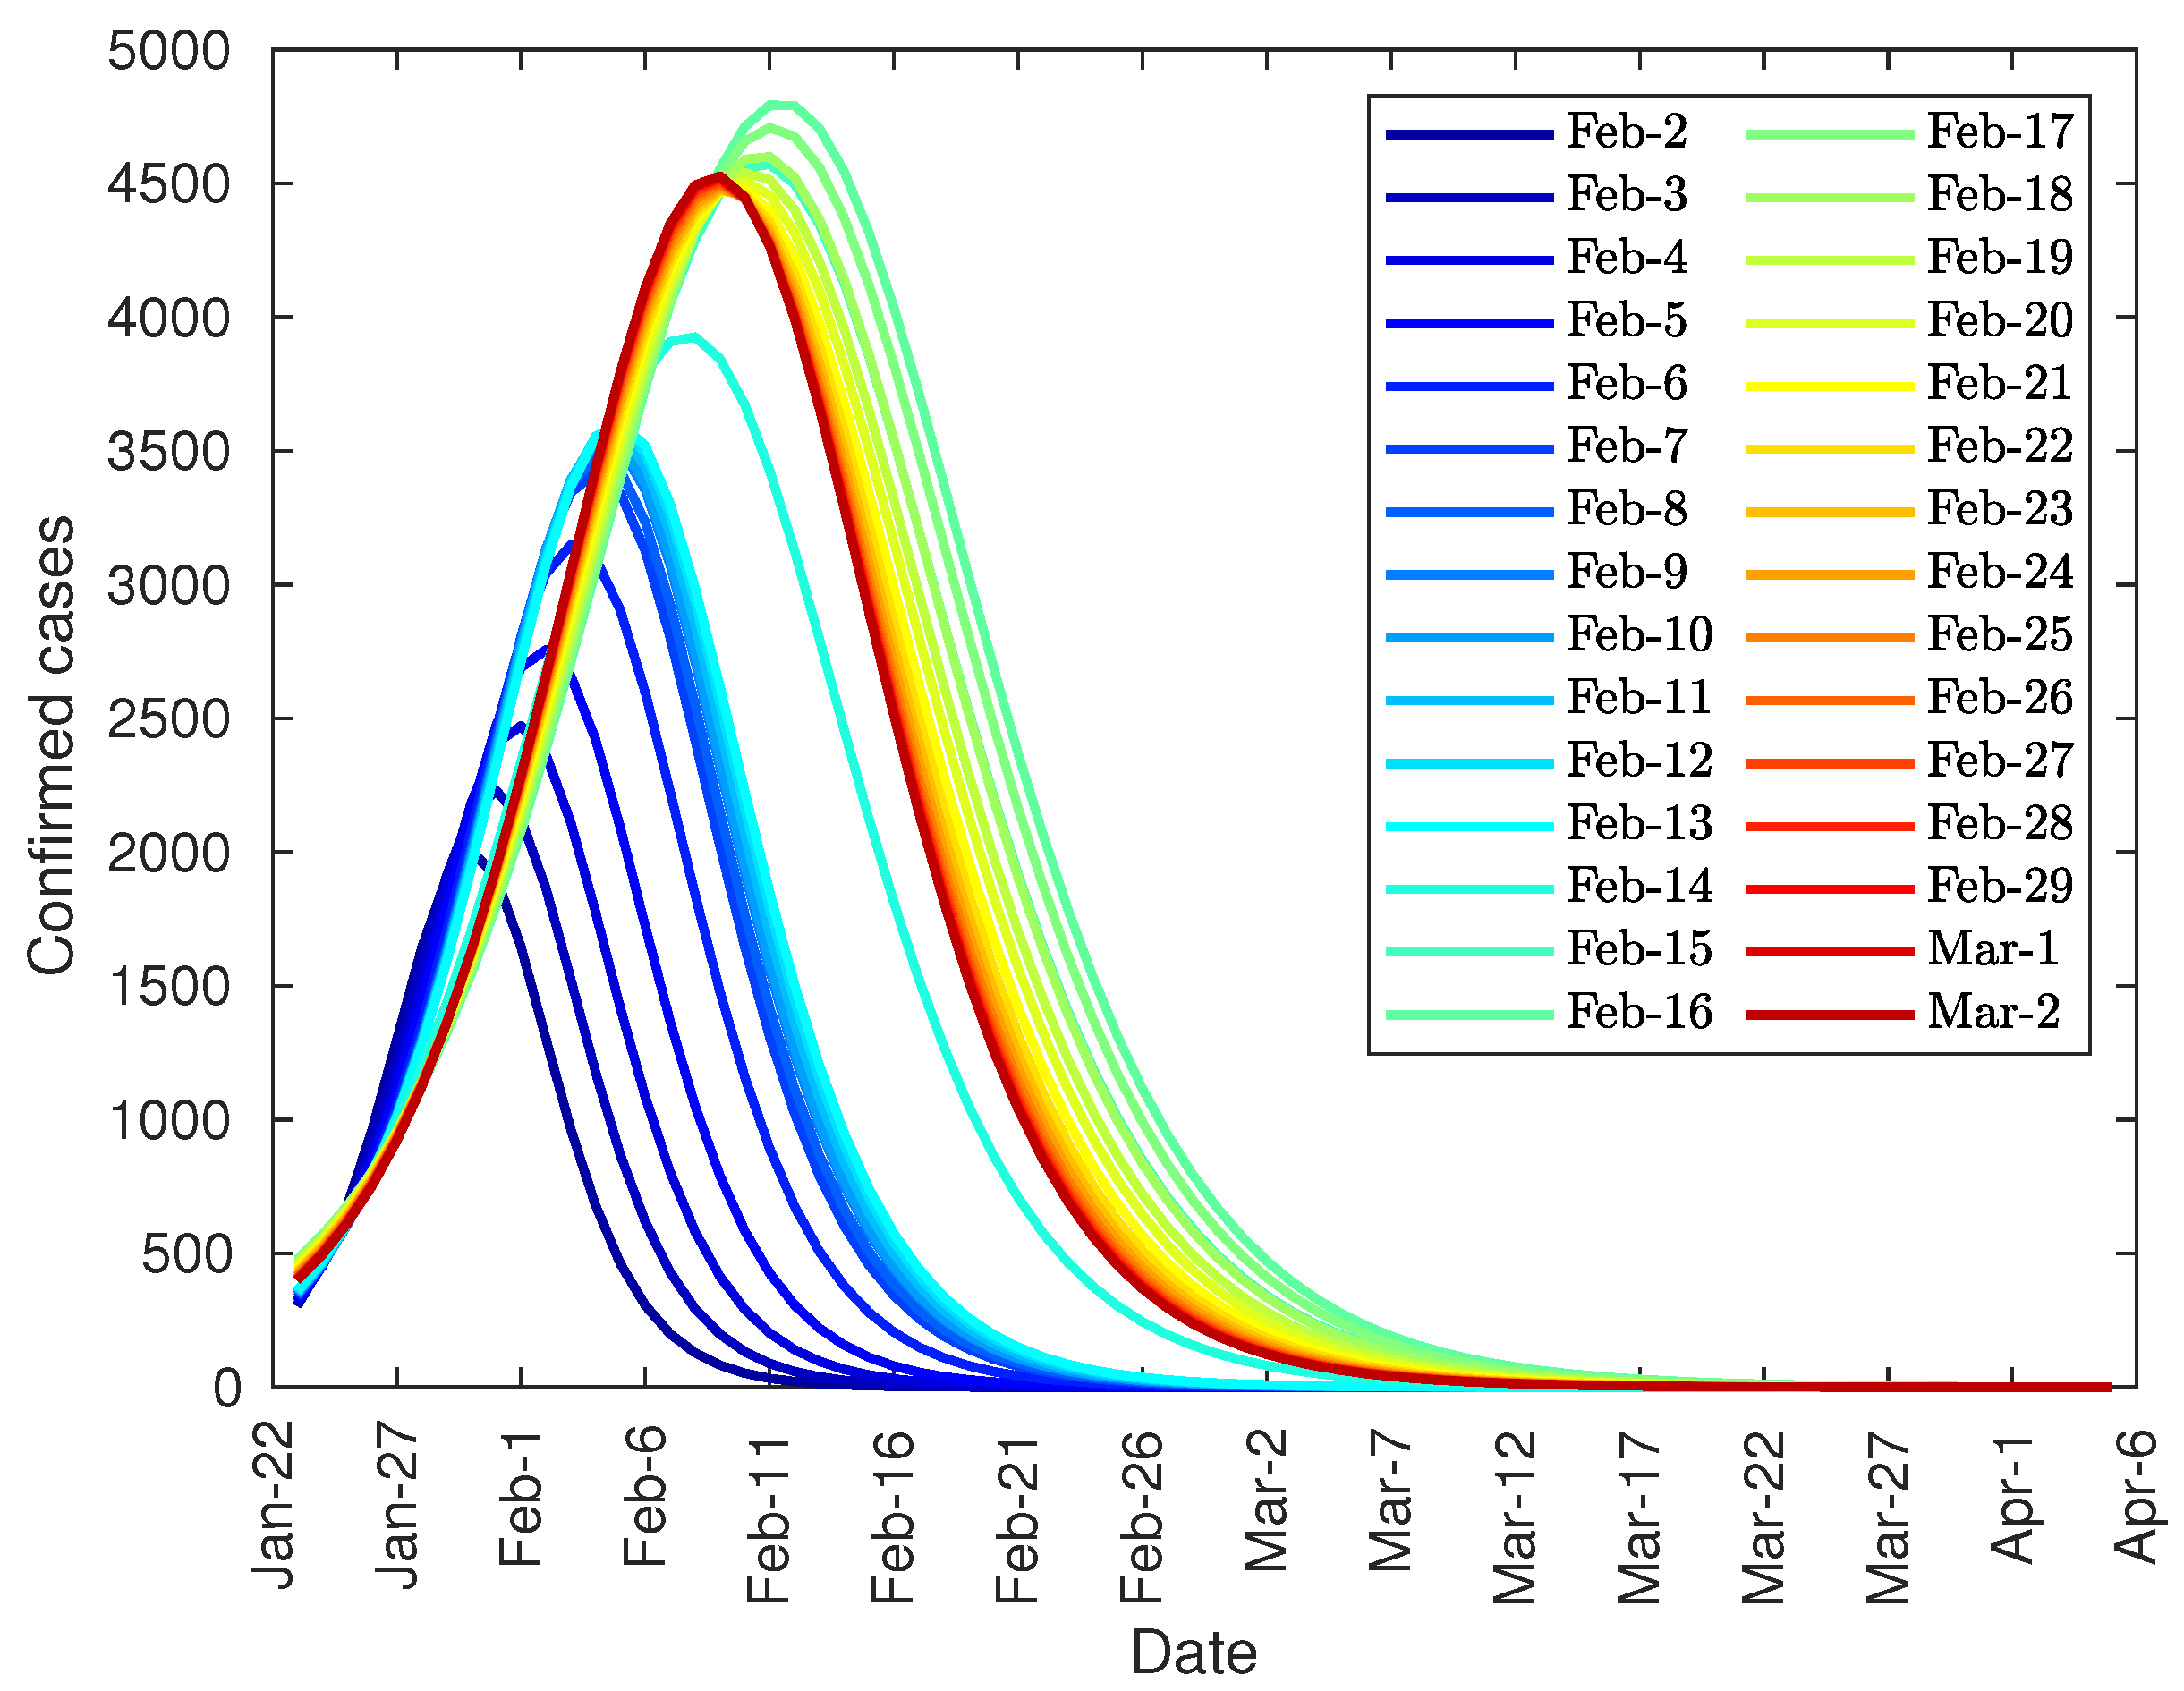
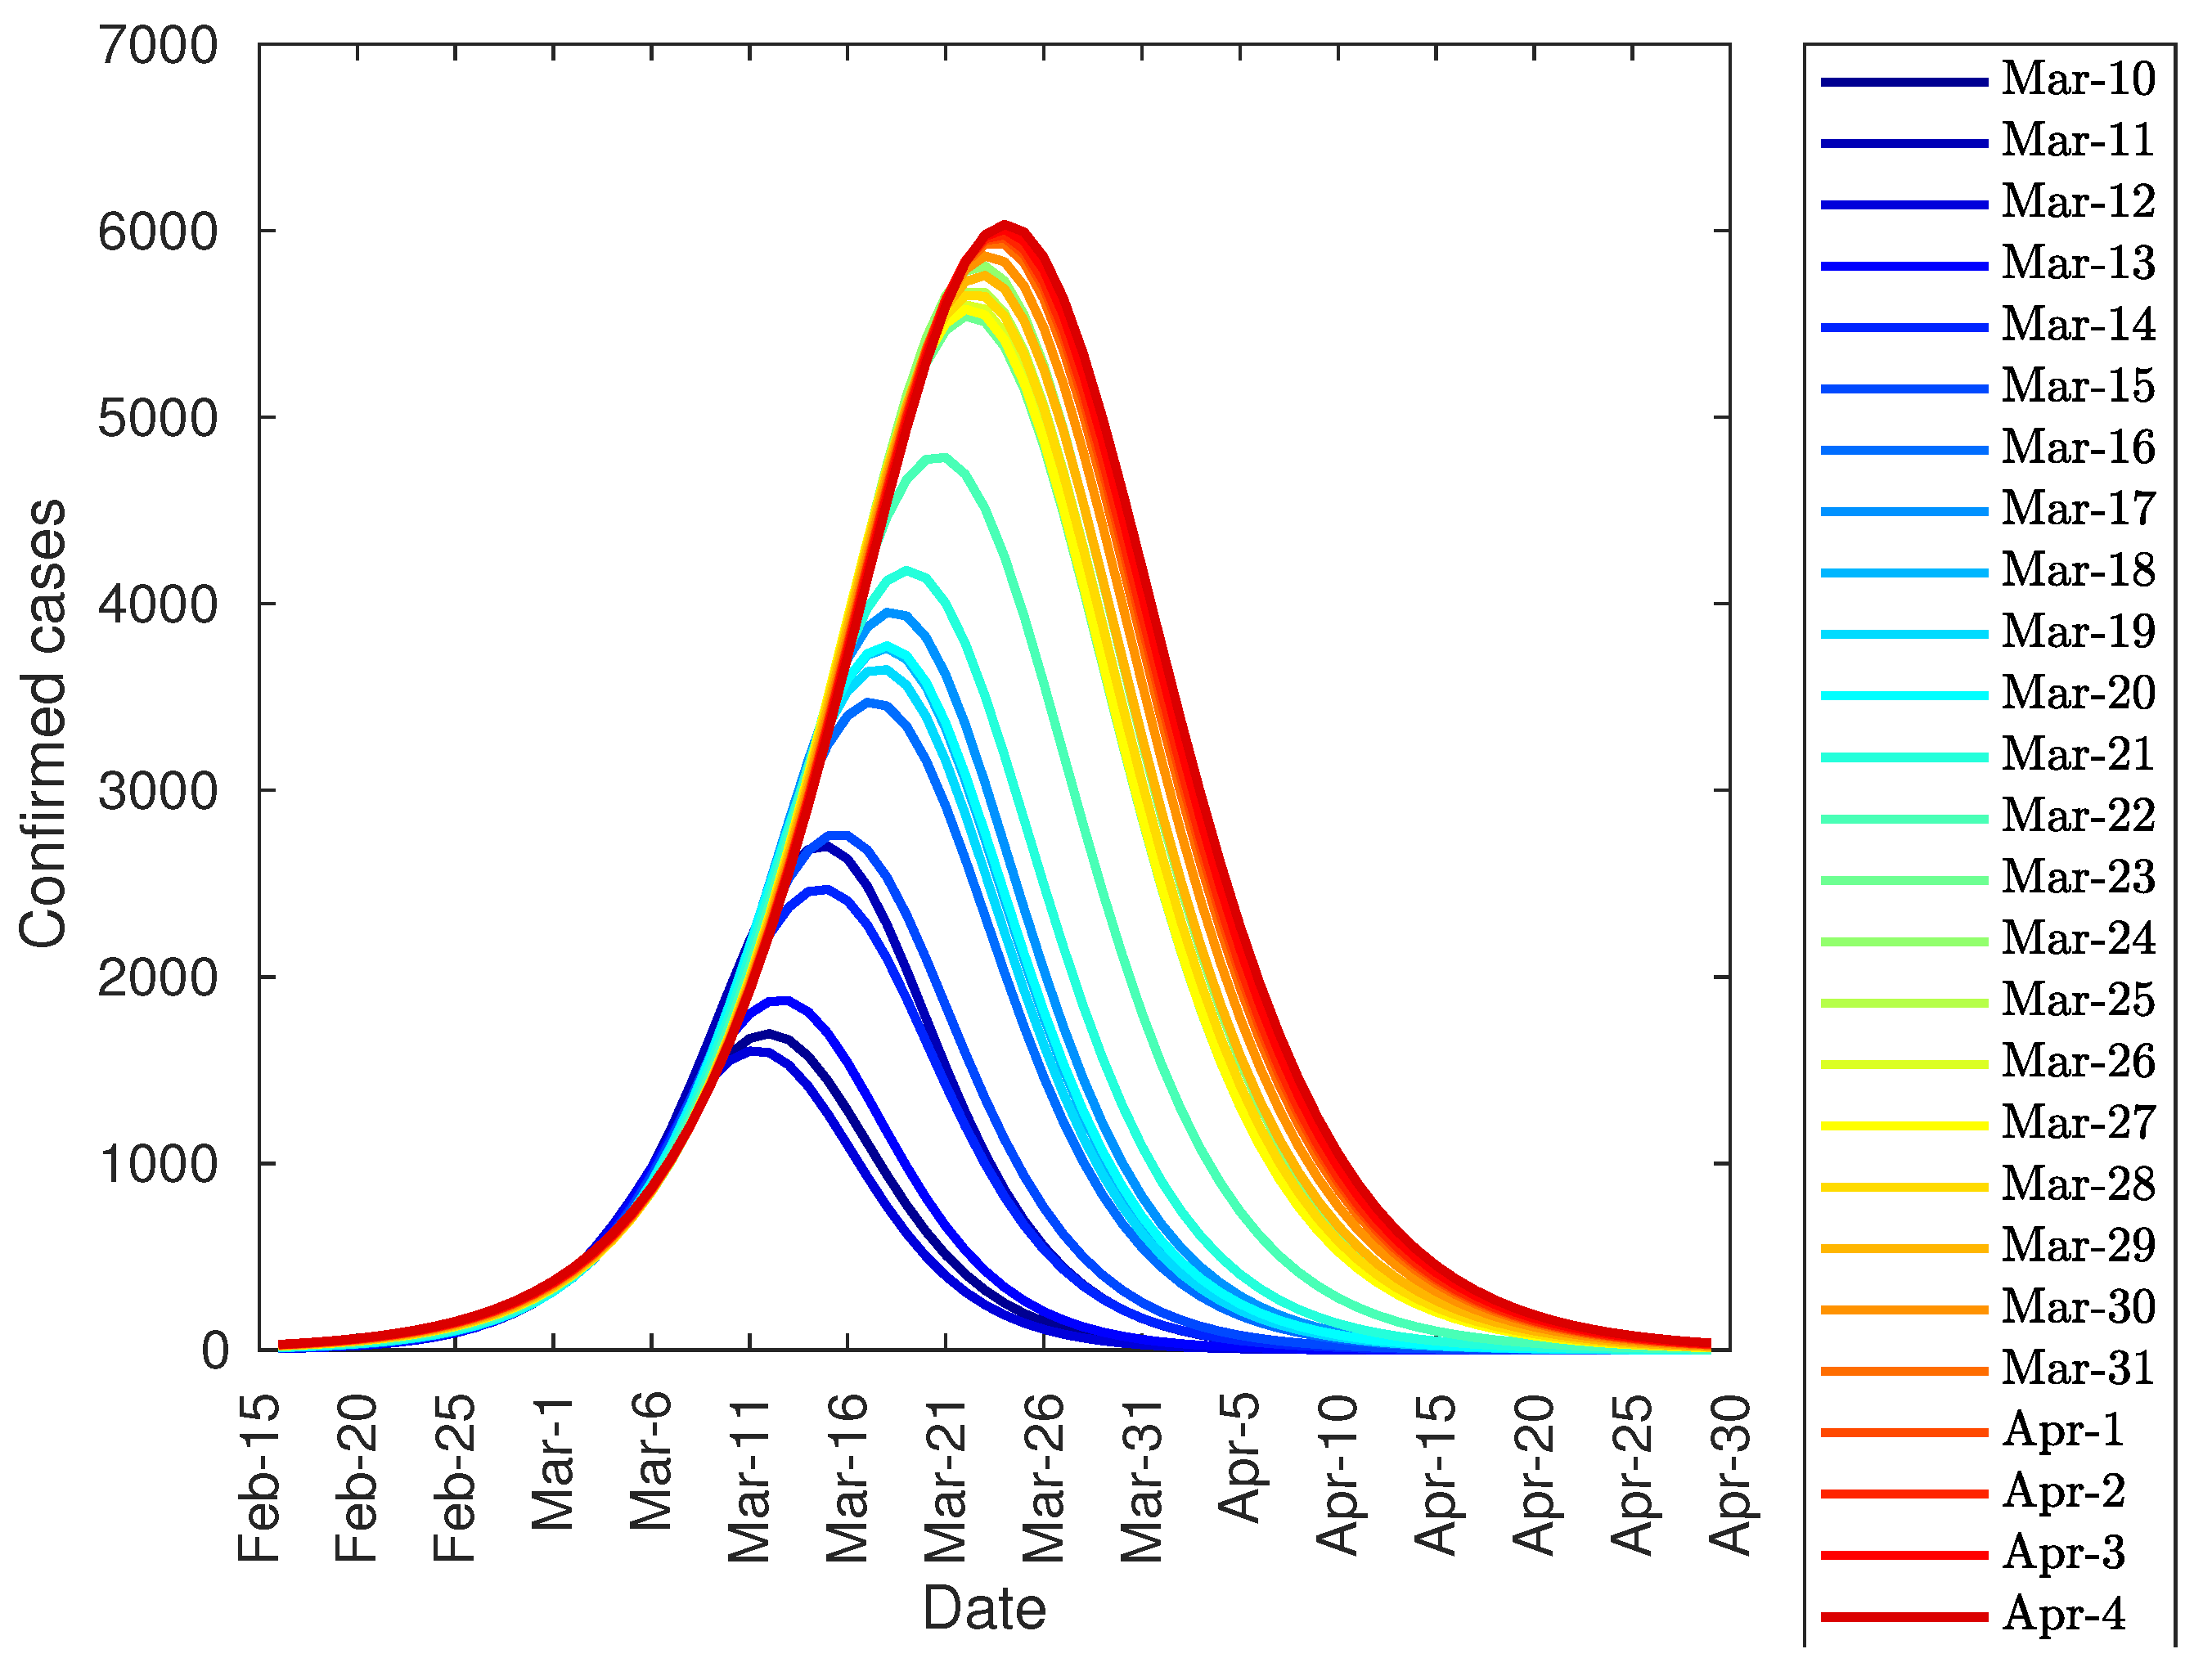
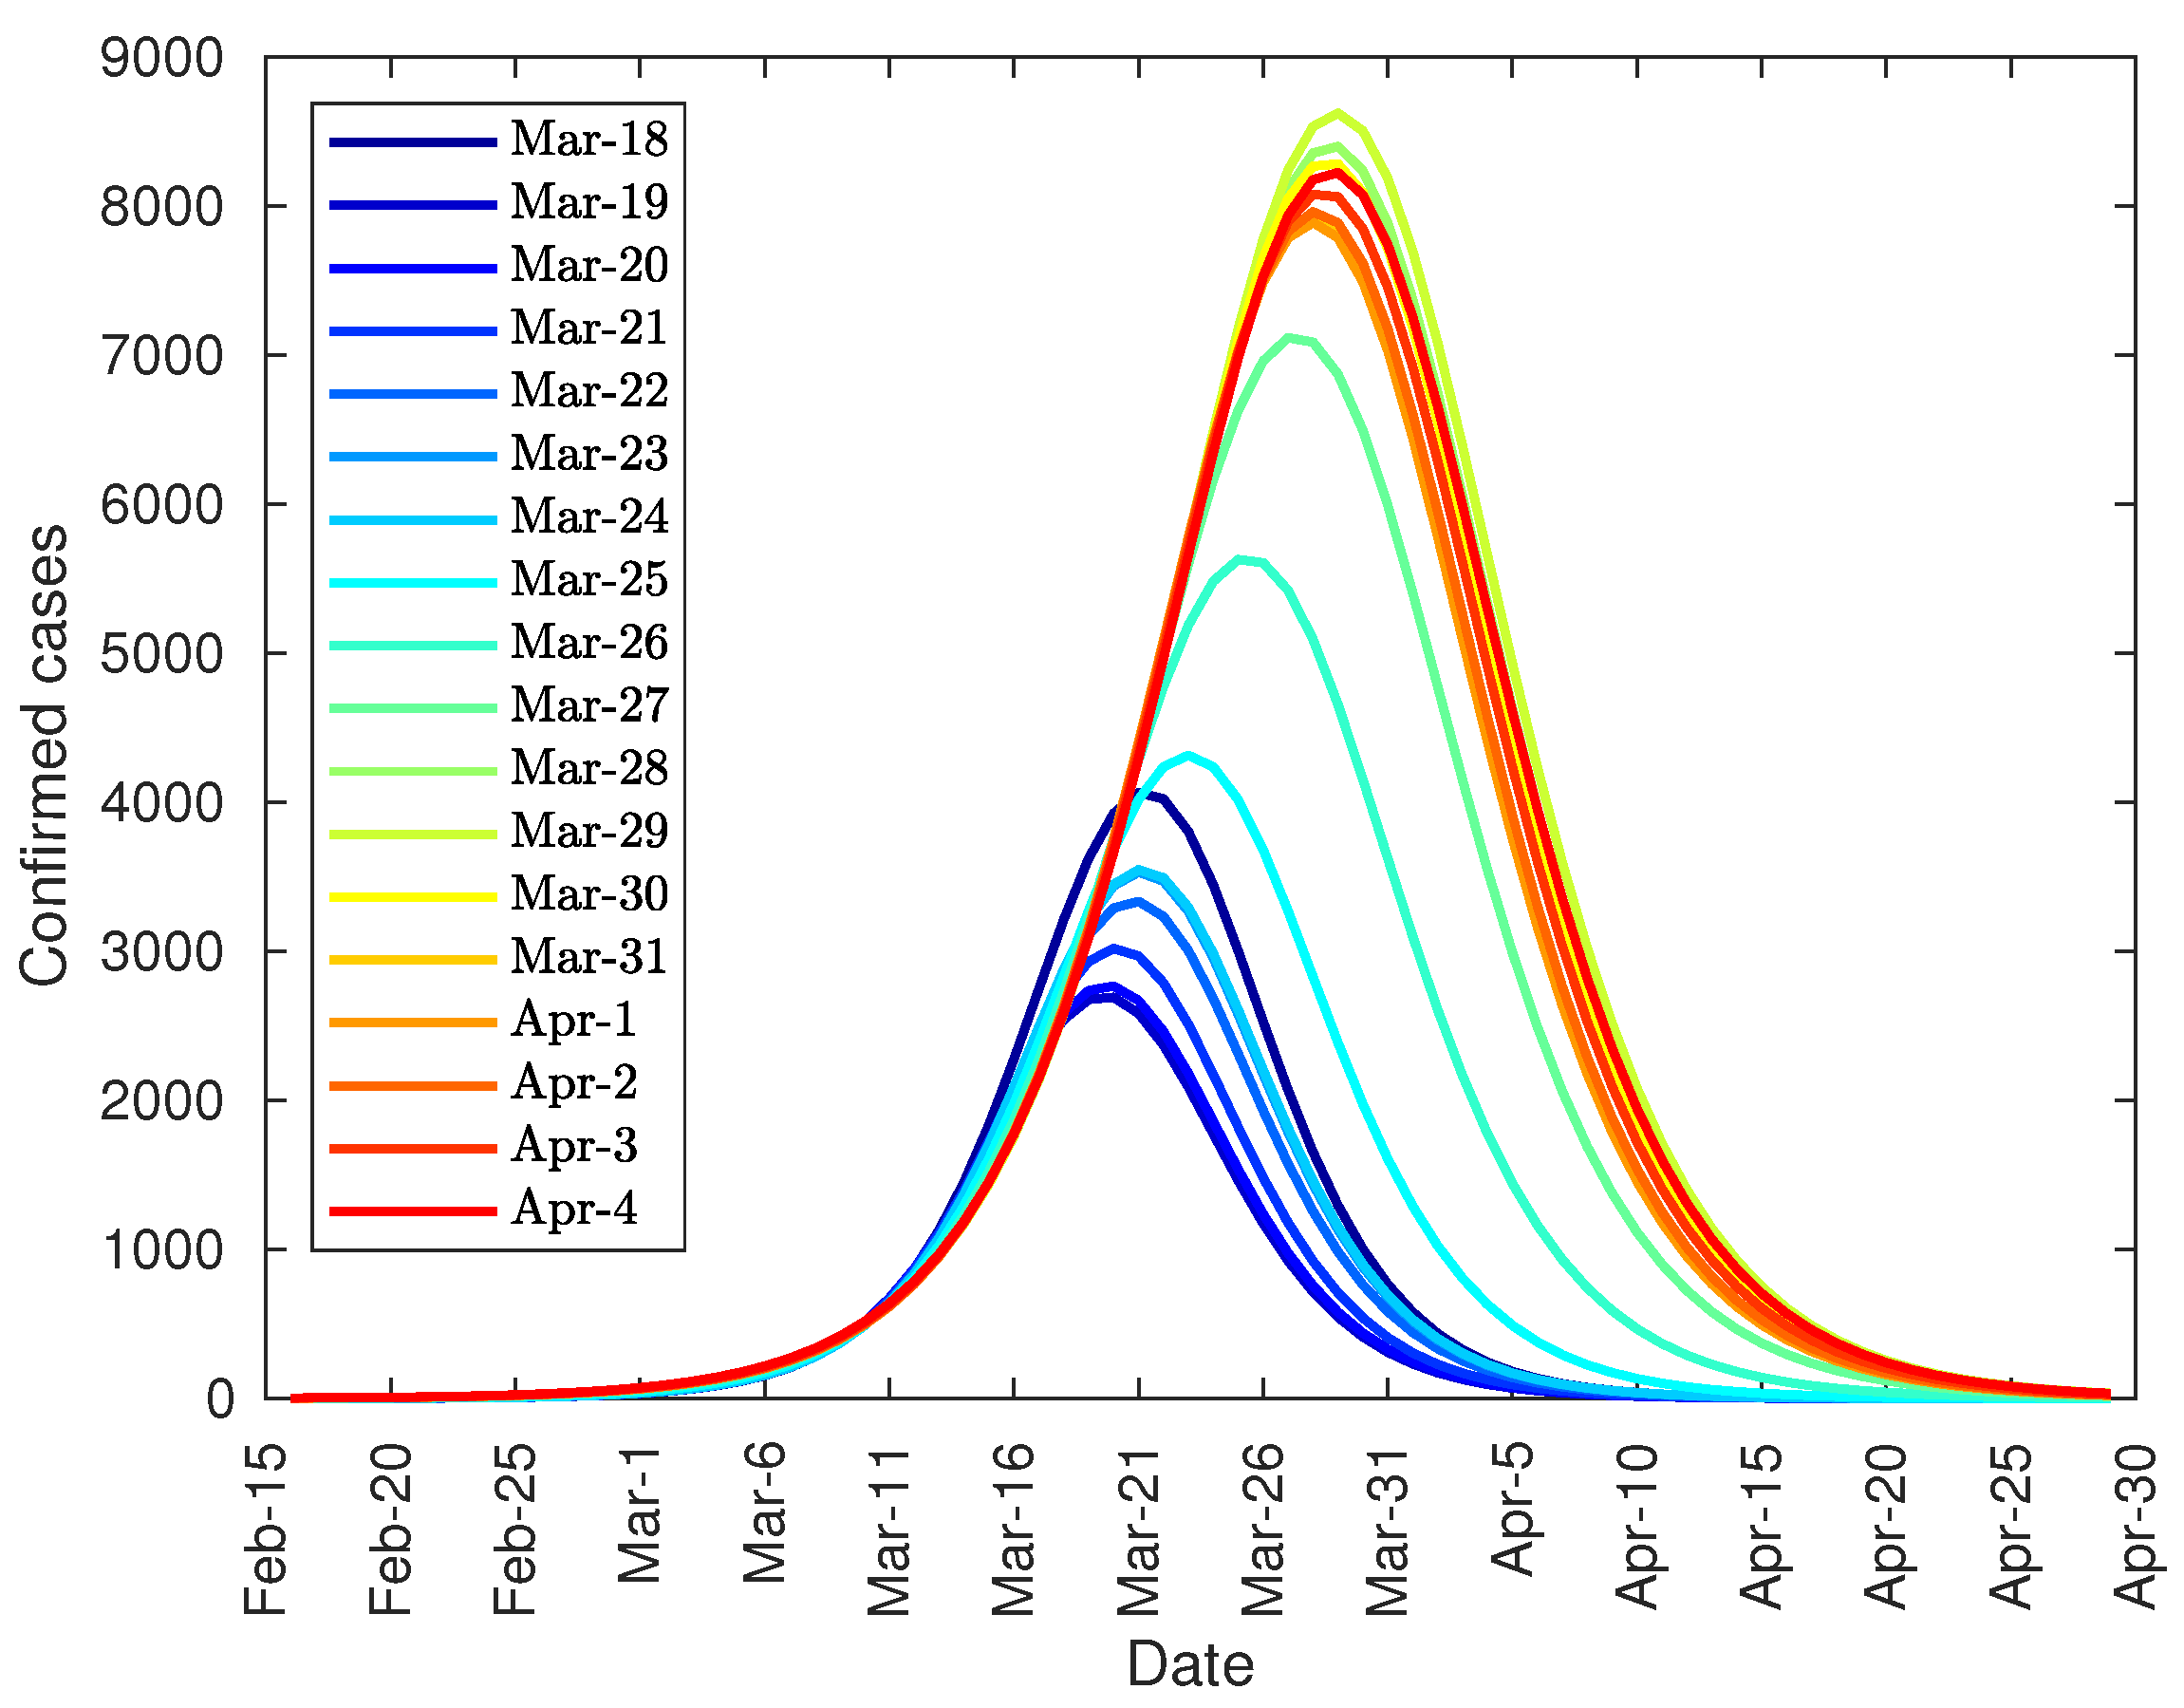
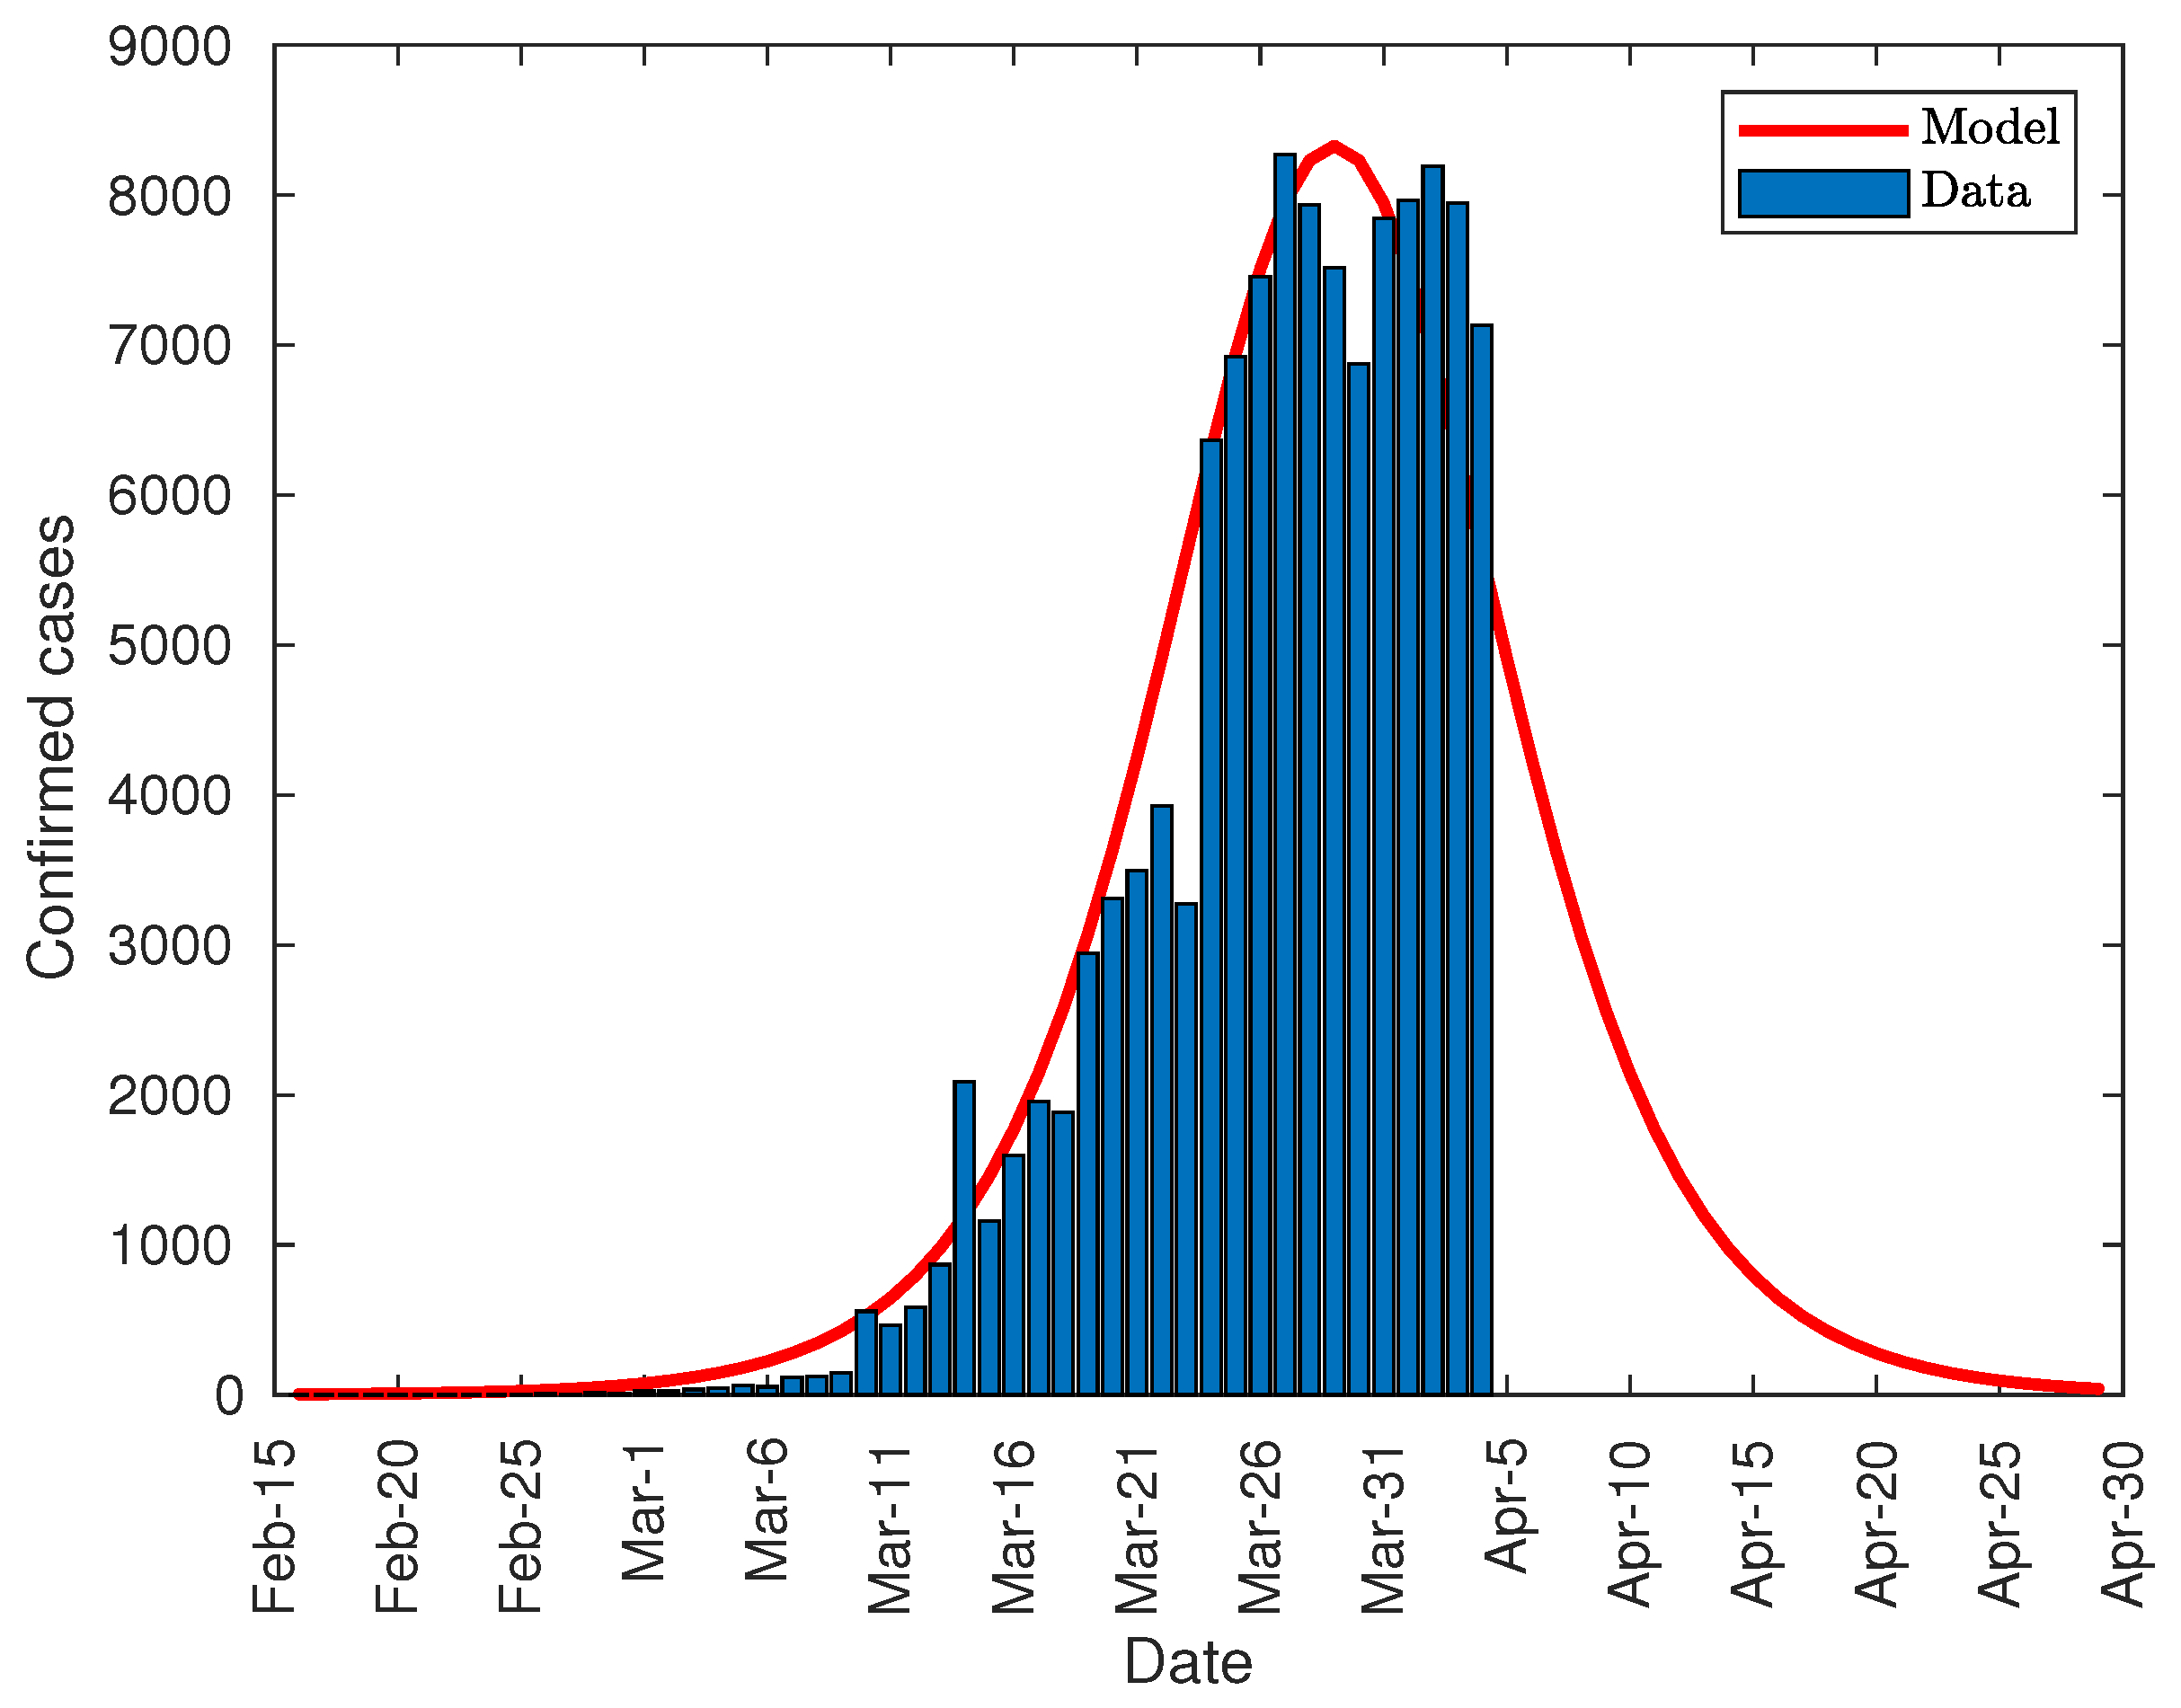
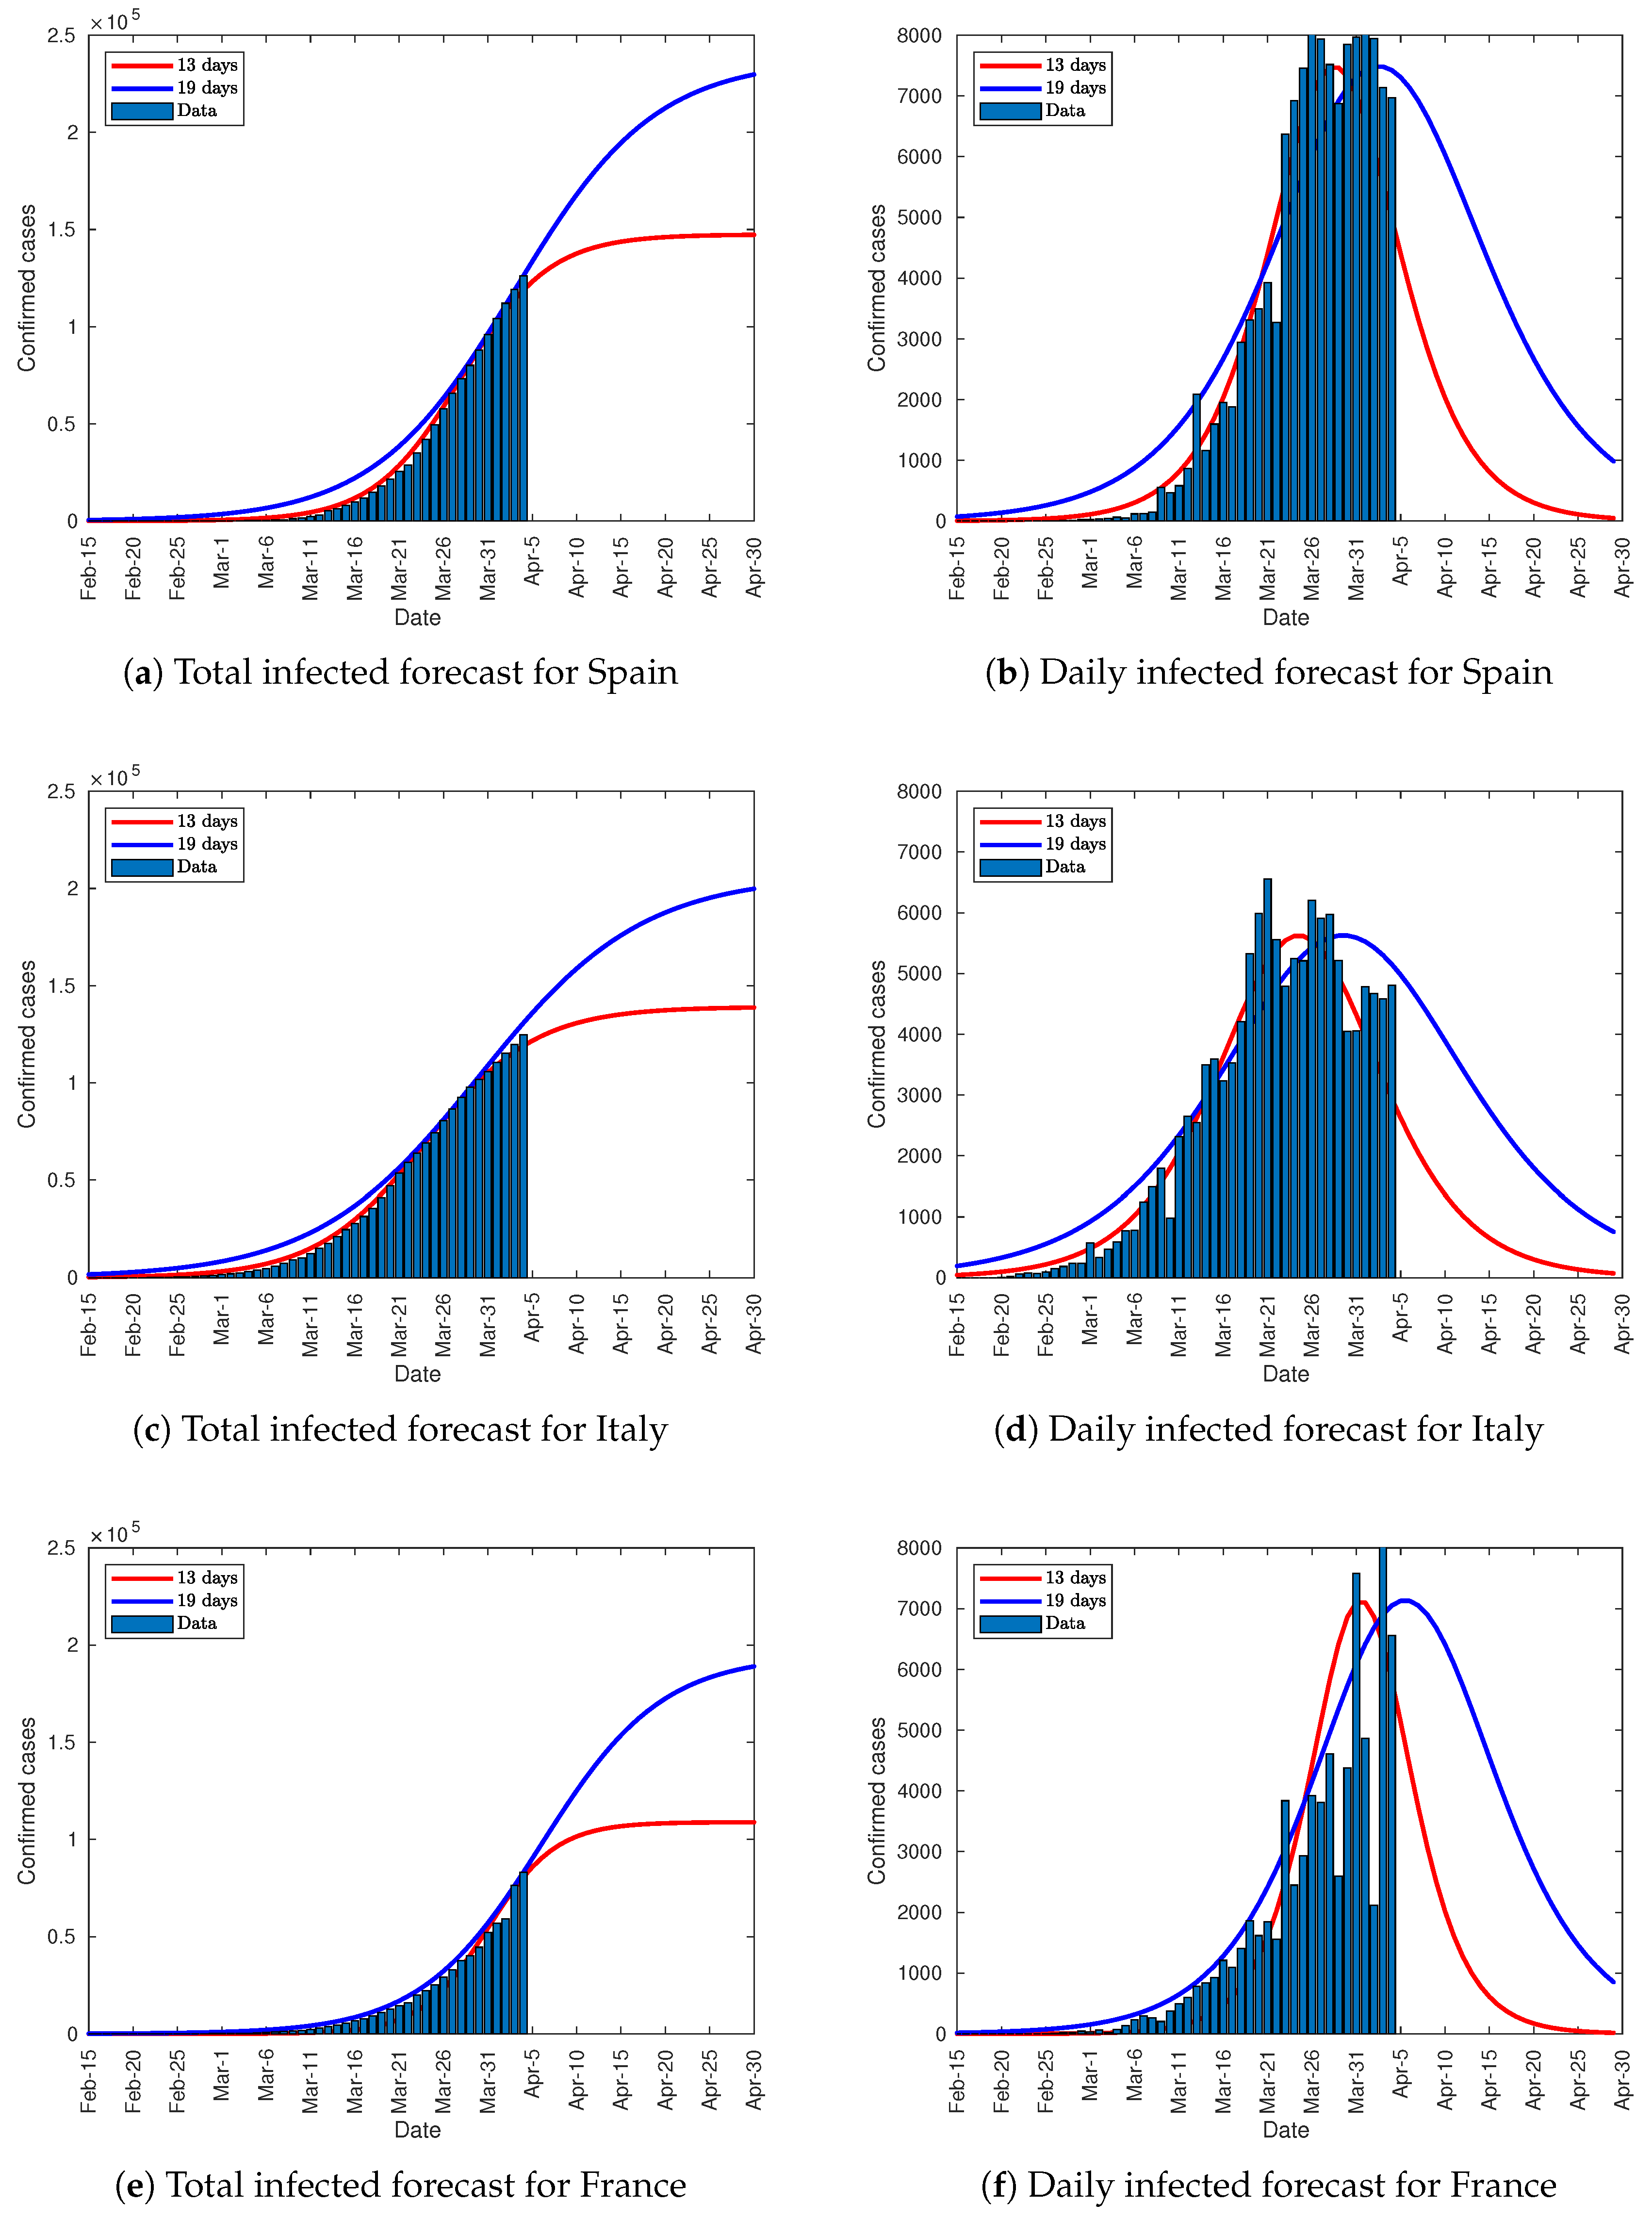
3.4. Predictive Model Parameter Identification
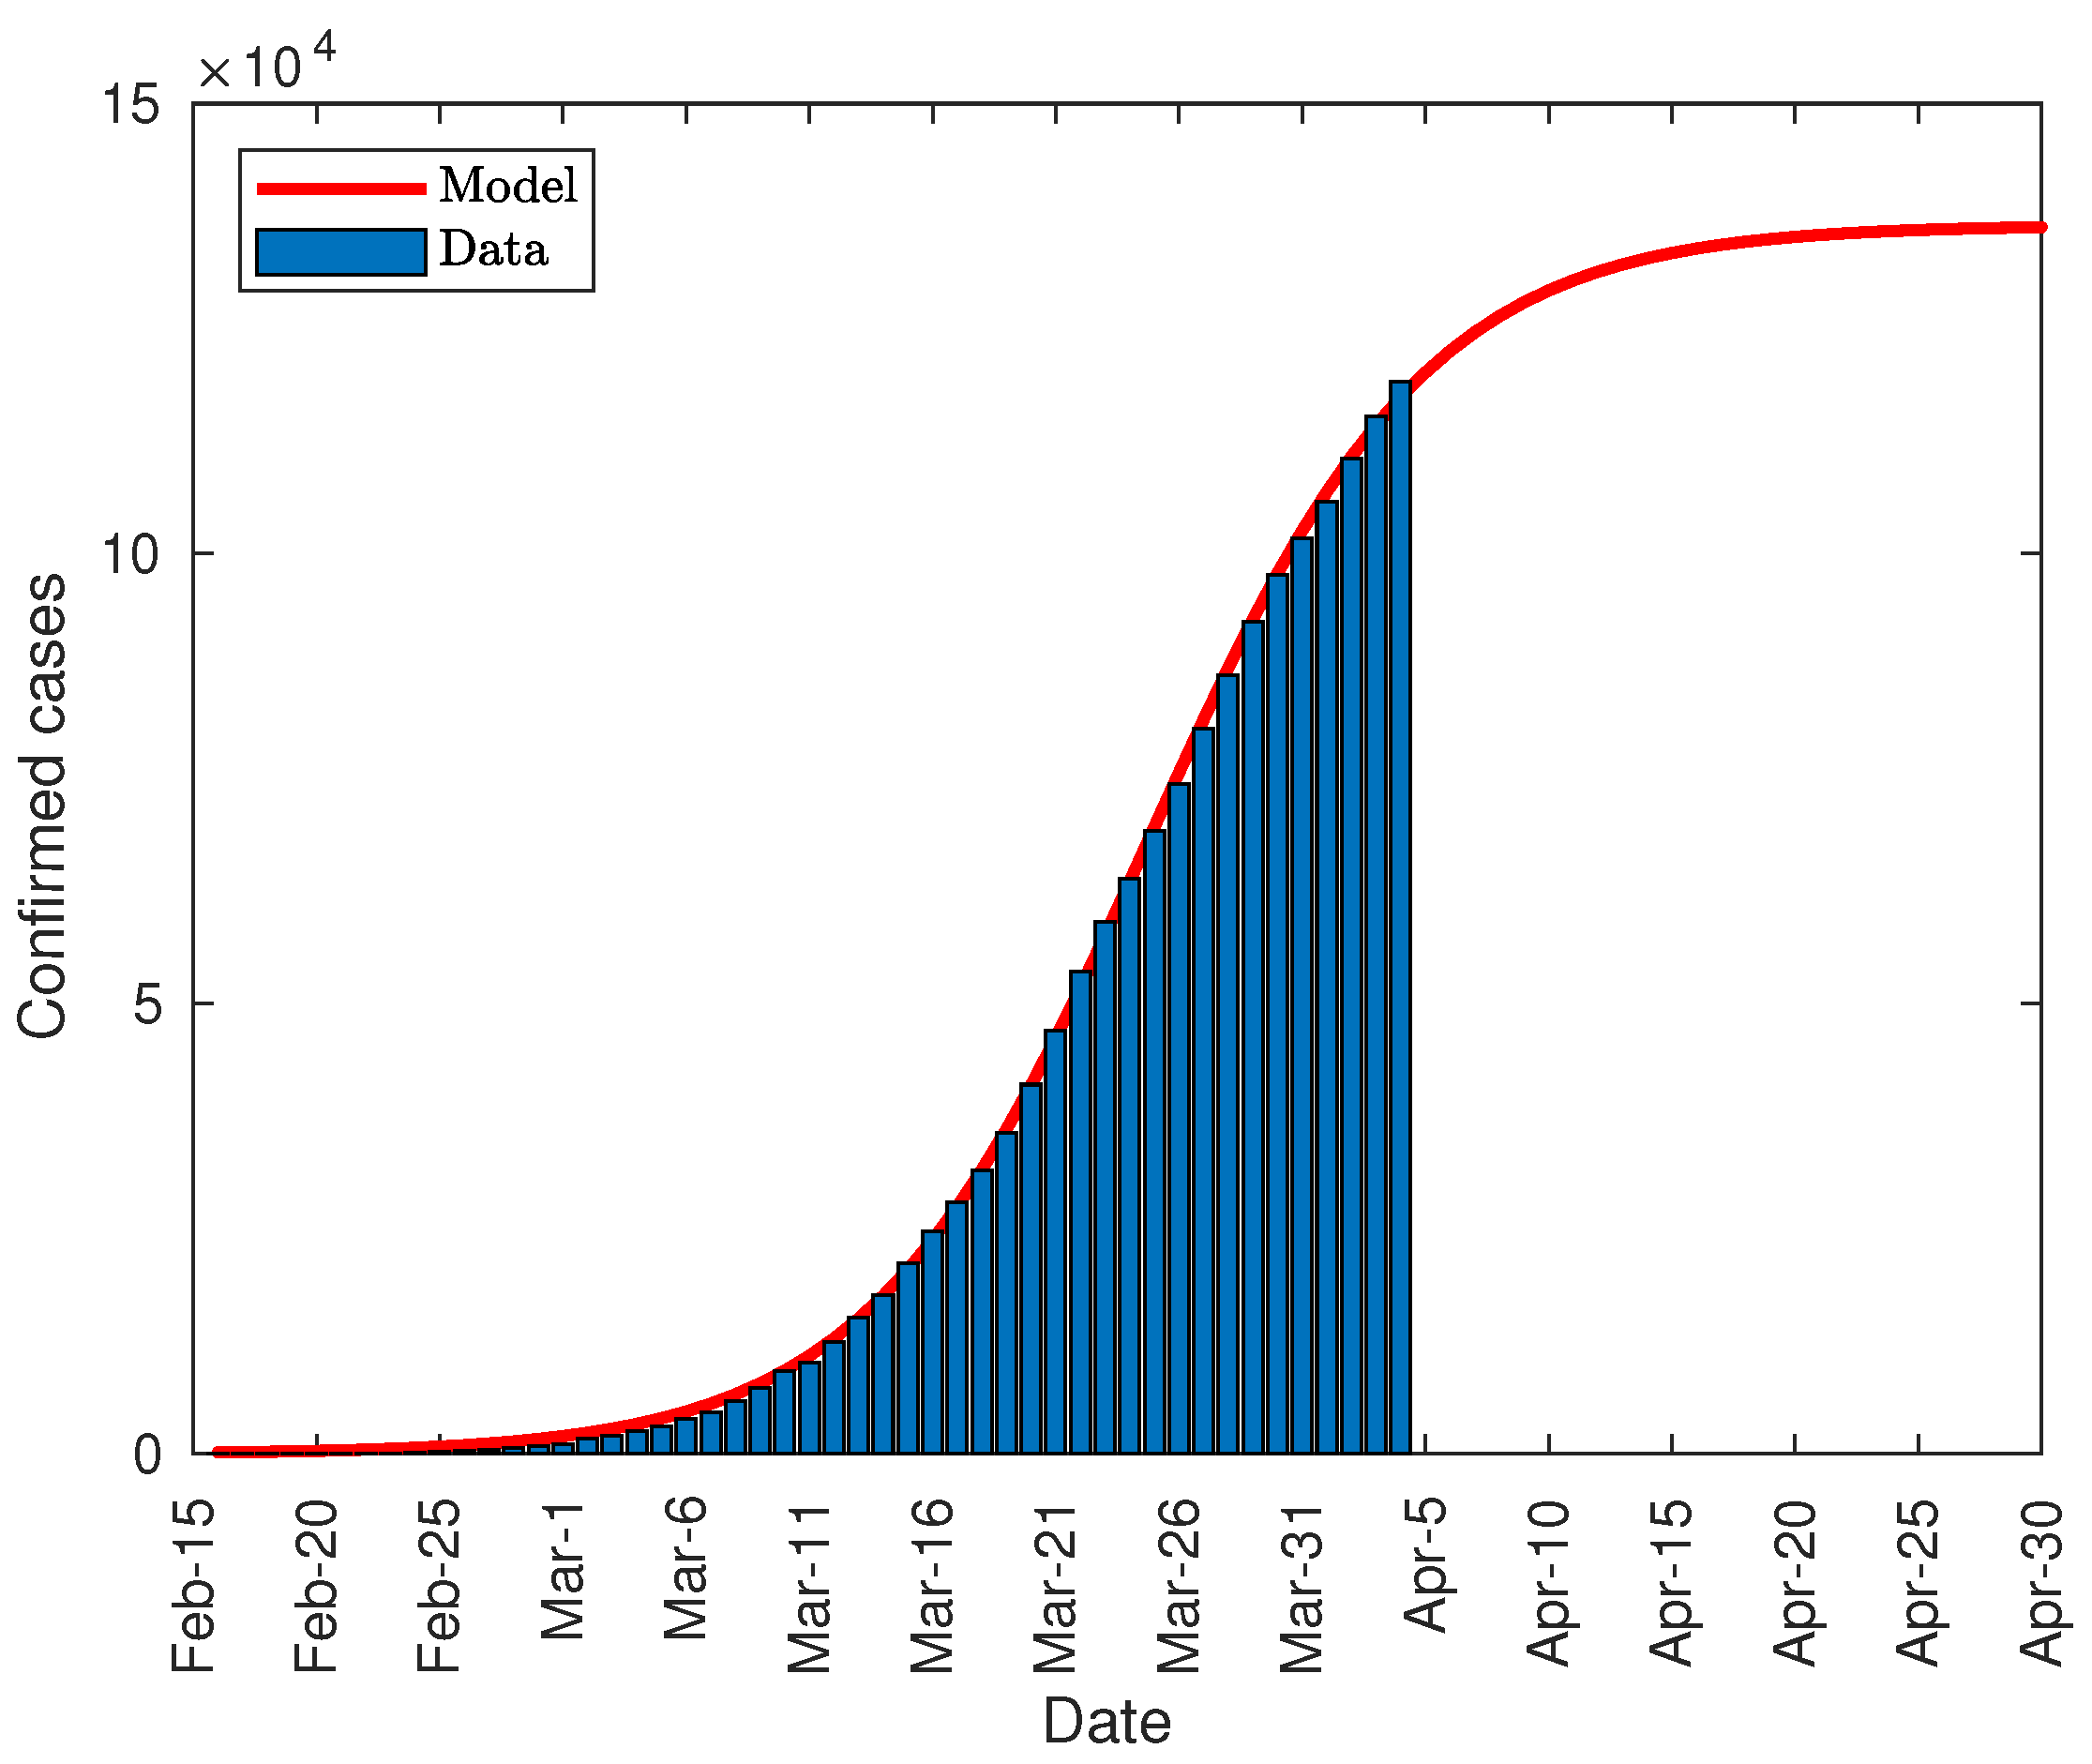
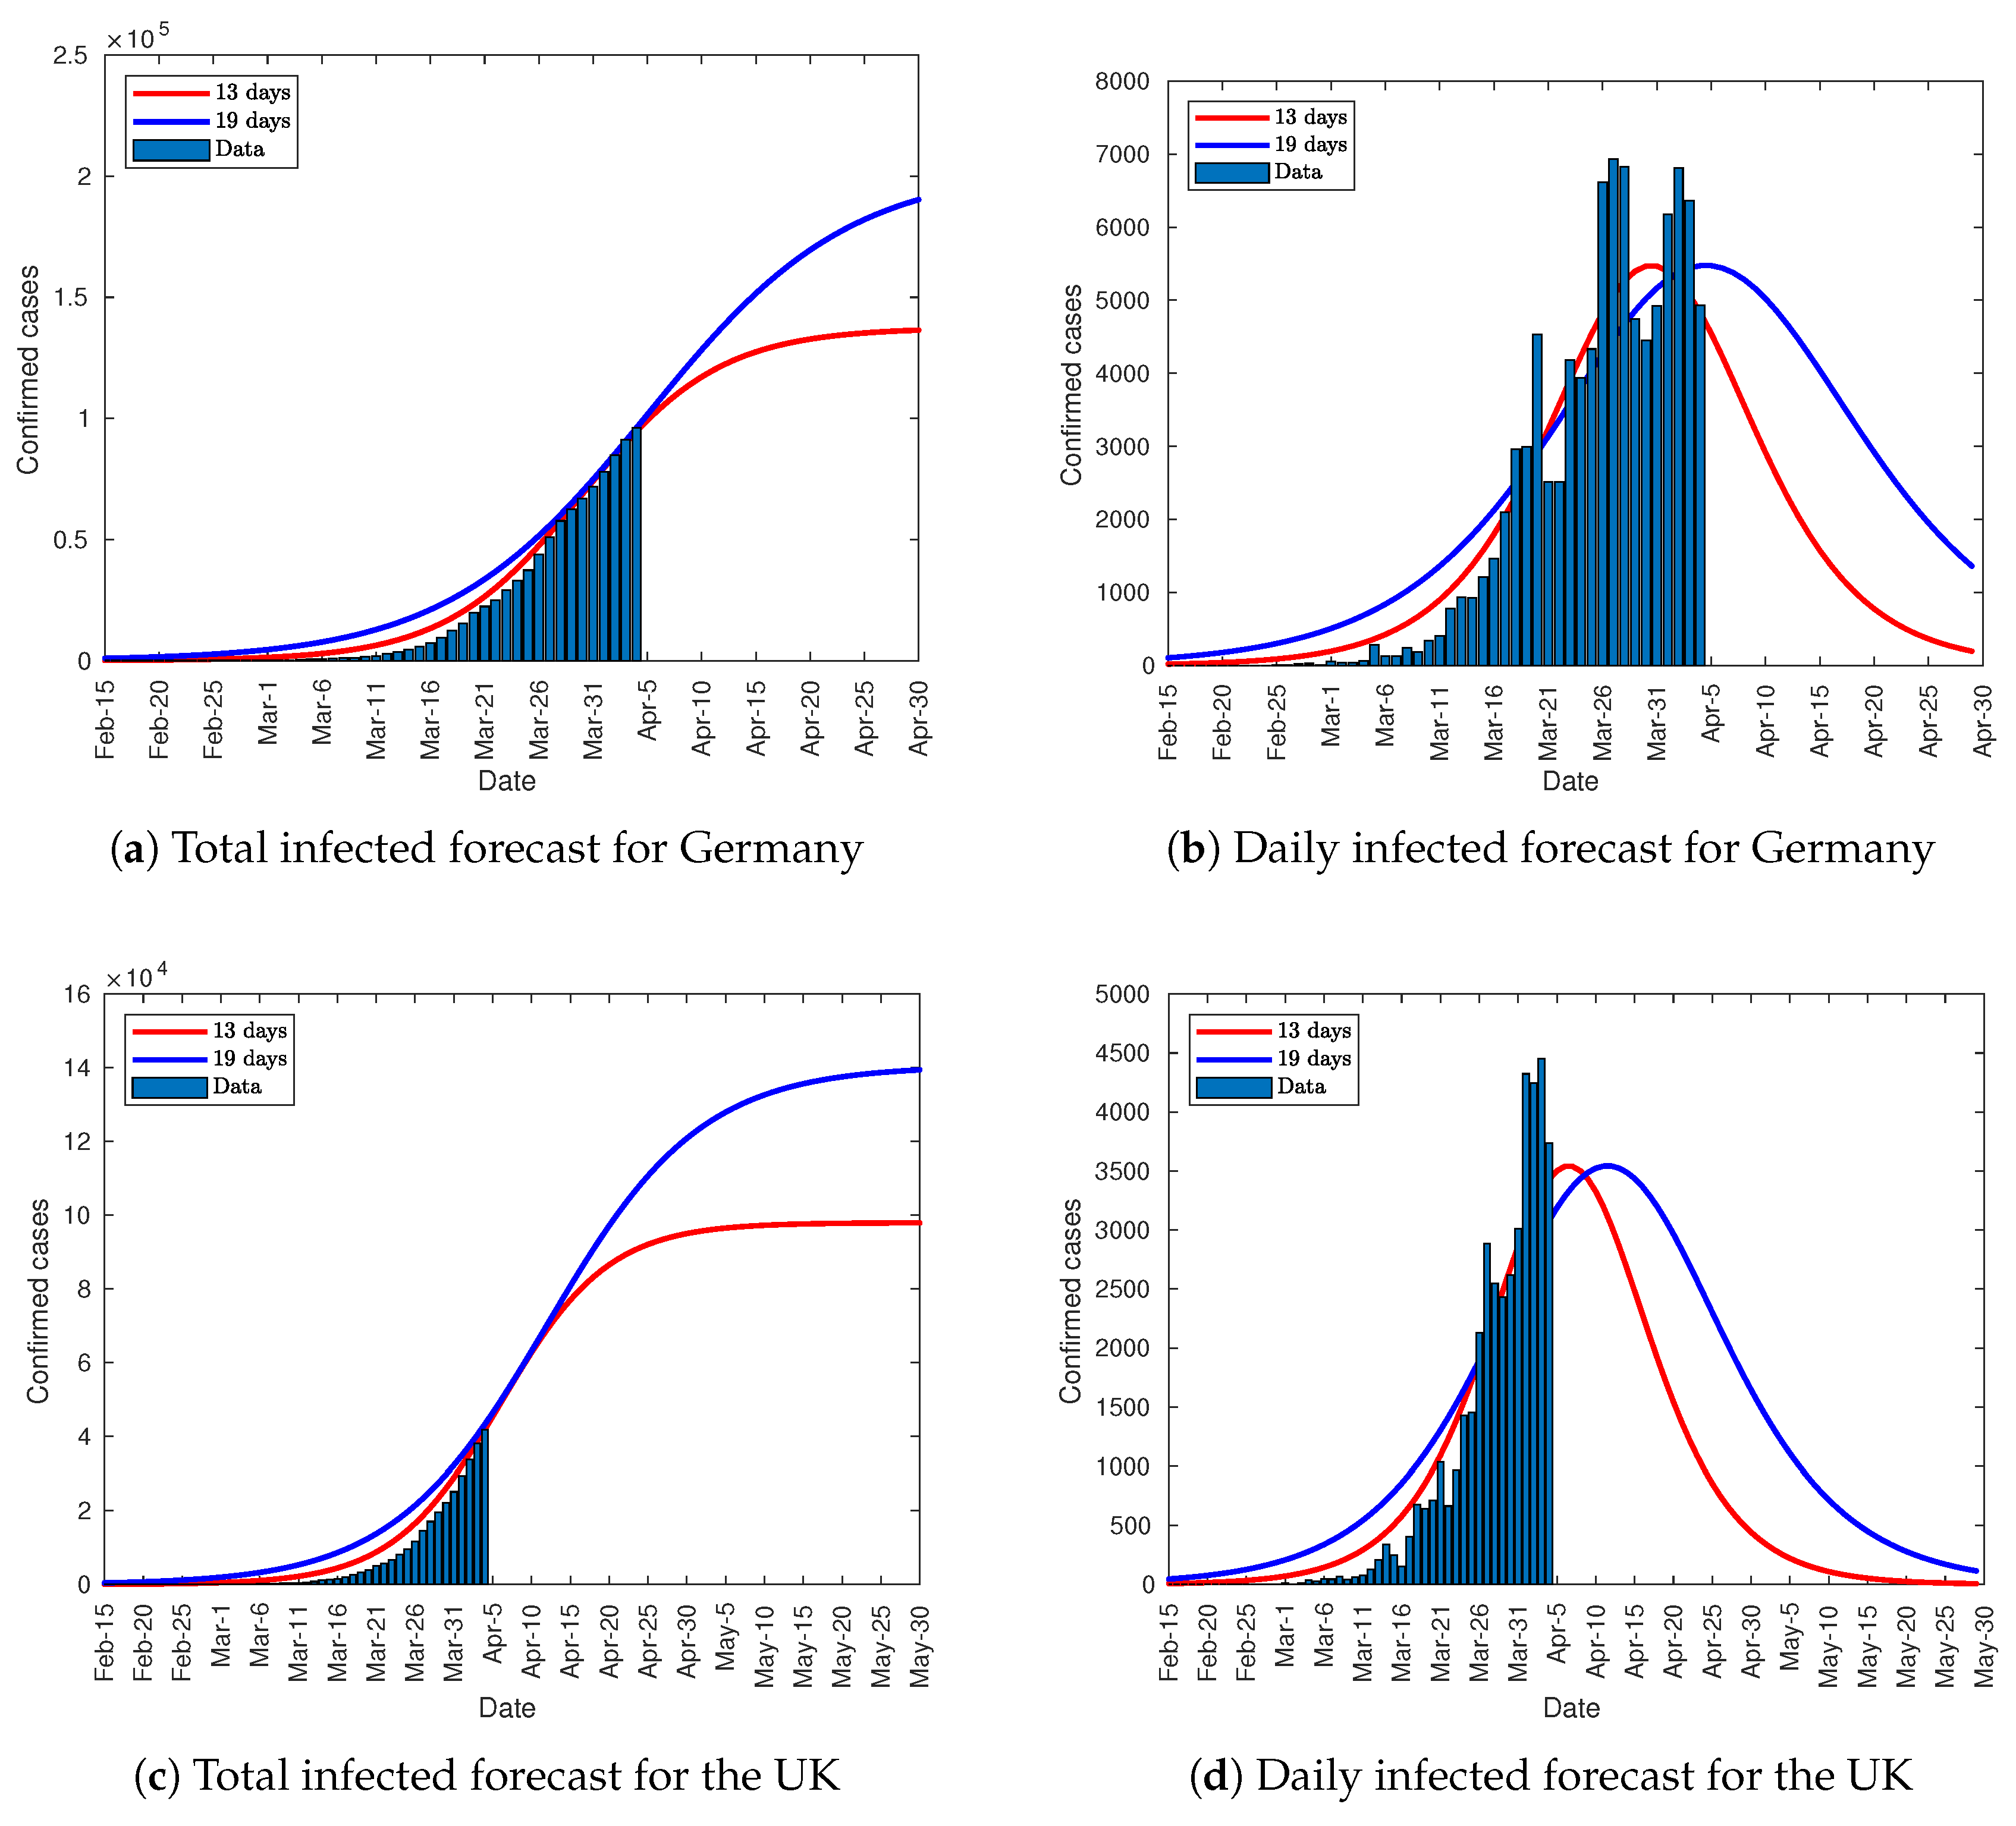
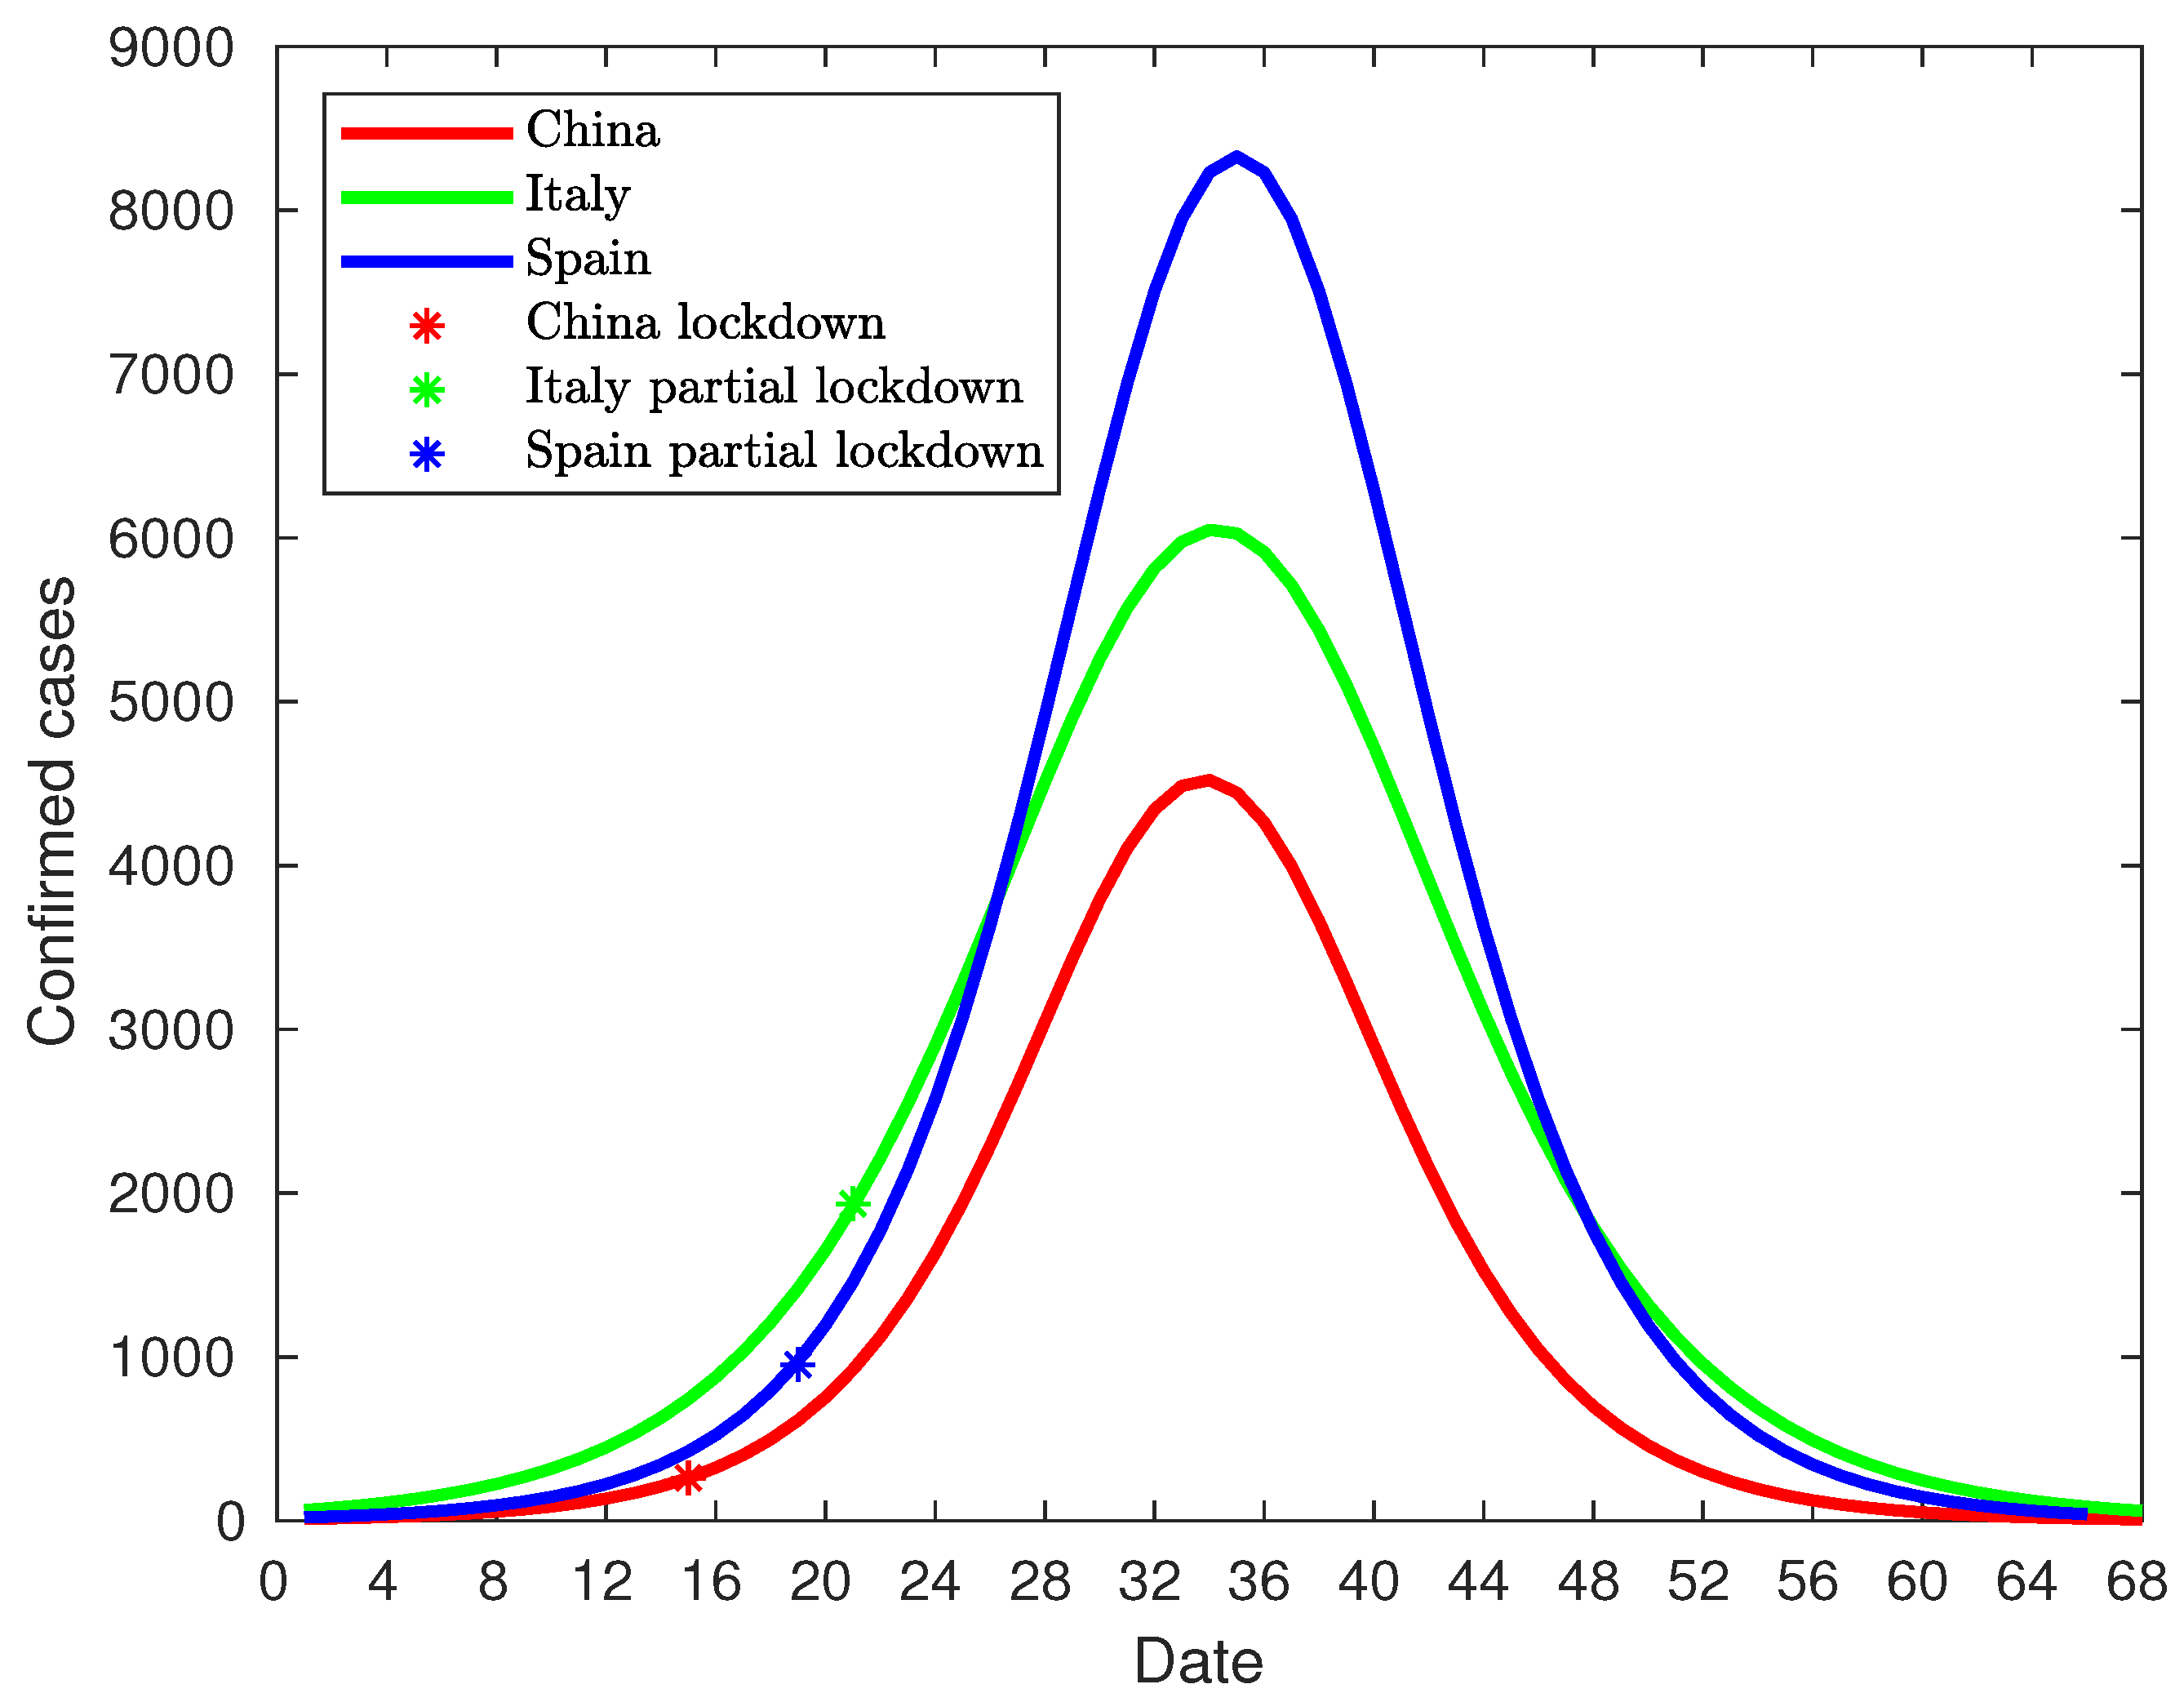
3.5. Predictive Model Forecasts
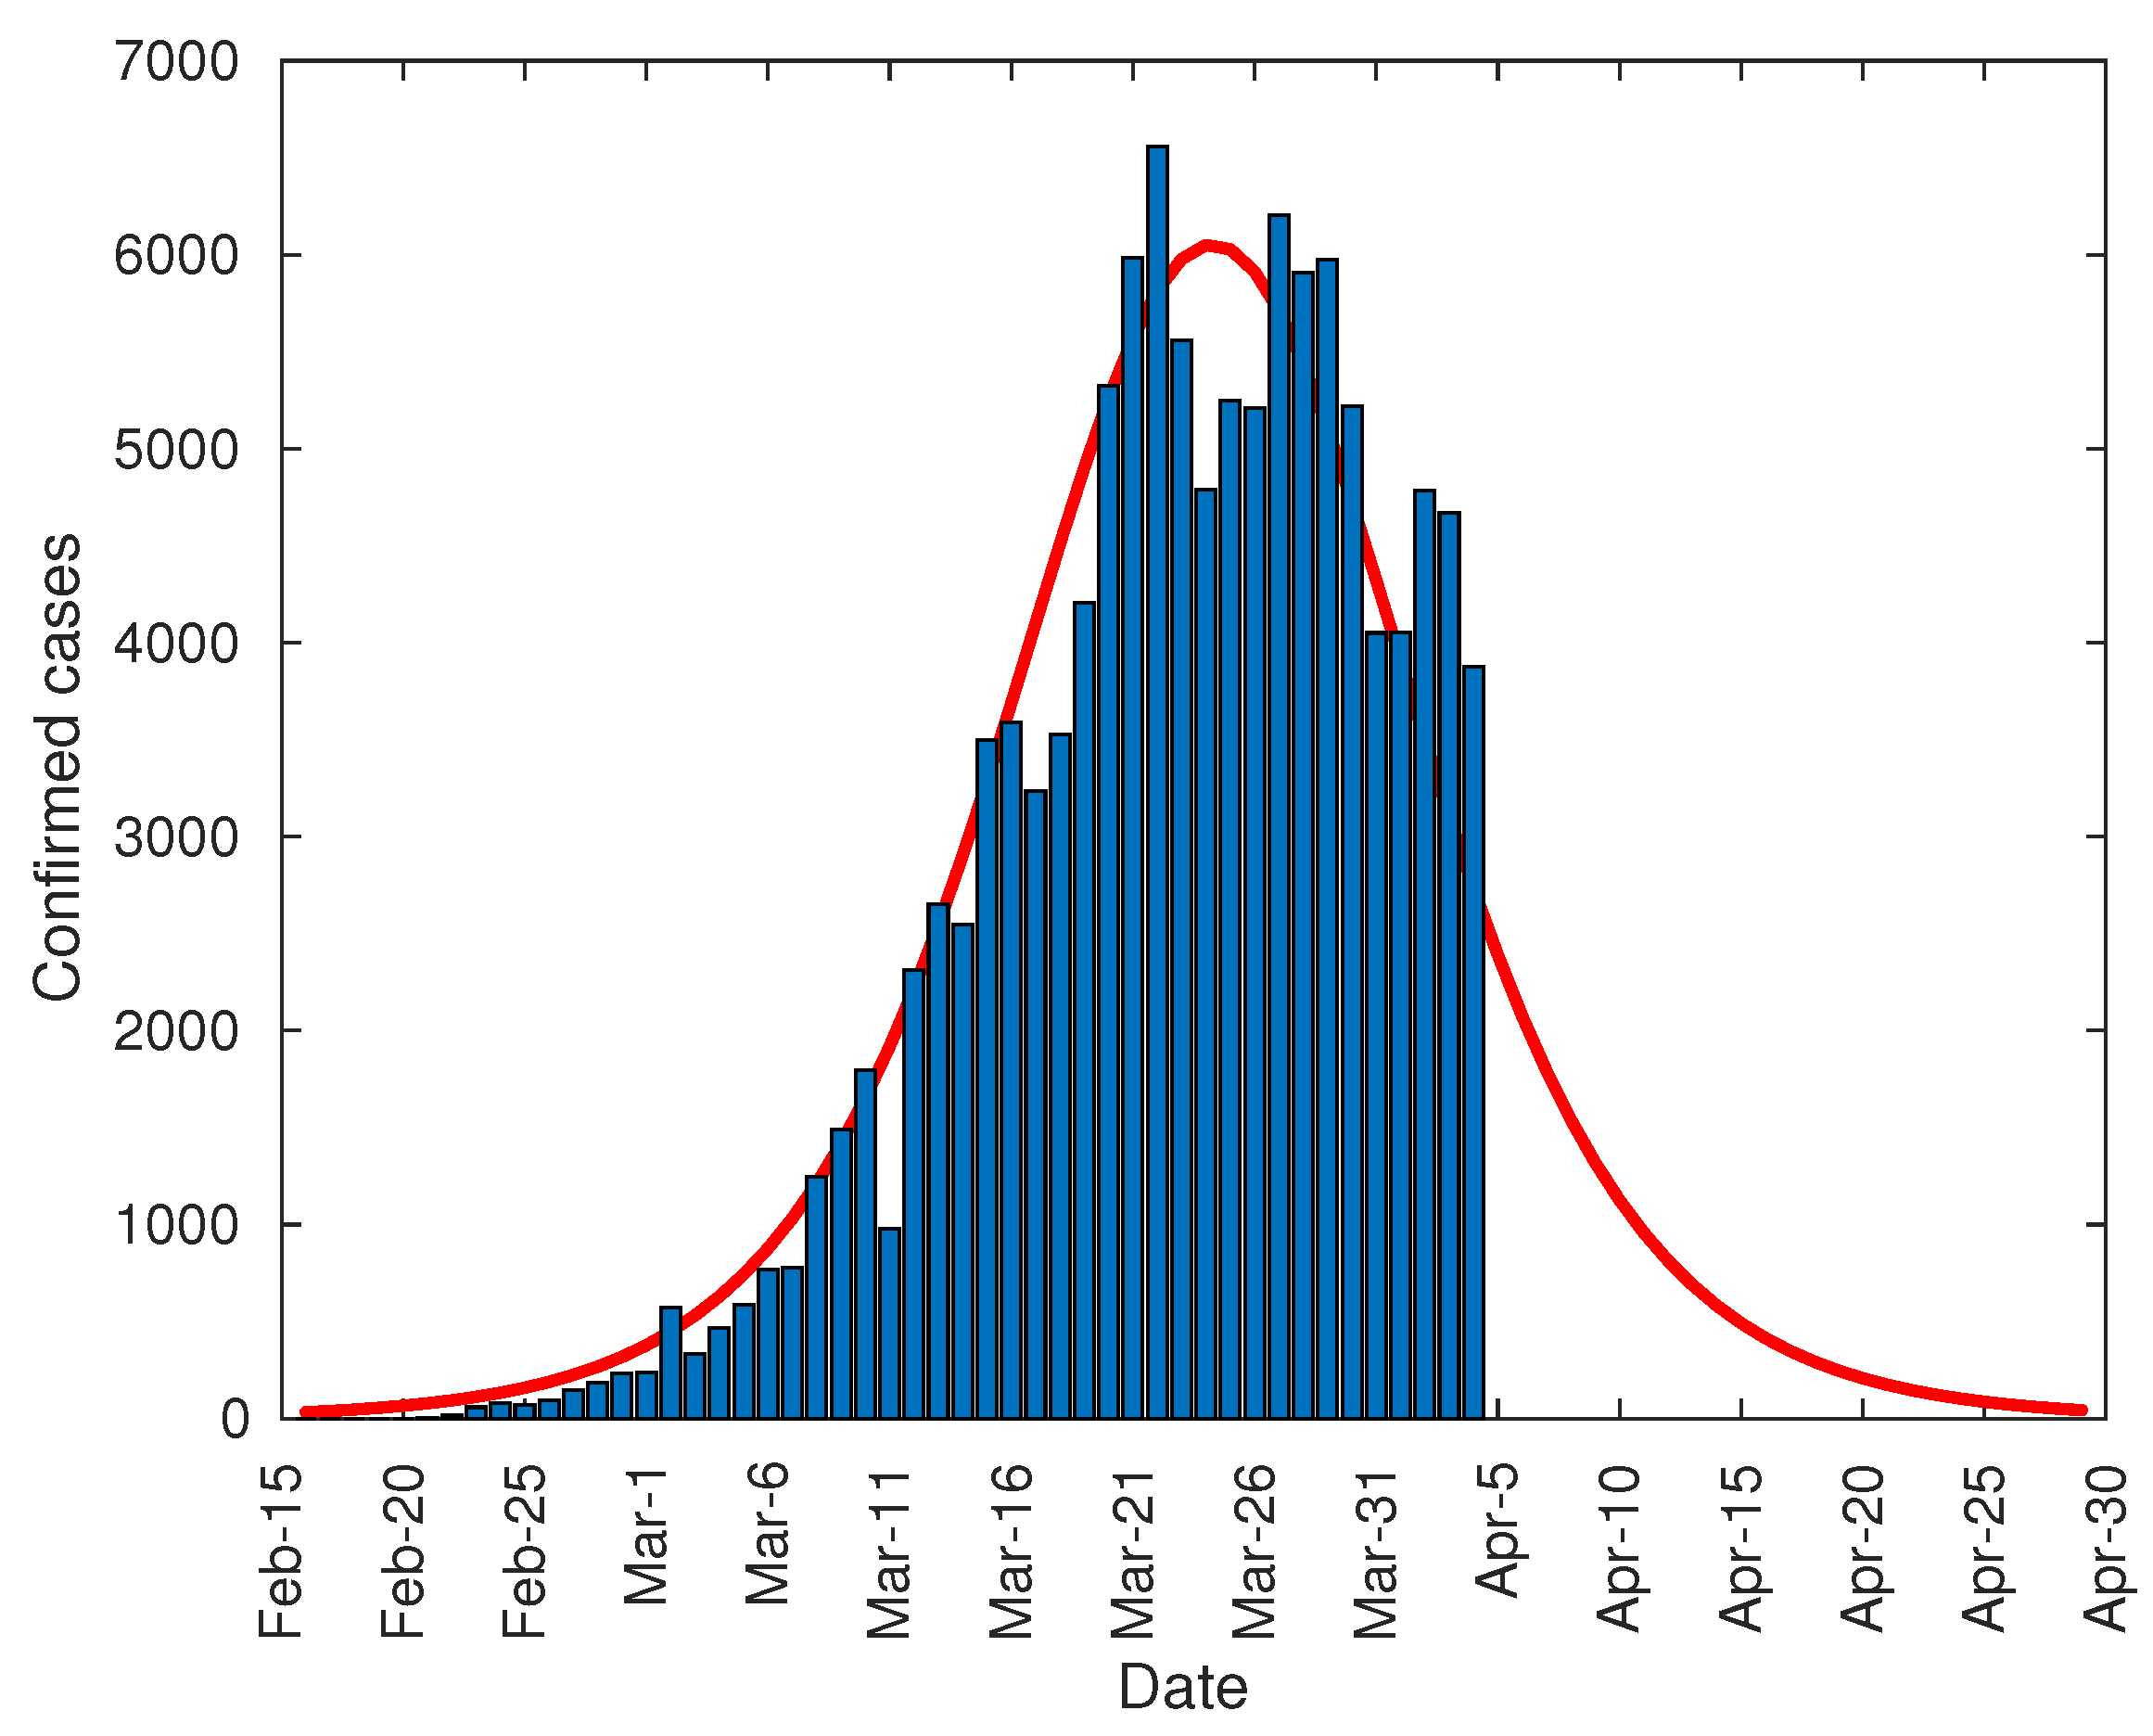
4. Results and Discussion
5. Conclusions
Supplementary Materials
Author Contributions
Funding
Conflicts of Interest
References
- Smith, D. Pandemic Risk Modelling. In The Palgrave Handbook of Unconventional Risk Transfer; Palgrave Macmillan: London, UK, 2017; pp. 463–495. [Google Scholar]
- Huang, C.; Wang, Y.; Li, X.; Ren, L.; Zhao, J.; Hu, Y.; Zhang, L.; Fan, G.; Xu, J.; Gu, X.; et al. Clinical features of patients infected with 2019 novel coronavirus in Wuhan, China. Lancet 2020, 395, 497–506. [Google Scholar] [CrossRef] [Green Version]
- Al-qaness, M.A.A.; Ewees, A.A.; Fan, H.; Abd El Aziz, M. Optimization Method for Forecasting Confirmed Cases of COVID-19 in China. J. Clin. Med. 2020, 9, 674. [Google Scholar] [CrossRef] [PubMed] [Green Version]
- Roosa, K.; Lee, Y.; Luo, R.; Kirpich, A.; Rothenberg, R.; Hyman, J.M.; Yan, P.; Chowell, G. Short-term Forecasts of the COVID-19 Epidemic in Guangdong and Zhejiang, China: 13–23 February 2020. J. Clin. Med. 2020, 9, 596. [Google Scholar] [CrossRef] [PubMed] [Green Version]
- Shao, N.; Zhong, M.; Yan, Y.; Pan, H.; Cheng, J.; Chen, W. Dynamic models for Coronavirus Disease 2019 and data analysis. Math. Methods Appl. Sci. 2020, 43, 4943–4949. [Google Scholar] [CrossRef] [Green Version]
- Sun, K.; Chen, J.; Viboud, C. Early epidemiological analysis of the coronavirus disease 2019 outbreak based on crowdsourced data: A population-level observational study. Lancet Digit. Health 2020, 2, e201–e208. [Google Scholar] [CrossRef]
- Zhao, S.; Chen, H. Modeling the epidemic dynamics and control of COVID-19 outbreak in China. Quant. Biol. 2020, 8, 11–19. [Google Scholar] [CrossRef] [PubMed] [Green Version]
- Kuniya, T. Prediction of the Epidemic Peak of Coronavirus Disease in Japan, 2020. J. Clin. Med. 2020, 9, 789. [Google Scholar] [CrossRef] [PubMed] [Green Version]
- Johns Hopkins University. Coronavirus COVID-19 Global Cases by the Center for Systems Science and Engineering. 2020. Available online: https://github.com/CSSEGISandData/COVID-19 (accessed on 4 April 2020).
- WHO. Wuhan Lockdown “Unprecedented”, Shows Commitment to Contain Virus: WHO Representative in China. 2020. Available online: https://www.reuters.com/article/us-china-health-who-idUSKBN1ZM1G9 (accessed on 19 March 2020).
- Spanish Government. 2020. Available online: https://www.dsn.gob.es/es/actualidad/sala-prensa/coronavirus-covid-19-12-febrero-2020 (accessed on 19 March 2020).
- CNN. First Case of Coronavirus Confirmed in Spain. 2020. Available online: https://edition.cnn.com/asia/live-news/coronavirus-outbreak-02-01-20-intl-hnk/h_afcf3a4665521aab11c721c8cc80dd03 (accessed on 19 March 2020).
- BBC. Coronavirus Confirmed as Pandemic by World Health Organization. 2020. Available online: https://www.bbc.com/news/world-51839944 (accessed on 20 March 2020).
- BBC. MWC 2020: Smartphone Showcase Cancelled over Coronavirus Fears. 2020. Available online: https://www.bbc.com/news/technology-51474116 (accessed on 20 March 2020).
- Entera’t. Capacity of the First League Stadiums in Spain. 2020. Available online: https://www.enterat.com/actualidad/estadios-futbol-espana.php (accessed on 19 March 2020).
- El Mundo. More than 550,000 People Demonstrating for Women Rights in Madrid and Barcelona. 2020. Available online: https://www.elmundo.es/espana/2019/03/08/5c82a5da21efa09e348b469c.html (accessed on 19 March 2020).
- La Vanguardia. Madrid Locksdown the Education System and Recommends Teleworking. 2020. Available online: https://www.lavanguardia.com/local/madrid/20200309/474061897680/madrid-ordena-cierre-colegios-coronavirus.html (accessed on 19 March 2020).
- BBC News. All of Italy Placed under Coronavirus Lockdown. 2020. Available online: https://www.bbc.com/news/world-europe-51810673 (accessed on 21 March 2020).
- Spanish Government. State of Alarm Announcement. 2020. Available online: https://www.lamoncloa.gob.es/presidente/actividades/Paginas/2020/130320-sanchez-declaracio.aspx (accessed on 21 March 2020).
- Spanish Government. State of Alarm Declaration. 2020. Available online: https://www.lamoncloa.gob.es/consejodeministros/resumenes/Paginas/2020/14032020_alarma.aspx (accessed on 19 March 2020).
- Offical Spanish Gazette. State of Alarm Conditions. 2020. Available online: https://www.boe.es/eli/es/rd/2020/03/14/463/con (accessed on 19 March 2020).
- Reuters. Merkel Says ‘Let’s Get through This’ as Shops, Bars and Churches Shut. 2020. Available online: https://www.reuters.com/article/us-health-coronavirus-germany-economy/merkel-says-lets-get-through-this-as-shops-bars-and-churches-shut-idUSKBN213178 (accessed on 26 March 2020).
- BBC. Coronavirus: Europe Plans Full Border Closure in Virus Battle. 2020. Available online: https://www.bbc.com/news/world-europe-51918596 (accessed on 26 March 2020).
- Bloomberg. Italy Tightens Virus Lockdown after Worst Daily Death Toll. 2020. Available online: https://www.bloomberg.com/news/articles/2020-03-19/italy-is-now-world-s-deadliest-hotspot-in-the-virus-pandemic (accessed on 20 March 2020).
- CNN. China to Lift Lockdown on Wuhan, Ground Zero of Coronavirus Pandemic. 2020. Available online: https://edition.cnn.com/2020/03/24/asia/coronavirus-wuhan-lockdown-lifted-intl-hnk/index.html (accessed on 21 March 2020).
- BBC. Coronavirus: Strict New Curbs on Life in UK Announced by PM. 2020. Available online: https://www.bbc.com/news/uk-52012432 (accessed on 26 March 2020).
- Offical Spanish Gazette. State of Alarm Thightening. 2020. Available online: https://www.boe.es/buscar/doc.php?id=BOE-A-2020-4166 (accessed on 19 March 2020).
- Verhulst, P. Notice sur la loi que la population suit dans son accroissement. Corresp. Math. Phys. 1838, 10, 113–126. [Google Scholar]
- BBC. Coronavirus: Sharp increase in Deaths and Cases in Hubei. 2020. Available online: https://www.bbc.com/news/world-asia-china-51482994 (accessed on 24 March 2020).
- Lauer, S.A.; Grantz, K.H.; Bi, Q.; Jones, F.K.; Zheng, Q.; Meredith, H.R.; Azman, A.S.; Reich, N.G.; Lessler, J. The Incubation Period of Coronavirus Disease 2019 (COVID-19) From Publicly Reported Confirmed Cases: Estimation and Application. Ann. Intern. Med. 2020. [Google Scholar] [CrossRef] [PubMed] [Green Version]
- Kampf, G.; Todt, D.; Pfaender, S.; Steinmann, E. Persistence of coronaviruses on inanimate surfaces and their inactivation with biocidal agents. J. Hosp. Infect. 2020, 104, 246–251. [Google Scholar] [CrossRef] [PubMed] [Green Version]
- World Health Organization. Coronavirus Disease (COVID-2019) Situation Reports. 2020. Available online: https://www.who.int/emergencies/diseases/novel-coronavirus-2019/situation-reports/ (accessed on 20 March 2020).


| Date | Location | Milestone |
|---|---|---|
| 22 January | China | The Chinese government decrees the total lockdown of the area of Wuhan [10]. |
| 31 January | Spain | First COVID-19 case diagnosed [11,12]. |
| 11 February | World | The WHO declares the global pandemic [13]. |
| 12 February | Barcelona | The world’s largest mobile phone showcase, Mobile World Congress (MWC), |
| is cancelled over coronavirus concerns [14]. | ||
| 13 February | Spain | The first coronavirus related death occurs. This would be known on 3 March |
| after an autopsy [12]. | ||
| 8 March | Spain | All sorts of sports competitions are held at all levels. Only in the first soccer |
| division, up to 760,000 people gathered throughout Spain [15]. The 8 M | ||
| demonstrations gathered more than 550,000 people throughout Spain [16]. | ||
| 9 March | Spain | All primary and high schools and universities in Madrid are closed, and |
| teleworking was recommended [17]. | ||
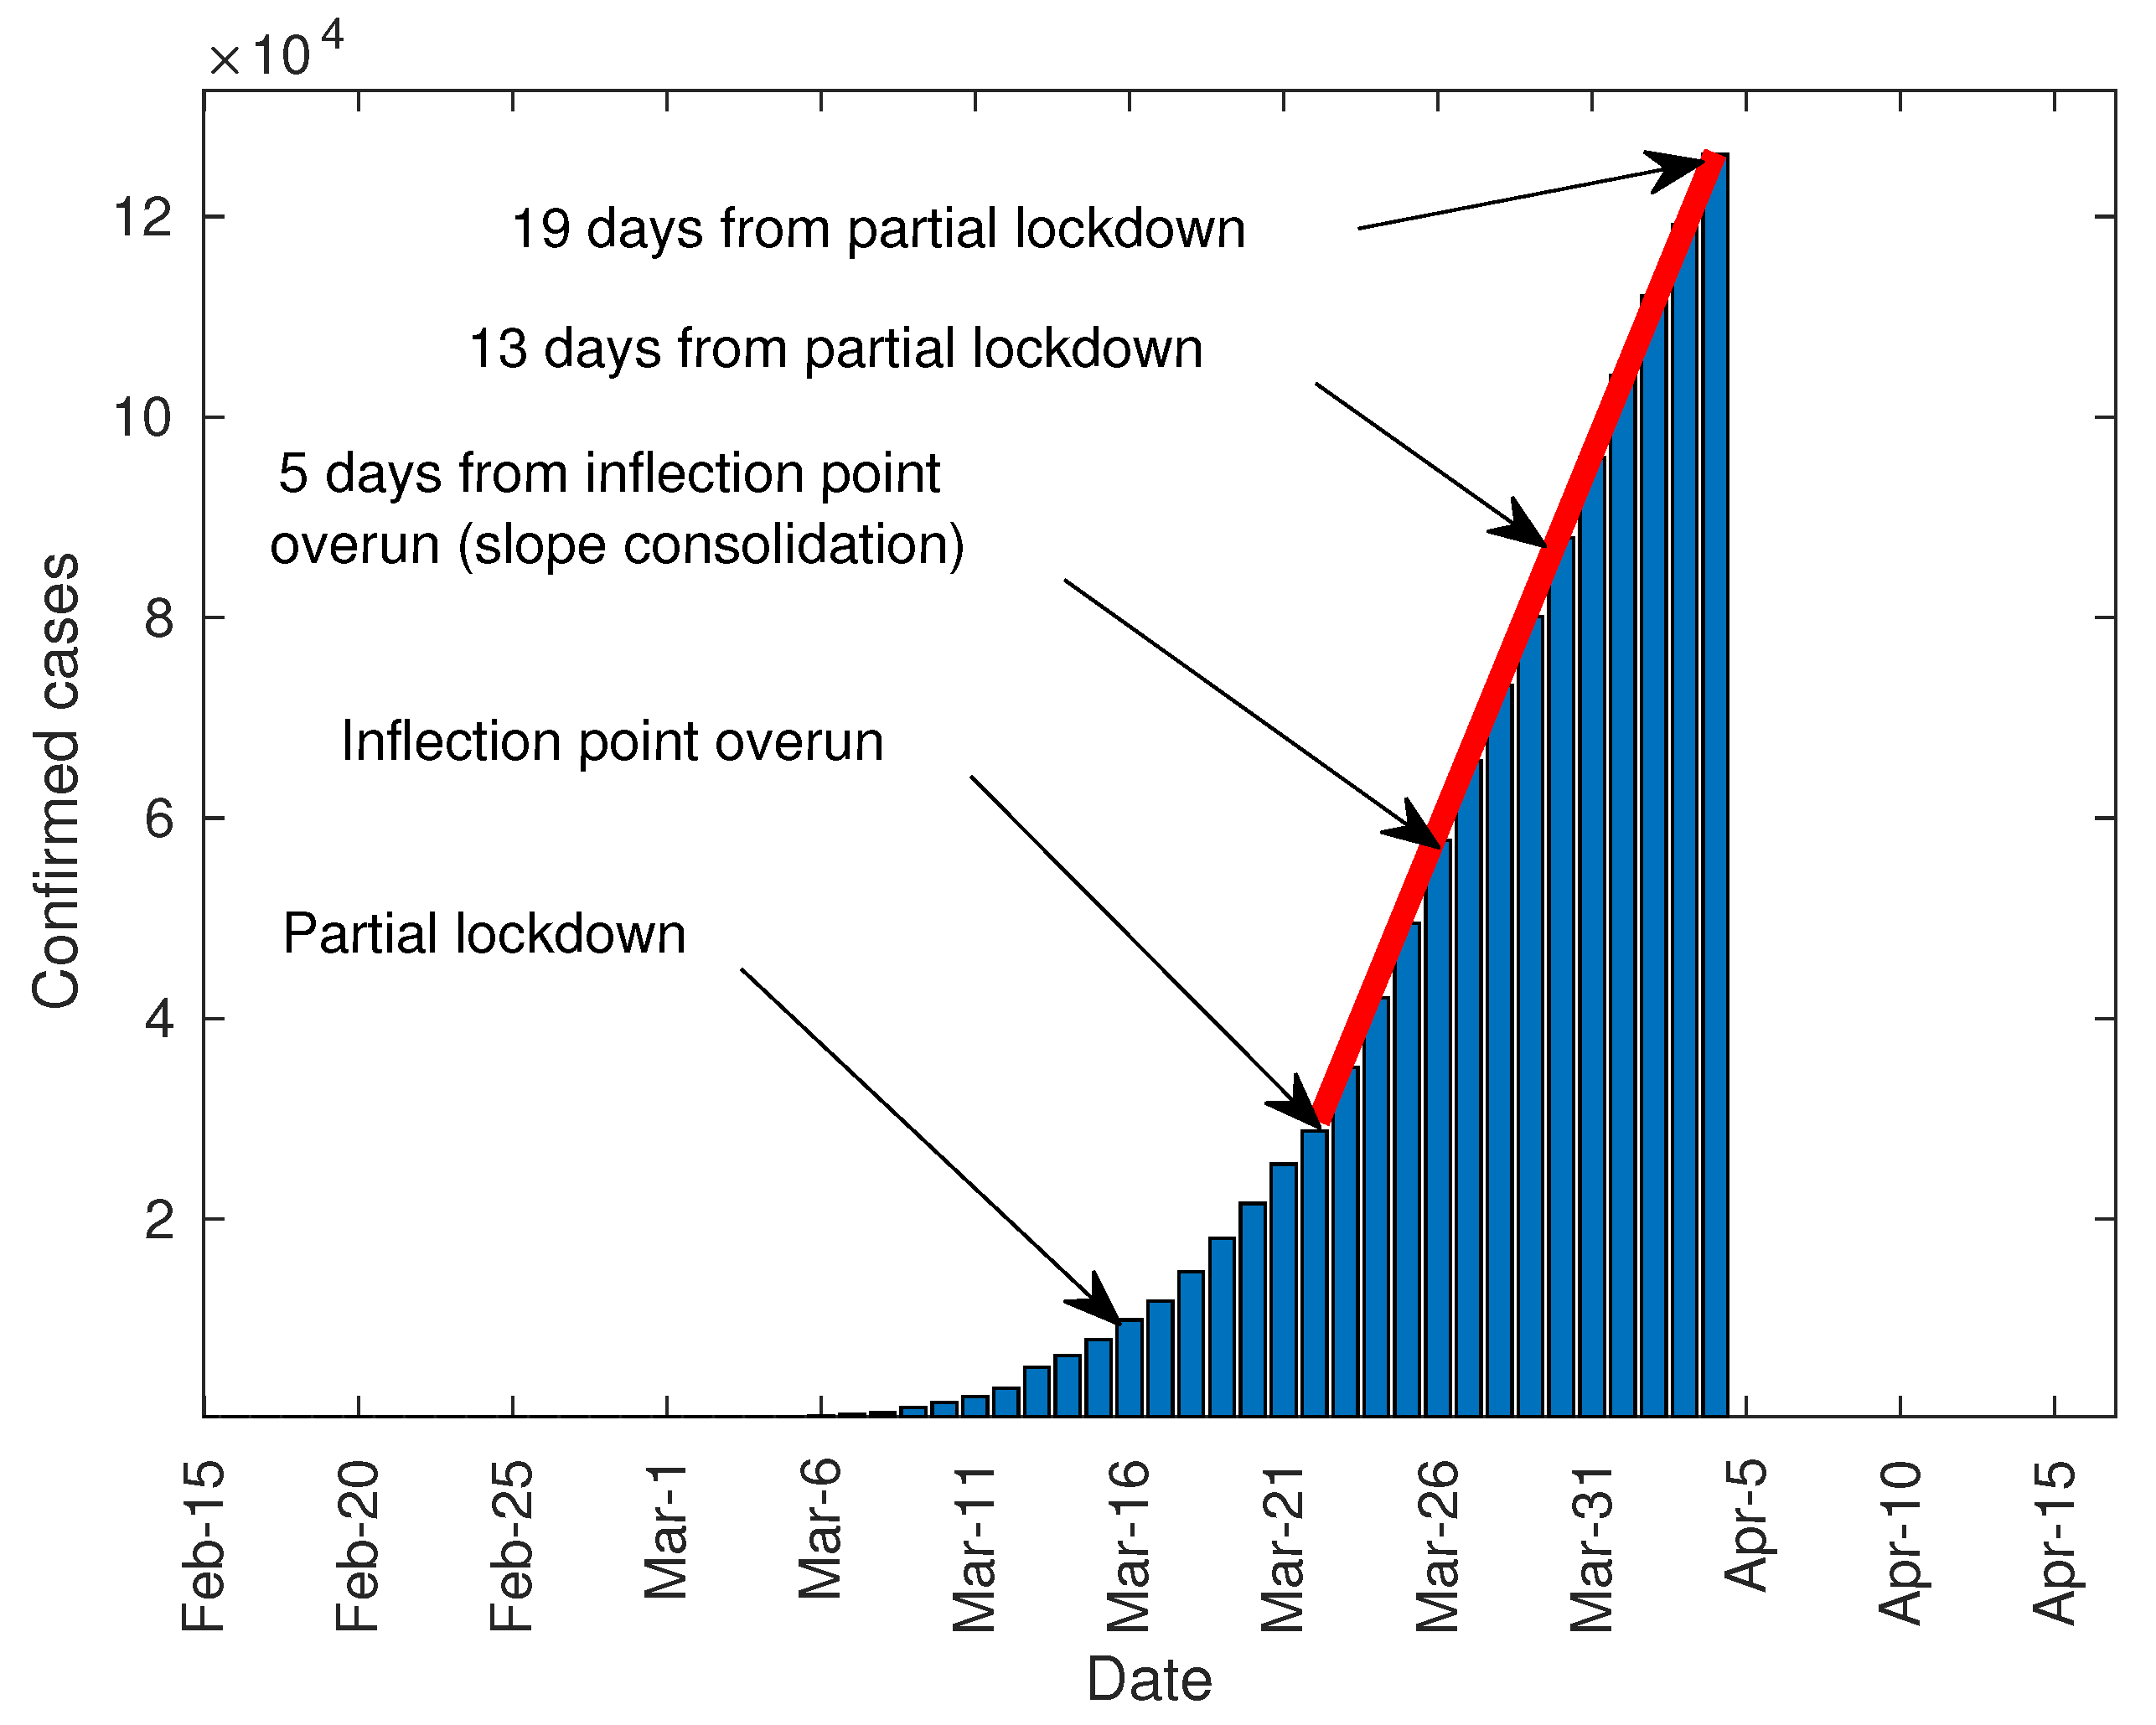
| 10 March | Italy | The Italian Prime Minister declares a partial lockdown, which restricts the |
| mobility of Italians but allows industrial activity [18]. | ||
| 12 March | Spain | The closure of schools and universities is extended to the whole country. |
| 13 March | Spain | The Spanish president announces the declaration of the state of alarm for the |
| next day [19]. The exodus of people from Madrid to other towns throughout | ||
| Spain is detected. | ||
| 14 March | Spain | First day of the state of alarm [20]. This leads to partial lockdown and |
| the restriction on movements, but it allows the industrial activity, in a similar | ||
| way to Italy [21]. | ||
| 16 March | Germany | The Deutch Chancelor bans gatherings and closes shops, bars and churches |
| while urges the citizens to stay at home [22]. | ||
| 17 March | France | The French Prime Minister orders people to stay at home and only go out for |
| essential duties [23]. | ||
| 21 March | Italy | The Italian Prime Minister declares total lockdown and stops all industrial |
| activity in Italy, except the essential for the country [24]. | ||
| 23 March | China | China lifts quarantine over Wuhan after two months of total lockdown [25]. |
| UK | The Prime minister of the United Kingdom declares partial lockdown. Shops | |
| selling non-essential goods are told to shut and gatherings in public of more | ||
| than two people who do not live together are prohibited [26]. | ||
| 28 March | Spain | The president of the Spanish government announces the tightening of lock- |
| down, allowing only the development of activities considered essential [27]. | ||
| The enforcement of the total lockdown will begin on Tuesday, 31 March. |
| China | Italy | Spain | |
|---|---|---|---|
| 12 | 30 | 37 | |
| 13 | 31 | 38 | |
| 17,200 | 24,750 | 28,770 | |
| 20,440 | 27,980 | 35,140 | |
| a | |||
| b | 3240 | 3230 | 6370 |
| 0 | 25 | 29 | |
| 19 | 38 | 42 | |
| K | 79,760 | 101,180 | 121,240 |
| Italy | Spain | France | Germany | UK | |
|---|---|---|---|---|---|
| 35 | 37 | 44 | 37 | 43 | |
| 44 | 50 | 50 | 50 | 50 | |
| 47,021 | 28,770 | 40,174 | 24,873 | 17,089 | |
| 97,689 | 126,168 | 83,019 | 96,092 | 41,903 | |
| a | |||||
| b | 5629.78 | 7492.15 | 7140.83 | 5478.38 | 3544.86 |
| 25 | 29 | 32 | 32 | 38 | |
| 139,081 | 147,445 | 108,910 | 137,400 | 97,985 | |
| 0.1619 | 0.2032 | 0.2623 | 0.1595 | 0.1447 | |
| 251.228 | 23.60 | 0.6276 | 104.897 | 52.833 | |
| 206,638 | 237,351 | 194,600 | 203.141 | 140,524 | |
| 0.1090 | 0.1263 | 0.1468 | 0.1079 | 0.1009 | |
| 1521.26 | 487.05 | 94.26 | 825.53 | 402.551 |
© 2020 by the authors. Licensee MDPI, Basel, Switzerland. This article is an open access article distributed under the terms and conditions of the Creative Commons Attribution (CC BY) license (http://creativecommons.org/licenses/by/4.0/).
Share and Cite
Sanchez-Caballero, S.; Selles, M.A.; Peydro, M.A.; Perez-Bernabeu, E. An Efficient COVID-19 Prediction Model Validated with the Cases of China, Italy and Spain: Total or Partial Lockdowns? J. Clin. Med. 2020, 9, 1547. https://doi.org/10.3390/jcm9051547
Sanchez-Caballero S, Selles MA, Peydro MA, Perez-Bernabeu E. An Efficient COVID-19 Prediction Model Validated with the Cases of China, Italy and Spain: Total or Partial Lockdowns? Journal of Clinical Medicine. 2020; 9(5):1547. https://doi.org/10.3390/jcm9051547
Chicago/Turabian StyleSanchez-Caballero, Samuel, Miguel A. Selles, Miguel A. Peydro, and Elena Perez-Bernabeu. 2020. "An Efficient COVID-19 Prediction Model Validated with the Cases of China, Italy and Spain: Total or Partial Lockdowns?" Journal of Clinical Medicine 9, no. 5: 1547. https://doi.org/10.3390/jcm9051547
APA StyleSanchez-Caballero, S., Selles, M. A., Peydro, M. A., & Perez-Bernabeu, E. (2020). An Efficient COVID-19 Prediction Model Validated with the Cases of China, Italy and Spain: Total or Partial Lockdowns? Journal of Clinical Medicine, 9(5), 1547. https://doi.org/10.3390/jcm9051547