1. Introduction
Despite advancements in early detection, the World Health Organization reports that over 0.5 million women still succumb to breast cancer every year. The majority of these deaths are attributed to tumor recurrences, which are largely believed to arise from residual cancer stem cells (CSC) that survive the initial therapeutic intervention [
1]. According to the CSC model of tumorigenesis, this population of cells is responsible for the origin, progression, and recurrence of the tumor, and therefore, for any therapy to have success, it must be able to effectively target this population [
2]. Despite their central role in the development of malignant disease, CSCs remain poorly characterized. The characterization of this population has been hampered, in part, by the lack of robust markers for their identification. Thus, highlighting the necessity to identify more robust markers and therapeutic strategies for CSCs.
Given their central role in promoting tumor progression, the identification and characterization of breast CSCs remain an active area of research. To date, most rely upon the combinatorial expression of cell surface markers such as the cluster of differentiation (CD) 24 and CD44 for the identification of CSC populations [
3]. Recently, metabolic stem cell markers, such as cytoplasmic aldehyde dehydrogenase (ALDH) A1 and A3 have been described as markers of adult stem cells and CSC in a number of tissue types [
4,
5]. Aldehydes are generated by the metabolism of a wide variety of xenobiotic and endobiotic compounds, including alcohols, amino acids, and anticancer drugs, as well as from lipid peroxidation. Aldehyde dehydrogenases function as detoxifying enzymes through their role in metabolizing aldehydes, thereby protecting cells from oxidative and electrophilic stress [
6]. The finding that CSCs can, in part, be identified by a metabolic marker has stimulated an interest in the characterization of CSC metabolism.
In order to meet the increased biochemical demands that accompany increased proliferation, metabolic pathways are frequently dysregulated in cancer. The metabolic reprogramming that accompanies cancer onset is now understood to be essential for the pathogenesis of the disease and accordingly has been added to the list of cancer hallmarks [
7,
8]. Of the metabolic alterations reported in cancer, none is better studied than aerobic glycolysis, the production of lactate from glucose in the presence of oxygen [
9,
10]. Glycolytic metabolism has been shown to play an important role in supporting stemness in several cancer types. However, it is becoming increasingly clear that in addition to high glycolytic rates, tumorigenesis is supported by multiple aberrant metabolic processes, including dysregulation of lipid metabolism [
11].
A coordinated dysregulation of lipid metabolism is observed in nearly all cancer types. In addition to fulfilling the basic requirements of structural lipids for membrane synthesis, lipids play important roles as signaling molecules and contribute significantly to energy homeostasis. As lipid metabolism affects multiple aspects of cellular biology, it is not surprising that alterations in lipid metabolism affect a diverse range of cellular processes including, growth, proliferation, differentiation, and motility.
In order to fulfill their heightened demand for lipids, cancer cells increase their uptake of exogenous fatty acids. This is achieved through increased surface expression of fatty acid translocase CD36. Interestingly, elevated CD36 expression has been reported in metastasis-initiating cell populations and is inversely correlated with survival prognosis [
12]. Once taken up by the cells, the free fatty acids can be shuttled into the mitochondria to produce energy equivalents through fatty acid beta-oxidation(FAO). Maintenance of cellular energy stores by FAO has been shown to be fundamental to the survival of CSCs in scarce nutrient environments [
13]. Multiple reports have highlighted the importance of increased exogenous fatty acid metabolism in CSCs [
14].
In addition to the increased uptake of exogenous lipids, cancer cells also have the unique property of being able to synthesize lipids. Whilst fatty acid biosynthesis is normally restricted to hepatocytes, adipocytes, or mammary epithelium during lactation, several studies have now demonstrated the ability of cancer cells to preform de novo fatty acid biosynthesis [
15,
16]. Indeed, the expression of several enzymes involved in de novo fatty acid biosynthesis has been implicated in tumorigenesis and the maintenance of stemness in CSCs [
17,
18].
On a cellular level, excess fatty acids, either exogenous fatty acids taken up by the cells or products of de novo fatty acid biosynthesis, are processed into triacylglycerides and retained in specialized storage organelles called lipid droplets [
19]. Lipid droplets are endoplasmic reticulum (ER)-derived organelles that are comprised of a phospholipid monolayer surrounding a core of neutral lipids, primarily triglycerides and sterol esters. They have long been considered to function as a primary store of energy but several recent reports have begun to highlight their role in a diverse range of cellular functions including ER stress, ROS detoxification, and protein dynamics [
20].
Our goal in this study is to assess lipid metabolism as a therapeutic target in a panel of breast cancer cell lines. We report that stemness in breast cancer cell lines correlates with lipid droplet number. In line with this, we devised a FACS based strategy to isolate lipid droplet enriched populations and analyzed them for CSC markers. This analysis revealed that lipid droplethi populations increase CSC markers, as well as increasing mammosphere-forming efficiency. Utilizing an inhibitor of fatty acid biosynthesis, we were able to effectively target the stem cell population in a subset of breast cancer cell lines, thus demonstrating the potential of lipid metabolism targeting compounds as adjuvants to traditional therapies.
2. Experimental Section
2.1. Cell Lines and Culture Conditions
In this study, the following human breast cancer cell lines were used: BT474, MCF7, T47D, and MDA-MB-231. BT474 cells were purchased from the Leibniz Institute DSMZ-German Collection of Microorganisms and Cell Cultures and maintained in Roswell Park Memorial Institute, RPMI 1640, (Lonza, Basel, Switzerland) supplemented with 5% fetal bovine serum (Sigma-Aldrich, St. Louis, MO, USA), 2 mM L-Glutamine (Euroclone, Milano, Italy), and 10 μg/mL human insulin (Sigma-Aldrich, St. Louis, MO, USA). MCF7, T47D, and MDA-MB 231 were purchased from the National Cancer Institute, Bethesda, MD, USA (NCI) and maintained in RPMI 1640 supplemented with 10% fetal bovine serum and 2 mM L-Glutamine. All the cell lines were cultured at 37 °C in a humidified atmosphere, 5% CO2 incubator.
Additionally, two cell lines, representative of normal breast epithelium, HMEC (Cambrex, East Rutherford, NJ, USA) and MCF10a (European Institute of Oncology, Milan, Italy) were used. HMEC cells were cultured in RPMI 1640 with 10% FBS and 2 mM L-glutamine. MCF10a cells were cultured in Dulbecco’s modified Eagle medium/nutrient mixture F-12 (DMEM-Ham’s F12), (Sigma Aldrich, St. Louis, MO, USA) containing: 5% horse serum (Life Technologies, Carlsbad, CA, USA), 10 μg/mL insulin, 20 ng/mL epidermal growth factor (Vinci Biochem, Florence, Italy), 500 ng/mL hydrocortisone (Sigma Aldrich, St. Louis, MO, USA), 100 ng/mL cholera toxin (Sigma Aldrich, St. Louis, MO, USA) and 2 mM L-glutamine.
2.2. 5-(Tetradecyloxy)-2-Furoic Acid (TOFA) Treatments
TOFA (Sigma-Aldrich, T6575, St. Louis, MO, USA) was resuspended in two milliliters of Dimethyl sulfoxide (DMSO) and stored at −20 °C. Experiments in which cells were treated with TOFA, unless otherwise specified, were cultured in the presence of 10 μM TOFA in their normal growth media for forty-eight hours prior to initiating measurements or assays.
2.3. Growth Curves for TOFA Sensitivity
To assess the effects of TOFA on cell proliferation each cell line was seeded across five, 96-well plates (CostarTM, Corning, NY, USA) at the following cell densities, expressed as cells per well: MDA-MB-231 0.5 × 10⁴, MCF7 1 × 10⁴, BT474 and T47D 1.5 × 10⁴. Additional wells were filled with growth media alone to act as plate blanks. All experimental conditions were set up in triplicate. Upon cell adhesion and spreading, a single plate was taken from each set of five plates, fixed and stained.
Fixation was done by removing the culture media and adding 100 μL of 4% paraformaldehyde solution, PFA, (HIMEDIA, Kennett Square, PA, USA) to each well for ten minutes. The PFA was then removed and 100 μL of Crystal Violet solution (Merck KGaA, Darmstadt, Germany) was added to each well. After twenty minutes, all non-cell associated Crystal Violet was removed by washing the wells with water.
Cells in the remaining sets of four plates were treated with either growth media containing 0.13% DMSO or growth media with 10 μM TOFA (Sigma-Aldrich, St. Louis, MO, USA) in DMSO. Every 24 h, for 96 h, a single plate was removed from each set and processed as described above.
Once in the entire time course, five plates in total per cell line were processed and completely dried. One hundred μL of acetic acid glacial was added to each well and incubated for twenty minutes at room temperature. The log optical density (OD) of each experimental well was then measured at a wavelength of 570 nm using a Wallace Victor 3TM multilabel reader (PerkinElmer Inc., Waltham, MA, USA). Reported OD values were generated by subtracting the average of the three experimental wells from the average of the three corresponding plate blank wells.
2.4. Fluorescence-Activated Cell Sorting
BODIPY™ 500/510 C1, C12 (4,4-Difluoro-5-Methyl-4-Bora-3a,4a-Diaza-s-Indacene-3-Dodecanoic Acid) (Molecular Probes, Eugene, OR, USA) stock solution, 1 mg/mL, was prepared in ethanol and kept at −20 °C until used. For FACS sorting, the cells were incubated with 1 μg/mL BODIPY™, following an overnight incubation; they were washed twice, trypsinized, resuspended in Phosphate Buffered Saline(PBS) containing 2% FBS and 0.3% Gentamycin and sorted on a MoFlo Astrios cell sorter (Beckman Coulter, Pasadena, CA, USA).
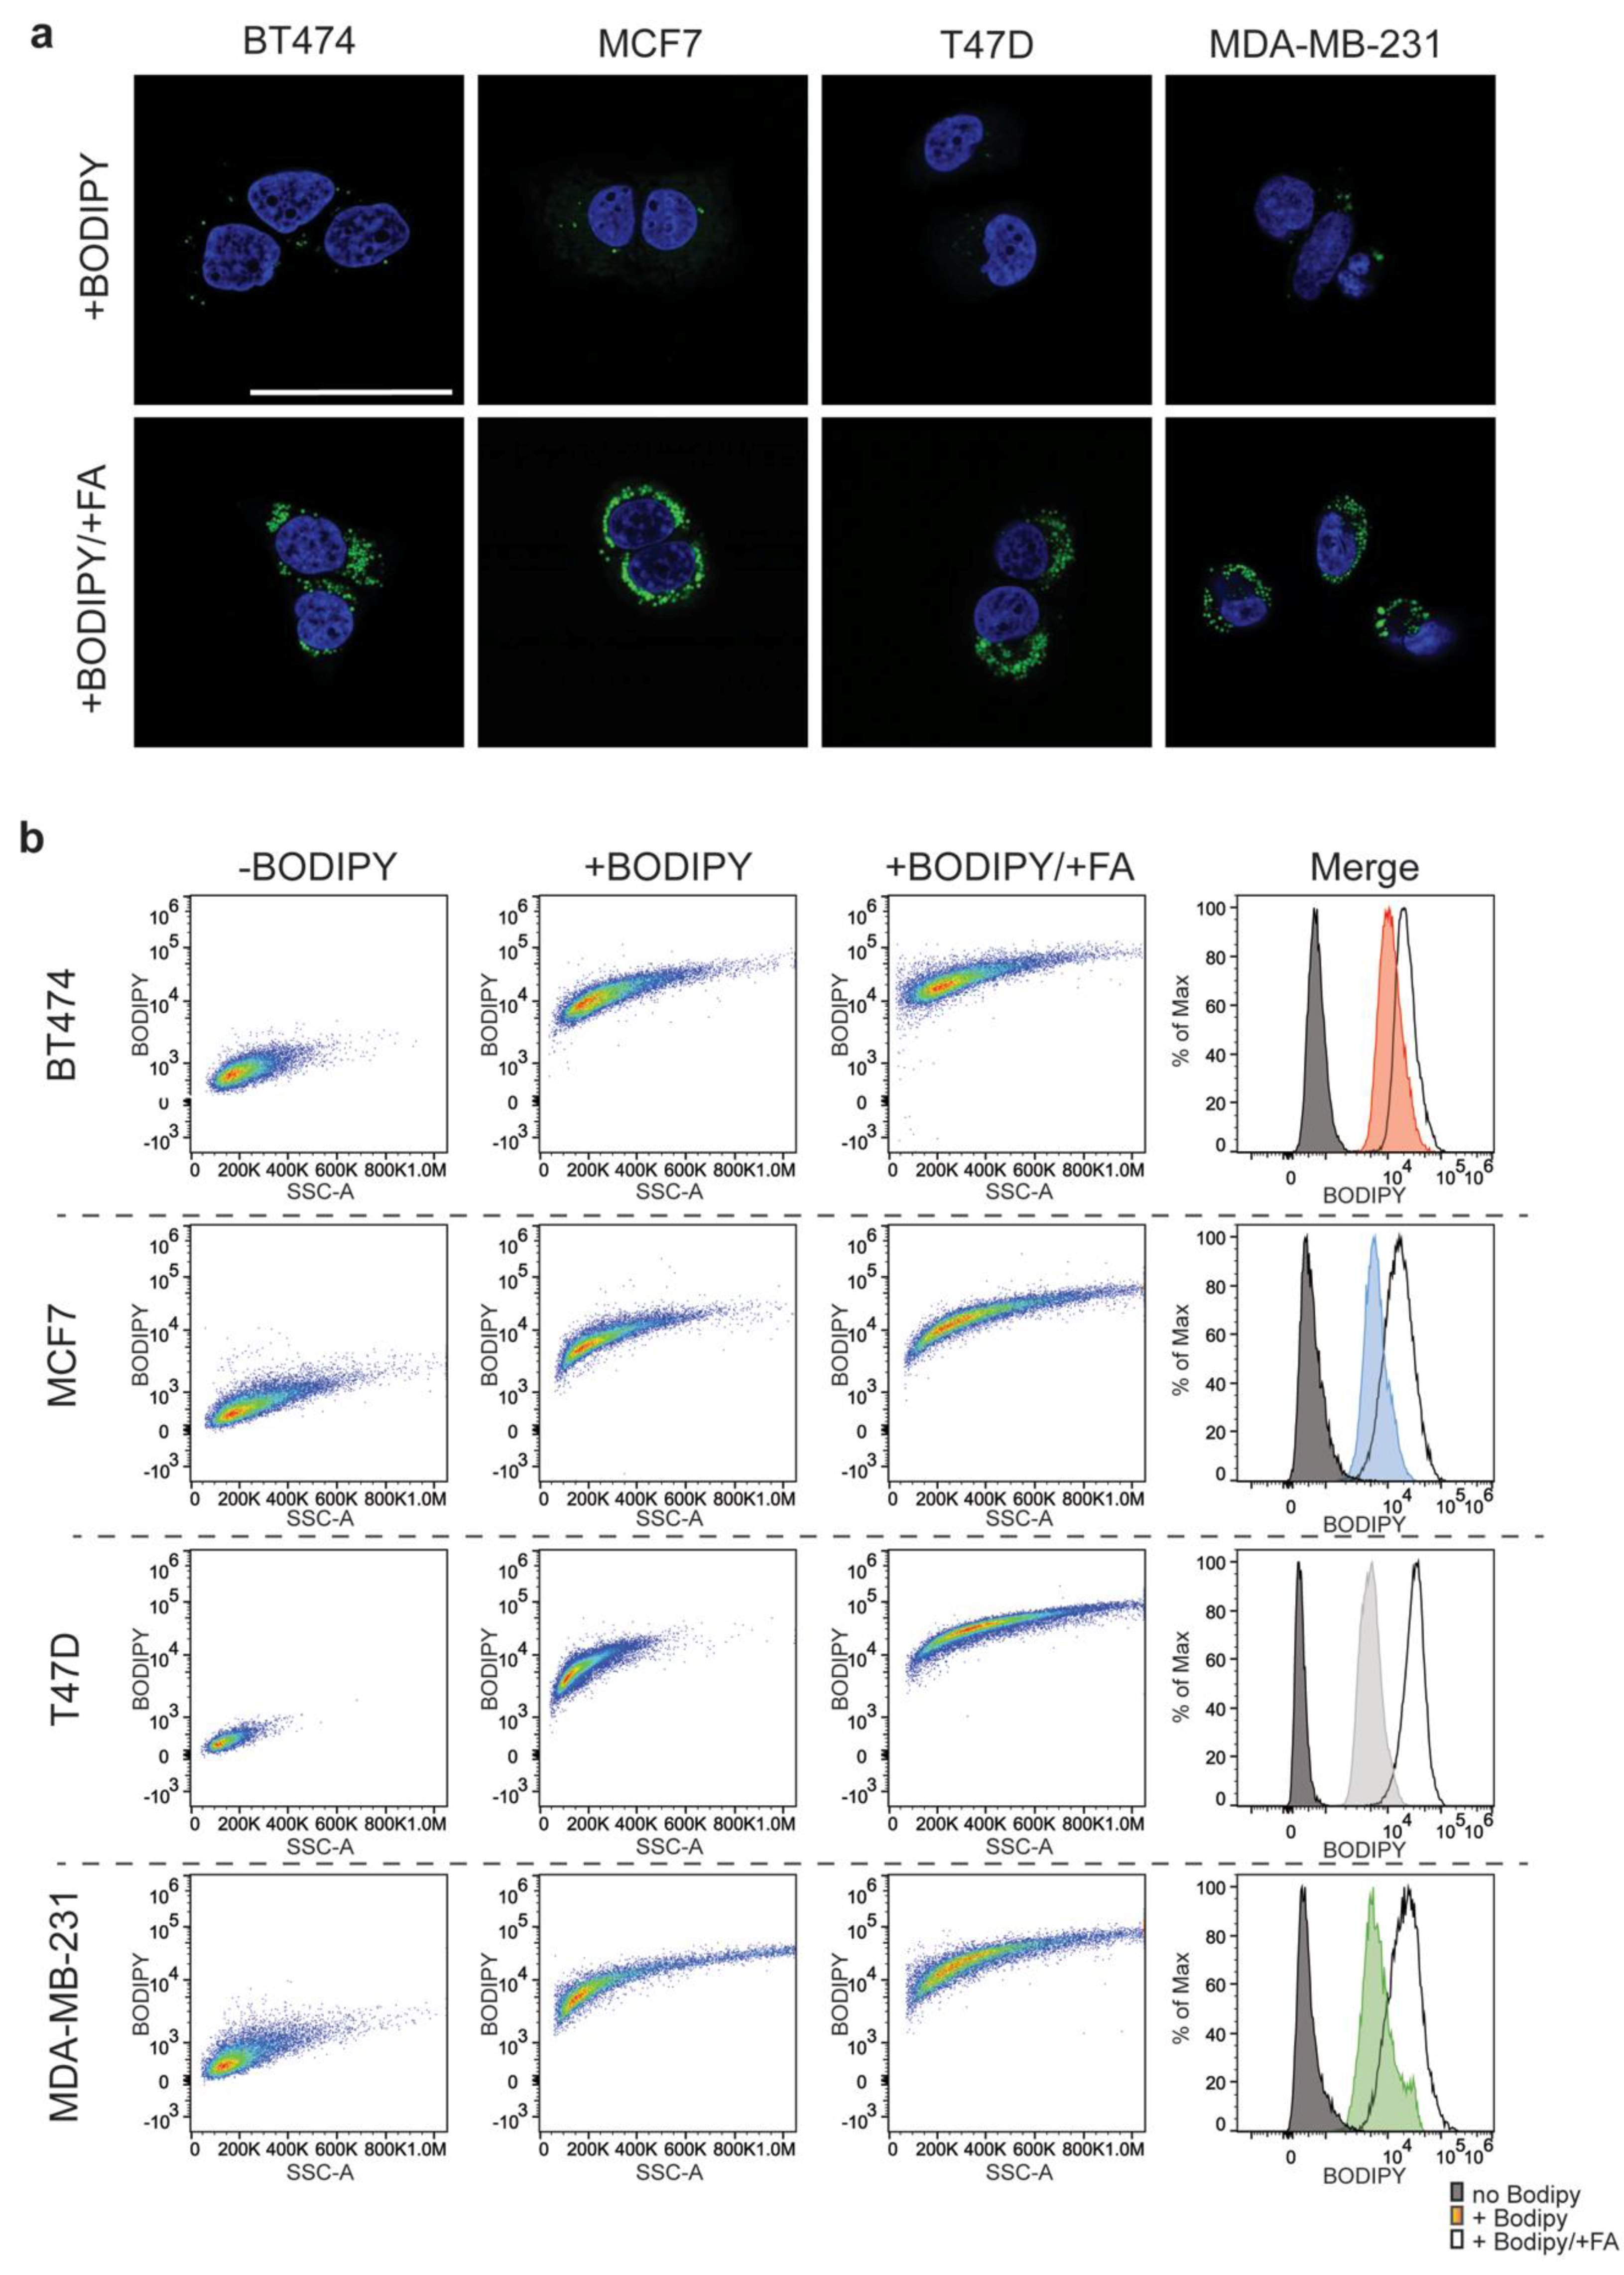
2.5. FACS of Fatty Acid Loaded and TOFA Treated Cells
FACS analysis of fatty acid loaded cells was done by culturing cells to 30–40% confluence. The normal growth media was then spiked with 100 μM oleic acid (Sigma-Aldrich, O1383, St. Louis, MO, USA) and 50 μM palmitic acid (Sigma-Aldrich, P5585, St. Louis, MO, USA) for 48 h. Twelve hours prior to FACS, cells were treated with Bodipy at 1 μg/mL. Immediately before FACS, cells were then trypsinized and spun at 1200 rpm for five minutes. The pellet was gently washed with Dulbecco’s Phosphate Buffered Saline (DPBS) and resuspended in DPBS containing 2%, 0.22 μm filtered, FBS. FACS was conducted using Attune NxT (Thermofisher Scientific Inc., Waltham, MA, USA). FACS data depicted represents analysis done on single, 4’,6-diamindino-2-phenylindole(DAPI)-negative cell populations. FlowJo version 10.4.2 (BD Life Sciences, Franklin Lakes, NJ, USA) was used for the analysis.
The same workflow, with the exception of the fatty acid loading step, was used to assess the impact of TOFA treatment on the lipid droplet content of the experimental cell lines.
2.6. Nile Red Staining and Lipid Droplets Quantification Analysis
The Nile Red staining was performed as previously reported [
21]. Briefly, Nile red (Molecular Probes, Eugene, OR, USA) stock solution was made in DMSO at a concentration of 1 mg/mL. For cellular staining, cells were seeded on poly-lysine coated coverslips and then fixed in paraformaldehyde, 4%, for fifteen minutes. After washing, the cells were incubated for ten minutes in Nile Red, 1 μL of 1 mg/mL Nile Red stock in 10 mL of 150 mM NaCl, protected from light. Nuclei were stained using Dapi, and finally, coverslips were mounted onto glass slides.
Lipid droplet quantification was performed using a Fiji plug-in (developed by Martini E.). Briefly, after manually delineating an Region of Interest (ROI) around the cells, the plugin identified lipid droplets using the ImageJ’s Find Maxima2 algorithm on the maximum projection image after background removal (using the rolling ball algorithm3) and noise reduction (with a median filter).
2.7. RNA Extraction and Quantitative RT-PCR Analysis
In order to perform the RT-PCR analysis, total RNA was first isolated using a trizol-chloroform extraction with TRIzol reagent (Life Technologies, Carlsbad, CA, USA) and chloroform. For the cells collected following cell sorting, RNA was extracted using the RNeasy mini kit (Qiagen, Hilden, Germany). After the extraction, the RNA was quantified by NanoDrop to assess both concentration and quality. Reverse transcription was performed using the SuperScript III reverse transcriptase kit (Invitrogen, Carlsbad, CA, USA). Gene expression was analyzed using the TaqMan gene expression analysis. The samples were amplified with primers for each gene; β-actin was used as the housekeeping gene. The primer assay IDs used in these experiments were: ACTB, Hs99999903_m1; SOX2, Hs01053049_s1; POU5F1, Hs00742896_s1; KLF4, Hs00358836_m1; ALDH1A1, Hs00946916_m1; ALDH1A3, Hs00167476_m1.
2.8. Mammosphere Formation Assay from Cell Lines
The primary mammospheres were produced as previously described [
22]. The mammosphere media used in this assay was DMEM-F12 (Biowest, Nuaillé, France) supplemented with B27 supplement (Invitrogen, Carlsbad, CA, USA) and EGF 20 ng/mL (Vinci Biochem, Florence, Italy). To prepare non-adherent plates, standard 6-well plates were coated with 1 ml of 1% agarose solution in PBS. To produce the 1% agarose solution, agarose powder was dissolved in PBS and autoclaved.
Briefly, cells were centrifuged at 580× g for two minutes and resuspended in 2 mL PBS. To avoid cellular aggregates, a 22 G needle was used to syringe the cell suspension. We found out that 1 × 10⁴ cells/well was a good seeding density for our cell lines. Cells were plated and incubated in a 5% CO2 humidified incubator at 37 °C. After five days, all mammospheres larger than 50 μm were counted and the mammosphere formation efficiency (MFE) was calculated using the following formula: mammosphere forming efficiency (%) = (number of mammospheres per well/number of cells seeded per well) × 100.
2.9. Assessment of Lipid Droplet Content Using CD44/CD24 Stem Cell Markers
MDA-MB-231 and BT474 cell lines were cultured in 6-well plates (Falcon
®, Ref no. 353046, Corning, NY, USA). On the night prior to FACS analysis, cells were treated with BODIPY™ 500/510 C
1, C
12, as described in
Section 2.4. Following incubation with BODIPY
TM 500/510 C
1, C
12, the cells were harvested and incubated in 500 μL of a 1× DPBS, 5% BSA, blocking buffer for forty-five minutes at room temperature. The cells were then stained with Alexa Fluor
® 647 mouse anti-human CD24 (BD Pharmingen, Material No. 561644, San Jose, CA, USA) and CD44-VioBlue
® mouse anti-human CD44 (Miltenyi Biotec, Order No. 130-113-899, Bergisch Gladbach, Germany) for thirty minutes on ice. The antibody concentrations recommended on the accompanying data sheets were used for the stain. Following staining, the cells were pelleted and washed three times with a 1× DPBS, 1% BSA solution, prior to resuspension in a 1% FBS, 1× DPBS solution. The FACS was conducted using the Attune NxT (Thermofisher Scientific Inc., Waltham, MA, USA). FACS data depicted represents analysis done on single, propidium iodide negative, cell population. FlowJo version 10.4.2 (BD Life Sciences, Franklin Lakes, NJ, USA) was used for the analysis.
2.10. Fatty Acid Oxidation Assay
MDA-MB-231, MCF7, T47D, and BT474 cell lines were seeded into 96-well plates (CostarTM, Corning, NY, USA) at 7 × 10⁴ cells per well and treated with either the vehicle or 10 μM TOFA in DMSO. After approximately twenty hours, the cells were assessed using a fatty acid oxidation assay (Abcam, ab217602, Cambridge, United Kingdom) used in conjunction with an extracellular O2 consumption assay (Abcam, ab197243, Cambridge, UK). The protocols accompanying the assays were followed to assess the cell lines after TOFA treatment. Experimental measurements were made using a Wallac EnvisionTM 2104 multilabel reader (Perkin-Elmer, Waltham, MA, USA), maintained at 37 °C throughout the course of the experiment. Excitation filter, UV (TRF) 340 and emission filter APC665 were used to assess the status of the oxygen-sensing probe used for the assay. Measurements of the oxygen-sensing probe were made every 90 s for one and a half hours.
2.11. Transmitted Light and Fluorescence Microscopy
Mammosphere images were acquired with an EVOS FL imaging system (Thermo Fisher Scientific, Inc., Waltham, MA, USA) transmitted light microscope. Fluorescent images were acquired with laser-scanning confocal microscopes: Leica TCS SP5 laser confocal scanner mounted on a Leica DMI 6000B inverted microscope equipped with motorized stage and HCX PL APO 63X/1.4NA oil immersion objective (Leica Mikrosysteme Vertrieb GmbH, Wetzlar, Germany) and Leica TCS SP2 AOBS laser confocal scanner mounted on a Leica DM IRE2 inverted microscope equipped with HCX PL APO 63X/1.4NA oil immersion objective (Leica Mikrosysteme Vertrieb GmbH, Wetzlar, Germany). For the excitation of fluorochromes dyes, 405, 488, 561, and 633 nm laser lines were used on Leica TCS SP5 and Leica TCS SP2 AOBS. The following settings were maintained for fluorescent images acquisition: digital zoom 2.5 and a 1024 × 1024 scan format.
2.12. Kaplan-Meier Plotter
Kaplan–Meier plots were generated using the Kaplan–Meier plotter found at
http://kmplot.com/analysis/index.php?p=background [
23]. This is an online platform that enables the user to assess the effect of 54,000 genes on survival in 21 cancer types. Prognostic values for PLIN2 mRNA (Affymetrix ID 209122_at) expression was evaluated for a cohort of 3951 breast cancer patients.
2.13. Statistical Analysis
All experiments were carried out at least three times unless otherwise indicated. Data were analyzed using GraphPad Prism version 8 statistical software (GraphPad Software, San Diego, CA, USA). Experimental results are reported as mean and standard deviation unless otherwise stated.
4. Discussion
The resurgence of interest in tumor metabolism has largely focused on the dysregulation of metabolic pathways in the primary tumor itself. However, there is increasing evidence that the metabolic hallmarks of singular populations could play a role in determining their response to therapeutic challenges. Indeed, over the past five years, numerous reports have emerged suggesting that alterations in lipid metabolism correlate with resistance [
24,
31]. The mechanisms by which dysregulated lipid metabolism contribute to resistance still remain largely unknown. In this study, we investigated the relationship between lipid metabolism and stemness traits by interrogating a panel of breast cancer cell lines.
One of the hallmarks of therapeutic resistant populations is an observed increase in cytoplasmic lipid droplets. Lipid droplets are the lipid storage organelle of the cell, in which neutral lipids such as triglycerides and sterol esters are sequestered. They are dynamic organelles that arise from pools of lipids within the ER in response to stress or alterations in metabolism. The first association of lipid droplets with tumor cells was first made over 50 years ago [
32]. Recently, lipid droplets have been shown to correlate with stemness in colorectal cancer [
33]. Despite that, surprisingly few have focused on the use of the lipid droplet as a biomarker in breast cancer.
The protein component of lipid droplets could be used as a proxy and facilitate their inclusion in histopathological analyses. In this study, we have focused on PLIN2. PLIN2 is a member of the perilipin family of proteins that includes PLIN2, -3, -4, and -5. This family of lipid-droplet associated proteins plays an instrumental role in lipid droplet formation, stability and trafficking [
19,
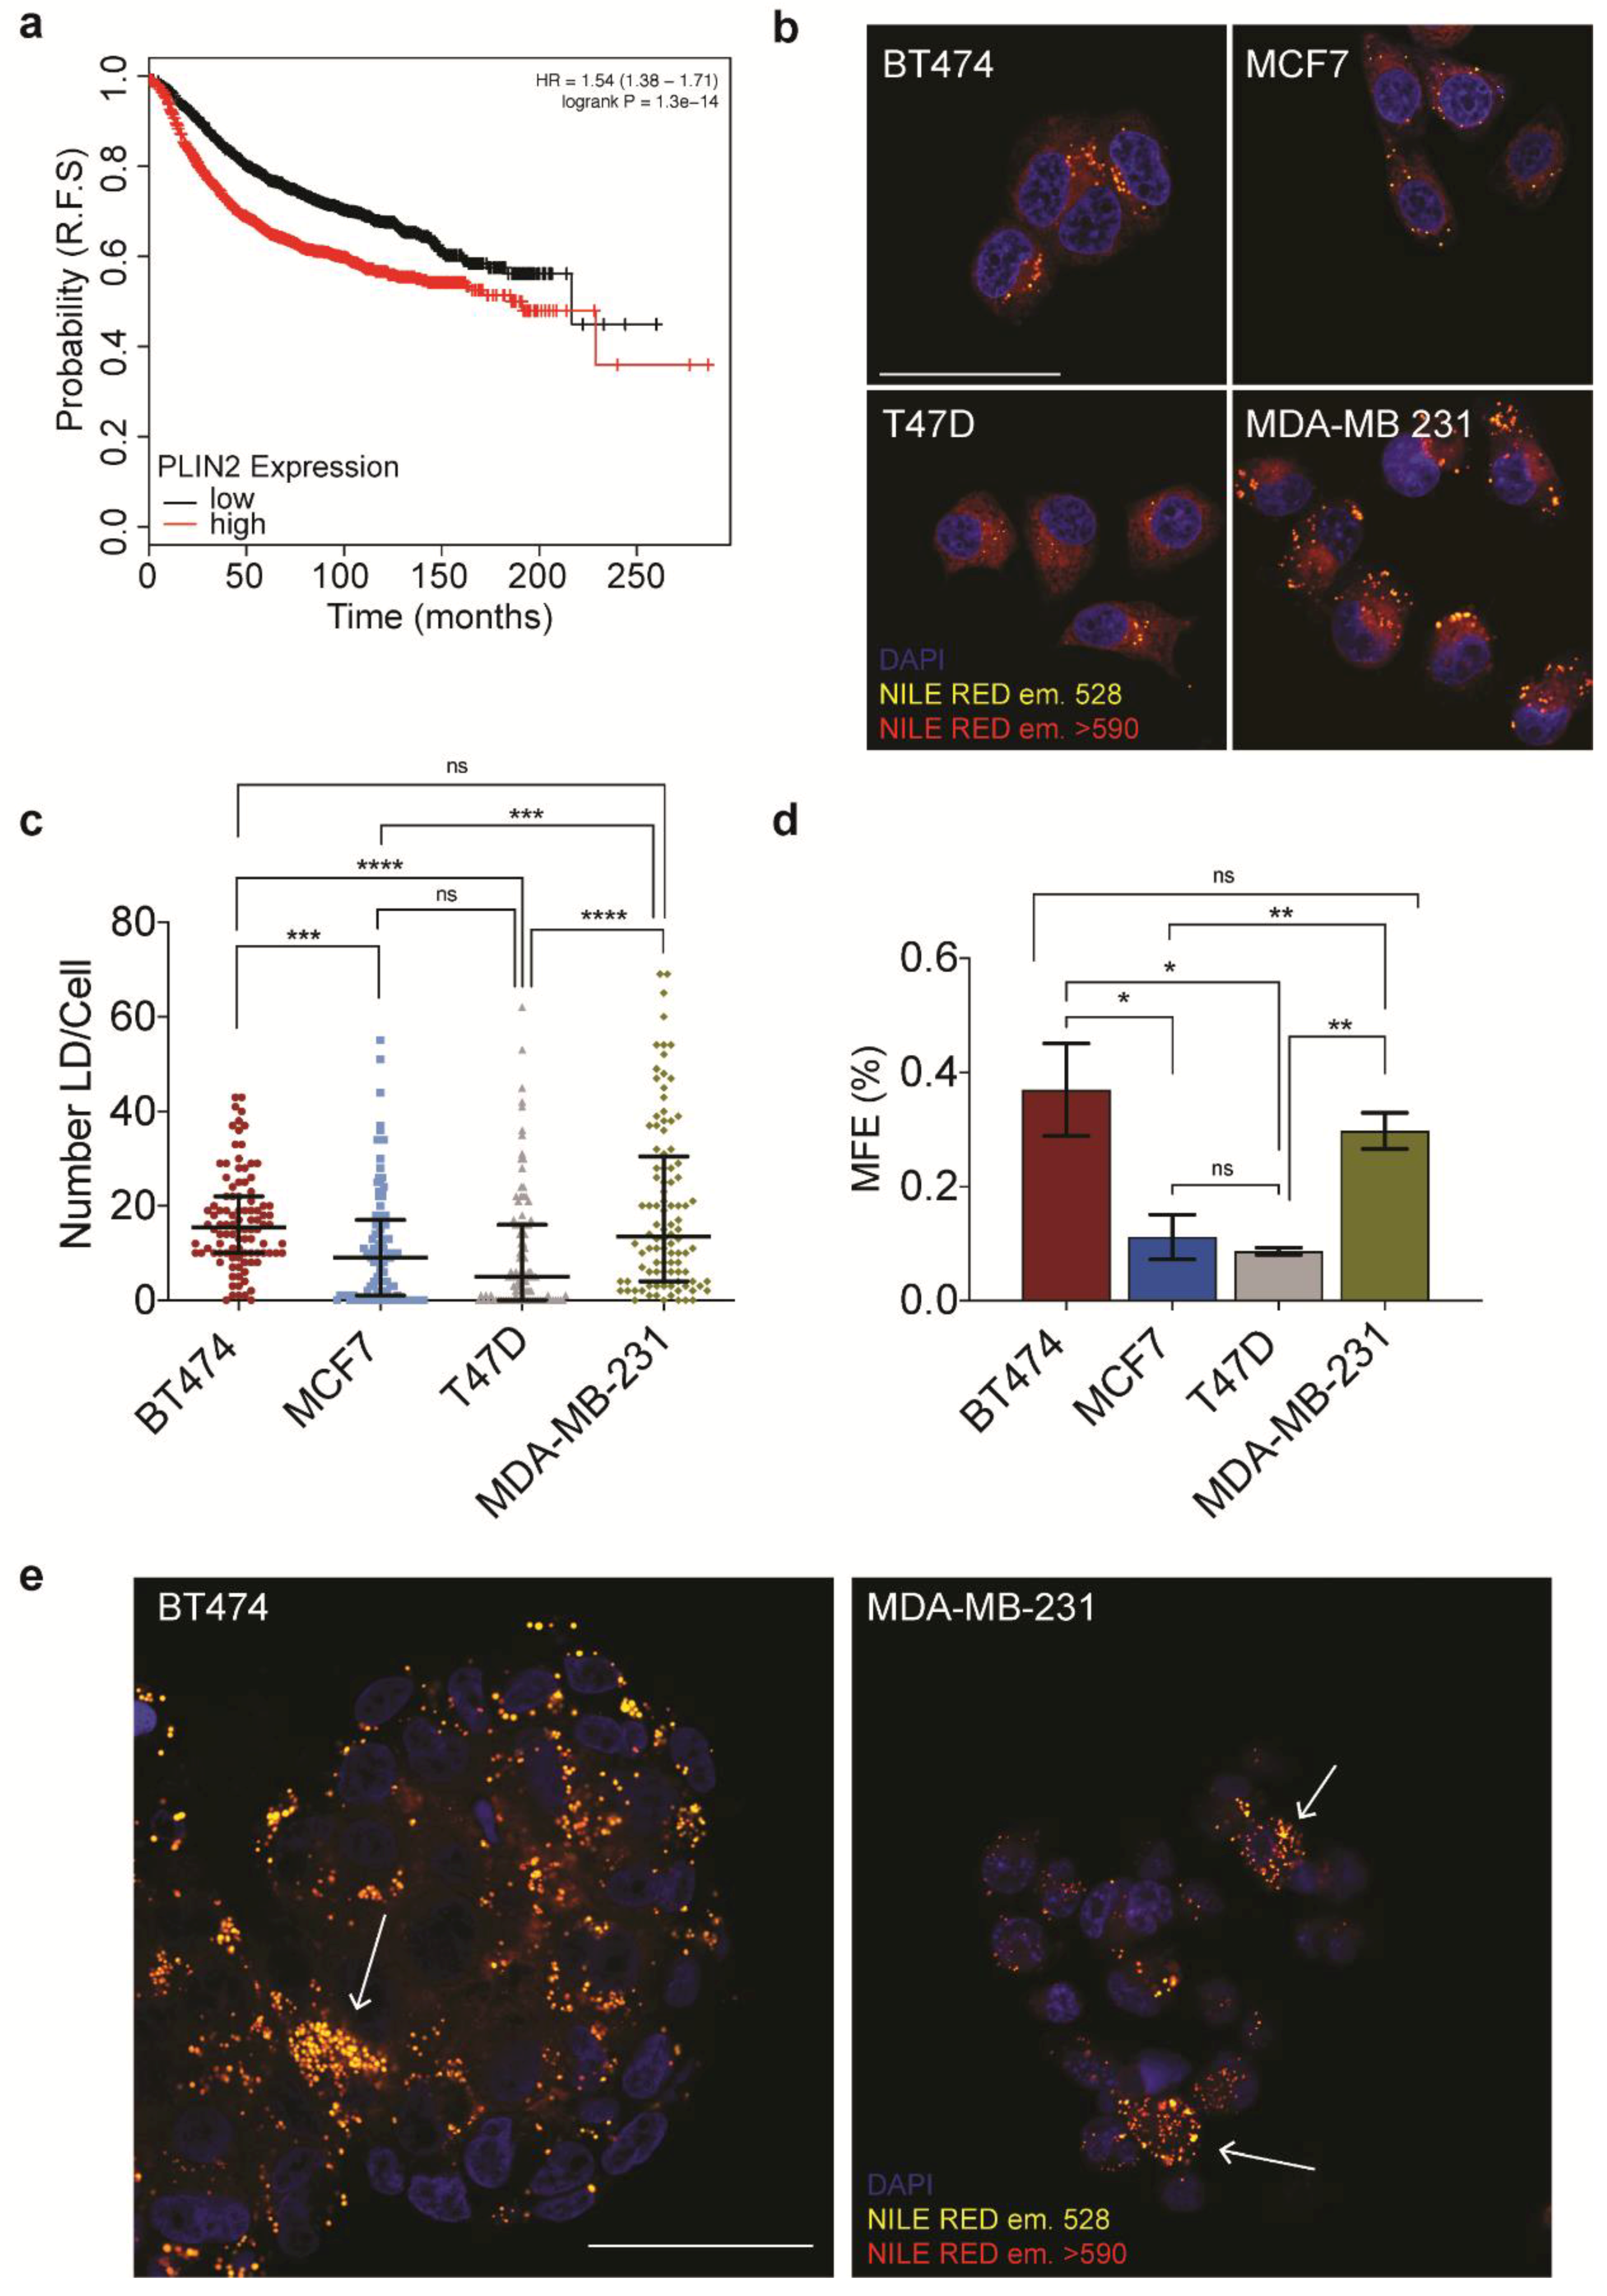
34]. Querying the Kaplan–Meier plotter, we observed a significant negative correlation between lipid droplet associated protein PLIN2 expression level and relapse-free survival in breast cancer patients [
23]. This observation stimulated us to better understand the association. One of the outstanding questions in the field is whether the lipid droplets that have been observed in therapeutic resistant cell populations are the result of de novo synthesis in the face of a therapeutic challenge, or if they are an enrichment of a previously metabolically distinct population of cells. The finding that PLIN2 expression in the primary tumor correlates with a worse prognosis suggests that at least in a subset of patients, pre-existing alterations in lipid metabolism could correlate with disease progression.
Interestingly, evaluation of a panel of breast cancer cell lines revealed distinct differences in lipid droplet number between the cell lines. This is despite being maintained in similar media conditions, at comparable confluency. It is interesting to note, as beautifully cataloged in a recent study, that despite having been maintained for 40-plus years in culture, in non-physiological conditions, the metabolic profiles of these cell lines have retained some significant differences, suggesting perhaps a metabolic addiction [
35]. In this regard, it is important to highlight that even within individual cell lines, we observed a high degree of heterogeneity in terms of lipid droplet loading within the population. This variation could reflect alterations in the cell cycle, or intriguingly, it could be a marker of metabolically distinct clonal populations, among which CSCs within the cell lines themselves.
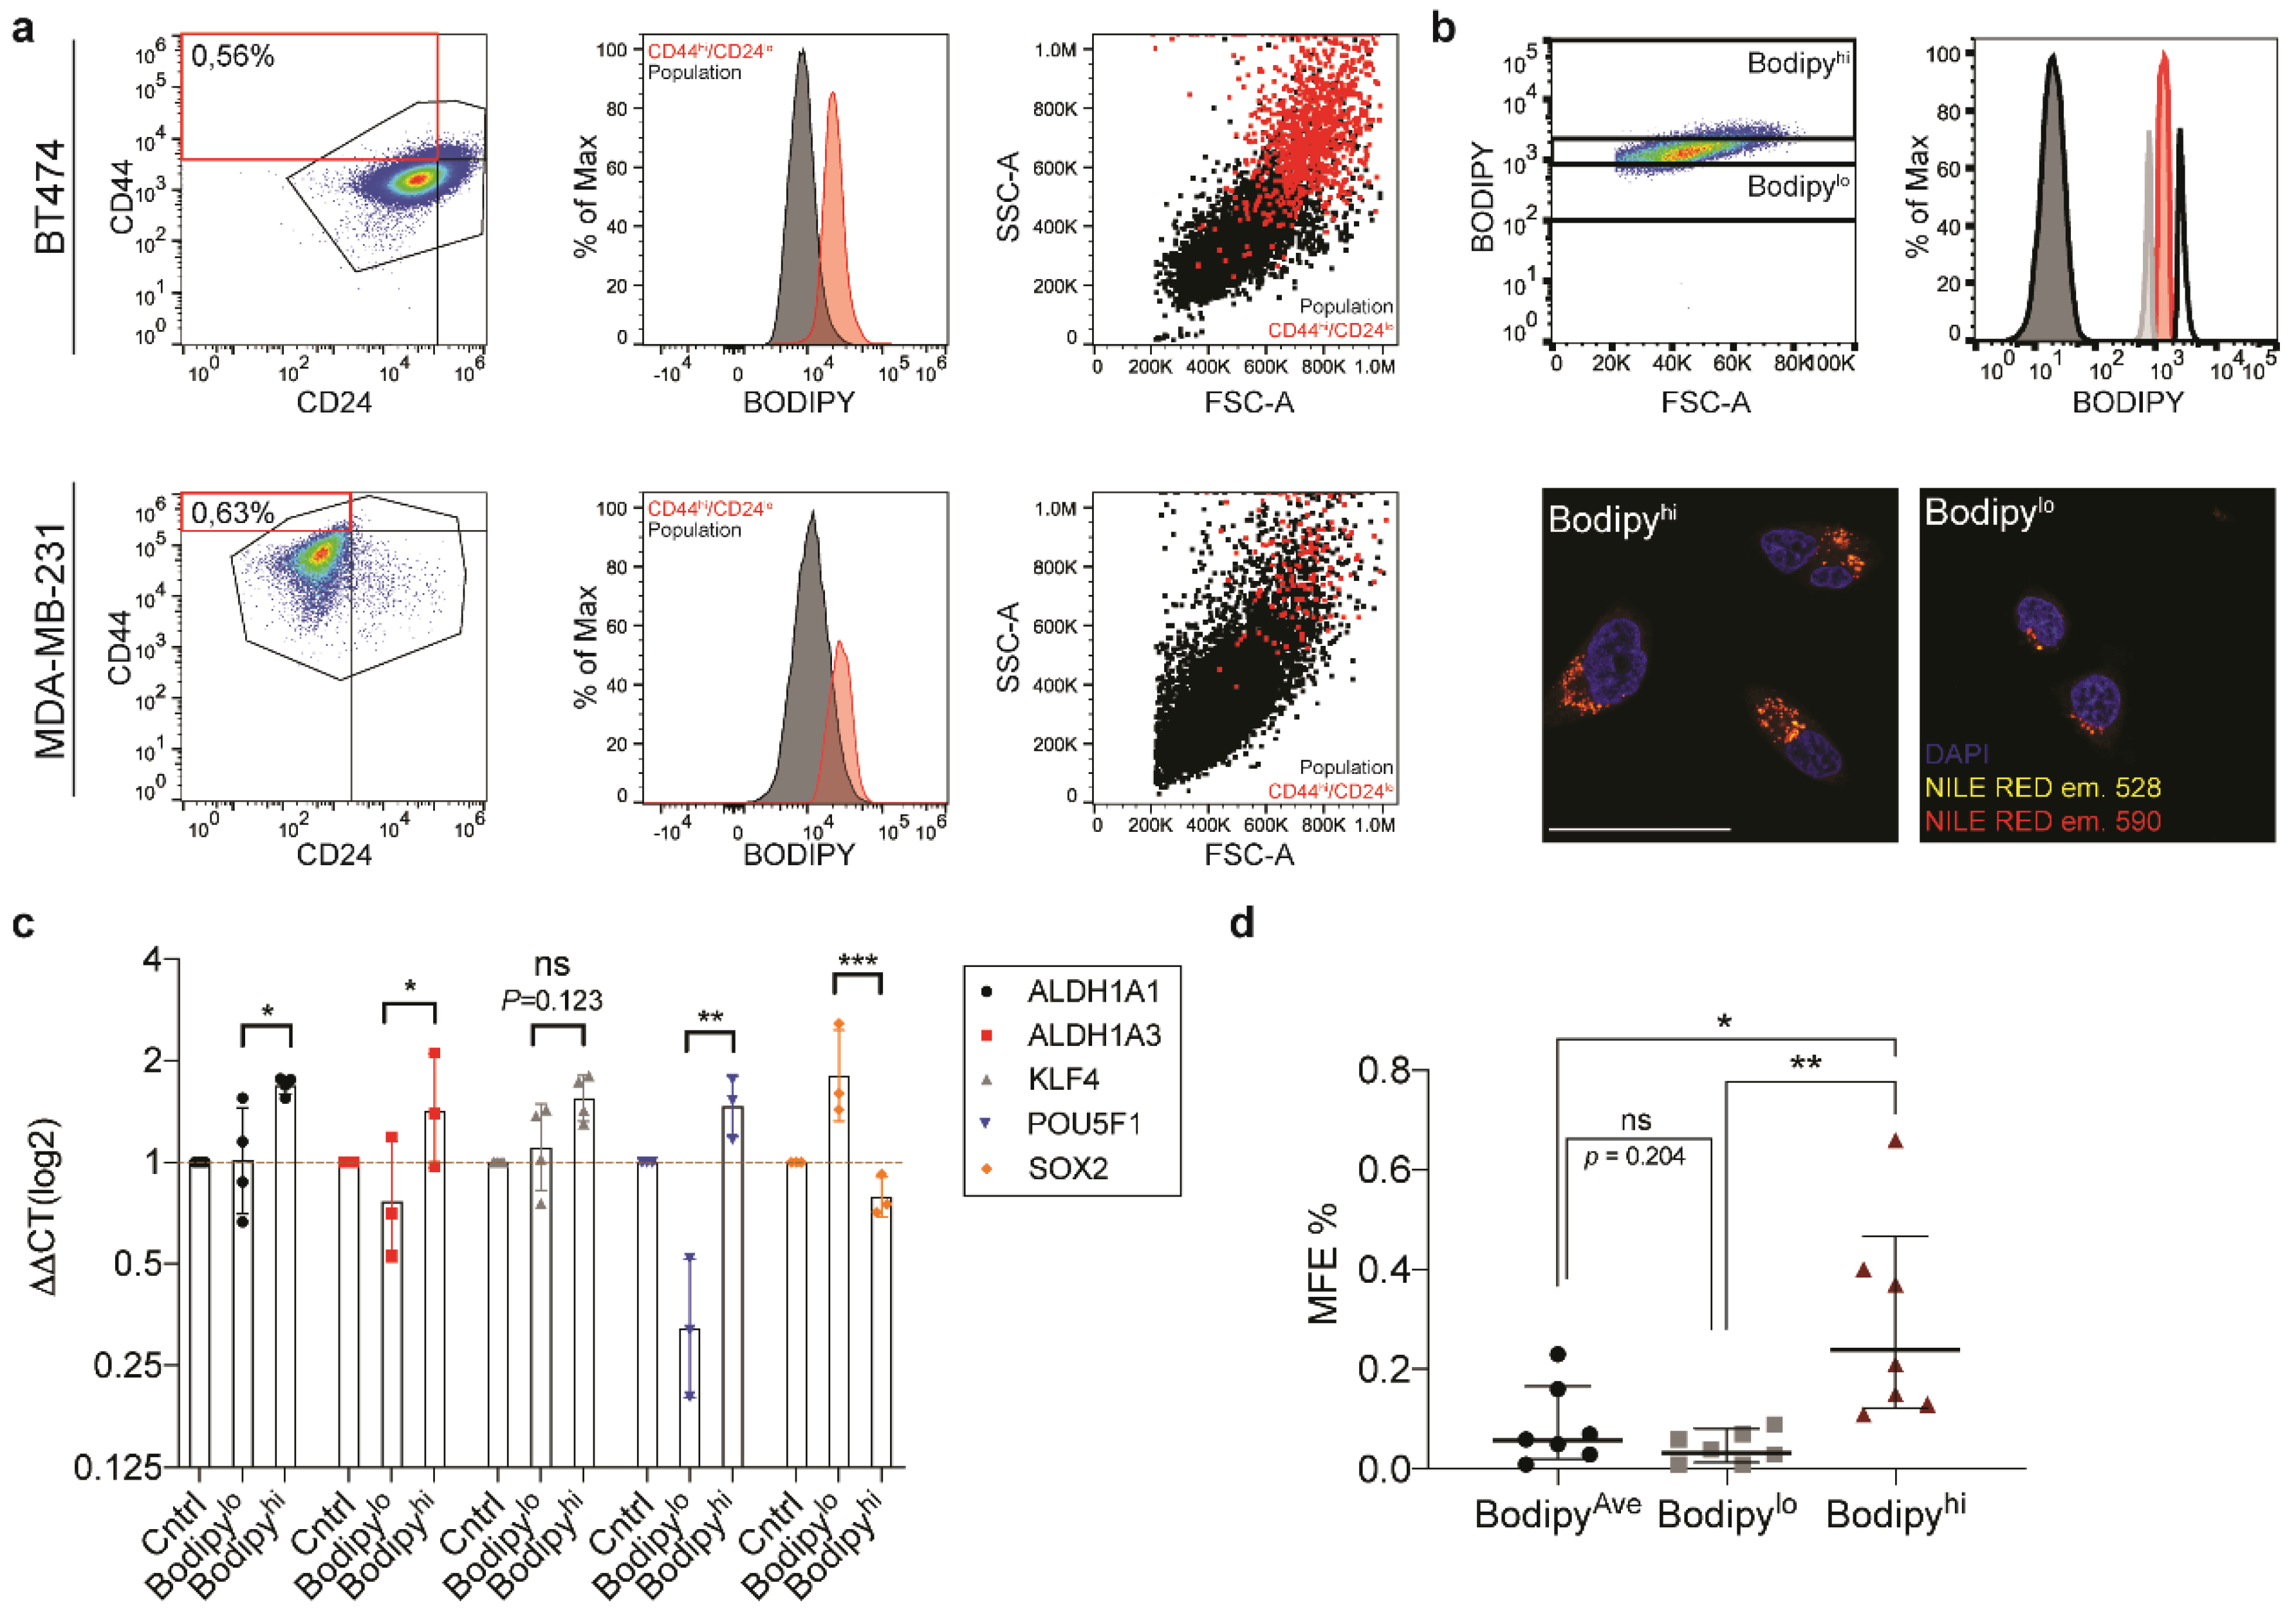
One of the most elusive, yet highly sought-after contributors to heterogeneity is the population of CSCs. The CSC theory of tumor progression proposes that it is this population that resists therapeutic intervention, and acts as the seed for tumor recurrence. Therefore, efficient targeting of this population would lead to higher therapeutic efficacy and better long-term survival rates. However, for many tumor types, we still lack robust markers to enable the identification and characterization of the CSC population. Interestingly, we observed a strong correlation between lipid droplet number and stemness in the cell lines we used in this study.
Having devised a method to sort the population based upon lipid droplet number, we were able to demonstrate an increase in mammosphere forming capacity and stem cell markers in the lipid droplethi segment of the population. An additional characteristic of lipid droplet containing cells which emerged from this study was the correlation between lipid droplets and increased cytosolic complexity, which was detected as increased SSC at FACS. The demonstration that lipid droplets contribute to increased side scatter provides an interesting stain-free mechanism to distinguish lipid droplethi populations. Taken together, this data suggests that inclusion of lipid droplets into the current criteria for CSC identification could provide an additional, low-cost parameter for stem cell identification.
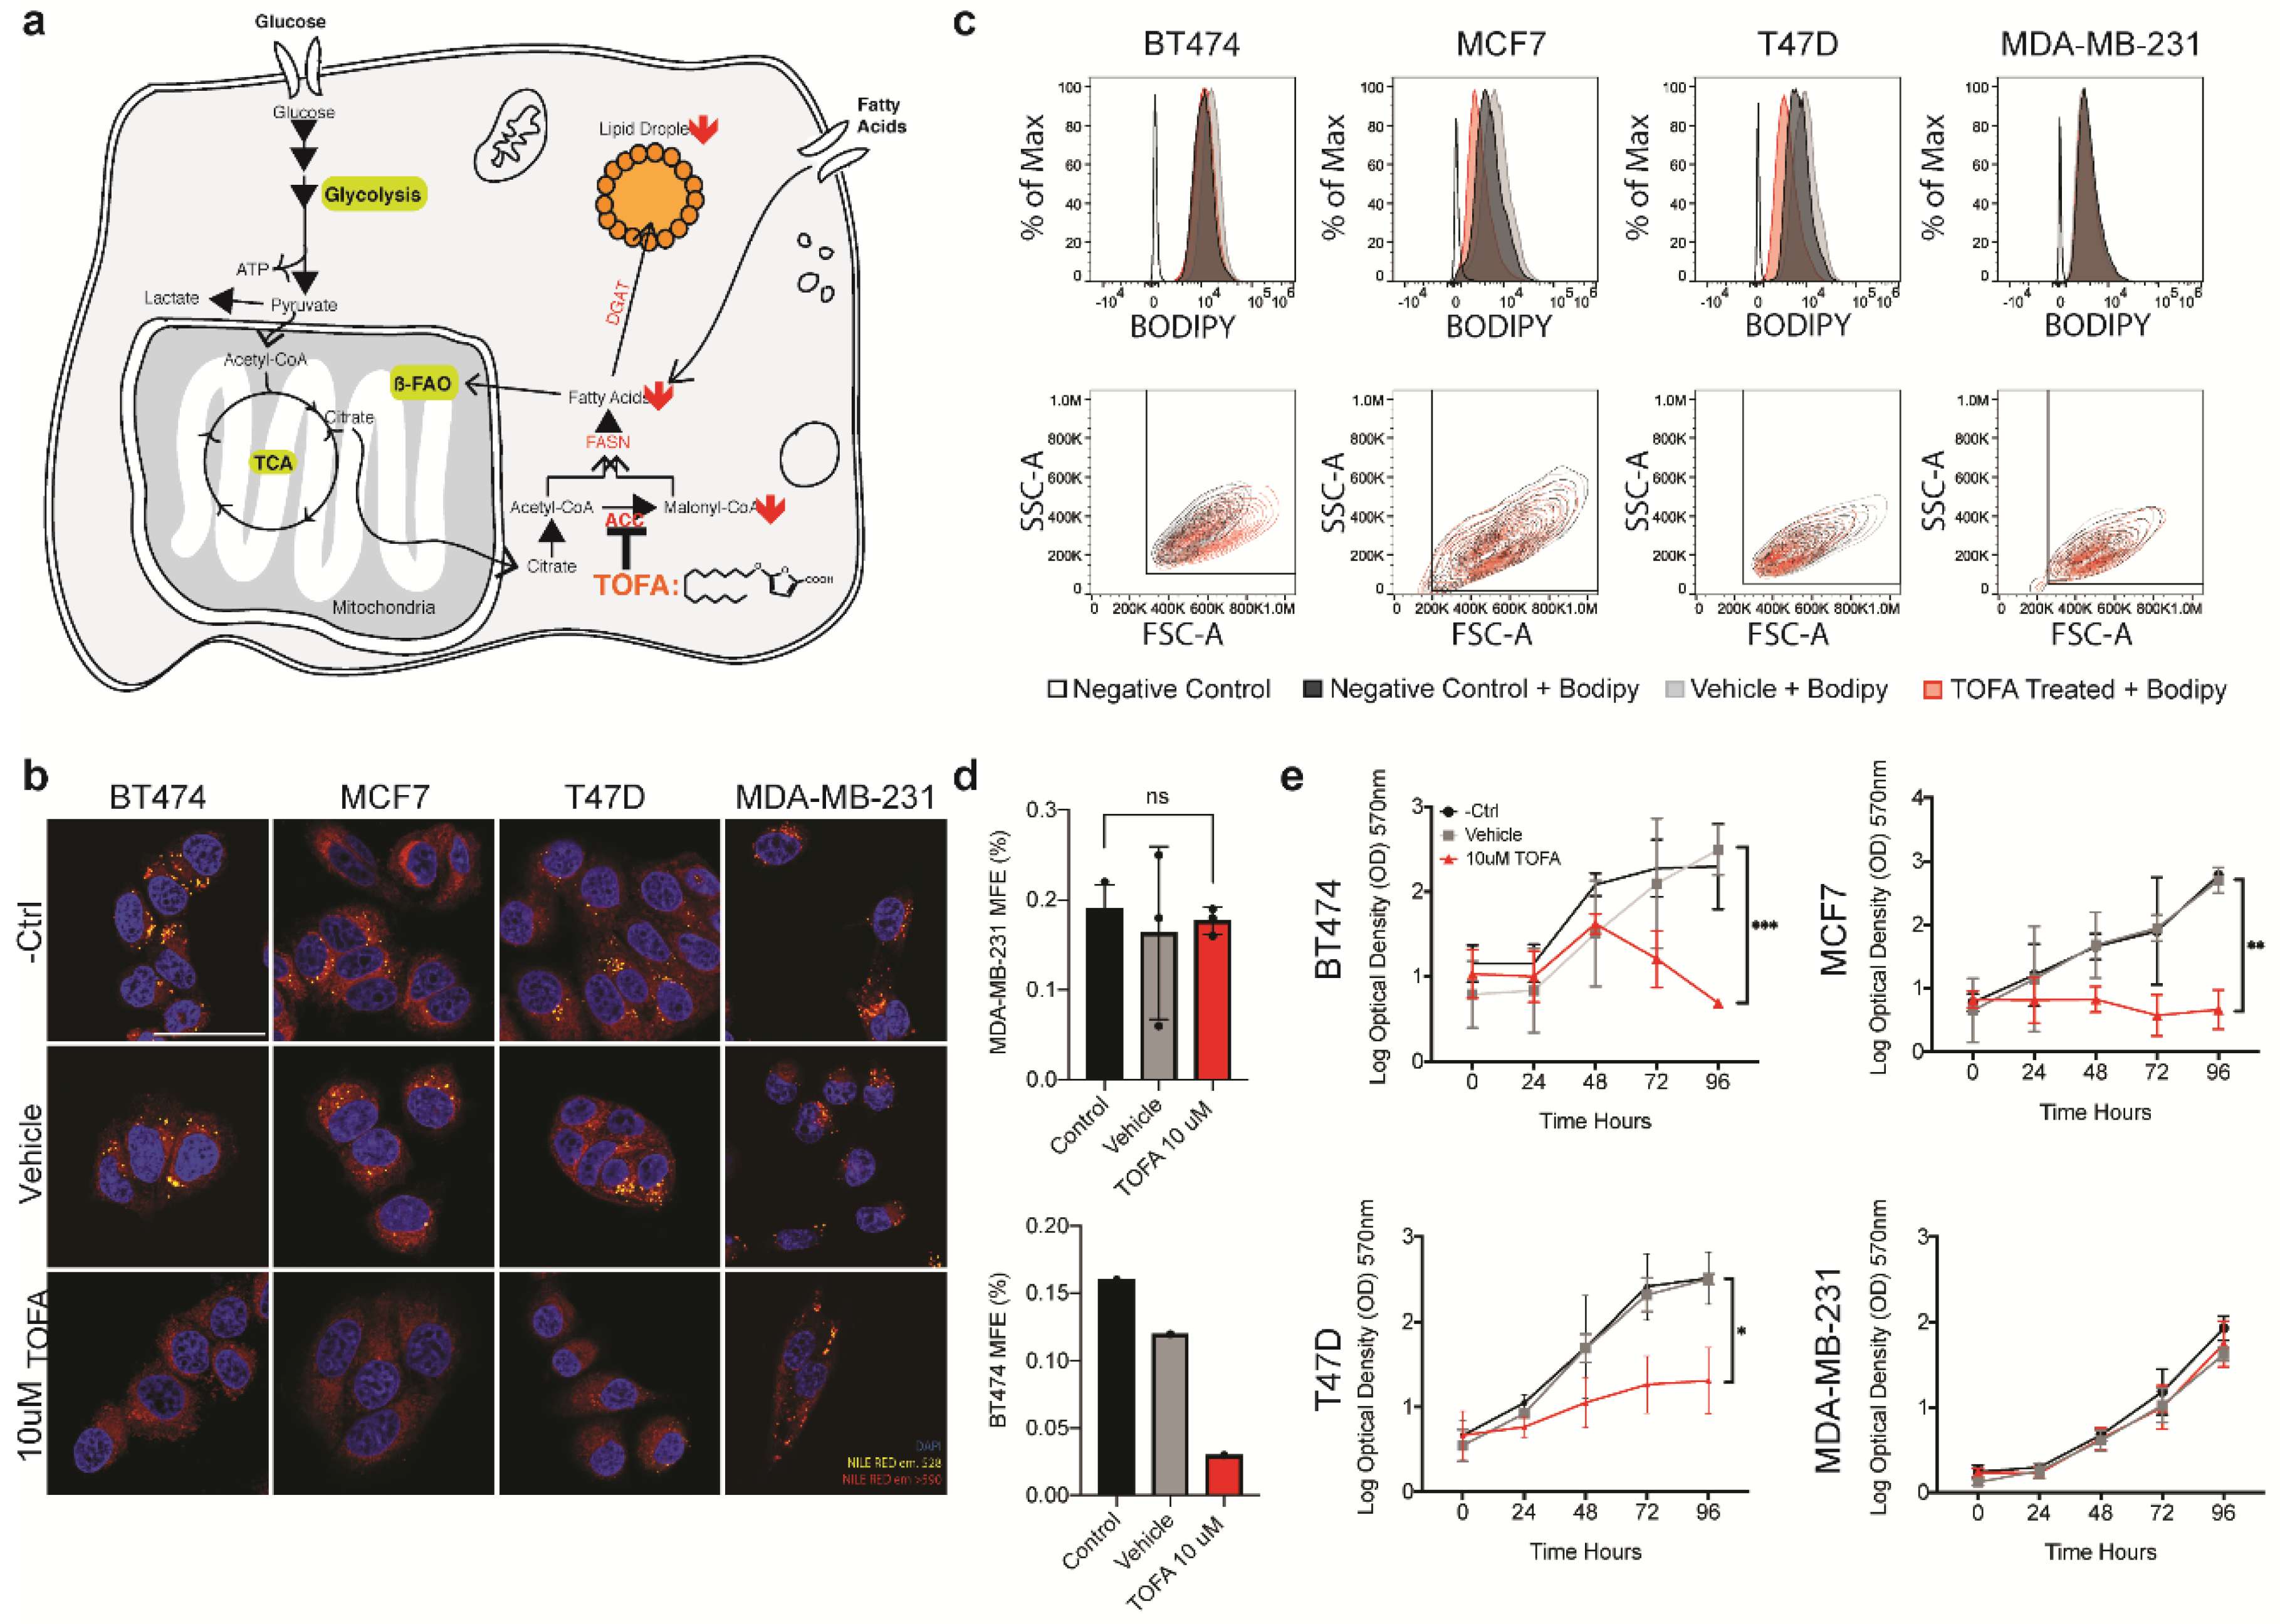
We also demonstrate that this feature of CSC metabolism can be exploited in therapeutic settings by targeting lipid metabolism. In line with previous reports for CRC, exposure to TOFA, an ACAA targeting drug, profoundly impacted upon lipid droplet persistence in our panel of cell lines [
36]. Treatment with TOFA severely affected proliferation in three out of the four lines tested. In the case of BT474, for which we have shown a strong correlation between lipid droplet abundance and stemness, TOFA mediated lipid droplet depletion also resulted in a decrease in the expression of several markers of stemness. An interesting observation for further studies is the cell line MDA-MB-231 that appeared to be largely resistant to treatment by TOFA, as seen by the lack of impact upon lipid droplets number as quantified at FACS. In line with this, we observed no effect of TOFA treatment on viability or stemness in the MDA-MB-231, despite observing a drastic effect in all other cell lines. This data suggests that MDA-MB-231 is able to fulfill its fatty acid demands by other means. As TOFA specifically targets de novo fatty biosynthesis, it would be informative to perform a more inclusive study, using a panel of inhibitors targeting the various druggable components of the lipid droplet assembly cascade. However, despite the lack of efficacy on MDA-MB-231, the efficacy of TOFA in inhibiting proliferation of the other cell lines used in this study suggests that it would be interesting to explore the inclusion of lipid metabolic targeting compounds into current therapeutic regimes.


