Differential Gene Expression in Circulating CD14+ Monocytes Indicates the Prognosis of Critically Ill Patients with Sepsis

 , , , ,
Abstract
1. Introduction
2. Experimental Section
2.1. Patients and Controls
2.2. Isolation of Peripheral Blood Mononuclear Cells and Polymorphonuclear Cells
2.3. Flow Cytometry
2.4. Isolation of CD14+ Monocytes
2.5. Library Preparation
2.6. Standard Bioinformatic Analysis
2.7. Preparation of RNA and NanoString Analysis
2.8. Statistical Analysis
3. Results
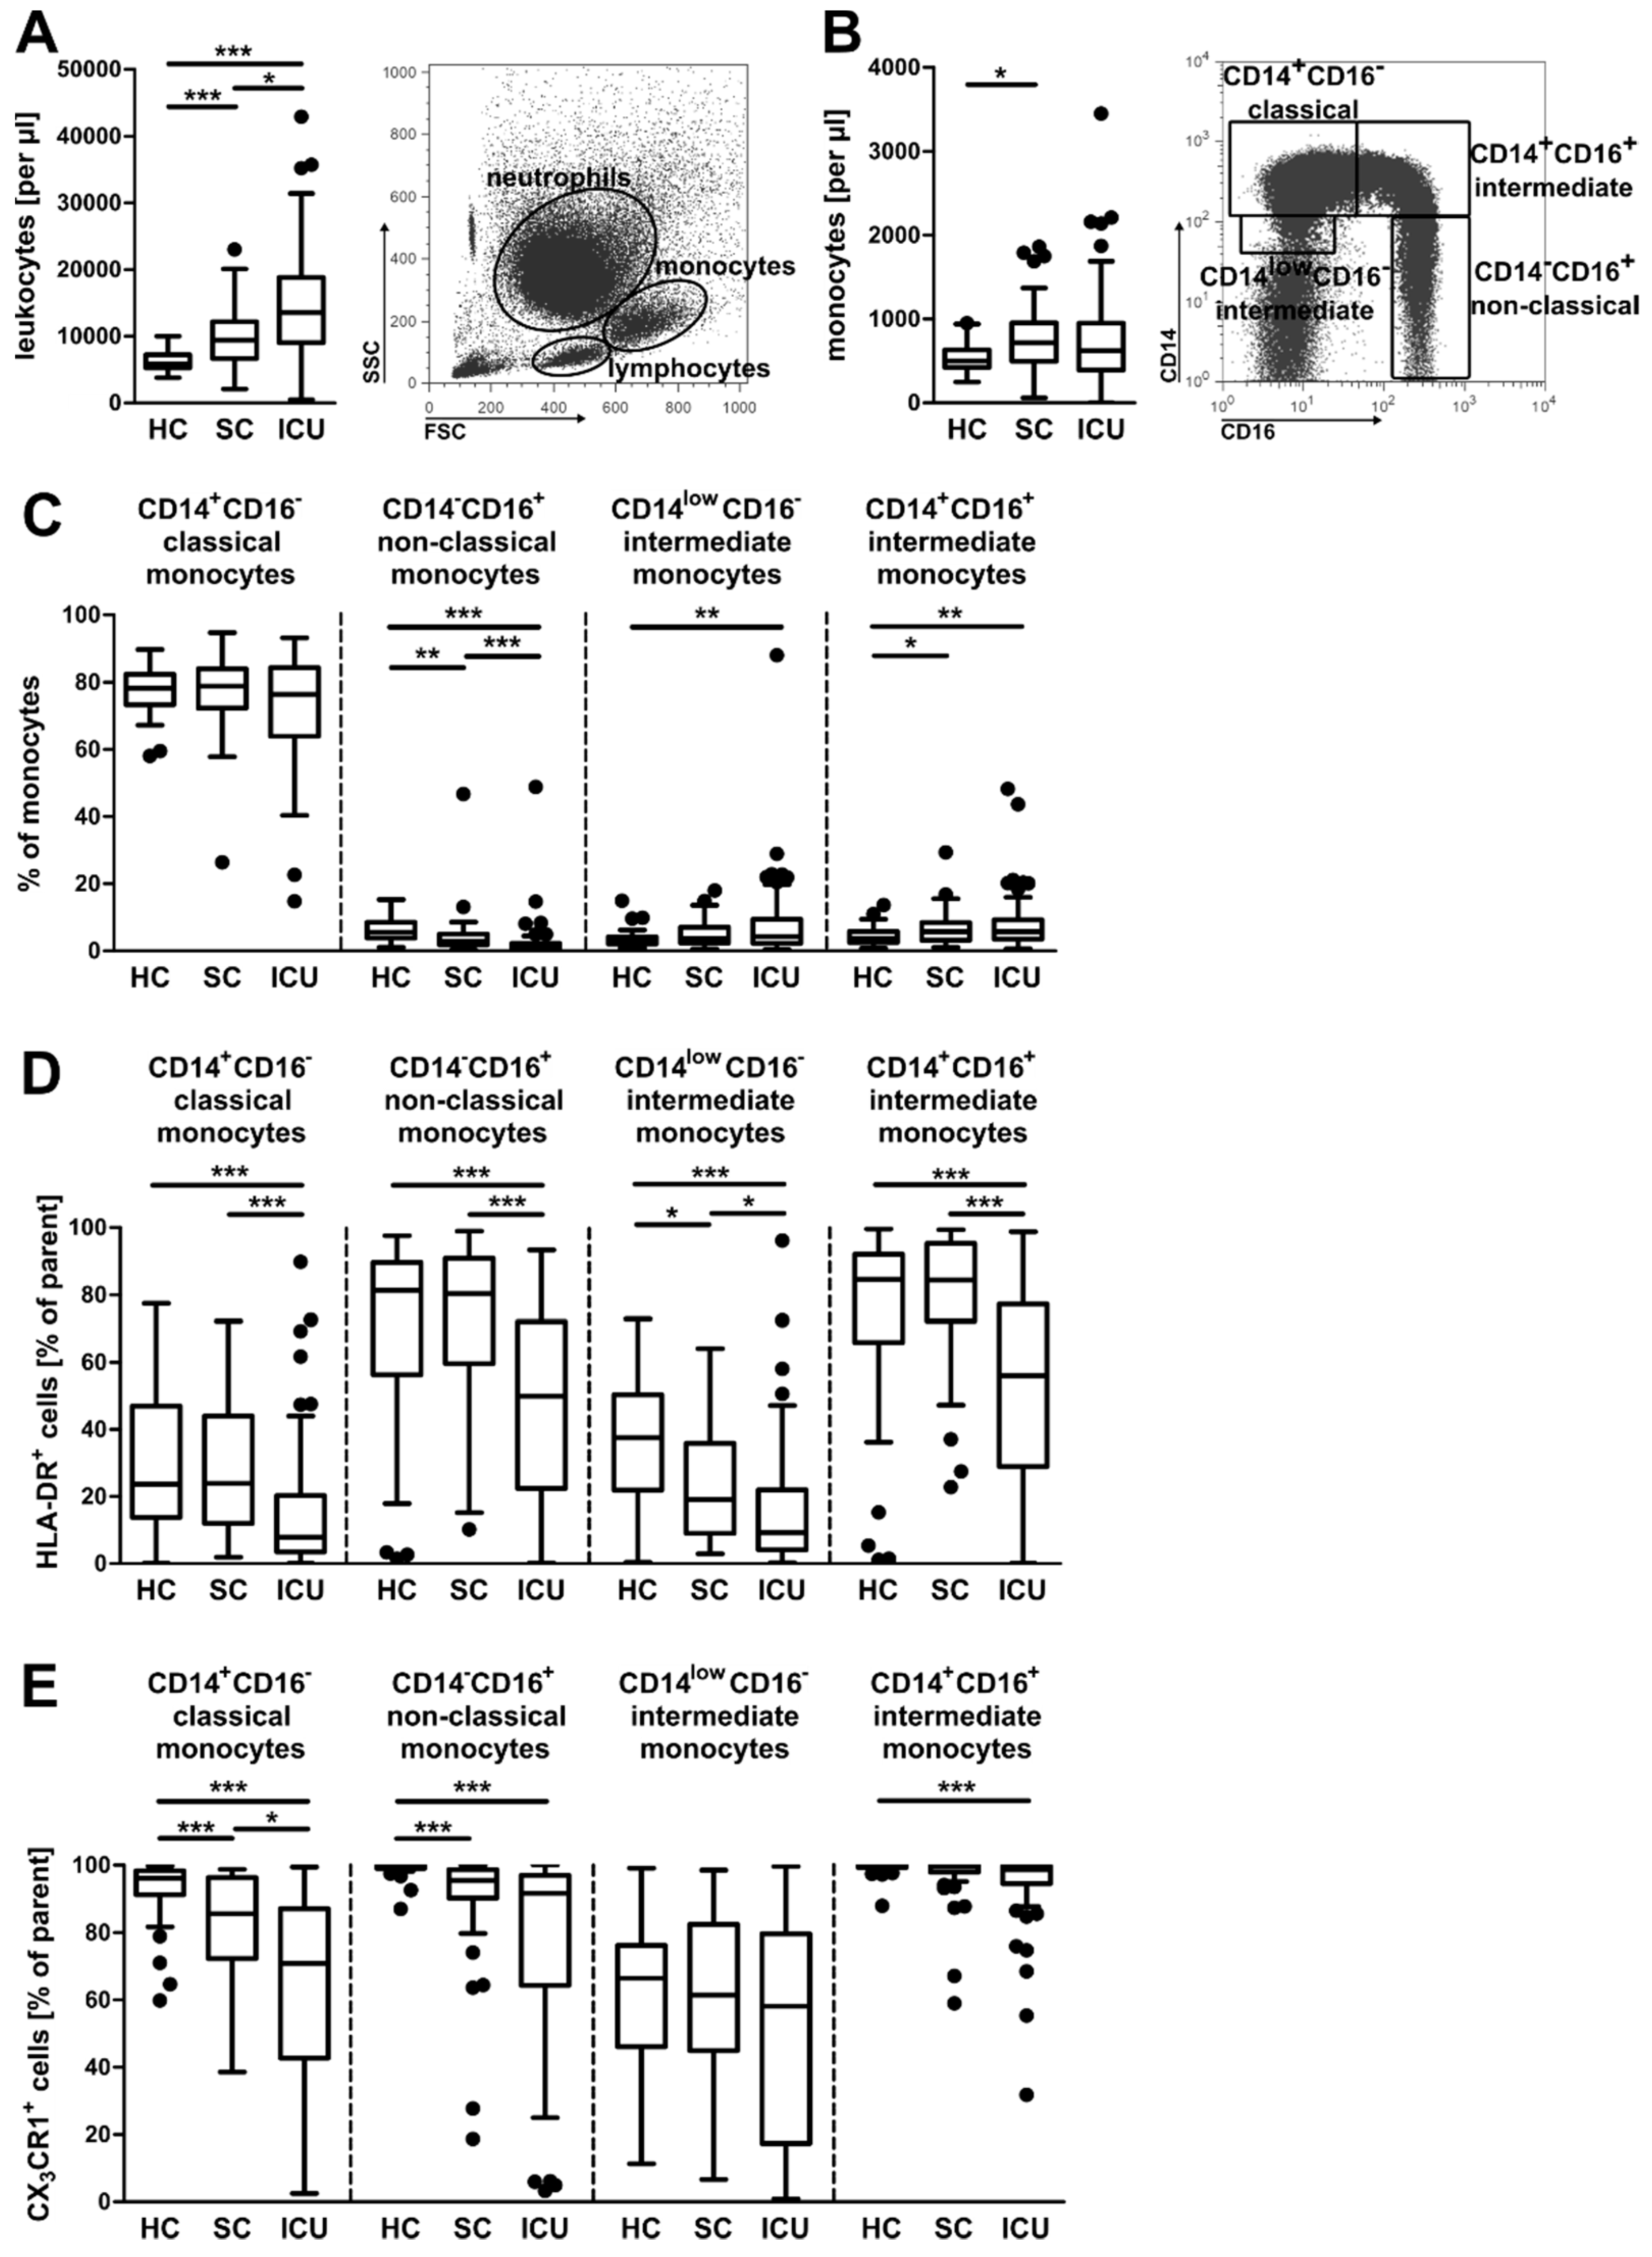
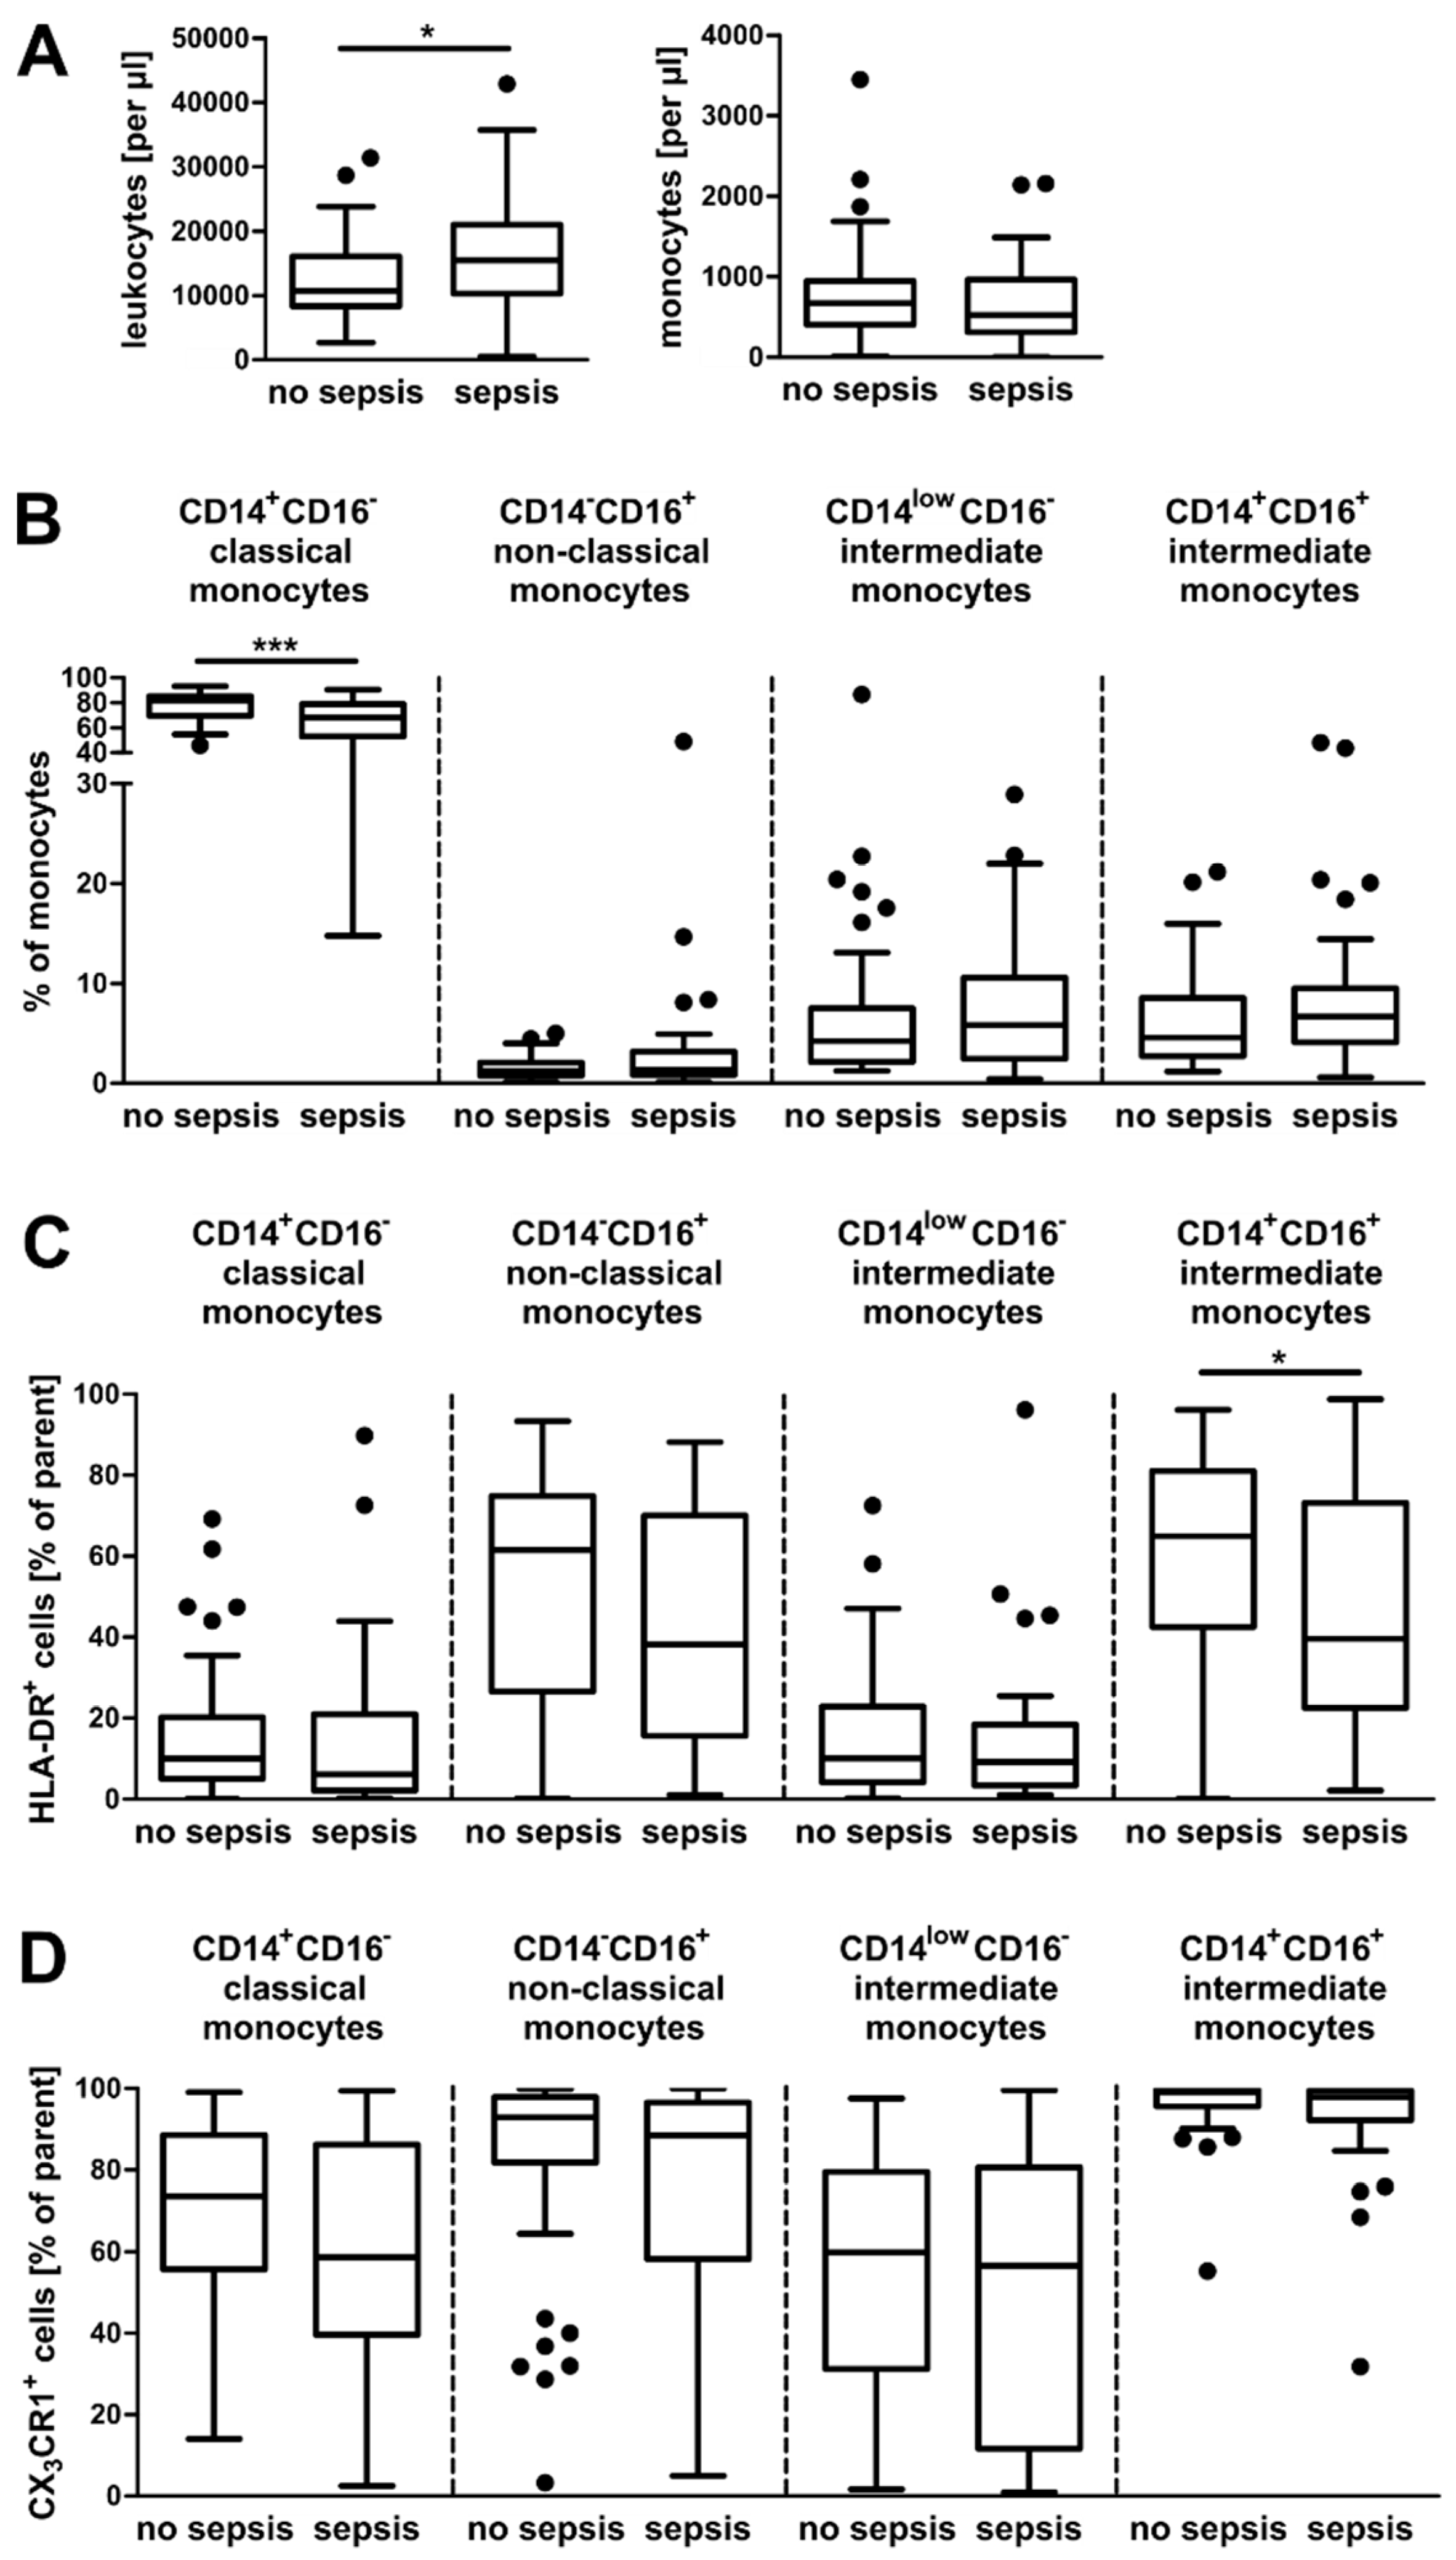
3.1. Alterations in the Composition of Circulating Monocyte Populations and Their Surface Marker Expression in Critically Ill Patients
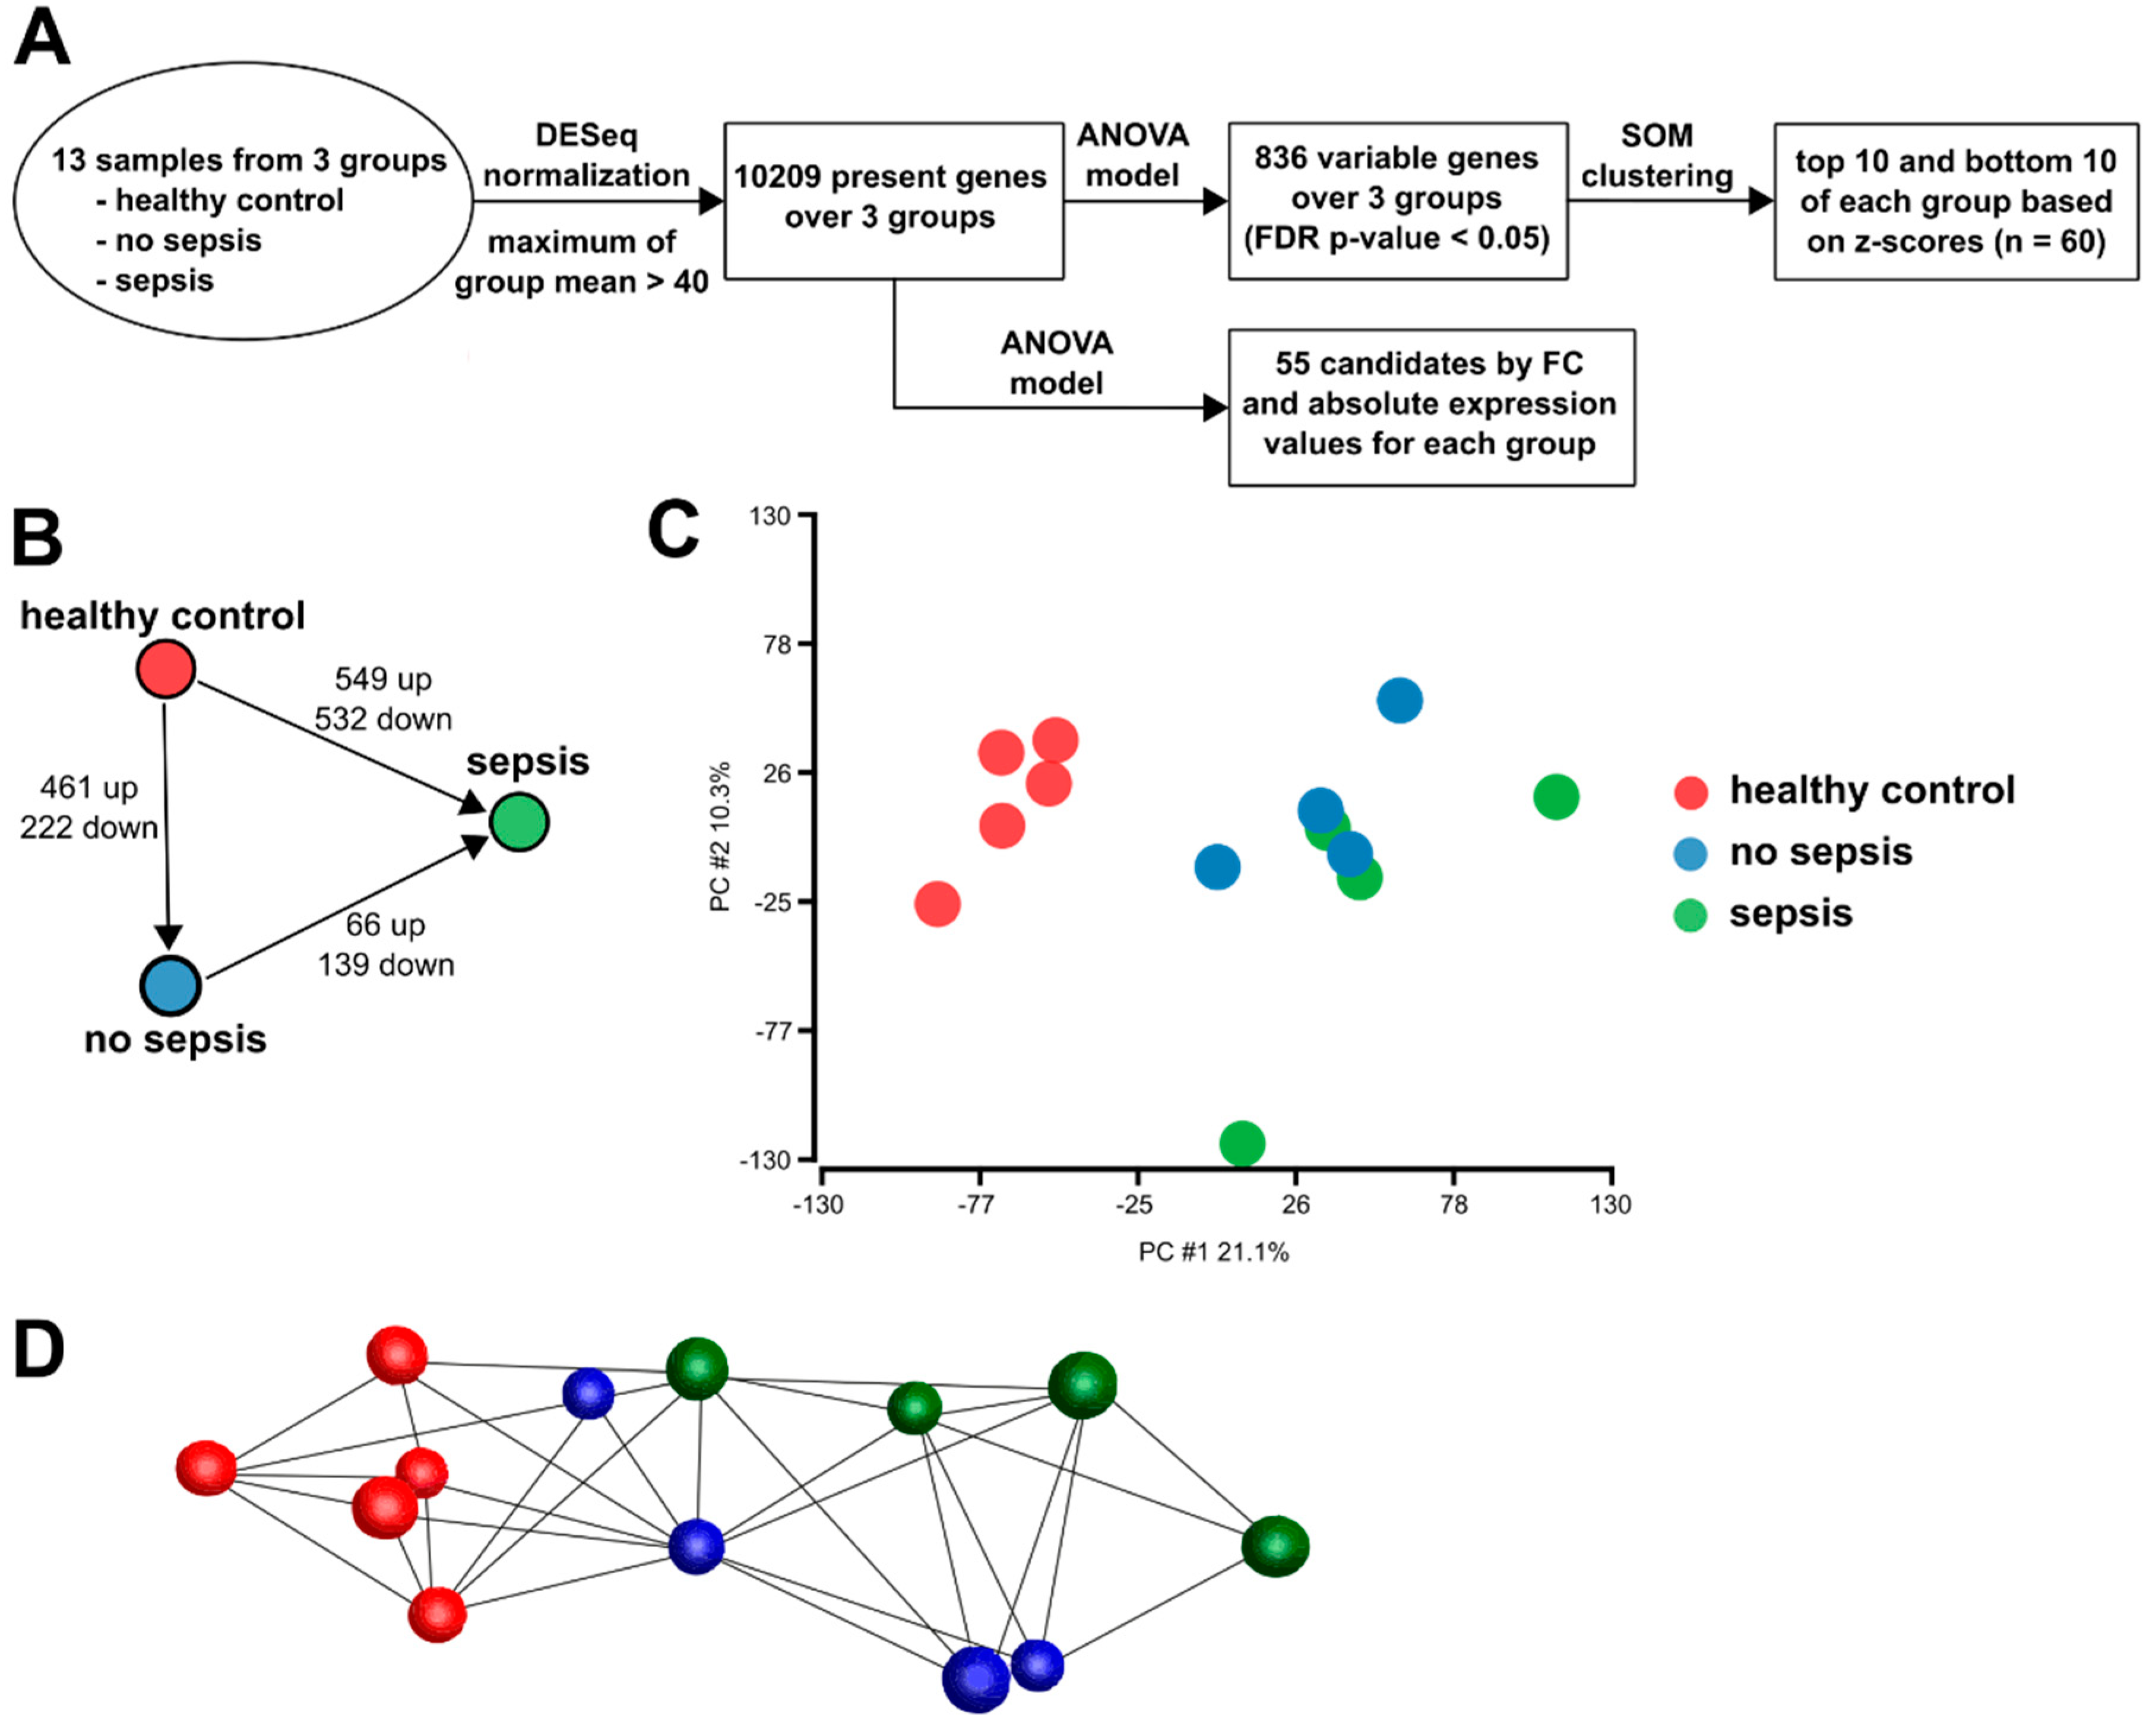
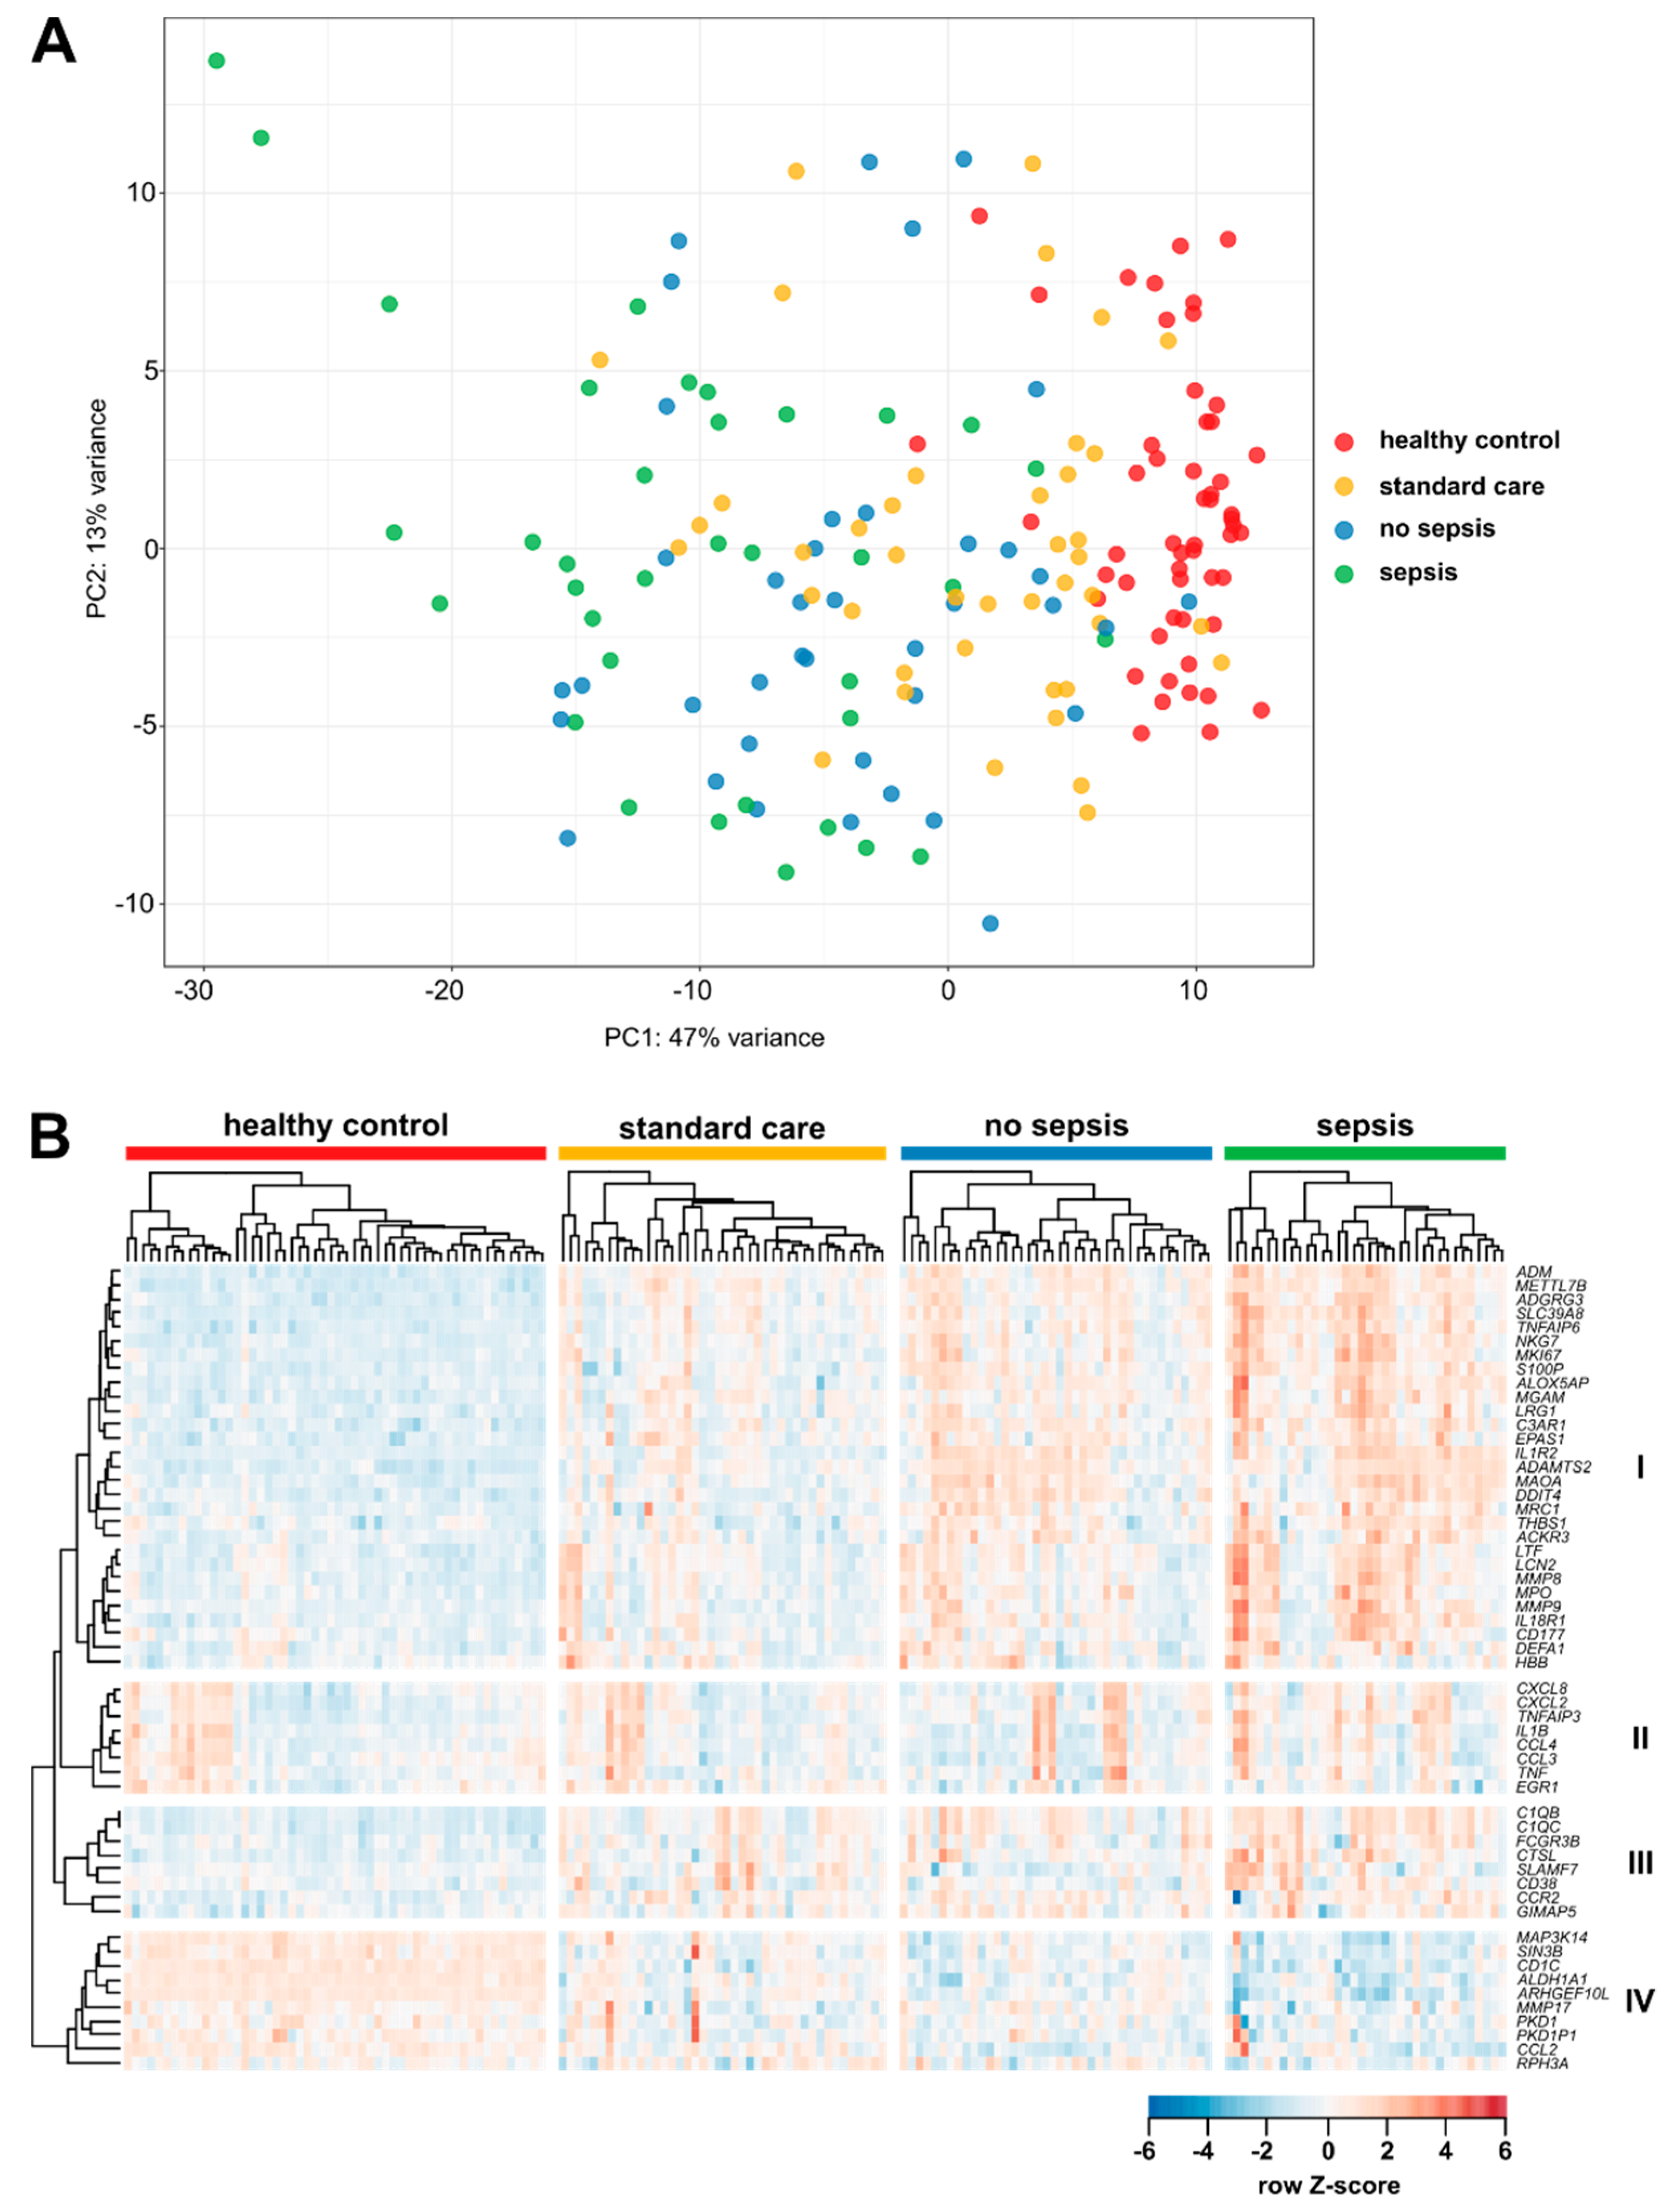
3.2. Gene Expression in CD14+ Monocytes from Critically Ill Patients
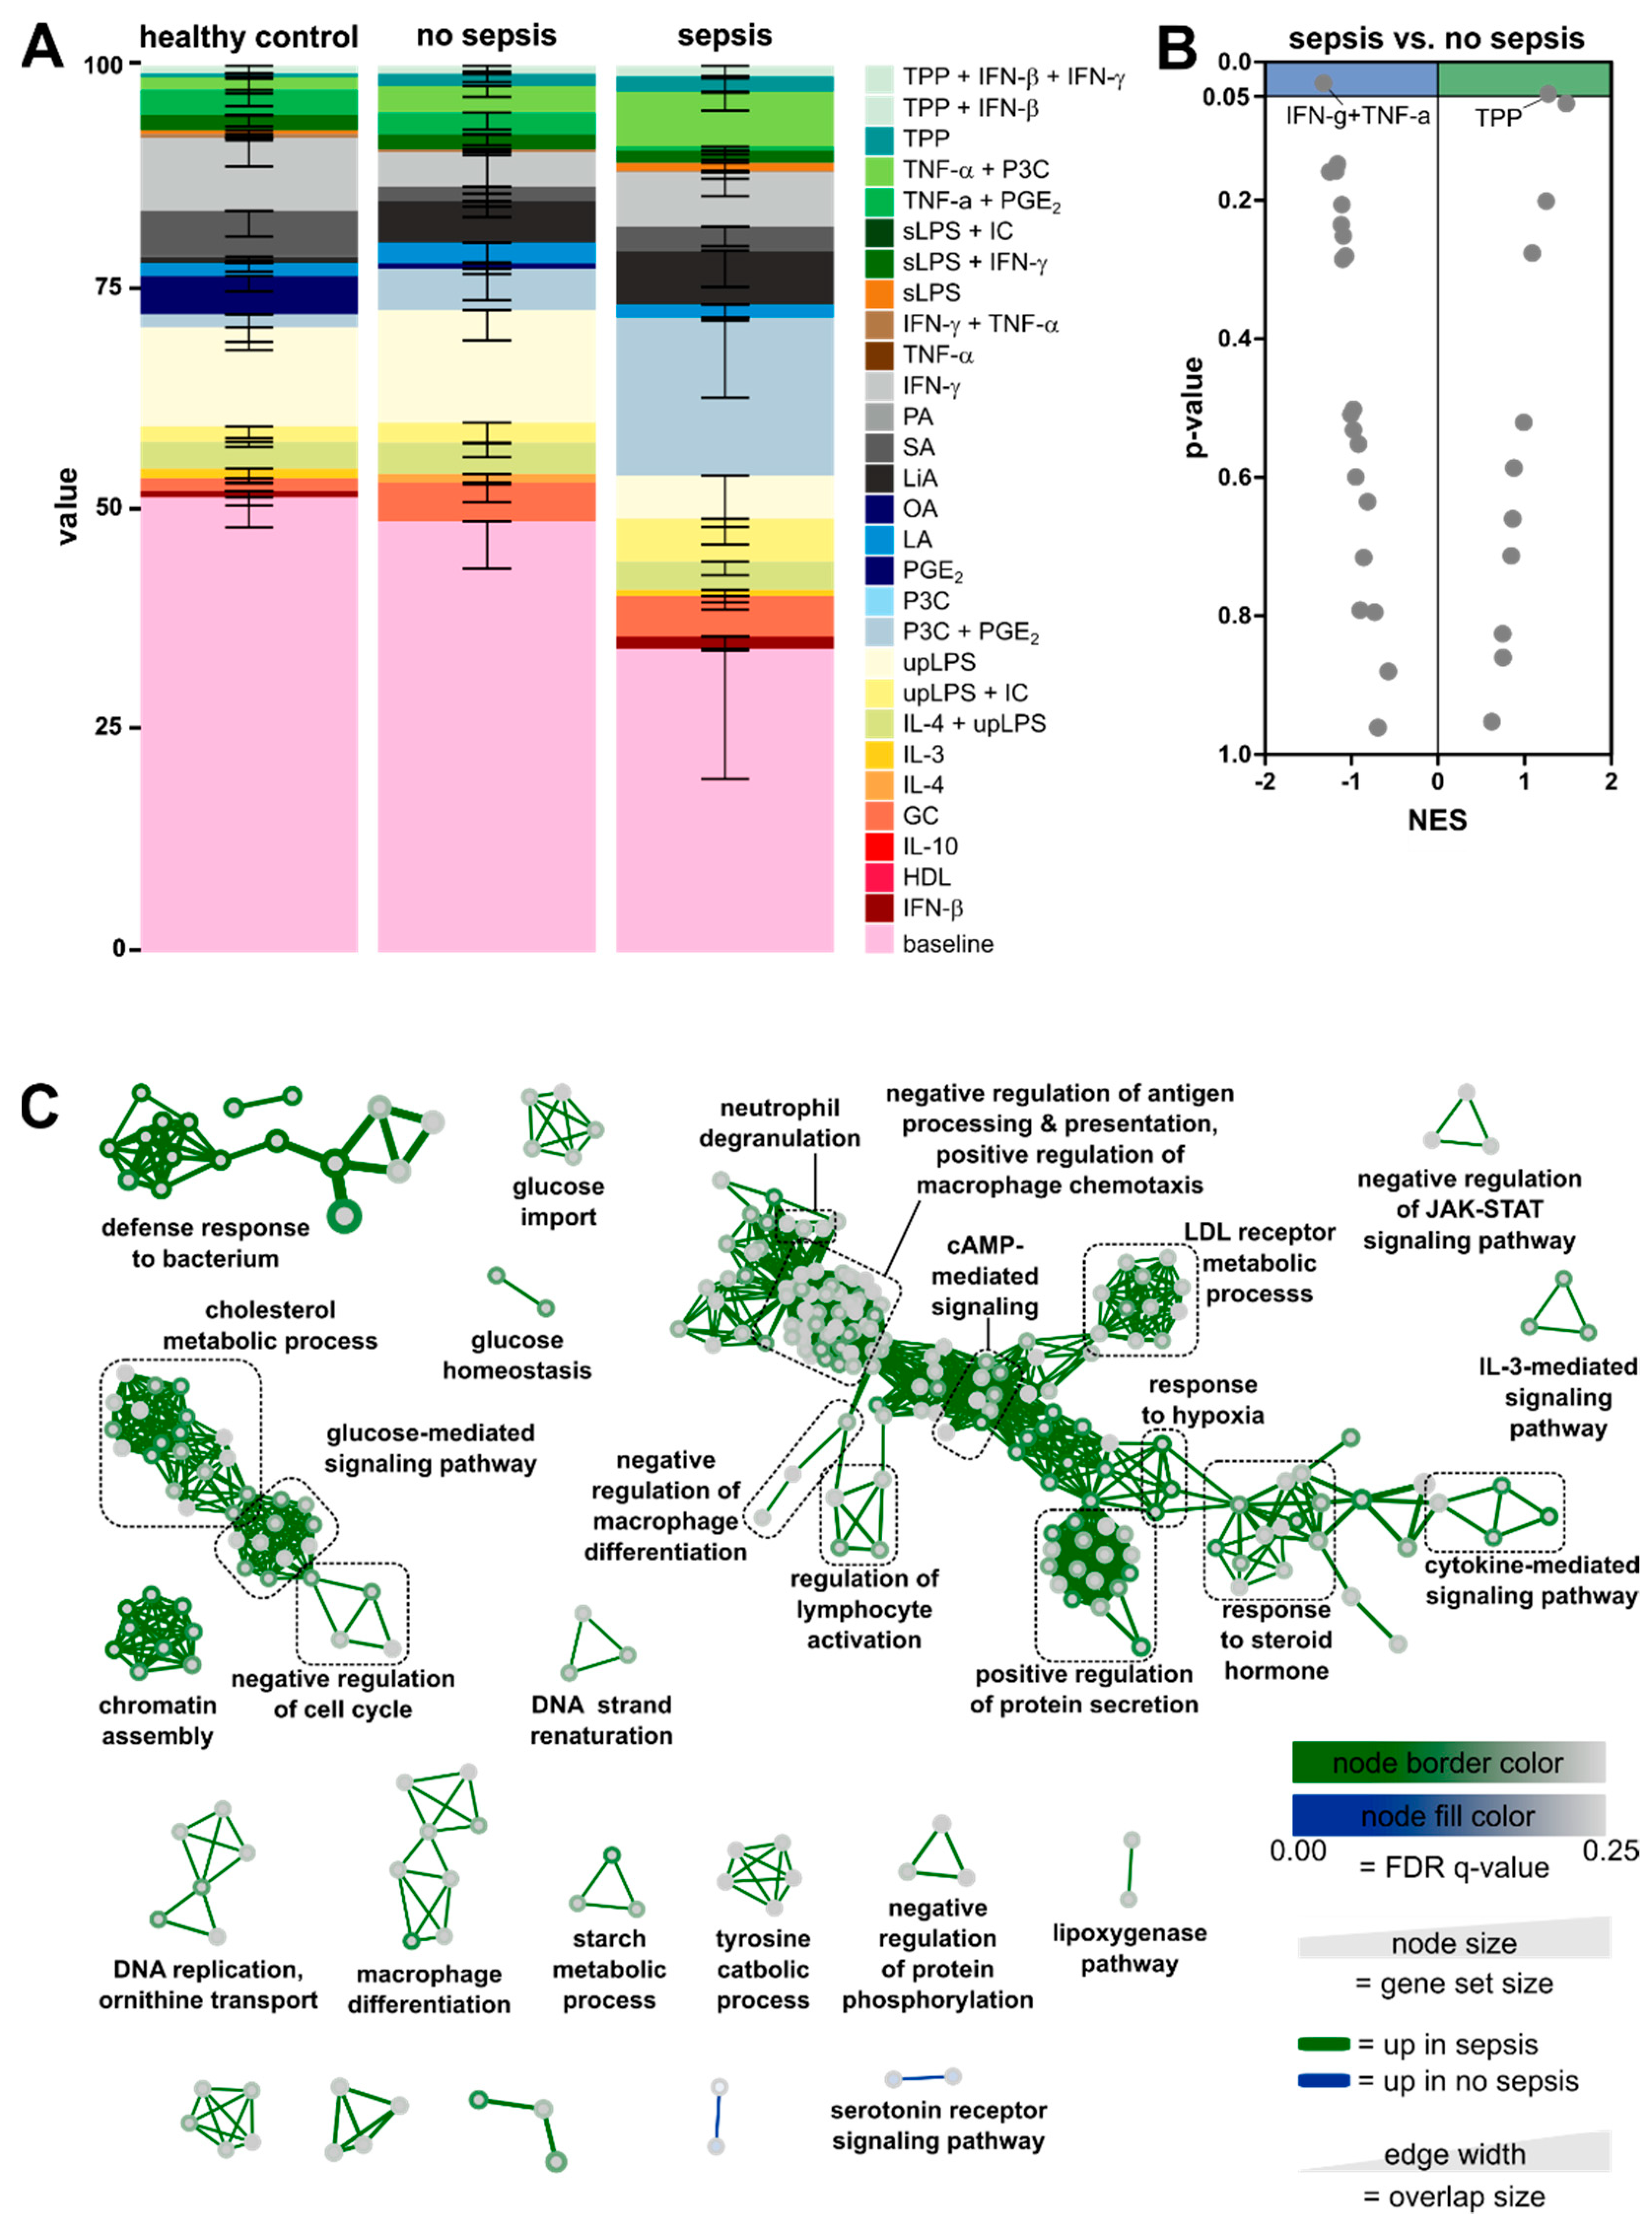
3.3. Enrichment of Activation Modules from Human Macrophages in Circulating Monocytes of ICU Patients
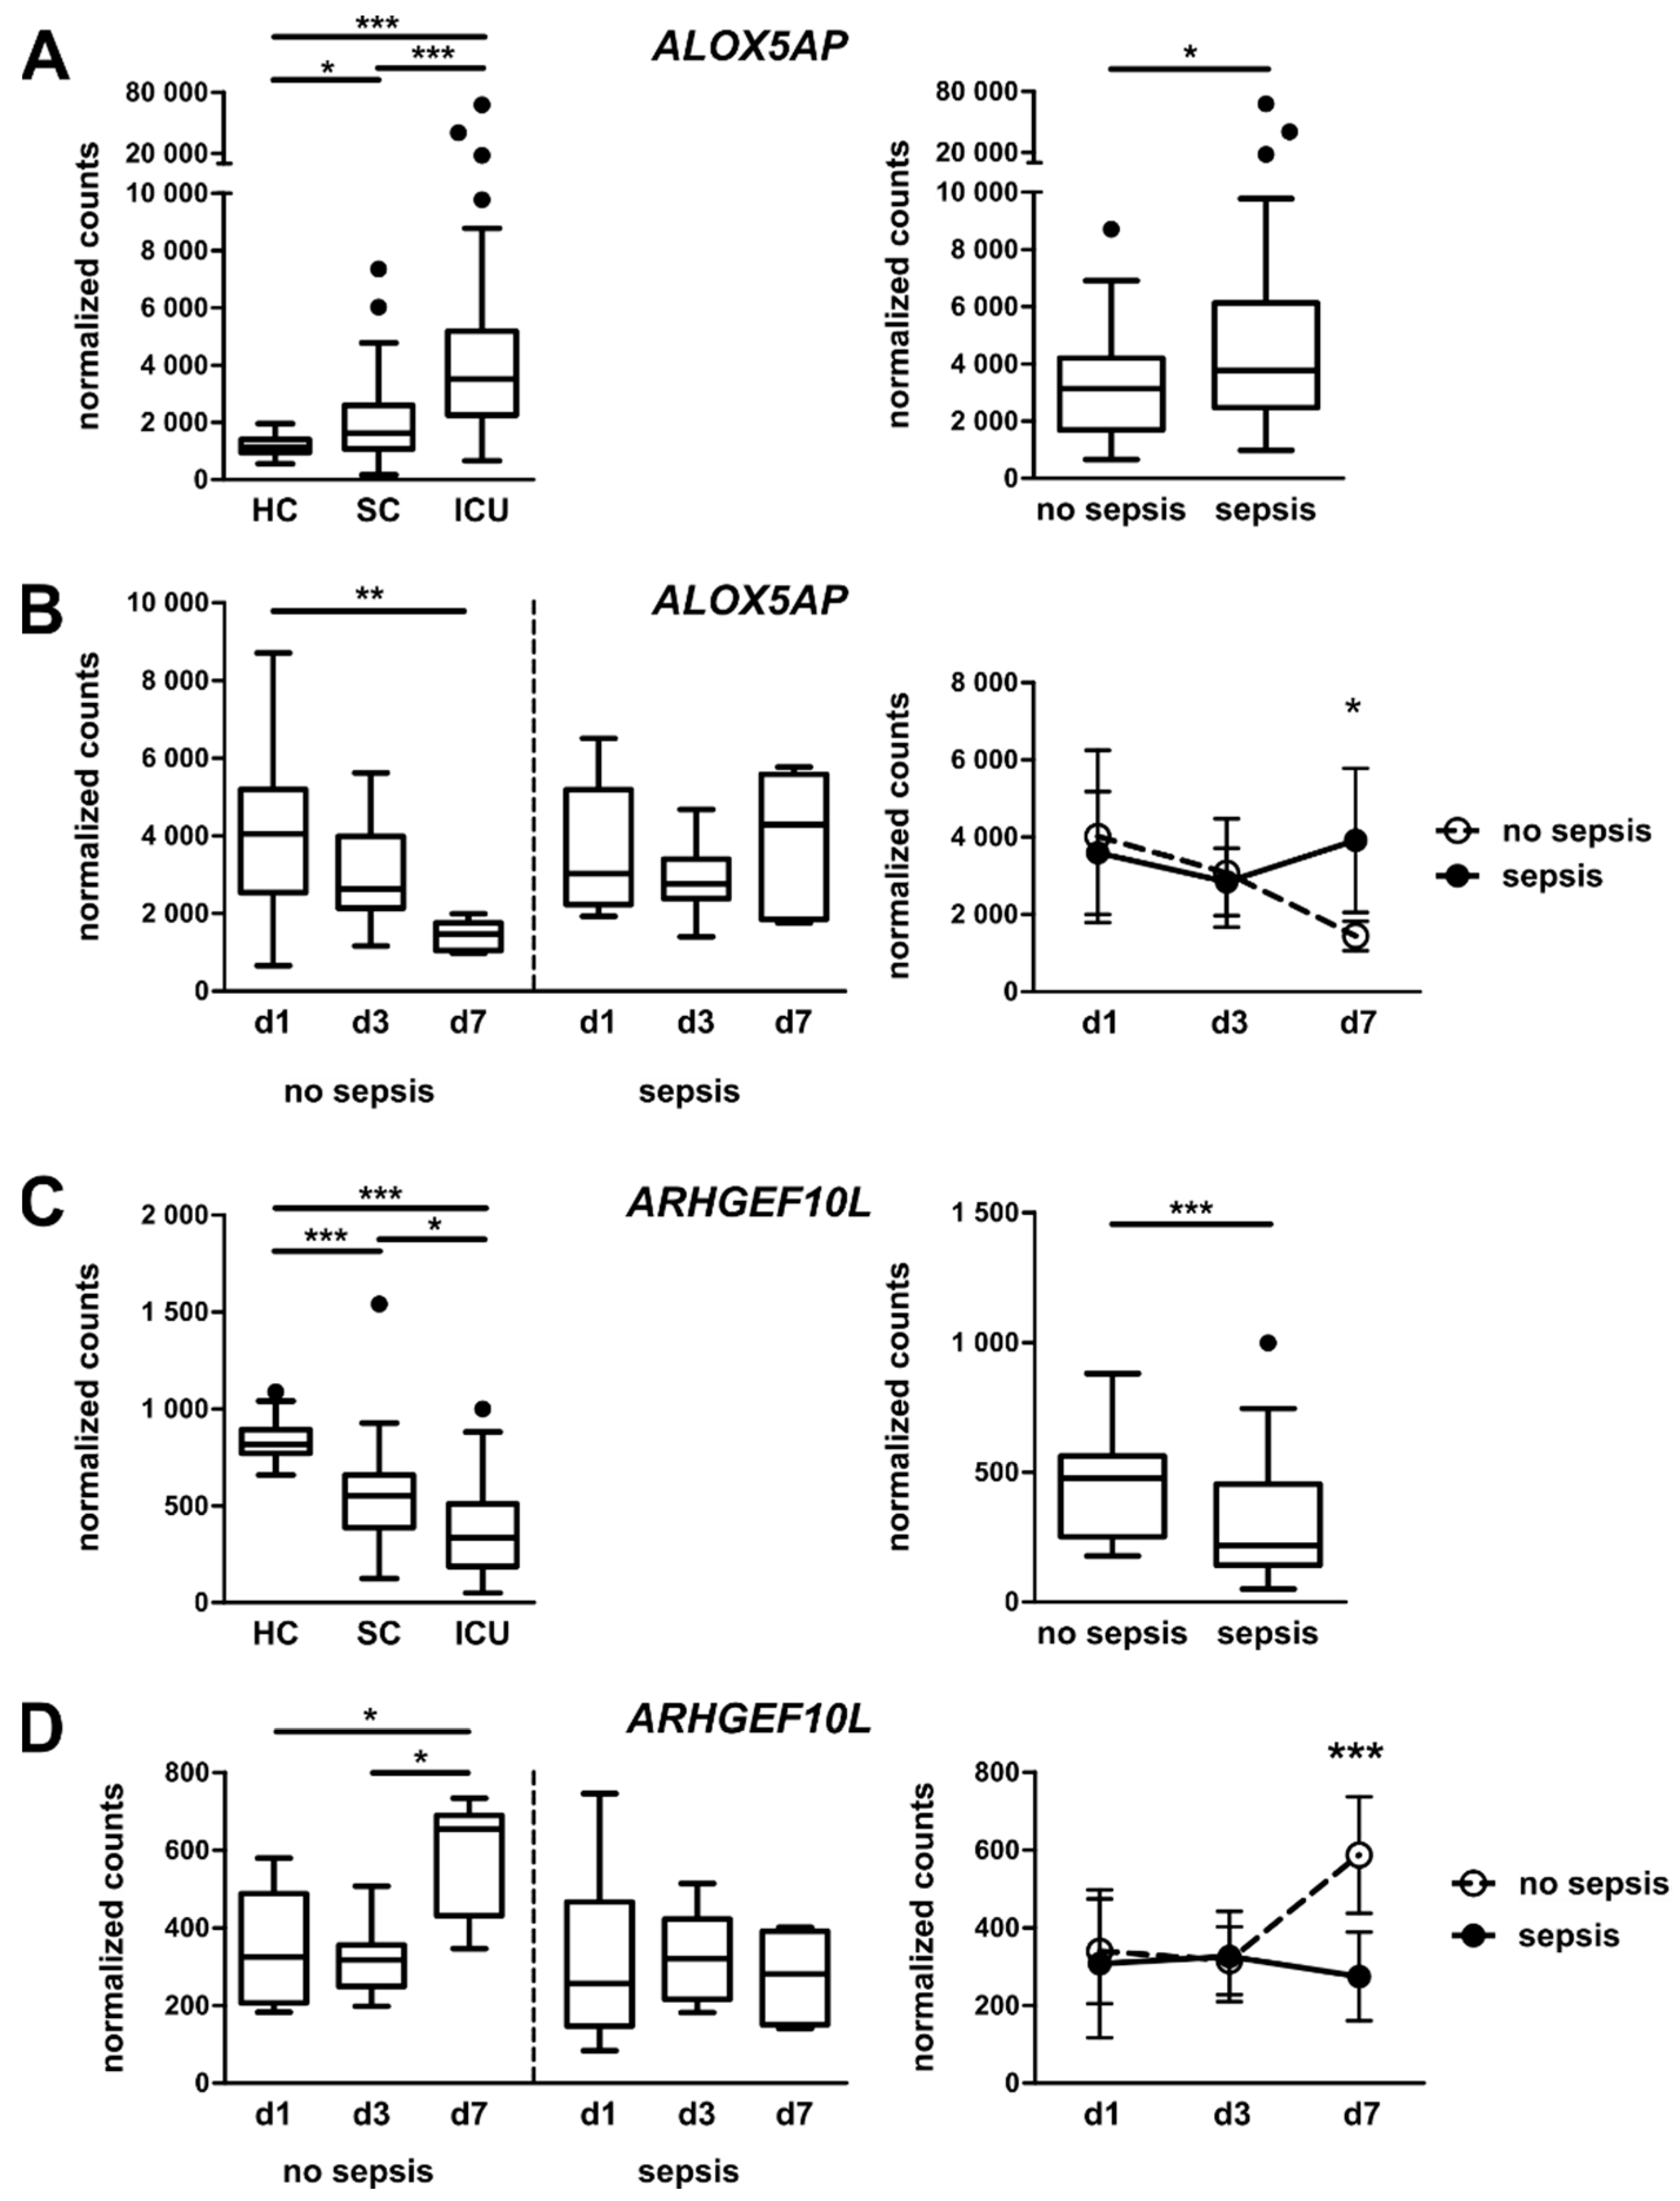
3.4. Targeted Gene Expression Analysis in Monocytes from Total Patient Cohorts
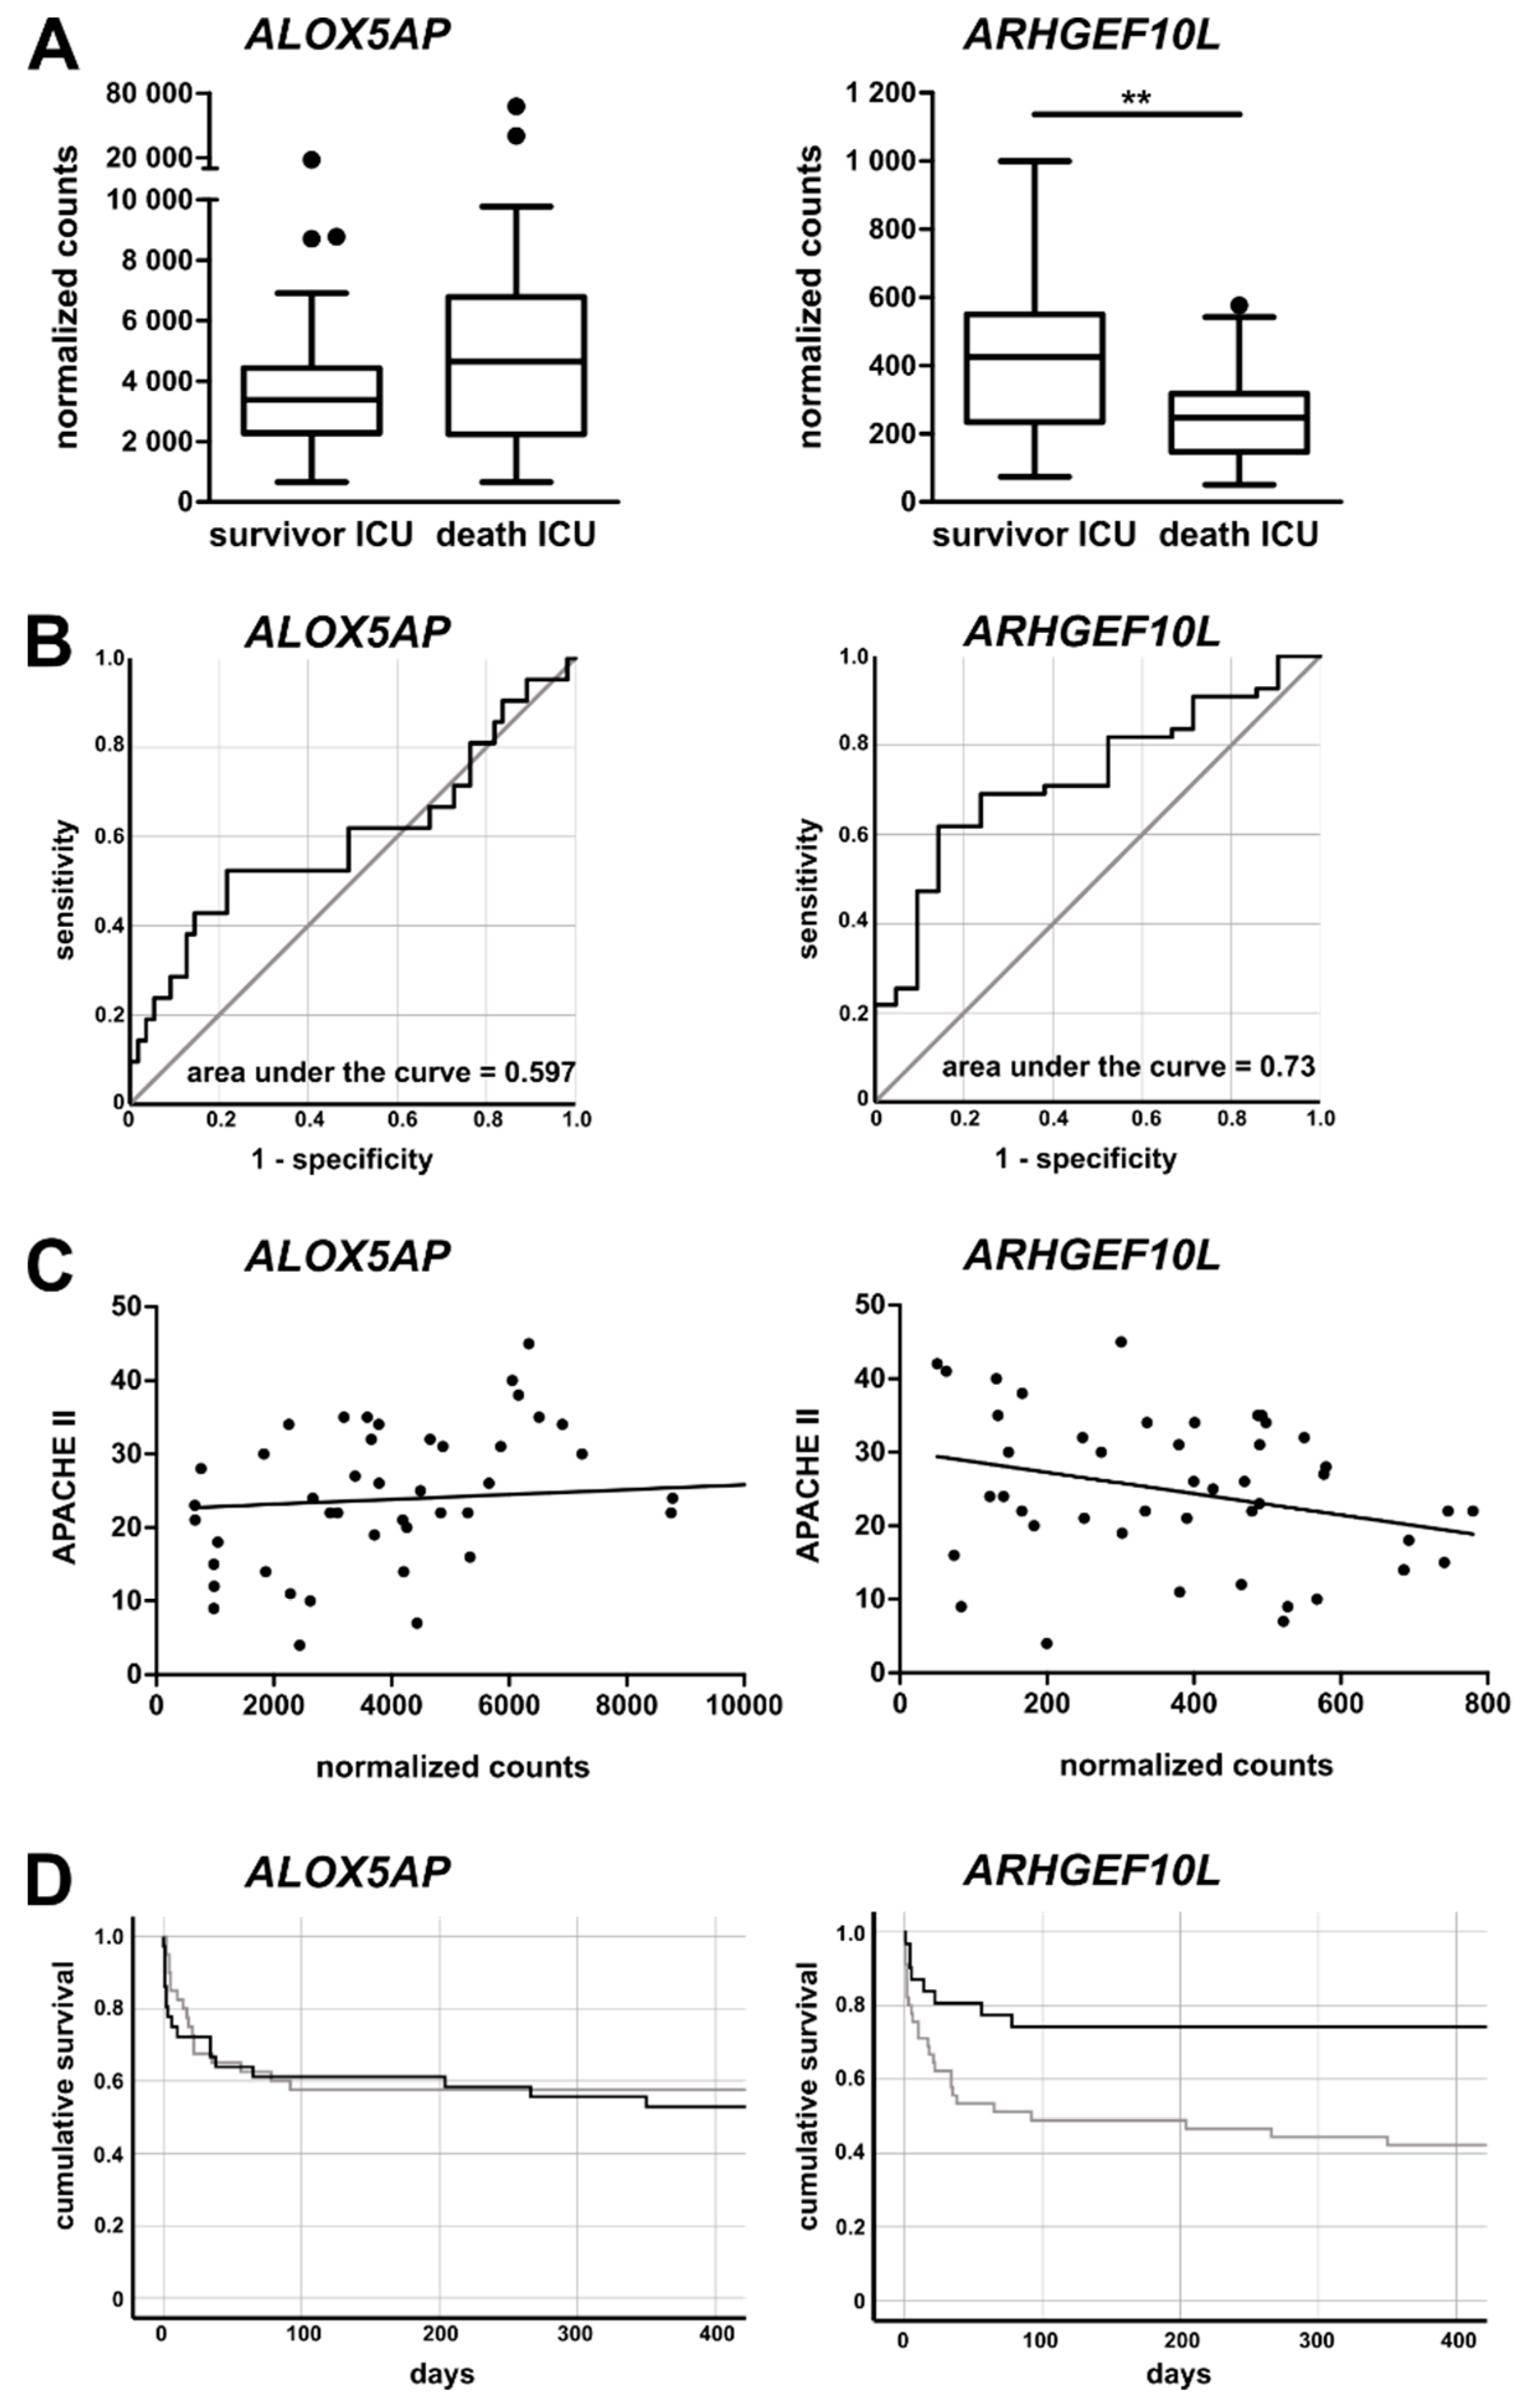
3.5. Monocytic ALOX5AP and ARHGEF10L Expression as Markers of Prognosis for ICU Patients
4. Discussion
5. Conclusions
Supplementary Materials
Author Contributions
Funding
Acknowledgments
Conflicts of Interest
References
- Shankar-Hari, M.; Datta, D.; Wilson, J.; Assi, V.; Stephen, J.; Weir, C.J.; Rennie, J.; Antonelli, J.; Bateman, A.; Felton, J.M.; et al. Early PREdiction of sepsis using leukocyte surface biomarkers: The ExPRES-sepsis cohort study. Intensive Care Med. 2018, 44, 1836–1848. [Google Scholar] [CrossRef] [PubMed]
- Pene, F.; Pickkers, P.; Hotchkiss, R.S. Is this critically ill patient immunocompromised? Intensive Care Med. 2016, 42, 1051–1054. [Google Scholar] [CrossRef] [PubMed]
- Conway Morris, A.; Datta, D.; Shankar-Hari, M.; Stephen, J.; Weir, C.J.; Rennie, J.; Antonelli, J.; Bateman, A.; Warner, N.; Judge, K.; et al. Cell-surface signatures of immune dysfunction risk-stratify critically ill patients: INFECT study. Intensive Care Med. 2018, 44, 627–635. [Google Scholar] [CrossRef] [PubMed]
- Cheron, A.; Floccard, B.; Allaouchiche, B.; Guignant, C.; Poitevin, F.; Malcus, C.; Crozon, J.; Faure, A.; Guillaume, C.; Marcotte, G.; et al. Lack of recovery in monocyte human leukocyte antigen-DR expression is independently associated with the development of sepsis after major trauma. Crit. Care 2010, 14, R208. [Google Scholar] [CrossRef]
- Fleischmann, C.; Scherag, A.; Adhikari, N.K.; Hartog, C.S.; Tsaganos, T.; Schlattmann, P.; Angus, D.C.; Reinhart, K.; International Forum of Acute Care Trialists. Assessment of Global Incidence and Mortality of Hospital-treated Sepsis. Current Estimates and Limitations. Am. J. Respir. Crit. Care Med. 2016, 193, 259–272. [Google Scholar] [CrossRef]
- Loosen, S.H.; Koch, A.; Tacke, F.; Roderburg, C.; Luedde, T. The Role of Adipokines as Circulating Biomarkers in Critical Illness and Sepsis. Int. J. Mol. Sci. 2019, 20, 4820. [Google Scholar] [CrossRef]
- Ruan, L.; Chen, G.Y.; Liu, Z.; Zhao, Y.; Xu, G.Y.; Li, S.F.; Li, C.N.; Chen, L.S.; Tao, Z. The combination of procalcitonin and C-reactive protein or presepsin alone improves the accuracy of diagnosis of neonatal sepsis: A meta-analysis and systematic review. Crit. Care 2018, 22, 316. [Google Scholar] [CrossRef]
- Chen, Z.; Luo, Z.; Zhao, X.; Chen, Q.; Hu, J.; Qin, H.; Qin, Y.; Liang, X.; Suo, Y. Association of vitamin D status of septic patients in intensive care units with altered procalcitonin levels and mortality. J. Clin. Endocrinol. Metab. 2015, 100, 516–523. [Google Scholar] [CrossRef][Green Version]
- Sanaie, S.; Mahmoodpoor, A.; Hamishehkar, H.; Fattahi, S.; Soleymani, S.; Faramarzi, E. The Relationship of Serum Vitamin D Level With the Outcome in Surgical Intensive Care Unit Patients. Iran. J. Pharmaceut. Res. IJPR 2019, 18, 1052–1059. [Google Scholar] [CrossRef]
- De Rosa, S.; Indolfi, C. Circulating microRNAs as Biomarkers in Cardiovascular Diseases. Exp. Suppl. 2015, 106, 139–149. [Google Scholar] [CrossRef]
- Roderburg, C.; Benz, F.; Koch, A.; Loosen, S.H.; Spehlmann, M.; Luedde, M.; Wree, A.; Vucur, M.; Trautwein, C.; Tacke, F.; et al. A Combined Score of Circulating miRNAs Allows Outcome Prediction in Critically Ill Patients. J. Clin. Med. 2019, 8, 1644. [Google Scholar] [CrossRef]
- Wang, X.; Wang, X.; Liu, X.; Wang, X.; Xu, J.; Hou, S.; Zhang, X.; Ding, Y. miR-15a/16 are upregulated in the serum of neonatal sepsis patients and inhibit the LPS-induced inflammatory pathway. Int. J. Clin. Exp. Med. 2015, 8, 5683–5690. [Google Scholar] [PubMed]
- Wang, H.; Zhang, P.; Chen, W.; Feng, D.; Jia, Y.; Xie, L.X. Evidence for serum miR-15a and miR-16 levels as biomarkers that distinguish sepsis from systemic inflammatory response syndrome in human subjects. Clin. Chem. Lab. Med. 2012, 50, 1423–1428. [Google Scholar] [CrossRef] [PubMed]
- Tacke, F.; Roderburg, C.; Benz, F.; Cardenas, D.V.; Luedde, M.; Hippe, H.J.; Frey, N.; Vucur, M.; Gautheron, J.; Koch, A.; et al. Levels of circulating miR-133a are elevated in sepsis and predict mortality in critically ill patients. Crit. Care Med. 2014, 42, 1096–1104. [Google Scholar] [CrossRef] [PubMed]
- Arts, R.J.; Gresnigt, M.S.; Joosten, L.A.; Netea, M.G. Cellular metabolism of myeloid cells in sepsis. J. Leukoc. Biol. 2017, 101, 151–164. [Google Scholar] [CrossRef] [PubMed]
- Hohlstein, P.; Gussen, H.; Bartneck, M.; Warzecha, K.T.; Roderburg, C.; Buendgens, L.; Trautwein, C.; Koch, A.; Tacke, F. Prognostic Relevance of Altered Lymphocyte Subpopulations in Critical Illness and Sepsis. J. Clin. Med. 2019, 8, 353. [Google Scholar] [CrossRef]
- Flores-Mejia, L.A.; Cabrera-Rivera, G.L.; Ferat-Osorio, E.; Mancilla-Herrera, I.; Torres-Rosas, R.; Bosco-Garate, I.B.; Lopez-Macias, C.; Isibasi, A.; Cerbulo-Vazquez, A.; Arriaga-Pizano, L.A. Function is Dissociated From Activation-Related Immunophenotype on Phagocytes From Patients With SIRS/Sepsis Syndrome. Shock 2019, 52, e68–e75. [Google Scholar] [CrossRef]
- Daix, T.; Guerin, E.; Tavernier, E.; Mercier, E.; Gissot, V.; Herault, O.; Mira, J.P.; Dumas, F.; Chapuis, N.; Guitton, C.; et al. Multicentric Standardized Flow Cytometry Routine Assessment of Patients With Sepsis to Predict Clinical Worsening. Chest 2018, 154, 617–627. [Google Scholar] [CrossRef] [PubMed]
- Winkler, M.S.; Rissiek, A.; Priefler, M.; Schwedhelm, E.; Robbe, L.; Bauer, A.; Zahrte, C.; Zoellner, C.; Kluge, S.; Nierhaus, A. Human leucocyte antigen (HLA-DR) gene expression is reduced in sepsis and correlates with impaired TNFalpha response: A diagnostic tool for immunosuppression? PLoS ONE 2017, 12, e0182427. [Google Scholar] [CrossRef] [PubMed]
- Ziegler-Heitbrock, L. Blood Monocytes and Their Subsets: Established Features and Open Questions. Front. Immunol. 2015, 6, 423. [Google Scholar] [CrossRef]
- Villani, A.C.; Satija, R.; Reynolds, G.; Sarkizova, S.; Shekhar, K.; Fletcher, J.; Griesbeck, M.; Butler, A.; Zheng, S.; Lazo, S.; et al. Single-cell RNA-seq reveals new types of human blood dendritic cells, monocytes, and progenitors. Science 2017, 356. [Google Scholar] [CrossRef] [PubMed]
- Mukherjee, R.; Kanti Barman, P.; Kumar Thatoi, P.; Tripathy, R.; Kumar Das, B.; Ravindran, B. Non-Classical monocytes display inflammatory features: Validation in Sepsis and Systemic Lupus Erythematous. Sci. Rep. 2015, 5, 13886. [Google Scholar] [CrossRef] [PubMed]
- Lukaszewicz, A.C.; Grienay, M.; Resche-Rigon, M.; Pirracchio, R.; Faivre, V.; Boval, B.; Payen, D. Monocytic HLA-DR expression in intensive care patients: Interest for prognosis and secondary infection prediction. Crit. Care Med. 2009, 37, 2746–2752. [Google Scholar] [CrossRef] [PubMed]
- Le Tulzo, Y.; Pangault, C.; Amiot, L.; Guilloux, V.; Tribut, O.; Arvieux, C.; Camus, C.; Fauchet, R.; Thomas, R.; Drenou, B. Monocyte human leukocyte antigen-DR transcriptional downregulation by cortisol during septic shock. Am. J. Respir. Crit. Care Med. 2004, 169, 1144–1151. [Google Scholar] [CrossRef]
- Pachot, A.; Cazalis, M.A.; Venet, F.; Turrel, F.; Faudot, C.; Voirin, N.; Diasparra, J.; Bourgoin, N.; Poitevin, F.; Mougin, B.; et al. Decreased expression of the fractalkine receptor CX3CR1 on circulating monocytes as new feature of sepsis-induced immunosuppression. J. Immunol. 2008, 180, 6421–6429. [Google Scholar] [CrossRef]
- Pachot, A.; Lepape, A.; Vey, S.; Bienvenu, J.; Mougin, B.; Monneret, G. Systemic transcriptional analysis in survivor and non-survivor septic shock patients: A preliminary study. Immunol. Lett. 2006, 106, 63–71. [Google Scholar] [CrossRef]
- Buendgens, L.; Yagmur, E.; Bruensing, J.; Herbers, U.; Baeck, C.; Trautwein, C.; Koch, A.; Tacke, F. C-terminal proendothelin-1 (CT-proET-1) is associated with organ failure and predicts mortality in critically ill patients. J. Intensive Care 2017, 5, 25. [Google Scholar] [CrossRef]
- Koch, A.; Voigt, S.; Kruschinski, C.; Sanson, E.; Duckers, H.; Horn, A.; Yagmur, E.; Zimmermann, H.; Trautwein, C.; Tacke, F. Circulating soluble urokinase plasminogen activator receptor is stably elevated during the first week of treatment in the intensive care unit and predicts mortality in critically ill patients. Crit. Care 2011, 15, R63. [Google Scholar] [CrossRef]
- Koch, A.; Yagmur, E.; Linka, J.; Schumacher, F.; Bruensing, J.; Buendgens, L.; Herbers, U.; Koek, G.H.; Weiskirchen, R.; Trautwein, C.; et al. High Circulating Caspase-Cleaved Keratin 18 Fragments (M30) Indicate Short-Term Mortality in Critically Ill Patients. Dis. Markers 2018, 2018, 8583121. [Google Scholar] [CrossRef]
- Gussen, H.; Hohlstein, P.; Bartneck, M.; Warzecha, K.T.; Buendgens, L.; Luedde, T.; Trautwein, C.; Koch, A.; Tacke, F. Neutrophils are a main source of circulating suPAR predicting outcome in critical illness. J. Intensive Care 2019, 7, 26. [Google Scholar] [CrossRef]
- Rhodes, A.; Evans, L.E.; Alhazzani, W.; Levy, M.M.; Antonelli, M.; Ferrer, R.; Kumar, A.; Sevransky, J.E.; Sprung, C.L.; Nunnally, M.E.; et al. Surviving Sepsis Campaign: International Guidelines for Management of Sepsis and Septic Shock: 2016. Crit. Care Med. 2017, 45, 486–552. [Google Scholar] [CrossRef] [PubMed]
- Theocharidis, A.; van Dongen, S.; Enright, A.J.; Freeman, T.C. Network visualization and analysis of gene expression data using BioLayout Express(3D). Nat. Protoc. 2009, 4, 1535–1550. [Google Scholar] [CrossRef] [PubMed]
- Shannon, P.; Markiel, A.; Ozier, O.; Baliga, N.S.; Wang, J.T.; Ramage, D.; Amin, N.; Schwikowski, B.; Ideker, T. Cytoscape: A software environment for integrated models of biomolecular interaction networks. Genome Res. 2003, 13, 2498–2504. [Google Scholar] [CrossRef] [PubMed]
- Maere, S.; Heymans, K.; Kuiper, M. BiNGO: A Cytoscape plugin to assess overrepresentation of gene ontology categories in biological networks. Bioinformatics 2005, 21, 3448–3449. [Google Scholar] [CrossRef]
- Merico, D.; Isserlin, R.; Stueker, O.; Emili, A.; Bader, G.D. Enrichment map: A network-based method for gene-set enrichment visualization and interpretation. PLoS ONE 2010, 5, e13984. [Google Scholar] [CrossRef]
- Love, M.I.; Huber, W.; Anders, S. Moderated estimation of fold change and dispersion for RNA-seq data with DESeq2. Genome Biol. 2014, 15, 550. [Google Scholar] [CrossRef]
- Koch, A.; Sanson, E.; Helm, A.; Voigt, S.; Trautwein, C.; Tacke, F. Regulation and prognostic relevance of serum ghrelin concentrations in critical illness and sepsis. Crit. Care 2010, 14, R94. [Google Scholar] [CrossRef]
- Xue, J.; Schmidt, S.V.; Sander, J.; Draffehn, A.; Krebs, W.; Quester, I.; De Nardo, D.; Gohel, T.D.; Emde, M.; Schmidleithner, L.; et al. Transcriptome-based network analysis reveals a spectrum model of human macrophage activation. Immunity 2014, 40, 274–288. [Google Scholar] [CrossRef]
- Mossanen, J.C.; Krenkel, O.; Ergen, C.; Govaere, O.; Liepelt, A.; Puengel, T.; Heymann, F.; Kalthoff, S.; Lefebvre, E.; Eulberg, D.; et al. Chemokine (C-C motif) receptor 2-positive monocytes aggravate the early phase of acetaminophen-induced acute liver injury. Hepatology 2016, 64, 1667–1682. [Google Scholar] [CrossRef]
- Murray, P.J.; Allen, J.E.; Biswas, S.K.; Fisher, E.A.; Gilroy, D.W.; Goerdt, S.; Gordon, S.; Hamilton, J.A.; Ivashkiv, L.B.; Lawrence, T.; et al. Macrophage activation and polarization: Nomenclature and experimental guidelines. Immunity 2014, 41, 14–20. [Google Scholar] [CrossRef]
- Winkler, S.; Mohl, M.; Wieland, T.; Lutz, S. GrinchGEF-A novel Rho-specific guanine nucleotide exchange factor. Biochem. Biophys. Res. Commun. 2005, 335, 1280–1286. [Google Scholar] [CrossRef] [PubMed]
- Thaler, B.; Hohensinner, P.J.; Krychtiuk, K.A.; Matzneller, P.; Koller, L.; Brekalo, M.; Maurer, G.; Huber, K.; Zeitlinger, M.; Jilma, B.; et al. Differential in vivo activation of monocyte subsets during low-grade inflammation through experimental endotoxemia in humans. Sci. Rep. 2016, 6, 30162. [Google Scholar] [CrossRef] [PubMed]
- Lorente-Sorolla, C.; Garcia-Gomez, A.; Catala-Moll, F.; Toledano, V.; Ciudad, L.; Avendano-Ortiz, J.; Maroun-Eid, C.; Martin-Quiros, A.; Martinez-Gallo, M.; Ruiz-Sanmartin, A.; et al. Inflammatory cytokines and organ dysfunction associate with the aberrant DNA methylome of monocytes in sepsis. Genome Med. 2019, 11, 66. [Google Scholar] [CrossRef] [PubMed]
- Rodriguez, S.; Chora, A.; Goumnerov, B.; Mumaw, C.; Goebel, W.S.; Fernandez, L.; Baydoun, H.; HogenEsch, H.; Dombkowski, D.M.; Karlewicz, C.A.; et al. Dysfunctional expansion of hematopoietic stem cells and block of myeloid differentiation in lethal sepsis. Blood 2009, 114, 4064–4076. [Google Scholar] [CrossRef]
- Mittal, M.; Tiruppathi, C.; Nepal, S.; Zhao, Y.Y.; Grzych, D.; Soni, D.; Prockop, D.J.; Malik, A.B. TNFalpha-stimulated gene-6 (TSG6) activates macrophage phenotype transition to prevent inflammatory lung injury. Proc. Natl. Acad. Sci. USA 2016, 113, E8151–E8158. [Google Scholar] [CrossRef]
- Abramovitz, M.; Wong, E.; Cox, M.E.; Richardson, C.D.; Li, C.; Vickers, P.J. 5-lipoxygenase-activating protein stimulates the utilization of arachidonic acid by 5-lipoxygenase. Eur. J. Biochem. 1993, 215, 105–111. [Google Scholar] [CrossRef]
- Reddy, K.V.; Serio, K.J.; Hodulik, C.R.; Bigby, T.D. 5-lipoxygenase-activating protein gene expression. Key role of CCAAT/enhancer-binding proteins (C/EBP) in constitutive and tumor necrosis factor (TNF) alpha-induced expression in THP-1 cells. J. Biol. Chem. 2003, 278, 13810–13818. [Google Scholar] [CrossRef]
- Serio, K.J.; Reddy, K.V.; Bigby, T.D. Lipopolysaccharide induces 5-lipoxygenase-activating protein gene expression in THP-1 cells via a NF-kappaB and C/EBP-mediated mechanism. Am. J. Physiol. Cell Physiol. 2005, 288, C1125–C1133. [Google Scholar] [CrossRef]
- Tang, J.; Liu, C.; Xu, B.; Wang, D.; Ma, Z.; Chang, X. ARHGEF10L contributes to liver tumorigenesis through RhoA-ROCK1 signaling and the epithelial-mesenchymal transition. Exp. Cell Res. 2019, 374, 46–68. [Google Scholar] [CrossRef]


| Parameter | HC | SC | ICU | ICU: No Sepsis | ICU: Sepsis |
|---|---|---|---|---|---|
| Number, n | 54 | 42 | 76 | 40 | 36 |
| Male/female, n | 30/24 | 31/11 | 45/31 | 24/16 | 21/15 |
| Age (years) | 48.5 (24–77) | 65.5 (21–88) | 68 (18–97) | 60.5 (23–92) | 71 (18–97) |
| Days in hospital | - | 6.5 (3–25) | 14 (1– 97) | 13 (2–89) | 20 (1–97) |
| Days on ICU | - | - | 4 (1–79) | 4 (1–37) | 4 (1–79) |
| Death on ICU, n (%) | - | - | 21 (27.6%) | 5 (12.5%) | 16 (44.4%) |
| Death in hospital, n (%) | - | 2 (4.8%) | 28 (36.8%) | 10 (25%) | 18 (50%) |
| APACHE II score | - | - | 22.5 (2–45) | 20 (2–43) | 25.5 (9–45) |
| Leukocytes (per nL) | 5.8 (3.8–10.0) | 9.4 (2.1–23.0) | 13.5 (0.5–42.9) | 10.7 (2.7–31.4) | 15.5 (0.5–42.9) |
| Monocytes (per nL) | 0.50 (0.25–0.95) | 0.71 (0.06–1.86) | 0.62 (0–3.45) | 0.66 (0.01–3.45) | 0.52 (0–2.16) |
| IFN-γ, (pg/mL) | 4.21 (0–500) | 8.07 (0–372) | 10.6 (0–527) | 9.23 (0–101) | 20.5 (0–527) |
| IL-6 (pg/mL) | 0.36 (0.2–200) | 9.25 (0.32–526) | 137 (2.4–500,000) | 56.5 (8.88–1490) | 204 (2.4–500,000) |
| IL-8 (pg/mL) | 4.53 (1.71–33.8) | 7.47 (1.86–81.7) | 23.3 (0–1000) | 14.8 (0–282) | 29.3 (3.18–1000) |
| TNF-α (pg/mL) | 0.57 (0–63.3) | 0.63 (0–87.2) | 1.51 (0–126) | 1.42 (0–61.9) | 1.56 (0–126) |
| Cholesterol (mg/dL) | - | - | 123 (41–374) | 123 (41–374) | 128 (60–223) |
| Triglyceride (mg/dL) | - | - | 139 (40–434) | 148 (40–434) | 128 (63–302) |
| Site of infection, n (%) | |||||
| Pulmonary | - | 14 (33.3%) | 17 (22.4%) | - | 17 (47.2%) |
| Urinary | - | 17 (40.5%) | 5 (6.6%) | - | 5 (13.9%) |
| Abdominal | - | 6 (14.3%) | 12 (15.8%) | - | 12 (33.3%) |
| Bloodstream | - | 2 (4.8%) | 1 (1.3%) | - | 1 (2.8%) |
| Other | - | 3 (7.1%) | 1 (1.3%) | - | 1 (2.8%) |
| Culture positive, n (%) | - | 11 (26.2%) | 21 (27.6%) | - | 21 (58.3%) |
| Gram neg., n | - | 3 | 7 | - | 7 |
| Gram pos., n | - | 7 | 10 | - | 10 |
| Gram pos. and neg., n | - | 0 | 3 | - | 3 |
| Fungal, n | - | 1 | 1 | - | 1 |
© 2020 by the authors. Licensee MDPI, Basel, Switzerland. This article is an open access article distributed under the terms and conditions of the Creative Commons Attribution (CC BY) license (http://creativecommons.org/licenses/by/4.0/).
Share and Cite
Liepelt, A.; Hohlstein, P.; Gussen, H.; Xue, J.; Aschenbrenner, A.C.; Ulas, T.; Buendgens, L.; Warzecha, K.T.; Bartneck, M.; Luedde, T.; et al. Differential Gene Expression in Circulating CD14+ Monocytes Indicates the Prognosis of Critically Ill Patients with Sepsis. J. Clin. Med. 2020, 9, 127. https://doi.org/10.3390/jcm9010127
Liepelt A, Hohlstein P, Gussen H, Xue J, Aschenbrenner AC, Ulas T, Buendgens L, Warzecha KT, Bartneck M, Luedde T, et al. Differential Gene Expression in Circulating CD14+ Monocytes Indicates the Prognosis of Critically Ill Patients with Sepsis. Journal of Clinical Medicine. 2020; 9(1):127. https://doi.org/10.3390/jcm9010127
Chicago/Turabian StyleLiepelt, Anke, Philipp Hohlstein, Hendrik Gussen, Jia Xue, Anna C. Aschenbrenner, Thomas Ulas, Lukas Buendgens, Klaudia T. Warzecha, Matthias Bartneck, Tom Luedde, and et al. 2020. "Differential Gene Expression in Circulating CD14+ Monocytes Indicates the Prognosis of Critically Ill Patients with Sepsis" Journal of Clinical Medicine 9, no. 1: 127. https://doi.org/10.3390/jcm9010127
APA StyleLiepelt, A., Hohlstein, P., Gussen, H., Xue, J., Aschenbrenner, A. C., Ulas, T., Buendgens, L., Warzecha, K. T., Bartneck, M., Luedde, T., Trautwein, C., Schultze, J. L., Koch, A., & Tacke, F. (2020). Differential Gene Expression in Circulating CD14+ Monocytes Indicates the Prognosis of Critically Ill Patients with Sepsis. Journal of Clinical Medicine, 9(1), 127. https://doi.org/10.3390/jcm9010127