
Predictive Models for Injury Risk Across Body Regions and Sport Types in Physically Active Students: Cross-Sectional Design


Abstract
1. Introduction
2. Materials and Methods
2.1. Ethics
2.2. Study Design
2.3. Sample Size
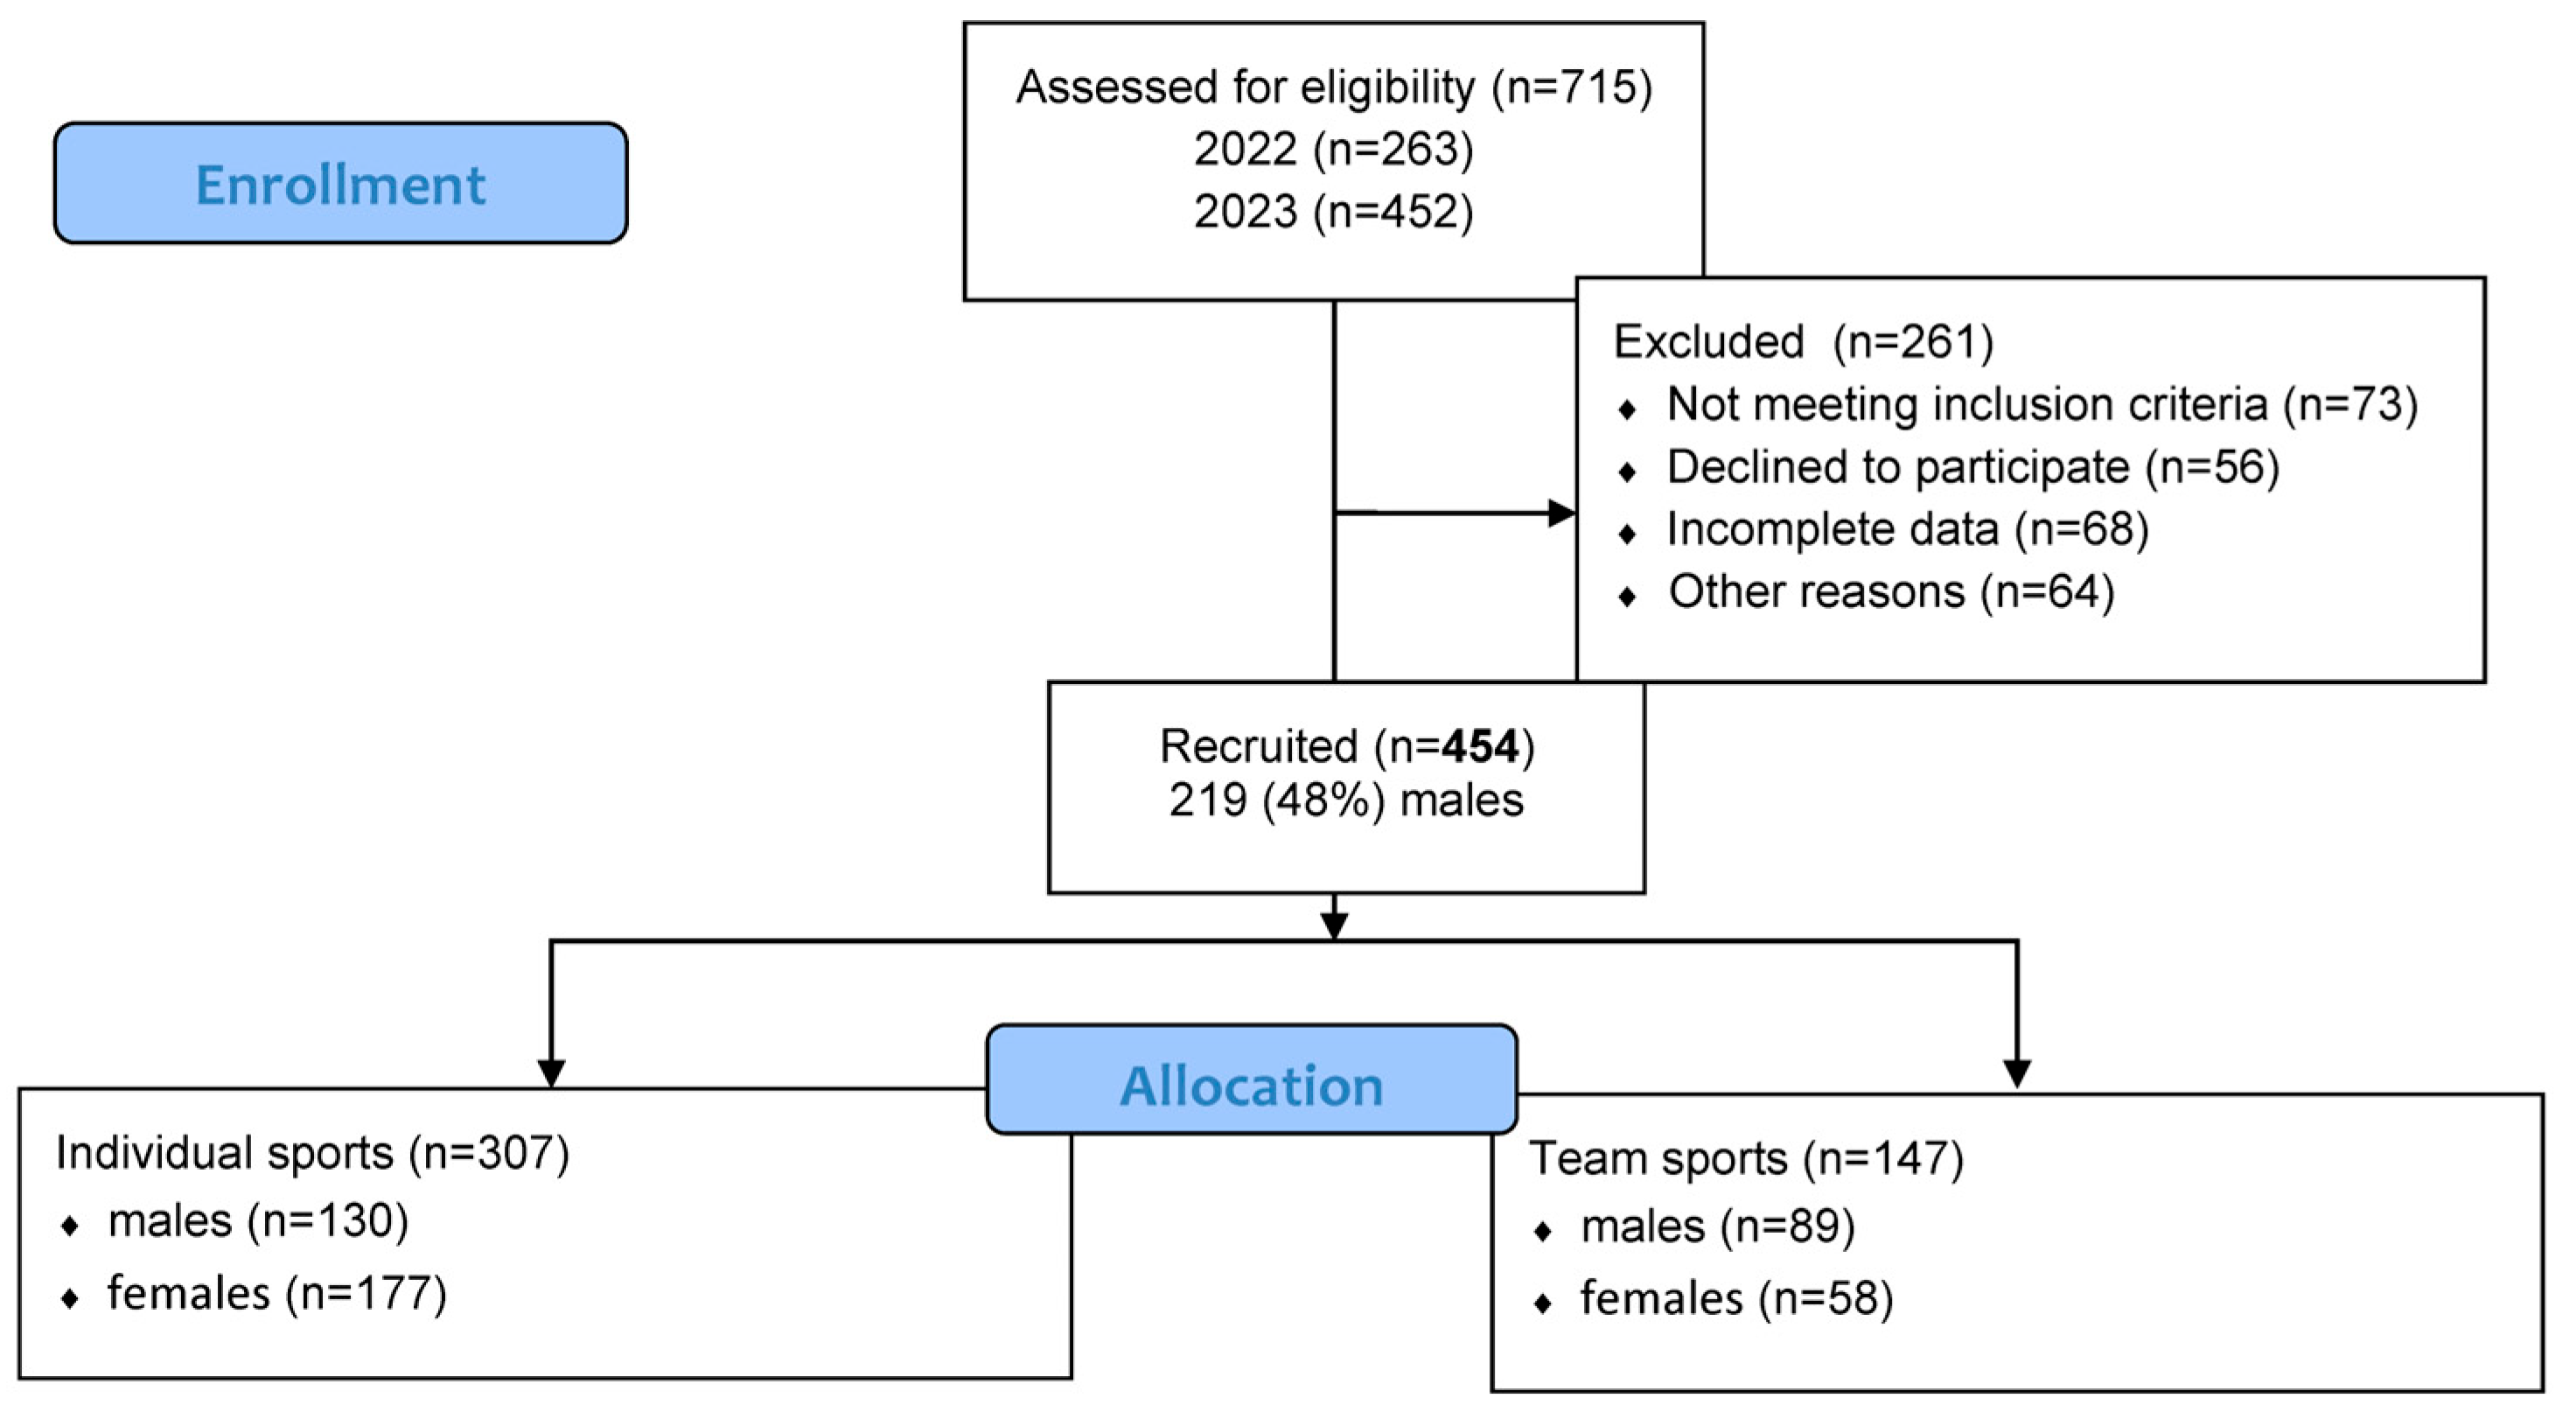
2.4. Participants
2.5. Anthropometric and Body Composition Measurements, Asymmetry Calculations
2.6. Recording of Musculoskeletal Injuries
2.7. Demographic and Training Load Characteristics
2.8. Statistics
3. Results
3.1. Baseline Characteristics and Injury Frequencies
3.2. Predictive Modeling
3.3. Evaluating the Relative Impact of Predictors
4. Discussion
5. Conclusions
Author Contributions
Funding
Institutional Review Board Statement
Informed Consent Statement
Data Availability Statement
Acknowledgments
Conflicts of Interest
References
- Bahr, R.; Krosshaug, T. Understanding injury mechanisms: A key component of preventing injuries in sport. Br. J. Sports Med. 2005, 39, 324–329. [Google Scholar] [CrossRef] [PubMed] [PubMed Central]
- Clarsen, B.; Myklebust, G.; Bahr, R. Development and validation of a new method for the registration of overuse injuries in sports injury epidemiology: The Oslo Sports Trauma Research Centre (OSTRC) Overuse Injury Questionnaire. Br. J. Sports Med. 2013, 47, 495–502. [Google Scholar] [CrossRef] [PubMed]
- Emery, C.A.; Roy, T.O.; Whittaker, J.L.; Nettel-Aguirre, A.; van Mechelen, W. Neuromuscular training injury prevention strategies in youth sport: A systematic review and meta-analysis. Br. J. Sports Med. 2015, 49, 865–870. [Google Scholar] [CrossRef] [PubMed]
- Gabbett, T.J. The training—Injury prevention paradox: Should athletes be training smarter and harder? Br. J. Sports Med. 2016, 50, 273–280. [Google Scholar] [CrossRef] [PubMed]
- Gabbett, T.J.; Whyte, D.G.; Hartwig, T.B.; Wescombe, H.; Naughton, G.A. The relationship between workloads, physical performance, injury and illness in adolescent male football players. Sports Med. 2014, 44, 989–1003. [Google Scholar] [CrossRef] [PubMed]
- Franco, M.F.; Madaleno, F.O.; de Paula, T.M.N.; Ferreira, T.V.; Pinto, R.Z.; Resende, R.A. Prevalence of overuse injuries in athletes from individual and team sports: A systematic review with meta-analysis and GRADE recommendations. Braz. J. Phys. Ther. 2021, 25, 500–513. [Google Scholar] [CrossRef] [PubMed] [PubMed Central]
- Rotllan, C.; Viscor, G. Winter Sports Injuries in Elite Female Athletes: A Narrative Review. Int. J. Environ. Res. Public Health 2023, 20, 5815. [Google Scholar] [CrossRef] [PubMed] [PubMed Central]
- Koh, J.O. Prevalence rate of chronic overuse pain in taekwondo athletes. J. Sports Med. Phys. Fit. 2017, 57, 1330–1337. [Google Scholar] [CrossRef] [PubMed]
- Parry, G.N.; Williams, S.; McKay, C.D.; Johnson, D.J.; Bergeron, M.F.; Cumming, S.P. Associations between growth, maturation and injury in youth athletes engaged in elite pathways: A scoping review. Br. J. Sports Med. 2024, 58, 1001–1010. [Google Scholar] [CrossRef] [PubMed] [PubMed Central]
- Theisen, D.; Frisch, A.; Malisoux, L.; Urhausen, A.; Croisier, J.L.; Seil, R. Injury risk is different in team and individual youth sport. J. Sci. Med. Sport 2013, 16, 200–204. [Google Scholar] [CrossRef] [PubMed]
- Hulme, A.; Nielsen, R.O.; Timpka, T.; Verhagen, E.; Finch, C.F. Risk and protective factors for middle- and long-distance run-ning-related injury: A systematic review. Sports Med. 2017, 47, 869–886. [Google Scholar] [CrossRef] [PubMed]
- Domaradzki, J. Influence of body composition on injury risk in team sports: A cross-sectional study. J. Hum. Kinet. 2022, 82, 45–54. [Google Scholar] [CrossRef]
- Gabbett, T.J. How do training and competition workloads relate to injury? The workload–injury aetiology model. Br. J. Sports Med. 2017, 51, 428–435. [Google Scholar] [CrossRef]
- Soligard, T.; Schwellnus, M.; Alonso, J.-M.; Bahr, R.; Clarsen, B.; Dijkstra, H.P.; Gabbett, T.; Gleeson, M.; Hägglund, M.; Hutchinson, M.R.; et al. How much is too much? (Part 1) International Olympic Committee consensus statement on load in sport and risk of injury. Br. J. Sports Med. 2016, 50, 1030–1041. [Google Scholar] [CrossRef] [PubMed]
- Malisoux, L.; Frisch, A.; Urhausen, A.; Seil, R.; Theisen, D. Monitoring of sport participation and injury risk in young athletes: A systematic review. Int. J. Sports Med. 2015, 36, 501–508. [Google Scholar] [CrossRef] [PubMed]
- Jayanthi, N.; Pinkham, C.; Dugas, L.; Patrick, B.; Labella, C. Sports specialization in young athletes: Evidence-based recommendations. Sports Health 2013, 5, 251–257. [Google Scholar] [CrossRef] [PubMed] [PubMed Central]
- Armitage, P.; Colton, T. Encyclopedia of Biostatistics; John Wiley and Sons: Hoboken, NJ, USA, 2009. [Google Scholar]
- ISO 9001:2009; Quality Management Systems. International Organization for Standardization: Geneva, Switzerland, 2008.
- ISO 9001:2015; Quality Management Systems. International Organization for Standardization: Geneva, Switzerland, 2015.
- Aron, A.; Aron, E.N.; Coups, E.J. Statistics for Psychology, 6th ed.; Pearson International Edition: Upper Saddle River, NJ, USA, 2012. [Google Scholar]
- Kozlenia, D.; Domaradzki, J. Prediction and injury risk based on movement patterns and flexibility in a 6-month prospective study among physically active adults. PeerJ 2021, 9, e11399. [Google Scholar] [CrossRef]
- Zech, A.; Hollander, K.; Junge, A.; Steib, S.; Groll, A.; Heiner, J.; Nowak, F.; Pfeiffer, D.; Rahlf, A.L. Sex differences in injury rates in team-sport athletes: A systematic review and meta-regression analysis. J. Sport Health Sci. 2022, 11, 104–114. [Google Scholar] [CrossRef] [PubMed] [PubMed Central]
- Yang, J.; Tibbetts, A.S.; Covassin, T.; Cheng, G.; Nayar, S.; Heiden, E. Epidemiology of overuse and acute injuries among competitive collegiate athletes. J. Athl. Train 2012, 47, 198–204. [Google Scholar] [CrossRef] [PubMed] [PubMed Central]
- Sieland, J.; Krause, F.; Kalo, K.; Wilke, J.; Vogt, L.; Banzer, W.; Niederer, D. Injuries and functional performance status in young elite football players: A prospective 2-year monitoring. J. Sports Med. Phys. Fit. 2020, 60, 1363–1370. [Google Scholar] [CrossRef] [PubMed]
- Cassel, M.; Müller, J.; Moser, O.; Strempler, M.E.; Reso, J.; Mayer, F. Orthopedic injury profiles in adolescent elite athletes: A retrospective analysis from a sports medicine department. Front. Physiol. 2019, 10, 544. [Google Scholar] [CrossRef] [PubMed] [PubMed Central]
- de Subijana, C.L.; Galatti, L.; Moreno, R.; Chamorro, J.L. Analysis of the Athletic Career and Retirement Depending on the Type of Sport: A Comparison between Individual and Team Sports. Int. J. Environ. Res. Public Health 2020, 17, 9265. [Google Scholar] [CrossRef] [PubMed] [PubMed Central]
- Hewett, T.E.; Myer, G.D.; Ford, K.R.; Heidt, R.S., Jr.; Colosimo, A.J.; McLean, S.G.; Van Den Bogert, A.J.; Paterno, M.V.; Succop, P. Biomechanical measures of neuromuscular control and valgus loading of the knee predict anterior cruciate ligament injury risk in female athletes: A prospective study. Am. J. Sports Med. 2005, 33, 492–501. [Google Scholar] [CrossRef] [PubMed]
- Bliekendaal, S.; Moen, M.; Fokker, Y.; Stubbe, J.H.; Twisk, J.; Verhagen, E. Incidence and risk factors of medial tibial stress syndrome: A prospective study in Physical Education Teacher Education students. BMJ Open Sport Exerc. Med. 2018, 4, e000421. [Google Scholar] [CrossRef] [PubMed] [PubMed Central]
- Domaradzki, J.; Kozlenia, D. The performance of body mass component indices in detecting risk of musculoskeletal injuries in physically active young men and women. PeerJ 2022, 10, e12745. [Google Scholar] [CrossRef] [PubMed] [PubMed Central]
- Yard, E.; Comstock, D. Injury patterns by body mass index in US high school athletes. J. Phys. Act Health 2011, 8, 182–191. [Google Scholar] [CrossRef] [PubMed]
- Ezzat, A.M.; Schneeberg, A.; Koehoorn, M.; Emery, C.A. Association between Body Composition and Sport Injury in Canadian Adolescents. Physiother. Can. 2016, 68, 275–281. [Google Scholar] [CrossRef] [PubMed] [PubMed Central]
- Bruton, M.R.; O’Dwyer, N.; Adams, R. Sex differences in the kinematics and neuromuscular control of landing: Biological, environmental and sociocultural factors. J. Electromyogr. Kinesiol. 2013, 23, 747–758. [Google Scholar] [CrossRef] [PubMed]
- Farley, J.B.; Barrett, L.M.; Keogh, J.W.L.; Woods, C.T.; Milne, N. The relationship between physical fitness attributes and sports injury in female, team ball sport players: A systematic review. Sports Med. Open 2020, 6, 45. [Google Scholar] [CrossRef] [PubMed] [PubMed Central]
- Prieto-González, P.; Martínez-Castillo, J.L.; Fernández-Galván, L.M.; Casado, A.; Soporki, S.; Sánchez-Infante, J. Epidemiology of Sports-Related Injuries and Associated Risk Factors in Adolescent Athletes: An Injury Surveillance. Int. J. Environ. Res. Public Health 2021, 18, 4857. [Google Scholar] [CrossRef] [PubMed] [PubMed Central]

| Variable | Males | Females | ||||||
|---|---|---|---|---|---|---|---|---|
| Mean | −95%CI | 95%CI | sd | Mean | −95%CI | 95%CI | sd | |
| individual | ||||||||
| Age [years] | 21.8 | 21.5 | 22.1 | 1.9 | 21.2 | 21.0 | 21.4 | 1.5 |
| BH [cm] | 182.2 | 181.0 | 183.4 | 7.0 | 167.9 | 167.1 | 168.8 | 5.8 |
| BW [kg] | 80.3 | 78.3 | 82.2 | 11.1 | 60.3 | 59.1 | 61.5 | 8.3 |
| BMI [kg/m2] | 24.1 | 23.7 | 24.6 | 2.7 | 21.4 | 21.0 | 21.8 | 2.6 |
| FMI [kg/m2] | 4.0 | 3.7 | 4.2 | 1.4 | 5.1 | 4.8 | 5.3 | 1.7 |
| SMI [kg/m2] | 16.7 | 16.1 | 17.3 | 3.6 | 10.3 | 9.9 | 10.8 | 3.0 |
| MFR [score] | 4.9 | 4.5 | 5.2 | 2.0 | 2.7 | 2.5 | 2.8 | 1.0 |
| Load [h/week] | 6.6 | 5.9 | 7.3 | 4.1 | 5.6 | 5.0 | 6.2 | 3.8 |
| Experience [y] | 3.4 | 3.2 | 3.6 | 1.3 | 3.2 | 3.0 | 3.4 | 1.5 |
| team | ||||||||
| Age [years] | 21.8 | 21.4 | 22.2 | 1.9 | 21.2 | 20.8 | 21.6 | 1.5 |
| BH [cm] | 181.9 | 180.5 | 183.4 | 7.1 | 169.3 | 167.5 | 171.0 | 6.6 |
| BW [kg] | 78.1 | 76.5 | 79.7 | 7.6 | 62.7 | 60.1 | 65.3 | 10.0 |
| BMI [kg/m2] | 23.6 | 23.2 | 24.0 | 2.0 | 21.8 | 21.1 | 22.6 | 2.8 |
| FMI [kg/m2] | 3.8 | 3.5 | 4.0 | 1.2 | 5.3 | 4.8 | 5.8 | 1.9 |
| SMI [kg/m2] | 16.2 | 15.6 | 16.8 | 3.0 | 11.5 | 10.8 | 12.2 | 2.6 |
| MFR [score] | 4.9 | 4.5 | 5.3 | 1.9 | 2.9 | 2.6 | 3.2 | 1.2 |
| Load [h/week] | 5.8 | 5.0 | 6.5 | 3.5 | 5.8 | 4.8 | 6.8 | 3.9 |
| Experience [y] | 3.9 | 3.7 | 4.2 | 1.2 | 2.9 | 2.5 | 3.2 | 1.5 |
| Sex | Injury N (%) | |||
|---|---|---|---|---|
| Sport | 1 | 0 | All | |
| males | individual | 54 (41.54%) | 76 (58.46%) | 130 (42.35%) |
| team | 44 (49.44%) | 45 (50.56%) | 89 (60.54%) | |
| whole | 98 (44.75%) | 121 (55.25%) | 219 (48.24%) | |
| females | individual | 97 (54.80%) | 80 (45.20%) | 177 (57.65%) |
| team | 31 (53.45%) | 27 (46.55%) | 58 (39.46%) | |
| whole | 128 (54.47%) | 107 (45.53%) | 235 (51.76) | |
| all | 226 (49.78) | 228 (50.22) | 454 |
| Sex | Sport | All | Head-Neck-Trunk 0 | Head-Neck-Trunk 1 | Upper Limb 0 | Upper Limb 1 | Lower Limb 0 | Lower Limb 1 |
|---|---|---|---|---|---|---|---|---|
| Males | individual | 130 (42.35%) | 113 (86.92%) | 17 (13.08%) | 97 (74.62%) | 33 (25.38%) | 66 (50.77%) | 64 (49.23%) |
| team | 89 (60.54%) | 80 (89.89%) | 9 (10.11%) | 71 (79.78%) | 18 (20.22%) | 49 (55.06%) | 40 (44.94%) | |
| whole | 219 | 193 (88.13%) | 26 (11.87%) | 168 (76.71%) | 51 (23.29%) | 115 (52.51%) | 104 (47.49%) | |
| females | individual | 177 (57.65%) | 154 (87.01%) | 23 (12.99%) | 145 (81.92%) | 32 (18.08%) | 107 (60.45%) | 70 (39.55%) |
| team | 58 (39.46%) | 52 (89.66%) | 6 (10.34%) | 46 (79.31%) | 12 (20.69%) | 34 (58.62%) | 24 (41.38%) | |
| whole | 235 | 206 (87.66%) | 29 (12.34%) | 191 (81.28%) | 44 (18.72%) | 141 (60.00%) | 94 (40.00%) | |
| all | 454 | 399 (87.89%) | 55 (12.11%) | 359 (79.07%) | 95 (20.93%) | 256 (56.39%) | 198 (43.61%) |
| Body Part | Variable | Beta | SE | Wald | p | OR | –95%CI | +95%CI | LRT |
|---|---|---|---|---|---|---|---|---|---|
| Males | individual | ||||||||
| H-n-tr | MFR | 0.28 | 0.19 | 2.19 | 0.139 | 1.33 | 0.91 | 1.93 | −49.93 |
| FMI | 0.30 | 0.28 | 1.20 | 0.274 | 1.35 | 0.79 | 2.32 | −49.36 | |
| Model Fit Statistics: AIC = 104.73, BIC = 113.32, Nagelkerke’s R2 = 0.03 || AUC MFR = 0.55, AUC FMI = 0.48, Δ AUC = −0.07, p = 0.661 | |||||||||
| Upper limb | Age | −0.47 | 0.15 | 9.92 | 0.002 | 0.62 | 0.47 | 0.84 | −67.93 |
| FMI | 0.18 | 0.15 | 1.47 | 0.226 | 1.20 | 0.89 | 1.62 | −67.19 | |
| Model Fit Statistics: AIC = 140.39, BIC = 148.99, Nagelkerke’s R2 = 0.14 || AUC Age = 0.68, AUC FMI = 0.51, Δ AUC = −0.17, p = 0.064 | |||||||||
| Lower limb | Age | −0.37 | 0.11 | 11.17 | 0.001 | 0.69 | 0.56 | 0.86 | −84.00 |
| FMI | 0.12 | 0.13 | 0.77 | 0.379 | 1.13 | 0.86 | 1.47 | −83.61 | |
| Model Fit Statistics: AIC = 173.22, BIC = 181.82, R2 Nagelkerke = 0.13 || AUC Age = 0.66, AUC FMI = 0.49, Δ AUC = −0.17, p = 0.040 | |||||||||
| Males | team | ||||||||
| H-n-tr | FMI | −0.73 | 0.45 | 2.57 | 0.109 | 0.48 | 0.20 | 1.18 | −28.86 |
| BMI | 0.42 | 0.26 | 2.53 | 0.112 | 1.52 | 0.91 | 2.54 | −27.55 | |
| Model Fit Statistics: AIC = 61.10, BIC = 68.57, Nagelkerke’s R2 = 0.07 || AUC FMI = 0.59, AUC BMI = 0.43, Δ AUC = −0.16, p = 0.055 | |||||||||
| Upper limb | Age | 0.63 | 0.26 | 6.11 | 0.013 | 1.88 | 1.14 | 3.10 | −36.17 |
| SMI | −0.28 | 0.16 | 3.14 | 0.077 | 0.75 | 0.55 | 1.03 | −34.32 | |
| Model Fit Statistics: AIC = 74.65, BIC = 82.11, Nagelkerke’s R2 = 0.33 || AUC Age = 0.78, AUC SMI = 0.74, Δ AUC = −0.04, p = 0.438 | |||||||||
| Lower limb | FMI | −0.30 | 0.19 | 2.60 | 0.107 | 0.74 | 0.51 | 1.07 | −59.93 |
| SMI | 0.09 | 0.08 | 1.42 | 0.233 | 1.09 | 0.94 | 1.27 | −59.20 | |
| Model Fit Statistics: AIC = 124.41, BIC = 131.88, Nagelkerke’s R2 = 0.06 || AUC FMI = 0.38, AUC SMI = 0.43, Δ AUC = 0.05, p = 0.589 | |||||||||
| Females | individual | ||||||||
| H-n-tr | Load | −0.10 | 0.07 | 1.91 | 0.167 | 0.91 | 0.79 | 1.04 | −67.61 |
| Experience | 0.22 | 0.15 | 1.98 | 0.159 | 1.24 | 0.92 | 1.67 | −66.62 | |
| Model Fit Statistics: AIC = 139.25, BIC = 148.78, Nagelkerke’s R2 = 0.04 || AUC Load = 0.44, AUC Experience = 0.57, Δ AUC = 0.14, p = 0.060 | |||||||||
| Upper limb | SMI | 0.17 | 0.08 | 4.49 | 0.034 | 1.18 | 1.01 | 1.38 | −79.62 |
| BMI | 0.07 | 0.08 | 0.91 | 0.341 | 1.08 | 0.92 | 1.26 | −79.16 | |
| Model Fit Statistics: AIC = 164.33, BIC = 173.86, Nagelkerke’s R2 = 0.08 || AUC SMI= 0.67, AUC BMI = 0.59, Δ AUC = −0.09, p = 0.115 | |||||||||
| Lower limb | Age | −0.29 | 0.11 | 6.53 | 0.011 | 0.75 | 0.60 | 0.94 | −115.23 |
| BMI | 0.08 | 0.06 | 2.01 | 0.157 | 1.09 | 0.97 | 1.22 | −114.27 | |
| Model Fit Statistics: AIC = 234.45, BIC = 243.98, Nagelkerke’s R2 = 0.07 || AUC Age = 0.39, AUC BMI = 0.44, Δ AUC = 0.06, p = 0.361 | |||||||||
| Females | team | ||||||||
| H-n-tr | Experience | −0.65 | 0.39 | 2.86 | 0.091 | 0.52 | 0.24 | 1.11 | −17.43 |
| BMI | 0.09 | 0.14 | 0.46 | 0.500 | 1.10 | 0.84 | 1.43 | −17.21 | |
| Model Fit Statistics: AIC = 40.43, BIC = 40.61, Nagelkerke’s R2 = 0.14 || AUC Expierience = 0.73, AUC BMI = 0.51, Δ AUC = −0.22, p = 0.173 | |||||||||
| Upper limb | MFR | 0.90 | 0.38 | 5.70 | 0.017 | 2.46 | 1.17 | 5.15 | −29.43 |
| BMI | 0.52 | 0.19 | 7.14 | 0.008 | 1.67 | 1.15 | 2.44 | −24.12 | |
| Model Fit Statistics: AIC = 54.23, BIC = 60.41, Nagelkerke’s R2 = 0.27 || AUC MFR = 0.56, AUC BMI = 0.61, Δ AUC = −0.05, p = 0.786 | |||||||||
| Lower limb | Age | −0.44 | 0.22 | 4.08 | 0.043 | 0.64 | 0.42 | 0.99 | −37.95 |
| FMI | 0.53 | 0.20 | 6.89 | 0.009 | 1.70 | 1.14 | 2.52 | −33.21 | |
| Model Fit Statistics: AIC = 72.42, BIC = 78.60, Nagelkerke’s R2 = 0.26|| AUC Age = 0.61, AUC FMI = 0.68, Δ AUC = −0.07, p = 0.540 | |||||||||
| Beta | OR | ||||||
|---|---|---|---|---|---|---|---|
| Model 1 | Variable 1 | Model 2 | Variable 2 | Z-Score | p | Z-Score | p |
| Males | |||||||
| Upper_Individuals | Age | Lower_Individuals | Age | −0.54 | 0.591 | −0.58 | 0.561 |
| Upper_Individuals | Age | Upper_Team | Age | −3.66 | 0.000 | −3.76 | 0.000 |
| Lower_Individuals | Age | Upper_Team | Age | −3.54 | 0.000 | −3.61 | 0.000 |
| Females | |||||||
| Upper_Individuals | SMI | Lower_Individuals | Age | 3.38 | 0.001 | 3.25 | 0.001 |
| Upper_Individuals | SMI | Upper_Team | MFR | −1.88 | 0.060 | −1.90 | 0.057 |
| Upper_Individuals | SMI | Upper_Team | BMI | −1.70 | 0.090 | −1.67 | 0.095 |
| Upper_Individuals | SMI | Lower_Team | Age | 2.61 | 0.009 | 2.63 | 0.009 |
| Upper_Individuals | SMI | Lower_Team | FMI | −1.67 | 0.095 | −1.68 | 0.093 |
| Lower_Individuals | Age | Upper_Team | MFR | −3.01 | 0.003 | −3.01 | 0.003 |
| Lower_Individuals | Age | Upper_Team | BMI | −3.69 | 0.000 | −3.58 | 0.000 |
| Lower_Individuals | Age | Lower_Team | Age | 0.61 | 0.542 | 0.64 | 0.521 |
| Lower_Individuals | Age | Lower_Team | FMI | −3.59 | 0.000 | −3.52 | 0.000 |
| Upper_Team | MFR | Upper_Team | BMI | 0.89 | 0.371 | 0.91 | 0.361 |
| Upper_Team | MFR | Lower_Team | Age | 3.05 | 0.002 | 3.08 | 0.002 |
| Upper_Team | MFR | Lower_Team | FMI | 0.86 | 0.389 | 0.86 | 0.389 |
| Upper_Team | BMI | Lower_Team | Age | 3.30 | 0.001 | 3.30 | 0.001 |
| Upper_Team | BMI | Lower_Team | FMI | −0.04 | 0.971 | −0.06 | 0.949 |
| Lower_Team | Age | Lower_Team | FMI | −3.26 | 0.001 | −3.28 | 0.001 |
Disclaimer/Publisher’s Note: The statements, opinions and data contained in all publications are solely those of the individual author(s) and contributor(s) and not of MDPI and/or the editor(s). MDPI and/or the editor(s) disclaim responsibility for any injury to people or property resulting from any ideas, methods, instructions or products referred to in the content. |
© 2025 by the authors. Licensee MDPI, Basel, Switzerland. This article is an open access article distributed under the terms and conditions of the Creative Commons Attribution (CC BY) license (https://creativecommons.org/licenses/by/4.0/).
Share and Cite
Domaradzki, J.; Kopacka, E. Predictive Models for Injury Risk Across Body Regions and Sport Types in Physically Active Students: Cross-Sectional Design. J. Clin. Med. 2025, 14, 4307. https://doi.org/10.3390/jcm14124307
Domaradzki J, Kopacka E. Predictive Models for Injury Risk Across Body Regions and Sport Types in Physically Active Students: Cross-Sectional Design. Journal of Clinical Medicine. 2025; 14(12):4307. https://doi.org/10.3390/jcm14124307
Chicago/Turabian StyleDomaradzki, Jarosław, and Edyta Kopacka. 2025. "Predictive Models for Injury Risk Across Body Regions and Sport Types in Physically Active Students: Cross-Sectional Design" Journal of Clinical Medicine 14, no. 12: 4307. https://doi.org/10.3390/jcm14124307
APA StyleDomaradzki, J., & Kopacka, E. (2025). Predictive Models for Injury Risk Across Body Regions and Sport Types in Physically Active Students: Cross-Sectional Design. Journal of Clinical Medicine, 14(12), 4307. https://doi.org/10.3390/jcm14124307