
Structure-Function Correlation of Retinal Fibrosis in Eyes with Neovascular Age-Related Macular Degeneration

 , ,
, ,  , ,
, ,
Abstract
1. Introduction
2. Methods
2.1. Inclusion and Clinical Monitoring
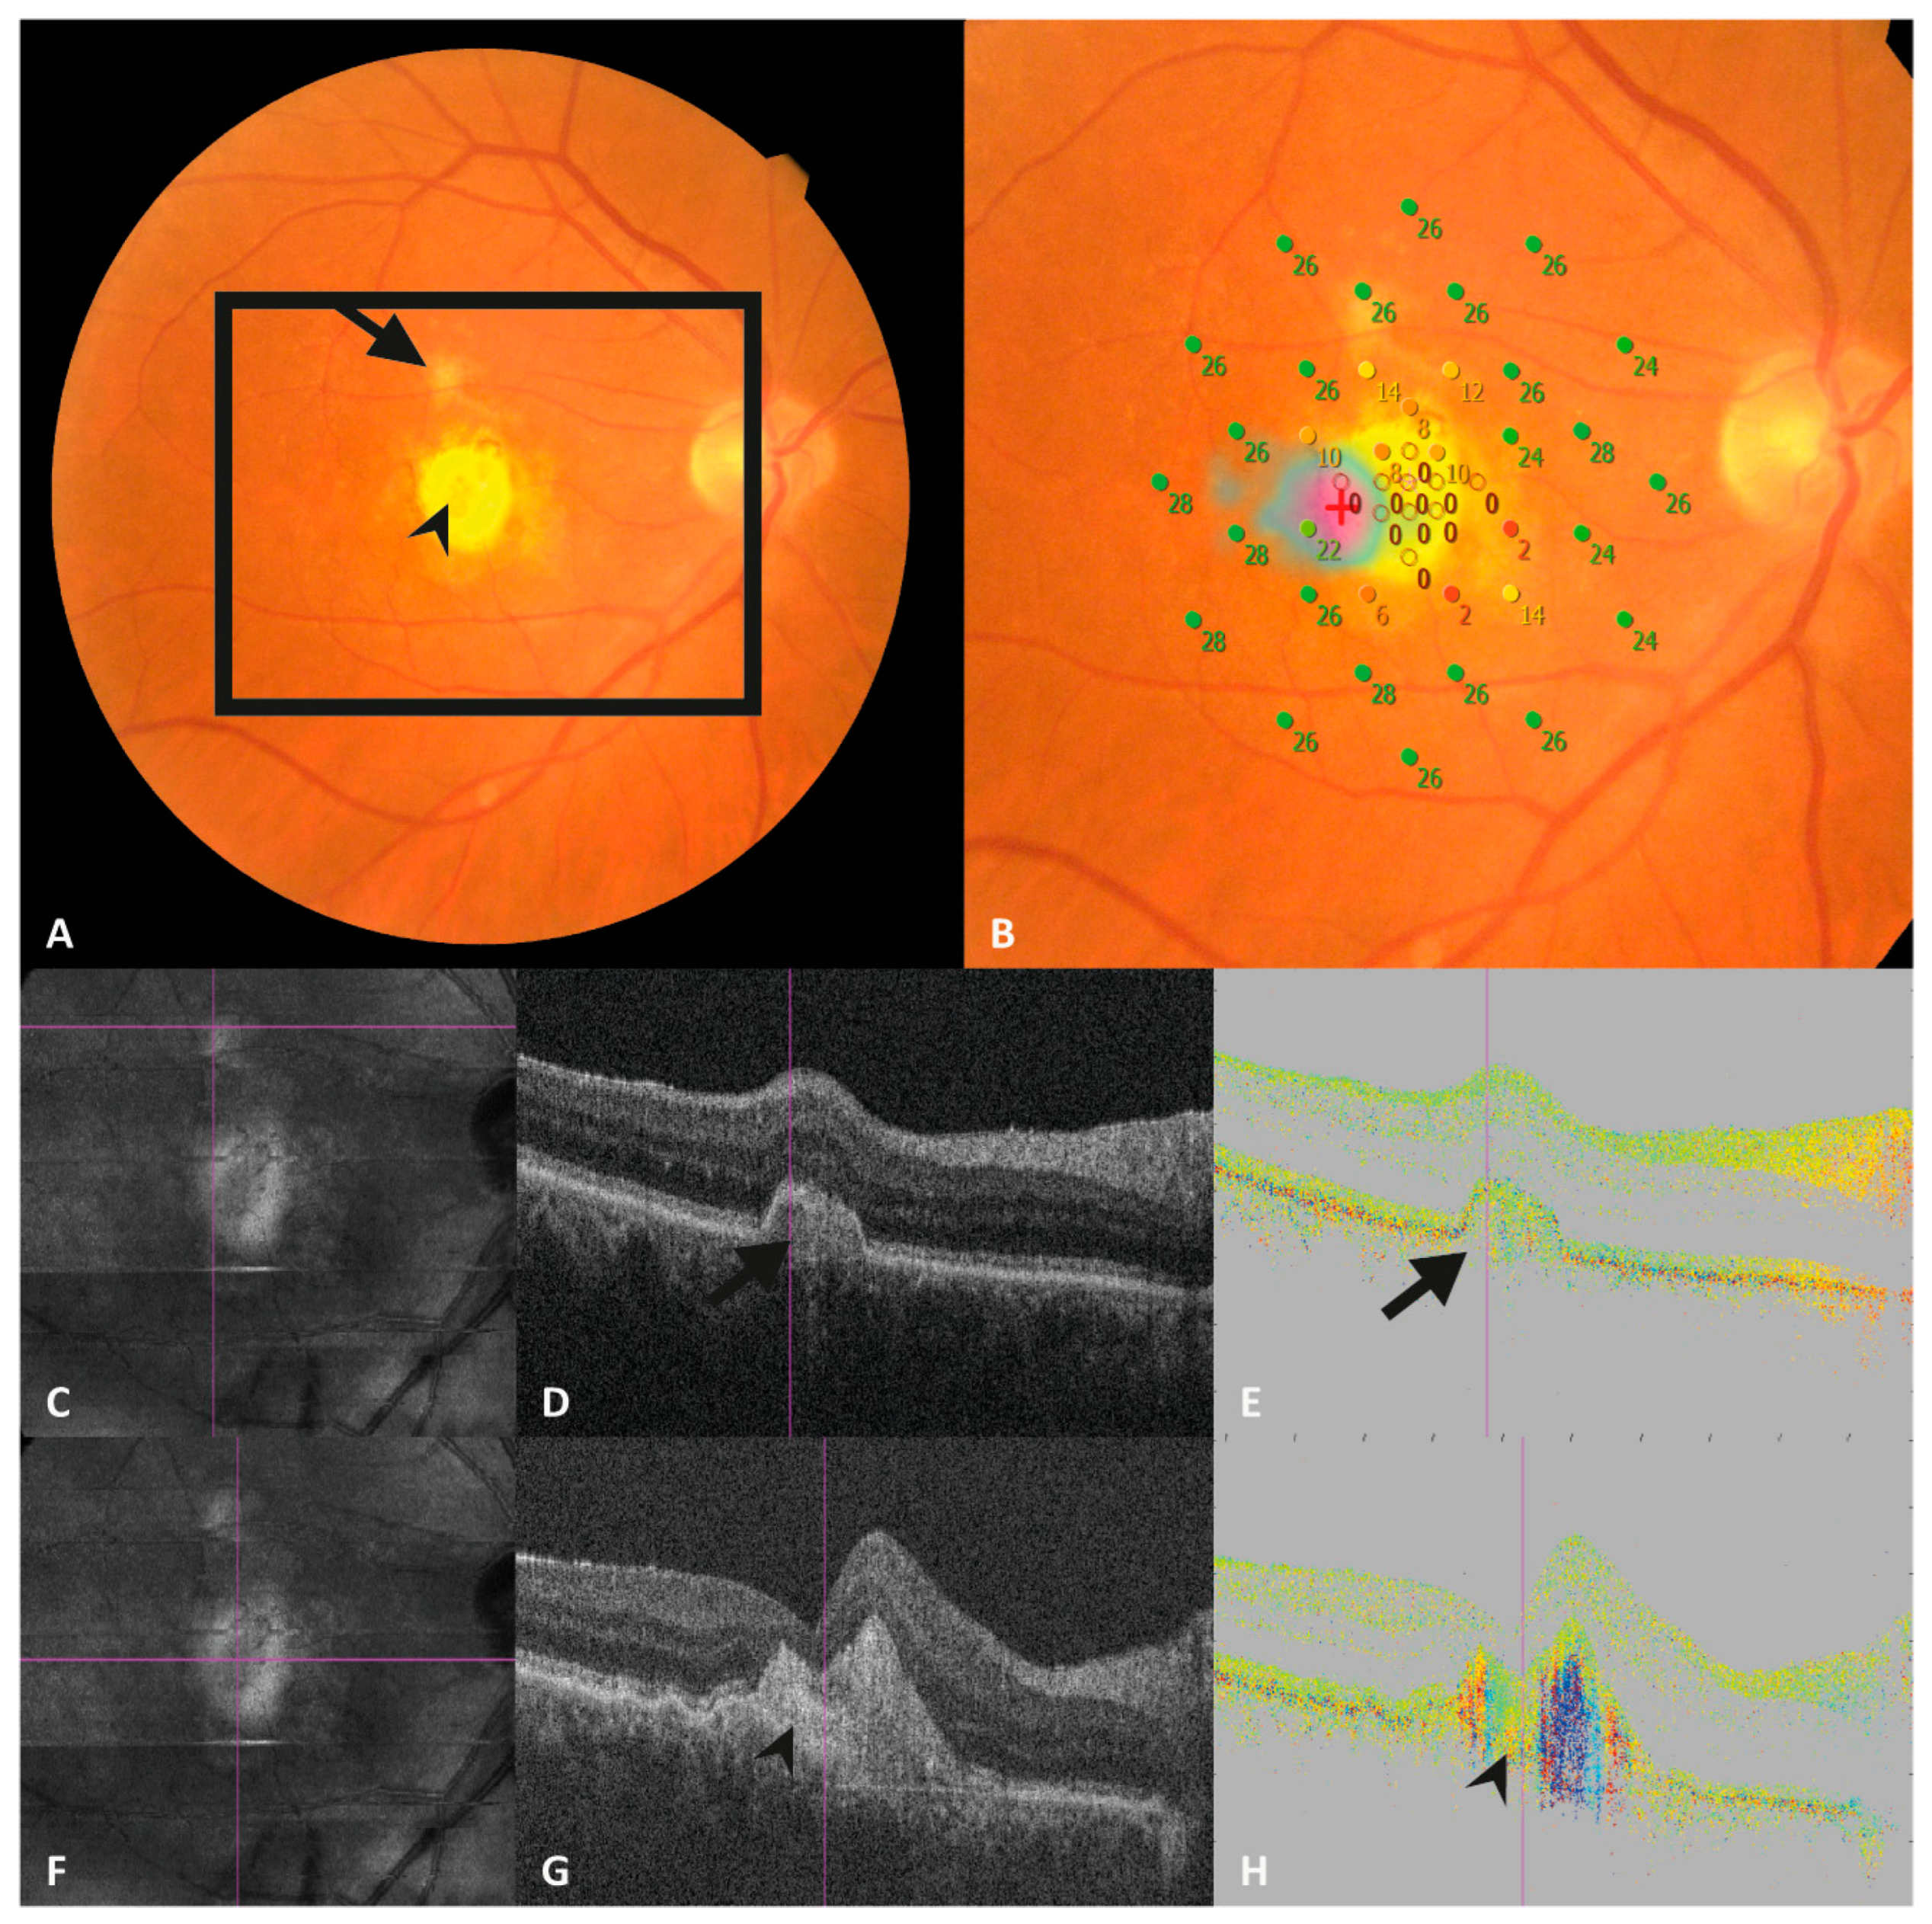
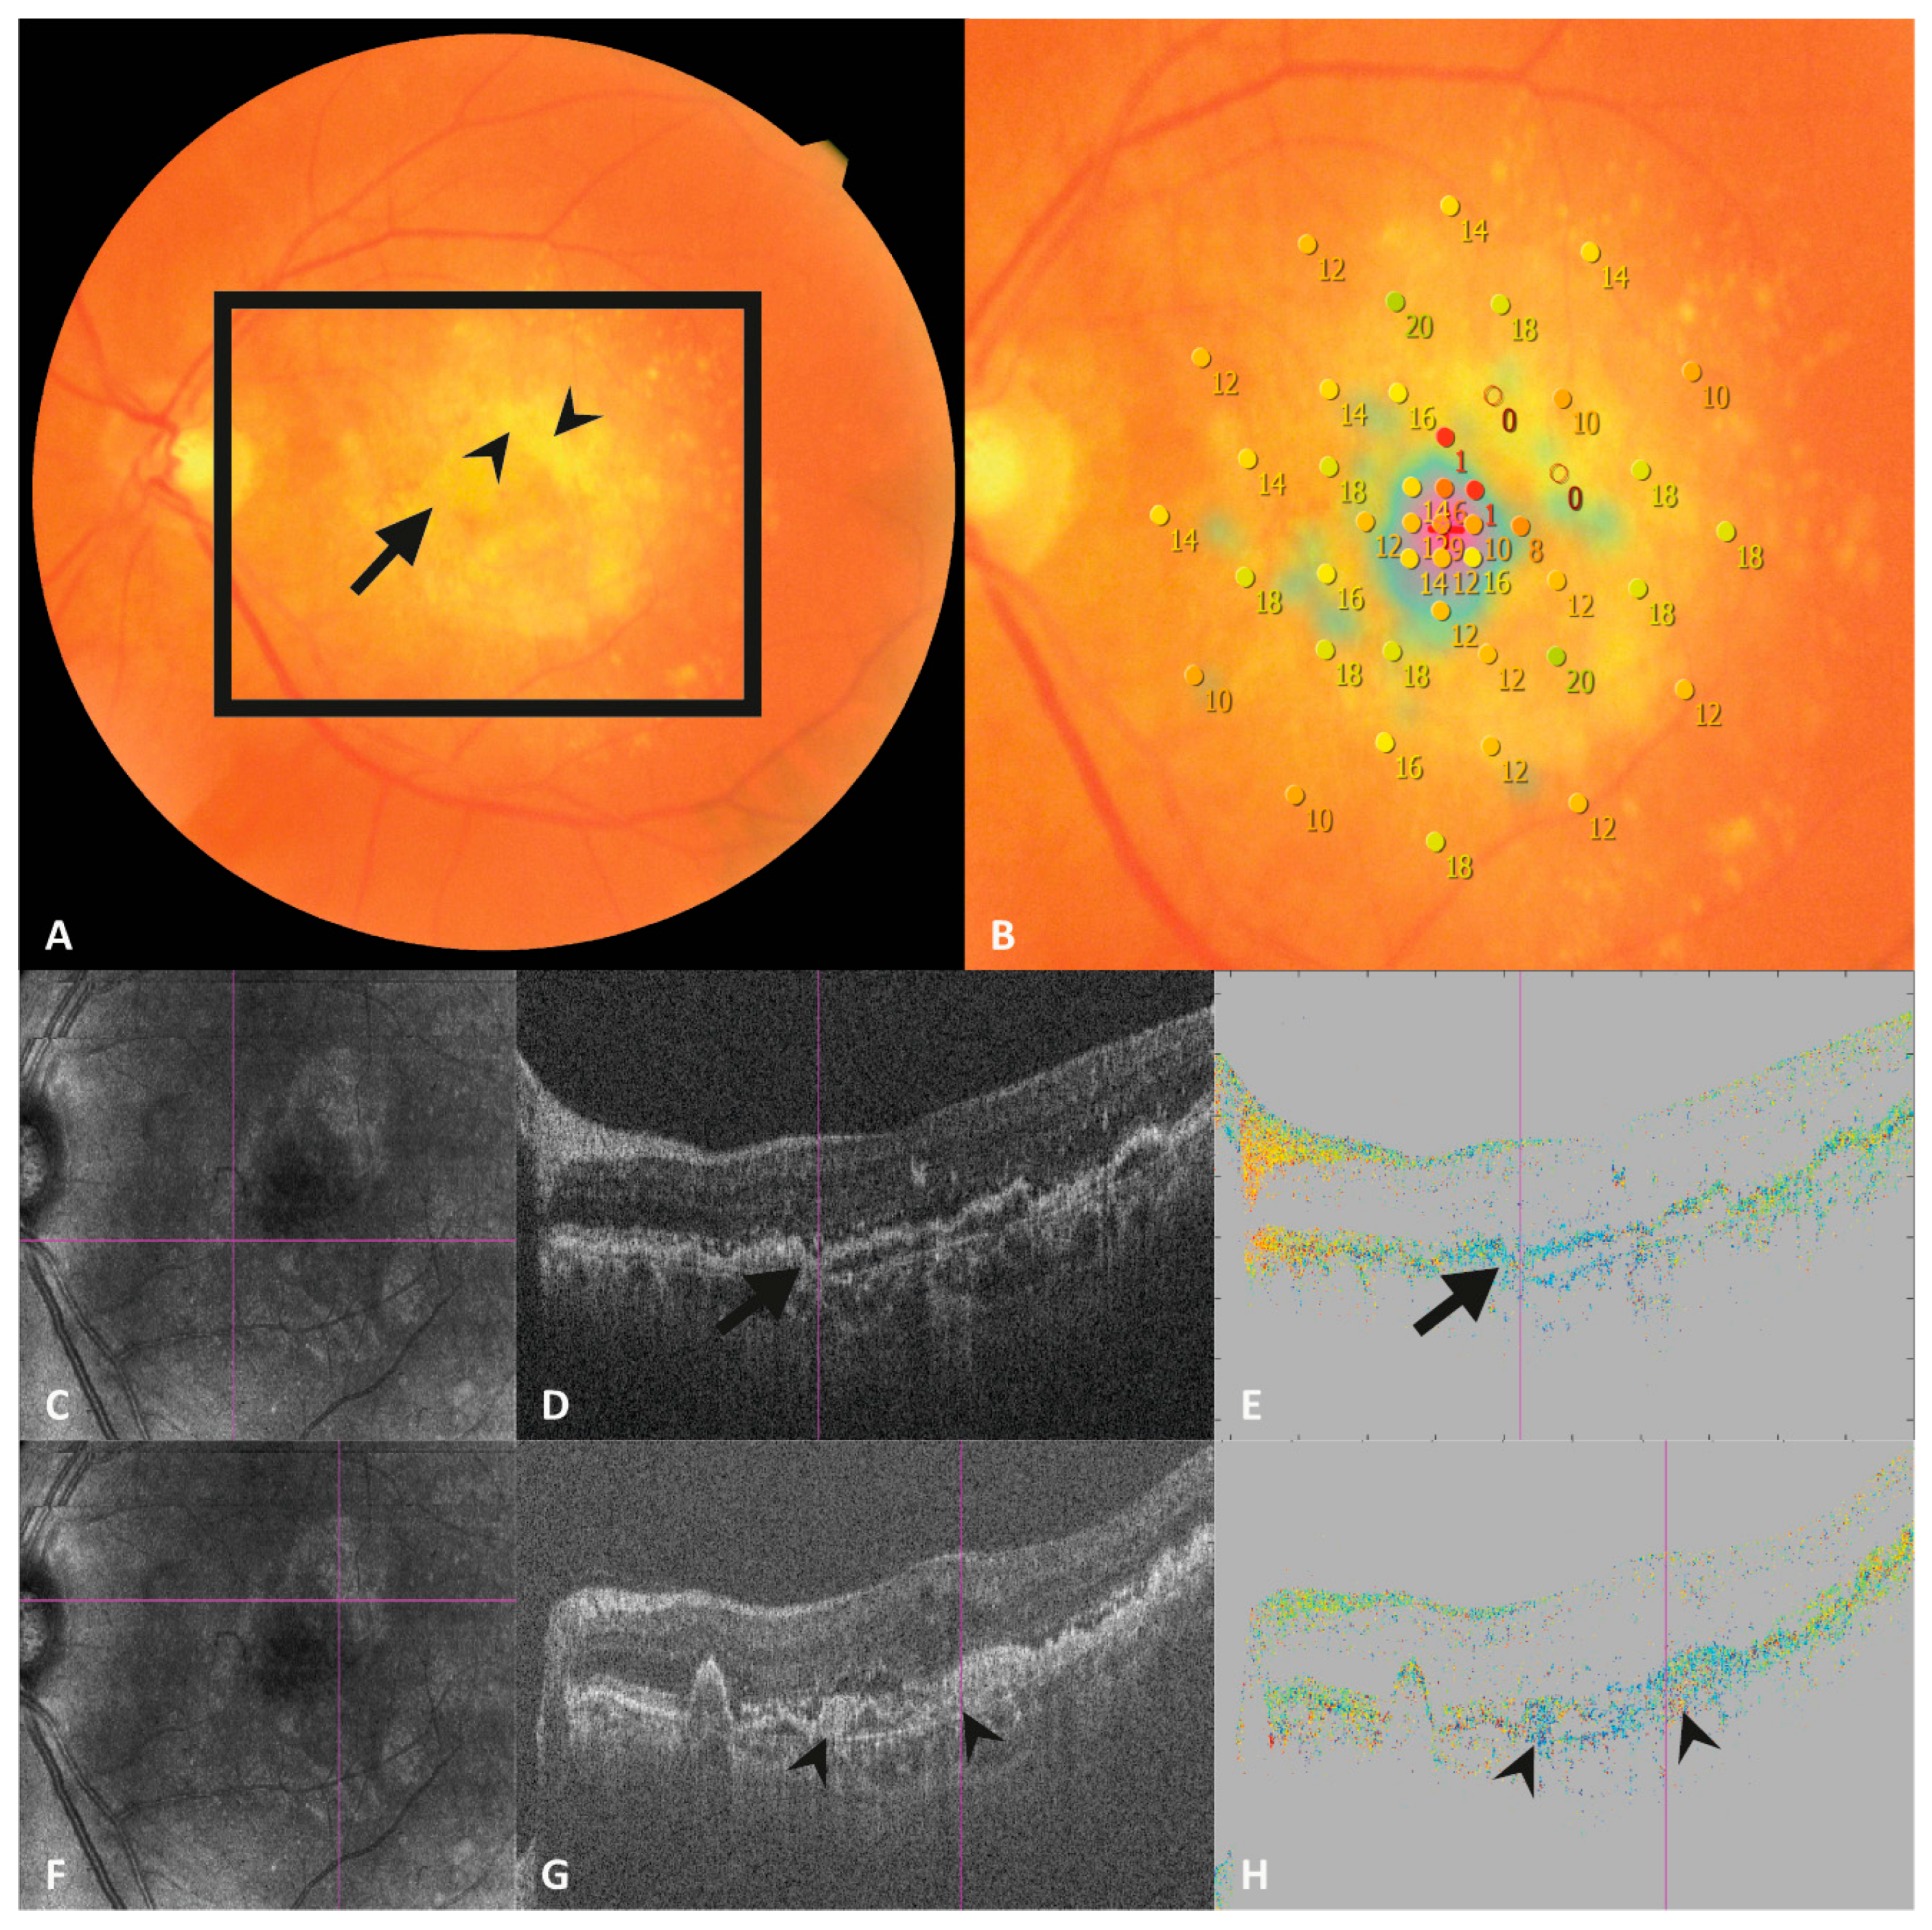
2.2. OCT Imaging
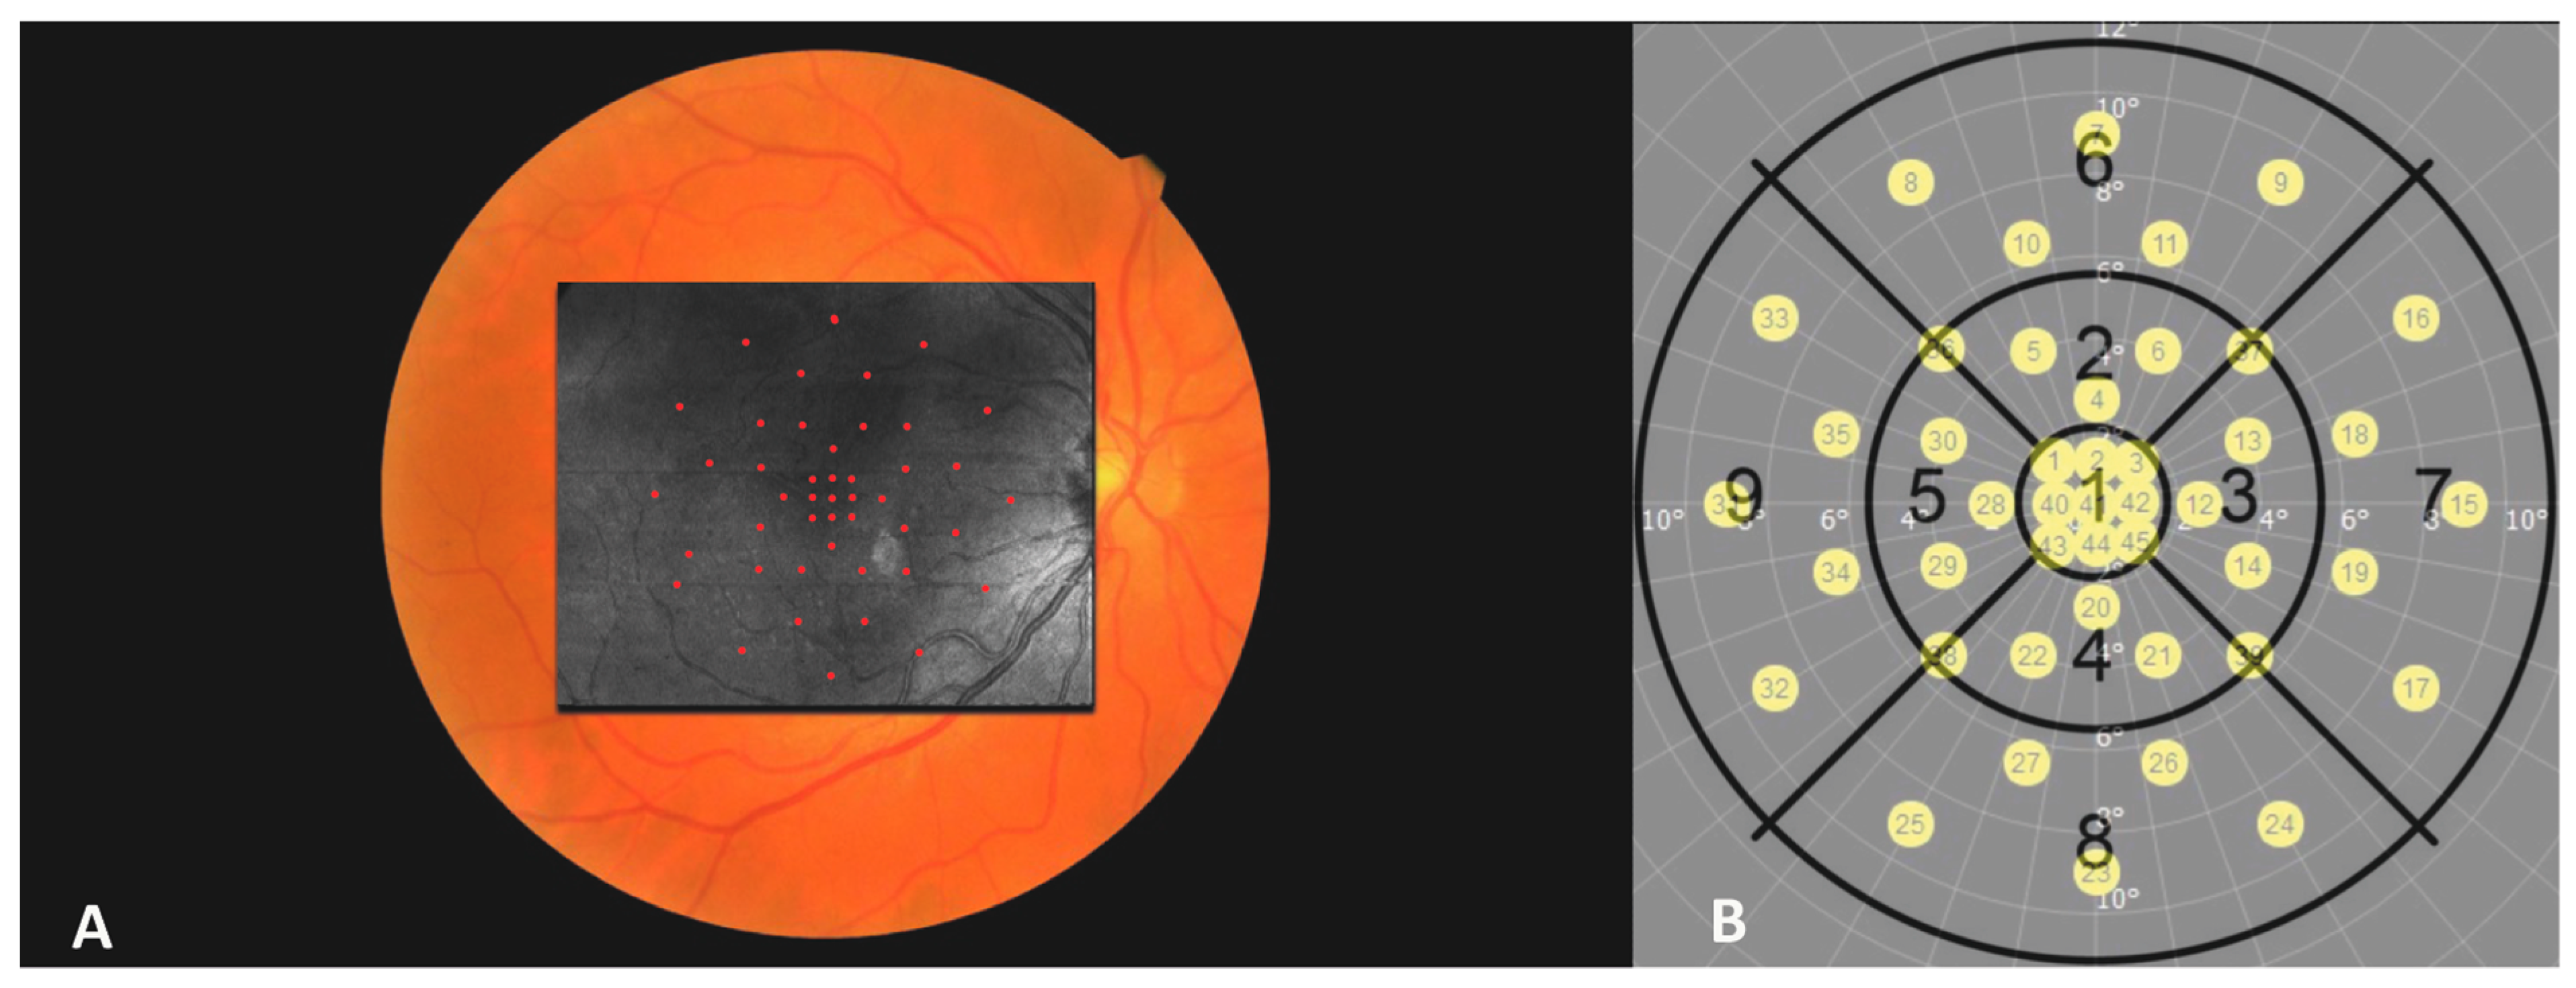
2.3. Microperimetry
2.4. Image Analysis and Image Preparations
2.5. Statistical Testing
3. Results
3.1. Patient Characteristics
3.2. Retinal Sensitivity
4. Discussion
5. Conclusions
Author Contributions
Funding
Institutional Review Board Statement
Informed Consent Statement
Data Availability Statement
Conflicts of Interest
References
- Wong, W.L.; Su, X.; Li, X.; Cheung, C.M.G.; Klein, R.; Cheng, C.-Y.; Wong, T.Y. Global Prevalence of Age-Related Macular Degeneration and Disease Burden Projection for 2020 and 2040: A Systematic Review and Meta-Analysis. Lancet Glob. Health 2014, 2, e106–e116. [Google Scholar] [CrossRef] [PubMed]
- Rein, D.B.; Wittenborn, J.S.; Burke-Conte, Z.; Gulia, R.; Robalik, T.; Ehrlich, J.R.; Lundeen, E.A.; Flaxman, A.D. Prevalence of Age-Related Macular Degeneration in the US in 2019. JAMA Ophthalmol. 2022, 140, 1202–1208. [Google Scholar] [CrossRef] [PubMed]
- Rein, D.B.; Wittenborn, J.S.; Zhang, X.; Honeycutt, A.A.; Lesesne, S.B.; Saaddine, J. Forecasting Age-Related Macular Degeneration through the Year 2050: The Potential Impact of New Treatments. Arch. Ophthalmol. 2009, 127, 533–540. [Google Scholar] [CrossRef] [PubMed]
- Daniel, E.; Toth, C.A.; Grunwald, J.E.; Jaffe, G.J.; Martin, D.F.; Fine, S.L.; Huang, J.; Ying, G.S.; Hagstrom, S.A.; Winter, K.; et al. Risk of Scar in the Comparison of Age-Related Macular Degeneration Treatments Trials. Ophthalmology 2014, 121, 656–666. [Google Scholar] [CrossRef] [PubMed]
- Kuiper, E.J.; Van Nieuwenhoven, F.A.; de Smet, M.D.; van Meurs, J.C.; Tanck, M.W.; Oliver, N.; Klaassen, I.; Van Noorden, C.J.F.F.; Goldschmeding, R.; Schlingemann, R.O. The Angio-Fibrotic Switch of VEGF and CTGF in Proliferative Diabetic Retinopathy. PLoS ONE 2008, 3, 1–7. [Google Scholar] [CrossRef] [PubMed]
- Ambati, J.; Fowler, B.J. Mechanisms of Age-Related Macular Degeneration. Neuron 2012, 75, 26–39. [Google Scholar] [CrossRef] [PubMed]
- Lopez, P.F.; Sippy, B.D.; Lambert, H.M.; Thach, A.B.; Hinton, D.R. Transdifferentiated Retinal Pigment Epithelial Cells are Immunoreactive for Vascular Endothelial Growth Factor in Surgically Excised Age-Related Macular Degeneration- Related Choroidal Neovascular Membranes. Investig. Ophthalmol. Vis. Sci. 1996, 37, 855–868. [Google Scholar]
- Graham, K.W.; Chakravarthy, U.; Hogg, R.E.; Muldrew, K.A.; Young, I.S.; Kee, F. Identifying features of early and late age-related macular degeneration. Retina 2018, 38, 1751–1758. [Google Scholar] [CrossRef]
- Willoughby, A.S.; Ying, G.; Toth, C.A.; Maguire, M.G.; Burns, R.E.; Grunwald, J.E.; Daniel, E.; Jaffe, G.J.; Williams, D.F.; Beardsley, S.; et al. Subretinal Hyperreflective Material in the Comparison of Age-Related Macular Degeneration Treatments Trials. Ophthalmology 2015, 122, 1846–1853.e5. [Google Scholar] [CrossRef]
- Daniel, E.; Pan, W.; Ying, G.; Kim, B.J.; Grunwald, J.E.; Ferris, F.L.; Jaffe, G.J.; Toth, C.A.; Martin, D.F.; Fine, S.L.; et al. Development and Course of Scars in the Comparison of Age-Related Macular Degeneration Treatments Trials. Ophthalmology 2018, 125, 1037–1046. [Google Scholar] [CrossRef]
- Cheong, K.X.; Cheung, C.M.G.; Teo, K.Y.C. Review of Fibrosis in Neovascular Age-Related Macular Degeneration. Am. J. Ophthalmol. 2023, 246, 192–222. [Google Scholar] [CrossRef] [PubMed]
- Hogg, R.; Curry, E.; Muldrew, A.; Winder, J.; Stevenson, M.; McClure, M.; Chakravarthy, U. Identification of Lesion Components That Influence Visual Function in Age Related Macular Degeneration. Br. J. Ophthalmol. 2003, 87, 609–614. [Google Scholar] [CrossRef] [PubMed]
- Gillies, M.C.; Campain, A.; Barthelmes, D.; Simpson, J.M.; Arnold, J.J.; Guymer, R.H.; McAllister, I.L.; Essex, R.W.; Morlet, N.; Hunyor, A.P. Long-Term Outcomes of Treatment of Neovascular Age-Related Macular Degeneration: Data from an Observational Study. Ophthalmology 2015, 122, 1837–1845. [Google Scholar] [CrossRef]
- Baumann, B.; Choi, W.; Potsaid, B.; Huang, D.; Duker, J.S.; Fujimoto, J.G. Swept Source/Fourier Domain Polarization Sensitive Optical Coherence Tomography with a Passive Polarization Delay Unit. Opt. Express 2012, 20, 10229. [Google Scholar] [CrossRef]
- Matsuzaki, M.; Mandai, M.; Yamanari, M.; Totani, K.; Nishida, M.; Sugita, S.; Maeda, T.; Koide, N.; Takagi, S.; Hirami, Y.; et al. Polarization-Sensitive Optical Coherence Tomography for Estimating Relative Melanin Content of Autologous Induced Stem-Cell Derived Retinal Pigment Epithelium. Sci. Rep. 2020, 10, 7656. [Google Scholar] [CrossRef]
- Hong, Y.-J.; Miura, M.; Ju, M.J.; Makita, S.; Iwasaki, T.; Yasuno, Y. Simultaneous Investigation of Vascular and Retinal Pigment Epithelial Pathologies of Exudative Macular Diseases by Multifunctional Optical Coherence Tomography. Investig. Opthalmol. Vis. Sci. 2014, 55, 5016. [Google Scholar] [CrossRef] [PubMed]
- Jaspers, M.E.H.; Feroldi, F.; Vlig, M.; de Boer, J.F.; van Zuijlen, P.P.M. In Vivo Polarization-Sensitive Optical Coherence Tomography of Human Burn Scars: Birefringence Quantification and Correspondence with Histologically Determined Collagen Density. J. Biomed. Opt. 2017, 22, 1. [Google Scholar] [CrossRef]
- Roberts, P.; Sugita, M.; DeáK, G.; Baumann, B.; Zotter, S.; Pircher, M.; Sacu, S.; Hitzenberger, C.K.; Schmidt-Erfurth, U. Automated Identification and Quantification of Subretinal Fibrosis in Neovascular Age-Related Macular Degeneration Using Polarization-Sensitive OCT. Invest. Ophthalmol. Vis. Sci. 2016, 57, 1699–1705. [Google Scholar] [CrossRef]
- Gräfe, M.G.O.; van de Kreeke, J.A.; Willemse, J.; Braaf, B.; de Jong, Y.; Tan, H.S.; Verbraak, F.D.; de Boer, J.F. Subretinal Fibrosis Detection Using Polarization Sensitive Optical Coherence Tomography. Transl. Vis. Sci. Technol. 2020, 9, 13. [Google Scholar] [CrossRef]
- Motschi, A.R.; Roberts, P.K.; Desissaire, S.; Schranz, M.; Schwarzhans, F.; Bogunović, H.; Pircher, M.; Hitzenberger, C.K. Identification and Quantification of Fibrotic Areas in the Human Retina Using Polarization-Sensitive OCT. Biomed. Opt. Express 2021, 12, 4380–4400. [Google Scholar] [CrossRef]
- Miura, M.; Makita, S.; Yasuno, Y.; Tsukahara, R.; Usui, Y.; Rao, N.A.; Ikuno, Y.; Uematsu, S.; Agawa, T.; Iwasaki, T.; et al. Polarization-Sensitive Optical Coherence Tomographic Documentation of Choroidal Melanin Loss in Chronic Vogt-Koyanagi-Harada Disease. Invest. Ophthalmol. Vis. Sci. 2017, 58, 4467–4476. [Google Scholar] [CrossRef] [PubMed]
- Balasubramanian, S.; Uji, A.; Lei, J.; Velaga, S.; Nittala, M.; Sadda, S. Interdevice Comparison of Retinal Sensitivity Assessments in a Healthy Population: The CenterVue MAIA and the Nidek MP-3 Microperimeters. Br. J. Ophthalmol. 2018, 102, 109–113. [Google Scholar] [CrossRef] [PubMed]
- Sulzbacher, F.; Roberts, P.; Munk, M.R.; Kaider, A.; Kroh, M.E.; Sacu, S.; Schmidt-Erfurth, U. Relationship of Retinal Morphology and Retinal Sensitivity in the Treatment of Neovascular Age-Related Macular Degeneration Using Aflibercept. Investig. Ophthalmol. Vis. Sci. 2015, 56, 1158–1167. [Google Scholar] [CrossRef] [PubMed]
- Roberts, P.K.; Schranz, M.; Motschi, A.; Desissaire, S.; Hacker, V.; Pircher, M.; Sacu, S.; Buehl, W.; Hitzenberger, C.K.; Schmidt-Erfurth, U. Morphologic and Microvascular Differences between Macular Neovascularization with and without Subretinal Fibrosis. Transl. Vis. Sci. Technol. 2021, 10, 1. [Google Scholar] [CrossRef] [PubMed]
- Tenbrock, L.; Wolf, J.; Boneva, S.; Schlecht, A.; Agostini, H.; Wieghofer, P.; Schlunck, G.; Lange, C. Subretinal Fibrosis in Neovascular Age-Related Macular Degeneration: Current Concepts, Therapeutic Avenues, and Future Perspectives. Cell Tissue Res. 2021, 387, 361–375. [Google Scholar] [CrossRef]
- Cheung, C.M.G.; Grewal, D.S.; Teo, K.Y.C.; Gan, A.; Mohla, A.; Chakravarthy, U.; Wong, T.Y.; Jaffe, G.J. The Evolution of Fibrosis and Atrophy and Their Relationship with Visual Outcomes in Asian Persons with Neovascular Age-Related Macular Degeneration. Ophthalmol. Retin. 2019, 3, 1045–1055. [Google Scholar] [CrossRef]
- Bachmeier, I.; Armendariz, B.G.; Yu, S.; Jäger, R.J.; Ebneter, A.; Glittenberg, C.; Pauleikhoff, D.; Sadda, S.V.R.; Chakravarthy, U.; Fauser, S. Fibrosis in Neovascular Age-Related Macular Degeneration: A Review of Definitions Based on Clinical Imaging. Surv. Ophthalmol. 2023, 68, 835–848. [Google Scholar] [CrossRef]
- Desissaire, S.; Pollreisz, A.; Sedova, A.; Hajdu, D.; Datlinger, F.; Steiner, S.; Vass, C.; Schwarzhans, F.; Fischer, G.; Pircher, M.; et al. Analysis of Retinal Nerve Fiber Layer Birefringence in Patients with Glaucoma and Diabetic Retinopathy by Polarization Sensitive OCT. Biomed. Opt. Express 2020, 11, 5488. [Google Scholar] [CrossRef]
- Yamanari, M.; Mase, M.; Obata, R.; Matsuzaki, M.; Minami, T.; Takagi, S.; Yamamoto, M.; Miyamoto, N.; Ueda, K.; Koide, N.; et al. Melanin Concentration and Depolarization Metrics Measurement by Polarization-Sensitive Optical Coherence Tomography. Sci. Rep. 2020, 10, 19513. [Google Scholar] [CrossRef] [PubMed]
- Spaide, R.F.; Jaffe, G.J.; Sarraf, D.; Freund, K.B.; Sadda, S.R.; Staurenghi, G.; Waheed, N.K.; Chakravarthy, U.; Rosenfeld, P.J.; Holz, F.G.; et al. Consensus Nomenclature for Reporting Neovascular Age-Related Macular Degeneration Data Consensus on Neovascular Age-Related Macular Degeneration Nomenclature Study Group. Ophthalmology 2020, 127, 616–636. [Google Scholar] [CrossRef] [PubMed]
- Toth, C.A.; Tai, V.; Pistilli, M.; Chiu, S.J.; Winter, K.P.; Daniel, E.; Grunwald, J.E.; Jaffe, G.J.; Martin, D.F.; Ying, G.S.; et al. Distribution of OCT Features within Areas of Macular Atrophy or Scar after Two Years of Anti-VEGF Treatment for Neovascular AMD in CATT. Ophthalmol. Retin. 2019, 3, 316. [Google Scholar] [CrossRef] [PubMed]
- Adrean, S.D.; Morgenthien, E.; Ghanekar, A.; Ali, F.S. Subretinal Fibrosis in HARBOR Varies by Choroidal Neovascularization Subtype. Ophthalmol. Retin. 2020, 4, 752–754. [Google Scholar] [CrossRef] [PubMed]
- Wu, C.Y.; Brooks, H.L.; Davis, J.L. Subretinal Exudation and Fibrosis in Relentless Placoid Chorioretinitis. Am. J. Ophthalmol. 2022, 243, e3–e4. [Google Scholar] [CrossRef] [PubMed]
- Fang, M.; Chanwimol, K.; Maram, J.; Datoo O’Keefe, G.A.; Wykoff, C.C.; Sarraf, D.; Brown, A.; Lampen, S.I.R.; Zhou, B.; Rusakevich, A.M.; et al. Morphological Characteristics of Eyes with Neovascular Age-Related Macular Degeneration and Good Long-Term Visual Outcomes after Anti-VEGF Therapy. Br. J. Ophthalmol. 2023, 107, 399–405. [Google Scholar] [CrossRef]
- Finn, A.P.; Pistilli, M.; Tai, V.; Daniel, E.; Ying, G.S.; Maguire, M.G.; Grunwald, J.E.; Martin, D.F.; Jaffe, G.J.; Toth, C.A. Localized Optical Coherence Tomography Precursors of Macular Atrophy and Fibrotic Scar in the Comparison of Age-Related Macular Degeneration Treatments Trials. Am. J. Ophthalmol. 2021, 223, 338–347. [Google Scholar] [CrossRef]
- Toth, C.A.; Tai, V.; Chiu, S.J.; Winter, K.; Sevilla, M.B.; Daniel, E.; Grunwald, J.E.; Jaffe, G.J.; Martin, D.F.; Ying, G.S.; et al. Linking OCT, Angiographic, and Photographic Lesion Components in Neovascular Age-Related Macular Degeneration. Ophthalmol. Retin. 2018, 2, 481–493. [Google Scholar] [CrossRef]
- Obata, R.; Yoshinaga, A.; Yamamoto, M.; Komatsu, K.; Aoki, N.; Yamanari, M.; Sugiyama, S.; Minami, T.; Azuma, K.; Inoue, T.; et al. Imaging of a Retinal Pigment Epithelium Aperture Using Polarization-Sensitive Optical Coherence Tomography. Jpn. J. Ophthalmol. 2021, 65, 30–41. [Google Scholar] [CrossRef]
- Cense, B.; Miller, D.T.; King, B.J.; Theelen, T.; Elsner, A.E. Measuring Polarization Changes in the Human Outer Retina with Polarization-Sensitive Optical Coherence Tomography. J. Biophotonics 2018, 11, e201700134. [Google Scholar] [CrossRef]
- Ishikawa, K.; Kannan, R.; Hinton, D.R. Molecular Mechanisms of Subretinal Fibrosis in Age-Related Macular Degeneration. Exp. Eye Res. 2016, 142, 19–25. [Google Scholar] [CrossRef] [PubMed]

| General Data | |
|---|---|
| Number of patients | 30 (15 males, 15 females) |
| Mean BCVA | 60.2 ± 23.7 letters |
| Age | 76.7 ± 6.3 years |
| Treatment Duration | 3.7 ± 2.4 years |
| Numbers of anti-VEGF injections | 14.3 ± 6.9 injections |
| MNV in the fellow eye | 14 patients (46.7%) |
| MNV type I | 18 (60%) eyes |
| MNV type II | 4 (13.3%) eyes |
| MNV type I + II | 7 (20.3%) eyes |
| MNV type III | 1 (3.3%) eye |
| Color Fundus Photography | Standard OCT | Polarization Sensitive OCT | ||||||
|---|---|---|---|---|---|---|---|---|
| Parameter | Estimate | p-Value | Parameter | Estimate | p-Value | Parameter | Estimate | p-Value |
| Constant term | +21.5 | 0.349 | Constant term | +19.41 | <0.001 | Constant term | +18.75 | <0.001 |
| Degree of center | +0.29 | <0.001 | Degree of center | +0.46 | <0.001 | Degree of center | +0.54 | <0.001 |
| Presence of fibrosis | −13.08 | <0.001 | Presence of SHRM | −8.99 | <0.001 | Presence of Bi-refringence | −11.56 | <0.001 |
| Interaction Presence of fibrosis * degree of center | +0.52 | 0.001 | Interaction Presence of SHRM and degree of center | −0.24 | 0.258 | Interaction Bi-refringence and degree of center | +0.20 | 0.428 |
| Mean (Decibel) | 95% Confidence Intervall (Decibel) | |
|---|---|---|
| Fibrosis in 3 modalities | 7.2 | 4.6–9.8 |
| Fibrosis in 2 modalities | 10.1 | 7.7–12.4 |
| Fibrosis in 1 modality | 15.3 | 13.2–17.4 |
| Fibrosis in 0 modality | 23.3 | 21.4–24.2 |
| Difference of Means | Significance | ||
|---|---|---|---|
| Fibrosis in 3 modalities | Fibrosis in 2 modalities | −2.9 | 0.060 |
| Fibrosis in 1 modality | −8.1 | <0.001 | |
| Fibrosis in 0 modality | −16.1 | <0.001 | |
| Fibrosis in 2 modalities | Fibrosis in 3 modalities | 2.9 | 0.060 |
| Fibrosis in 1 modality | −5.2 | <0.001 | |
| Fibrosis in 0 modality | −13.2 | <0.001 | |
| Fibrosis in 1 modality | Fibrosis in 3 modalities | 8.1 | <0.001 |
| Fibrosis in 2 modalities | 5.2 | <0.001 | |
| Fibrosis in 0 modality | −8.0 | <0.001 | |
| Fibrosis in 0 modality | Fibrosis in 3 modalities | 16.1 | <0.001 |
| Fibrosis in 2 modalities | 13.2 | <0.001 | |
| Fibrosis in 1 modality | 8.0 | <0.001 |
Disclaimer/Publisher’s Note: The statements, opinions and data contained in all publications are solely those of the individual author(s) and contributor(s) and not of MDPI and/or the editor(s). MDPI and/or the editor(s) disclaim responsibility for any injury to people or property resulting from any ideas, methods, instructions or products referred to in the content. |
© 2024 by the authors. Licensee MDPI, Basel, Switzerland. This article is an open access article distributed under the terms and conditions of the Creative Commons Attribution (CC BY) license (https://creativecommons.org/licenses/by/4.0/).
Share and Cite
Schranz, M.; Sacu, S.; Reiter, G.S.; Baratsits, M.; Desissaire, S.; Pircher, M.; Mylonas, G.; Hitzenberger, C.; Schmidt-Erfurth, U.; Roberts, P.K. Structure-Function Correlation of Retinal Fibrosis in Eyes with Neovascular Age-Related Macular Degeneration. J. Clin. Med. 2024, 13, 1074. https://doi.org/10.3390/jcm13041074
Schranz M, Sacu S, Reiter GS, Baratsits M, Desissaire S, Pircher M, Mylonas G, Hitzenberger C, Schmidt-Erfurth U, Roberts PK. Structure-Function Correlation of Retinal Fibrosis in Eyes with Neovascular Age-Related Macular Degeneration. Journal of Clinical Medicine. 2024; 13(4):1074. https://doi.org/10.3390/jcm13041074
Chicago/Turabian StyleSchranz, Markus, Stefan Sacu, Gregor S. Reiter, Magdalena Baratsits, Silvia Desissaire, Michael Pircher, Georgios Mylonas, Christoph Hitzenberger, Ursula Schmidt-Erfurth, and Philipp Ken Roberts. 2024. "Structure-Function Correlation of Retinal Fibrosis in Eyes with Neovascular Age-Related Macular Degeneration" Journal of Clinical Medicine 13, no. 4: 1074. https://doi.org/10.3390/jcm13041074
APA StyleSchranz, M., Sacu, S., Reiter, G. S., Baratsits, M., Desissaire, S., Pircher, M., Mylonas, G., Hitzenberger, C., Schmidt-Erfurth, U., & Roberts, P. K. (2024). Structure-Function Correlation of Retinal Fibrosis in Eyes with Neovascular Age-Related Macular Degeneration. Journal of Clinical Medicine, 13(4), 1074. https://doi.org/10.3390/jcm13041074