
Accuracy of Artificial Intelligence-Based Technologies for the Diagnosis of Atrial Fibrillation: A Systematic Review and Meta-Analysis


 ,
,  ,
, 

Abstract
:
1. Introduction
2. Materials and Methods
2.1. Inclusion and Exclusion Criteria
2.2. Data Sources and Search Strategy
2.3. Screening
2.4. Data Extraction
2.5. Assessment of Risk of Bias and Applicability
2.6. Statistical Analysis
3. Results
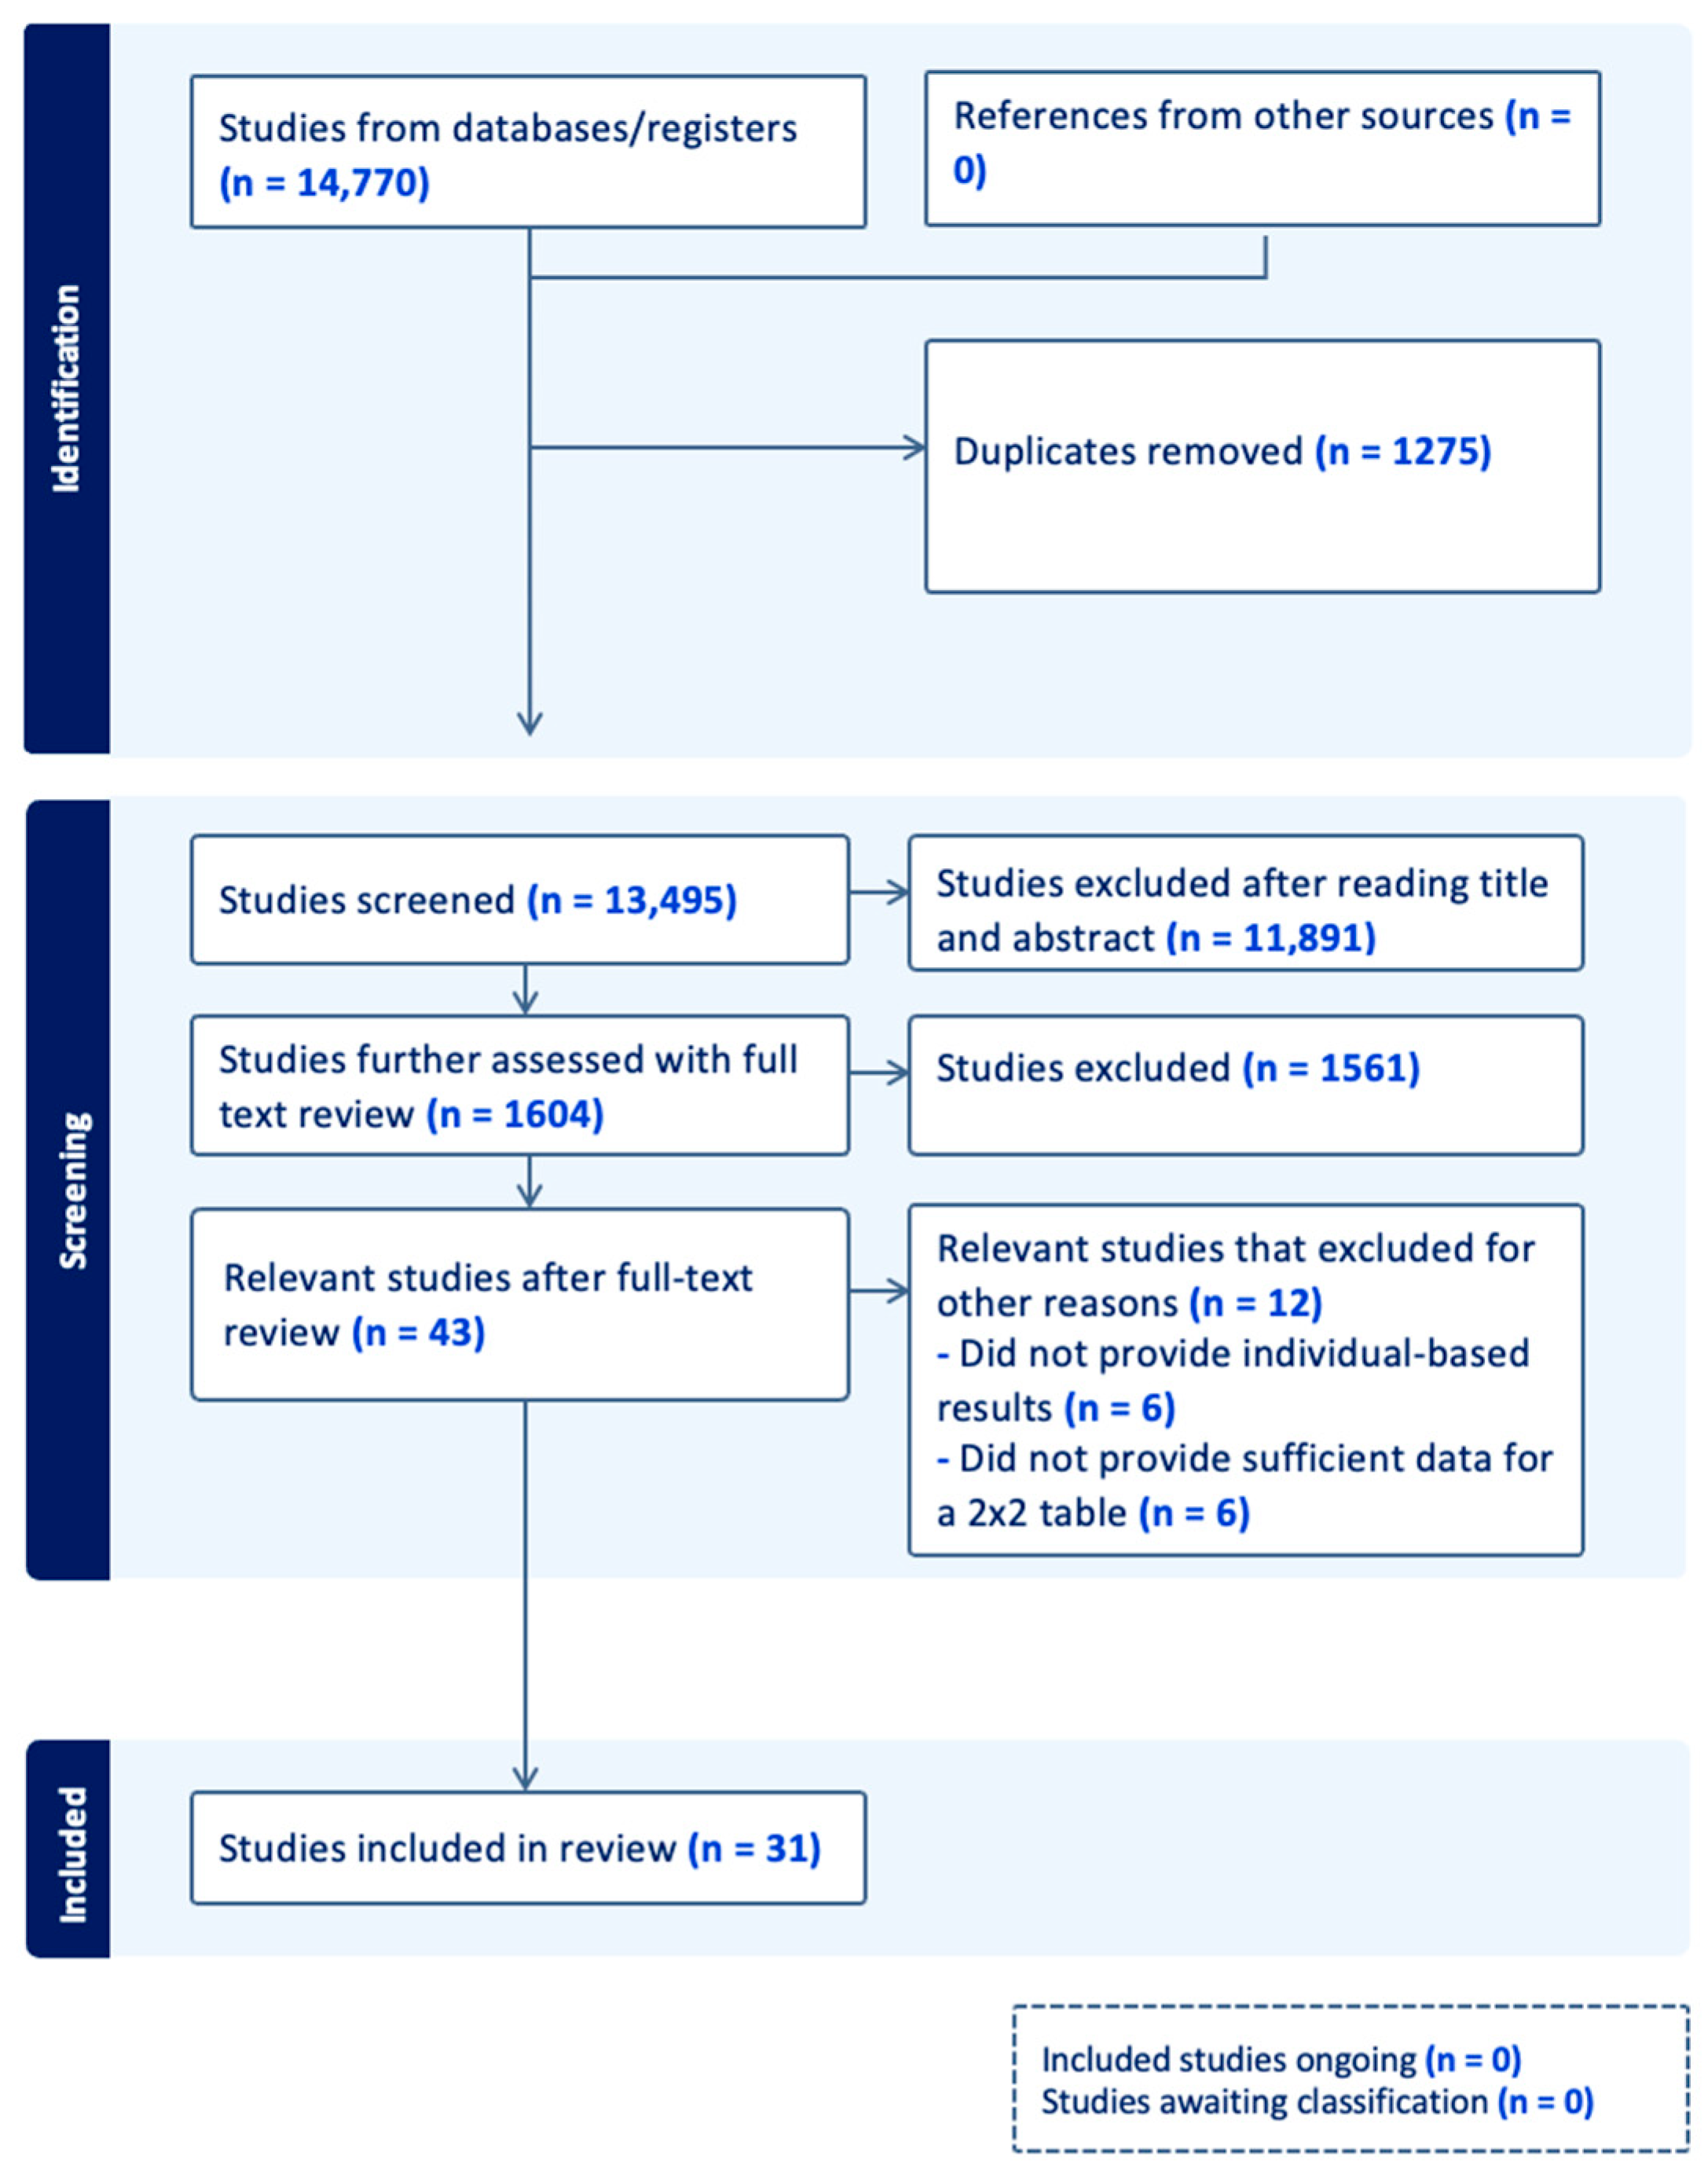
3.1. Study Selection
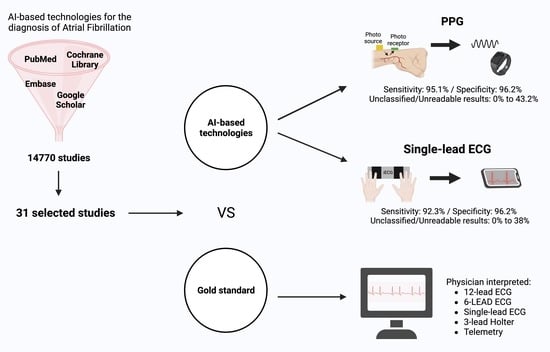
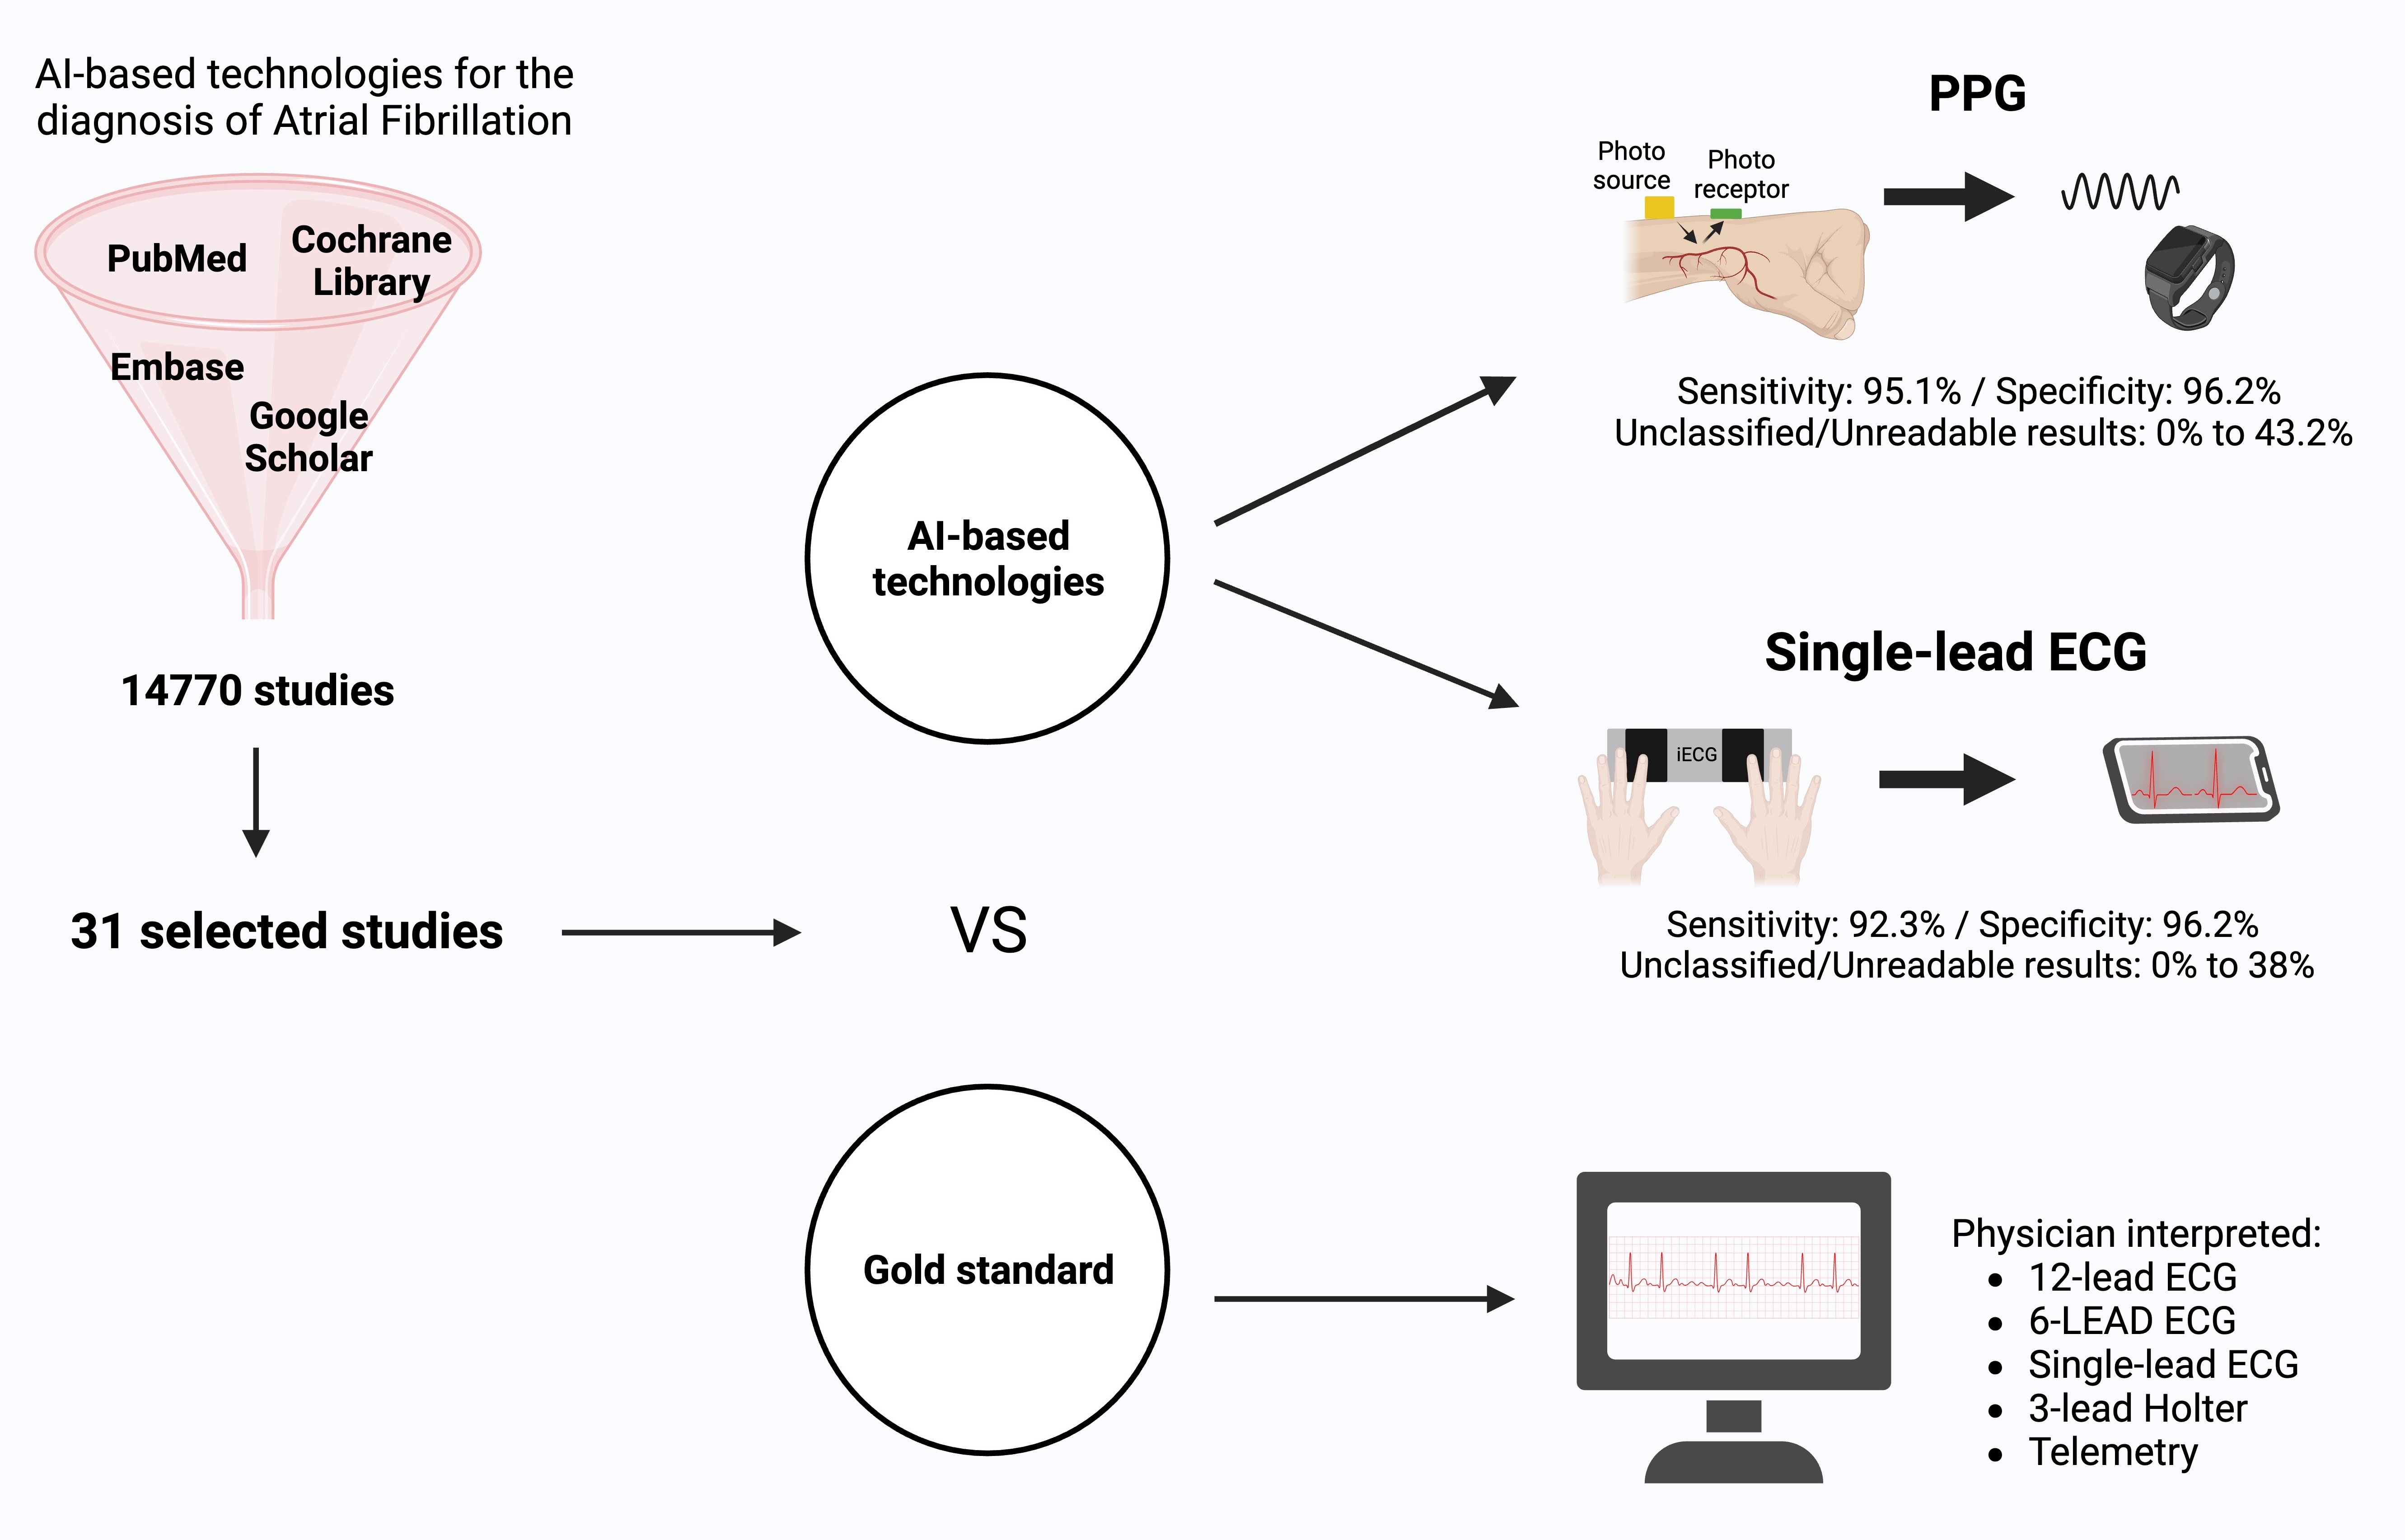
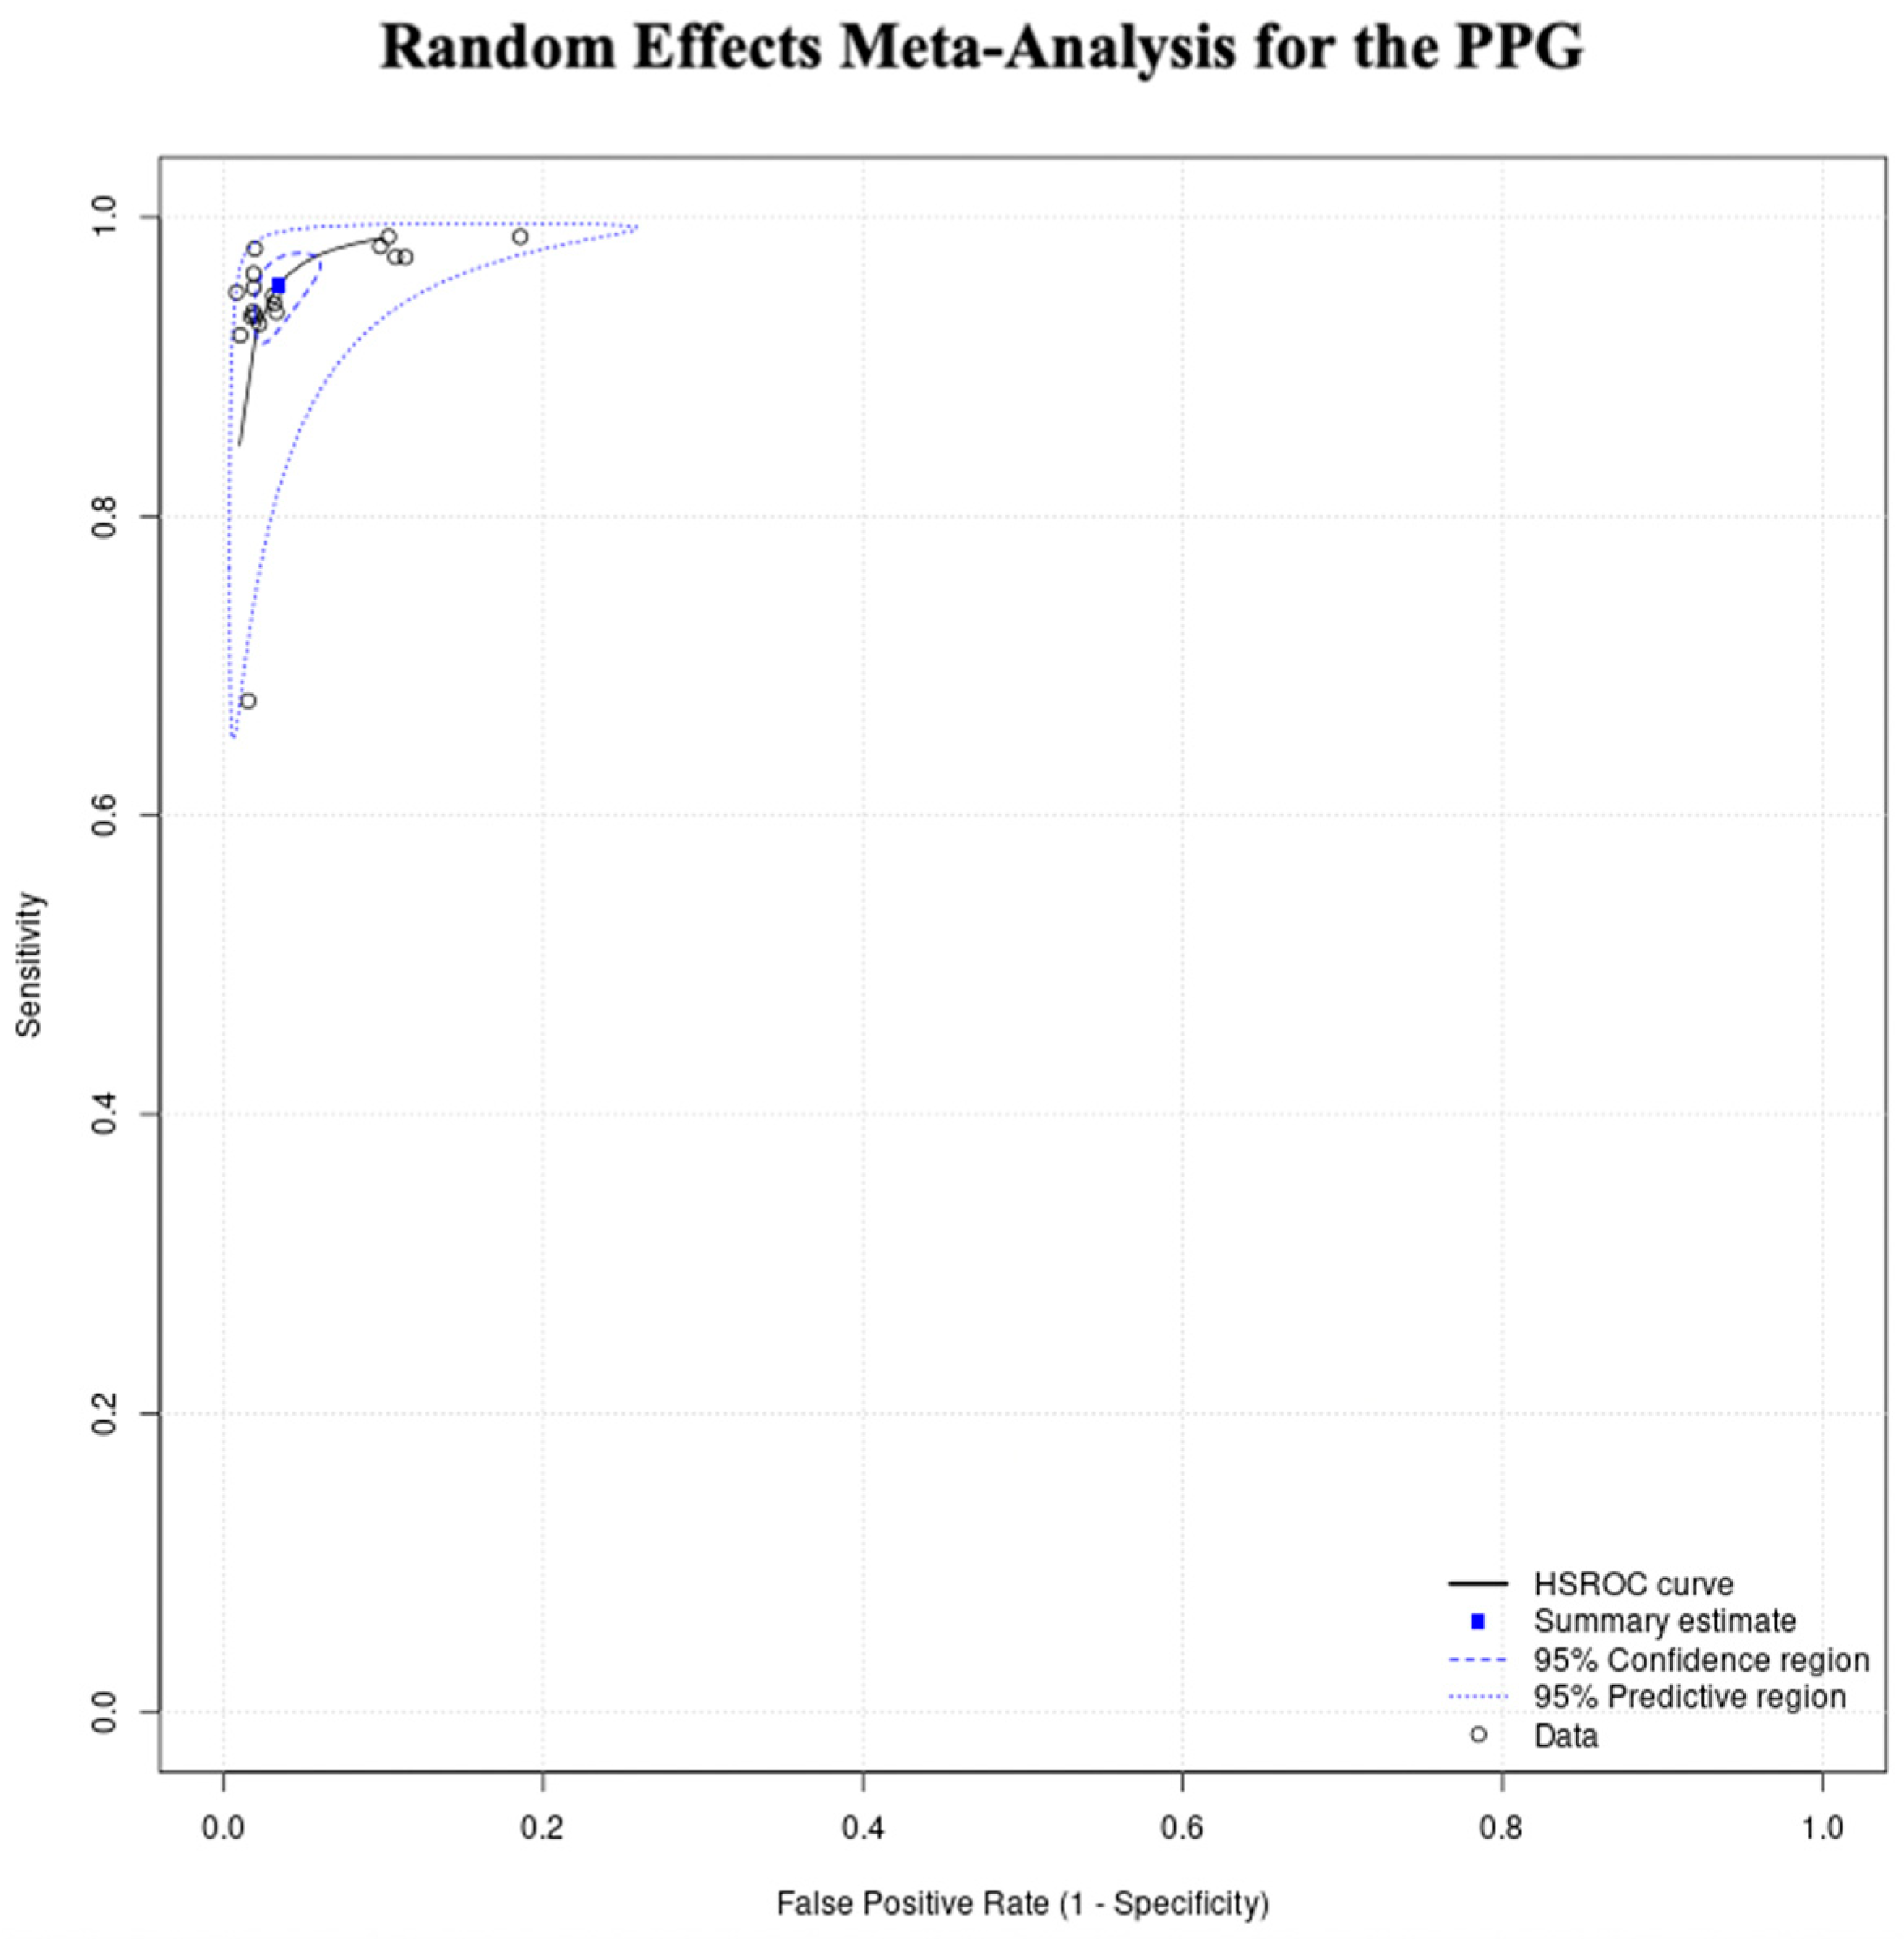
3.2. Diagnostic Performance of Photoplethysmography (PPG) Devices
3.2.1. Study Characteristics of PPG Studies
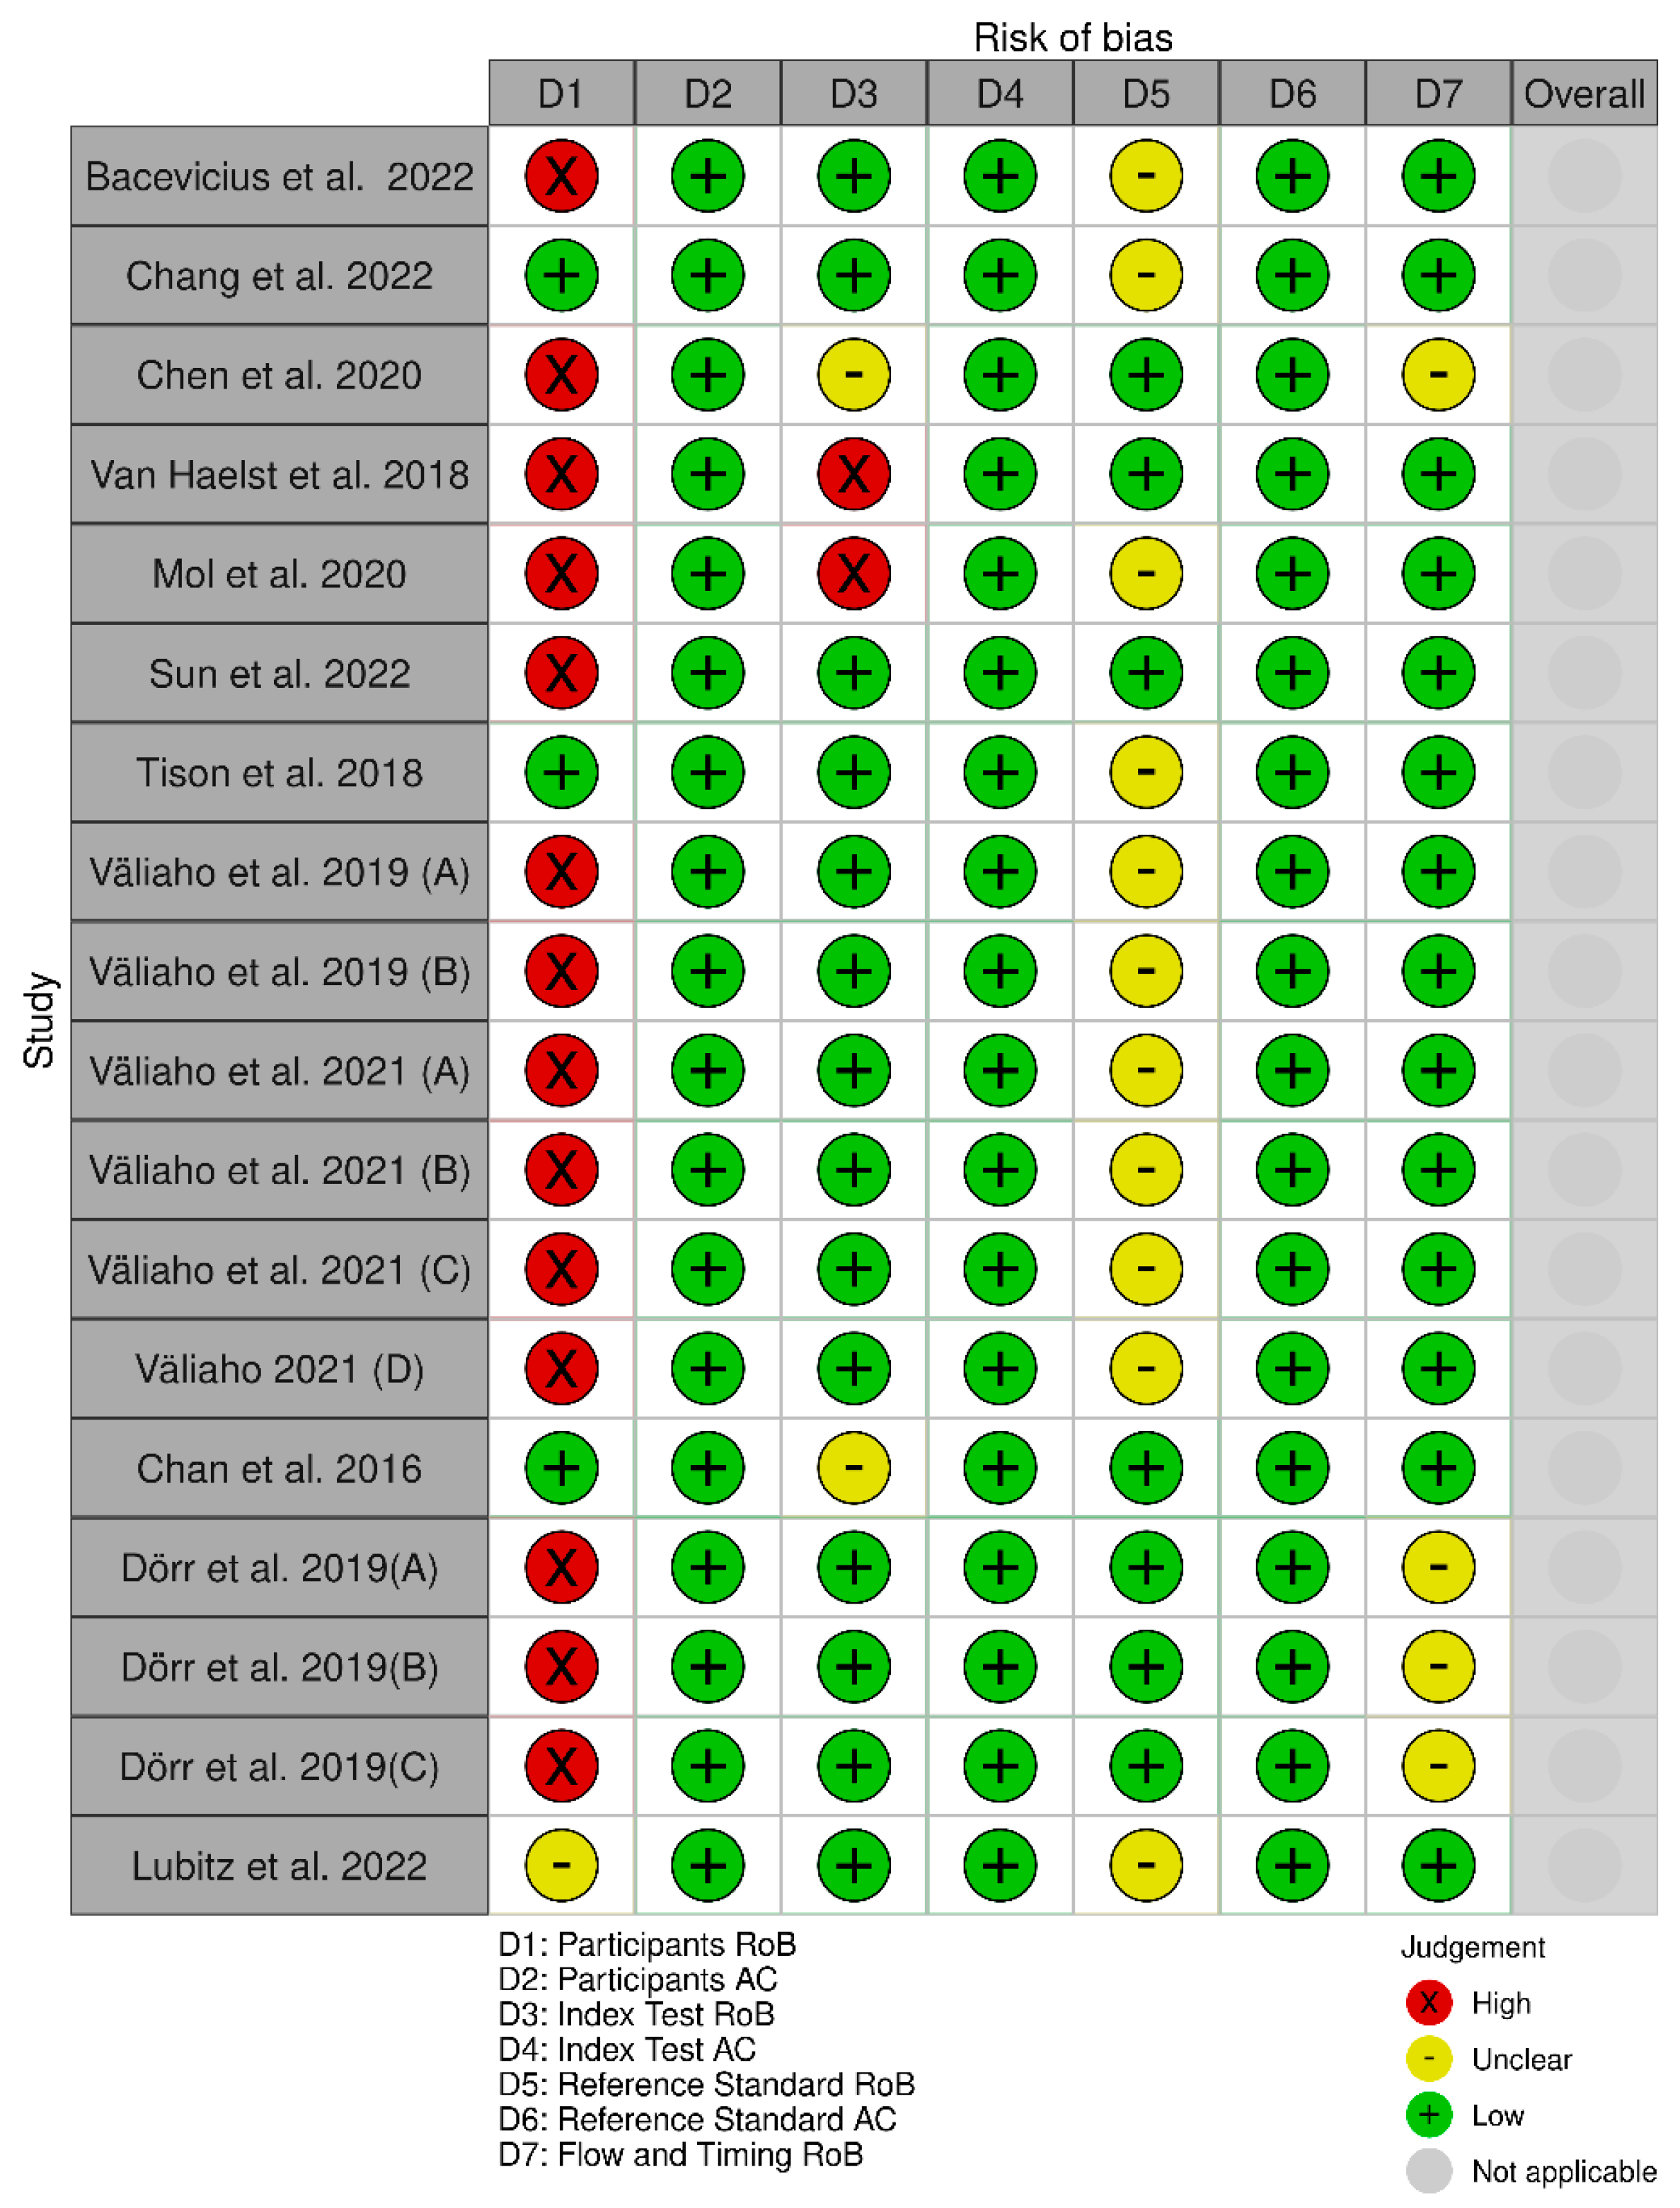
3.2.2. Assessment of Risk of Bias and Applicability of PPG Studies
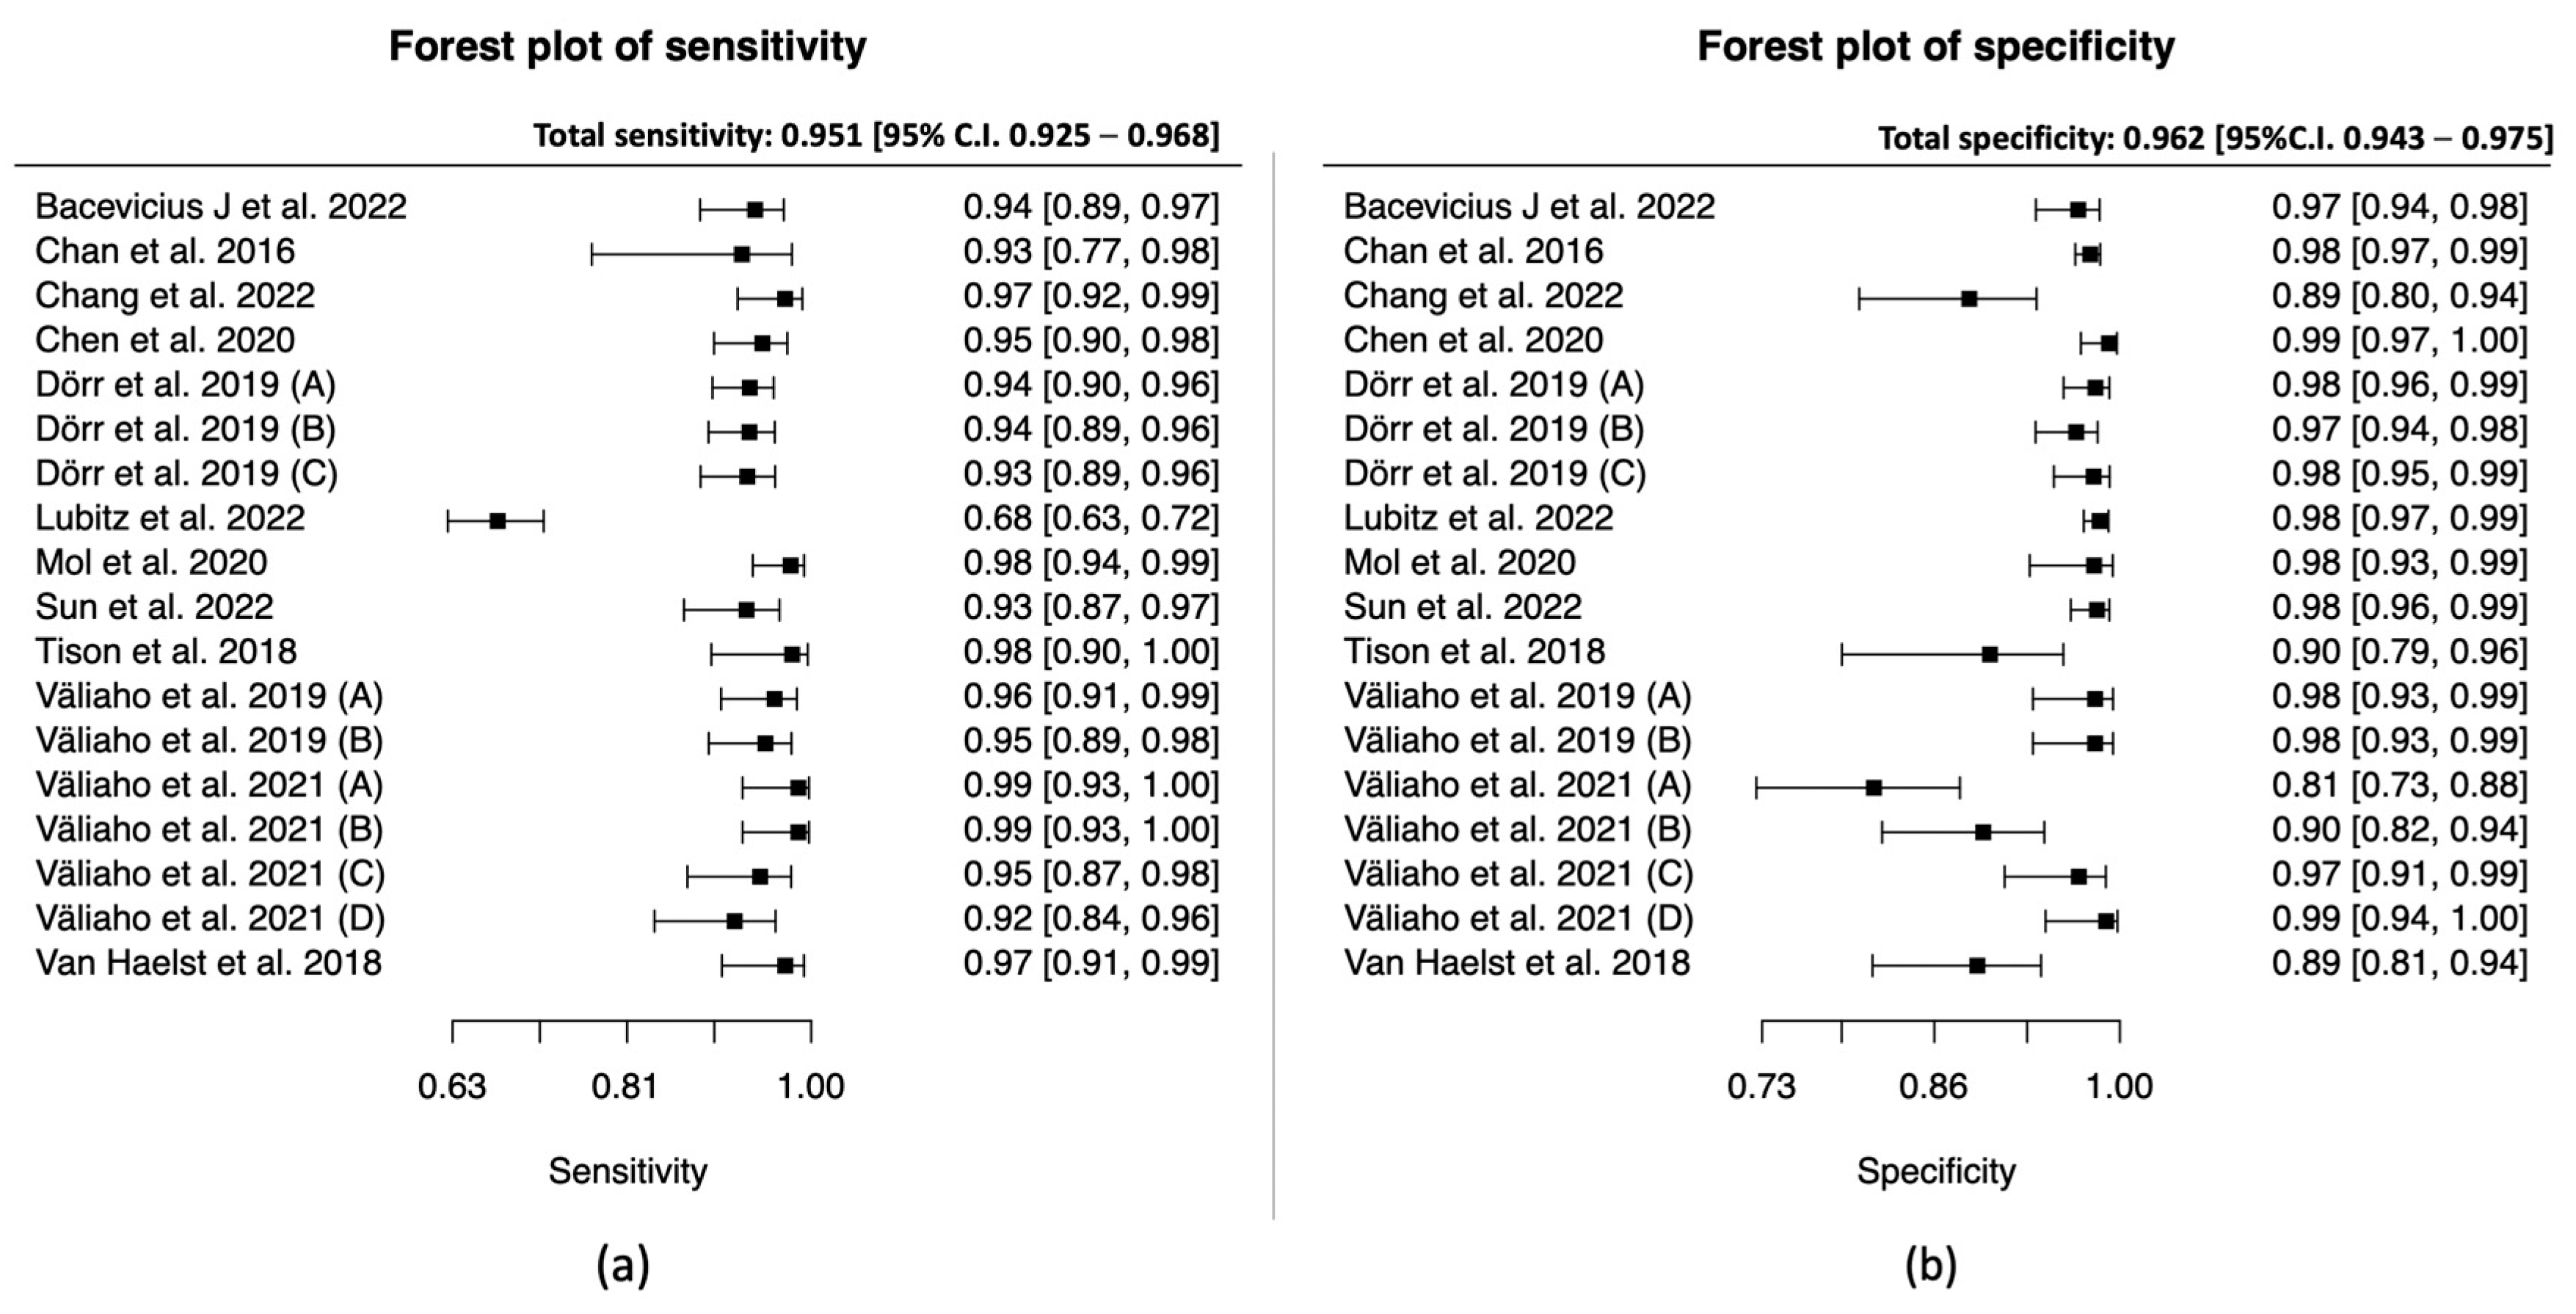
3.2.3. Data Synthesis of the PPG Studies
3.2.4. Subgroup Analysis (Inpatients vs. Outpatients) of the PPG Studies
3.2.5. Unclassified Unreadable Results of the PPG Studies
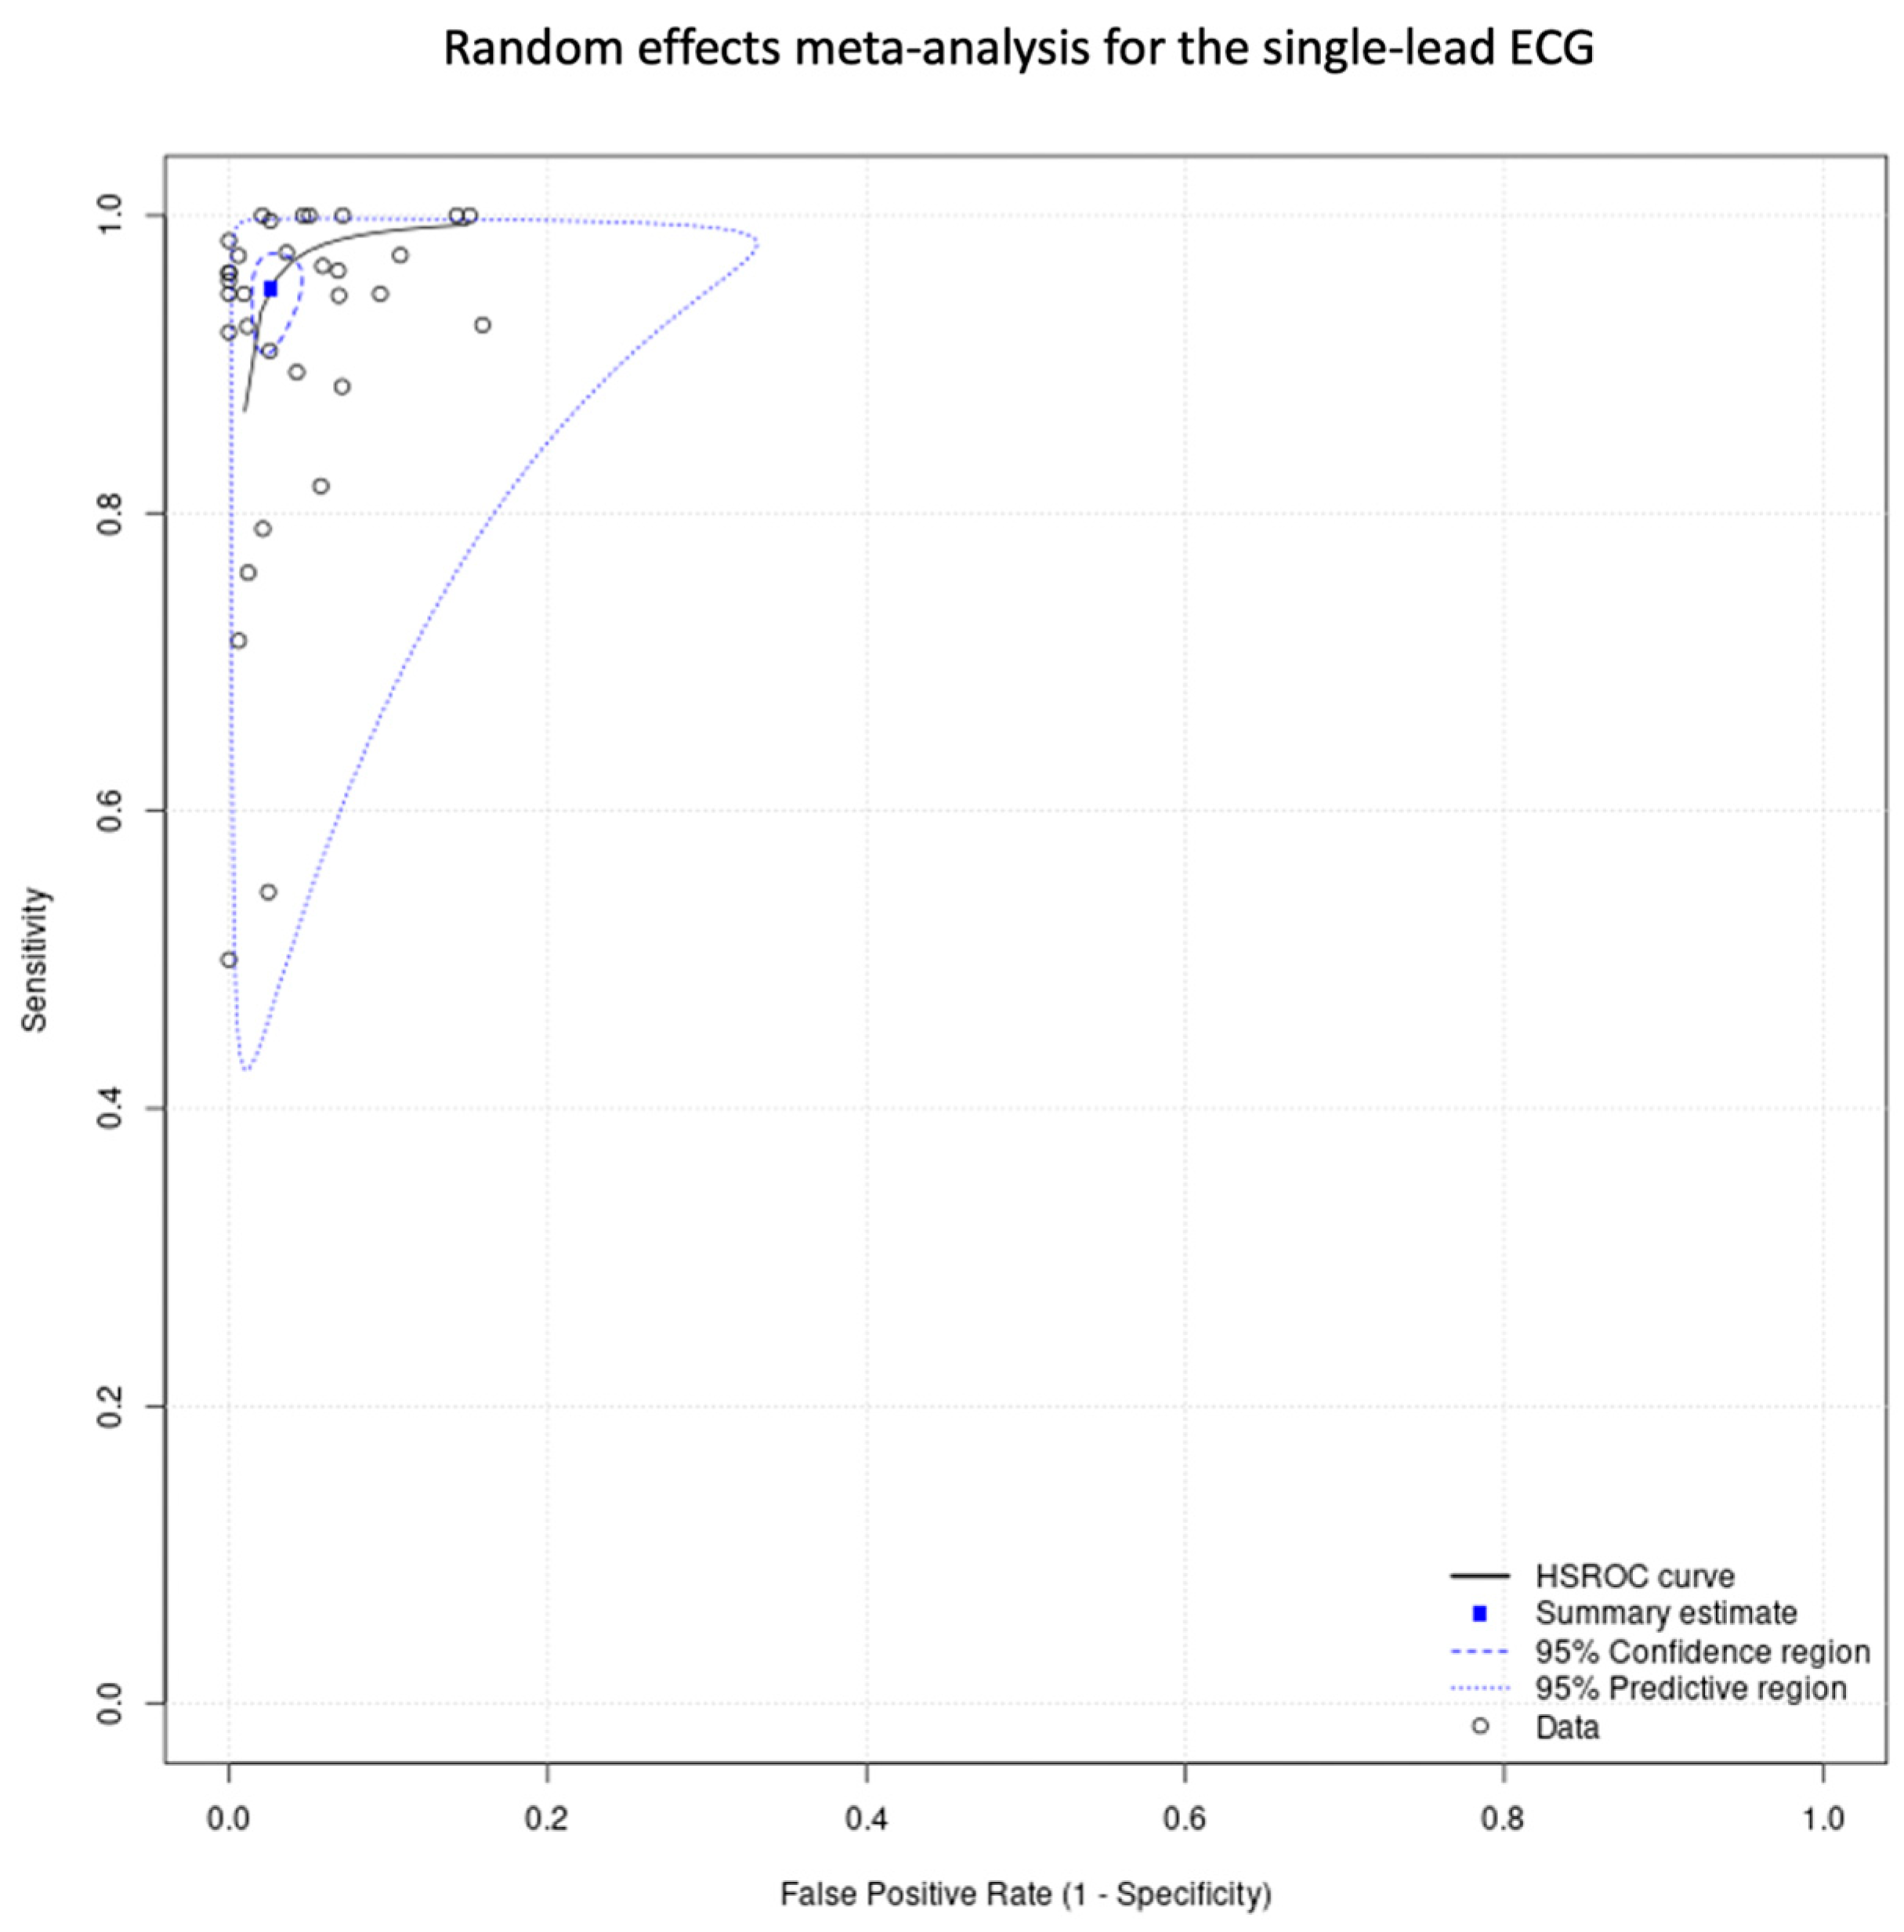
3.3. Diagnostic Performance of Single-Lead ECG Devices
3.3.1. Study Characteristics of the Single-Lead ECG Studies
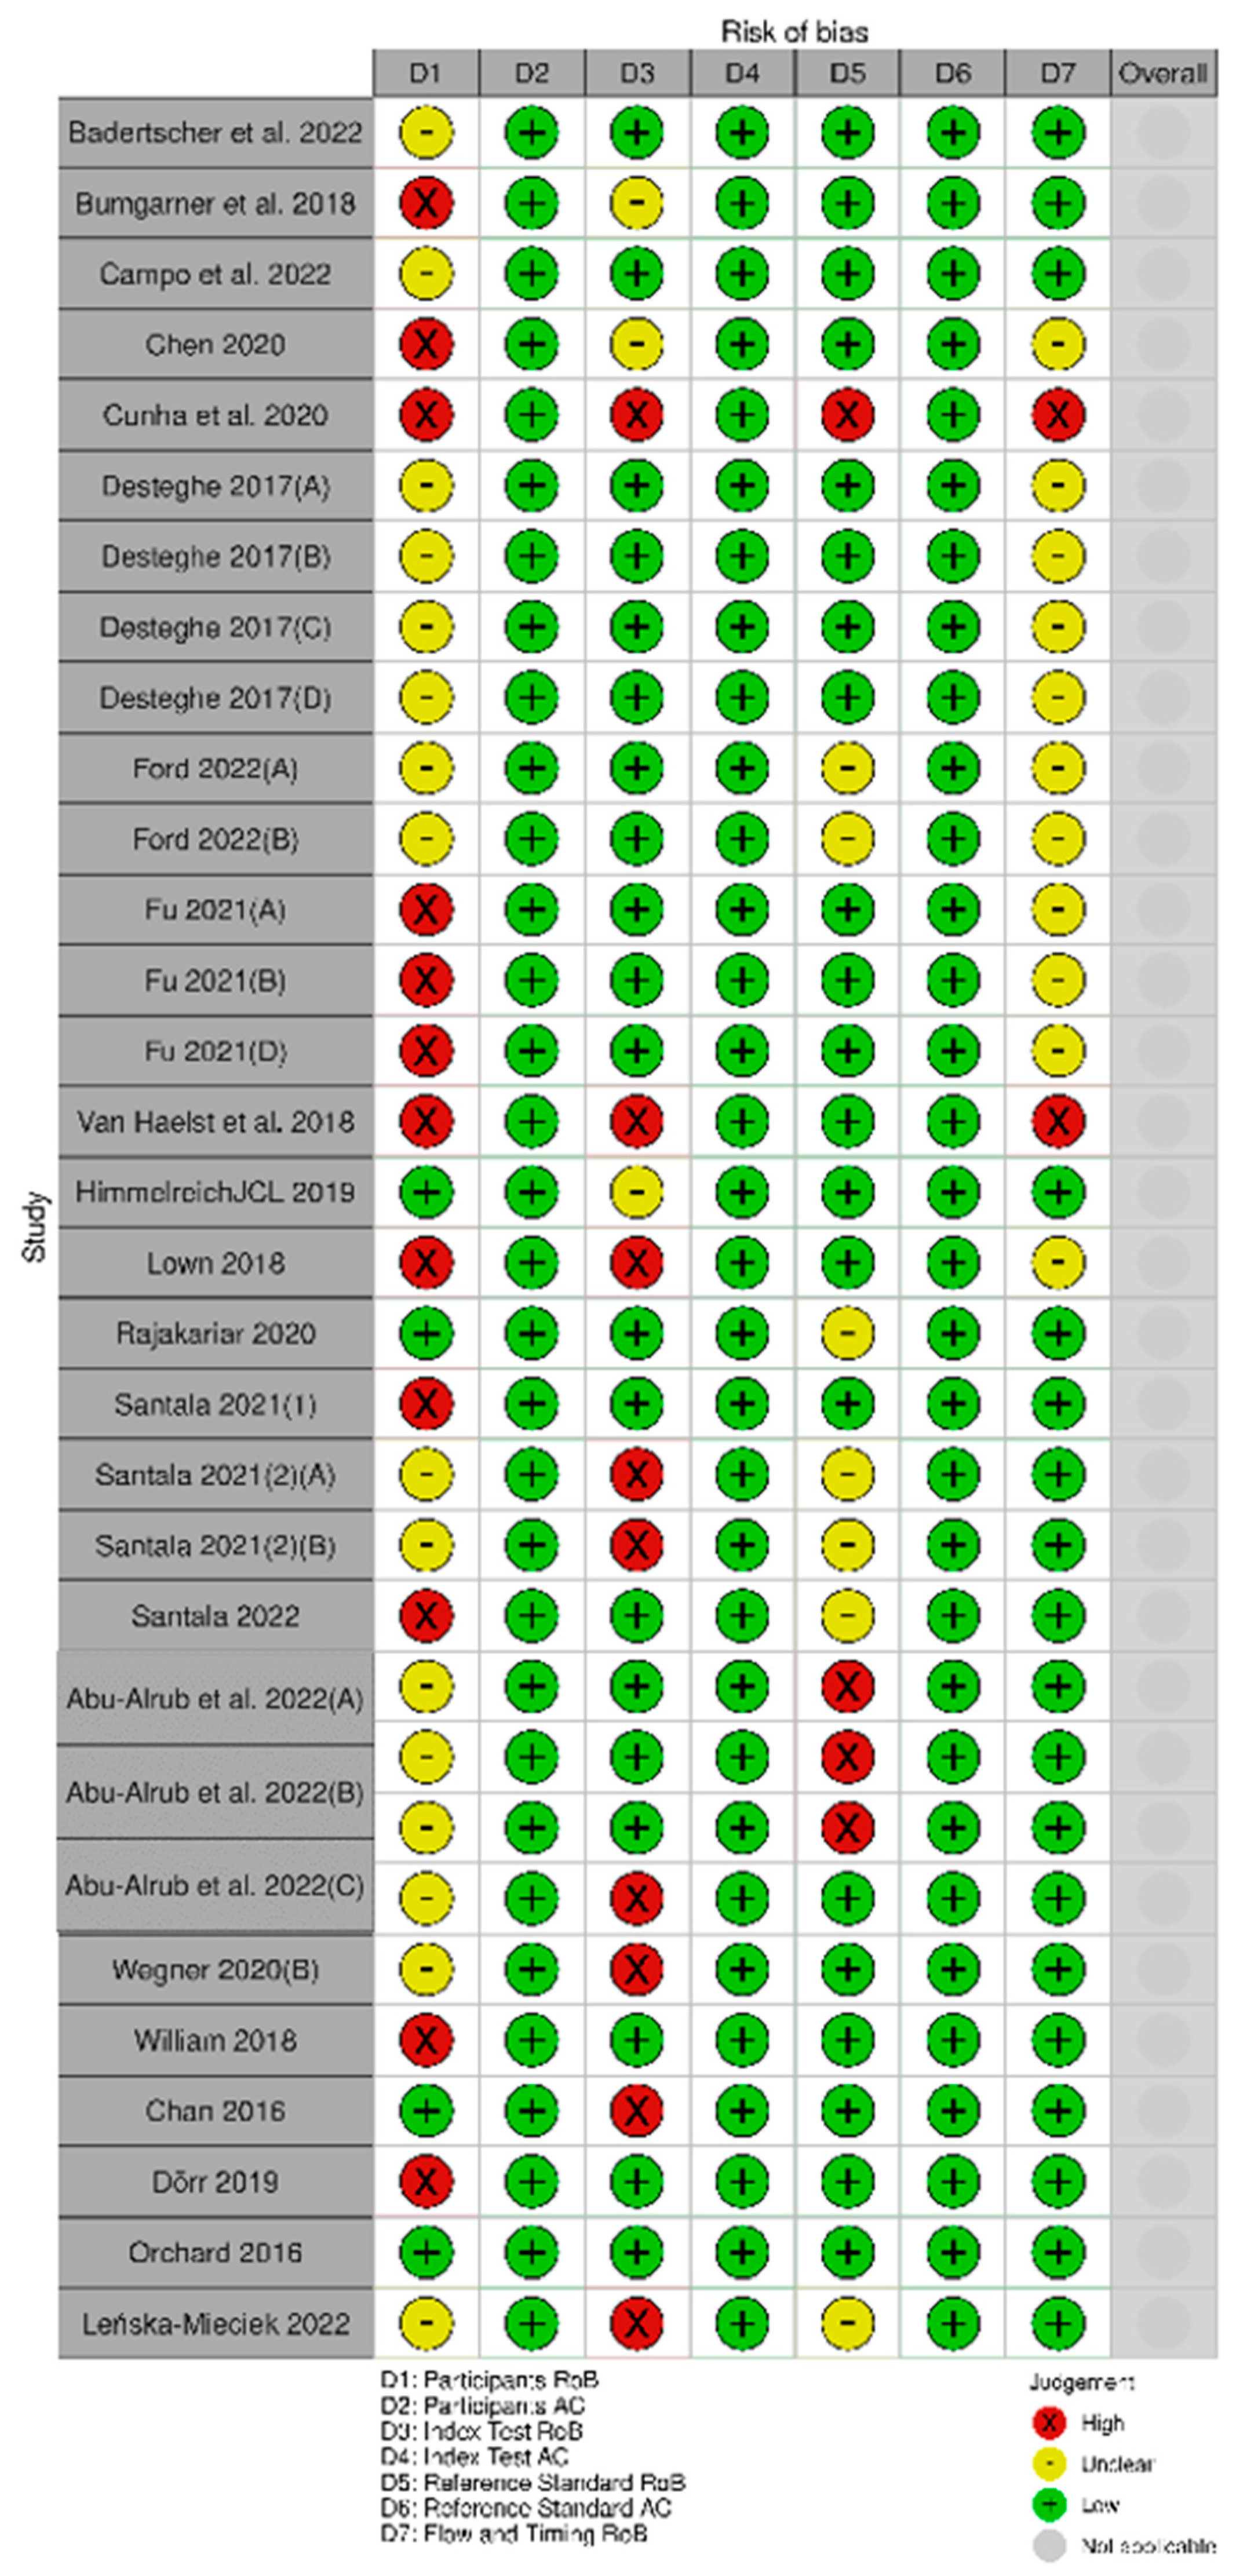
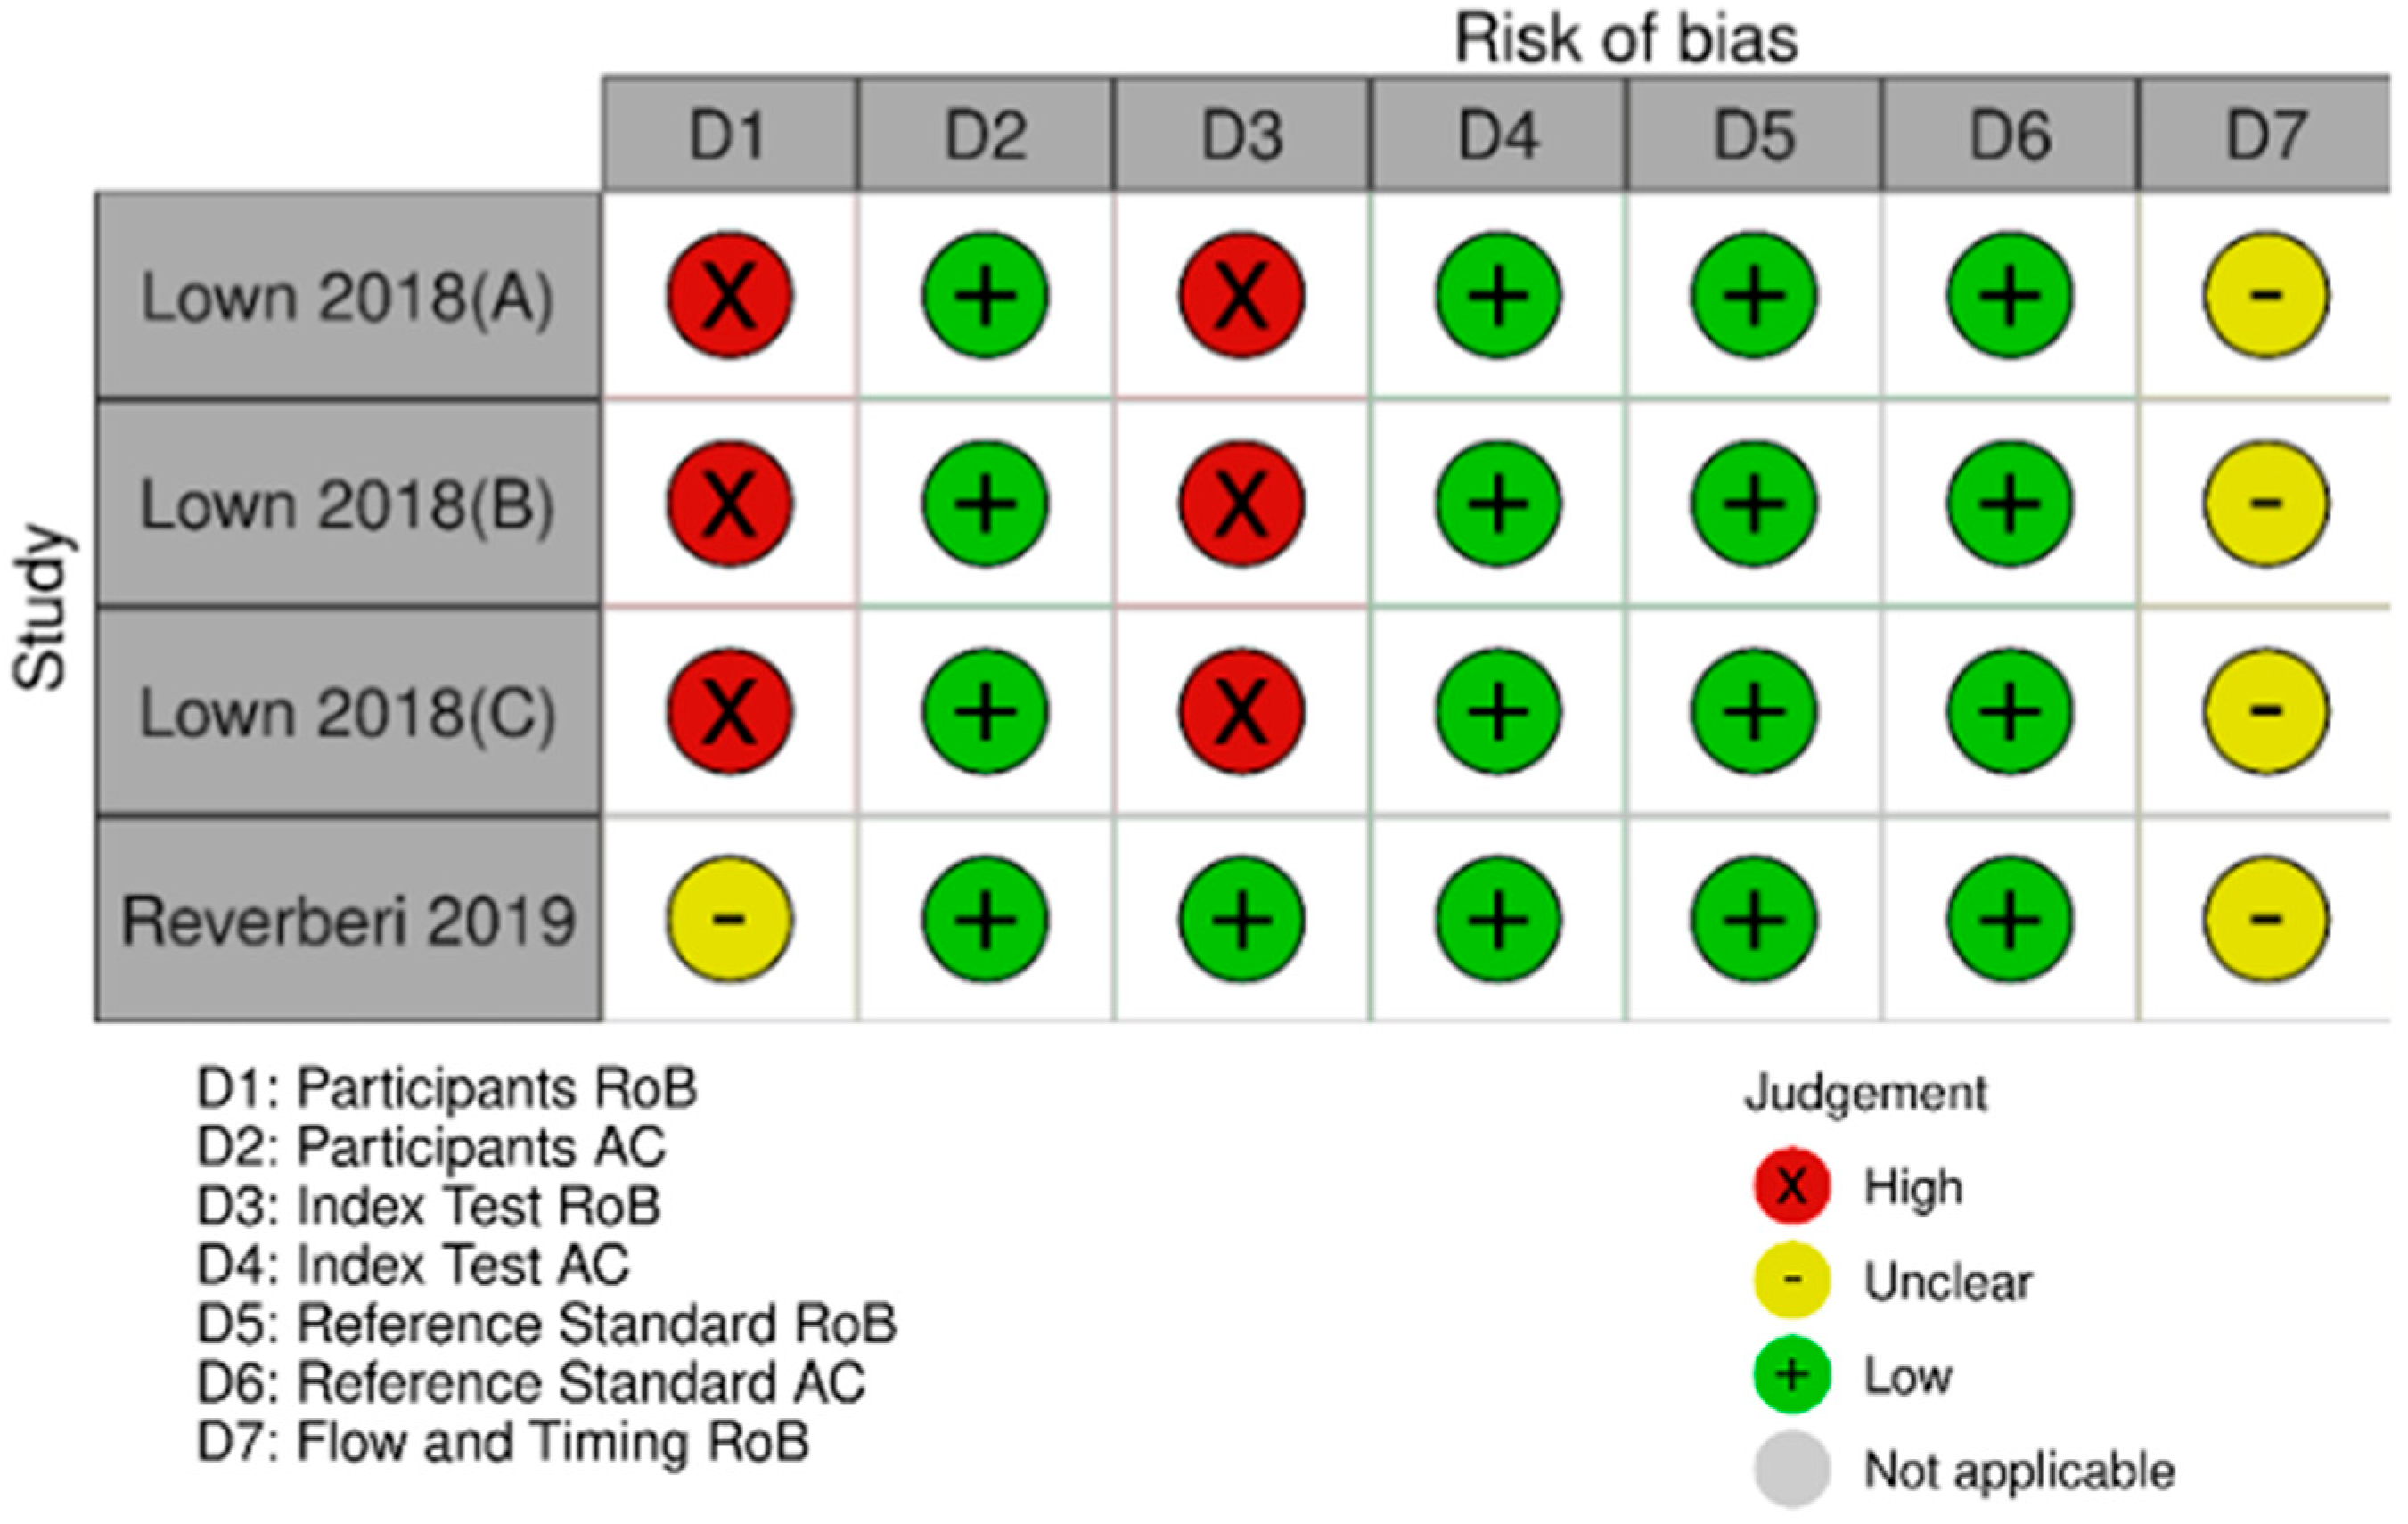
3.3.2. Assessment of Risk of Bias and Applicability of the Single-Lead ECG Studies
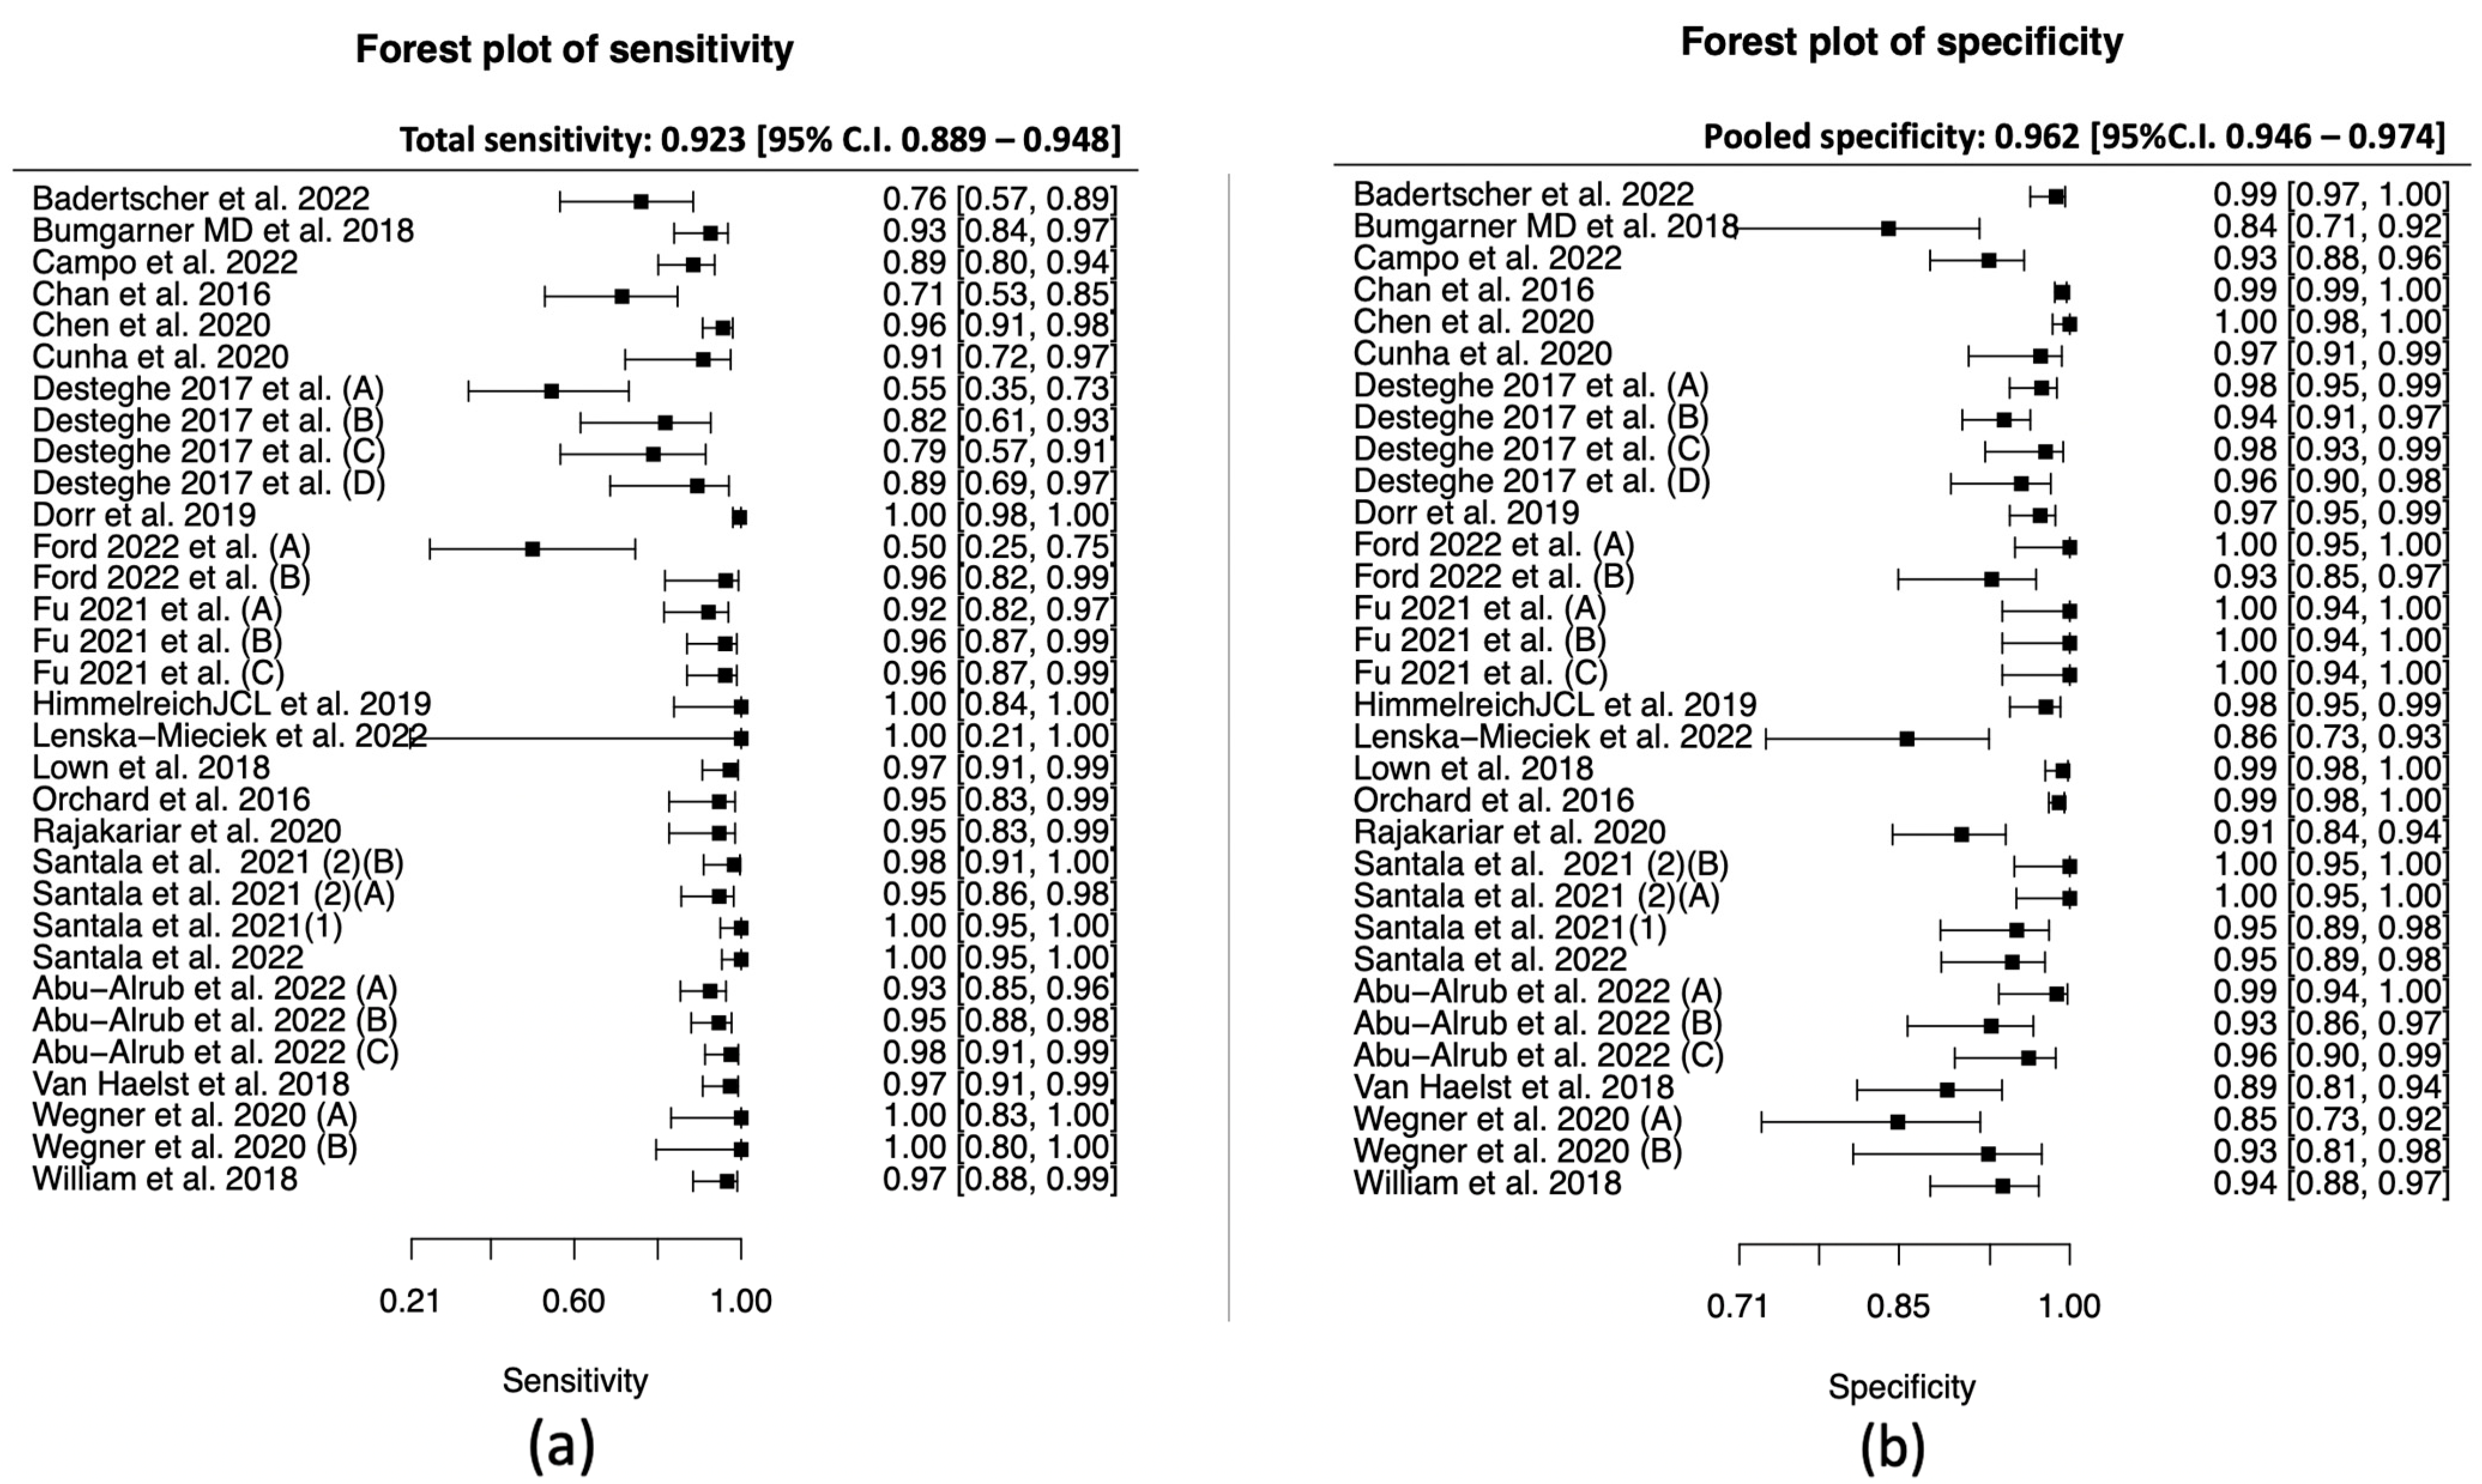
3.3.3. Data Synthesis of the Single-Lead ECG Studies
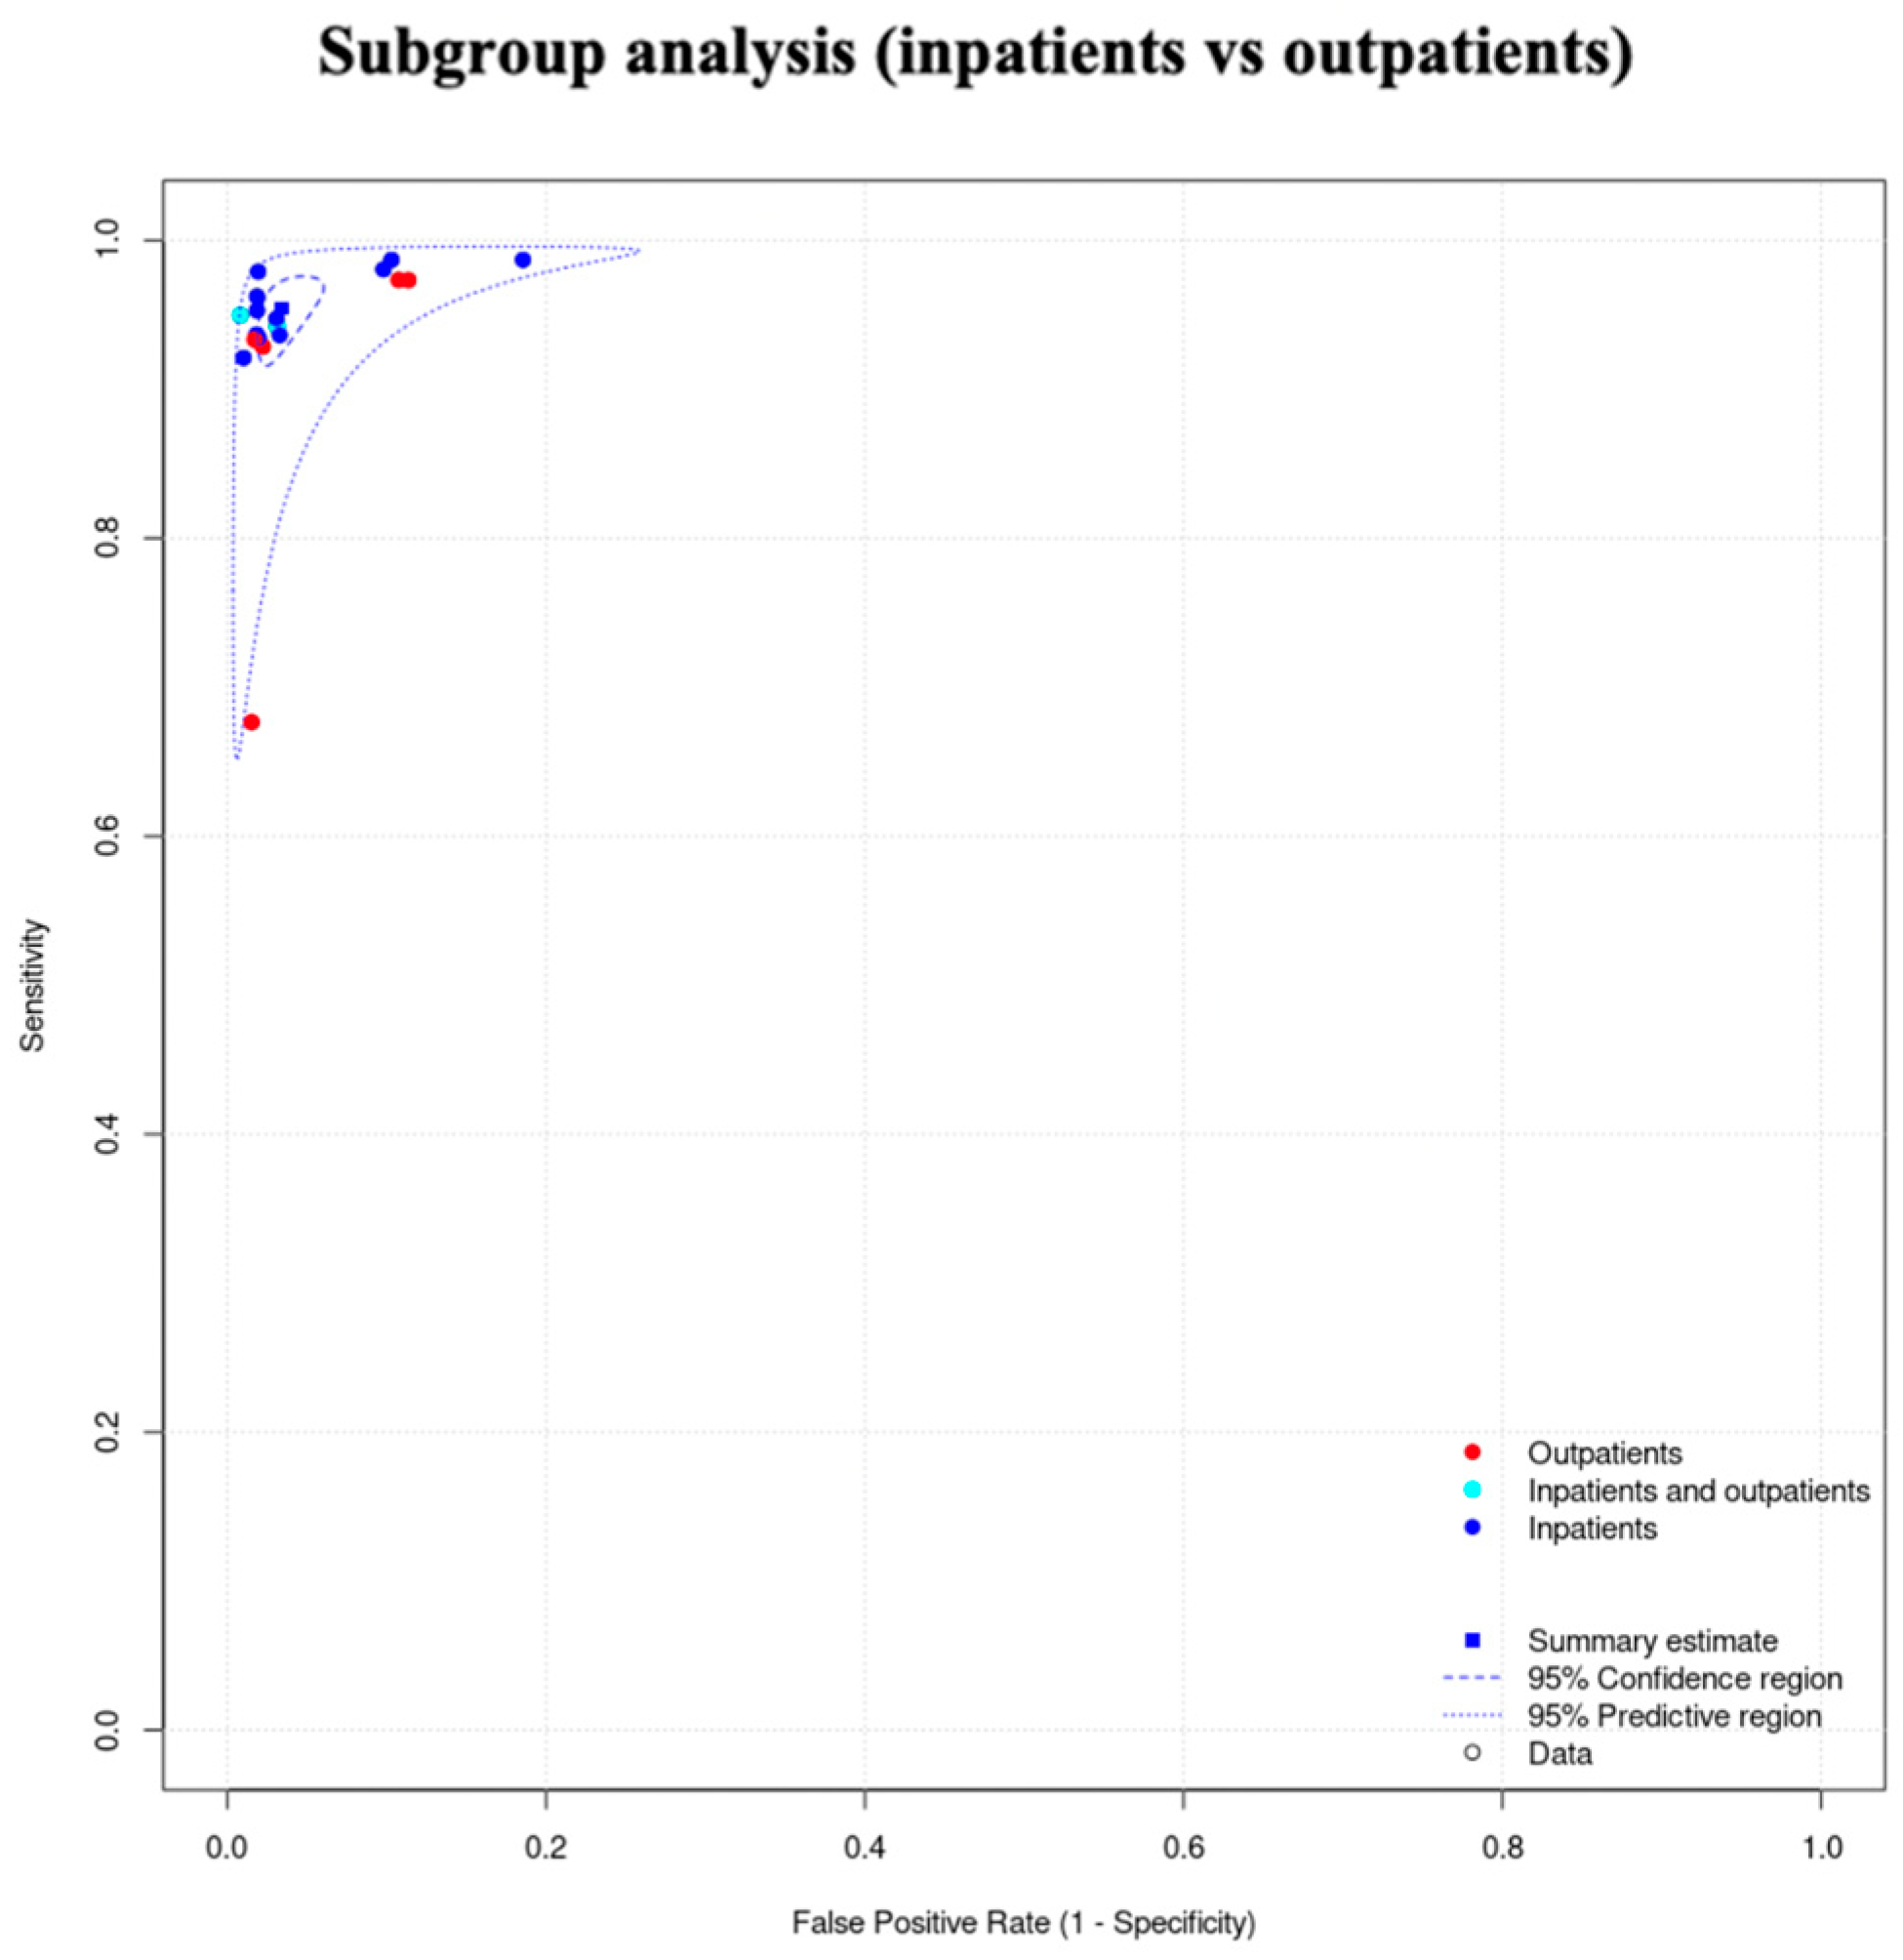
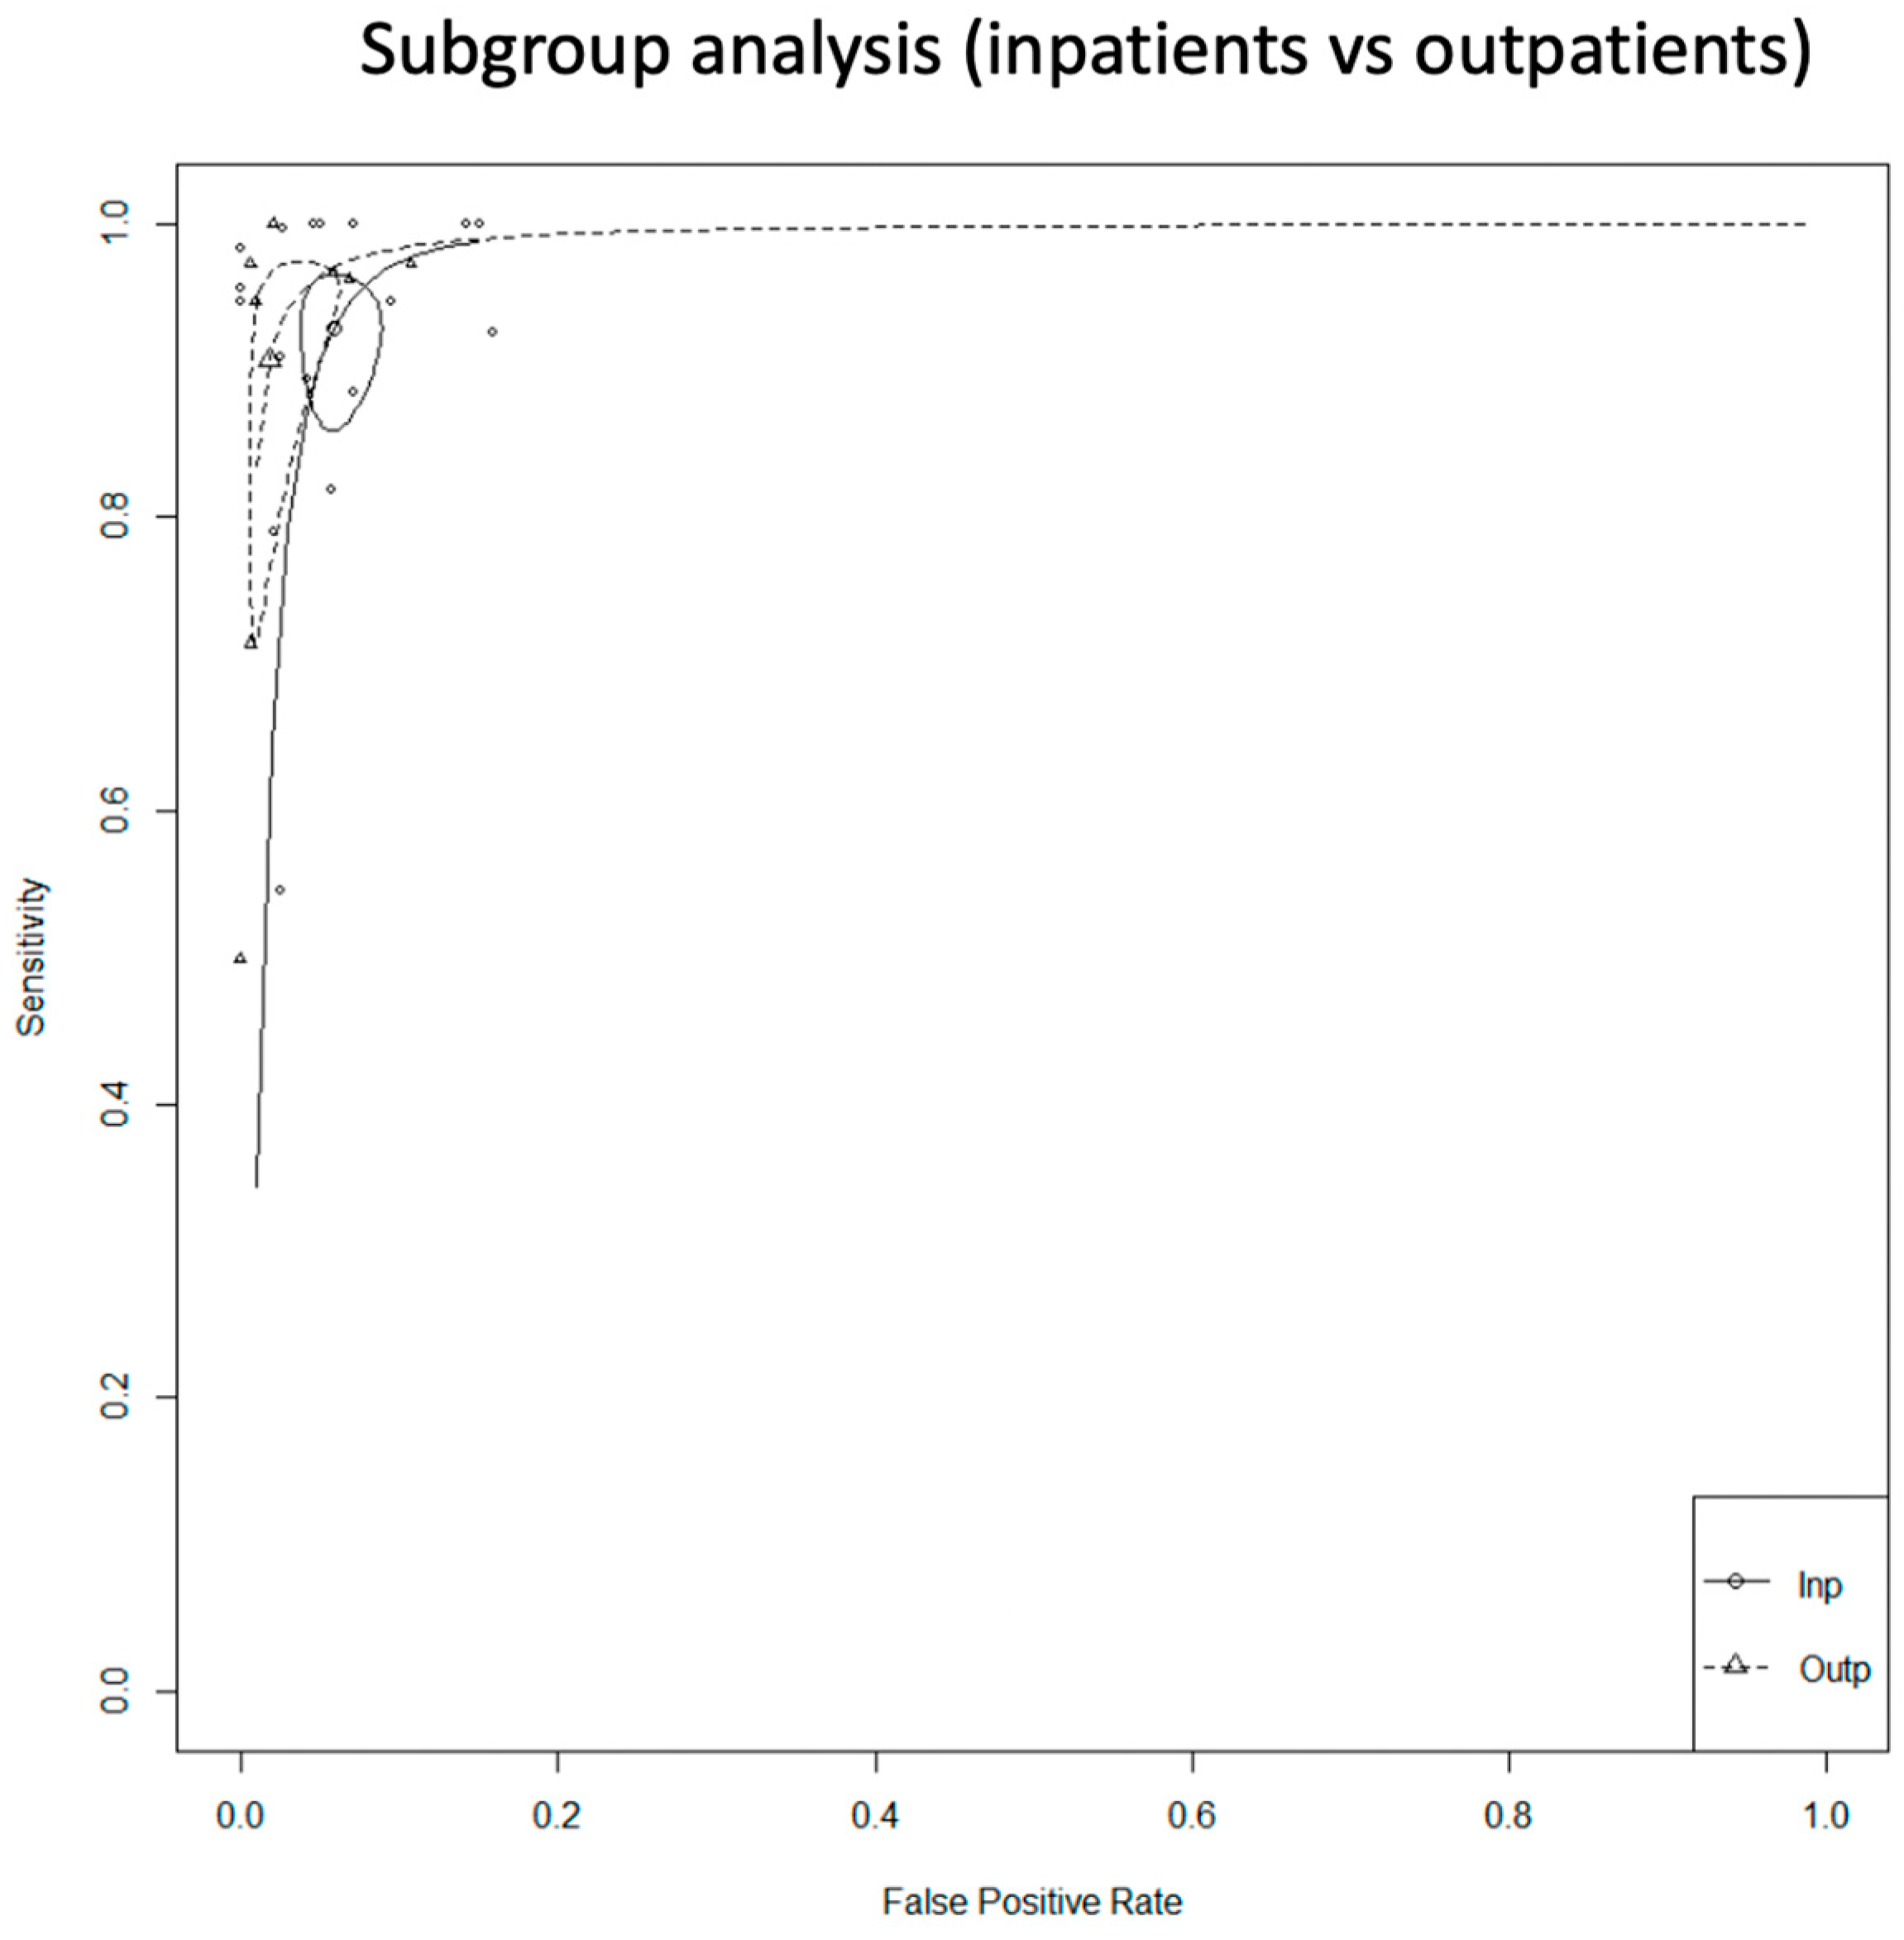
3.3.4. Subgroup Analysis (Inpatients vs. Outpatients) of the Single-Lead ECG Studies
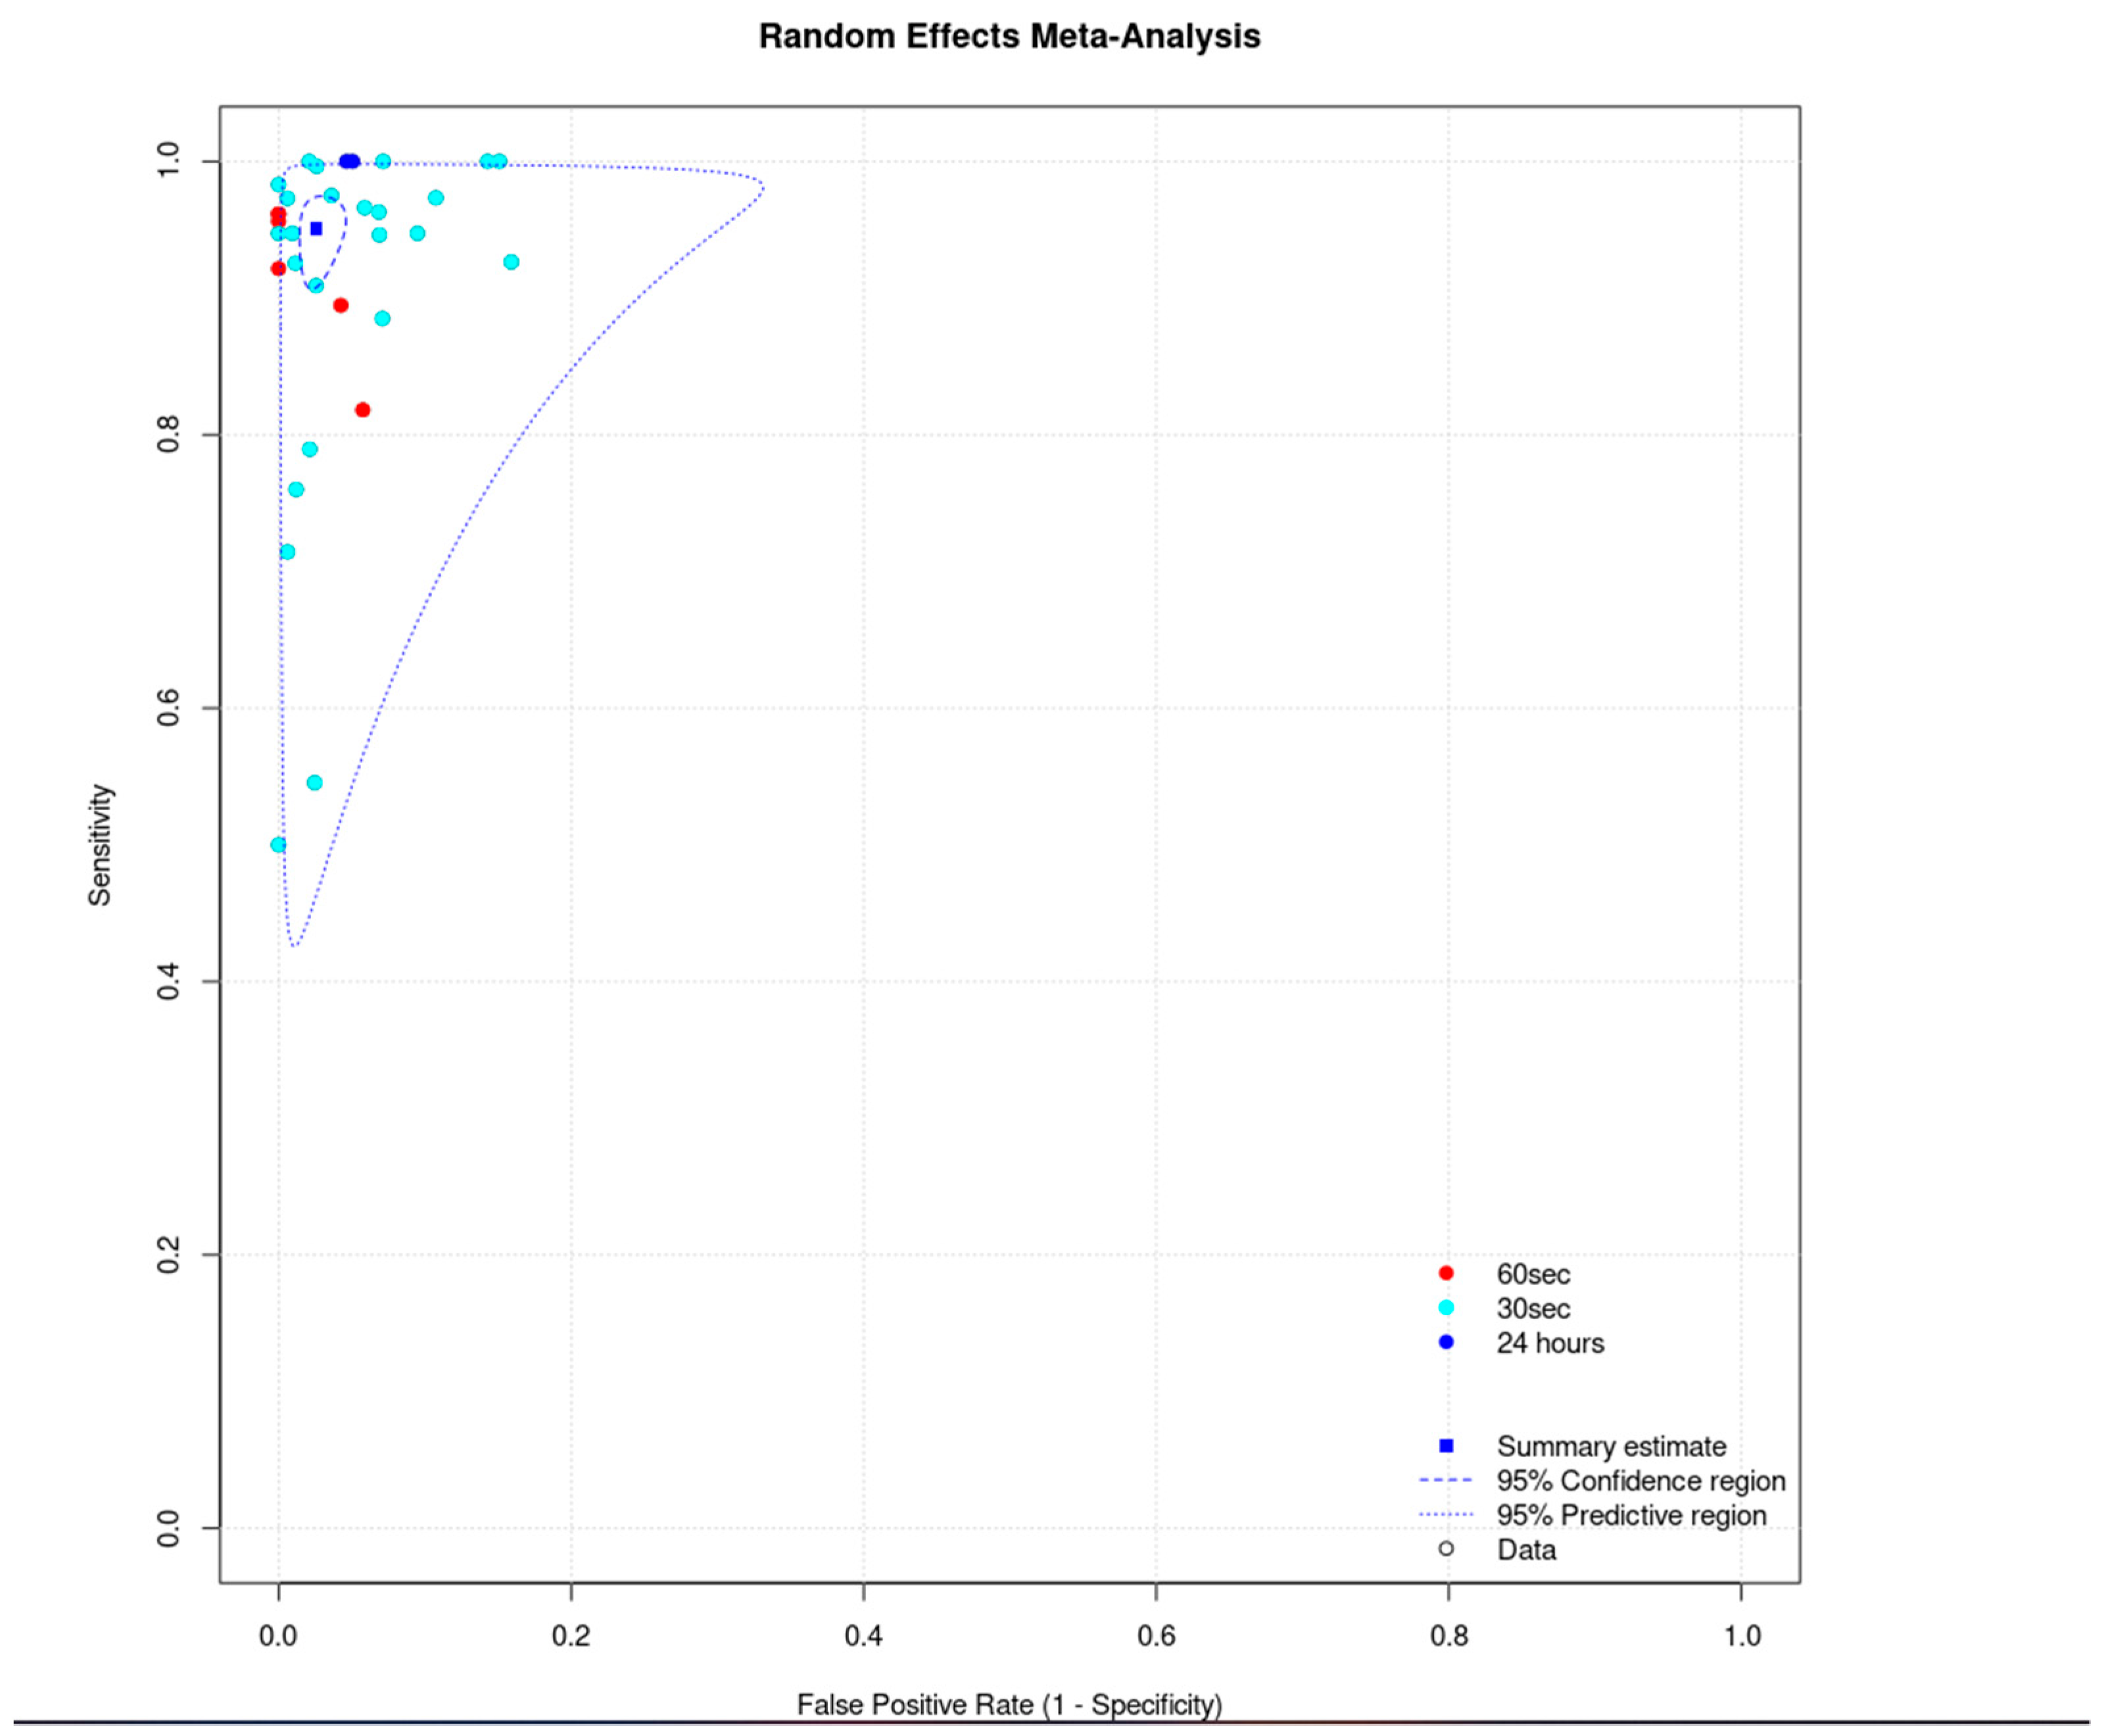
3.3.5. Subgroup Analysis (Duration of Index Test) of the Single-Lead ECG Studies
3.3.6. Unclassified/Unreadable Results of the Single-Lead ECG Studies
3.4. Diagnostic Performance of Technologies Other Than PPG or Single-Lead ECG
4. Discussion
5. Strengths and Limitations
6. Conclusions
Funding
Data Availability Statement
Conflicts of Interest
References
- Freedman, B.; Potpara, T.S.; Lip, G.Y.H. Stroke prevention in atrial fibrillation. Lancet 2016, 388, 806–817. [Google Scholar] [CrossRef] [PubMed]
- Mairesse, G.H.; Moran, P.; Van Gelder, I.C.; Elsner, C.; Rosenqvist, M.; Mant, J.; Banerjee, A.; Gorenek, B.; Brachmann, J.; Varma, N.; et al. Screening for atrial fibrillation: A European Heart Rhythm Association (EHRA) consensus document endorsed by the Heart Rhythm Society (HRS), Asia Pacific Heart Rhythm Society (APHRS), and Sociedad Latinoamericana de Estimulación Cardíaca y Electrofisiología (SOLAECE). EP Eur. 2017, 19, 1589–1623. [Google Scholar] [CrossRef]
- Hindricks, G.; Potpara, T.; Dagres, N.; Arbelo, E.; Bax, J.J.; Blomström-Lundqvist, C.; Boriani, G.; Castella, M.; Dan, G.-A.; Dilaveris, P.E.; et al. 2020 ESC Guidelines for the diagnosis and management of atrial fibrillation developed in collaboration with the European Association for Cardio-Thoracic Surgery (EACTS): The Task Force for the diagnosis and management of atrial fibrillation of the European Society of Cardiology (ESC) Developed with the special contribution of the European Heart Rhythm Association (EHRA) of the ESC. Eur. Heart J. 2021, 42, 373–498. [Google Scholar] [CrossRef]
- Li, K.H.C.; White, F.A.; Tipoe, T.; Liu, T.; Wong, M.C.; Jesuthasan, A.; Baranchuk, A.; Tse, G.; Yan, B.P. The Current State of Mobile Phone Apps for Monitoring Heart Rate, Heart Rate Variability, and Atrial Fibrillation: Narrative Review. JMIR Mhealth Uhealth 2019, 7, e11606. [Google Scholar] [CrossRef] [PubMed]
- Taggar, J.S.; Coleman, T.; Lewis, S.; Heneghan, C.; Jones, M. Accuracy of methods for detecting an irregular pulse and suspected atrial fibrillation: A systematic review and meta-analysis. Eur. J. Prev. Cardiol. 2015, 23, 1330–1338. [Google Scholar] [CrossRef]
- Yang, T.Y.; Huang, L.; Malwade, S.; Hsu, C.-Y.; Chen, Y.C. Diagnostic Accuracy of Ambulatory Devices in Detecting Atrial Fibrillation: Systematic Review and Meta-analysis. JMIR Mhealth Uhealth 2021, 9, e26167. [Google Scholar] [CrossRef]
- Nazarian, S.; Lam, K.; Darzi, A.; Ashrafian, H. Diagnostic Accuracy of Smartwatches for the Detection of Cardiac Arrhythmia: Systematic Review and Meta-analysis. J. Med. Internet Res. 2021, 23, e28974. [Google Scholar] [CrossRef]
- Kavsaoğlu, A.R.; Polat, K.; Hariharan, M. Non-invasive prediction of hemoglobin level using machine learning techniques with the PPG signal’s characteristics features. Appl. Soft Comput. 2015, 37, 983–991. [Google Scholar] [CrossRef]
- Pereira, T.; Tran, N.; Gadhoumi, K.; Pelter, M.M.; Do, D.H.; Lee, R.J.; Colorado, R.; Meisel, K.; Hu, X. Photoplethysmography based atrial fibrillation detection: A review. NPJ Digit. Med. 2020, 3, 3. [Google Scholar] [CrossRef]
- Ford, C.; Xie, C.X.; Low, A.; Rajakariar, K.; Koshy, A.N.; Sajeev, J.K.; Roberts, L.; Pathik, B.; Teh, A.W. Comparison of 2 Smart Watch Algorithms for Detection of Atrial Fibrillation and the Benefit of Clinician Interpretation. JACC Clin. Electrophysiol. 2022, 8, 782–791. [Google Scholar] [CrossRef]
- Van Haelst, R. The diagnostic accuracy of smartphone applications to detect atrial fibrillation: A head-to-head comparison between Fibricheck and AliveCor. Master Thesis, KU Leuven University, Leuven, Belgium, 2016. Available online: https://www.icho-info.be/application/content/downloadthesis/id/1320 (accessed on 10 July 2023).
- Benezet-Mazuecos, J.; García-Talavera, C.S.; Rubio, J.M. Smart devices for a smart detection of atrial fibrillation. J. Thorac. Dis. 2018, 10 (Suppl. S33), S3824–S3827. [Google Scholar] [CrossRef] [PubMed]
- Welcome to the Preferred Reporting Items for Systematic Reviews and Meta-Analyses (PRISMA) Website! Available online: http://www.prisma-statement.org/ (accessed on 28 September 2023).
- Available online: https://www.crd.york.ac.uk/prospero/display_record.php?RecordID=357232 (accessed on 28 September 2023).
- Available online: https://www.cochrane.org/news/cochrane-recommends-covidence-new-reviews (accessed on 28 September 2023).
- PWhiting, P.F.; Rutjes, A.W.S.; Westwood, M.E.; Mallett, S.; Deeks, J.J.; Reitsma, J.B.; Leeflang, M.M.G.; Sterne, J.A.C.; Bossuyt, P.M.M. QUADAS-2: A Revised Tool for the Quality Assessment of Diagnostic Accuracy Studies. Ann. Intern. Med. 2011, 155, 529–536. [Google Scholar] [CrossRef] [PubMed]
- Available online: https://onlinelibrary.wiley.com/doi/full/10.1002/jrsm.1439 (accessed on 28 September 2023).
- Zhou, Y.; Dendukuri, N. Statistics for quantifying heterogeneity in univariate and bivariate meta-analyses of binary data: The case of meta-analyses of diagnostic accuracy. Stat. Med. 2014, 33, 2701–2717. [Google Scholar] [CrossRef]
- Shen, Q.; Li, J.; Cui, C.; Wang, X.; Gao, H.; Liu, C.; Chen, M. A wearable real-time telemonitoring electrocardiogram device compared with traditional Holter monitoring. J. Biomed. Res. 2021, 35, 238–246. [Google Scholar] [CrossRef]
- Selder, J.L.; Breukel, L.; Blok, S.; van Rossum, A.C.; Tulevski, I.I.; Allaart, C.P. A mobile one-lead ECG device incorporated in a symptom-driven remote arrhythmia monitoring program. The first 5982 Hartwacht ECGs. Neth. Heart J. 2019, 27, 38–45. [Google Scholar] [CrossRef]
- Koh, K.T.; Law, W.C.; Zaw, W.M.; Foo, D.H.P.; Tan, C.T.; Steven, A.; Samuel, D.; Fam, T.L.; Chai, C.H.; Wong, Z.S.; et al. Smartphone electrocardiogram for detecting atrial fibrillation after a cerebral ischaemic event: A multicentre randomized controlled trial. EP Eur. 2021, 23, 1016–1023. [Google Scholar] [CrossRef] [PubMed]
- Hiraoka, D.; Inui, T.; Kawakami, E.; Oya, M.; Tsuji, A.; Honma, K.; Kawasaki, Y.; Ozawa, Y.; Shiko, Y.; Ueda, H.; et al. Diagnosis of Atrial Fibrillation Using Machine Learning with Wearable Devices after Cardiac Surgery: Algorithm Development Study. JMIR Form. Res. 2022, 6, e35396. [Google Scholar] [CrossRef] [PubMed]
- Avram, R.; Ramsis, M.; Cristal, A.D.; Nathan, V.; Zhu, L.; Kim, J.; Kuang, J.; Gao, A.; Vittinghoff, E.; Rohdin-Bibby, L.; et al. Validation of an algorithm for continuous monitoring of atrial fibrillation using a consumer smartwatch. Heart Rhythm. 2021, 18, 1482–1490. [Google Scholar] [CrossRef]
- Scholten, J.; Jansen, W.P.; Horsthuis, T.; Mahes, A.D.; Winter, M.M.; Zwinderman, A.H.; Keijer, J.T.; Minneboo, M.; de Groot, J.R.; Bokma, J.P. Six-lead device superior to single-lead smartwatch ECG in atrial fibrillation detection. Am. Heart J. 2022, 253, 53–58. [Google Scholar] [CrossRef]
- Brasier, N.; Raichle, C.J.; Dörr, M.; Becke, A.; Nohturfft, V.; Weber, S.; Bulacher, F.; Salomon, L.; Noah, T.; Birkemeyer, R.; et al. Detection of atrial fibrillation with a smartphone camera: First prospective, international, two-centre, clinical validation study (DETECT AF PRO). EP Eur. 2019, 21, 41–47. [Google Scholar] [CrossRef]
- Palà, E.; Bustamante, A.; Clúa-Espuny, J.L.; Acosta, J.; González-Loyola, F.; Dos Santos, S.; Ribas-Segui, D.; Ballesta-Ors, J.; Penalba, A.; Giralt, M.; et al. Blood-biomarkers and devices for atrial fibrillation screening: Lessons learned from the AFRICAT (Atrial Fibrillation Research In CATalonia) study. PLoS ONE 2022, 17, e0273571. [Google Scholar] [CrossRef] [PubMed]
- Rischard, J.; Waldmann, V.; Moulin, T.; Sharifzadehgan, A.; Lee, R.; Narayanan, K.; Garcia, R.; Marijon, E. Assessment of Heart Rhythm Disorders Using the AliveCor Heart Monitor: Beyond the Detection of Atrial Fibrillation. JACC Clin. Electrophysiol. 2020, 6, 1313–1315. [Google Scholar] [CrossRef] [PubMed]
- Mannhart, D.; Lischer, M.; Knecht, S.; Lavallaz, J.d.F.d.; Strebel, I.; Serban, T.; Vögeli, D.; Schaer, B.; Osswald, S.; Mueller, C.; et al. Clinical Validation of 5 Direct-to-Consumer Wearable Smart Devices to Detect Atrial Fibrillation: BASEL Wearable Study. JACC Clin. Electrophysiol. 2023, 9, 232–242. [Google Scholar] [CrossRef] [PubMed]
- Lau, J.K.; Lowres, N.; Neubeck, L.; Brieger, D.B.; Sy, R.W.; Galloway, C.D.; Albert, D.E.; Freedman, S.B. iPhone ECG application for community screening to detect silent atrial fibrillation: A novel technology to prevent stroke. Int. J. Cardiol. 2013, 165, 193–194. [Google Scholar] [CrossRef] [PubMed]
- Tison, G.H.; Sanchez, J.M.; Ballinger, B.; Singh, A.; Olgin, J.E.; Pletcher, M.J.; Vittinghoff, E.; Lee, E.S.; Fan, S.M.; Gladstone, R.A.; et al. Passive Detection of Atrial Fibrillation Using a Commercially Available Smartwatch. JAMA Cardiol. 2018, 3, 409–416. [Google Scholar] [CrossRef]
- Lubitz, S.A.; Faranesh, A.Z.; Selvaggi, C.; Atlas, S.J.; McManus, D.D.; Singer, D.E.; Pagoto, S.; McConnell, M.V.; Pantelopoulos, A.; Foulkes, A.S. Detection of Atrial Fibrillation in a Large Population Using Wearable Devices: The Fitbit Heart Study. Circulation 2022, 146, 1415–1424. [Google Scholar] [CrossRef]
- Chan, P.; Wong, C.; Poh, Y.C.; Pun, L.; Leung, W.W.; Wong, Y.; Wong, M.M.; Poh, M.; Chu, D.W.; Siu, C.; et al. Diagnostic Performance of a Smartphone-Based Photoplethysmographic Application for Atrial Fibrillation Screening in a Primary Care Setting. J. Am. Heart Assoc. 2016, 5, e003428. [Google Scholar] [CrossRef]
- Chang, P.-C.; Wen, M.-S.; Chou, C.-C.; Wang, C.-C.; Hung, K.-C. Atrial fibrillation detection using ambulatory smartwatch photoplethysmography and validation with simultaneous holter recording. Am. Heart J. 2022, 247, 55–62. [Google Scholar] [CrossRef]
- Sun, Y.; Yang, Y.-Y.; Wu, B.-J.; Huang, P.-W.; Cheng, S.-E.; Chen, C.-C. Contactless facial video recording with deep learning models for the detection of atrial fibrillation. Sci. Rep. 2022, 12, 281. [Google Scholar] [CrossRef]
- Mol, D.; Riezebos, R.K.; Marquering, H.A.; Werner, M.E.; Lobban, T.C.; de Jong, J.S.; de Groot, J.R. Performance of an automated photoplethysmography-based artificial intelligence algorithm to detect atrial fibrillation. Cardiovasc. Digit. Health J. 2020, 1, 107–110. [Google Scholar] [CrossRef]
- Väliaho, E.-S.; Kuoppa, P.; A Lipponen, J.; Martikainen, T.J.; Jäntti, H.; Rissanen, T.T.; Kolk, I.; Castrén, M.; Halonen, J.; Tarvainen, M.P.; et al. Wrist band photoplethysmography in detection of individual pulses in atrial fibrillation and algorithm-based detection of atrial fibrillation. EP Eur. 2019, 21, 1031–1038. [Google Scholar] [CrossRef] [PubMed]
- Dörr, M.; Nohturfft, V.; Brasier, N.; Bosshard, E.; Djurdjevic, A.; Gross, S.; Raichle, C.J.; Rhinisperger, M.; Stöckli, R.; Eckstein, J. The WATCH AF Trial: SmartWATCHes for Detection of Atrial Fibrillation. JACC Clin. Electrophysiol. 2019, 5, 199–208. [Google Scholar] [CrossRef] [PubMed]
- Väliaho, E.-S.; Lipponen, J.A.; Kuoppa, P.; Martikainen, T.J.; Jäntti, H.; Rissanen, T.T.; Castrén, M.; Halonen, J.; Tarvainen, M.P.; Laitinen, T.M.; et al. Continuous 24-h Photoplethysmogram Monitoring Enables Detection of Atrial Fibrillation. Front. Physiol. 2022, 12, 778775. [Google Scholar] [CrossRef] [PubMed]
- Bacevicius, J.; Abramikas, Z.; Dvinelis, E.; Audzijoniene, D.; Petrylaite, M.; Marinskiene, J.; Staigyte, J.; Karuzas, A.; Juknevicius, V.; Jakaite, R.; et al. High Specificity Wearable Device with Photoplethysmography and Six-Lead Electrocardiography for Atrial Fibrillation Detection Challenged by Frequent Premature Contractions: DoubleCheck-AF. Front. Cardiovasc. Med. 2022, 9, 869730. [Google Scholar] [CrossRef] [PubMed]
- Chen, E.; Jiang, J.; Su, R.; Gao, M.; Zhu, S.; Zhou, J.; Huo, Y. A new smart wristband equipped with an artificial intelligence algorithm to detect atrial fibrillation. Heart Rhythm. 2020, 17, 847–853. [Google Scholar] [CrossRef]
- Santala, E.O.; Halonen, J.; Martikainen, S.; Jäntti, H.; Rissanen, T.T.; Tarvainen, M.P.; Laitinen, T.P.; Laitinen, T.M.; Väliaho, E.-S.; Hartikainen, J.E.K.; et al. Automatic Mobile Health Arrhythmia Monitoring for the Detection of Atrial Fibrillation: Prospective Feasibility, Accuracy, and User Experience Study. JMIR Mhealth Uhealth 2021, 9, e29933. [Google Scholar] [CrossRef]
- Badertscher, P.; Lischer, M.; Mannhart, D.; Knecht, S.; Isenegger, C.; Lavallaz, J.D.F.d.; Schaer, B.; Osswald, S.; Kühne, M.; Sticherling, C. Clinical validation of a novel smartwatch for automated detection of atrial fibrillation. Heart Rhythm. O2 2022, 3, 208–210. [Google Scholar] [CrossRef]
- Bumgarner, J.M.; Lambert, C.T.; Hussein, A.A.; Cantillon, D.J.; Baranowski, B.; Wolski, K.; Lindsay, B.D.; Wazni, O.M.; Tarakji, K.G. Smartwatch Algorithm for Automated Detection of Atrial Fibrillation. J. Am. Coll. Cardiol. 2018, 71, 2381–2388. [Google Scholar] [CrossRef]
- Campo, D.; Elie, V.; de Gallard, T.; Bartet, P.; Morichau-Beauchant, T.; Genain, N.; Fayol, A.; Fouassier, D.; Pasteur-Rousseau, A.; Puymirat, E.; et al. Atrial Fibrillation Detection With an Analog Smartwatch: Prospective Clinical Study and Algorithm Validation. JMIR Form. Res. 2022, 6, e37280. [Google Scholar] [CrossRef]
- Cunha, S.; Antunes, E.; Antoniou, S.; Tiago, S.; Relvas, R.; Fernandez-Llimós, F.; da Costa, F.A. Raising awareness and early detection of atrial fibrillation, an experience resorting to mobile technology centred on informed individuals. Res. Soc. Adm. Pharm. 2020, 16, 787–792. [Google Scholar] [CrossRef]
- Desteghe, L.; Raymaekers, Z.; Lutin, M.; Vijgen, J.; Dilling-Boer, D.; Koopman, P.; Schurmans, J.; Vanduynhoven, P.; Dendale, P.; Heidbuchel, H. Performance of handheld electrocardiogram devices to detect atrial fibrillation in a cardiology and geriatric ward setting. EP Eur. 2017, 19, 29–39. [Google Scholar] [CrossRef]
- Fu, W.; Li, R. Diagnostic performance of a wearing dynamic ECG recorder for atrial fibrillation screening: The HUAMI heart study. BMC Cardiovasc. Disord. 2021, 21, 558. [Google Scholar] [CrossRef] [PubMed]
- Himmelreich, J.C.; Karregat, E.P.; Lucassen, W.A.; van Weert, H.C.; de Groot, J.R.; Handoko, M.L.; Nijveldt, R.; Harskamp, R. Diagnostic Accuracy of a Smartphone-Operated, Single-Lead Electrocardiography Device for Detection of Rhythm and Conduction Abnormalities in Primary Care. Ann. Fam. Med. 2019, 17, 403. [Google Scholar] [CrossRef] [PubMed]
- Lown, M.; Yue, A.M.; Shah, B.N.; Corbett, S.J.; Lewith, G.; Stuart, B.; Garrard, J.; Brown, M.; Little, P.; Moore, M. Screening for Atrial Fibrillation Using Economical and Accurate Technology (From the SAFETY Study). Am. J. Cardiol. 2018, 122, 1339–1344. [Google Scholar] [CrossRef] [PubMed]
- Rajakariar, K.; Koshy, A.N.; Sajeev, J.K.; Nair, S.; Roberts, L.; Teh, A.W. Accuracy of a smartwatch based single-lead electrocardiogram device in detection of atrial fibrillation. Heart 2020, 106, 665. [Google Scholar] [CrossRef]
- Santala, O.E.; Lipponen, J.A.; Jäntti, H.; Rissanen, T.T.; Halonen, J.; Kolk, I.; Pohjantähti-Maaroos, H.; Tarvainen, M.P.; Väliaho, E.; Hartikainen, J.; et al. Necklace-embedded electrocardiogram for the detection and diagnosis of atrial fibrillation. Clin. Cardiol. 2021, 44, 620–626. [Google Scholar] [CrossRef]
- Santala, O.E.; A Lipponen, J.; Jäntti, H.; Rissanen, T.T.; Tarvainen, M.P.; Laitinen, T.P.; Laitinen, T.M.; Castrén, M.; Väliaho, E.-S.; A Rantula, O.; et al. Continuous mHealth Patch Monitoring for the Algorithm-Based Detection of Atrial Fibrillation: Feasibility and Diagnostic Accuracy Study. JMIR Cardio. 2022, 6, e31230. [Google Scholar] [CrossRef]
- Abu-Alrub, S.; Strik, M.; Ramirez, F.D.; Moussaoui, N.; Racine, H.P.; Marchand, H.; Buliard, S.; Haïssaguerre, M.; Ploux, S.; Bordachar, P. Smartwatch Electrocardiograms for Automated and Manual Diagnosis of Atrial Fibrillation: A Comparative Analysis of Three Models. Front. Cardiovasc. Med. 2022, 9, 836375. [Google Scholar] [CrossRef]
- Wegner, F.K.; Kochhäuser, S.; Ellermann, C.; Lange, P.S.; Frommeyer, G.; Leitz, P.; Eckardt, L.; Dechering, D.G. Prospective blinded Evaluation of the smartphone-based AliveCor Kardia ECG monitor for Atrial Fibrillation detection: The PEAK-AF study. Eur. J. Intern. Med. 2020, 73, 72–75. [Google Scholar] [CrossRef]
- William, A.D.; Kanbour, M.; Callahan, T.; Bhargava, M.; Varma, N.; Rickard, J.; Saliba, W.; Wolski, K.; Hussein, A.; Lindsay, B.D.; et al. Assessing the accuracy of an automated atrial fibrillation detection algorithm using smartphone technology: The iREAD Study. Heart Rhythm. 2018, 15, 1561–1565. [Google Scholar] [CrossRef]
- Orchard, J.; Lowres, N.; Ben Freedman, S.; Ladak, L.; Lee, W.; Zwar, N.; Peiris, D.; Kamaladasa, Y.; Li, J.; Neubeck, L. Screening for atrial fibrillation during influenza vaccinations by primary care nurses using a smartphone electrocardiograph (iECG): A feasibility study. Eur. J. Prev. Cardiol. 2016, 23 (Suppl. S2), 13–20. [Google Scholar] [CrossRef] [PubMed]
- Leńska-Mieciek, M.; Kuls-Oszmaniec, A.; Dociak, N.; Kowalewski, M.; Sarwiński, K.; Osiecki, A.; Fiszer, U. Mobile Single-Lead Electrocardiogram Technology for Atrial Fibrillation Detection in Acute Ischemic Stroke Patients. J. Clin. Med. 2022, 11, 665. [Google Scholar] [CrossRef] [PubMed]
- Reverberi, C.; Rabia, G.; De Rosa, F.; Bosi, D.; Botti, A.; Benatti, G. The RITMIATM Smartphone App for Automated Detection of Atrial Fibrillation: Accuracy in Consecutive Patients Undergoing Elective Electrical Cardioversion. Biomed. Res. Int. 2019, 2019, 4861951. [Google Scholar] [CrossRef] [PubMed]
- Lead-I ECG Devices for Detecting Symptomatic Atrial Fibrillation Using Single Time Point Testing in Primary Care. 2019. Available online: www.nice.org.uk/guidance/dg35 (accessed on 28 September 2023).
- Us Preventive Services Task Force; Davidson, K.W.; Barry, M.J.; Mangione, C.M.; Cabana, M.; Caughey, A.B.; Davis, E.M.; Donahue, K.E.; Doubeni, C.A.; Epling, J.W.; et al. Screening for Atrial Fibrillation: US Preventive Services Task Force Recommendation Statement. JAMA 2022, 327, 360–367. [Google Scholar] [CrossRef]
- Sanna, T.; Diener, H.-C.; Passman, R.S.; Di Lazzaro, V.; Bernstein, R.A.; Morillo, C.A.; Rymer, M.M.; Thijs, V.; Rogers, T.; Beckers, F.; et al. Cryptogenic Stroke and Underlying Atrial Fibrillation. N. Engl. J. Med. 2014, 370, 2478–2486. [Google Scholar] [CrossRef]
- Svennberg, E.; Friberg, L.; Frykman, V.; Al-Khalili, F.; Engdahl, J.; Rosenqvist, M. Clinical outcomes in systematic screening for atrial fibrillation (STROKESTOP): A multicentre, parallel group, unmasked, randomised controlled trial. Lancet 2021, 398, 1498–1506. [Google Scholar] [CrossRef]
- Chen, W.; Khurshid, S.; Singer, D.E.; Atlas, S.J.; Ashburner, J.M.; Ellinor, P.T.; McManus, D.D.; Lubitz, S.A.; Chhatwal, J. Cost-effectiveness of Screening for Atrial Fibrillation Using Wearable Devices. JAMA Health Forum 2022, 3, e222419. [Google Scholar] [CrossRef]
- Khurshid, S.; Chen, W.; Singer, D.E.; Atlas, S.J.; Ashburner, J.M.; Choi, J.G.; Hur, C.; Ellinor, P.T.; McManus, D.D.; Chhatwal, J.; et al. Comparative clinical effectiveness of population-based atrial fibrillation screening using contemporary modalities: A decision-analytic model. J. Am. Heart Assoc. 2021, 10, e020330. [Google Scholar] [CrossRef]


| Author, Year | Setting | Study Design | Device | Algorithm | Time Used | Gold Standard | Age (Mean ± SD) | Sex (Females %) | N | N in AF Group | N in Control Group (Type of Control Group) | Group of AFL | TP | TN | FP | FN |
Unclassified/ Uninterpretable |
|---|---|---|---|---|---|---|---|---|---|---|---|---|---|---|---|---|---|
| Bacevicius et al., 2022 [39] | Inpatients and outpatients | Case–control selected cross-sectional study | Prototype of the wearable device | Automatic PPG-based algorithm (PPG) | 2 min. | 3-lead Holter | AF: 65.6 ± 11.2, SR: 67.3 ± 14.2 | AF: 47.1% SR: 46.1% | 344 | 121 | 223 (SR) | Excluded from study | 114 | 216 | 7 | 7 | Excluded |
| Chang et al., 2022 [33] | Outpatients | Cohort selected cross-sectional study | Garmin Forerunner 945 smartwatch | Garmin Forerunner 945 smartwatch algorithm (PPG) | 24 h | 3-lead Holter | All participants: 66.1 ± 12.6 AF: 69.3 ± 11.5 Non-AF: 62.0 ± 12.9 | All participants: 36.5% AF: 30.4% Non-AF: 44.3% | 200 | 112 | 88 (non-AF) | AF group | 109 | 78 | 10 | 3 | 0% |
| Chen et al., 2020 (A) [40] | Inpatients and outpatients | Case–control selected cross-sectional study | Amazfit Health Band 1S | RealBeats Artificial Intelligence Biological Data Engine (Huami Technology) (PPG) | 3 min. | 12-lead ECG | AF: 70.4 ± 11.5 Non-AF: 59.3 ± 14.8 | AF: females: 43.3% Non-AF: females: 52.6% | 401 | 139 | 244 (non-AF) | Control group | 132 | 242 | 2 | 7 | 4.5% |
| Van Haelst et al., 2018 (A) [11] | Outpatients | Case–control selected cross-sectional study | Fibricheck | Fibricheck algorithm (PPG) | 3 min. | 12-lead ECG | All participants: 77.3 ± 8.0 AF: 78.8 ± 8.0 No AF: 75.9 ± 7.9 | All participants: 57.4% AF: 51.1% Non-AF: 63.3% | 190 | 75 | 93 (non-AF) | AF group | 73 | 83 | 10 | 2 | 11.6% |
| Mol et al., 2020 [35] | Inpatients | Case–control selected cross-sectional study | iPhone 8 | Algorithm developed by Happitech (Amsterdam, The Netherlands) (PPG) | 90 s | Continuous electrocardiography | All participants: 69 ± 9 | All participants: 43% | 257 | 149 | 108 (SR) | Excluded from study | 139 | 101 | 2 | 3 | 4.7% |
| Sun et al., 2022 [34] | Outpatients | Case–control selected cross-sectional study | Industrial camera (FLIR BFLY-U3-03S2C-CS) | DCNN model (PPG) | 10 min. max or as much as tolerated | 12-lead ECG | All participants: 69.3 ± 13.0 AF: 74.3 ± 12.5 Non-AF: 67.8 ± 13.0 | All participants: 46% AF: 51.4% Non-AF: 44.8% | 453 | 105 | 348 (no-AF) | Control group | 98 | 342 | 6 | 7 | Excluded |
| Tison et al., 2018 [30] | Inpatients | Case–control selected cross-sectional study | Apple Watch | Optimized Cardiogram app (PPG) | 20 min prior- and 20 min post-cardioversion | 12-lead ECG | All participants: 66.1 ± 10.7 | All participants: 16% | 51 | 51 | 51 (SR) | Excluded from study | 50 | 46 | 5 | 1 | 0% |
| Väliaho et al., 2019 (A) [36] | Inpatients | Case–control selected cross-sectional study | Empatica E4 wrist band | MATLAB® software version R2017b using AFEvidence or COSEn (PPG) | 5 min | 3-lead Holter | AF: 72.0 ± 14.3 years SR: 54.5 ± 18.6 years | AF: 42.5% SR: 44.9% | 213 | 106 | 107 (SR) | Excluded from study | 102 | 105 | 2 | 4 | Excluded |
| Väliaho et al., 2019 (B) [36] | Inpatients | Case–control selected cross-sectional study | Empatica E4 wrist band | MATLAB® software version R2017b using AFEvidence or COSEn (PPG) | 5 min | 3-lead Holter | AF: 72.0 ± 14.3 years SR: 54.5 ± 18.6 years | AF: 42.5% SR: 44.9% | 213 | 106 | 107 (SR) | Excluded from study | 101 | 105 | 2 | 5 | Excluded |
| Väliaho et al., 2021 (A) [41] | Inpatients | Case–control selected cross-sectional study | Empatica E4 wrist band | MATLAB® software (version R2017b) with a novel autocorrelation (AC) feature (PPG) | 1 min every 10 min, 20 min, 30 min, 60 min | 3-lead Holter | AF: 77.1 ± 9.7 SR: 67.3 ± 15.8 | AF: 46.1% SR: 55.7% | 173 | 76 | 97 (SR) | Unclear | 75 | 79 | 18 | 1 | 0% |
| Väliaho et al., 2021 (B) [41] | Inpatients | Case–control selected cross-sectional study | Empatica E4 wrist band | MATLAB® software (version R2017b) with a novel autocorrelation (AC) feature (PPG) | 1 min every 10 min, 20 min, 30 min, 60 min | 3-lead Holter | AF: 77.1 ± 9.7 SR: 67.3 ± 15.8 | AF: 46.1% SR: 55.7% | 173 | 76 | 97 (SR) | Unclear | 75 | 87 | 10 | 1 | 0% |
| Väliaho et al., 2021 (C) [41] | Inpatients | Case–control selected cross-sectional study | Empatica E4 wrist band | MATLAB® software (version R2017b) with a novel autocorrelation (AC) feature (PPG) | 1 min every 10 min, 20 min, 30 min, 60 min | 3-lead Holter | AF: 77.1 ± 9.7 SR: 67.3 ± 15.8 | AF: 46.1% SR: 55.7% | 173 | 76 | 97 (SR) | Unclear | 72 | 94 | 3 | 4 | 0% |
| Väliaho et al., 2021 (D) [41] | Inpatients | Case–control selected cross-sectional study | Empatica E4 wrist band | MATLAB® software (version R2017b) with a novel autocorrelation (AC) feature (PPG) | 1 min every 10 min, 20 min, 30 min, 60 min | 3-lead Holter | AF: 77.1 ± 9.7 SR: 67.3 ± 15.8 | AF: 46.1% SR: 55.7% | 173 | 76 | 97 (SR) | Unclear | 70 | 96 | 1 | 6 | 0% |
| Chan et al., 2016 (A) [32] | Outpatients | Cohort selected cross-sectional study | iPhone 4S | Cardiio Rhythm smartphone application (Cardiio Inc.) (PPG) | 51.3 s | single-lead ECG | All participants: 68.4 ± 12.2 | All participants: 53.2% | 1013 | 28 | 985 (non-AF) | Excluded from study | 26 | 963 | 22 | 2 | 0% |
| Dörr et al., 2019 (A) [37] | Inpatients | Case–control selected cross-sectional study | Gear Fit 2, Samsung | Heartbeats application (Preventicus GmbH, Jena, Germany) (PPG) | 1 min, 3 min and 5 min | single-lead ECG | All participants: 76.4 ± 9.5 AF: 77.4 ± 9.1 SR: 75.6 ± 9.8 | All participants: 44.3% SR: 46.1% AF: 42.2% | 650 | 237 | 271 (SR) | Excluded from study | 222 | 266 | 5 | 15 | 21.8% |
| Dörr et al., 2019 (B) [37] | Inpatients | Case–control selected cross-sectional study | Gear Fit 2, Samsung | Heartbeats application (Preventicus GmbH, Jena, Germany) (PPG) | 1 min, 3 min and 5 min | single-lead ECG | All participants: 76.4 ± 9.5 AF: 77.4 ± 9.1 SR: 75.6 ± 9.8 | All participants: 44.3% SR: 46.1% AF: 42.2% | 650 | 204 | 243 (SR) | Excluded from study | 191 | 235 | 8 | 13 | 31.2% |
| Dörr et al., 2019 (C) [37] | Inpatients | Case–control selected cross-sectional study | Gear Fit 2, Samsung | Heartbeats application (Preventicus GmbH, Jena, Germany) (PPG) | 1 min, 3 min and 5 min | single-lead ECG | All participants: 76.4 ± 9.5 AF: 77.4 ± 9.1 SR: 75.6 ± 9.8 | All participants: 44.3% SR: 46.1% AF: 42.2% | 650 | 167 | 202 (SR) | Excluded from study | 156 | 198 | 4 | 11 | 43.2% |
| Lubitz et al., 2022 [31] | Outpatients | Cohort selected cross-sectional study | Fitbit device | Fitbit app (PPG) | 1 week | single-lead ECG | All participants *: ≥75 years: 9.7% 65–74 years: 33.2% 55–64 years: 37.4% 40–54 years: 16.6% 22–39 years: 6.1% | All participants: 48.2% | 1057 | 340 | 717 (non-AF) | AF group | 230 | 706 | 11 | 110 | 0% |
| Badertscher et al., 2022 [42] | - | Cohort selected cross-sectional study | Withings Scanwatch | Withings Scanwatch detection algorithm (single-lead ECG) | 30 s | 12-lead ECG | All participants: 67 (54–76 years) | All participants: 48% | 319 | 34 | 285 (SR) | No comment | 19 | 247 | 3 | 6 | 13.8% |
| Bumgarner MD et al., 2018 [43] | Inpatients | Case–control selected cross-sectional study | Kardia Band | Kardia Band detection algorithm (single-lead ECG) | 30 s | 12-lead ECG | All participants: 68.2 ± 10.86 | All participants: 17% | 169 | 91 | 78 (SR) | In AF group | 63 | 37 | 7 | 5 | 33.7% |
| Campo et al., 2022 [44] | Inpatients and outpatients | Case–control selected cross-sectional study | Withings Scanwatch | Withings Scanwatch detection algorithm (single-lead ECG) | 30 s | 12-lead ECG | All participants: 67.7 ± 14.8 AF: 74.3 ± 12.3 SR: 61.8 ± 14.3 Other arrhythmias: 66.9 ± 15.2 Unreadable ECGs: 78.8 ± 12.5 | All participants: 61.1% AF: 42% SR: 34.5% Other arrhythmias: 40% Unreadable ECGs: 75% | 258 | 87 | 155 (non-AF) | Control group | 77 | 144 | 11 | 10 | 6.2% |
| Chen et al., 2020 (B) [40] | Inpatients and outpatients | Cohort selected cross-sectional study | Amazfit Health Band 1S | RealBeats Artificial Intelligence Biological Data Engine (Huami Technology) (single-lead ECG) | 60 s | 12-lead ECG | AF: 70.4 ± 11.5 Non-AF: 59.3 ± 14.8 | AF: 43.3% Non-AF: 52.6% | 401 | 150 | 25 (non-AF) | No comment | 131 | 249 | 0 | 6 | 3.7% |
| Cunha et al., 2020 [45] | Inpatients | Cohort selected cross-sectional study | Kardia® mobile | Kardia® mobile algorithm (single-lead ECG) | 30 s | 12-lead ECG | - | - | 129 | 22 | 78 (SR) | No comment | 20 | 76 | 2 | 2 | 22.4% |
| Desteghe et al., 2017 (A) [46] | Inpatients | Cohort selected cross-sectional study | AliveCor | AliveCor algorithm (single-lead ECG) | 30 s | 12-lead ECG | All participants: 67.9 ± 14.6 AF: 73.1 ± 12.2 SR: 65.1 ± 15.0 | All participants: 43.1% AF: 51.8% SR: 38.3% | 265 | 22 | 243 (SR) | In AF group | 12 | 237 | 6 | 10 | 0% |
| Desteghe et al., 2017 (B) [46] | Inpatients | Cohort selected cross-sectional study | MyDiagnostick | MyDiagnostick algorithm (single-lead ECG) | 60 s | 12-lead ECG | All participants: 67.9 ± 14.6 AF: 73.1 ± 12.2 SR: 65.1 ± 15.0 | All participants: 43.1% AF: 51.8% SR: 38.3% | 265 | 22 | 243 (SR) | In AF group | 18 | 229 | 14 | 4 | 0% |
| Desteghe et al., 2017 (C) [46] | Inpatients | Cohort selected cross-sectional study | AliveCor | AliveCor algorithm (single-lead ECG) | 30 s | 6-lead ECG | - | - | 113 | 19 | 94 (SR) | In AF group | 15 | 92 | 2 | 4 | 0% |
| Desteghe et al., 2017 (D) [46] | Inpatients | Cohort selected cross-sectional study | MyDiagnostick | MyDiagnostick algorithm (single-lead ECG) | 60 s | 6-lead ECG | - | - | 113 | 19 | 94 (SR) | In AF group | 17 | 90 | 4 | 2 | 0% |
| Ford et al., 2022 (A) [10] | outpatients | Case–control selected cross-sectional study | Apple Watch 4 | Apple Watch 4 algorithm (single-lead ECG) | 30 s | 12-lead ECG | All participants: 76 ± 7 | All participants: 38% | 125 | 31 | 94 (SR) | In AF group | 6 | 76 | 0 | 6 | 29.6% |
| Ford et al., 2022 (B) [10] | outpatients | Case–control selected cross-sectional study | KardiaBand | KardiaBand algorithm (single-lead ECG) | 30 s | 12-lead ECG | All participants: 76 ± 7 | All participants: 38% | 125 | 31 | 94 (SR) | In AF group | 26 | 68 | 5 | 1 | 20% |
| Fu et al., 2021 (A) [47] | - | Case–control selected cross-sectional study | Wearable Dynamic ECG Recorder | Amazfit CardiDoc application (single-lead ECG) | 60 s | 12-lead ECG | All participants: 59 ± 11.16 AF: 64.00 ± 9.38 SR:55.15 ± 11.01 | All participants: 34% AF: 45.3% SR: 41% | 114 | 53 | 61 (SR) | Excluded | 47 | 61 | 0 | 4 | 1.8% |
| Fu et al., 2021 (B) [47] | - | Case–control selected cross-sectional study | Wearable Dynamic ECG Recorder | Amazfit CardiDoc application (single-lead ECG) | 60 s | 12-lead ECG | All participants: 59 ± 11.16 AF: 64.00 ± 9.38 SR:55.15 ± 11.01 | All participants: 34% AF: 45.3% SR: 41% | 114 | 53 | 61 (SR) | Excluded | 50 | 61 | 0 | 2 | 0.9% |
| Fu et al., 2021 (C) [47] | - | Case–control selected cross-sectional study | Wearable Dynamic ECG Recorder | Amazfit CardiDoc application (single-lead ECG) | 60 s | 12-lead ECG | All participants: 59 ± 11.16 AF: 64.00 ± 9.38 SR:55.15 ± 11.01 | All participants: 34% AF: 45.3% SR: 41% | 114 | 53 | 61 (SR) | Excluded | 50 | 61 | 0 | 2 | 0.9% |
| Van Haelst et al., 2018 (B) [11] | Outpatients | Cohort selected cross-sectional study | AliveCor | AliveCor algorithm (single-lead ECG) | 30 s | 12-lead ECG | All patients: 77.3 ± 8.0 AF: 78.8 ± 8.0 Non-AF: 75.9 ± 7.9 | All participants: 57.4% AF: 51.1% No AF: 63.3% | 190 | 75 | 93 (non-AF) | In AF group | 73 | 83 | 10 | 2 | 19.3% |
| Himmelreich JCL et al., 2019 [48] | Outpatients | Cohort selected cross-sectional study | KardiaMobile | KardiaMobile (AliveCor, Inc.) algorithm (single-lead ECG) | 30 s | 12-lead ECG | All participants: 64.1 ± 14.7 | All participants: 46.3% | 214 | 23 | 191 (SR) | In AF group | 20 | 187 | 4 | 0 | 1.4% |
| Lown et al., 2018 (A) [49] | Outpatients | Case–control selected cross-sectional study | AliveCor | AliveCor (Kardia version 4.7.0) algorithm (single-lead ECG) | 30 s | 12-lead ECG | All participants: 73.9 ± 6.1 | - | 418 | 82 | 336 (non-AF) | In AF group | 72 | 332 | 2 | 2 | 2.4% |
| Rajakariar et al., 2020 [50] | Inpatients | Cohort selected cross-sectional study | KardiaBand | AliveCor Kardia application V.5.0.2 (AliveCor, Mountain View, CA, USA) (single-lead ECG) | 30 s | 12-lead ECG | All participants: 67 ± 16 AF: 76 ± 11 SR: 64 ± 17 | All participants: 43.5% AF: 48% SR: 36% | 200 | 38 | 162 (SR) | No comment | 36 | 124 | 13 | 2 | 12.5% |
| Santala et al., 2021 (1) [41] | Inpatients | Case–control selected cross-sectional study | Suunto Movesense, Suunto, Vantaa, Finland (heart belt) | Awario, Heart2Save, Kuopio, Finland (single-lead ECG) | 24 h | 12-lead ECG | AF: 77 ± 10 SR: 68 ± 16 | AF: 48% SR: 60% | 159 | 73 | 86 (SR) | No comment | 73 | 82 | 4 | 0 | 0% |
| Santala et al., 2021 (2) (A) [51] | Inpatients | Case–control selected cross-sectional study | single-lead Necklace-embedded ECG recorder (Including Movesense ECG-sensor, Suunto, Vantaa, Finland, Necklace-ECG) | Awario, Heart2Save, Kuopio, Finland (single-lead ECG) | 30 s | 3-lead Holter ECG | AF (years): 72.7 ± 14.1 SR (years): 61.5 ± 18.1 | AF: 56.1% SR: 53.2% | 145 | 66 | 79 (SR) | No comment | 54 | 78 | 0 | 3 | 6.9% |
| Santala et al., 2021 (2) (B) [51] | Inpatients | Case–control selected cross-sectional study | single-lead Necklace-embedded ECG recorder (Including Movesense ECG-sensor, Suunto, Vantaa, Finland, Necklace-ECG) | Awario, Heart2Save, Kuopio, Finland (single-lead ECG) | 30 s | 3-lead Holter ECG | AF (years): 72.7 ± 14.1 SR (years): 61.5 ± 18.1 | AF: 56.1% SR: 53.2% | 145 | 66 | 79 (SR) | No comment | 58 | 75 | 0 | 1 | 7.6% |
| Santala et al., 2022 [52] | Inpatients | Case–control selected cross-sectional study | Firstbeat Bodyguard 2, Firstbeat Technologies | Awario, Heart2Save (single-lead ECG) | 24 h | 3-lead Holter ECG | AF: 77 ± 10 SR: 68 ± 15 | AF: 47% SR: 60% | 178 | 79 | 99 (SR) | No comment | 79 | 94 | 5 | 0 | 0% |
| Abu-Alrub et al., 2022 (A) [53] | - | Case–control selected cross-sectional study | Apple Watch Series 5® | Apple Watch Series 5® (single-lead ECG) | 30 s | 12-lead ECG | All participants: 62 ± 7 | All participants: 44% | 200 | 100 | 100 (SR) | Excluded | 87 | 86 | 1 | 7 | 9.5% |
| Abu-Alrub et al., 2022 (B) [53] | - | Case–control selected cross-sectional study | Samsung Galaxy Watch Active 3® | Samsung Galaxy Watch Active 3® (single-lead ECG) | 30 s | 12-lead ECG | All participants: 62 ± 7 | All participants: 44% | 200 | 100 | 100 (SR) | Excluded | 88 | 81 | 6 | 5 | 10% |
| Abu-Alrub et al., 2022 (C) [53] | - | Case–control selected cross-sectional study | Withings Move ECG® | Withings Move ECG® algorithms (single-lead ECG) | 30 s | 12-lead ECG | All participants: 62 ± 7 | All participants: 44% | 200 | 100 | 100 (SR) | Excluded | 78 | 80 | 3 | 2 | 18.5% |
| Wegner et al., 2020 (A) [54] | Inpatients | Cohort selected cross-sectional study | AliveCor Kardia ECG monitor | AliveCor Kardia ECG monitor algorithm (single-lead ECG) | 30 s | 12-lead ECG | All participants: 64 ± 15 | All participants: 38.4% | 92 | 27 | 65 (SR) | In AF group | 19 | 45 | 8 | 0 | 21.7% |
| Wegner et al., 2020 (B) [54] | Inpatients | Cohort selected cross-sectional study | AliveCor Kardia ECG monitor | AliveCor Kardia ECG monitor algorithm (single-lead ECG) | 30 s | 12-lead ECG | All participants: 64 ± 15 | All participants: 38.4% | 92 | 27 | 65 (SR) | In AF group | 15 | 39 | 3 | 0 | 38% |
| William et al., 2018 [55] | Inpatients | Case–control selected cross-sectional study | Kardia Mobile Cardiac Monitor | Kardia Mobile Cardiac Monitor (single-lead ECG) | 30 s | 12-lead ECG | All participants: 68.1 [42.6–85.6] | All participants: 32.7% | 223 | 80 | 143 (SR) | In AF group | 57 | 96 | 6 | 2 | 27.8% |
| Chan et al., 2016 (B) [32] | Outpatients | Cohort selected cross-sectional study | 1st generation; AliveCor Inc. | AliveECG application (version 2.2.2) (single-lead ECG) | 30 s | single-lead interpreted by cardiologists | All participants: 68.4 ± 12.2 | All participants: 53.2% | 1013 | 28 (AF) | 985 (non-AF) | In control group | 20 | 979 | 6 | 8 | 0% |
| Dörr et al., 2019 (D) [37] | Inpatients | Case–control selected cross-sectional study | AliveCor Kardia system | Heartbeats application (Preventicus GmbH, Jena, Germany) (single-lead ECG) | 30 s | single-lead interpreted by cardiologists | All participants: 76.4 ± 9.5 AF: 77.4 ± 9.1 SR: 75.6 ± 9.8 | All participants: 44.3% SR: 46.1% AF: 42.2% | 650 | 319 | 331 (SR) | Excluded | 279 | 262 | 7 | 1 | 15.5% |
| Orchard et al., 2016 [56] | Outpatients | Cohort selected cross-sectional study | AliveCor Heart Monitor | AliveCor Heart Monitor algorithm (single-lead ECG) | 30 s | single-lead interpreted by cardiologists | - | - | 972 | 38 | 934 (SR) | Excluded | 36 | 844 | 8 | 2 | 8.4% |
| Leńska-Mieciek et al., 2022 [57] | Inpatients | Cohort selected cross-sectional study | Kardia Mobile portable device (AliveCor Inc., San Francisco, CA, USA) | AliveCor app. (single-lead ECG) | 30 s | Single-lead ECG interpreted by cardiologist | All participants: 64.44 ± 10.52 | All participants: 48% | 50 | 1 | 49 (non-AF) | No comment | 1 | 42 | 7 | 0 | 0% |
| Lown et al., 2018 (B) [49] | Outpatients | Case–control selected cross-sectional study | WatchBP | WatchBP algorithm (modified sphygmomanometer) | - | 12-Lead ECG | All participants: 73.9 ± 6.1 | - | 418 | 82 | 336 (No AF) | In AF group | 79 | 314 | 22 | 3 | - |
| Lown et al., 2018 (C) [49] | Outpatients | Case–control selected cross-sectional study | Polar H7 | PH7: (A Real-Time Atrial Fibrillation Detection Algorithm Based on the Instantaneous State of Heart Rate) (ECG data sensor) | - | 12-Lead ECG | All participants: 73.9 ± 6.1 | - | 418 | 82 | 336 (No AF) | In AF group | 79 | 330 | 6 | 3 | - |
| Lown et al., 2018 (D) [49] | Outpatients | Case–control selected cross-sectional study | Bodyguard 2 | BG2 (A Real-Time Atrial Fibrillation Detection Algorithm Based on the Instantaneous State of Heart Rate) (heart rate variability) | - | 12-Lead ECG | All participants: 73.9 ± 6.1 | - | 418 | 82 | 336 (No AF) | In AF group | 79 | 331 | 5 | 3 | - |
| Reverberi et al., 2019 [58] | Inpatients | Case–control selected cross-sectional study | consumer-grade Bluetooth low-energy (BLE) HR monitor, of the chest-strap type | RITMIA™ (Heart Sentinel srl, Parma, Italy) (HR monitor) | - | 12-lead ECG | All participants: 66.2 ± 10.7 | All participants: 21.5% | 182 ** | 99 | 83 (non-AF) | Excluded | 96 | 79 | 4 | 3 | - |
| Chen et al., 2020 (C) [40] | Inpatients and outpatients | Case–control selected cross-sectional study | Amazfit Health Band 1S (Huami Technology, Anhui, China) | RealBeats Artificial Intelligence Biological Data Engine (Huami Technology) (PPG combined with single-lead ECG) | - | 12-lead ECG | AF: 70.4 ± 11.5 Non-AF: 59.3 ± 14.8 | AF: 43.3% Non-AF: 52.6% | 401 | 150 | 251 (non-AF) | Unclear | - | - | - | - | - |
Disclaimer/Publisher’s Note: The statements, opinions and data contained in all publications are solely those of the individual author(s) and contributor(s) and not of MDPI and/or the editor(s). MDPI and/or the editor(s) disclaim responsibility for any injury to people or property resulting from any ideas, methods, instructions or products referred to in the content. |
© 2023 by the authors. Licensee MDPI, Basel, Switzerland. This article is an open access article distributed under the terms and conditions of the Creative Commons Attribution (CC BY) license (https://creativecommons.org/licenses/by/4.0/).
Share and Cite
Manetas-Stavrakakis, N.; Sotiropoulou, I.M.; Paraskevas, T.; Maneta Stavrakaki, S.; Bampatsias, D.; Xanthopoulos, A.; Papageorgiou, N.; Briasoulis, A. Accuracy of Artificial Intelligence-Based Technologies for the Diagnosis of Atrial Fibrillation: A Systematic Review and Meta-Analysis. J. Clin. Med. 2023, 12, 6576. https://doi.org/10.3390/jcm12206576
Manetas-Stavrakakis N, Sotiropoulou IM, Paraskevas T, Maneta Stavrakaki S, Bampatsias D, Xanthopoulos A, Papageorgiou N, Briasoulis A. Accuracy of Artificial Intelligence-Based Technologies for the Diagnosis of Atrial Fibrillation: A Systematic Review and Meta-Analysis. Journal of Clinical Medicine. 2023; 12(20):6576. https://doi.org/10.3390/jcm12206576
Chicago/Turabian StyleManetas-Stavrakakis, Nikolaos, Ioanna Myrto Sotiropoulou, Themistoklis Paraskevas, Stefania Maneta Stavrakaki, Dimitrios Bampatsias, Andrew Xanthopoulos, Nikolaos Papageorgiou, and Alexandros Briasoulis. 2023. "Accuracy of Artificial Intelligence-Based Technologies for the Diagnosis of Atrial Fibrillation: A Systematic Review and Meta-Analysis" Journal of Clinical Medicine 12, no. 20: 6576. https://doi.org/10.3390/jcm12206576
APA StyleManetas-Stavrakakis, N., Sotiropoulou, I. M., Paraskevas, T., Maneta Stavrakaki, S., Bampatsias, D., Xanthopoulos, A., Papageorgiou, N., & Briasoulis, A. (2023). Accuracy of Artificial Intelligence-Based Technologies for the Diagnosis of Atrial Fibrillation: A Systematic Review and Meta-Analysis. Journal of Clinical Medicine, 12(20), 6576. https://doi.org/10.3390/jcm12206576