Article

Model Calibration of Pharmacokinetic-Pharmacodynamic Lung Tumour Dynamics for Anticancer Therapies

1
Research Group of Dynamical Systems and Control, Ghent University, 9052 Ghent, Belgium
2
Faculty of Medicine and Health Sciences, Antwerp University, 2610 Wilrijk, Belgium
3
EEDT—Core Lab on Decision and Control, Flanders Make Consortium, 9052 Ghent, Belgium
4
Cancer Research Institute Ghent, 9052 Ghent, Belgium
5
Department of Radiation Oncology, Iridium Cancer Network—GZA Hospitals Sint Augustinus, 2610 Wilrijk, Belgium
6
Department of Radiotherapy, Faculty of Medicine and Health Sciences, Antwerp University, 2610 Wilrijk, Belgium
7
Department of Automatic Control, Technical University of Cluj Napoca, 400114 Cluj, Romania
*
Author to whom correspondence should be addressed.
J. Clin. Med. 2022, 11(4), 1006; https://doi.org/10.3390/jcm11041006
Submission received: 30 November 2021 / Revised: 2 February 2022 / Accepted: 9 February 2022 / Published: 15 February 2022
(This article belongs to the Special Issue Lung Cancer: Symptoms, Treatment, and Early Diagnosis)

Abstract

:
Individual curves for tumor growth can be expressed as mathematical models. Herein we exploited a pharmacokinetic-pharmacodynamic (PKPD) model to accurately predict the lung growth curves when using data from a clinical study. Our analysis included 19 patients with non-small cell lung cancer treated with specific hypofractionated regimens, defined as stereotactic body radiation therapy (SBRT). The results exhibited the utility of the PKPD model for testing growth hypotheses of the lung tumor against clinical data. The model fitted the observed progression behavior of the lung tumors expressed by measuring the tumor volume of the patients before and after treatment from CT screening. The changes in dynamics were best captured by the parameter identified as the patients’ response to treatment. Median follow-up times for the tumor volume after SBRT were 126 days. These results have proven the use of mathematical modeling in preclinical anticancer investigations as a potential prognostic tool.

1. Introduction

Described as a societal challenge of the modern world [1], the lung cancer paradigm leads the research progress towards increasing the effectiveness of curative treatment options, with positive outcomes in decreased morbidity and improved patient life. The scientific community recognizes the difficulties encountered in lung cancer, proposing a shift of paradigm towards a multidisciplinary approach to reach drug dosing optimality [2,3,4,5].
The prognostic and predictive implications of biological response after treatment in terms of describing tumor dynamics are captured by mathematical models, validated with in vitro experimental or clinical data. In the context of tumor modeling, the classical approach provides [6,7]:
  • exponential-linear models [8,9],
  • logistic and Gompertz models [9,10,11],
  • dynamic carrying capacity models [12],
  • Von Bertalanffy and power law models [13,14].
Most principles of tumor growth are expressions of ordinary differential equations [15], but recent advances suggest that complex biological phenomena can be captured by adopting fractional calculus with non-integer order differentiation [16,17,18,19,20,21,22,23]. Quantitative analysis can be done in a variety of experimental settings, including in vitro and in vivo studies, involving animal or human data, for preclinical anticancer drug investigations in all existing therapies (i.e., radiotherapy, chemotherapy, immunotherapy, targeted drug therapy) [24,25,26,27,28]. Tumor growth kinetics follow the purely phenomenological approach from an initial exponential phase followed by a linear regimen, a mathematical formalism that can be characterized as pharmacokinetic and pharmacodynamic modeling [29,30,31].
In this work, a pharmacokinetic-pharmacodynamic (PKPD) model of radiotherapy is developed with a description of the following features: (i) the proliferation of the tumor, (ii) the necrosis of tumor cells, (iii) the clearance and inhibitory effect of the therapy, and (iv) the therapeutic effect of ablative radiation. The model is a revision of our previous work described in [29] and adjusted for integrating the rationale for dose fractionation, according to each patient RT schedule. For lung tumors, the computed dose distributions strongly depend on the accuracy of the predictions based on the model. In SBRT, a very high biologically effective dose (BED) is delivered to the center of the targeted tumor, while delivering a high dose to the clinical target volume and a minimized dose to normal tissue. Detailed theoretical analyses concluded that higher BED irradiated during a short period must be administrated to achieve successful local control of lung cancer cell dynamics.
The interventional study presented here provides one of the first investigations into how mathematical PKPD parameters correlates with SBRT dose distributions for patients with primary NSCLC or lung metastases. It has a pivotal role in using mathematical formulations in predicting the clinical outcome after SBRT in real treatment applied on patients, instead of in vitro studies or in vivo on animal models (i.e., mice). Our work provides an important opportunity to advance the understanding of using mathematical models as tools in treatment planning for describing the current state and evolution of lung tumours, depending on inter- and intra-patient variability. This realistic PKPD model allows for different time-dose schemes for therapy administration to be evaluated and compared, taking into account the diffusion pattern and tumor dynamics observed. Since radiation-induced pneumonitis is a severe side-effect whose probability to occur primarily depends on the total dose and the volume of irradiated tissue, the dose-calculation algorithm is considered highly relevant in treatment planning support. Prediction of tissue behavior concerning the model parameters can have differences in patient and tumor characteristics, length of time interval follow-up, and definition of requirements to validate the tumor progress. This model is then a cross-fertilization between current medical practice information tools and prediction models available for tumor growth.
We conducted a small pilot study of 22 patients with non-small cell lung cancer (NSCLC) treated with stereotactic body radiation therapy (SBRT) in order to analyze in mathematical terms the relationship between a given physical absorbed dose and the resulting biological response, quantifying the influencing factors as well. The obtained results for tumor volume are comparable to the measured variables in clinical practice, for the same radiotherapy (RT) regimen. Nevertheless, given the treatment management particularity established from histology, molecular pathology, age, comorbidities, and patient preferences, patient-to-patient variability in response to RT is still debatable for the influence on the development of individualized treatment modality.
The main scope of this work is to calibrate and validate the application of PKPD model for SBRT in patients with NSCLC and encourage its use in the decision-making process about treatment management, as a recommended additional supportive tool.

2. Materials and Methods

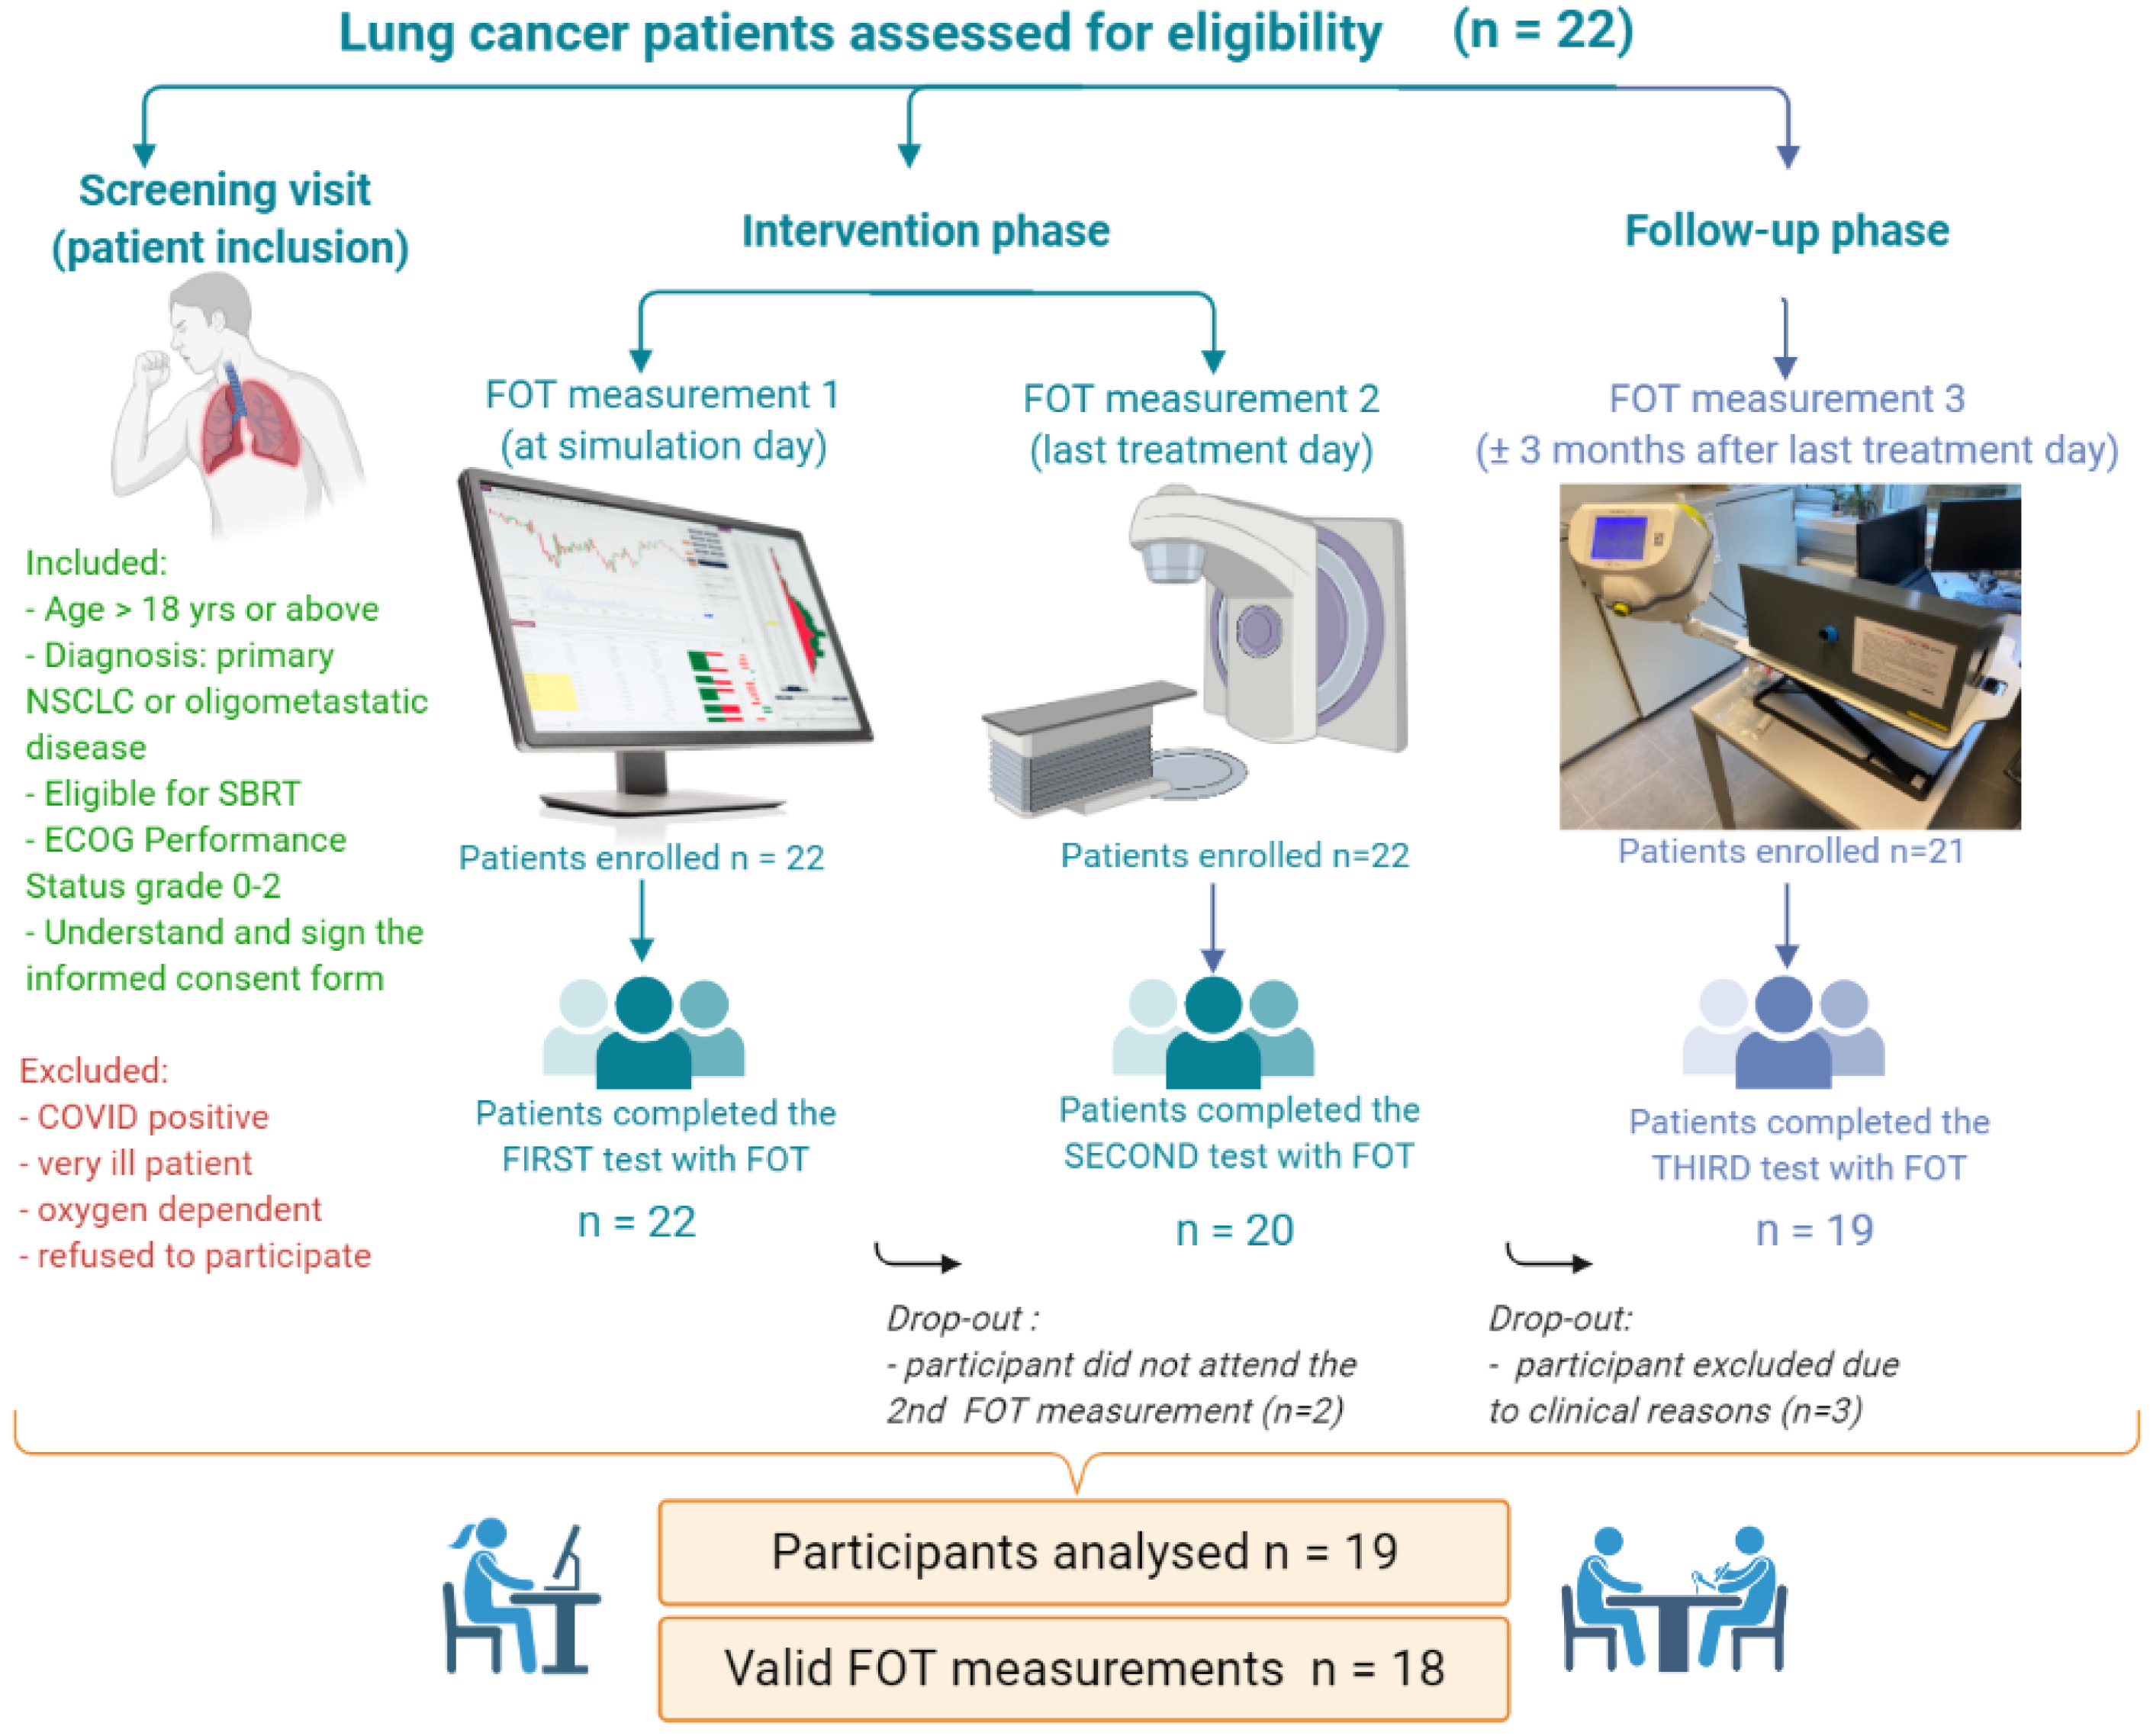
2.1. Clinical Study Design

The data set for this study was assessed under a non-randomized clinical trial performed at GasthuisZusters Hospital Sint-Augustinus in Antwerpen, Belgium, entitled “Respiratory impedance models for non-invasive lung function testing in individualized stereotactice body radiation therapy (RIMIRT)” (CTOR20105GZA). Prior to commencing the study, ethical clearance was provided. The study was approved by the Medical Ethics Committee GZA and was conducted in accordance with the Declaration of Helsinki, the guidelines for Good Clinical Practices (ICH-GCP), and any applicable regulatory requirements.
The results presented in this work provide a proof of concept for the proposed modeling strategy by means of calibrating the PKPD model with the tumor volume from the patient database. The procedures performed throughout the clinical study are outlined following the events schedule:
1.
Screening visit (patient inclusion). Eligibility of the patient is determined according to the inclusion/exclusion criteria and screening assessments are recorded, as shown in Table 1 (i.e., anthropometric data, diagnosis, the extent of cancer, tumor characteristics and localization, medical history, concomitant medication, spirometric and plethysmographic data (if available)).
2.
Intervention phase. Once enrolled, fully eligible patients will start with the intended SBRT treatment and specific clinical information about the scheme of treatment is provided (dose fractionation, dose distribution details, duration of administration, and concomitant therapies.) The tumor volume was measured by the radiation oncologist using CT scans done for RT treatment simulation.
3.
Follow-up phase (usually 3 months after last treatment day). The tumor volume was measured by the radiation oncologist using CT scans done after RT administration, during the follow-up visit.
In this flow diagram, the use of the forced oscillation technique (FOT) as a maneuverless, easy to perform a lung function test is introduced. Details on the use of this technique are given in [16,19,32,33]. The complementary information from the FOT measurements is out of the scope of this paper, but the end goal of the clinical study is to minimize model uncertainty by injecting respiratory mechanics variables into the PKPD model.
Table 1. Characteristics of participants completing the study.
CharacteristicValue (n = 19 Patients)%
Age (y)
        Median67.84(46–80)
Sex
        Men1263.2%
        Women736.8%
Site of original primary tumor
        Lung1052.6%
        Colon421%
        Rectum210.5%
        Other sites 1315.8%
Primary tumor histology
        Adenocarcinoma947.4%
        Spinocellular carcinoma421%
        Mucinous carcinoma15.3%
        Clear cell carcinoma15.3%
        Unknown/NA421%
Primary or metastatic lung lesion
        Primary947.4%
        Metastatic1052.6%
TNM Classification of Malignant tumors 2
        T0N0M11052.6%
        T1N0M0736.8%
        T2N0M0210.5%
Tumor localization (by lobe side)
        Right side1263.2%
        Left side526.3%
        Both sides210.5%
Tumor localization (by tumor position within the lobe)
        Upper lobe736.8%
        Lower lobe947.4%
        Upper and lower lobe210.5%
        Mid lobe15.3%
Number of lesions
        1 lesion1684.2%
        2 lesions210.5%
        3 lesions15.3%
ECOG Performance Status 3
        ECOG 0736.8%
        ECOG 11157.9%
        ECOG 215.3%
Smoking history
        Active947.4%
        Ex-smoker526.3%
        Never526.3%
Respiratory disorders
        COPD 4842.1%
        Other respiratory disorders 5210.5%
        NA947.4%
Medical history
        Previous surgeries 6842.1%
        Previous RT 7421%
        No previous interventions947.4%
Fractionation schemes
        1 × 34 Gy2/229%
        3 × 18 Gy9/2240.9%
        4 × 12 Gy10/2245.5%
        8 × 7.5 Gy1/224.5%
Concomitant cancer therapy
        Chemotherapy—Xeloda (Capecitabine)15.3%
Abbreviations: NA = not applicable, ECOG = Eastern Cooperative Oncology Group, COPD = Chronic Obstructive Pulmonary Disease, GOLD = Global Initiative for COPD. 1 Other sites: sigmoid, hypopharynx, kidney. 2 TNM is a globally recognised standard for classifying the anatomical extent of tumor cancers. TNM stage is classified at the time of RT treatment. T: size or direct extent of the primary tumor (T0: no evidence of tumor, T1, T2: size and/or extension of the primary tumor), N: degree of spread to regional lymph nodes (N0: no regional lymph nodes metastasis), M: presence of distant metastasis (M0: no distant metastasis, M1: metastasis to distant organs). 3 ECOG Performance Status: 0-Asymptomatic (fully active, able to carry on all predisease activities without restriction), 1-Symptomatic but completely ambulatory (restricted in strenuous activity, ambulatory and able to do light work.), 3-Symptomatic, <50% in bed during the day (capable of all self care, but no work activities, out of bed >50% of day). 4 COPD types: GOLD 3 (severe) and GOLD 4 (very severe). 5 Other respiratory disorders: asthma, pneumonitis. 6 Previous surgeries of the: lung cancer (pneumonectomy, lobectomy), kidney (nephrectomy), colon cancer, breast cancer. 7 Previous radiation treatment for: lung, prostate, hypopharynx.

2.2. Participants Data

The study included a total of 22 patients (19 eligible) with NSCLC, who are medically inoperable or high-risk surgical candidates, treated with various combinations of dose-rate and fractionation. The detailed flow diagram of the study participants can be depicted in Figure 1. Advanced technologies were used for delivering curative RT safely, given by linear accelerators producing X-rays with high-energy [1,3,34,35].
The patients enrolled in the interventional pilot study satisfied all the inclusion criteria: male or female, aged 18 years or above, diagnosed with primary NSCLC or oligometastatic disease eligible for SBRT, having an Eastern Cooperative Oncology Group (ECOG) Performance Status grade 0–2. Each patient signed an informed consent form (ICF) indicating that he/she understands the purpose and procedures required for the study and is willing to participate in the study and comply with all the requirements.Three patients are missing from reported data, one did not attend the second and third visit of the study, while two patients were drop-out due to clinical reasons of disease progression.
The characteristics of the participants that completed the study are listed in Table 1. 19 patients were eligible, of which 3 patients had multiple lesions treated separately. Therefore, a total of 22 treatments schemes specific to each tumor were considered. Data collected during the screening evaluation includes, but is not limited to demography, diagnosis, and extent of cancer (site of original tumor, histology, primary or metastasis, TNM stage, tumor localization, number of lesions), ECOG performance status, smoking history, medical history (previous RT treatments and/or cancer resection surgeries, respiratory disorders), cancer resection surgeries), fractionation schemes and concomitant cancer therapy. At the follow-up visit, the patients underwent computed tomography (CT), for evaluation of treatment efficacy and the tumor volume is measured again (if still exist). For the purpose of comparison principles, the oncologist performed the same method of tumor measurement as used for the screening visit.

2.3. Treatment Strategy—Clinical Protocol

Of the various lung cancer treatment protocols, SBRT is the standard of care for medically inoperable patients with peripherally located, early-stage NSCLC (non-small cell lung cancer) or for the patients that refuse the surgical resection of the tumor.
Decisions about the recommended radiotherapy regimen were based on a multidisciplinary discussion to provide consensus for SBRT applicability, safety, and risks, in order to better assist management care and individualized treatment. For SBRT simulation, planning, and delivery, commonly used prescription doses and normal tissue dose constraints were taken into consideration by the medical team from GZA hospital, based on published experience and current guidelines [36,37,38,39,40], ongoing trials, historical data, modeling, and empirical judgment. Treatment planning was performed using a TrueBeam linear accelerator (Varian Medical Systems) and dose calculations were carried out with a colapsed cone convolution algorithm (RayStation TPS, RaySearch Laboratories) characterised by a set of user-definable configuration parameters [41,42].
The treatment planning uses prior knowledge highlighted in clinical practice recommendations for stereotactic treatments [36,37,38,39,40,43,44]. The dose and fractionation regimens, as presented in Table 2, are patient-specific and limited by a subset of historically used maximum dose constraints. However, the regimens used can be included in 4 subgroups, based on a multidisciplinary discussion, weighing the potential benefit over the patient risk.
Tumor size is determined by measuring the “tumor area” defined from the CT scans and is represented as a multiplication of the largest diameter of the tumor by the greatest perpendicular diameter [45]. The tumor volume is assessed twice: before RT (from the CT scan done for RT treatment simulation) and after RT (from the CT scan done after RT treatment during the follow-up visit, usually after 5 months). The time between the measurements is expressed for each patient, this criterion being important for the simulations.
For predicting the risk of radiation-induced toxicity (radiation pneumonitis (RP)) in future research, other dose-volume histogram (DVH) parameters are assessed. First, the lung V20 is defined as the percentage of normal lung receiving at least 20 Gy, being proportional with the total lung volume (TLV) [46]. Second, the mean lung dose (MLD) is expressed as the average dose of the CT-defined TLV [47]. Finally, lung V5 is introduced as a new dose constraint in treatment planning where TLV receiving a dose of 5 Gy should not exceed 60% [48].

2.4. Mathematical Formulation

Pharmacokinetic and pharmacodynamic interactions were simulated based on our prior work [29] which contained relevant model coefficient values from the literature. This revision is proposed by employing the PKPD compartmental model to real clinical data from patients with NSCLC. To extend the utility of the existing model, its parameters and structure were reviewed for analysing the clinical outcome obtained in clinical practice for the applied treatment, quantified by measuring on CT images the tumor area before and after SBRT.
Taking into consideration the proliferating tumor volume (x1 in mm3) and the necrotic tumor volume (x2 in mm3), the total tumor volume can be expressed. Since the exact therapy of each patient is simulated, it is not argumentative for the tumor volume to possess comparable dimensions with the ones reported by clinicians. In this model representation, the inhibitor level x3 in mg/(mL · day) is expressed based on the radiation dose rate administrated ur (mg · day/mL), according to the dosing regimen for NSCLC. The equivalent mass of the tumor from approximation formula 1 mm3 = 10−3 mg [34,49] was used to calibrate radiotherapy model parameters via a unit transformation from Gy ⟶ 1/mL.
Considering these features, the tumor growth dynamic model, entitled as PKPD model, has been characterized using the following equations:
x ˙ 1 = ( a n ) x 1 E · x 1 x ˙ 2 = n x 1 + E · x 1 x ˙ 3 = c a x 3 + u a x e ˙ 3 = c a x e 3 + E t a · x 3 x ˙ 4 = c i x 4 + u i x e ˙ 4 = c i x e 4 + E t i · x 4 x ˙ 5 = c r x 5 + u r x e ˙ 5 = c r x e 5 + E t r · x 5
where a denotes the tumor growth rate, n the necrosis rate, and c r is the clearance rate on the Michaelis-Menten kinetics x 1 x 3 E D 50 r + x 3 (mm 3 /day). The parameters x e i and E t i are the effect drug concentrations, and the synergic effect between tumor cells and chosen therapy [50]. The model is a representation of combined therapies, respectively antiangiogenic, immunotherapy, and radiotherapy, respectively. Combining the effects of radiation therapy with the tumor incidence, produces a dose-response relationship, with a Hill slope deciding the interaction factor:
I = U n t + U n r + σ U n r · U n t
with σ denoting the amount of synergy present between the drugs. As a function of concentration, the Hill equation is expressed through the effect drug concentrations x e i which is normalized to its corresponding half effect concentration C 50 .
U n r = U r C 50 r
To solve the pharmacology of the therapy used, the Hill equation is considered as follows:
E f f e c t = I γ 1 + I γ
where γ describes the patient drug responsiveness or drug resistance (curve’s sigmoidicity generated while using the Hill equation).
Table 3 provides the parametric model coefficients for the generic tumor representation. Given the GTV tumor volume provided by CT screening (from Table 2), this can be used to calibrate the PKPD model. The equivalent mass of the tumor from approximation formula 1 mm3 = 10−3 mg [29] was used to calibrate radiotherapy model parameters via a unit transformation from Gy ⟶ 1/mL. In order to set a reference value for the tumor value, we propose to quantify the volumetric difference between total tumor tissue and necrotic tissue, that is the effective volume still active in the tumor (in mm3):
δ V t = T o t a l V o l u m e N e c r o t i c V o l u m e
Given the fact that in clinical practice for our study case, no other therapies have been used for the presented patients, the PKPD model coefficients that correspond to immunotheraphy and antiangiogenesis therapy, respectively, have been set with 0 values for model calibration. The proposed model can be further investigated with the purpose of evaluation of the synergic effects caused by the use of multiple anticancer therapies.
Table 3. Coefficients parameters corresponding with PKPD model applied on the study cohort.
ParameterNameValueUnitsSource
atumor growth rate0.6931/day[34,49]
nnecrosis rate0.101/day[34,49]
c r clearance rate RT3/treatment days1/day[34]
C 50 r half-effect concentration RT20Gy/day[34]
C 50 t half-effect tumor growth50% mm3[34,51]
E m a x r max effect RT50%[34,51]
γ patient responsevaries (0.043-0.25)(-)[52]
σ drug reaction (synergic)8(-)[52]
Ecombined effects (all)calculated1/dayNA
u r radiotherapy dose ratevariesmg/(mL·day)Table 2
Abbreviations: NA = source not available.

2.5. Analysis

In order to examine the model sensitivity to unknown variability of the tumor volume, an analysis was made. Specifically, tumor volume uncertainty has been introduced and the end result in tumor volume decrease has been examined. Although the CT scans are delivering accurate information on tumor volume, it is not intended as a recurrent tool of investigation for patient safety and minimizing radiation risks. It is, therefore, necessary to allow uncertainty in the model while providing the medical staff with a certain measure of error they can accommodate in their tumor dynamics predictions.
The tumor volume reported using CT images was used as the baseline for comparison with the simulated values obtained with the PKPD model. A linear approach for modeling the relationship between the two sets of values for tumor volume after SBRT was used, as well as the display of all tumor measurements corresponding to each patient. As different dose regimens of therapy were administrated, their efficacy was separately evaluated.
To analyse the treatment efficacy, the percentage change in tumor volume (TV) was calculated using the following formula:
E f f i c a c y ( % ) = 100 ( T V f i n a l T V i n i t i a l ) · 100
where T V f i n a l describes the tumor volume measured from the second CT scan in the last day of patient monitoring, as depicted in Table 2, and T V i n i t i a l is the tumor volume acquired in the first CT scan on the simulation day.

3. Results

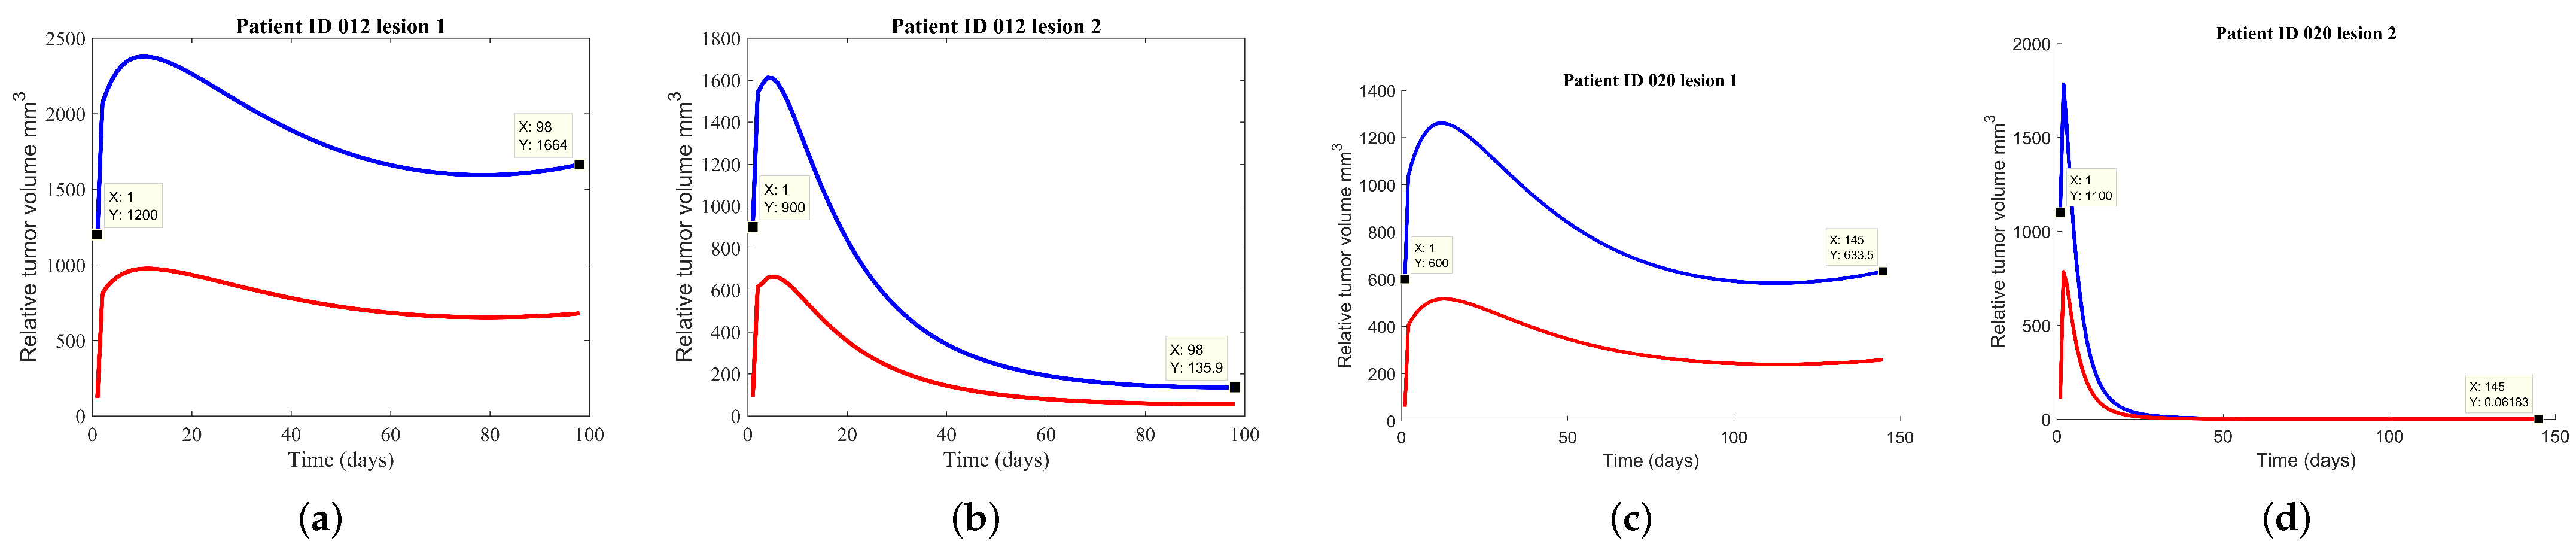
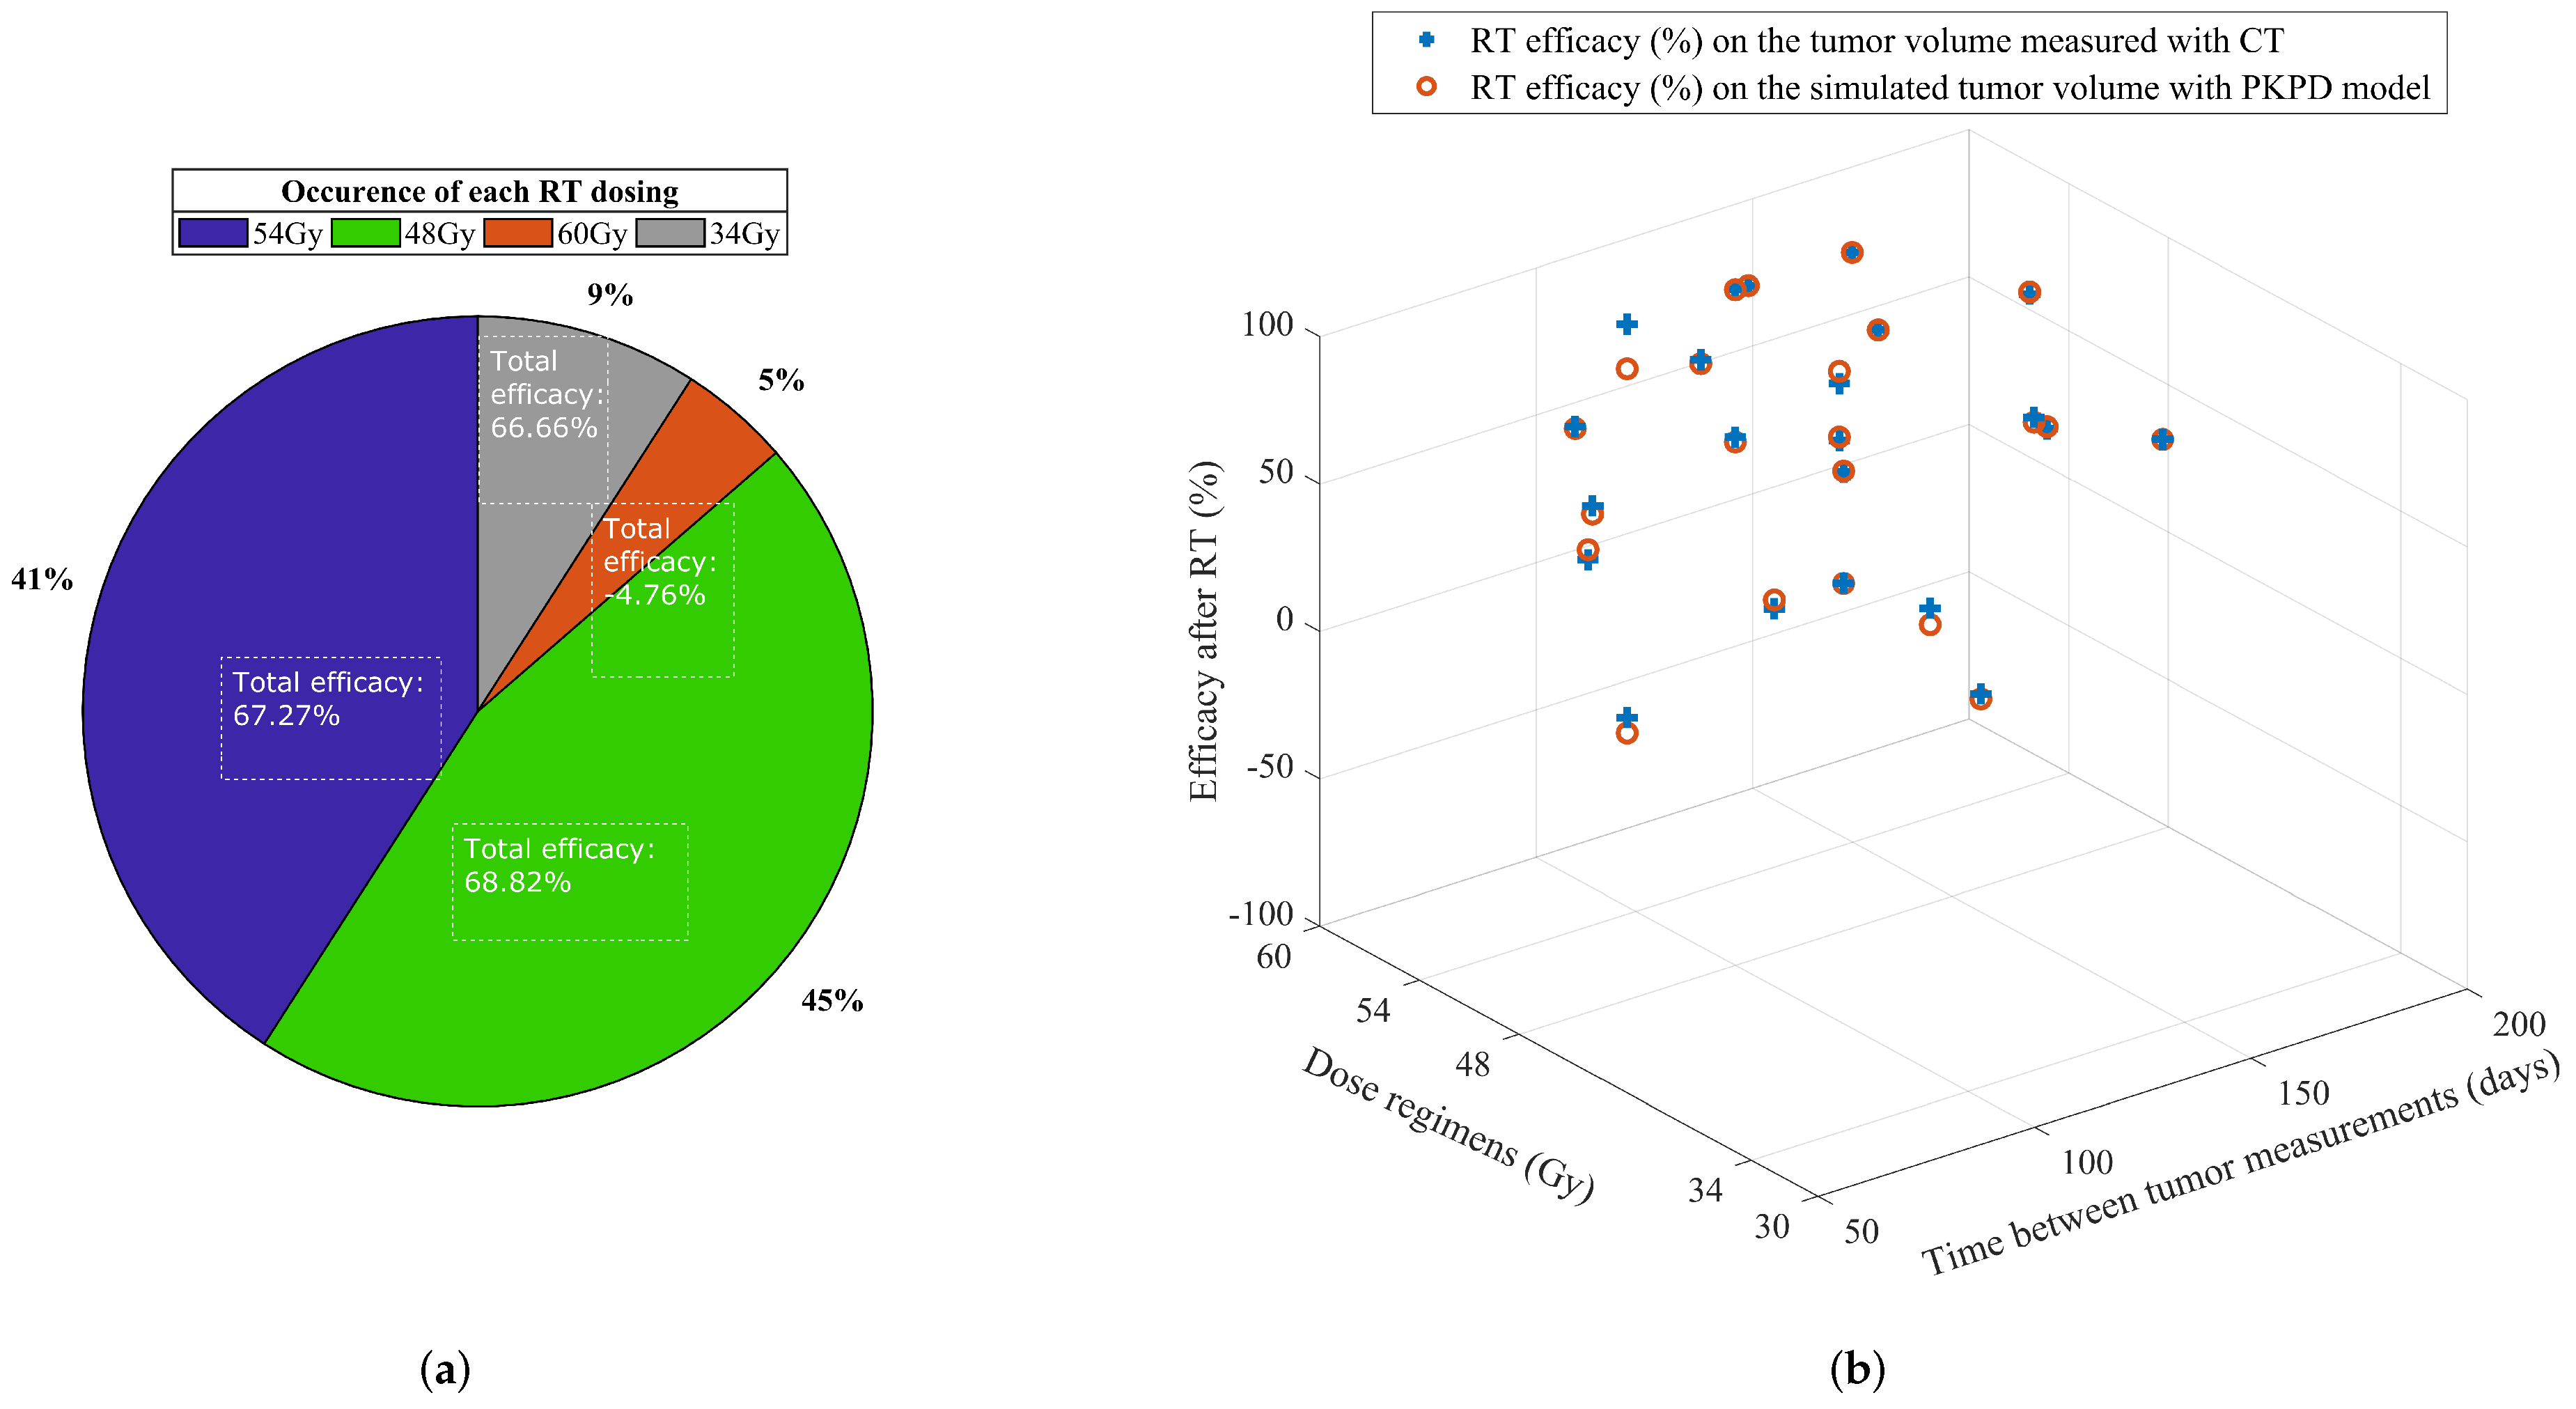
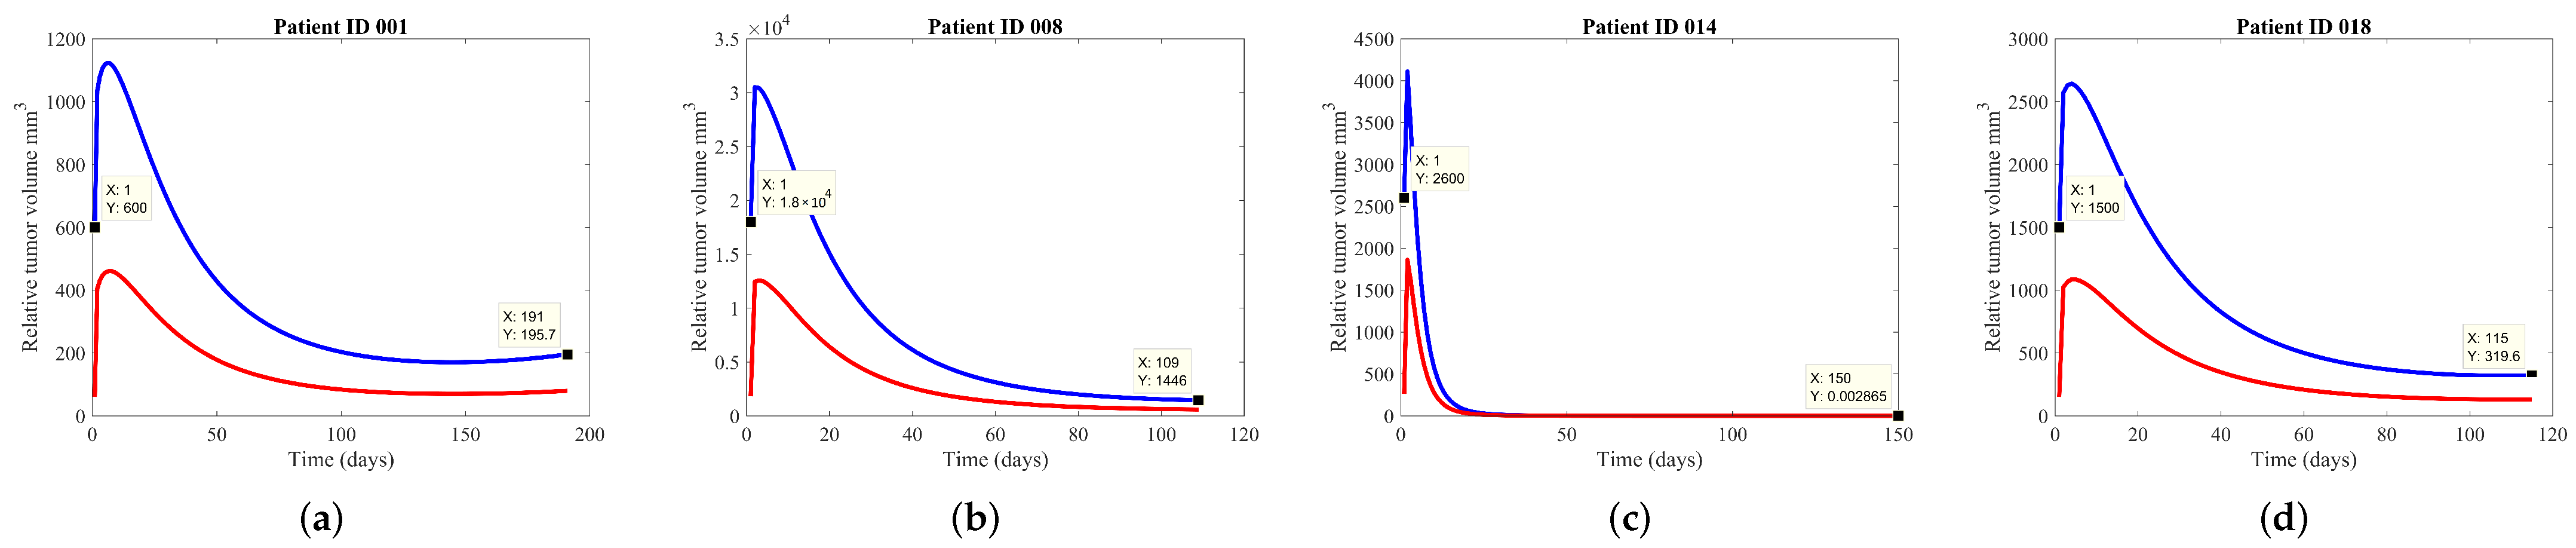
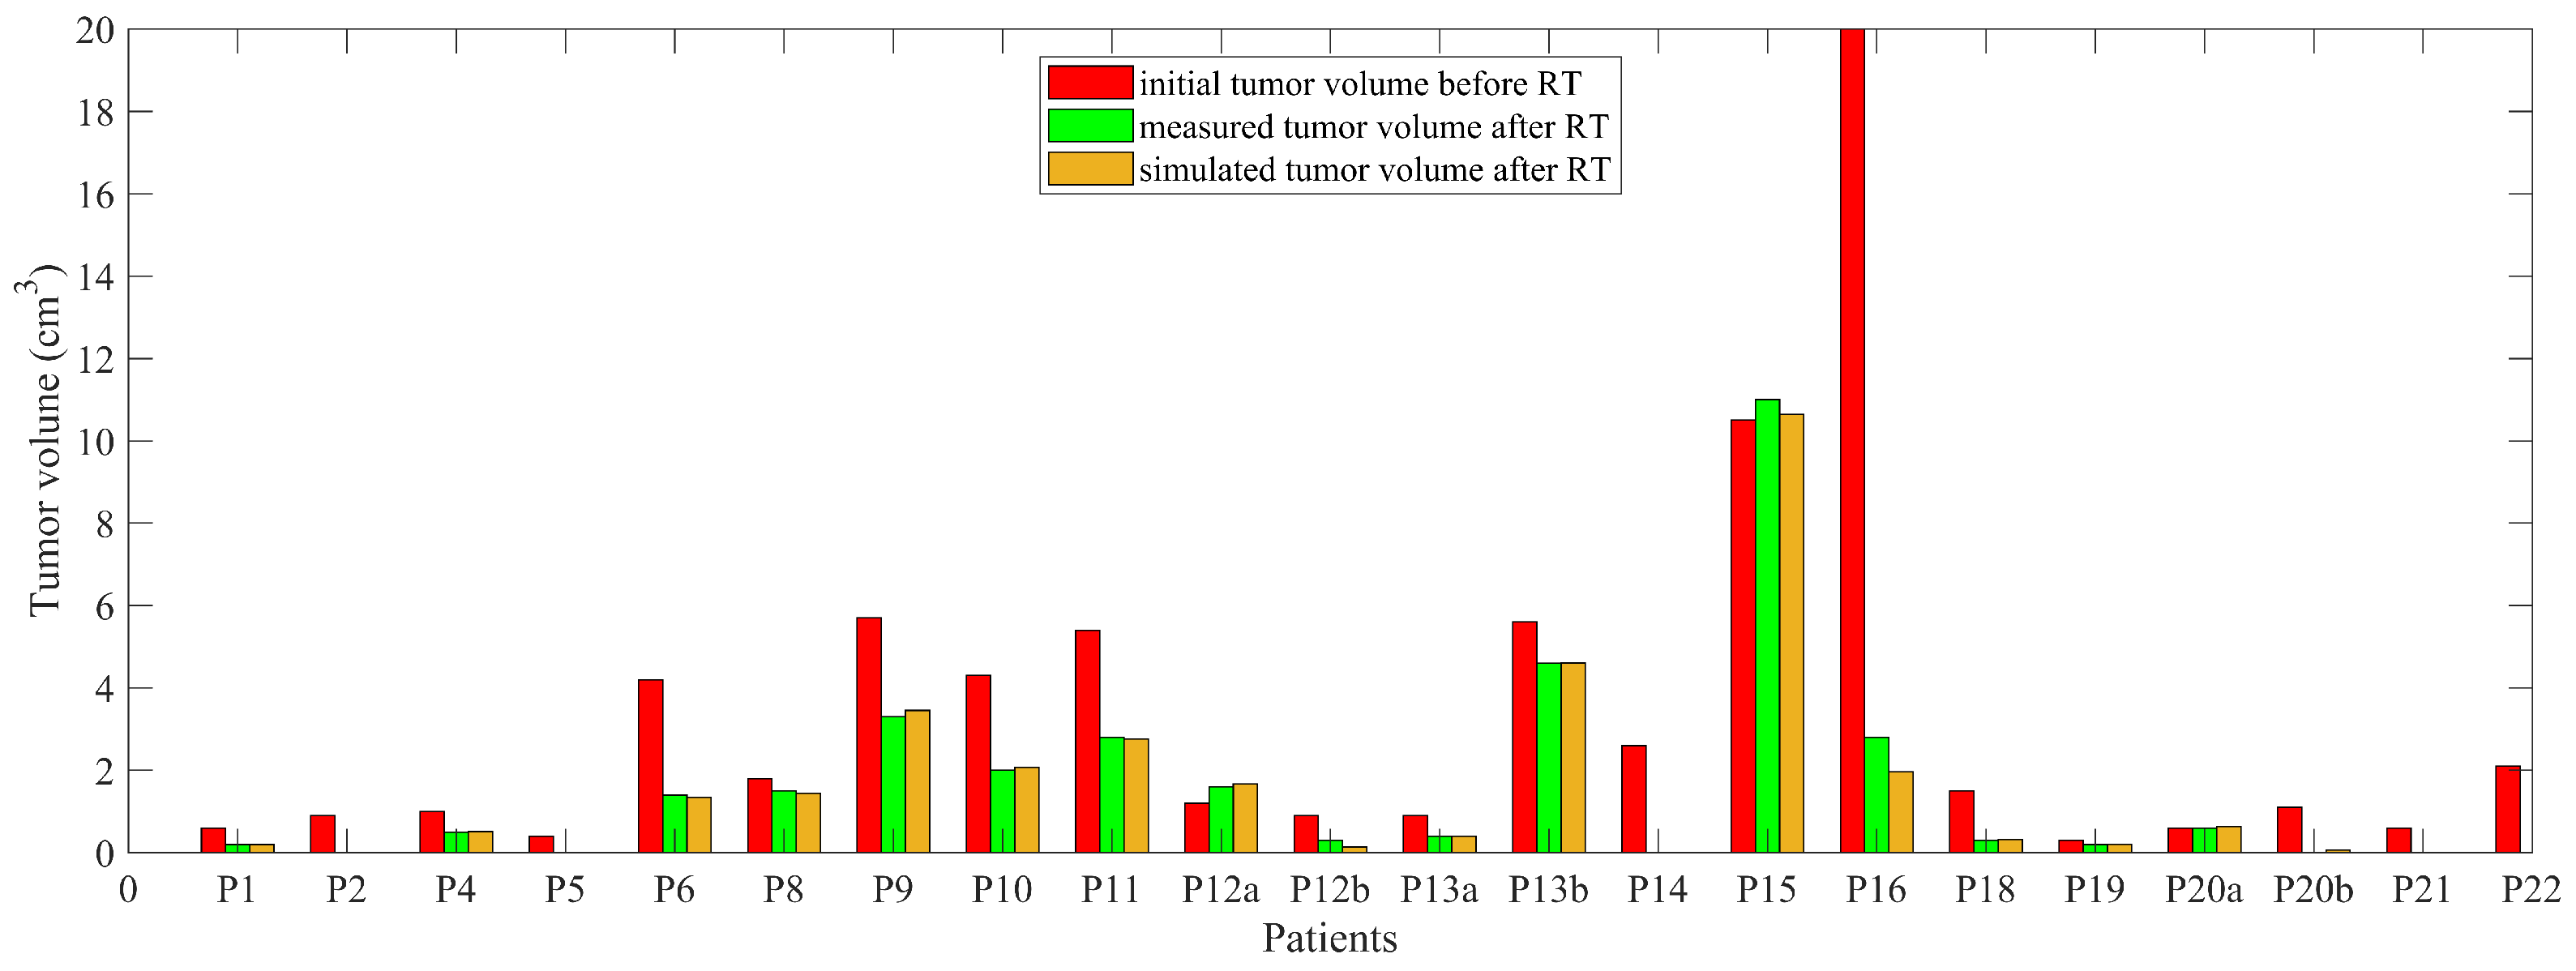
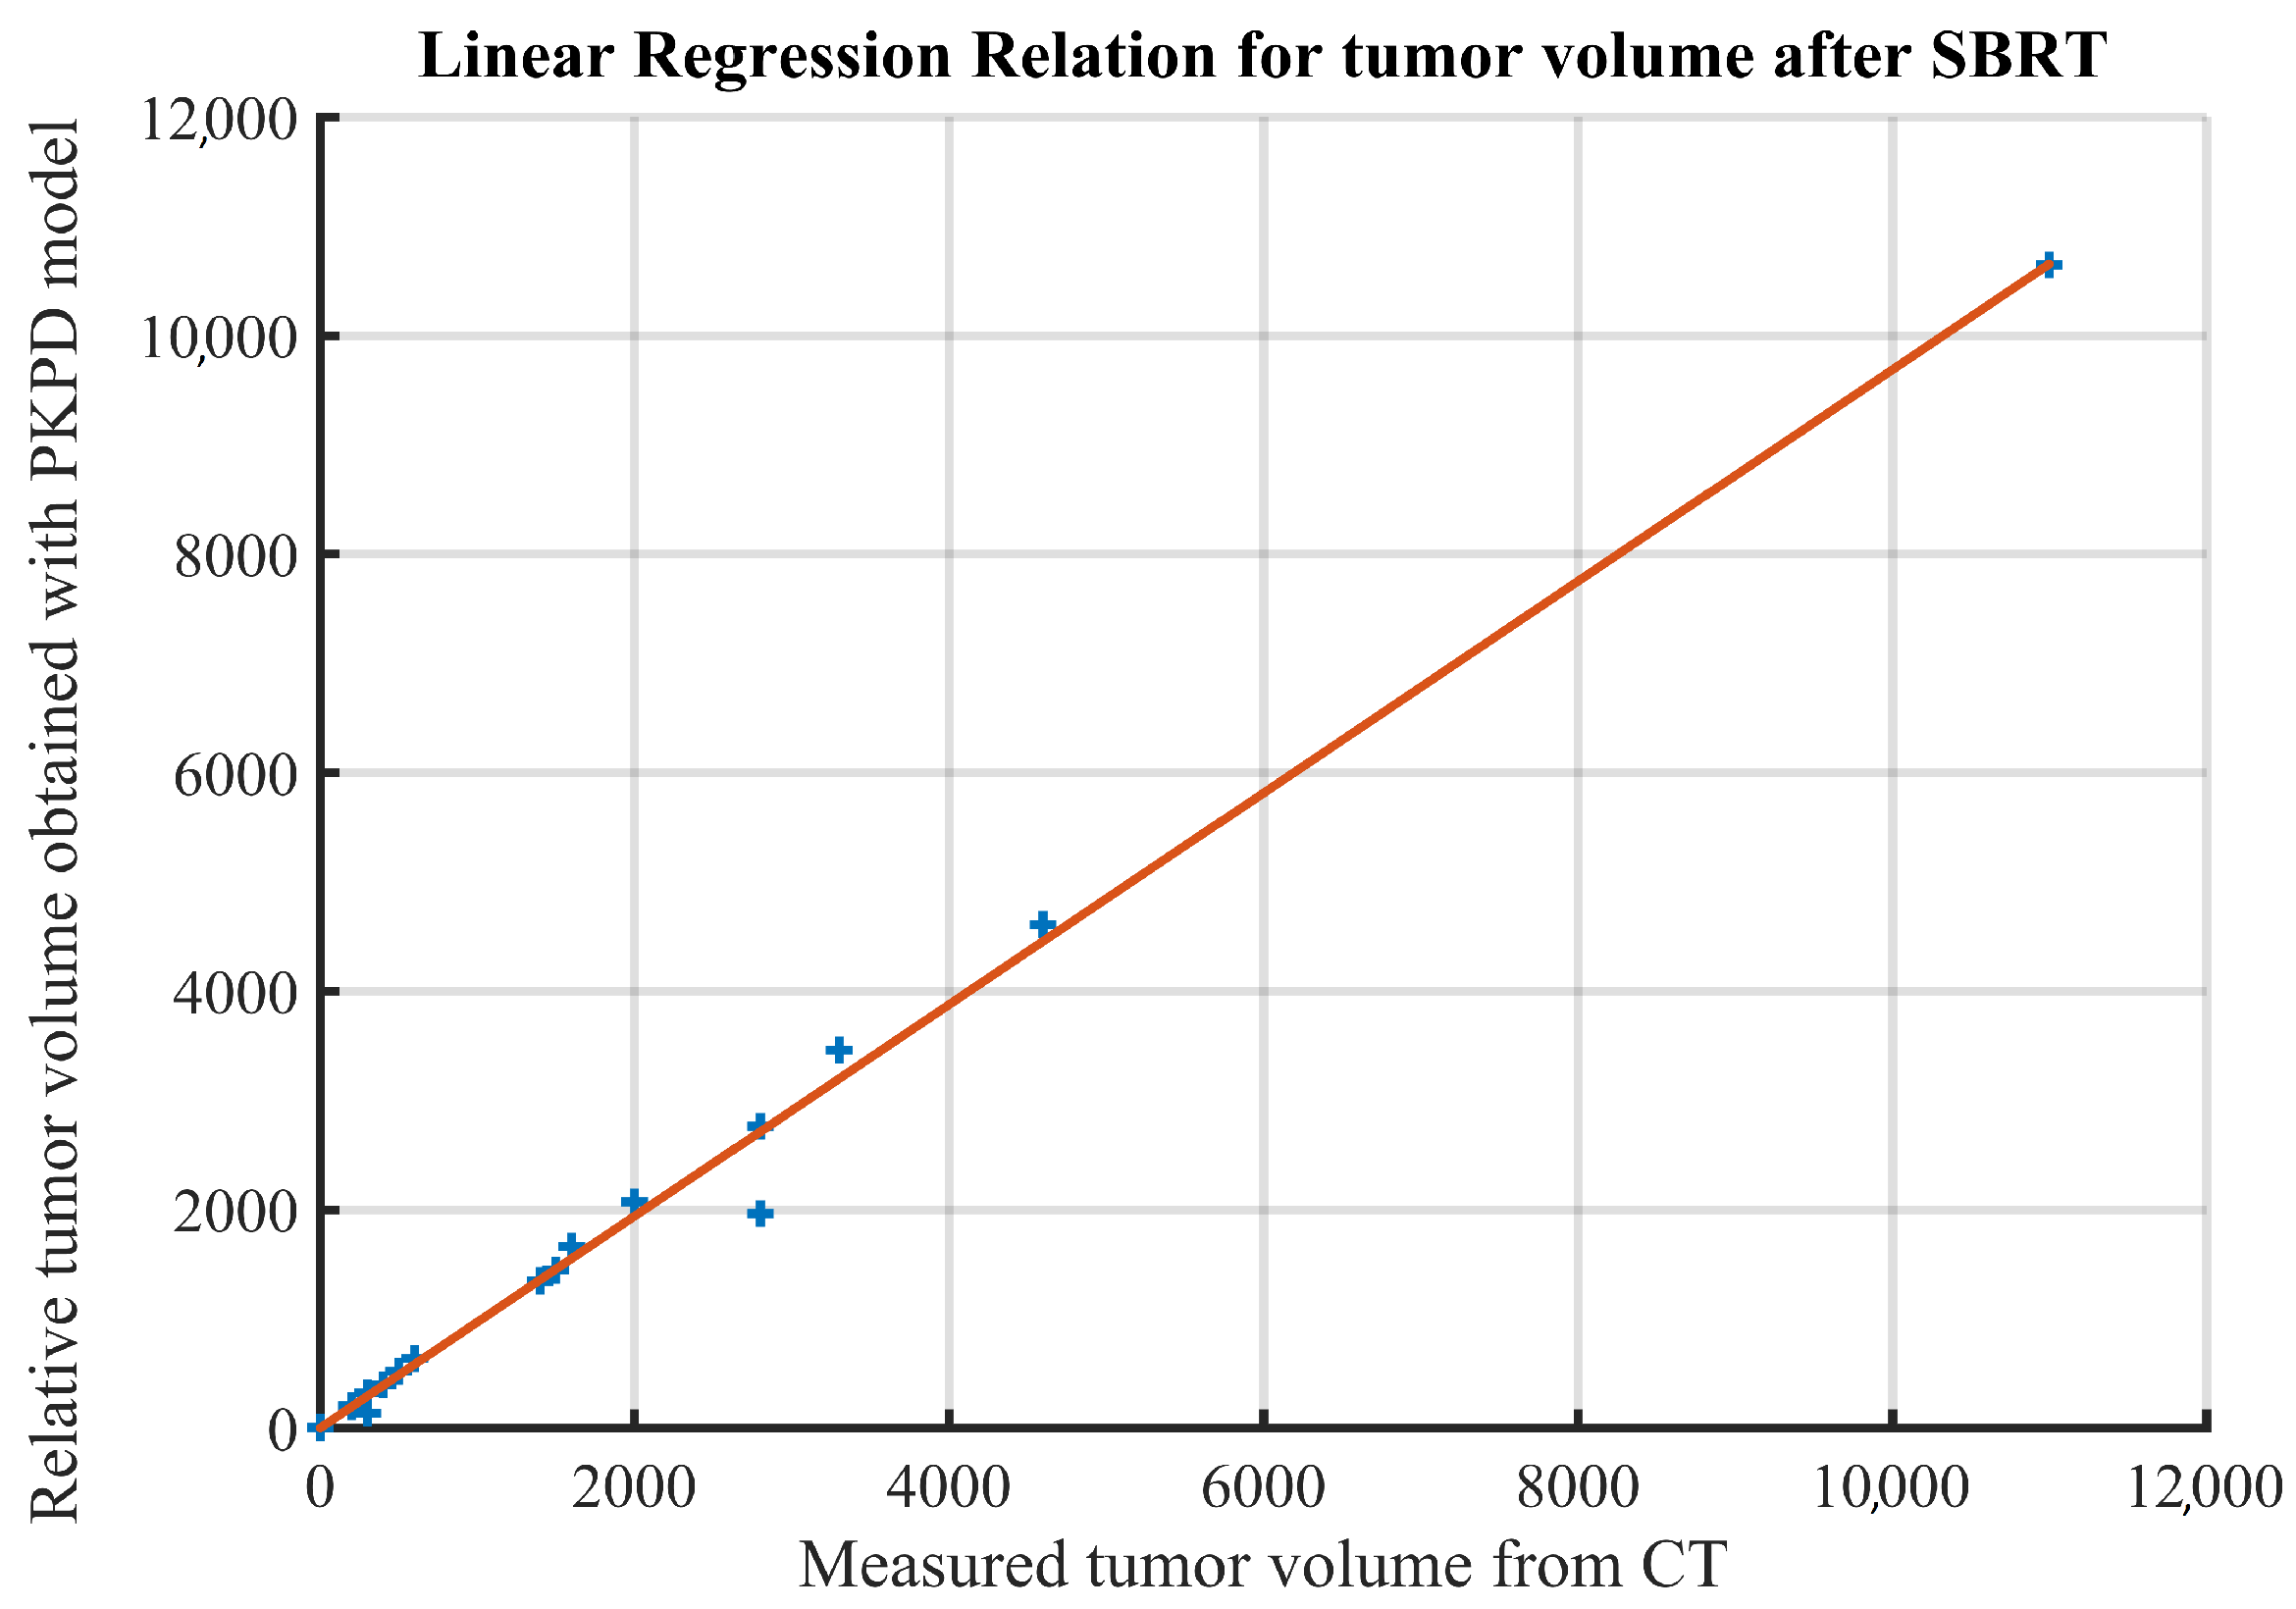
3.1. Prediction of Tumor Volume

The main rationale that guided our representation of tumor growth is the argument that the tumor existent at the lung site is represented by the total tumor volume (i.e., ‘alive’ and ‘dead’ tumor cells), and the washout of the dead tumor cells that suffered from apoptosis is still in process. Therefore, the measured volume for CT screening of the patients is taking into account the entire tumorous mass. In Figure 2, examples of the data for the patients with single lesions treated with SBRT are reported, having subsequently similar volumes with the ones measured and detailed in Table 2. In the plotted analysis it can be observed that the PKPD model fitted the same growth curve, corresponding with the a priori estimate of measurement.
We succeeded in closely matching the clinical data by varying the γ parameter related to patient response to treatment and keeping σ at the constant value of 8. The reasoning for keeping σ constant is explained by the use of a single therapy, instead of multiple concomitant therapies, therefore the synergy between treatments applied does not exist and is considered only the effect of radiotherapy in tumor cells. Parameter values resulting from the fits showed that increased γ (with values from 0.1 to 0.25) allows the tumor volume to decrease and achieve values close to 0. This can signify in clinical practice that the tumor has been eliminated as reported and is not measurable. Decreasing γ < 0.1, the model fits the tumor with a decreased curve of growth, but still existent. However, the parameters depend also on the maximal initial tumor volume. For the cases where the tumor volume is rather stable after therapy (no decrease), γ has also the smallest value (0.043), the model allowing the changes in the curvature. Those three patients where this situation is encountered (as mentioned in Table 2) are going to be further under investigations, as follow-up CT scans highlighted evident radiation pneumonitis (RP) reaction, leading to a discrete higher volume which is difficult to differentiate from the nodule.
It can be observed that the cellular radiosensitivity is not influenced by the size of the irradiated volume, rather on the RT dosing and intensity, although the consequence of cell death for lung is strongly dependent on initial volume.

3.2. Tumor Growth for Multiple Lesions

Tumors with multiple lesions in the same site (lungs) have been identified before treatment. Having multiple lesions requires an adapted treatment that will treat separately each tumor. Given the diagnosis, treatment of multiple lung nodules is guided by the same regulations as the normal tumor. Accordingly, those lesions were treated by the clinicians separately, as single sites, without influencing each other. The results have shown that in clinical practice the multiple lesions are difficult to minimize, in the majority of the cases the lesions still remaining active with the same volume after treatment, as seen in Figure 3.

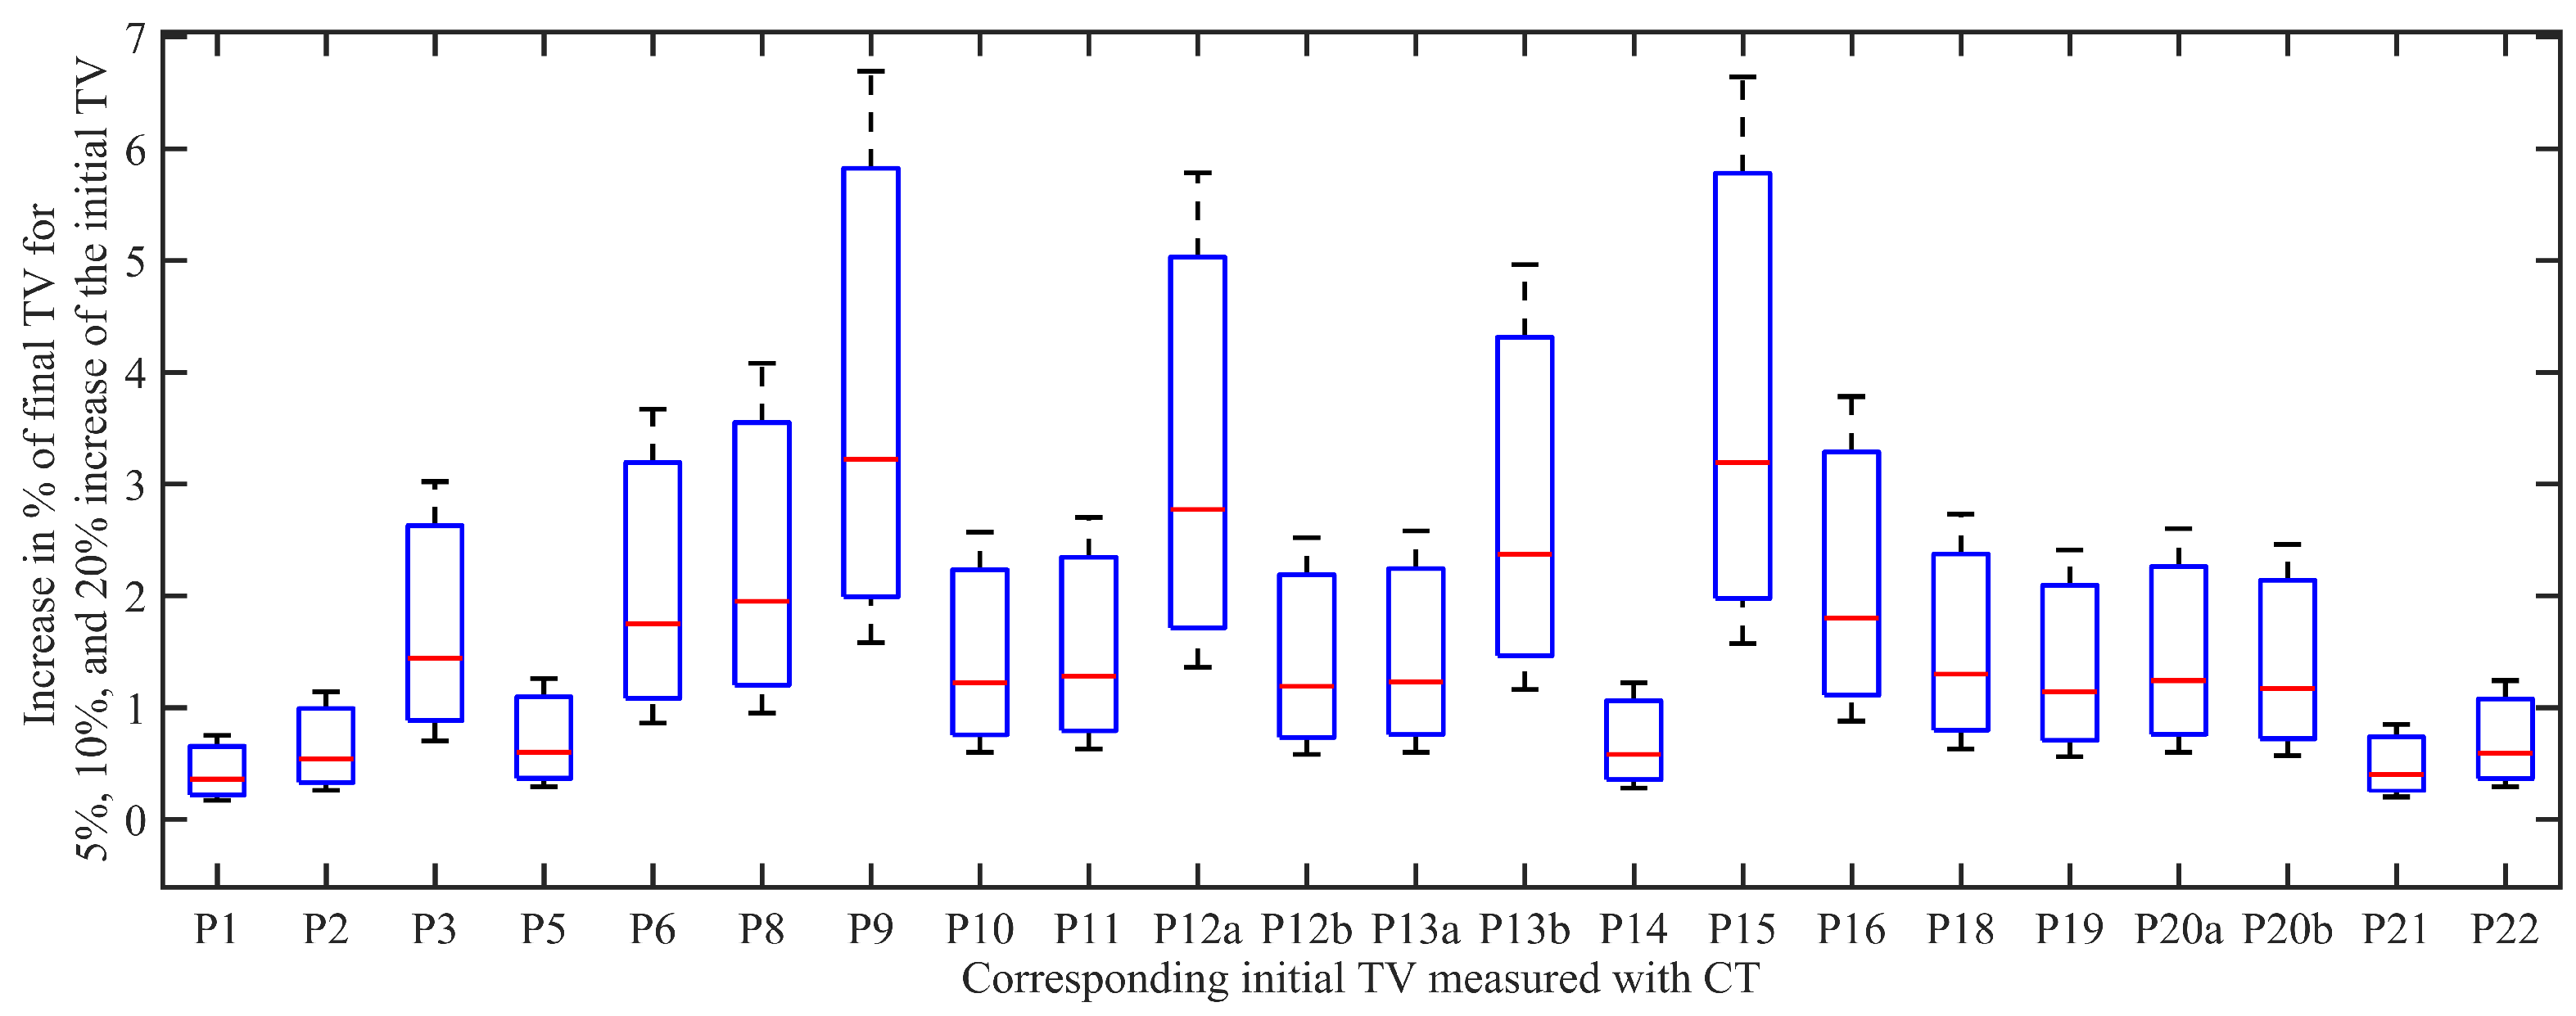
3.3. Uncertainty Analysis

The continuing uncertainty in tissue properties and tumor volume is of particular interest for high-precision delivery techniques for completing radiotherapy treatments in one or a few fractions.
Modeling the changes in tumor dynamics seems to play an important role in modulating clinical responses. Notably, the representation of the tumor volumes reported for the included patients illustrates the close similarity between the simulated tumor volume and measured one after radiotherapy for all patients (Figure 4).
We have analysed the error between the tumor volume after treatment reported by clinicians and the one obtained through model simulations, plotting the results. In Figure 5, the clinical reported volume is plotted against the relative simulated volume, together with the regression line (root mean squared error and correlation coefficient R = 0.994, and slope of the regression = 0.968). As expected, the two measures are strongly correlated.
Further investigation of the effectiveness of each SBRT fractionated regimen in NSCLC patients shows a higher rate for 48 Gy/4 fractions (68.82 %), 54 Gy/3 fractions (67.27 %), and 34 Gy/1 fraction (66.66 %), compared to 60 Gy/8 fractions (−4.76 %) (as seen in Figure 6a). As illustrated in Figure 6b, depending on the patient response and fractionation regimen, the initial tumor volume has remained stable after treatment for 3 lesions, and decreased for all the other lesions (efficacy between 17.86% and 100%).
In the context of different methods for tumor measurements, we have simulated with the PKPD model the influence of the measurement errors that could occur in the tumor volume. With the scope of analysing the model uncertainty, we have decreased the initial tumor volume with 5%, 10%, and 20%, respectively (see Figure 7). Patients without a regression in the tumor met the biggest increased variation in the simulated final tumor volume (1.57–6.69%), concomitant with the increase in the initial tumor volume. However, for a change of the initial tumor volume, the final tumor volume after RT changes below 1% (for 5% decrease in TV), 0.5–3.22% (for 10%), and 0.85–6.69% (for 20%).

4. Discussion

Mostly, SBRT is frequently applied as hypofractionation with few large fractions higher than 2 Gy [34]. The therapeutic advantage is that it will increase in tolerance for the late-responding normal tissue damage than for tumors compared with conventional fractionation. In practice, SBRT uses image guidance and a coordinate system to locate the tumor in the lungs in order to treat it accurately. However, an interdisciplinary approach for individualized SBRT is recommended to achieve better dose conformity. Different time-dose schemes for therapy administration are evaluated, taking into account the tumor dynamics and synergy pattern observed from the PKPD model.
Our approach was to implement a mathematical formulation for describing the pharmacokinetics and pharmacodynamics of the tumor growth process under influence of radiation. The recommended dosages administrated were as follows: 54 Gy or 48 Gy for lesions situated mostly in the peripheral areas, without organs at risk nearby, a new scheme of a very high dose of 34 Gy in only 1 fraction (similar with 54 Gy) for very small tumor located peripherally and 60 Gy for centrally located lesions. The higher doses are radiobiological similar to all the other dosages, but the difference is the strength and the number of fractions. Therefore, centrally located lesions that are close to the trachea, bronchi, heart and are sensitive to high RT receive lower multiple doses because of the serious damage that can be caused to the healthy surrounding tissue. In our study, we had one patient with a resistant clone group of tumor cells not really sensitive to RT, so the patient receives systemic chemotherapy with Xeloda drug daily every two weeks.
Mathematical models describe through relatively simple laws the internal interconnecting complexity of tumor growth kinetics and dynamics. For further clinical exploration, a quantitative analysis of the tumor growth characterized particularly by the PKPD model was performed. In our analysis, the PKPD model was able to accurately fit both data sets, consistently with the reported values before and after the radiotherapy. As expected, our results confirmed previous observations that tumor growth is patient dependent in the range of the tumor volumes studied, validating the fractionation regimen used. However, the magnitude of local pulmonary changes is independent of the irradiated volume but does depend on patient-related factors such as co-morbidities, smoking, and age.
All the presented results emphasise a steep increase in tumor volume after the first applied dose of radiation. It can be explained as a local adverse effect that occurs in the tissue due to inflammation caused by the radiation. This first reaction is compensated in time, after further administration of radiotherapy.
Despite generic waveform similarities, important differences were noted in the parameter γ estimates for changes in the curvature of the tumor growth. This explains the fact that each patient has a different response for the treatment applied, i.e., patient variability. Our results and methodology provide a complementary aiding tool to predict the possible treatment outcomes. Despite the small dataset, the results are still representative in terms of the feasibility of clinical relevance.
In reviewing the literature, limited data was found on the association between input parameters from pharmacokinetic and pharmacodynamic models and SBRT in human NSCLC studies [53]. Most of the prior studies report in vitro data from animals studies, results used to project potential response in vivo. Comparison of the findings with those of other studies can only be done for the clinical outcome of SBRT in clinical trials.
Furthermore, this analysis is significant in the rational design of dose and scheduling of anticancer drugs for integration of therapies effects on tumor growth. By matching pre- and post-treatment measurements, the results show that the response of tumors to the same fractionation schemes is variable and we can also conclude that such heterogeneity also exists between multiple lesions of the same organ in patients. Although treatment scheduling is done by a multidisciplinary team, the same modified fractionation schedule may or may not be optimal for all patients. To best select the specific group to which a patient belongs is critical for maximizing benefits and can be changed in relevant preclinical settings, and therefore to individualize treatment (Figure 8).
In this study, we showed that high radiation doses lead to improved local tumor control, with tolerated toxicity. Usually, a decrease in the tumor size after RT can be seen in the time interval from weeks to two months, not immediately, all patients remaining with a visible local scar after radiation. We found that tumor volume GTV measured after RT decreased (86.36%) or stayed stable (13.63%) for all lesions. After further investigations of the CT scans for the patients that preliminary results showed a greater field of unhealthy tissue after treatment, we distinguished between tumor and toxicity reaction. Via the examined scans, it was reported no tumor increase, closer inspection revealing a field of toxicity that can be graded with clinical factors and symptoms of RP, but possible to diagnose only after 6 months–1 year. Because of the presence of adjacent pneumonitis or fibrosis, the interpretation of the nodule area measurement is more difficult.
After diagnosis and staging lung cancer, a multidisciplinary team of health professionals proposes several comprehensive treatment schemes for each patient, mostly based on empirical knowledge, experience, and prior expertise from literature. The multidisciplinary oncologic consult (MOC) could involve these mathematical predictions when a patient’s case is discussed while taking into consideration the standard imaging tests, laboratory results, and clinical condition of the patient. The selection of the best treatment option in the pretreatment scheduling phase is benefiting from the computer simulations of growth dynamical models of treatment response. The detection of different patterns of response in the chosen therapy according to specific responses criteria is bringing several advantages. These are as follows: help in designing interventions for cancer control initiatives, developing non-invasive techniques for precised therapies, reduced clinical trials, health gain in case of early treatment, life years gained, complications avoided.
Our approach explicitly offers an evidence on the calibration of the PKPD model with real patients’ data. The scope of this mathematical formalism is to provide a prediction of treatment effectiveness in patients scheduled for SBRT treatment strategies in NSCLC cohorts and, where possible, the extent of toxicity resulting from it. Therefore, this methodology assist the physicians and healthcare professionals involved in making treatment decisions.
Choosing SBRT instead of surgery is mostly due to clinico-pathological criteria, but a certain amount of patients with NSCLC might be intolerant to surgical resections due to impaired pulmonary function. Possible extensions include pulmonary function tests such as FOT, which provide information about lung capacity and tissue mechanics [36,54]. Measurements of lung function with non-invasive devices (i.e., FOT) in fragile patients with lung cancer would help to determine the functional consequences of irradiating small fields in lungs and establish evidence based criteria for eligibility for SBRT schemes on the basis of lung function. Further research should be undertaken to investigate the influence of the presence of other medical respiratory conditions (e.g., chronic obstructive pulmonary disease) on the treatment outcome.
This study is unable to encompass the entire impact of the findings from our research, certain limitations of this study being worth mentioning: the relative small sample size, given the time constraint for performing the three visits; the heterogeneity of the small group cohort that doesn’t allow a classification of the regimens; the lack of an automatic software for measuring the tumor volume in all 3 phases, requiring the physician validation.
Future work will address the development of a model prediction of acute and late toxicity after radiotherapy in lung cancer, the correlation of tumor and late toxicity with tissue heterogeneity present in the lungs, the parameters configuration of PKPD model in a bigger group of patients, the inclusion of other therapies in the treatment regimen.

5. Conclusions

This paper provided a feasibility analysis of a pharmacokinetic-pharmacodynamic model of tumor progression and calibration with a real tumor volume patient dataset. Our study is a proof of concept in humans that the PKPD modeling can anticipate the SBRT effect in certain groups of NSCLC patients, predict drug-drug and drug-body interactions, and guide the dose and treatment regimens. The use of such models greatly aids the support to further personalise the radiotherapy treatment in combination therapies such as immuno- and antiangiogenesis therapies. The use of such interdisciplinary patient models enables faster clinical onset relevance evaluation while allowing to work with sparse dataset information. The direct benefit is to allow working from lower numbers of patients in clinical trials, therefore shortening the time to the result availability.

Author Contributions

Conceptualization, C.M.I. and D.V.; methodology, C.M.I. and D.V.; software, C.M.I. and M.G.; validation, C.M.I., D.V., C.B. and M.G.; formal analysis, M.G. and C.M.I.; investigation, M.G. and C.B; resources, C.M.I., D.C. and M.G.; data curation, M.G.; writing—original draft preparation, M.G.; writing—review and editing, all authors; visualization, C.M.I.; supervision, C.M.I., D.V. and C.B.; project administration, C.M.I., D.V. and C.B.; funding acquisition, M.G., D.C. and C.M.I. All authors have read and agreed to the published version of the manuscript.

Funding

This research was funded by the Special Research Fund of Ghent University, doctoral fellowship number 01D15919 (M.G.), and project grant number 01J01619 and by the Flanders Research Foundation (FWO) post-doctoral grant fellowship number 12X6819N (D.C.).

Institutional Review Board Statement

The study was conducted according to the guidelines of the Declaration of Helsinki, and approved by the Medical Ethics Committee of GasthuisZusters Antwerpen (GZA) Ziekenhuizen (protocol code CTOR20105GZA and date of approval 7 December 2021).

Informed Consent Statement

Informed consent was obtained from all subjects involved in the study.

Data Availability Statement

The authors confirm that the data supporting the findings of this study are available within the article.

Conflicts of Interest

The authors declare no conflict of interest.

Abbreviations

The following abbreviations are used in this manuscript:
BEDBiological Effective Dose
COPDChronic Obstructive Pulmonary Disease
CTComputed Tomography
CTCAECommon Terminology Criteria for Adverse Events
DVHDose-volume histogram
ECOGEastern Cooperative Oncology Group
FOTForced Oscillation Technique
GCPGood Clinical Practice
GOLDGlobal Initiative for COPD
GTVGross tumor volume
GZAGasthuisZusters Antwerpen
ICFInformed consent form
MLDMean lung dose
NANot applicable
NSCLCNon-small cell lung cancer
PKPDPharmacokinetic-Pharmacodynamic
RPRadiation pneumonitis
RTRadiotherapy
SBRTStereotactic Body Radiation Therapy
TLVTotal lung volume
TNMClassification of Malignant tumors

References

  1. Osarogiagbon, R.U.; Veronesi, G.; Fang, W.; Ekman, S.; Suda, K.; Aerts, J.G.; Donington, J. Early-stage NSCLC: Advances in thoracic oncology 2018. J. Thorac. Oncol. 2019, 14, 968–978. [Google Scholar] [CrossRef] [PubMed]
  2. Varlatto, J.M.; Veronesi, G. Editorial: Controversies in the local management of lung cancer. Front. Oncol. 2018, 8, 233. [Google Scholar] [CrossRef] [PubMed]
  3. Poels, K.; Depuydt, T.; Verellen, D.; Gevaert, T.; Dhont, J.; Duchateau, M.; Burghelea, M.; Boussaer, M.; Steenbeke, F.; Collen, C.; et al. Improving the intra-fraction update efficiency of a correlation model used for internal motion estimation during real-time tumor tracking for SBRT patients: Fast update or no update? Radiother. Oncol. 2014, 112, 352–359. [Google Scholar] [CrossRef] [PubMed]
  4. Liu, W.; Liu, A.; Chan, J.; Boldt, R.G.; Munoz-Schuffenegger, P.; Louie, A.W. What is the optimal radiotherapy utilization rate for lung cancer?—A systematic review. Transl. Lung Cancer Res. 2019, 8 (Suppl. S2), S163–S171. [Google Scholar] [CrossRef] [PubMed]
  5. Sharma, R.A.; Plummer, R.; Stock, J.K.; Greenhalgh, T.A.; Ataman, O.; Kelly, S.; Clay, R.; Adams, R.A.; Baird, R.D.; Billingham, L.; et al. Clinical development of new drug–radiotherapy combinations. Nat. Rev. Clin. Oncol. 2016, 13, 627–642. [Google Scholar] [CrossRef] [PubMed] [Green Version]
  6. Benzekry, S.; Lamont, C.; Beheshti, A.; Tracz, A.; Ebos, J.M.L.; Hlatky, L.; Hahnfeldt, P. Classical mathematical models for description and prediction of experimental tumor growth. PLoS Comput. Biol. 2014, 10, e1003800. [Google Scholar] [CrossRef] [PubMed] [Green Version]
  7. Altrock, P.M.; Liu, L.L.; Michor, F. The mathematics of cancer: Integrating quantitative models. Nat. Rev. Cancer 2015, 15, 730–745. [Google Scholar] [CrossRef]
  8. Murphy, H.M.D.; Jaafari, H.; Dobrovolny, H.M. Differences in predictions of ODE models of tumor growth: A cautionary example. BMC Cancer 2016, 16, 1–10. [Google Scholar] [CrossRef] [Green Version]
  9. Sápi, J.; Drexler, D.A.; Kovács, L. Comparison of mathematical tumor growth models. In Proceedings of the 13th International Symposium on Intelligent Systems and Informatics (SISY), Subotica, Serbia, 17–19 September 2015; pp. 323–328. [Google Scholar]
  10. Hong, W.-S.; Zhang, G.-Q. Simulation analysis for tumor radiotherapy based on three component mathematical model. J. Appl. Clin. Med. Phys. 2019, 20, 22–26. [Google Scholar] [CrossRef]
  11. Akanuma, A. Parameter analysis of Gompertzian function growth model in clinical tumors. Eur. J. Cancer 1978, 14, 681–688. [Google Scholar] [CrossRef]
  12. Ribba, B.; Watkin, E.; Tod, M.; Girard, P.; Grenier, E.; You, B.; Giraudo, E.; Freyer, G. A model of vascular tumor growth in mice combining longitudinal tumor size data with histological biomarkers. Eur. J. Cancer 2011, 47, 479–490. [Google Scholar] [CrossRef] [PubMed]
  13. Von Bertalanffy, L. Quantitative laws in metabolism and growth. Q. Rev. Biol. 1957, 32, 217–231. [Google Scholar] [CrossRef] [PubMed]
  14. West, G.B.; Brown, J.H.; Enquist, B.J. A general model for ontogenetic growth. Nature 2001, 413, 628–631. [Google Scholar] [CrossRef] [PubMed]
  15. Gerlee, P. The model muddle: In search of tumor growth laws. Cancer Res. 2013, 73, 2407–2411. [Google Scholar] [CrossRef] [PubMed] [Green Version]
  16. Ghita, M.; Copot, D.; Ghita, M.; Derom, E.; Ionescu, C. Low frequency forced oscillation lung function test can distinguish dynamic tissue non-linearity in COPD patients. Front. Physiol. 2019, 10, 1390. [Google Scholar] [CrossRef] [PubMed]
  17. Ionescu, C.; Lopes, A.; Copot, D.; Machado, J.A.T.; Bates, J.H.T. The role of fractional calculus in modeling biological phenomena: A review. Commun. Nonlinear Sci. Numer. Simul. 2017, 51, 141–159. [Google Scholar] [CrossRef]
  18. Ionescu, C.; Kelly, J.F. Fractional calculus for respiratory mechanics: Power law impedance, viscoelasticity and tissue heterogeneity. Chaos Solitons Fractals 2017, 102, 433–440. [Google Scholar] [CrossRef]
  19. Ghita, M.; Copot, D.; Ionescu, C.M. Lung cancer dynamics using fractional order impedance modeling on a mimicked lung tumor setup. J. Adv. Res. 2021, 32, 61–71. [Google Scholar] [CrossRef]
  20. Assadi, I.; Charef, A.; Copot, D.; De Keyser, R.; Bensouici, T.; Ionescu, C. Evaluation of respiratory properties by means of fractional order models. Biomed. Signal. Process Control 2017, 34, 206–213. [Google Scholar] [CrossRef]
  21. West, B.J. Colloquium: Fractional calculus view of complexity: A tutorial. Rev. Mod. Phys. 2014, 86, 1169–1184. [Google Scholar] [CrossRef]
  22. Valentim, C.A.; Oliveira, N.A.; Rabi, J.A.; David, S.A. Can fractional calculus help improve tumor growth models? J. Comput. Appl. Math. 2020, 379, 112964. [Google Scholar] [CrossRef]
  23. Valentim, C.A.; Rabi, J.A.; David, S.A.; Tenreiro Machado, J.A. On multistep tumor growth models of fractional variable-order. BioSystems 2021, 199, 104294. [Google Scholar] [CrossRef] [PubMed]
  24. Enderling, H.; Chaplain, M.A.J.; Hahnfeldt, P. Quantitative modeling of tumor dynamics and radiotherapy. Acta Biotheor. 2010, 58, 341–353. [Google Scholar] [CrossRef] [PubMed]
  25. Drexler, D.A.; Ferenci, T.; Furedi, A.; Szakacs, G.; Kovacs, L. Experimental data-driven tumor modeling for chemotherapy. IFACPapersOnline 2020, 53, 16245–16250. [Google Scholar] [CrossRef]
  26. Drexler, D.A.; Sápi, J.; Kovács, L. Modeling of tumor growth incorporating the effects of necrosis and the effect of bevacizumab. Complexity 2017, 2017, 5985031. [Google Scholar] [CrossRef] [Green Version]
  27. Leszczyński, M.; Ledzewicz, U.; Schättler, H. Optimal control for a mathematical model for chemotherapy with pharmacometrics. Math. Model. Nat. Phenom. 2020, 15, 69. [Google Scholar] [CrossRef] [Green Version]
  28. Ghita, M.; Drexler, D.A.; Kovacs, L.; Copot, D.; Muresan, C.I.; Ionescu, C.M. Model-based management of lung cancer radiation therapy. IFACPapersOnline 2020, 53, 15928–15933. [Google Scholar] [CrossRef]
  29. Ionescu, C.M.; Ghita, M.; Copot, D.; Derom, E.; Verellen, D. A minimal PKPD Interaction model for evaluating synergy effects of combined NSCLC therapies. J. Clin. Med. 2020, 9, 1832. [Google Scholar] [CrossRef]
  30. Simeoni, M.; Magni, P.; Cammia, C.; De Nicolao, G.; Croci, V.; Pesenti, E.; Germani, M.; Poggesi, I.; Rocchetti, M. Predictive pharmacokinetic-pharmacodynamic modeling of tumor growth kinetics in xenograft models after administration of anticancer agents. Cancer Res. 2004, 64, 1094–1101. [Google Scholar] [CrossRef] [Green Version]
  31. Bonate, P.L. Pharmacokinetic-Pharmacodynamic Moodeling and Simulation, 2nd ed.; Springer: London, UK, 2011. [Google Scholar]
  32. Olarte, O.; De Keyser, R.; Ionescu, C.M. Fan-based device for non-invasive measurement of respiratory impedance. Identification, calibration and analysis. Biomed. Signal. Process Control 2016, 30, 127–133. [Google Scholar] [CrossRef]
  33. King, G.G.; Bates, J.; Berger, K.I.; Calverley, P.; de Melo, P.L.; Dellacà, R.L.; Farré, R.; Hall, G.L.; Ioan, I.; Irvin, C.G.; et al. Technical standards for respiratory oscillometry. Eur. Respir. J. 2020, 55, 1900753. [Google Scholar] [CrossRef] [PubMed]
  34. Joiner, M.; van der Kogel, A. (Eds.) Basic Clinical Radiobiology, 4th ed.; Hodder Arnold: London, UK, 2009. [Google Scholar]
  35. Ionescu, C.M.; Copot, C.; Verellen, D. Motion compensation for robotic lung tumour radiotherapy in remote locations: A personalised medicine approach. Acta Astronaut. 2017, 132, 59–66. [Google Scholar] [CrossRef]
  36. National Comprehensive Cancer Network (NCCN). Clinical Practice Guidelines in Oncology—Non-Small Cell Lung Cancer, Version 7.2021. 29 October 2021. Available online: http://www.nccn.org/patients/guidelines/nscl/index.html (accessed on 19 December 2021).
  37. Guckenberger, M.; Andratschke, N.; Dieckmann, K.; Hoogeman, M.S.; Hoyer, M.; Hurkmans, C.; Tanadini-Lang, S.; Lartigau, E.; Méndez Romero, A.; Senan, S.; et al. ESTRO ACROP consensus guideline on implementation and practice of stereotactic body radiotherapy for peripherally located early stage, non-small cell lung cancer. Radiother. Oncol. 2017, 124, 11–17. [Google Scholar] [CrossRef] [PubMed] [Green Version]
  38. Postmus, P.E.; Kerr, K.M.; Oudkerk, M.; Senan, S.; Waller, D.A.; Vansteenkiste, J.; Escriu, C.; Peters, S. Early and locally advanced non-small-cell lung cancer (NSCLC): ESMO Clinical Practice Guidelines for diagnosis, treatment and follow-up. Ann. Oncol. 2017, 28, iv1–iv21. [Google Scholar] [CrossRef] [PubMed]
  39. Remon, J.; Soria, J.C.; Peters, S. Early and locally advanced non-small-cell lung cancer: An update of the ESMO Clinical Practice Guidelines focusing on diagnosis, staging, systemic and local therapy. Ann. Oncol. 2021, 32, 1637–1642. [Google Scholar] [CrossRef] [PubMed]
  40. Planchard, D.; Popat, S.; Kerr, K.; Novello, S.; Smit, E.F.; Faivre-Finn, C.; Mok, T.S.; Reck, M.; Van Schil, P.E.; Hellmann, M.D.; et al. Metastatic non-small cell lung cancer: ESMO Clinical Practice Guidelines for diagnosis, treatment and follow-up. Ann. Oncol. 2018, 29, iv192–iv237. [Google Scholar] [CrossRef]
  41. Billiet, C.; Joye, I.; Mercier, C.; Depuydt, L.; De Kerf, G.; Vermeulen, P.; Van Laere, S.; Van de Kelft, E.; Meijnders, P.; Verellen, D.; et al. Outcome and toxicity of hypofractionated image-guided SABR for spinal oligometastases. Clin. Transl. Radiat.Oncol. 2020, 24, 65–70. [Google Scholar] [CrossRef]
  42. Saez, J.; Hernandez, V.; Goossens, J.; De Kerf, G.; Verellen, D. A novel procedure for determining the optimal: MLC. configuration parameters in treatment planning systems based on measurements with a Farmer chamber. Phys. Med. Biol. 2020, 65, 155006. [Google Scholar] [CrossRef]
  43. Benedict, S.H.; Yenice, K.M.; Followill, D.; Galvin, J.M.; Hinson, W.; Kavanagh, B.; Keall, P.; Lovelock, M.; Meeks, S.; Papiez, L.; et al. Stereotactic body radiation therapy: The report of AAPM Task Group 101. Med. Phys. 2010, 37, 4078–4101. [Google Scholar] [CrossRef] [Green Version]
  44. Wilke, L.; Andratschke, N.; Blanck, O.; Brunner, T.B.; Combs, S.E.; Grosu, A.-L.; Moustakis, C.; Schmitt, D.; Baus, W.W.; Guckenberger, M. ICRU report 91 on prescribing, recording, and reporting of stereotactic treatments with small photon beams: Statement from the DEGRO/DGMP working group stereotactic radiotherapy and radiosurgery. Strahlenther Onkol. 2019, 195, 193–198. [Google Scholar] [CrossRef]
  45. Ollivier, L.; Padhani, A.R.; Leclere, J. International criteria for measurement of tumor response. Cancer Imaging 2001, 2, 31–32. [Google Scholar]
  46. Wang, W.; Xu, Y.; Schipper, M.; Matuszak, M.M.; Ritter, T.; Cao, Y.; Ten Haken, R.K.; Kong, F.-M. Effect of normal lung definition on lung dosimetry and lung toxicity prediction in radiation therapy treatment planning. Int. J. Radiat. Oncol. Biol. Phys. 2013, 86, 956–963. [Google Scholar] [CrossRef] [PubMed] [Green Version]
  47. Billiet, C.; Peeters, S.; De Ruysscher, D. Focus on treatment complications and optimal management: Radiation oncology. Transl. Lung Cancer Res. 2014, 3, 187–191. [Google Scholar] [PubMed]
  48. Yom, S.S.; Liao, Z.; Liu, H.H.; Tucker, S.L.; Hu, C.; Wei, X.; Wang, X.; Wang, S.; Mohan, R.; Cox, J.D.; et al. Initial evaluation of treatment-related pneumonitis in advanced-stage non-small-cell lung cancer patients treated with concurrent chemotherapy and intensity-modulated radiotherapy. Int. J. Radiat. Oncol. Biol. Phys. 2007, 68, 94–102. [Google Scholar] [CrossRef]
  49. Jin, S.Z.; Pan, X.N.; Wu, N.; Jin, G.H.; Liu, S.Z. Whole-body low dose irradiation promotes the efficacy of conventional radiotherapy for cancer and possible mechanisms. Dose-Response 2007, 5, 349–358. [Google Scholar] [CrossRef] [PubMed]
  50. Yuan, S.; Chen, H. Mathematical rules for synergistic, additive, and antagonistic effects of multi-drug combinations and their application in research and development of combinatorial drugs and special medical food combinations. Food Sci. Hum. Wellness 2019, 8, 136–141. [Google Scholar] [CrossRef]
  51. Capasso, A.; Lang, J.; Pitts, T.M.; Jordan, K.R.; Lieu, C.H.; Davis, S.L.; Diamond, J.R.; Kopetz, S.; Barbee, J.; Peterson, J.; et al. Characterization of immune responses to anti-PD-1 mono- and combination therapy in hematopoietic humanized mice implanted with tumor xenographs. J. Immunother. Cancer 2019, 7, 37. [Google Scholar] [CrossRef]
  52. Ionescu, C.M. A computationally efficient Hill curve adaptation strategy during continuous monitoring of dose-effect relation in anesthesia. Nonlinear Dyn. 2018, 92, 843–852. [Google Scholar] [CrossRef]
  53. Injerd, R.; Turian, E. Mathematical Modeling of Non-Small Cell Lung Cancer Response to Therapy; Technical Report No. 17-0922. 2017. Available online: https://www.neiu.edu/sites/neiu.edu/files/migrated-arts-body/documents/ncwrinkl/Russell_TechnicalReport_Apr2018.pdf (accessed on 11 February 2021).
  54. Kwon, O.-B.; Yeo, C.-D.; Lee, H.-Y.; Kang, H.-S.; Kim, S.-K.; Kim, J.-S.; Park, C.-K.; Lee, S.-H.; Kim, S.-J.; Kim, J.-W. The value of residual volume/total lung capacity as an indicator for predicting postoperative lung function in non-small lung cancer. J. Clin. Med. 2021, 10, 4159. [Google Scholar] [CrossRef]
Figure 1. Flow diagram of the study design.
Jcm 11 01006 g001
Figure 2. Representations of the PKPD model fitting the clinical data of the tumor volume for the study cohort, after SBRT treatment. The blue line represents the total tumor volume, while the red line is the necrotic tumor volume. On each figure, it is also represented the initial tumor volume and final tumor volume with their corresponding day, specific to each patient. Plotted are the tumor growths for the following patients: (a) patient ID 001, (b) patient ID 008, (c) patient ID 014, (d) patient ID 018.
Jcm 11 01006 g002
Figure 3. Representations of the PKPD model fitting the clinical data of the tumor volume for the patients with multiple lesions, after SBRT treatment. The blue line represents the total tumor volume, while the red line is the necrotic tumor volume. Each figure also represents the initial tumor volume and final tumor volume with their corresponding day, specific to each patient. Plotted are the tumor growth dynamics for the patients with multiple lesions: (a,b) patient ID 012, (c,d) patient ID 020.
Jcm 11 01006 g003
Figure 4. Tumor volumes reported for the included patients. It can be seen that there are patients with tumor eradication due to treatment, having tumor volume values close to 0. Two lesions (a and b) were analysed for patients 12, 13, and 20.
Jcm 11 01006 g004
Figure 5. Linear regression showing strong correlation between the two volume measurements: measured from CT image and simulated with PKPD model.
Jcm 11 01006 g005
Figure 6. Occurrence of each fractionation regimen and their efficacy percentage for each patient. (a) Occurence of the fractionation regimens used for the study cohort. (b) Regression and progression in tumor volume after radiotherapy per patient, according to the calculated efficacy, dose regimen and time duration between measurements.
Jcm 11 01006 g006
Figure 7. Box plot corresponding to changes in % for the tumor volume of each patient. On each box, the central mark indicates the median, and the bottom and top edges of the box indicate the 25th and 75th percentiles, respectively. The minimum score for each box is for the case of 5% increase in the initial tumor volume, while the maximum score is corresponding to 20%.
Jcm 11 01006 g007
Figure 8. Precision Cancer Therapy versus Conventional Therapy.
Jcm 11 01006 g008
Table 2. Tumor and treatment related characteristics of participants completing the study.
Patients IDTime between Tumor Measurements (Days ≈ Months)Total Dose (Gy)No. of FractionsTotal Duration of RT Treatment (Days)Days of TreatmentTumor Colume GTV before RT (cm 3 )Tumor Volume GTV after RT (cm 3 )Mean Lung Dose (Gy)Total Lung Volume (cm 3 )V5 Lungs (%)V20 Lungs (%)
001191 d ≈ 7 m54361-3-60.60.21.24870.86.10.9
00263 d ≈ 2 m48481-3-5-80.902.72653.7132.8
003123 d ≈ 4 m54361-3-610.52.43758.1121.7
005126 d ≈ 5 m54361-3-60.40 *1.15031.450.9
006124 d ≈ 4 m48481-3-5-84.21.42.15263.31.62.1
008109 d ≈ 4 m48481-3-6-8181.53.43598.813.94.5
00990 d ≈ 3 m54361-3-65.73.32.55485.312.43
010169 d ≈ 6 m48491-3-6-94.321.93932.68.62
011172 d ≈ 6 m48481-3-6-85.42.85.33340.534.34.3
01298 d ≈ 4 m 7 7.3233531.513
   les.1543 1-4-61.21.6
   les.2543 3-5-70.90
   les.3543 3-5-70.90.3
013125 d ≈ 4 m 10 52886.4284.8
   les.1484 2-6-8-100.90.4
   les.2484 1-3-7-95.64.6
014150 d ≈ 5 m54361-3-62.60 *3.7222915.16
015112 d ≈ 4 m608171-3-6-8-10-13-15-1710.5114.53307.4176.3
016124 d ≈ 4 m484101-3-7-10202.83.7447717.54
018115 d ≈ 4 m54371-3-71.50.314463.84.51.3
019103 d ≈ 4 m341110.30.21.23336.35.90.7
020145 d ≈ 5 m 9 1.72602.27.61.7
   les.1484 10.60.6
   les.2341 2-4-7-91.10
021133 d ≈ 5 m484111-3-8-110.60 *1.92392.49.61.6
022123 d ≈ 4 m54361-2-62.10 *3.2283016.53.4
Patients ID 004, 007 and 017 are missing from reported data due to clinical reasons. Patients ID 016 and 022 have missing data for FOT measurements, but the tumor measurements are complete. Abbreviations: GTV = Gross tumor volume, les = lesion number, d = days, m = months. * Tumor volume not measurable, area of radiation pneumonitis, no nodule detectable.
Publisher’s Note: MDPI stays neutral with regard to jurisdictional claims in published maps and institutional affiliations.

